the Creative Commons Attribution 4.0 License.
the Creative Commons Attribution 4.0 License.
 | 17 Feb 2022
A new method to quantify particulate sodium and potassium salts (nitrate, chloride, and sulfate) by thermal desorption aerosol mass spectrometry
Yuya Kobayashi
The reaction of sea salt (or biomass burning) particles with sulfuric acid and nitric acid leads to the displacement of chloride relative to sodium (or potassium). We have developed a new particle mass spectrometer to quantify non-refractory and refractory sulfate aerosols (referred to as refractory aerosol thermal desorption mass spectrometer: rTDMS). The combination of a graphite particle collector and a carbon dioxide laser enables high desorption temperature (blackbody equivalent radiation temperature of up to 930 ∘C). Ion signals originating from evolved gas molecules are detected by a quadrupole mass spectrometer. Here we propose a new method to quantify the mass concentrations of sodium nitrate (NaNO3: SN), sodium chloride (NaCl: SC), sodium sulfate (Na2SO4: SS), potassium nitrate (KNO3: PN), potassium chloride (KCl: PC), and potassium sulfate (K2SO4: PS) particles by using the rTDMS. Laboratory experiments were performed to test the sensitivities of the rTDMS to various types of particles. We measured ion signals originating from single-component particles for each compound and found a good linearity (r2>0.8) between the major ion signals and mass loadings. We also measured ion signals originating from internally mixed SN + SC + SS (or PN + PC + PS) particles and found that the temporal profiles of ion signals at m/z 23 (Na+) (or 39; K+) were characterized by three sequential peaks associated with the evolution of the desorption temperature. We tested potential interferences in the quantification of sea salt particles under real-world conditions by artificially generating “modified” sea salt particles from a mixture of diluted seawater and SN (or SS) solution. The ratios estimated from the ion signals at 23, 36 (H35Cl+), and 48 (SO+) agreed well with those predicted from the solution concentrations to within ∼10 %. The ratios estimated from the ion signals at 30 (NO+) and 36 also agreed with those predicted from the solution concentrations to within ∼15 %, whereas the ratios estimated from 23 were significantly lower than the predicted values. Based on these experimental results, the applicability of the rTDMS to ambient measurements of sea salt particles is discussed.
- Article
(4579 KB) - Full-text XML
-
Supplement
(964 KB) - BibTeX
- EndNote


Aerosols have large impacts on the Earth's radiation budget by scattering and absorbing solar shortwave radiation (direct effect) and by acting as cloud condensation nuclei (indirect effect) (IPCC, 2013). The size and chemical composition of aerosol particles are important for quantitatively estimating the direct and indirect effects of aerosols. Sea salt aerosols generally make the largest contribution to the budget of natural aerosols in the troposphere (Seinfeld and Pandis, 2006; IPCC, 2013). Significant conversion of sodium chloride (NaCl: SC) to sodium sulfate (Na2SO4: SS) or sodium nitrate (NaNO3: SN) can take place via the reactions with sulfuric acid (H2SO4) or nitric acid (HNO3) in polluted air exported from urban areas to coastal regions (Kerminen et al., 1998; Hsu et al., 2007; AzadiAghdam et al., 2019). Biomass burning also makes large contributions to the global budget of soot, organics, and inorganic compounds (Andreae and Merlet, 2001; Akagi et al., 2011; Song et al., 2018). Potassium chloride (KCl: PC) is the dominant form of chloride in biomass burning aerosols (Reid et al., 2005). Potassium may also be present in biological particles emitted from rainforests (Pöhlker et al., 2012). Significant conversion of PC to potassium sulfate (K2SO4: PS) or potassium nitrate (KNO3: PN) can also take place via the reactions with H2SO4 or HNO3 when smoke from biomass burning mixes with urban pollution (Li et al., 2003; Zauscher et al., 2013; Schlosser et al., 2017).
Earlier studies investigated the chemical transformation of Cl− to or in sea salt or biomass burning particles by offline transmission electron microscopy (TEM) and X-ray spectrometry (Miura et al., 1991; Li et al., 2003; Adachi and Buseck, 2015). Single-particle mass spectrometry was also used to qualitatively detect the chemical transformation of Cl− to and (Hayes et al., 2013). Aerosol particles formed via the chemical transformation processes include both non-refractory and refractory compounds. Note that the definition of “non-refractory” and “refractory” compounds in atmospheric aerosols is rather empirical and depends on the analysis method. Following the definition from Kobayashi et al. (2021), chemical compounds with a bulk thermal desorption temperature lower than ∼673 K are referred to as non-refractory compounds, and others are referred to as refractory compounds. As briefly reviewed by Kobayashi et al. (2021), currently available techniques for online quantitative measurements of aerosols, including a particle-into-liquid sampler coupled with ion chromatography (PILS-IC; Weber et al., 2001) and an Aerodyne aerosol mass spectrometer (AMS; Jayne et al., 2000), are not optimized for separate quantification of refractory and non-refractory aerosols. The PILS-IC can measure total water-soluble ions but is not designed to specify their chemical form.
The primary purpose of Kobayashi et al. (2021) was to develop a new instrument to quantify non-refractory and refractory sulfate aerosols, which was referred to as a refractory aerosol thermal desorption mass spectrometer (rTDMS). The goal of the present study is to develop a new method to quantify particulate sodium and potassium salts (nitrate, chloride, and sulfate) by using the rTDMS. Potential application to sea salt aerosols is also discussed.
2.1 Instrument description
The concept and operation procedures of the rTDMS were described in detail by Kobayashi et al. (2021), and thus only the key points are presented here. The configuration is similar to that of the particle trap – laser desorption mass spectrometer (PT-LDMS) (Takegawa et al., 2012). The major difference between the rTDMS and PT-LDMS is the structure of the particle collector and laser power. The main components of the rTDMS include an aerodynamic lens (ADL), a graphite particle collector, a quadrupole mass spectrometer (QMS) equipped with a cross-beam-type electron ionization (EI) source (QMG700, Pfeiffer Vacuum), and a continuous wave focused CO2 laser (wavelength: 10.6 µm; ULR-25, Universal Laser Systems). Aerosol particles are introduced into a vacuum chamber via the ADL and collected on the graphite collector. The structure of the ADL is the same as that used by Miyakawa et al. (2014), which is essentially identical to that presented by Zhang et al. (2004). During particle loadings with the inlet valve open, the graphite collector faces the direction toward the inlet. After particles are collected, the graphite collector turns to the opposite direction so that it faces the ionizer of the QMS. The collected particles are vaporized by the CO2 laser, and evolved gas molecules are detected using the QMS. The blackbody equivalent temperature of the outer surface of the graphite collector was measured using a radiation thermometer (Impac IGA 140, LumaSense Technologies, Inc.). The focused CO2 laser coupled with the graphite collector is the key component of the rTDMS and enables a high desorption temperature (blackbody equivalent temperature of up to 930 ∘C) and a fast increase in the temperature (less than 60 s to reach the maximum temperature from room temperature). The distance between the graphite collector and the ionizer was shortened to 25 mm from the 50 mm used by Kobayashi et al. (2021), increasing the sensitivity by a factor of 2 to 3.
The rTDMS was operated with total measurement cycles ranging from 6 to 10 min, including the time for particle collection (2–6 min), laser irradiation and ion detection (2 min), and cooling of the graphite collector (2 min). The graphite collector was automatically rotated to set the position by using an electronic actuator. The sample was irradiated by the CO2 laser for 60 s. The inlet valve was kept closed for 4 min during the laser desorption analysis and cooling. Kobayashi et al. (2021) employed a constant laser power (∼20 W) for the detection of non-refractory and refractory sulfate. In this study we tested a two-step laser modulation for better separation of multi-component aerosol particles. Details of the laser power settings are described in Sect. 3.1 and the Supplement.
The QMS was operated in the multiple ion detection (MID) mode to measure ion signals at some selected peaks. The number of selected ion signals was typically limited to less than 10 to obtain better signal-to-noise ratios. We measured all possible signals for each compound to identify the major peaks that can be used for the quantification (see Table S1 in the Supplement).
2.2 Laboratory experiments
The experimental apparatus was basically the same as that presented by Kobayashi et al. (2021). The particle generation system included an air compressor, a Collison atomizer (Model 3076, TSI, Inc.), a diffusion dryer (Model 3062, TSI, Inc.), and a differential mobility analyzer (DMA; Model 3080, TSI, Inc.). A condensation particle counter (CPC; Model 3022A, TSI, Inc.) and the rTDMS were connected downstream of the particle generation system. We set the mobility diameter at 200 nm to generate monodisperse particles. The mass loadings of monodisperse aerosol particles were calculated from the CPC data with corrections for multiply charged particles (Takegawa and Sakurai, 2011) to derive the instrument sensitivity to various types of particles. Particle-free air (zero air: ZA) was introduced into the rTDMS and CPC to correct for blank levels and also for evaluating potential artifacts.
The chemical compounds tested in this study are summarized in Table 1. The main test particles included single-component SN, SC, SS, PN, PC, and PS particles, internally mixed multi-component SN + SC + SS and PN + PC + PS particles, and laboratory-generated sea salt particles. Ammonium nitrate (NH4NO3: AN), ammonium chloride (NH4Cl: AC), and ammonium sulfate ((NH4)2SO4: AS) particles were also used for evaluating the interference from ammonium salts. The results of the measurements of externally mixed ammonium salt particles are shown in the Supplement.
Table 1Chemical compounds tested in this studya.
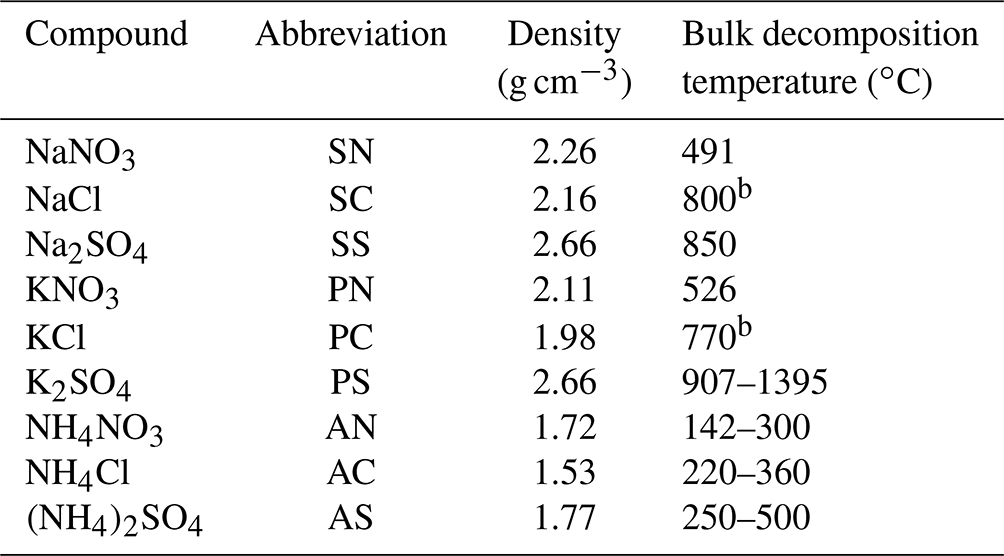
a The values of density were taken from Nagakura et al. (1998). The bulk decomposition temperatures were taken from Broström et al. (2013), Tagawa (1987), Halle and Stern (1980), Halsted (1970), Nakamura et al. (1980), and Tatykaev et al. (2014). The data for ammonium salts are only shown in the Supplement. b These values are the melting points.
Under real-world conditions, interferences from coexisting compounds should be carefully considered. Regarding sea salt aerosols, this can be achieved by using seawater samples for generating calibration particles. We sampled seawater from Tokyo Bay and prepared a diluted solution (by a factor of 100; equivalent to 4.5 mM of NaCl). The diluted seawater was used for generating pure sea salt particles. We also added SN and SS into the diluted seawater to prepare samples for the standard addition method. The tested solutions are summarized in Fig. 1. The seawater experiment aimed to quantify SN and SS in the presence of unidentified compounds in seawater. The estimation of the molar concentrations of various salts in the seawater sample is described in the Supplement. It should be noted that the simple atomization of seawater samples may not reproduce real-world sea salt particles generated by wave-breaking-driven bubble bursting (Fuentes et al., 2010). Therefore, the molar fractions of the inorganic compounds in the laboratory-generated particles may be different from those in real-world sea salt particles. Regarding biomass burning aerosols, it is not straightforward to generate combustion particles with reasonable reproducibility. Therefore, we only performed the experiments with authentic standard materials containing potassium.
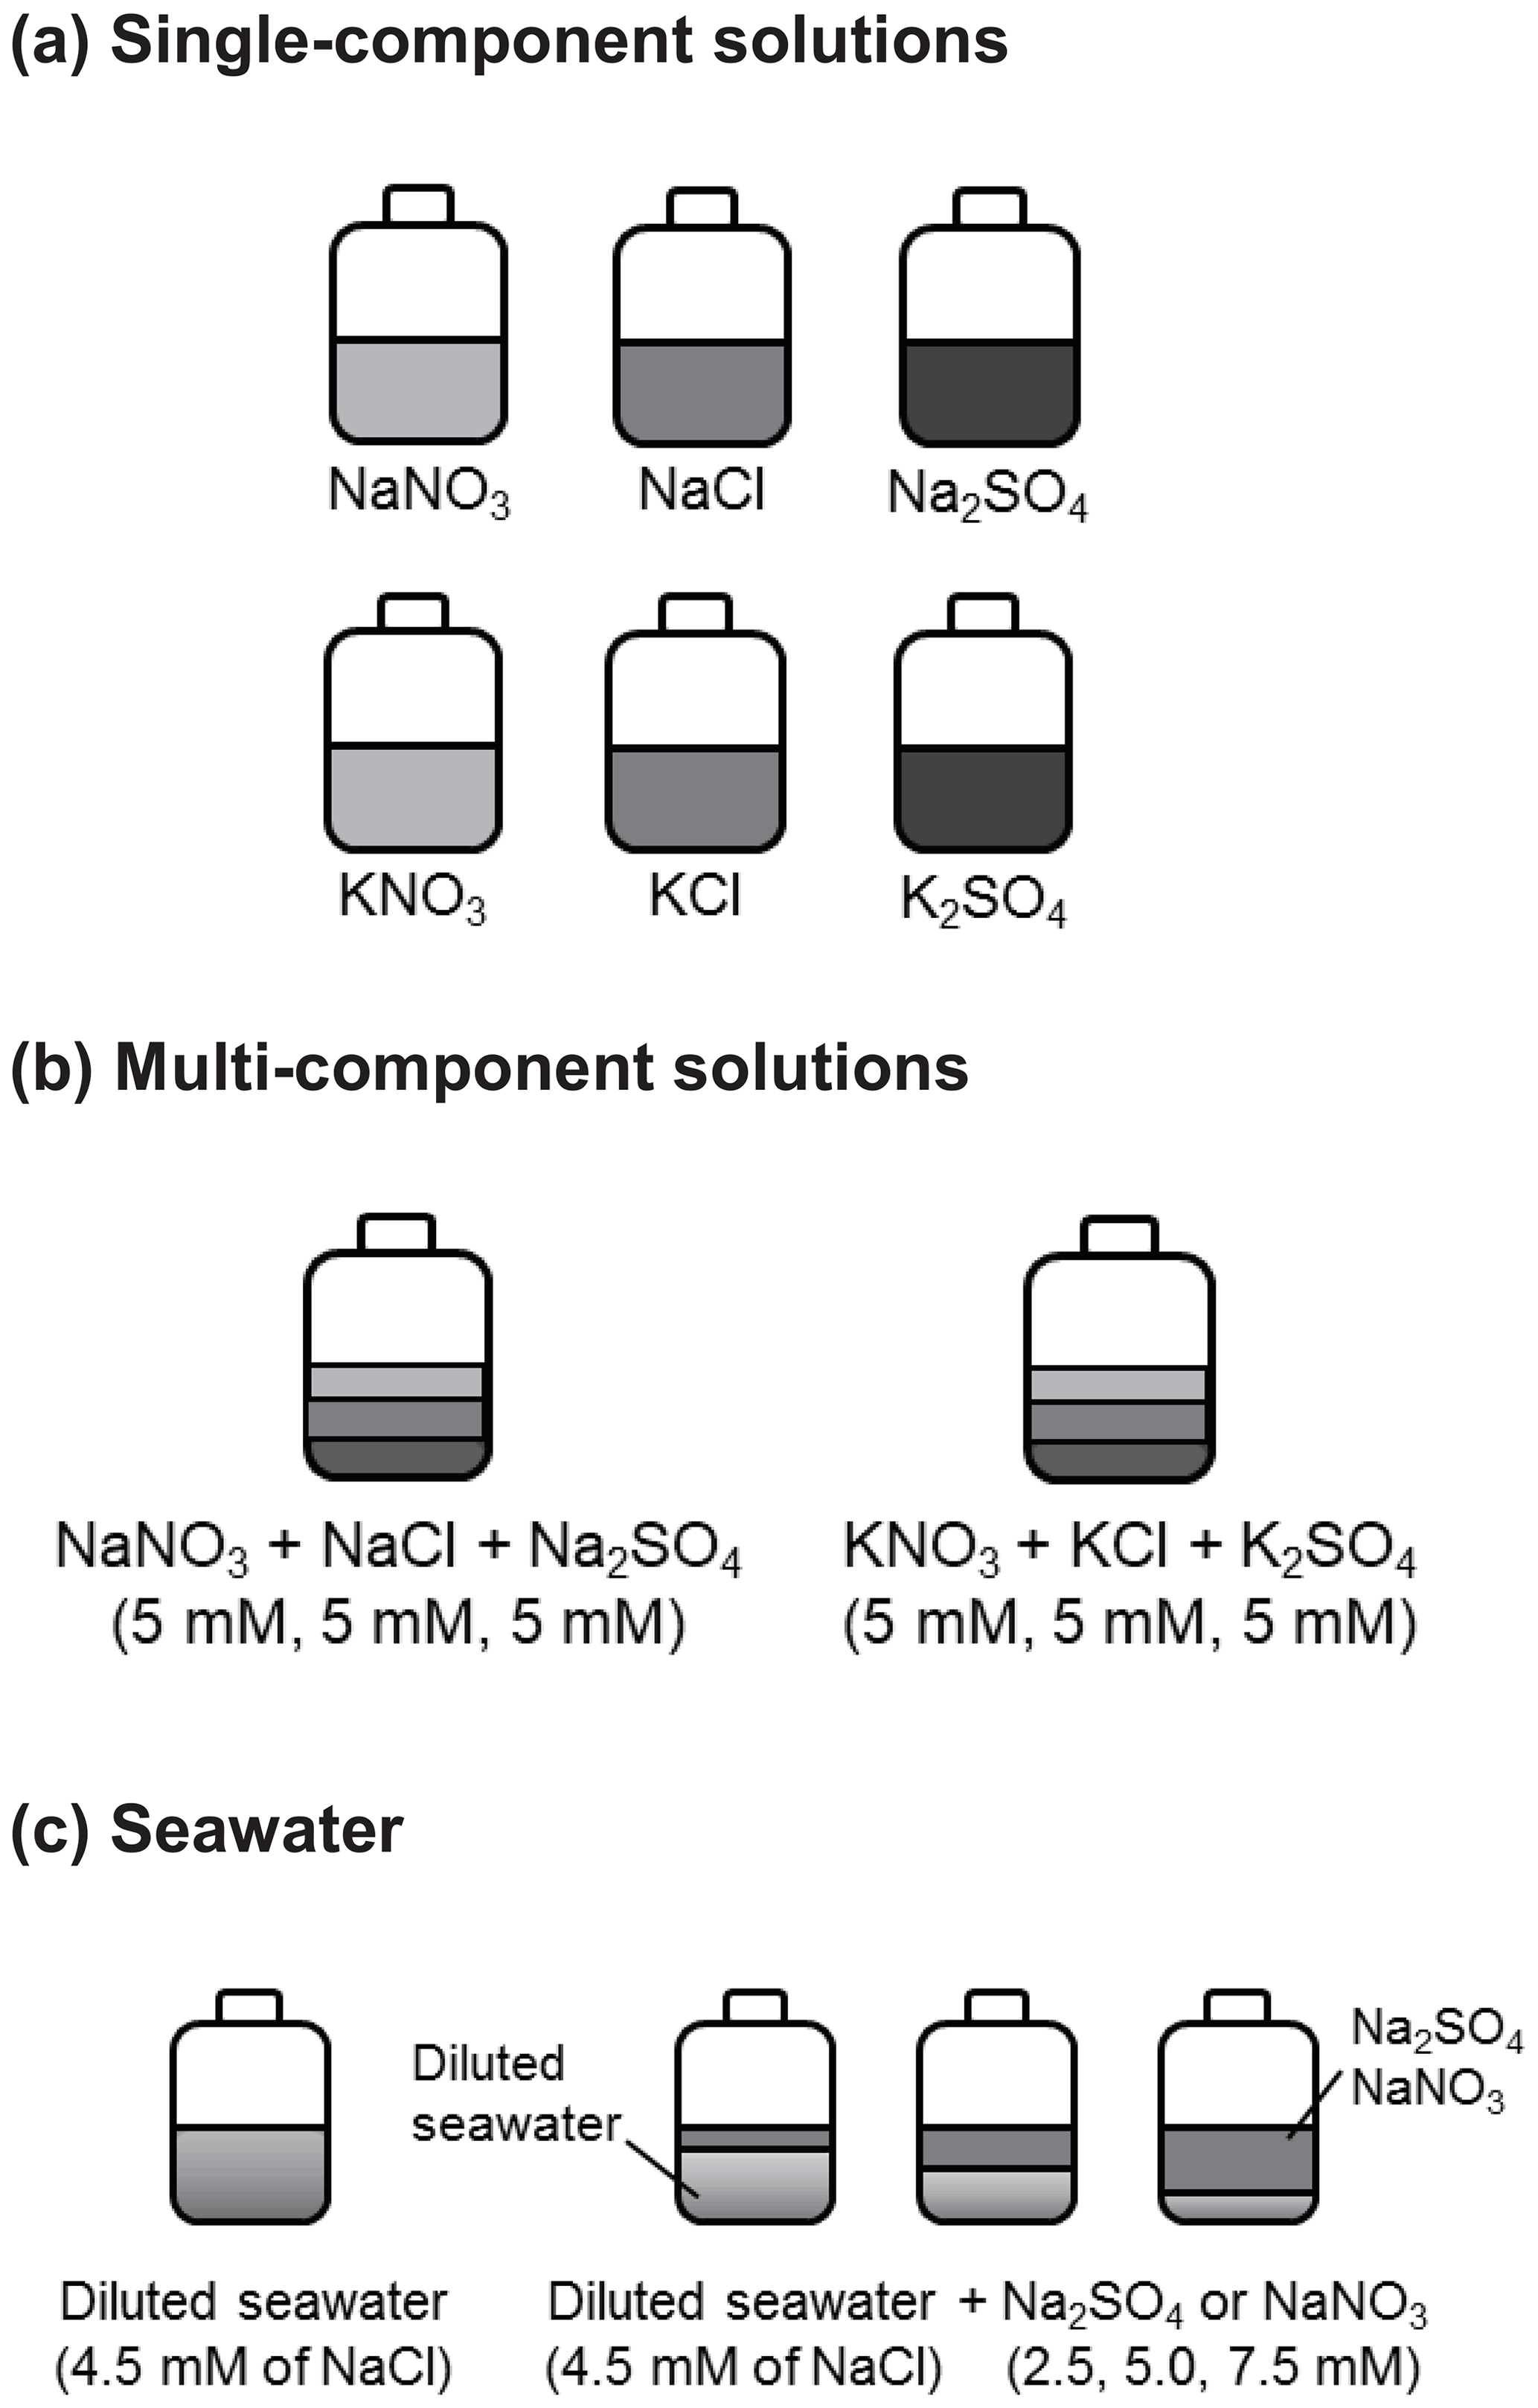
Figure 1Summary of tested solutions. (a) Single-component solutions of NaNO3 (SN), NaCl (SC), Na2SO4 (SS), KNO3 (PN), KCl (PC), and K2SO4 (PS) with a molar concentration of 5 mM. (b) Multi-component solutions of NaNO3 + NaCl + Na2SO4 and KNO3 + KCl + K2SO4 with a molar concentration of 5 mM for each compound. (c) Diluted seawater (by a factor of 100; equivalent to 4.5 mM of NaCl) and diluted seawater with Na2SO4 or NaNO3 with molar concentrations of 2.5, 5.0, and 7.5 mM.
2.3 Data analysis
The equations for calculating the mass loadings for each compound i, Wi, are the same as those presented by Kobayashi et al. (2021) for both the single-component and multi-component experiments. For a single compound i, the mass loadings of the cation or anion of the compound i (, K+, , Cl−, and ) introduced into the rTDMS, Wi, were calculated as follows:
where dm is the mobility diameter of particles, NCPC is the number concentration of monodisperse particles measured by the CPC, F is the sample flow rate, and t is the particle collection time. ρi and fi are the bulk material density and the mass fraction of the cation or anion, respectively, of the compound i. For multi-component particles, we used the following equations:
where n is the total number of molecules in each particle, NA is the Avogadro's number, and W is the mass loadings of multi-component compounds introduced into the rTDMS; ai and Mi are the molar fraction and the molecular weight, respectively, of the compound i (Σai=1). The value of n derived from Eq. (2) is used to calculate the value of W by Eq. (3). The effects of hydrated water should be properly considered for the calculations. The relative humidity (RH) downstream of the diffusion dryer was ∼5 %. Previous studies showed that the efflorescence RHs (ERHs) were 43, 56, 59, and 60 % for SC, SS, PC, and PS particles, respectively (Seinfeld and Pandis, 2006; Freney et al., 2009). We assumed that these compounds were effloresced to form solid crystals before reaching the DMA. Previous studies also reported that nitrate particles did not exhibit clear ERH features (e.g., Freney et al., 2009; Lee and Hsu, 2000). We assumed that SN and PN particles lost a majority of water molecules in order to calculate the mass of particles.
Laboratory experiments for Aerodyne AMSs showed that the collection efficiencies of non-refractory particles are largely controlled by particle bounce on the vaporizer (Matthew et al., 2008; Robinson et al., 2017; Saleh et al., 2017). Matthew et al. (2008) showed that laboratory-generated solid crystalline AS particles exhibited a particle collection efficiency of ∼20 %, which appears to be near the lower bound of the collection efficiencies for various types of particles. The particle collection efficiencies for the rTDMS would be mostly controlled by particle bounce effects as long as the temperature induced by the laser heating exceeds the vaporization temperature of the particle compounds.
Kobayashi et al. (2021) showed that the collection efficiency for solid AS, PS, and SS particles was ∼70 %. We did not measure the collection efficiencies for various types of particles tested in this study. Following the experimental results for the Aerodyne AMSs, we assume that the collection efficiencies for various types of particles were comparable to or higher than those for the laboratory-generated solid crystalline AS particles (∼70 %) in the rTDMS. For SC and PC particles, the collection efficiencies would be ∼70 % because they were likely in the form of solid crystals. For SN and PN particles, the particle collection efficiencies would be in the range of ∼70 %–100 % because they might not be in the form of solid crystals.
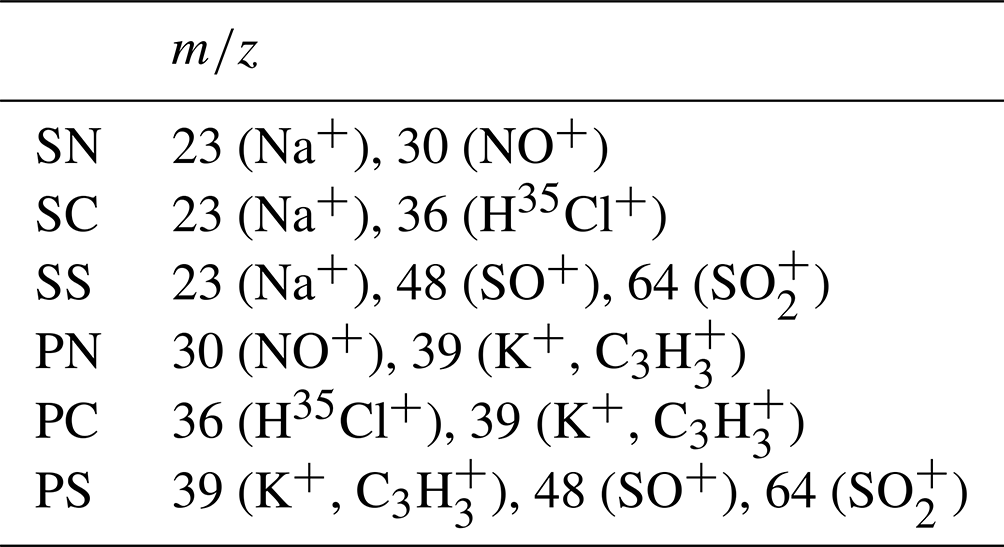
Temporal profiles of ion signals at selected values were integrated over the laser irradiation time to obtain the integrated ion signals for each compound i, . The major values for each compound are listed in Table 2. Variations in due to drifts in the detector sensitivity were corrected by using 14 (N+) signals. The sensitivity of the rTDMS at to compound i, , is defined as the ratio of to Wi. Kobayashi et al. (2021) suggested that the ion signals for multi-component sulfate particles could be approximated as the linear combination of ion signals originating from single-component sulfate particles based on mass closure tests. We did not perform detailed mass closure tests in the current study. Alternatively, we compared the and ratios estimated from the QMS ion signals with those predicted from the ionic concentrations in the solutions.
3.1 Single-component particles
Figure 2 shows temporal profiles of ion signals at 23 (Na+), 30 (NO+), 36 (H35Cl+), 39 (K+, ), 48 (SO+), and 64 () originating from monodisperse SN, SC, SS, PN, PC, and PS particles with mobility diameters of 200 nm. As described earlier, we used a two-step laser modulation for better separation of multi-component aerosol particles. We tested various combinations of laser power settings (power and duration time), as described in the Supplement. The power setting and duration of the first step were 7.5 W and 40 s, and those of the second step were 20 W and 20 s. Note that these laser power values were not measured ones but estimated from the product specifications.
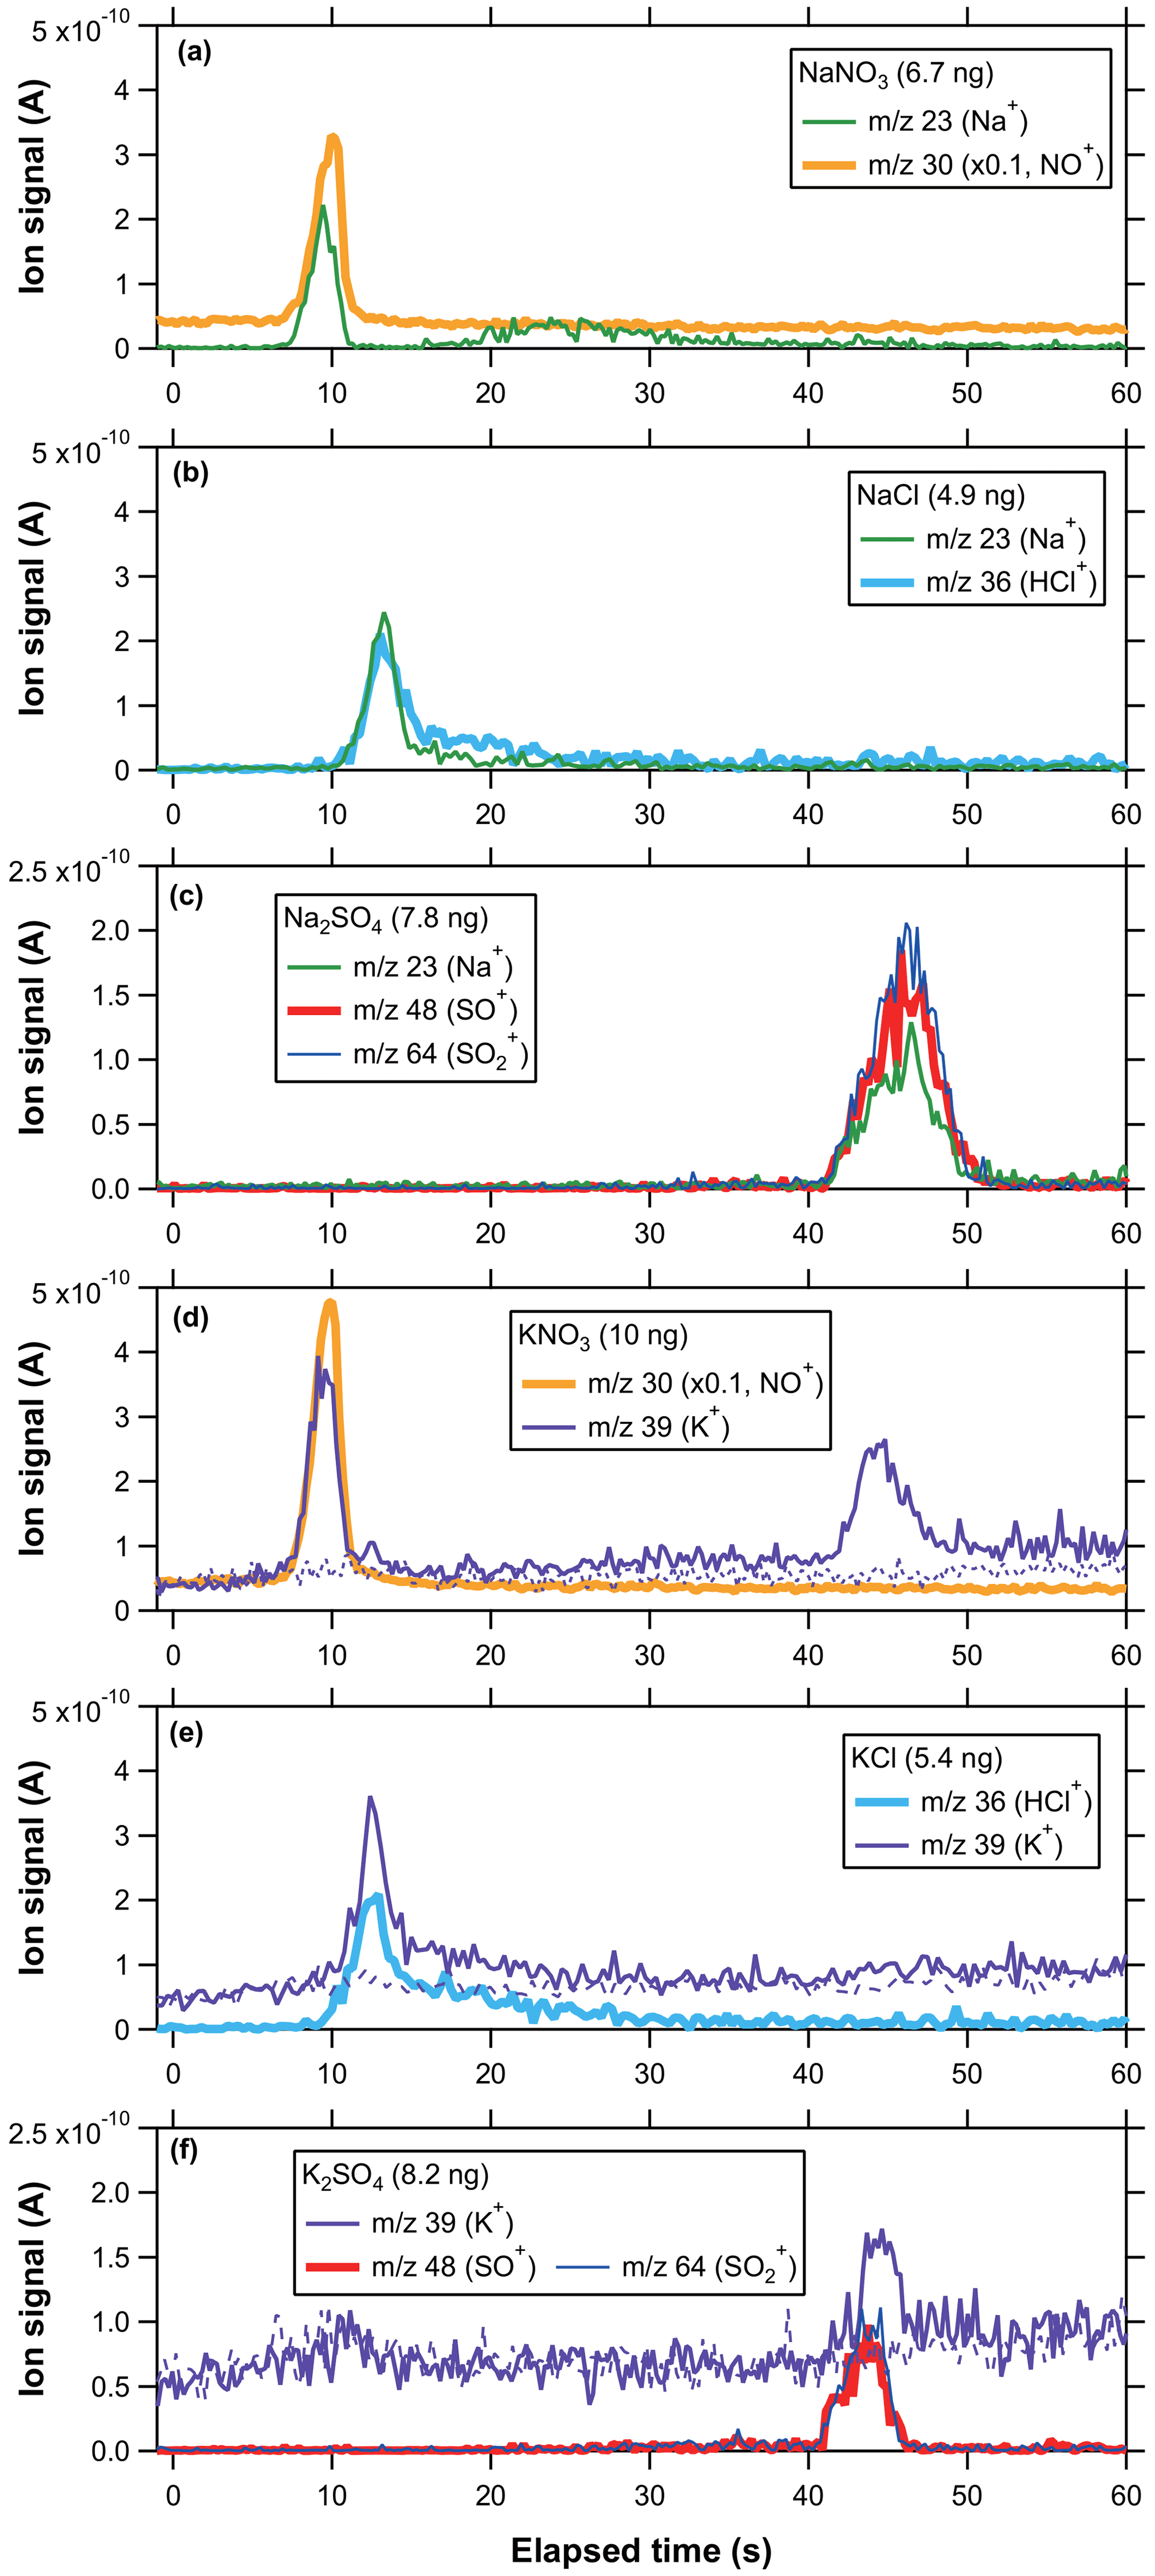
Figure 2Temporal profiles of ion signals originating from single-component (a) SN, (b) SC, (c) SS, (d) PN, (e) PC, and (f) PS particles as a function of elapsed time since turning the laser on. The ion signals at 30 were scaled by a factor of 0.1 for clarity of the presentation. Zero air signals at 39 are also plotted in (d)–(f). Zero signals at 23, 30, 36, 48, and 64 are not displayed because the signal levels were comparable to the baselines (i.e., ion signals before the laser irradiation). Particle mass loadings (in ng) are shown in the legend. The elapsed time may contain an error of ∼1 s because the laser operation was performed manually.
Ion signals at 30 originating from SN particles exhibited a distinct peak at the elapsed time of 7–12 s, whereas those at 23 exhibited bimodal broad peaks at 7–12 and 15–50 s (Fig. 2a). The ion signals at 46 () were negligibly small compared to those at 30, indicating that nitrate was mainly decomposed to NO. Ion signals at 23 and 36 originating from SC particles exhibited a single peak starting at ∼8 s with significant tailing up to ∼30 s (Fig. 2b). Ion signals at 58 (Na35Cl+) and 81 () were negligibly small compared to those at 23 or 36, indicating that the contributions of the intact form of NaCl or its clusters were not significant. Ion signals at 23, 48, and 64 from SS particles showed a distinct single peak at 40–52 s (Fig. 2c). Following the discussion by Kobayashi et al. (2021), the fragment ratio of 48 to 64 suggests that the major thermal decomposition product from SS particles was SO2 or SO3.
Ion signals at 30 originating from PN particles exhibited a distinct peak at 6–13 s, whereas those at 39 exhibited bimodal broad peaks at 6–13 and 40–50 s (Fig. 2d). Similarly to SN, ion signals at 46 were negligibly small compared to those at 30. The ion signals at 39 from PN particles did not reach the background level after the second peak, suggesting that PN particles were not fully vaporized at the current laser power settings. This may lead to underestimation of the sensitivity at 39 for PN particles. Ion signals at 36 and 39 originating from PC particles exhibited a single peak starting at ∼8 s with significant tailing up to ∼30 s (Fig. 2e). Similarly to SC, ion signals at 74 (K35Cl+) were negligibly small compared to those at 36 or 39. A small increase in the ion signals at 39 from PC particles was observed after 40 s, indicating that PC particles were not fully vaporized by the first laser power setting (7.5 W for 40 s). We estimated the effect of the small peak to be ∼20 % of that of the main peak by comparing the ion signals after 40 s with those before 40 s. Ion signals at 39, 48, and 64 from PS particles showed small increases at ∼30 s followed by a distinct peak at 40–47 s (Fig. 2f). The ion signals at 39 from PS particles also exhibited a peak at ∼ 6–13 s, which was probably due to artifacts ( from organic compounds adsorbed on the graphite collector). Similarly to SS, the fragment ratio of 48 to 64 suggests that the major thermal decomposition product from PS particles was SO2 or SO3. The timing of the ion signals was qualitatively consistent with the order of the bulk thermal decomposition temperature (Table 1).
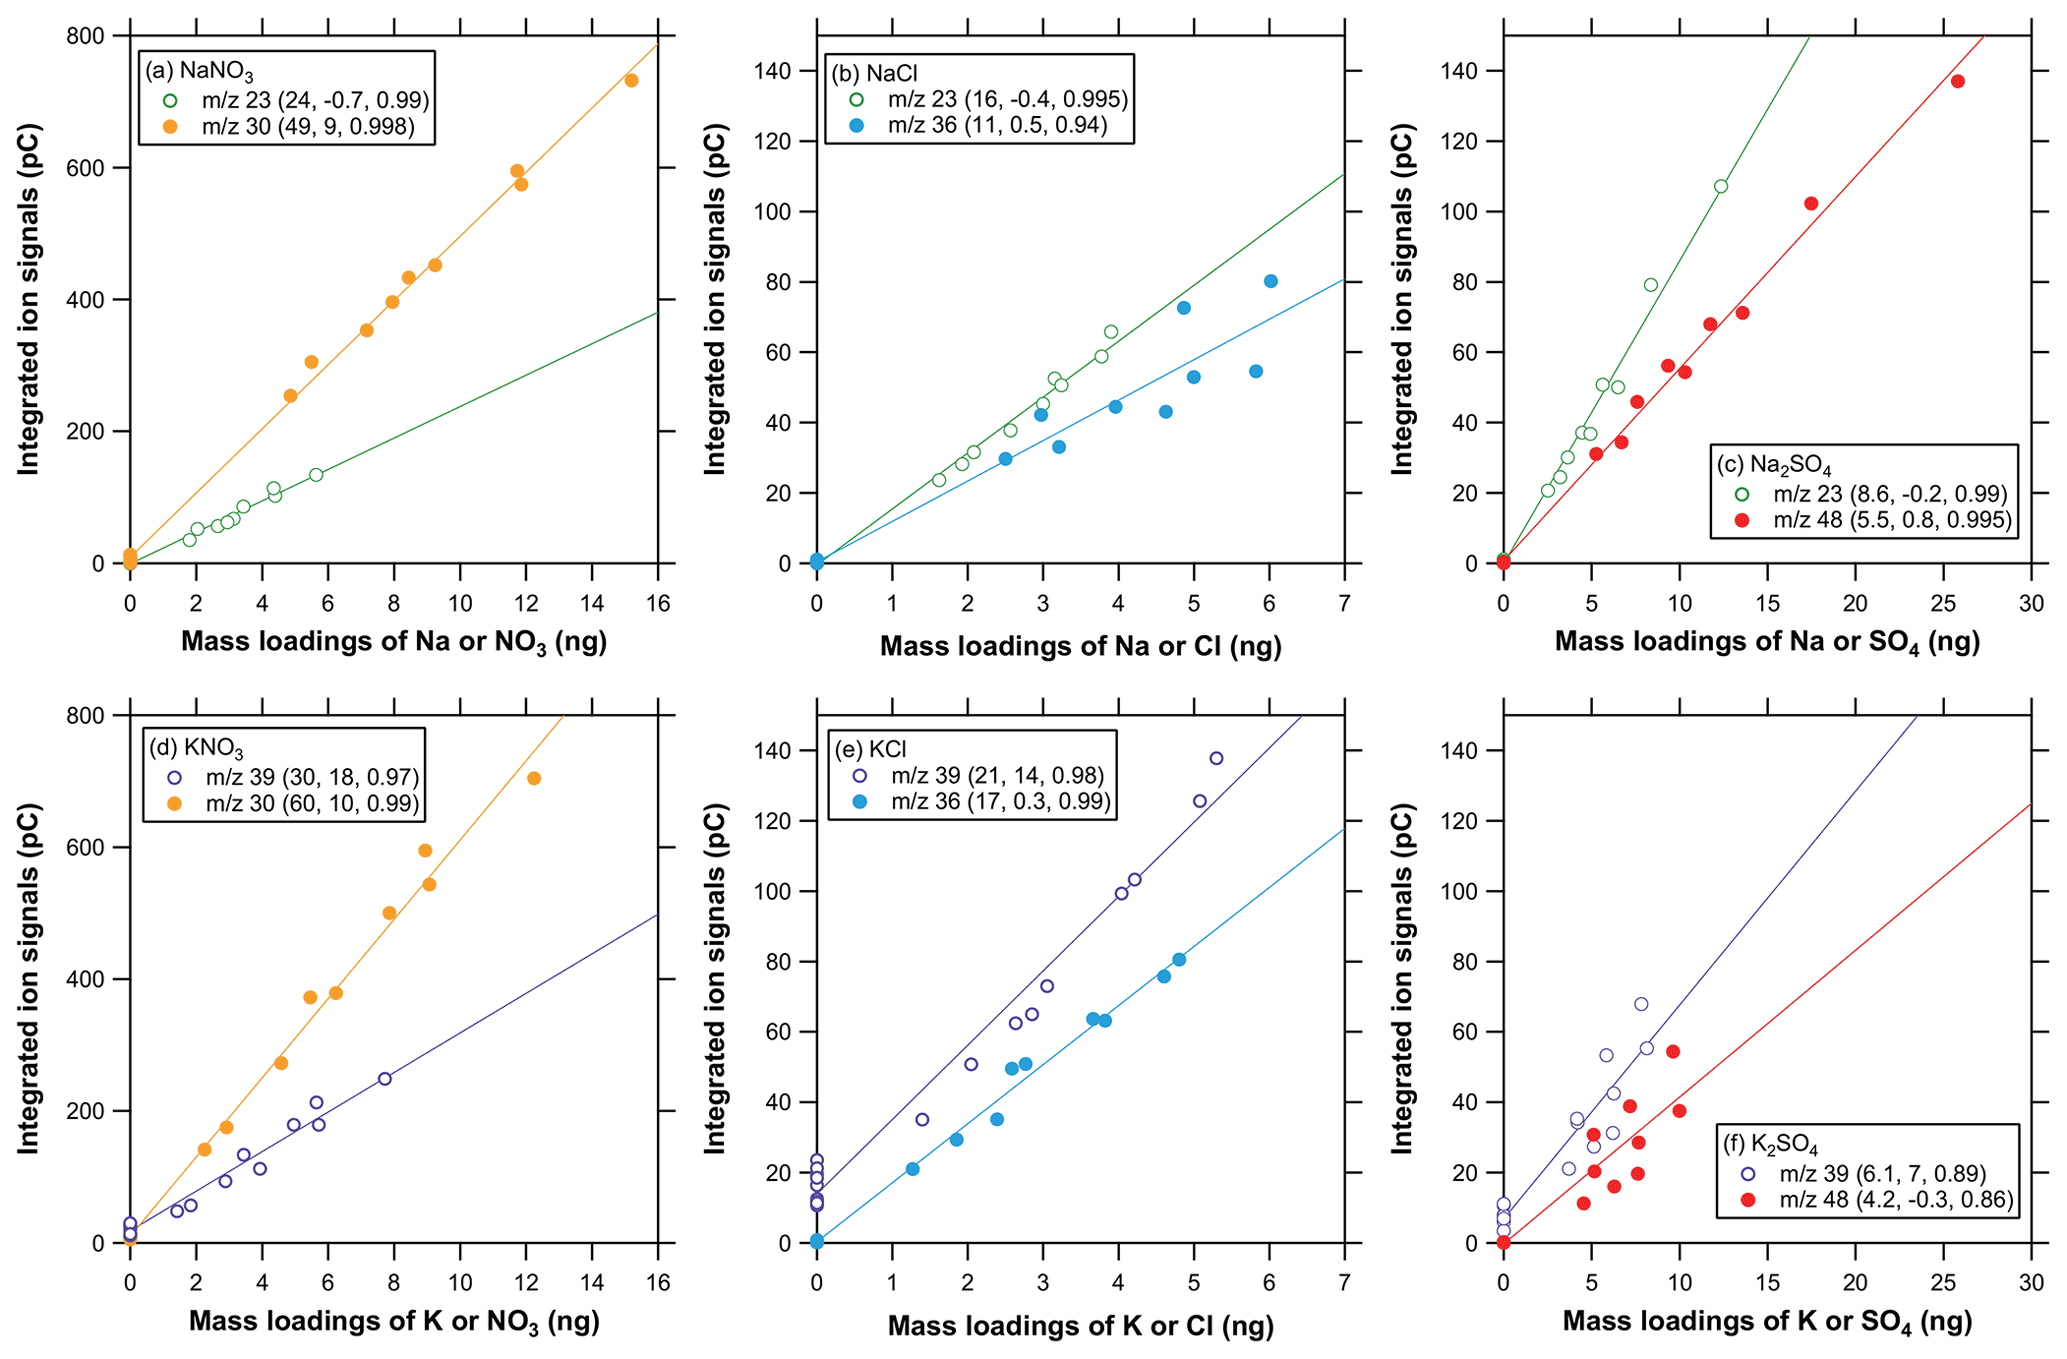
Figure 3Scatterplots of integrated ion signals versus mass loadings (Na for 23; K for 39; NO3 for 30; Cl for 36; SO4 for 48) for (a) SN, (b) SC, (c) SS, (d) PN, (e) PC, and (f) PS particles. The three values in the parentheses in the legend represent the slope, intercept, and r2, respectively, for the linear regression.
Figure 3 shows scatterplots of integrated ion signals () versus the mass loadings of the corresponding parent compounds (Wi) for single-component SN, SC, SS, PN, PC, and PS particles. Data obtained on different days are collectively plotted. The time window for the ion signal integration was set at 5–15 s ( 30) and 5–50 s ( 23) for SN, 5–15 s ( 30) and 5–55 s ( 39) for PN, 5–40 s for SC and PC, 40–55 s for SS, and 30–50 s for PS. There was no systematic difference in the –Wi relationship between the data obtained on different days, and the correlation coefficients were generally high (r2>0.8) for all the compounds tested, indicating good linearity and reproducibility in detecting these compounds. The scatter in the 39 signals at mass loadings of zero (i.e., ZA measurements) might be due to interference from organic compounds (). The integrated ion signals at 64 showed good correlation with those at 48 for SS and PS (r2>0.99; not shown in Fig. 3).
The difference in the regression slopes at a specific between different compounds can be interpreted as the variability in the sensitivity with respect to the difference in the chemical form. The regression slope at 30 was 49 and 60 pC ng−1 (average of 55 pC ng−1) of NO for SN and PN, respectively. The regression slope at 36 was 11 and 17 pC ng−1 (average of 14 pC ng−1) of Cl− for SC and PC, respectively. As mentioned above, the integrated ion signals at 64 showed good correlation with those at 48 for SS and PS, and we used 48 as a representative ion signal for these sulfate compounds. The regression slope at 48 was 5.5 and 4.2 pC ng−1 (average of 4.9 pC ng−1) of for SS and PS, respectively. These results suggest that the variability in the sensitivity was less than ∼20 % for , Cl−, and . By contrast, the regression slope at 23 was 24, 16, and 8.6 pC ng−1 (average of 16 pC ng−1) of Na for SN, SC, and SS, respectively, and the regression slope at 39 was 30, 21, and 6.1 pC ng−1 (average of 19 pC ng−1) of K for PN, PC, and PS, respectively. These results suggest that the variability in the sensitivity was considerably large for Na and K (more than ∼50 %). Furthermore, the sensitivities at 30 for nitrate particles were much larger than those for the other peaks (Figs. 2 and 3). The difference in the sensitivities cannot be explained by the difference in the electron ionization cross sections. We have not identified the mechanisms that caused the variability in the sensitivity values. The difference in the divergence angle of evolved gas molecules after the thermal desorption might be a possible mechanism (Uchida et al., 2019; Ide et al., 2019).
3.2 Multi-component particles
Figure 4 shows the temporal evolution of ion signals at 23, 30, 36, 39, and 48 originating from internally mixed, multi-component sodium and potassium salt particles. The multi-component ion signals at 23 and 39 exhibited trimodal peaks, with the first and second ones partially overlapped. Based on the comparison with the single-component experiment data, the first, second, and third peaks can be attributed to nitrate (SN, PN), chloride (SC, PC), and sulfate (SS, PS), respectively. These results indicate that the temporal profiles of ion signals at 23 (or 39) originating from internally mixed SC + SS + SN (or PC + PS + PN) particles were characterized by three sequential peaks associated with the evolution of the desorption temperature. Note that the third peak at 23 and 39 might be affected by the tails of the ion signals originating from SC and PC particles, respectively (especially for PC). We have not investigated the effects of the enhanced background signals on the quantification of sodium and potassium in the current study.
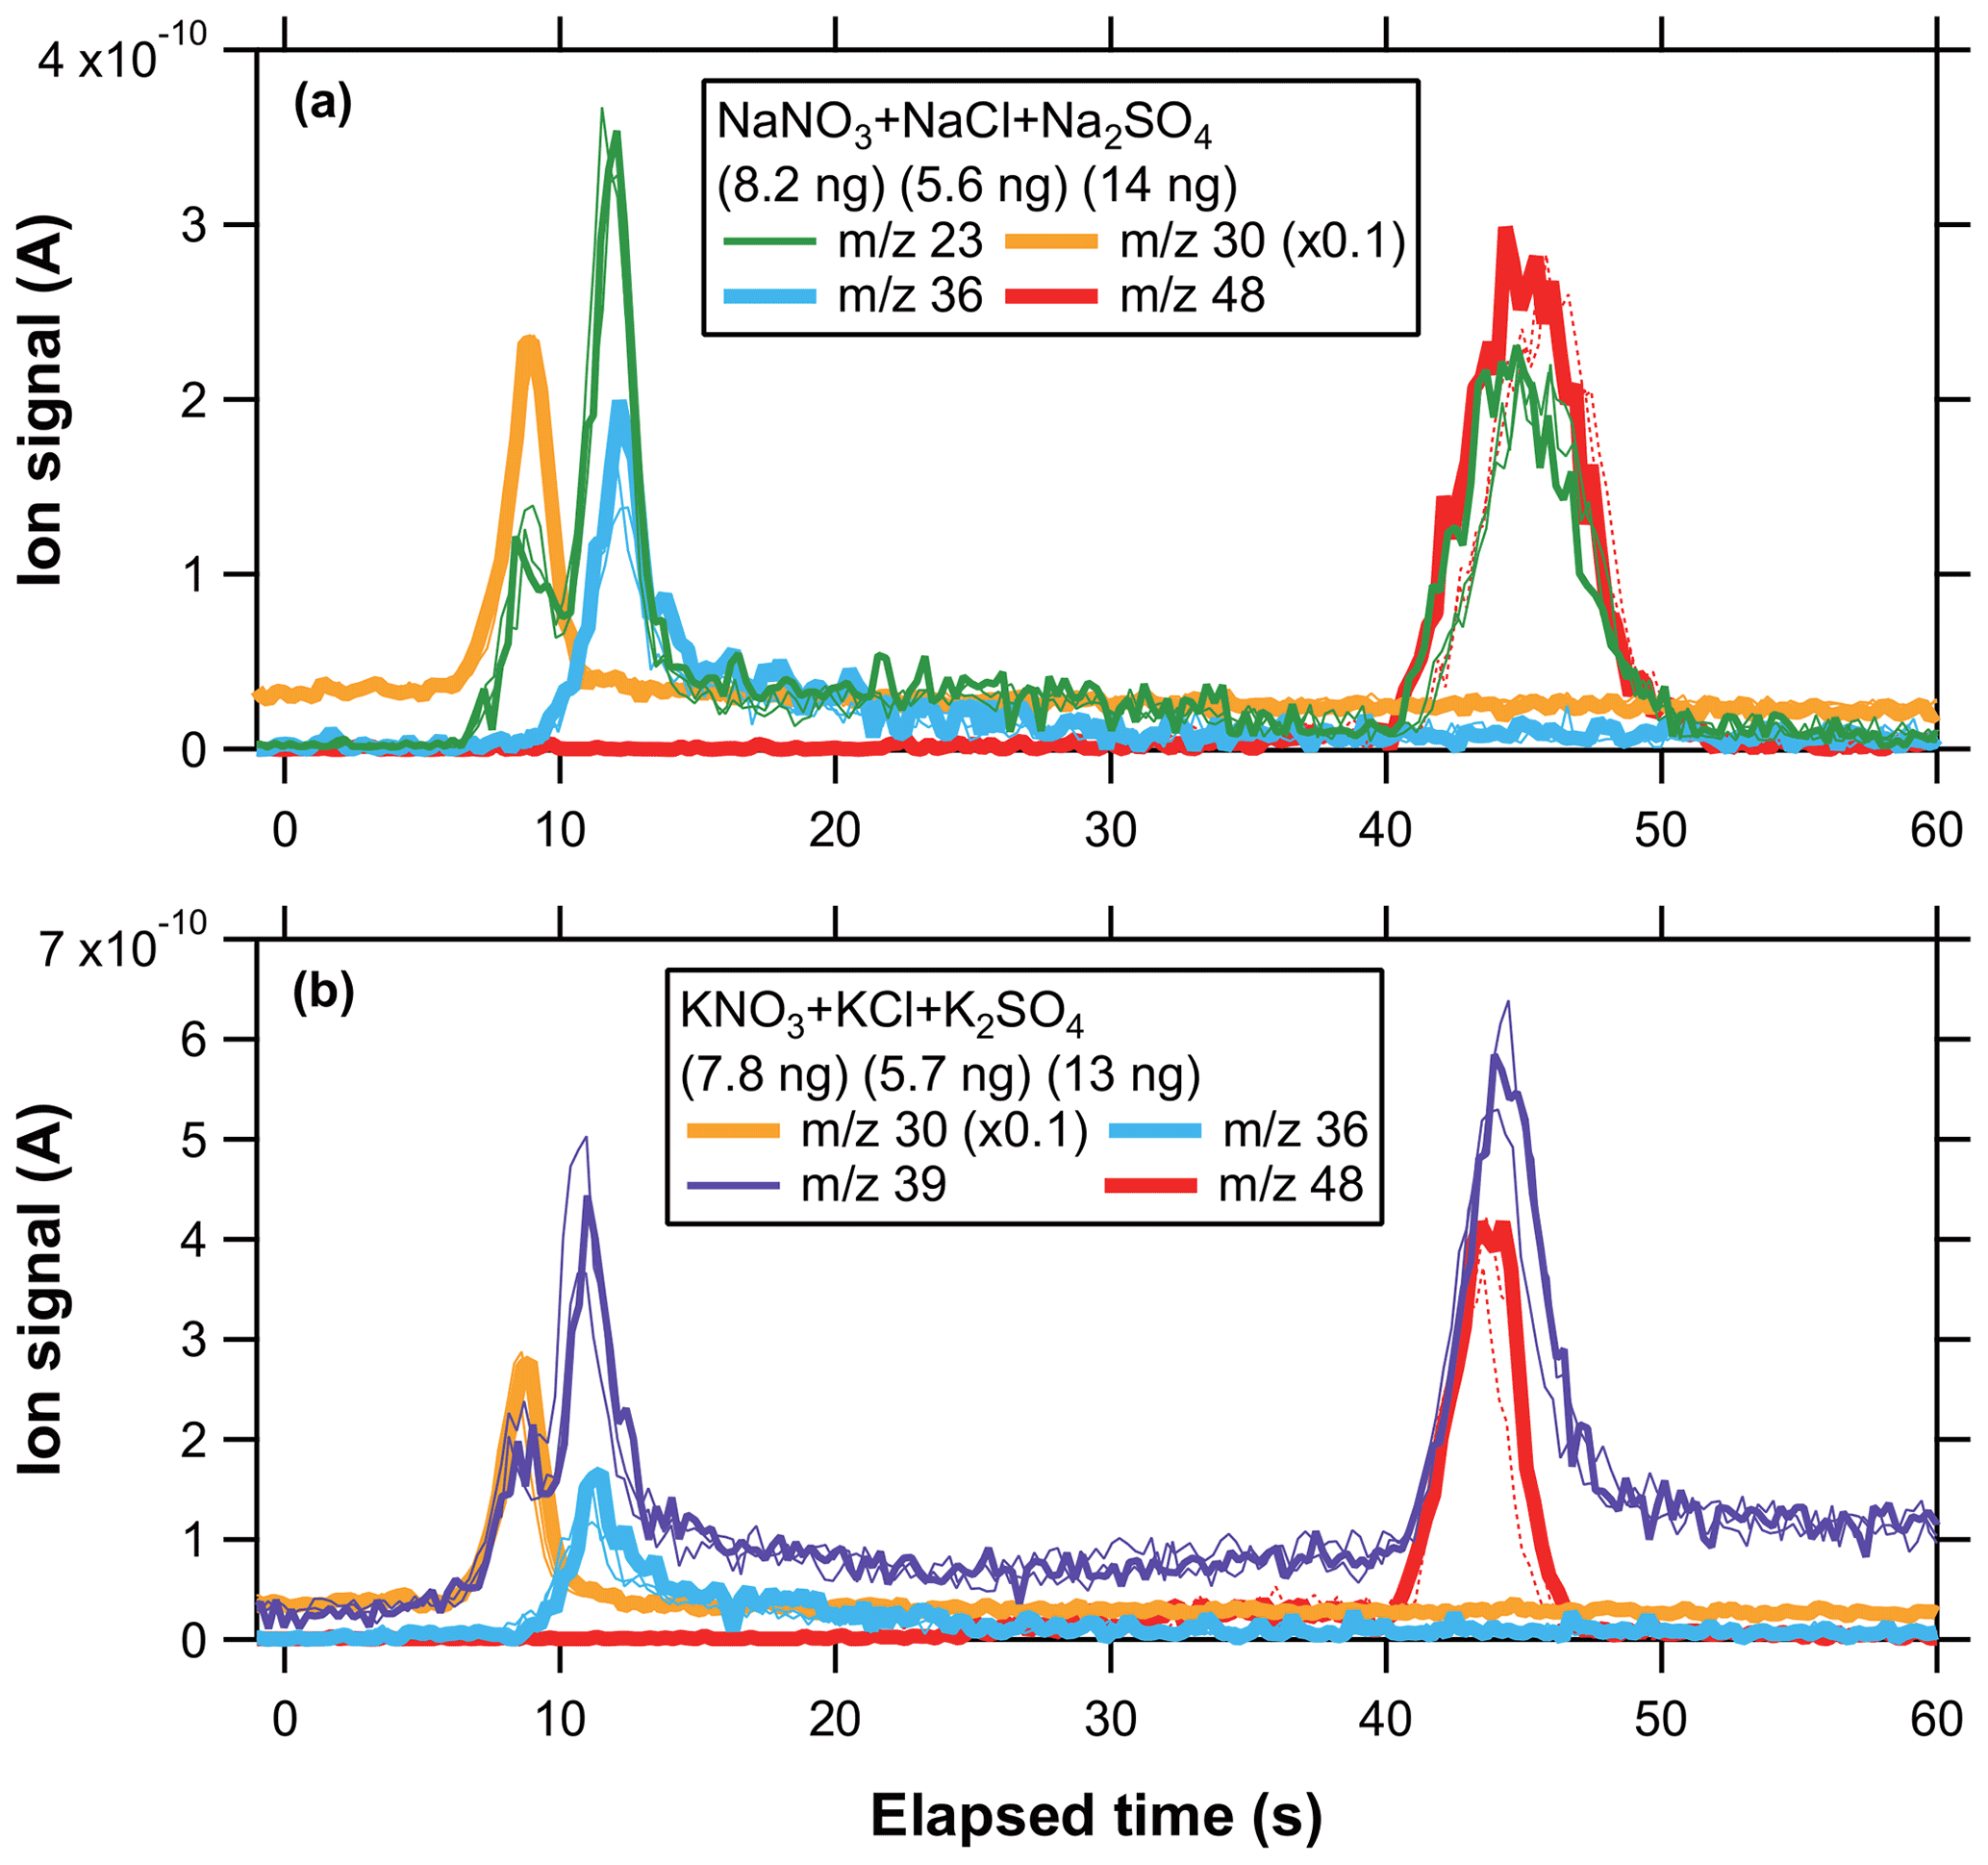
Figure 4Temporal profiles of ion signals originating from an internal mixture of (a) SN + SC + SS and (b) PN + PC + PS particles. The ion signals at 30 were scaled by a factor of 0.1 for clarity of the presentation. The thin and dashed lines represent repeated measurement data normalized to the mass loadings of the main data (the thick lines).
3.3 Particles generated from seawater samples
Figure 5a–c show the temporal evolution of ion signals at 23, 30, 36, and 48 originating from diluted seawater and “seawater + SN (or SS)” particles. The ion signals at 23 and 36 originating from diluted seawater particles exhibited temporal evolution shapes similar to those of the single-component SC particles. Ion signals at 23 originating from seawater + SN particles exhibited partially overlapped bimodal peaks.

Figure 5Temporal profiles of ion signals originating from (a) seawater (equivalent to 4.5 mM of SC), (b) seawater + SN (7.5 mM), and (c) seawater + SS (7.5 mM) particles.
Let MX be a salt formed from M+ and X− ions. We define the equivalent molar concentration of MX in the seawater sample as the molar concentration of M+ (or X−) that would form MX by complete dehydration (see the Supplement for details). Figure 6 shows scatterplots of the molar ratios of SN (or SS) to SC in collected particles estimated from ion signals versus the equivalent molar ratios of SN (or SS) to SC in the solutions. The data points for the authentic multi-component particles described in Sect. 3.2 are also plotted for comparison. The molar ratios of SN (or SS) to SC in the collected particles were calculated using the integrating ion signals at 30 (or 48) and 36. We also used ion signals at 23 to estimate the molar ratios of SN (or SS) to SC in collected particles. We employed a multi-peak fitting method for both the single- and multi-component sodium salt particles to estimate the contributions of SN and SC to the measured ion signals at 23 (see the Supplement). The linear regression slopes for the seawater + SN particles were found to be 0.48 (by 23) and 0.85 (by 30 and 36), and those for the seawater + SS particles were found to be 0.98 (by 23) and 1.1 (by 36 and 48). The data for the seawater + SN (or SS) samples showed a good linearity (r2≥0.98) and agreed well with the data points for the authentic multi-component particles, suggesting that interferences of unidentified compounds in seawater were small. The ratios estimated from the ion signals at 23, 36, and 48 agreed well with those predicted from the solution concentrations to within ∼10 %. The ratios estimated from the ion signals at 30 and 36 also agreed with those predicted from the solution concentrations to within ∼15 %, whereas the ratios estimated from the ion signals at 23 were significantly lower (∼52 %) than the predicted values. Possible causes for the difference will be discussed in Sect. 4.3.
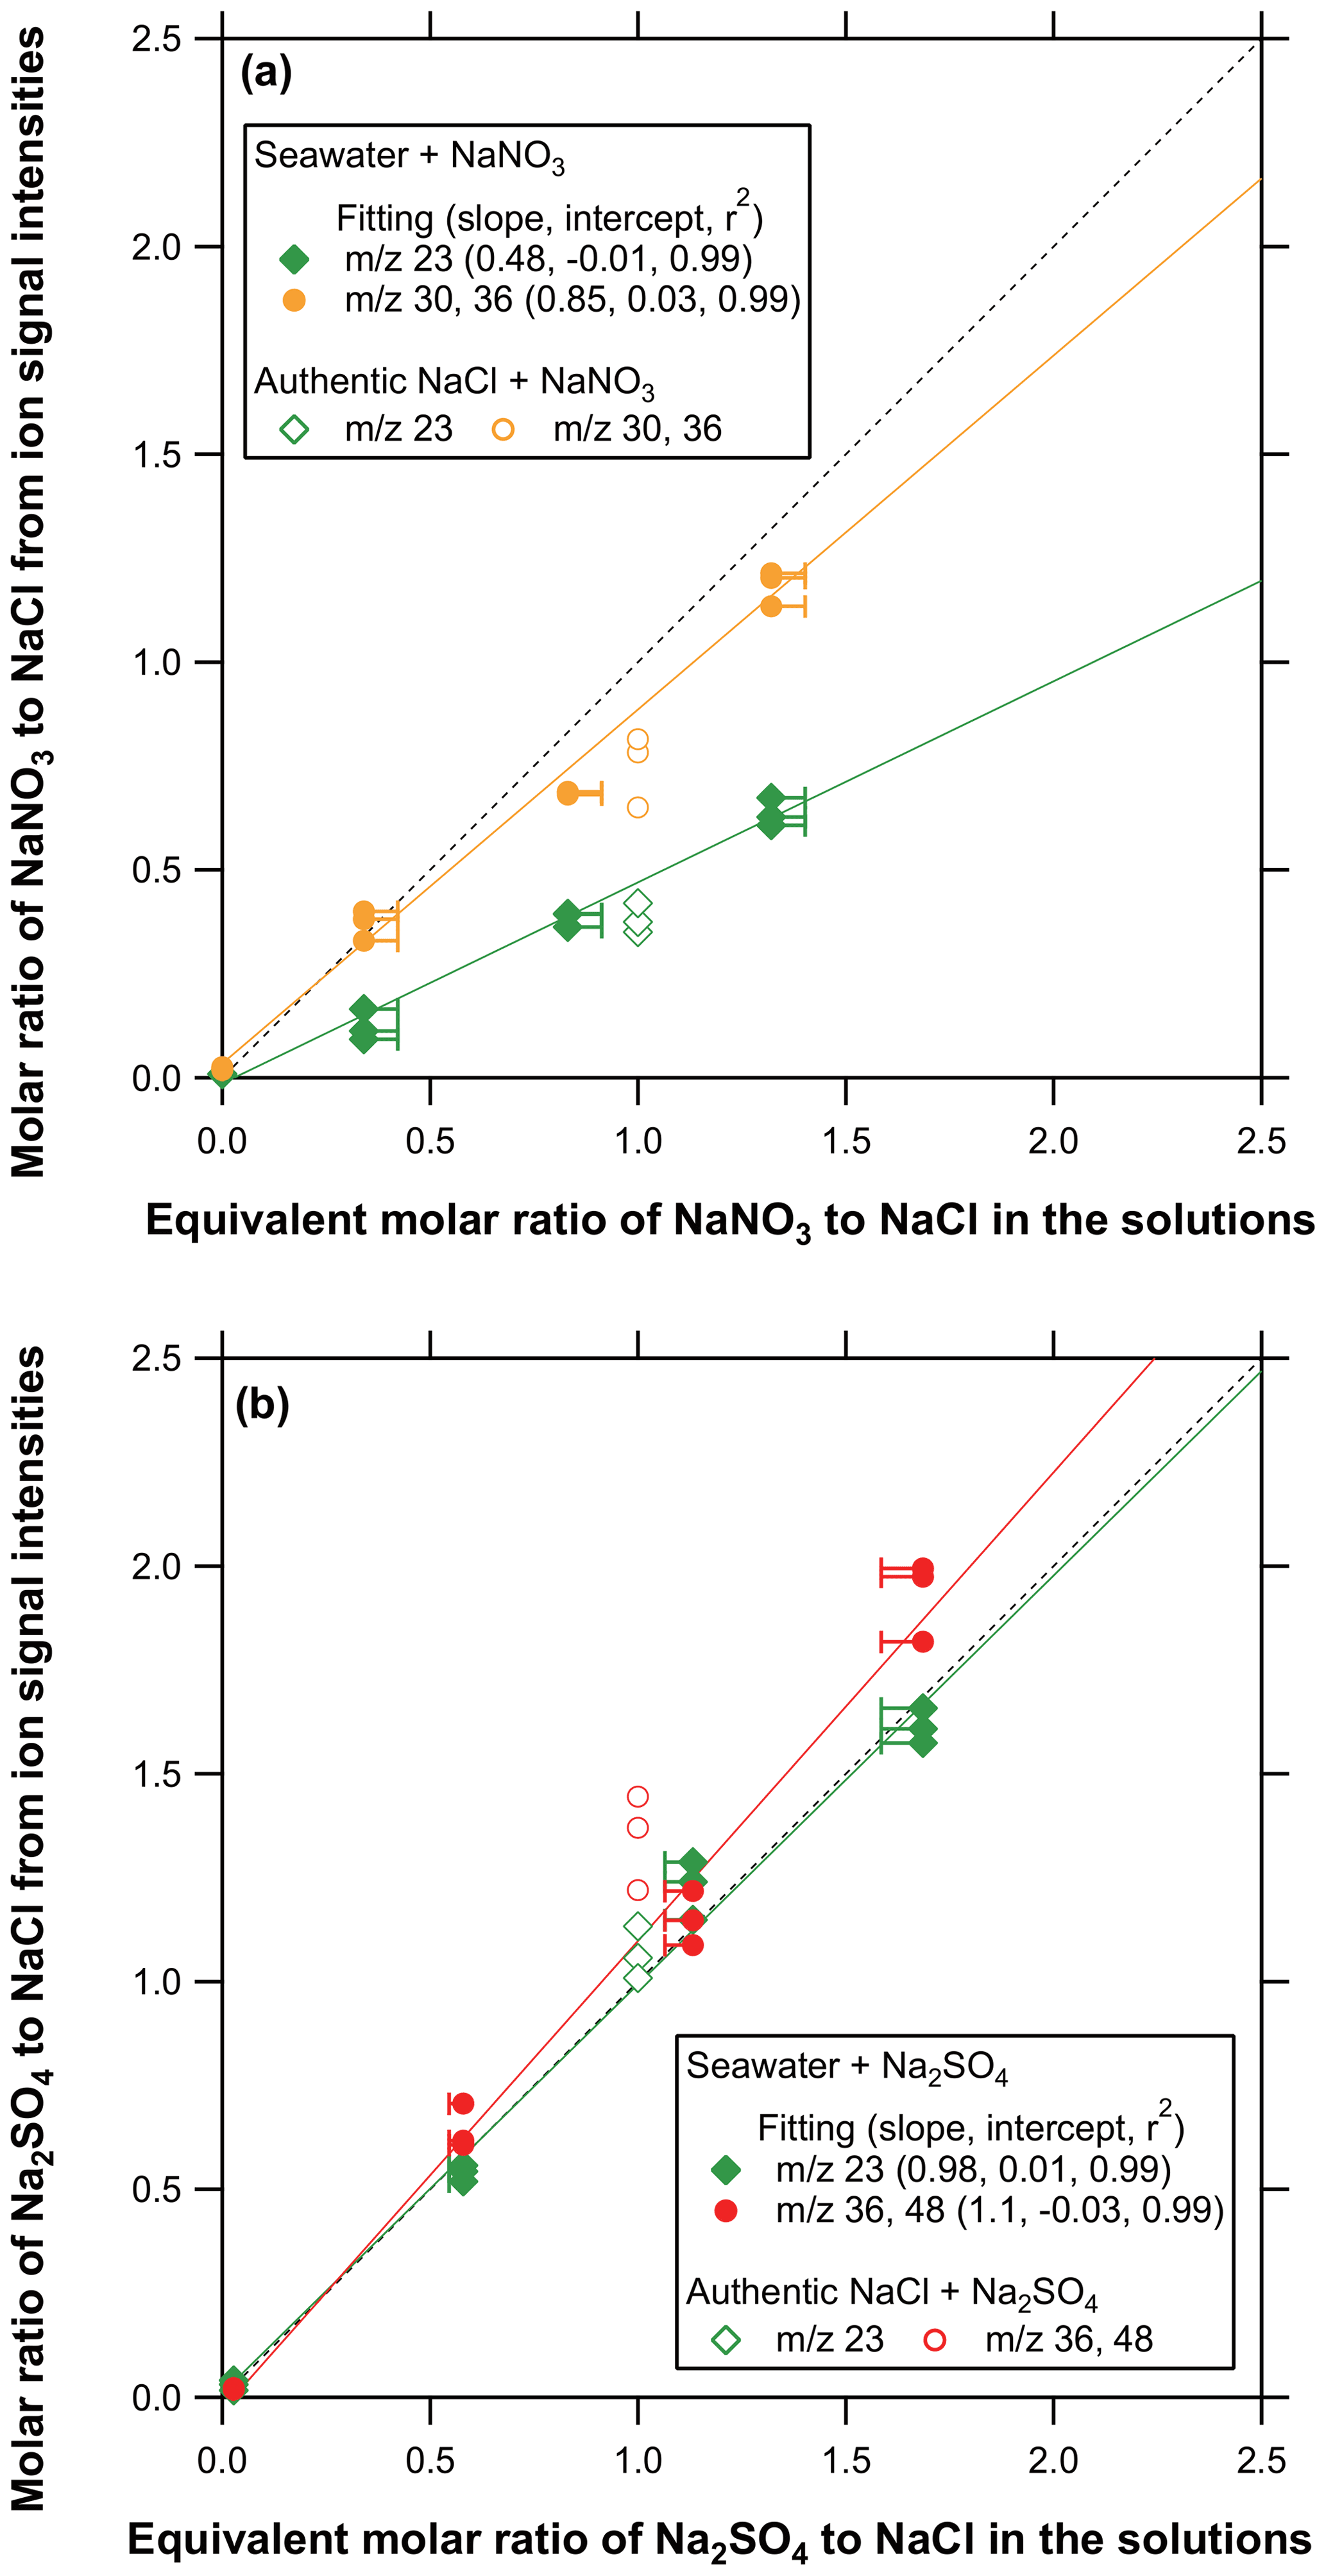
Figure 6(a) Scatterplots of the molar ratios of SN to SC derived from ion signals versus the equivalent molar ratios of SN to SC in the solutions. The slope, intercept, and r2 values for the linear regression are indicated in the legend. Solid and open symbols represent the data from seawater + SN and SC + SN particles, respectively. The error bars for the x axis represent the uncertainties in estimating the equivalent molar concentrations of the compounds (see the Supplement for details). (b) Same as (a) but for the molar ratios of SS to SC.
4.1 Thermal decomposition mechanisms
The thermal decomposition mechanisms for SS and PS were discussed by Kobayashi et al. (2021). Here we discuss possible thermal decomposition processes of nitrate and chloride. Our experimental data indicate that the thermal decomposition of SN particles yielded gas-phase Na and NO and that of PN particles yielded gas-phase K and NO. However, the temporal evolution of the ion signals at 23 and 39 suggests that the thermal decomposition processes of SN and PN particles were not represented by single-step reactions. Tagawa (1987) proposed the following reactions for the thermal decomposition of bulk SN in dry air:
and those for PN in dry air are
We speculate that Na2O and K2O underwent further thermal decomposition reactions to yield gas-phase Na and K in the rTDMS. The observed bimodal peaks at 23 (or 39) originating from SN (or PN) particles might be attributed to the sequentially occurring thermal decomposition of NaNO3 (or KNO3) and NaOx (or KOx).
The thermal decomposition processes of chloride would be simpler than those of nitrate and sulfate. We did not observe significant ion signals at 58 (Na35Cl+) and 74 (K35Cl+). Therefore, SC and PC particles were likely decomposed to metallic and halogen atoms:
The sensitivity of ion signals at 36 was larger than those at 35 by a factor of ∼3. This suggests that Cl(g) evolved from SC or PC particles mostly reacted with H2O in background air or on the graphite surface to form HCl(g) (Drewnick et al., 2015; Tobler et al., 2020).
As described in Sect. 2.1, we used the two-step laser modulation to separately quantify the aerosol compounds tested in this study. While this method successfully separated SS from SN and SC, the ion signals for SN and SC showed temporal overlapping. This is somewhat unexpected considering that the difference in the bulk thermal desorption temperature between SN and SC is larger than that between SC and SS (Table 1). The cause of this discrepancy is currently unknown.
4.2 Uncertainties in the quantification of single-component particles
The limit of detection (LOD) was estimated as the equivalent concentration at 3 times the standard deviation (3σ) of the integrated ion signals for repeated ZA measurements (20 samples for each compound). The equivalent concentration is calculated as the ratio of the 3σ value to the product of the sensitivity at a certain and sample air volume. The LOD values estimated by this method are listed in Table 3.
Table 3Limit of detection (LOD; µg m−3) for the mass concentrations of SN, SC, SS, PN, PC, and PS particles. The values in parentheses denote the mass loadings (ng).
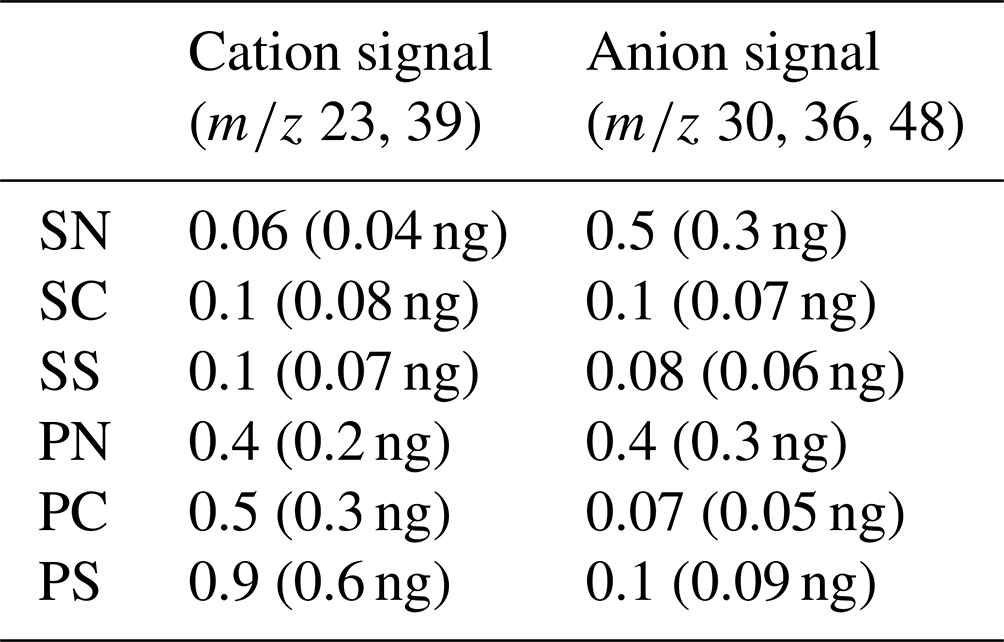
The LODs were estimated as the equivalent concentration at 3 times the standard deviation (3σ) of the integrated ion signals for repeated ZA measurements with a total measurement cycle of 10 min (particle collection time of 6 min). The 10 min measurement cycle was chosen because it was used for ambient test measurements.
The systematic errors due to the particle collection efficiencies were already described in Sect. 2.3. Other systematic errors may originate from the accuracy of the CPC detection efficiency, the DMA sizing, and the flow rate calibrations. These factors are not considered here because they are not specific to the detection of sodium and potassium salt particles by the rTDMS. The systematic errors might also originate from the effective density of particles, which was discussed in our previous study (Kobayashi et al., 2021). This factor is not considered because it was difficult to quantify with the current experimental apparatus.
4.3 Uncertainties in the quantification of multi-component sodium salt particles
The systematic errors in quantifying the and ratios (Fig. 6) are discussed. The collection efficiency of SC and SS particles could be approximated as ∼70 % because they were likely in the form of solid crystals (see Sect. 2.3). Assuming that the seawater (mainly SC) + SS and SC + SS particles were in the form of solid crystals, the collection efficiency would also be approximated as ∼70 %. Therefore, the uncertainty in the ratios due to the particle collection efficiencies was probably small. For the seawater + SN and SC + SN particles, however, the interpretation of the collection efficiency is rather complicated. The collection efficiency of the SN particles would be in the range of ∼70 %–100 % because they might not be in the form of solid crystals (see Sect. 2.3). Ishizaka et al. (2020) showed that the ERH of equimolar mixed SC and SN particles was ∼33 %, suggesting that the SC + SN particles (either authentic materials or seawater) were in the solid phase when introduced into the rTDMS. Assuming that the collection efficiency of the SC + SN particles was approximated as ∼70 %, the ratios could be underestimated by up to ∼30 % when using the sensitivity for the SN particles.
The deviation of the ratios derived from the 23 signals (∼52 %) cannot be explained by the systematic errors due to the collection efficiency. We compared the temporal profiles of ion signals at 23 from the single-component SN and SC particles and multi-component SC + SN particles (see the Supplement for details). The ion signals at 23 that could be attributed to SN in the multi-component particles (i.e., the first peak) were smaller than those expected from the single-component SN particles. By contrast, the ion signals at 23 that could be attributed to SC in the multi-component particles (i.e., the second peak) were larger than those from the single-component SC particles. These results suggest that there might be significant matrix effects in the quantification of SN and SC particles when using ion signals at 23 (i.e., the sensitivities depend on coexisting compounds). We have not investigated the mechanisms responsible for the matrix effects. Therefore, ion signals at 23 should be used only for qualitative identification of SN and SC particles.
The quantification of sodium and potassium salt (nitrate, chloride, sulfate) particles by the rTDMS was investigated in the laboratory. We generated single-component sodium or potassium salt particles (SN, SC, SS, PN, PC, and PS) and multi-component SN + SC + SS or PN + PC + PS particles. We also generated particles from real seawater samples. The major conclusions are summarized below:
-
Major ion signals originating from single-component sodium or potassium salt particles were clearly detected, associated with the increase in the desorption temperature by laser heating. A good linearity (r2>0.8) and reproducibility were found between the major ion signals and mass loadings.
-
Temporal profiles of ion signals at 23 (or 39) originating from multi-component sodium (or potassium) salt particles were characterized by three sequential peaks associated with the evolution of the desorption temperature. The first, second, and third peaks were attributed to SN (or PN), SC (or PC), and SS (or PS), respectively.
-
Particles generated from seawater samples were used to test the potential interference or matrix effects in the quantification of SN and SS under real-world conditions. The ratios estimated from the ion signals at 23, 36, and 48 agreed well with those predicted from the solution concentrations to within ∼10 %. The ratios estimated from the ion signals at 30 and 36 also agreed with those predicted from the solution concentrations to within ∼15 %, whereas the ratios estimated from 23 were significantly lower than the predicted values. Because the ion signals at 23 originating from the SC and SN particles might be influenced by matrix effects (i.e., the sensitivities depend on coexisting compounds), they should be used only for qualitative identification of SC and SN particles.
The laboratory experiments demonstrated the proof of concept under well-controlled conditions. In the current study we did not perform detailed mass closure tests, and it has not been fully tested whether the ion signals for multi-component particles could be approximated as the linear combination of ion signals originating from single-component particles. The uncertainty in the particle collection efficiency is one of the key issues, and thus the variability in the particle collection efficiencies due to differences in the chemical composition and mixing states should be minimized. Kobayashi et al. (2021) showed that the collection efficiencies for laboratory-generated solid sulfate particles were ∼70 %. Ambient particles might be collected with even higher efficiencies if they are in the liquid phase or internally mixed with “sticky” compounds, leading to systematic uncertainties of up to ∼30 %. Increasing the collection efficiencies for solid particles by improving the geometry of the particle collector may reduce the uncertainties.
Furthermore, modifications of the inlet system and vacuum system are needed to deploy the rTDMS for ambient measurement of sea salt particles. The structure of the current ADL is the same as that used by Miyakawa et al. (2014), which was optimized for efficiently transmitting submicron particles. An alternative ADL for transmitting supermicron particles is desired for measuring ambient sea salt aerosols. Because supermicron ADLs generally require higher operating pressures (Schreiner et al., 1999; Williams et al., 2013), a better differential pumping system may be needed to maintain sufficient vacuum levels for the ion detection.
The data used in this study are available at the Zenodo data repository (https://doi.org/10.5281/zenodo.5829744; Kobayashi and Takegawa, 2022).
The supplement related to this article is available online at: https://doi.org/10.5194/amt-15-833-2022-supplement.
YK and NT designed the research, YK performed the laboratory experiments and data analysis, and YK and NT wrote the paper.
The contact author has declared that neither they nor their co-author has any competing interests.
Publisher's note: Copernicus Publications remains neutral with regard to jurisdictional claims in published maps and institutional affiliations.
The authors acknowledge the financial support from the Japan Society for the Promotion of Science (JSPS).
This research has been supported by the Japan Society for the Promotion of Science (Grants-in-Aid for Scientific Research nos. 16H05620, 17H01862, and 20H04310).
This paper was edited by Pierre Herckes and reviewed by two anonymous referees.
Adachi, K. and Buseck, P. R.: Changes in shape and composition of sea-salt particles upon aging in an urban atmosphere, Atmos. Environ., 100, 1–9, https://doi.org/10.1016/j.atmosenv.2014.10.036, 2015.
Akagi, S. K., Yokelson, R. J., Wiedinmyer, C., Alvarado, M. J., Reid, J. S., Karl, T., Crounse, J. D., and Wennberg, P. O.: Emission factors for open and domestic biomass burning for use in atmospheric models, Atmos. Chem. Phys., 11, 4039–4072, https://doi.org/10.5194/acp-11-4039-2011, 2011.
Andreae, M. O. and Merlet, P.: Emission of trace gases and aerosols from biomass burning, Global Biogeochem. Cy., 15, 955–966, https://doi.org/10.1029/2000GB001382, 2001.
AzadiAghdam, M., Braun, R. A., Edwards, E.-L., Bañaga, P. A., Cruz, M. T., Betito, G., Cambaliza, M. O., Dadashazar, H., Lorenzo, G. R., Ma, L., MacDonald, A. B., Nguyen, P., Simpas, J. B., Stahl, C., and Sorooshian, A.: On the nature of sea salt aerosol at a coastal megacity: Insights from Manila, Philippines in Southeast Asia, Atoms. Environ., 216, 116922, https://doi.org/10.1016/j.atmosenv.2019.116922, 2019.
Broström, M., Enestam, S., Backman, R., and Mäkelä, K.: Condensation in the KCl–NaCl system, Fuel Process. Technol., 105, 142–148, https://doi.org/10.1016/j.fuproc.2011.08.006, 2013.
Drewnick, F., Diesch, J.-M., Faber, P., and Borrmann, S.: Aerosol mass spectrometry: particle–vaporizer interactions and their consequences for the measurements, Atmos. Meas. Tech., 8, 3811–3830, https://doi.org/10.5194/amt-8-3811-2015, 2015.
Freney, E. J., Martin, S. T., and Buseck, P. R.: Deliquescence and efflorescence of potassium salts relevant to biomass-burning aerosol particles, Aerosol Sci. Tech., 43, 799–807, https://doi.org/10.1080/02786820902946620, 2009.
Fuentes, E., Coe, H., Green, D., de Leeuw, G., and McFiggans, G.: Laboratory-generated primary marine aerosol via bubble-bursting and atomization, Atmos. Meas. Tech., 3, 141–162, https://doi.org/10.5194/amt-3-141-2010, 2010.
Halle, J. C. and Stern, K. H.: Vaporization and decomposition of sodium sulfate. Thermodynamics and kinetics, J. Phys. Chem., 84, 1699–1704, https://doi.org/10.1021/j100450a007, 1980.
Halsted, W. D.: Saturated vapor pressure of potassium sulphate, T. Faraday Soc., 66, 1966–1973, https://doi.org/10.1039/TF9706601966, 1970.
Hayes, P. L., Ortega, A. M., Cubison, M. J., Froyd, K. D., Zhao, Y., Cliff, S. S., Hu, W. W., Toohey, D. W., Flynn, J. H., Lefer, B. L., Grossberg, N., Alvarez, S., Rappenglück, B., Taylor, J. W., Allan, J. D., Holloway, J. S., Gliman, J. B., Kuster, W. C., de Gouw, J. A., Massoli, P., Zhang, X., Liu, J., Weber, R. J., Corrigan, A. L., Russell, L. M., Isaacman, G., Worton, D. R., Kreisberg, N. M., Goldstein, A. H., Thalman, R., Waxman, E. M., Volkamer, R., Lin, Y. H., Surratt, J. D., Kleindienst, T. E., Offenberg, J. H., Dusanter, S., Griffith, S., Stevens, P. S., Brioude, J., Angevine, W. M., and Jimenez, J. L.: Organic aerosol composition and sources in Pasadena, California, during the 2010 CalNex campaign, J. Geophys. Res.-Atmos., 118, 9233–9257, https://doi.org/10.1002/jgrd.50530, 2013.
Hsu, S.-C., Liu, S. C., Kao, S.-J., Jeng, W.-L., Huang, Y.-T., Tseng, C.-M., Tsai, F., Tu, J.-Y., and Yang, Y.: Water-soluble species in the marine aerosol from the northern SouthChina Sea: High chloride depletion related to air pollution, J. Geophys. Res., 112, D19304, https://doi.org/10.1029/2007JD008844, 2007.
Ide, Y., Uchida, K., and Takegawa, N.: Ionization efficiency of evolved gas molecules from aerosol particles in a thermal desorption aerosol mass spectrometer: Numerical simulations, Aerosol Sci. Tech., 53, 843–852, https://doi.org/10.1080/02786826.2019.1612512, 2019.
IPCC: Climate Change 2013: The physical science basis. Contribution of working group I to the Fifth Assessment Report of the Intergovernmental Panel on Climate Change, edited by: Stocker, T. F., Qin, D., Plattner, G.-K., Tignor, M., Allen, S. K., Boschung, J., Nauels, A., Xia, Y., Bex, V., and Midgley, P. M., Cambridge University Press, Cambridge, United Kingdom and New York, NY, USA, 576–578 and 596, https://doi.org/10.1017/CBO9781107415324.016, 2013.
Ishizaka, S., Guo, F., Tian, X., Seng, S., Tobon, Y. A., and Sobanska, S.: In situ observation of efflorescence and deliquescence phase transitions of single NaCl and NaNO3 mixture particles in air using a laser trapping technique, B. Chem. Soc. Jpn., 93, 86–91, https://doi.org/10.1246/bcsj.20190285, 2020.
Jayne, J. T., Leard, D. C., Zhang, X., Davidovits, P., Smith, K. A., Kolb, C. E., and Worsnop, D. R.: Development of an aerosol mass spectrometer for size and composition analysis of submicron particles, Aerosol Sci. Tech., 33, 49–70, https://doi.org/10.1080/027868200410840, 2000.
Kerminen, V.-M., Teinilä, K., Hillamo, R., and Pakkanen, T.: Substitution of chloride in sea-salt particles by inorganic and organic anions, J. Aerosol Sci., 29, 929–942, https://doi.org/10.1016/S0021-8502(98)00002-0, 1998.
Kobayashi, Y. and Takegawa, N.: Dataset for the refractory aerosol thermal desorption mass spectrometer (rTDMS), Version 1.0, Zenodo [data set], https://doi.org/10.5281/zenodo.5829744, 2022.
Kobayashi, Y., Ide, Y., and Takegawa, N.: Development of a novel particle mass spectrometer for online measurements of refractory sulfate aerosols, Aerosol Sci. Tech., 55, 371–386, https://doi.org/10.1080/02786826.2020.1852168, 2021.
Lee, C.-T. and Hsu, W.-C.: The Measurement of Liquid Water Mass Associated with Collected Hygroscopic Waters, J. Aerosol Sci., 31, 189–197, https://doi.org/10.1016/S0021-8502(99)00048-8, 2000.
Li, J., Pósfai, M., Hobbs, P. V., and Buseck, P. R.: Individual aerosol particles from biomass burning in southern Africa: 2. Compositions and aging of inorganic particles, J. Geophys. Res., 108, 8484, https://doi.org/10.1029/2002JD002310, 2003.
Matthew, B. M., Middlebrook, A. M., and Onasch, T. B.: Collection efficiencies in an Aerodyne Aerosol Mass Spectrometer as a function of particle phase for laboratory generated aerosols, Aerosol Sci. Tech., 42, 884–898, https://doi.org/10.1080/02786820802356797, 2008.
Miura, K., Kumakura, T., and Sekikawa, T.: The effect of continental air mass on the modification of individual sea salt particles collected over the coast and the open sea, J. Meteorol. Soc. Jpn., 69, 429–438, https://doi.org/10.2151/jmsj1965.69.4_429, 1991.
Miyakawa, T., Takeda, N., Koizumi, K., Tabaru, M., Ozawa, Y., Hirayama, N., and Takegawa, N.: A new laser induced incandescence – mass spectrometric analyzer (LII-MS) for online measurement of aerosol composition classified by black carbon mixing state, Aerosol Sci. Tech., 48, 853–863, https://doi.org/10.1080/02786826.2014.937477, 2014.
Nagakura, S., Inokuchi, H., Ezawa, H., Iwamura, H., Sato, H., and Kubo, R. (Eds.): Chemical dictionary, Iwanami Shoten, Publishers, Tokyo, Japan, ISBN 4-00-080090-6, 1998 (in Japanese).
Nakamura, H., Hara, Y., and Osada, H.: The thermal decomposition of ammonium sulfate and its reaction with iron (III) oxide, The Chemical Society of Japan, 5, 706–710, https://doi.org/10.1246/nikkashi.1980.706, 1980 (in Japanese).
Pöhlker, C., Wiedemann, K. T., Sinha, B., Shiraiwa, M., Gunthe, S. S., Smith, M., Su, H., Artaxo, P., Chen, Q., Cheng, T., Elbert, W., Gilles, M. K., Kilcoyne, A. L. D., Moffet, R. C., Weigand, M., Martin, S. T., Pöschl, U., and Andreae, M. O.: Biogenic potassium salt particles as seeds for secondary organic aerosol in the Amazon, Science, 337, 1075–1078, https://doi.org/10.1126/science.1223264, 2012.
Reid, J. S., Koppmann, R., Eck, T. F., and Eleuterio, D. P.: A review of biomass burning emissions part II: intensive physical properties of biomass burning particles, Atmos. Chem. Phys., 5, 799–825, https://doi.org/10.5194/acp-5-799-2005, 2005.
Robinson, E. S., Onasch, T. B., Worsnop, D., and Donahue, N. M.: Collection efficiency of α-pinene secondary organic aerosol particles explored via light-scattering single-particle aerosol mass spectrometry, Atmos. Meas. Tech., 10, 1139–1154, https://doi.org/10.5194/amt-10-1139-2017, 2017.
Saleh, R., Robinson, E. S., Ahern, A. T., and Donahue, N. M.: Evaporation rate of particles in the vaporizer of the Aerodyne aerosol mass spectrometer, Aerosol Sci. Tech., 51, 501–508, https://doi.org/10.1080/02786826.2016.1271109, 2017.
Schlosser, J. S., Braun, R. A., Bradley, T., Dadashazar, H., MacDonald, A. B., Aldhaif, A. A., Aghdam, M. A., Mardi, A. H., Xian, P., and Sorooshian, A.: Analysis of aerosol composition data for western United States wildfires between 2005 and 2015: Dust emissions, chloride depletion, and most enhanced aerosol constituents, J. Geophys. Res.-Atmos, 122, 8951–8966, https://doi.org/10.1002/2017JD026547, 2017.
Schreiner, J., Schild, U., Voigt, C., and Mauersberger, K.: Focusing of aerosols into a particle beam at pressures from 10 to 150 Torr, Aerosol Sci. Tech., 31, 373–382, https://doi.org/10.1080/027868299304093, 1999.
Seinfeld, J. H. and Pandis, S. N. (Eds.): Atmospheric chemistry and physics: From air pollution to climate change, Wiley, Hoboken, NJ, ISBN 978-0-471-72018-8, 2006.
Song, J., Zhao, Y., Zhang, Y., Fu, P., Zheng, L., Yuan, Q., Wang, S., Huang, X., Xu, W., Cao, Z., Gromov, S., and Lai, S.: Influence of biomass burning on atmospheric aerosols over the western South China Sea: Insights from ions, carbonaceous fractions and stable carbon isotope ratios, Environ. Pollut., 248, 1800–1809, https://doi.org/10.1016/j.envpol.2018.07.088, 2018.
Tagawa, H.: Thermal Decomposition of Nitrate, Bulletin of the Institute of Environmental Science and Technology, Yokohama National University, 14, 41–57, 1987 (in Japanese).
Takegawa, N. and Sakurai, H.: Laboratory evaluation of a TSI condensation particle counter (Model 3771) under airborne measurement conditions, Aerosol Sci. Tech., 45, 272–283, https://doi.org/10.1080/02786826.2010.532839, 2011.
Takegawa, N., Miyakawa, T., Nakamura, T., Sameshima, Y., Takei, M., Kondo, Y., and Hirayama, N.: Evaluation of a new particle trap in a laser desorption mass spectrometer for online measurement of aerosol composition, Aerosol Sci. Tech., 46, 428–443, https://doi.org/10.1080/02786826.2011.635727, 2012.
Tatykaev, B. B., Burkitbayev, M. M., Uralbekov, B. M., and Urakaev, F. Kh.: Mechanochemical synthesis of silver chloride nanoparticles by a dilution method in the system NH4Cl-AgNO3-NH4NO3, Acta Phys. Pol. A, 126, 1044–1048, https://doi.org/10.12693/APhysPolA.126.1044, 2014.
Tobler, A. K., Skiba, A., Wang, D. S., Croteau, P., Styszko, K., Nęcki, J., Baltensperger, U., Slowik, J. G., and Prévôt, A. S. H.: Improved chloride quantification in quadrupole aerosol chemical speciation monitors (Q-ACSMs), Atmos. Meas. Tech., 13, 5293–5301, https://doi.org/10.5194/amt-13-5293-2020, 2020.
Uchida, K., Ide, Y., and Takegawa, N.: Ionization efficiency of evolved gas molecules from aerosol particles in a thermal desorption aerosol mass spectrometer: Laboratory experiments, Aerosol Sci. Tech., 53, 86–93, https://doi.org/10.1080/02786826.2018.1544704, 2019.
Weber, R. J., Orsini, D., Daun, Y., Lee, Y.-N., Klotz, P. J., and Brechtel, F.: A particle-into-liquid collector for rapid measurement of aerosol bulk chemical composition, Aerosol Sci. Tech., 35, 718–27, https://doi.org/10.1080/02786820152546761, 2001.
Williams, L. R., Gonzalez, L. A., Peck, J., Trimborn, D., McInnis, J., Farrar, M. R., Moore, K. D., Jayne, J. T., Robinson, W. A., Lewis, D. K., Onasch, T. B., Canagaratna, M. R., Trimborn, A., Timko, M. T., Magoon, G., Deng, R., Tang, D., de la Rosa Blanco, E., Prévôt, A. S. H., Smith, K. A., and Worsnop, D. R.: Characterization of an aerodynamic lens for transmitting particles greater than 1 micrometer in diameter into the Aerodyne aerosol mass spectrometer, Atmos. Meas. Tech., 6, 3271–3280, https://doi.org/10.5194/amt-6-3271-2013, 2013.
Zauscher, M. D., Wang, Y., Moore, M. J. K., Gaston, C. J., and Prather, K. A.: Air quality impact and physicochemical aging of biomass burning aerosols during the 2007 San Diego wildfires, Environ. Sci. Technol., 47, 7633–7643, https://doi.org/10.1021/es4004137, 2013.
Zhang, X., Smith, K. A., Worsnop, D. R., Jimenez, J. L., Jayne, J. T., Kolb, C. E., Morris, J., and Davidovits, P.: Numerical characterization of particle beam collimation: Part II integrated aerodynamic-lens-nozzle system, Aerosol Sci. Tech., 38, 619–638, https://doi.org/10.1080/02786820490479833, 2004.