the Creative Commons Attribution 4.0 License.
the Creative Commons Attribution 4.0 License.
 | 23 Feb 2022
Detection of nitrous acid in the atmospheric simulation chamber SAPHIR using open-path incoherent broadband cavity-enhanced absorption spectroscopy and extractive long-path absorption photometry
Sophie Dixneuf
Rolf Häseler
Theo Brauers
Franz Rohrer
Hans-Peter Dorn
An instrument based on 20 m open-path incoherent broadband cavity-enhanced absorption spectroscopy (IBBCEAS) was established at the Jülich SAPHIR chamber in spring 2011. The setup was optimized for the detection of HONO and NO2 in the near-UV region 352–386 nm, utilizing a bright hot-spot Xe-arc lamp and a UV-enhanced charge-coupled device (CCD) detector. A 2σ detection limit of 26 pptv for HONO and 76 pptv for NO2 was achieved for an integration time of 1 min. Methacrolein (MACR) was also detected at mixing ratios below 5 ppbv with an estimated 2σ detection limit of 340 pptv for the same integration time. The IBBCEAS instrument's performance for HONO and NO2 detection was compared to that of extractive wet techniques, long-path absorption photometry (LOPAP), and chemiluminescence spectrometry (CLS) NOx detection, respectively. For the combined data sets an overall good agreement for both trend and absolute mixing ratios was observed between IBBCEAS and these established instruments at SAPHIR. Correlation coefficients r for HONO range from 0.930 to 0.994 and for NO2 from 0.937 to 0.992. For the single measurement of MACR r=0.981 is found in comparison to proton-transfer-reaction mass spectrometry (PTRMS).
- Article
(1815 KB) - Full-text XML
-
Supplement
(3801 KB) - BibTeX
- EndNote


Photolysis of nitrous acid leads to the formation of the most important daytime oxidant in the atmosphere, the hydroxyl radical (OH). Thus, HONO indirectly affects the oxidative potential of the troposphere and strongly influences degradation mechanisms of a vast variety of natural and urban pollutants. The mechanisms of HONO formation in the troposphere are still not fully understood (Calvert et al., 1994; Finlayson-Pitts et al., 2003; Ramazan et al., 2004; Liu et al., 2019). Many atmospheric studies revealed elevated HONO mixing ratios during daytime under specific conditions that cannot be fully explained (Staffelbach et al., 1997; Zhou et al., 2002a, 2003; Kleffmann et al., 2003; Vogel et al., 2003; Kleffmann et al., 2005; Acker et al., 2006; Spataro and Ianniello, 2014). Although there appears to be general agreement that heterogeneous NO2 chemistry is one of the most important sources of HONO (Harrison and Kitto, 1994; Reisinger, 2000), modelled HONO mixing ratios are often significantly below observed values (Vogel et al., 2003; Lammel and Cape, 1996). However, other sources have also been suggested (Stemmler et al., 2006; Li et al., 2012, 2014). Since the photochemistry of HONO is closely connected to that of NO2 (Johnston et al., 1974; Aumont et al., 2003; Bröske et al., 2003; Ramazan et al., 2004), the in situ measurement of time-dependent HONO and NO2 mixing ratios by monitoring both species simultaneously is particularly interesting to elucidate the natural formation processes of HONO (Kleffmann, 2007). One reason for the indeterminate formation and atmospheric role of HONO is the challenge to accurately and reliably quantify this species.
A direct spectroscopic way to detect HONO is through its electronic absorption in the near UV between 320 and 390 nm (Stutz et al., 2000) or through its IR active vibrational modes (Barney et al., 2000), e.g. in the Q-branches of trans-HONO at 1263 cm−1 (ν3) or 790 cm−1 (ν4). The cross sections in both cases are approximately between ∼2 and cm2 molec.−1. The UV region has been extensively exploited in differential optical absorption spectroscopy (DOAS) (Febo et al., 1996; Alicke et al., 2003; Stutz et al., 2010) but more recently also using cavity-enhanced methodologies (Wang and Zhang, 2000; Djehiche et al., 2011; Jain et al., 2011), especially incoherent broadband cavity-enhanced absorption spectroscopy (IBBCEAS) (Gherman et al., 2008; Hoch et al., 2012; Wu et al., 2012; Donaldson et al., 2014; Scharko et al., 2014; Min et al., 2016; Yi et al., 2016; Nakashima and Sadanaga, 2017; Duan et al., 2018; Jordan and Osthoff, 2020; Tang et al., 2020; Yi et al., 2021). The mid-IR was targeted using Fourier transform (Hanst et al., 1982) and tuneable diode laser spectroscopy (TDLAS) (Schiller et al., 2001). Laser-induced fluorescence (LIF) can also be used for sensitive HONO detection but only through the emission of OH radicals that are formed after HONO photolysis (Rodgers and Davis, 1989; Liao et al., 2006; Bottorff et al., 2021).
Most non-spectroscopic (indirect) detection methods are chemical in nature. Typical approaches comprise dry (Ferm and Sjödin, 1985) and wetted effluent diffusion (Simon and Dasgupta, 1995; Acker et al., 2006), or rotated (Oms et al., 1996; Spindler et al., 2003) denuders, HPLC/fluorescence methods (Huang et al., 2002; Takenaka et al., 2004; Beine et al., 2005), or long-path absorption photometry (LOPAP) (Heland et al., 2001; Kleffmann et al., 2002). The corresponding instrumentation is generally more sensitive than spectroscopic methods but at the same time also more susceptible to chemical interference that can affect the selectivity and quantification of HONO (Beine et al., 2005; Kleffmann et al., 2006). In most of the chemical methods HONO is sampled on humid or liquid surfaces where heterogeneous chemistry can affect HONO mixing ratios in the presence of specific interfering chemicals (Ferm and Sjödin, 1985; Spindler et al., 2003; Zhou et al., 2003; Gherman et al., 2008). Moreover, photolytic or heterogeneous formation of HONO in sampling lines can cause unreliable results in in situ measurements (Zhou et al., 2002a, b; Rohrer et al., 2005). Therefore, for studies aiming at HONO detection it is essential to compare the performance of instruments that use genuinely different approaches (Kleffmann, 2007). For example, validation studies of denuder-based approaches against DOAS measurements illustrated that significant discrepancies exist for daylight/illuminated conditions (Kleffmann, 2007). DOAS was also compared with the LOPAP approach, and several reasons for systematic differences in the acquired data were identified (Kleffmann et al., 2006).
A long open-path broadband cavity-enhanced absorption instrument was set up at the SAPHIR1 chamber at Forschungszentrum Jülich (Germany) in 2011, utilizing an incoherent short-arc Xe lamp as a light source (cf. Fiedler et al., 2003; Varma et al., 2009). Results of measurements to characterize its performance in the near UV through the in situ detection of HONO and NO2, as well as methacrolein (MACR, also called methacrylaldehyde or isobutenal), are presented here. MACR is of interest as an “interfering species”, which is naturally formed together with methyl vinyl ketone (MVK, also called butenone) (Pierotti et al., 1990) as a secondary atmospheric product after the reaction of isoprene with OH (Fehsenfeld et al., 1992). Both MACR and MVK are important factors in the oxidation chemistry of biogenically emitted species such as isoprene and can lead to the formation of ozone and/or secondary organic aerosol (Wennberg et al., 2018). MACR also has primary emission sources in urban environments. It is generated in combustion processes and industrial activities (Destaillats et al., 2002), and it has even been detected in indoor air from cigarette smoke (Sleiman et al., 2014). Typical natural mixing ratios of MACR of tens of pptv (parts per trillion by volume) to <3 ppbv (parts per billion by volume) have been observed e.g. above forest canopies in western Alabama (Montzka et al., 1993) and in airborne monitoring campaigns in Surinam using proton-transfer-reaction mass spectrometry (PTRMS, Warneke et al., 2001). In urban environments mixing ratios of e.g. tens of pptv to ∼0.33 ppbv have been reported for a 4 h period at the San Francisco bay bridge toll plaza using high-resolution gas chromatography/ion trap mass spectrometry (Destaillats et al., 2002).
Similar to the recent work by Yi et al. (2021) the objectives of our work in 2011 were (i) to assess the instrument's performance concerning HONO detection and to validate it with the LOPAP system available at SAPHIR and (ii) to compare its performance concerning NO2 detection with the local SAPHIR chemiluminescence spectrometry (CLS) NOx detector.
Section 2 outlines details on the experimental setup at SAPHIR in Jülich. Section 3 shows measurements of HONO, NO2, and MACR mixing ratio using the IBBCEAS instrument. The data are respectively compared with results from different instruments at SAPHIR: (a) a LOPAP system (HONO), (b) a standardized chemiluminescence detector (NO2), and (c) a proton-transfer reaction mass spectrometer (PTRMS) (MACR). Correlation plots between individual measurements will be discussed for 3 measurement days in summer and autumn 2011. The experiments presented here supplement a campaign on the Formal Intercomparison of Observations of Nitrous Acid (FIONA) (Ródenas et al., 2013), where instruments for the quantification of HONO were compared at the EUPHORE simulation chambers in Valencia (Spain) in May 2009.
IBBCEAS has been used for the detection of a variety of target species in different wavelength regions in the laboratory (Langridge et al., 2006; Washenfelder et al., 2008; Dixneuf et al., 2009; Thalman and Volkamer, 2010; Wu et al., 2009; Nakashima and Sadanaga, 2017; Duan et al., 2018) and in outdoor environments (Bitter et al., 2005; Saiz-Lopez et al., 2006; Leigh et al., 2010; Wu et al., 2012). The high sensitivity and spatial resolution of open-path IBBCEAS make this approach particularly attractive for applications in atmospheric simulation chambers (Varma et al., 2009; Fuchs et al., 2010; Chen et al., 2011; Ashu-Ayem et al., 2012; Hoch et al., 2012; Dorn et al., 2013; Ródenas et al., 2013). Thus, an open-path IBBCEAS instrument was developed at the Jülich SAPHIR chamber, a facility designed for the simulation of tropospheric scenarios at realistically low mixing ratios of relevant trace species (see e.g. Rohrer et al., 2005). The SAPHIR chamber is an ideal test bed for open-path IBBCEAS due to the available comprehensive suite of standard detection methods that can be used to assess and validate the data taken with IBBCEAS. For the experiments presented here the IBBCEAS instrument was optimized for the near-UV detection of HONO (352–386 nm), whose identification was based on three prominent absorption bands peaking at ≈354, ≈368, and ≈384 nm (Stutz et al., 2000). The spectral region covered also enabled the simultaneous detection of NO2 and methacrolein.
The experimental design of the IBBCEAS instrument was similar to the one described in Varma et al. (2009), Dorn et al. (2013), and Varma et al. (2013). It comprised a transmitter and a receiver unit, each housing one of the cavity mirrors. A sketch of the optical setup and details on experimental components are shown in Figs. S1–S3 in the Supplement. The transmitter unit was mounted on a concrete platform at the north end of SAPHIR (facing south). The receiver unit was located at the south end of SAPHIR (facing north), in order to minimize exposure of the detector to potential daytime stray light. The concave dielectric mirrors (radius of curvature −21 m, reflectivity ∼0.999, diameter =40 mm, Layertec GmbH) inside the mechanically stable units formed an optical cavity with a mirror separation of ∼20.4 m. Each unit was temperature stabilized with an air-to-air thermoelectric assembly (Laird Technologies). Vertical metal plates with optical ports (Fig. S3) were rigidly mounted to the concrete support and formed the interface between the instrument's units and the chamber. Pipes connected to the two units extended into the SAPHIR chamber through the optical ports. Due to the use of the vertical plates (sealed by O-rings) the mechanical stress of the chamber's Teflon wall was not imposed directly on the two optical units, which essentially decoupled the instrument from the chamber wall and improved its long-term stability. Each unit had two ports: one pipe with 50 mm diameter and another one with 25 mm. In each unit the wider pipe was aligned along the optical axis of the cavity reducing the contribution of stray light to the measured signal in the receiver unit. The pipes were sealed with a high-reflectivity mirror at one end and purged with zero air at a flow rate of 1.7 dm3 min−1 during measurements to protect the mirror. The narrower pipe, which was sealed off during normal use of the instrument, was only used as a port for a green alignment laser (see Fig. S1). The main light source was a short-arc Xe lamp running in hot-spot mode. In this mode, a small plasma spot (∼150 µm diameter) with a spectral radiance of 18 W cm−2 sr−1 nm−1 at 400 nm was formed close to the cathode surface, improving the imaging properties of the discharge in comparison to conventional diffuse arcs. Small random jumps of the arc position, however, required an active stabilization of the beam direction by means of a quadrant detector. When the spot “jumped” to a specific quadrant, an actively controlled piezo-driven Al mirror was used to minimize the resulting beam deviation from the optical axis of the cavity-enhanced absorption spectroscopy (CEAS) instrument. A telescope imaged the incoherent light into the optically stable cavity whose mirrors were aligned by two remote-controlled high-resolution positioning motors per mirror. The light transmitted by the cavity was collected by a UV-enhanced Al mirror and focused onto the aperture of a circular-to-rectangular fibre bundle which guided the light onto the entrance slit (25 µm) of a (Shamrock 303i) spectrograph (f=303 mm, F/4) supplied with a 1200 grooves mm−1 holographic grating. The light transmitted by the spectrograph was imaged onto a charge-coupled device (CCD) detector cooled to −65 ∘C. Light outside the high-reflectivity range of the cavity mirrors was optically filtered by means of a bandpass filter to avoid excessive scattering into the spectrometer and the potential saturation of the detector. The wavelength range from 352 to 386 nm was covered with a spectral resolution of ∼0.24 nm. A sample of transmission spectra can be found in the Supplement (Fig. S4).
2.1 Measurement procedure
After overnight flushing of the chamber with dry synthetic air (also referred to as “zero air” in this publication) the cavity transmission, I0(λ), was measured every morning in the dark chamber before experiments commenced. Typically 300 cavity transmission spectra with an individual acquisition time of 200 ms were accumulated during experiments, yielding a time resolution of 1 min per measured spectrum I(λ). The extinction coefficient ε(λ) [cm−1] was calculated according to (the left part of) Eq. (1):
where Reff represents the wavelength-dependent effective reflectivity of the cavity mirrors and d=19.57 m represents the interaction path length per pass in the cavity (d equals the mirror separation minus the length corresponding to the mirror purge volume; see the Supplement, Fig. S1). (1−Reff) comprises all effective optical losses of the cavity when filled with zero air after purging the chamber overnight; i.e. mirror reflectivity losses, Rayleigh and potentially Mie scattering losses, and diffraction losses. The spatial average of the number density ni [molec. cm−3] of the absorbing species i (i.e. HONO, NO2, and MACR) was retrieved by fitting the function on the right-hand side in Eq. (1) to the measured extinction coefficient. σi [cm2 molec.−1] represents the absorption cross sections of species i. The cross sections used for HONO (Stutz et al., 2000), NO2 (Mérienne et al., 1995), and MACR (Meller, 1990) were taken from the Mainz UV/VIS Spectral Atlas of Gaseous Molecules of Atmospheric Interest (Keller-Rudek et al., 2013). Several reference spectra from the literature (Bogumil et al., 2003; Burrows et al., 1998; Harder et al., 1997; Mérienne et al., 1995; Vandaele et al., 2002; Voigt et al., 2002) were tested to fit the NO2 absorption spectra in the 352–386 nm spectral range. The reference data yielding the smallest residuals in measurements with only NO2 were chosen as reference cross sections in measurements with all other gas mixtures – this turned out to be Mérienne et al. (1995). A similar approach was taken for HONO with reference data from Bongartz et al. (1994), Brust et al. (2000), and Stutz et al. (2000). The data from Stutz delivered the smallest least squares discrepancies in the fit. All cross sections were always converted to the spectral resolution of the spectrometer using home-made Gaussian convolution software, written in Fortran. The five fit parameters aj (j=0…4) in Eq. (1) belong to a fourth-order polynomial, accounting for unspecified additional losses, such as background featureless absorption, or Rayleigh and Mie scattering that may become relevant over time. The fitting procedure was based on least squares minimization using a singular value decomposition (SVD) procedure (Press et al., 1986; Varma et al., 2009) in order to eliminate biases of the fit due to parameter correlations. During a first test run of the SVD approach the wavelength of all cross-section reference spectra was individually shifted to further minimize the least squares sum, and the optimized wavelengths were subsequently used in SVD analyses. For all reference spectra the typical shift was nm and thus within the spectral resolution of the measurement. The absolute wavelength was calibrated with a low-pressure neon pen ray lamp (see also Fig. S9). An example of an IBBCEAS extinction spectrum and the corresponding fit of Eq. (1) to the measured data are shown in Fig. 1 (uppermost panel). We will further discuss this figure as well as reflectivity calibration aspects in Sect. 4.
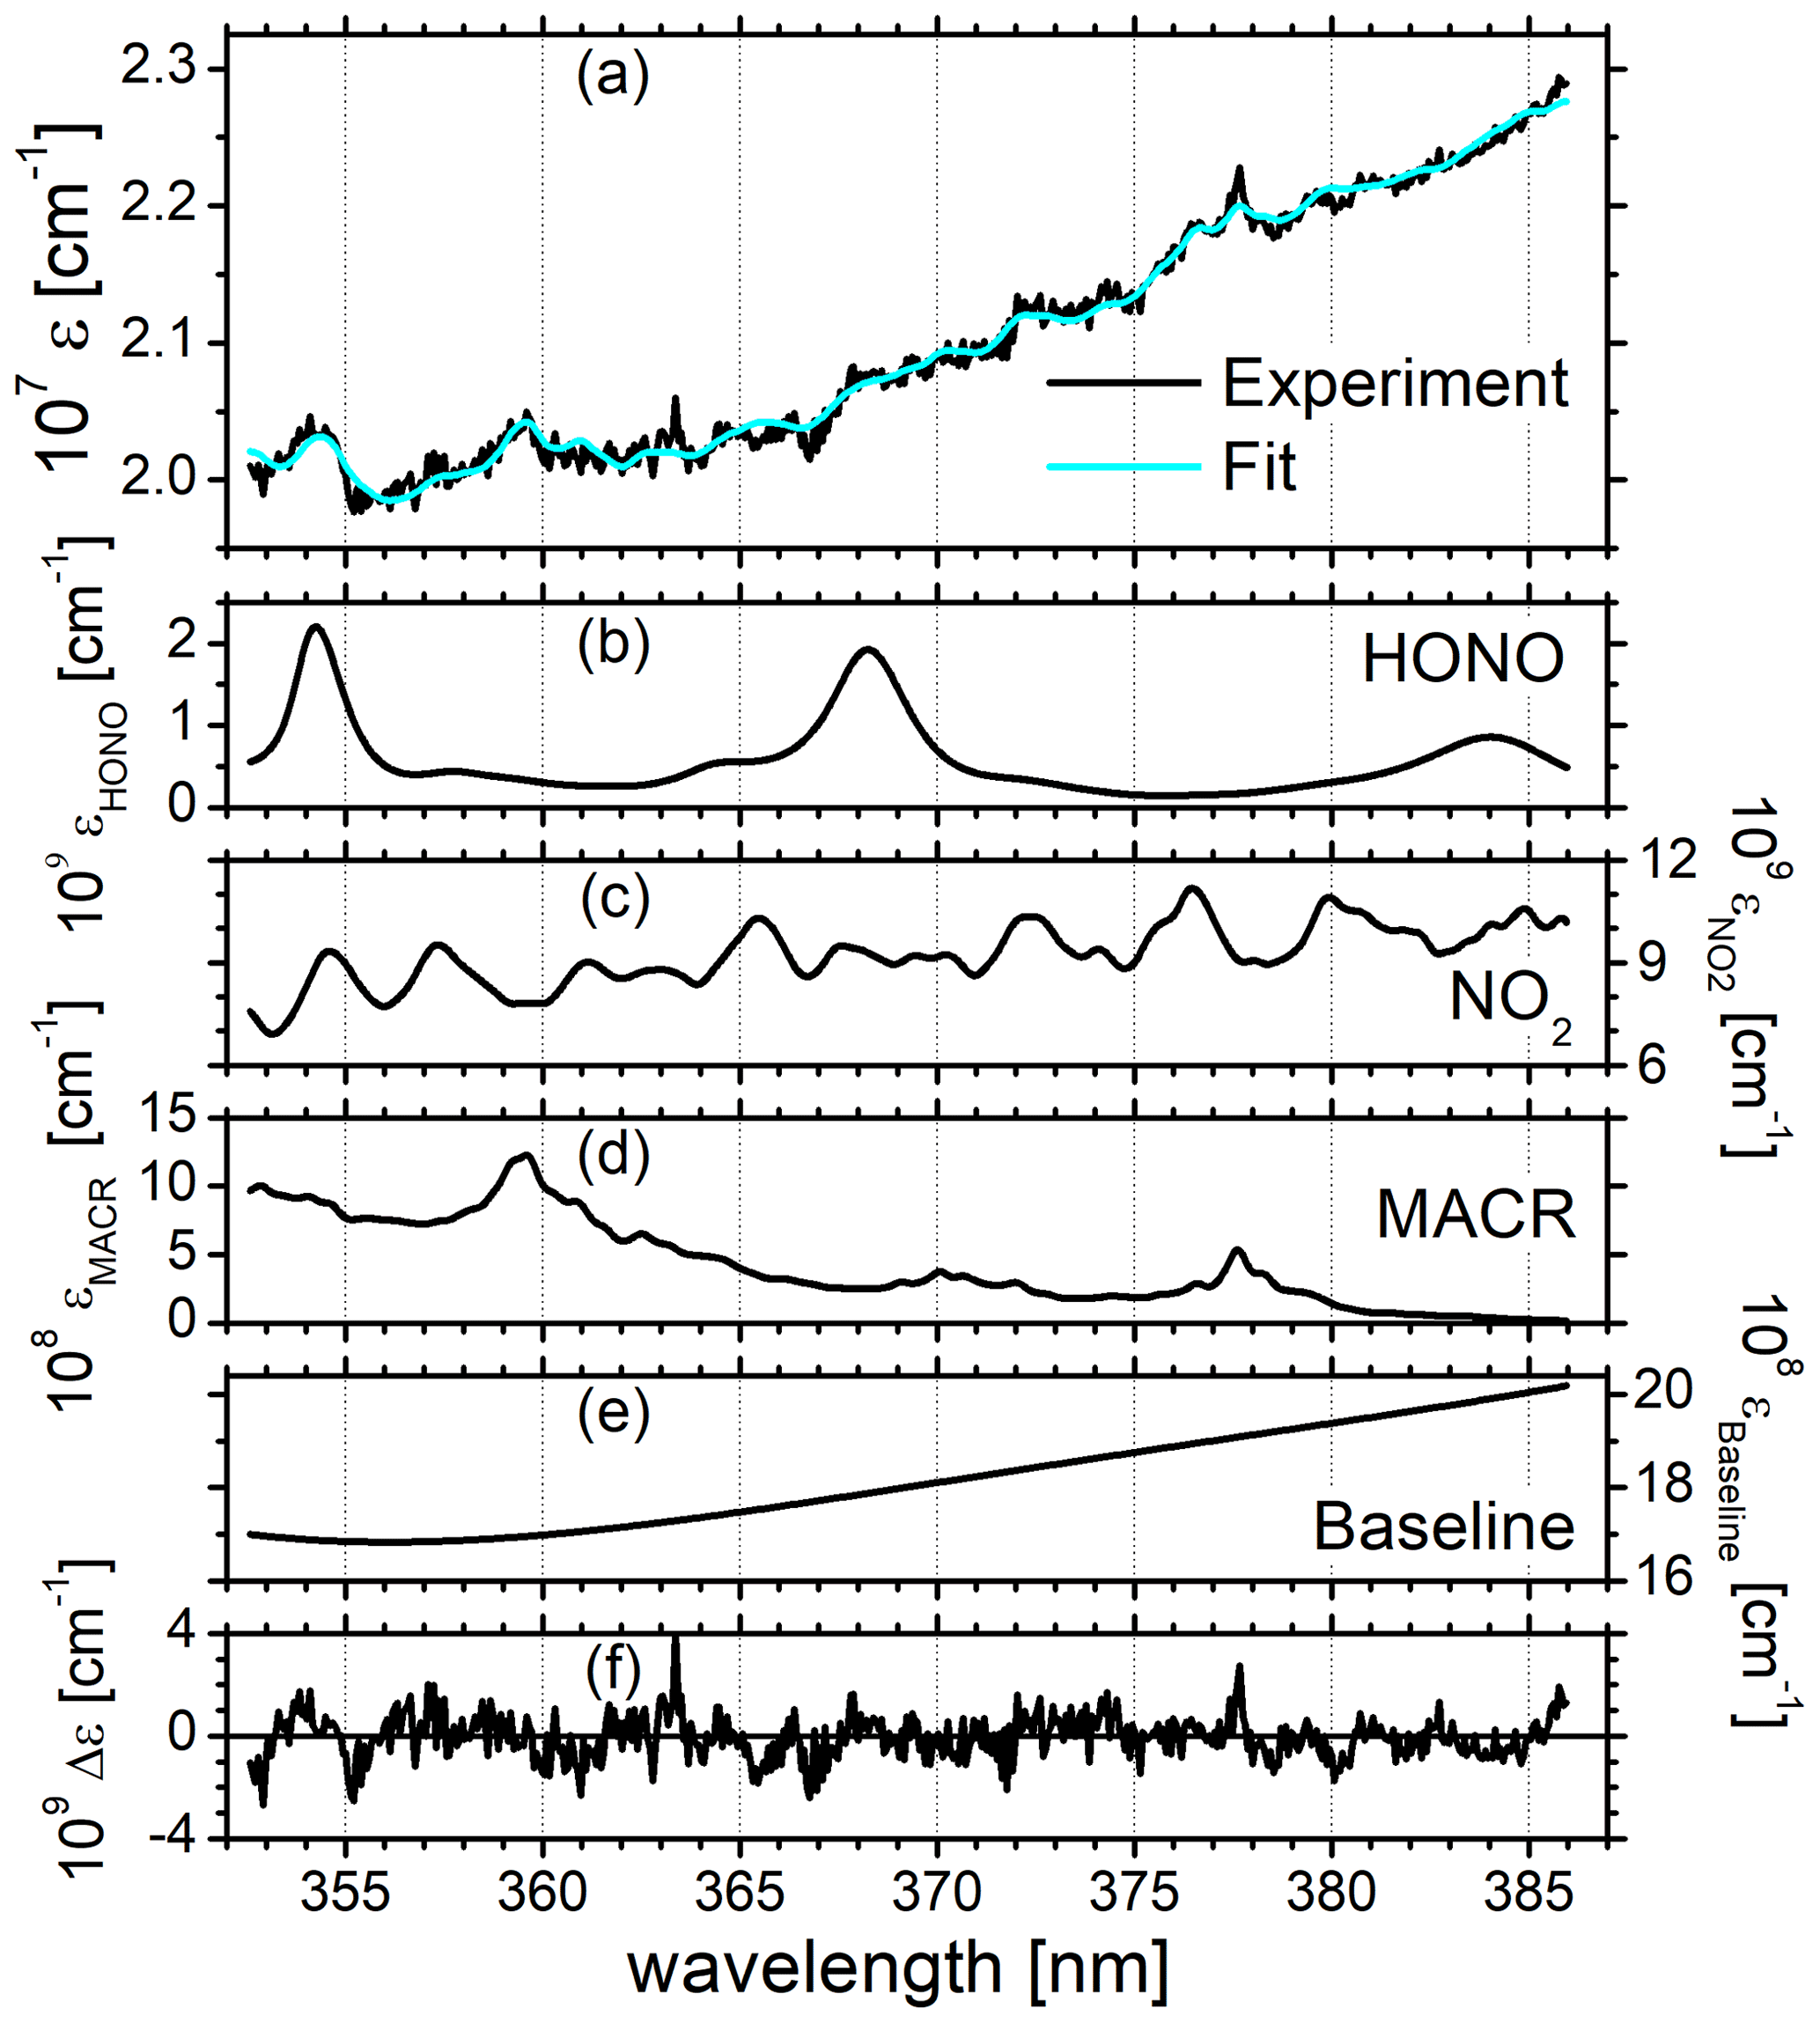
Figure 1Example of the extinction coefficient spectrum, ε(λ), measured with IBBCEAS at SAPHIR in the wavelength range 352–386 nm with an integration time of 1 min, taken at 13:00 UTC on 11 July 2011. (a) Measured extinction (black), fit of Eq. (1) to the extinction (cyan). (f) Absolute fit residuals . HONO, NO2, and MACR mixing ratios were retrieved as nHONO=0.160 ppbv, ppbv, and nMACR=8.055 ppbv, respectively. The corresponding contributions and the polynomial baseline are shown in panels (b), (c), (d), and (e). The absolute wavelength scale was calibrated with a low-pressure Ne pen ray lamp (see Fig. S9). No O2–O2 absorption at ∼360 and ∼380 nm is observed since all spectra, I0(λ) and I(λ), were measured in synthetic air.
2.2 The LOPAP instrument
The LOPAP instrument used in this study has been described in detail by Häseler et al. (2009) and Li et al. (2014) in the context of several campaigns on airborne detection of HONO aboard a Zeppelin airship. Air is extracted through two sampling coils in series where HONO is stripped into the liquid phase. In both coils the air is exposed to equal flows of a solution (0.06 M sulfanilamide in 1 M HCl solution) in which HONO almost instantaneously reacts to forms a diazonium salt. While the first coil removes HONO nearly quantitatively from the gas phase, only a fraction of other chemically interfering species are scrubbed. The second coil, however, samples that fraction of interfering species but only the remaining small amount of HONO. Using the difference of the signals derived from the two coils enables the influence of interfering species to be accounted for. The air is then separated from the liquid, and the solutions are separately transferred into two mixing volumes, where a 0.8 mM solution of N-(1-naphthyl)ethylenediamine-dihydrochloride is added to generate an azo dye. The azo dye's concentration is then determined by its optical absorption to determine HONO mixing ratios. The absorption cells for both channels consist of long-length Teflon tubing, acting as a liquid core waveguide (LCW). Visible light is sent through the tubing and detected by two small spectrometers.
The entire instrument was housed in a compact 19 in. (48.3 cm) rack ( cm3) consisting of two chemistry units and one electronics/detection unit. In order to avoid sampling artefacts in inlet lines, the sampling unit was straightforwardly mounted inside SAPHIR about 0.3 m from the chamber wall at the north end and 1 m above the floor. The instrument's sampling frequency, time resolution, 3σ detection limit, 1σ precision, and accuracy of the instrument was 0.33 Hz, 4–5 min, 10 pptv, 3 pptv, and 12 %, respectively. The measurement range of the instrument can in principle be varied by the length of the absorption tubes and by the use of different absorption wavelengths for the evaluation. In this study we used an optical path length of 2.9 m.
2.3 Chemiluminescence spectrometry NOx detector
The NOx detector was located in a container underneath the chamber from where gas mixtures were sampled at a flow rate of 1 dm3 min−1 through a Teflon tube of ca. 6 m length (internal diameter 4 mm) corresponding to an approximate residence time of 1 s. NO2 was converted to NO by a pulsed LED photolytic converter at 395±8 nm (Droplet Measurement Technologies blue light converter, BLC) in a volume of 17 mL with a conversion efficiency of approximately 50 %. The LED in the converter was consecutively switched on and off to alternately determine NO and NOx concentrations. NO was detected by a customized CLS detector (Eco Physics TR 780 (Rohrer and Brüning, 1992; Fuchs et al., 2010). NO2 mixing ratios were calculated using an interpolated value between two subsequent NOx measurements at a time when NO mixing ratios were measured. The instrument was calibrated using NO standard gas mixtures (2 ppmv NO in N2; BOC, a Linde company) and gas phase titration with O3 for NO2.
The fact that besides NO2 also HONO is photolysed at 395 nm to yield NO was accounted for by determining the corresponding NO yield from HONO numerically from the spectrum of the LEDs. The HONO photolysis contribution to NO is less than 5 % compared to that of NO2. The 1σ accuracy of the chemiluminescence detector for NO2 was determined to be ±7 %, based on the uncertainty of ±5 % of the NO standard used for the calibration and a ±5 % uncertainty for the NO2 conversion efficiency. The known interference of 5 % towards HONO is not corrected in the final data set and not included in this accuracy estimate.
2.4 Proton-transfer-reaction mass spectrometry (PTRMS)
PTRMS was utilized to monitor methacrolein in the presence of HONO and NO2. Generally the PTRMS technique relies on soft chemical ionization to detect gaseous trace components. The target species are converted to product ions through the transfer of a proton from the reagent ion, H3O+. The trace gases (X) are identified through the mass of the product ions usually being the protonated molecular mass (XH+): . The PTRMS instrument applied here was a quadrupole mass spectrometer system (PTR-Quad-MS). The system features a switchable reagent ion source with H3O+, NO+, and O as precursor ions for the measurement and identification of a number of trace gases. Details on the PTRMS instrument were published in Wisthaler et al. (2008).
Measurements of time-dependent mixing ratios of HONO, NO2, and MACR using open-path IBBCEAS were taken during summer and autumn 2011 and compared with those utilizing long-path absorption photometry (LOPAP), chemiluminescence spectrometry (CLS), and proton-transfer-reaction mass spectrometry (PTRMS), respectively. The performance intercomparison study is exemplified on basis of measurements on 11 July and on 5 and 6 October 2011, when different photochemical scenarios were simulated. The measurements in July were carried out as part of a Jülich internal photochemistry campaign (6 June to 15 July 2011), whose goal was to study the oxidation of isoprene (H2C=C(CH3)-CH=CH2), methacrolein (CH2=C(CH3)–CHO), or methyl vinyl ketone (CH3-C(O)-CH=CH2) by hydroxyl (OH) radicals at low NOx mixing ratios (Nehr et al., 2014; Fuchs et al., 2014). In contrast, the measurements in October were specifically designed for a comparison between LOPAP and IBBCEAS under well-controlled low-concentration conditions with no obvious potential chemical interference disturbing the LOPAP instrument. Generally, after cleaning and humidifying the SAPHIR chamber HONO formation by unknown photo-induced reactions on the Teflon chamber walls and degradation was studied in experiments always including light-induced and dark reactions of HONO formation or destruction – the experimental protocols concerning changes in chamber conditions are given in the captions of Figs. 2–4. The results obtained on the 3 d will be outlined in chronological order. The performance of the open-path IBBCEAS instrument will subsequently be discussed in the context of the different measurement condition and atmospheric scenarios together with that of the Jülich LOPAP instrument.
3.1 Measurements on 11 July 2011
Figure 2a and b summarize the time-dependent measurements of mixing ratios of HONO, NO2, and MACR as determined by IBBCEAS (black symbols), LOPAP (red), CLS (blue), and PTRMS (green). The same colour code is also used in all remaining figures. The vertical arrow in Fig. 2a indicates the times when the cavity transmission through the clean chamber, I0(λ), was measured for ca. 10 min. The only day for which the build-up of HONO was monitored during daylight conditions is 11 July. The HONO mixing ratio increased after humidification of the bright chamber (for 48 min) and decreased subsequently when O3 (∼40 ppbv) was introduced. At 09:15 UTC there is a marked but unexplained change in the data of HONO mixing ratios as measured by IBBCEAS in comparison to LOPAP. The increase in the noise of the IBBCEAS data occurred ca. 15 min before the addition of CO to the chamber at 09:30 UTC, which is expected to influence neither the HONO chemistry nor the data retrieval, even at high CO (∼750 pbbv) concentrations (see Fig. 2a). Presently there is no obvious explanation for this behaviour in the IBBCEAS measurement. Likewise the return to dark conditions at 15:33 UTC led initially to an unexpected increase in the HONO mixing ratio as recorded by the LOPAP instrument, but it was also observed by the IBBCEAS measurement. This observation was also made in other campaigns and will be briefly discussed in Sect. 4.2. NO2 mixing ratios, as measured by CLS, increased gradually during humidification of the bright chamber and increased sharply when O3 was introduced, followed by a more gradual increase until MACR was added to the mixture at 11:51 UTC. The jump of the NO2 mixing ratio at 07:30 UTC shows the effect when O3 was added actively to the chamber. The vast majority of NO was oxidized to NO2 at that time (see Fig. 2a). Both CLS and CEAS show this effect. The observed temporary decrease in the NO2 concentration after the addition of MACR can be explained by a reaction sequence following the formation of OH from HONO: the primary oxidation step of the reaction of OH with MACR forms the peroxy methacryloyl radical (CH2=C(CH3)-C(O)OO), part of which further reacts with NO2 to form MPAN (peroxy methacryloyl nitrate, CH2=C(CH3)-C(O)OONO2). MPAN is thermally unstable with a small thermal decomposition rate of s−1 at 298 K (Roberts and Bertman, 1992); the temperature inside the chamber after the addition of MACR was in excess of 300 K (see Fig. S8). Thus, a thermal equilibrium is established from which NO2 is reformed after the initial amount of MACR has been consumed (Fuchs et al., 2014).
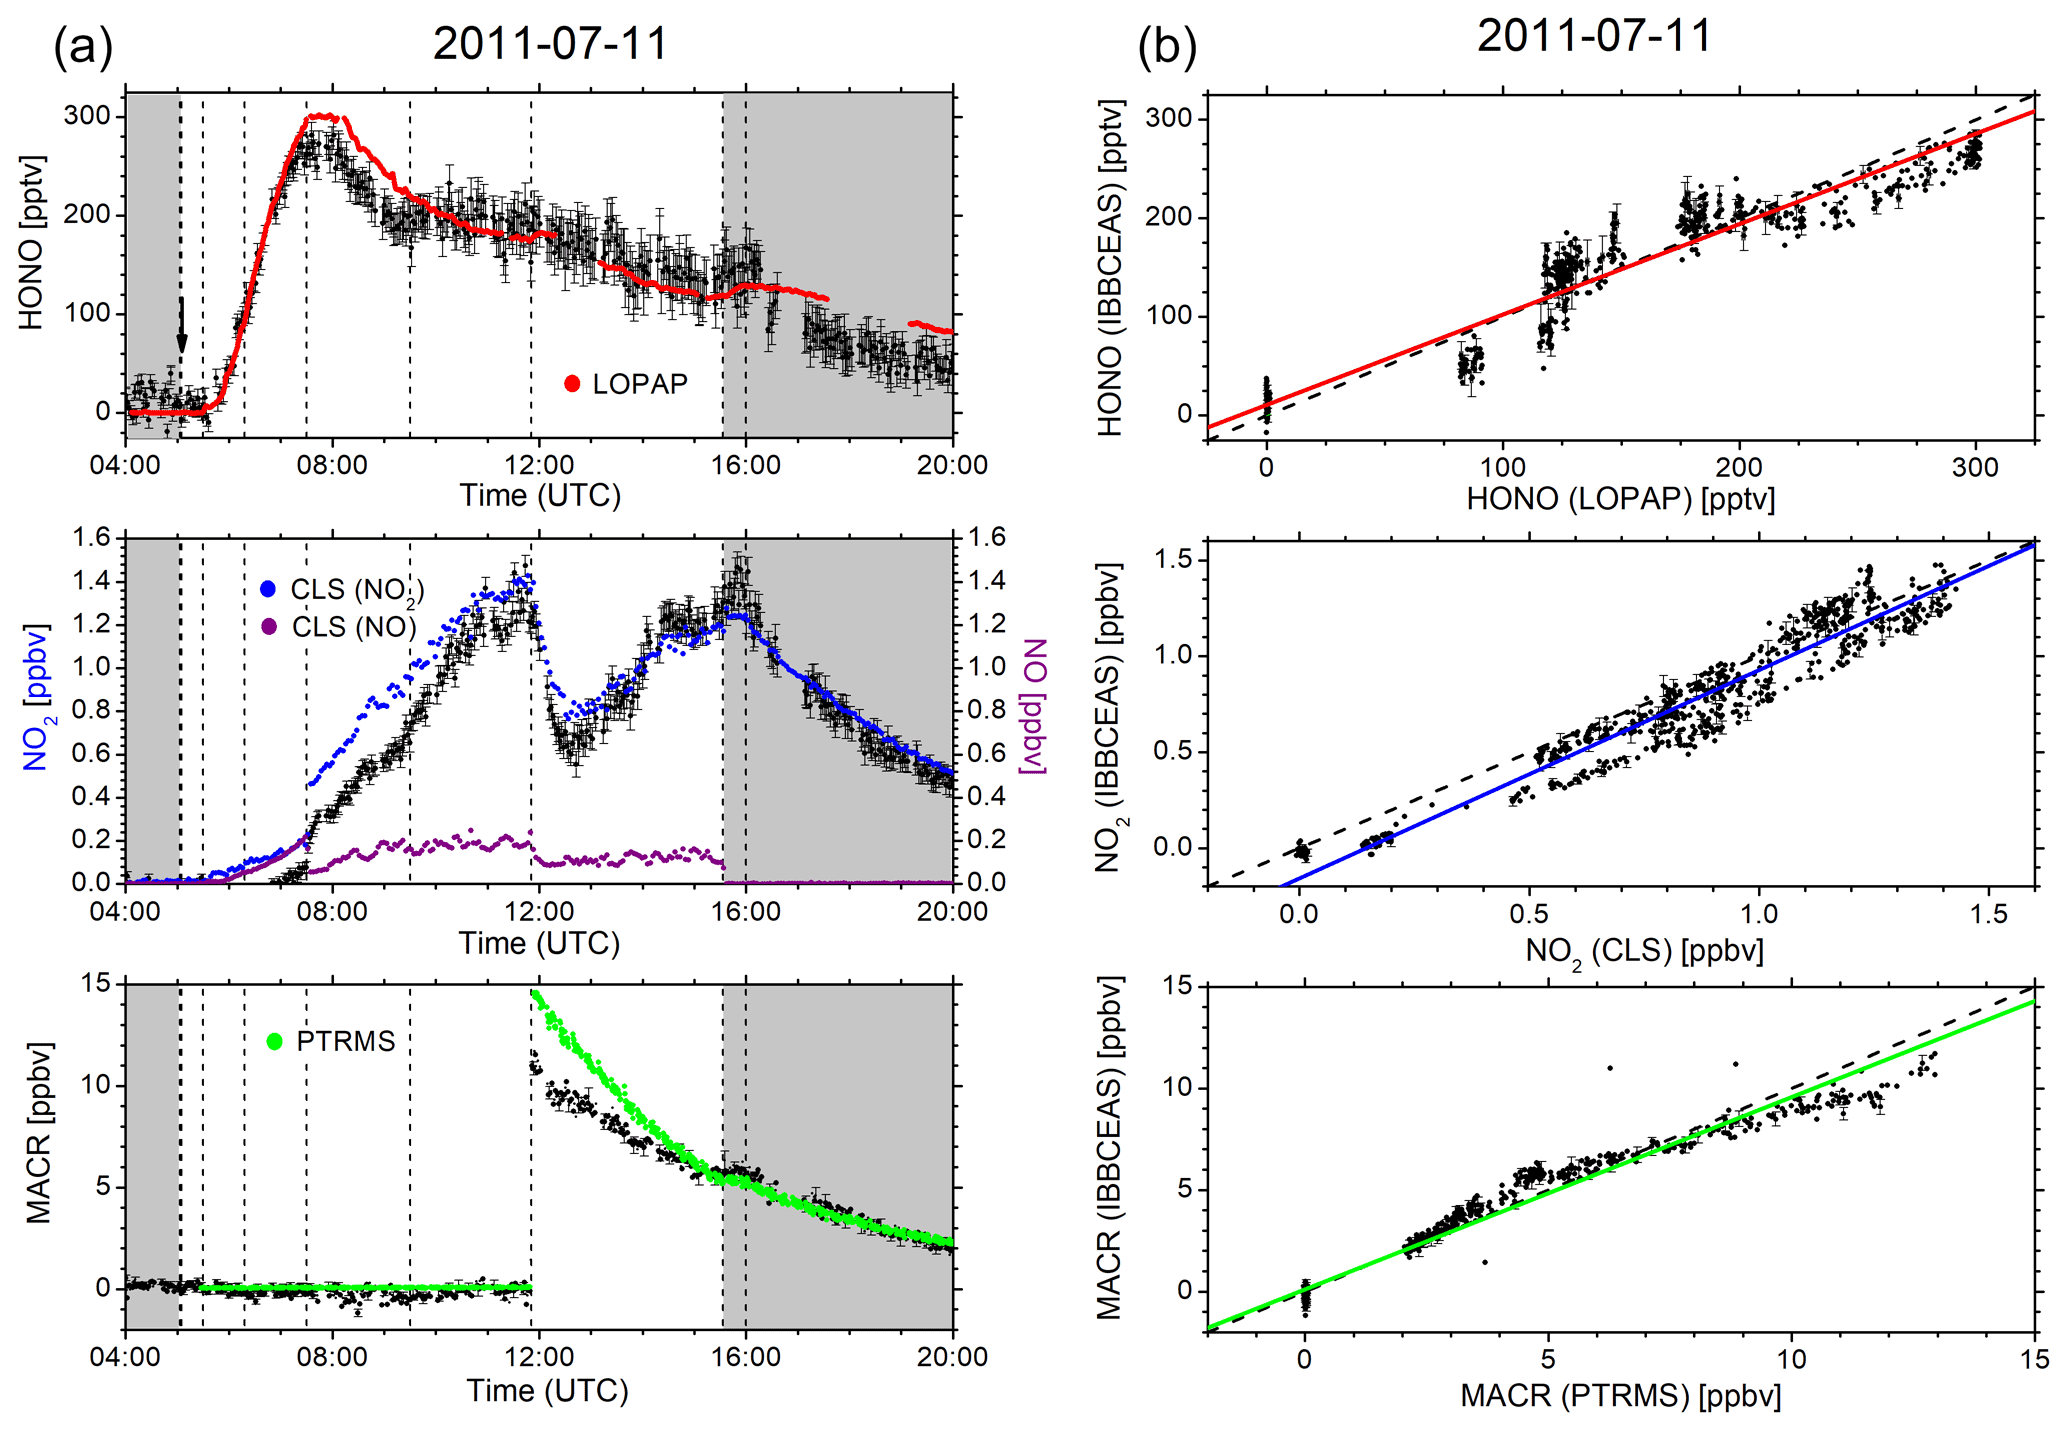
Figure 2(a) Time-dependent HONO, NO2, and MACR mixing ratios measured by IBBCEAS (black trace) at SAPHIR on 11 July 2011. The NO mixing ratios (purple) measured by the CLS instrument are also shown. Dashed vertical lines indicate changes in the chamber conditions according to the experimental protocol: overnight flushing of chamber with zero air stopped (05:03 UTC), roof opened (05:05 UTC), humidification started (05:30 UTC), humidification ended (06:18 UTC), 40 ppbv O3 (07:30 UTC), 750 ppbv CO (09:30 UTC), MACR (11:51 UTC), roof closed (15:33 UTC), and flushing with zero air started (16:00 UTC). IBBCEAS data taken in the near-UV region of the spectrum (352–386 nm) are compared to LOPAP (red), CLS (blue), and PTRMS (green) data. The vertical black arrow indicates the time when I0 was measured (generally for 10 min). (b) Correlation plots of two instruments being compared against IBBCEAS. The dashed line represents the identity, and the coloured solid lines are linear regressions to the data. Results are listed in Table 1.
Concentrations of NO2 and MACR both appeared to stagnate when the roof was closed (at 15:33 UTC) due to the absence of light-driven photochemistry. Finally the purging of the chamber with synthetic air removed all trace gases from the chamber.
The experiments in October were designed to enable accurate mirror reflectivity calibration and intercomparison of LOPAP and IBBCEAS under unperturbed condition at sub-ppbv mixing ratios of HONO. The measurements shown in Figs. 2–4 demonstrate that the long-cavity IBBCEAS instrument at SAPHIR is capable of detecting HONO at pptv levels without difficulty. The ability of the IBBCEAS instrument to measure MACR selectively and with high sensitivity is a useful addition for the evaluation of photochemical experiments of the radical-driven oxidation of isoprene since the detection of the jointly formed reaction products MACR and MVK (methyl vinyl ketone) by mass spectrometric techniques using H3O+ as reactive ion can only determine the sum of MACR and MVK in the gas phase.
3.2 Measurements on 5 October 2011
Figure 3 summarizes the measurement on 5 October 2011. After overnight flushing in the morning of 5 October, NO2 was added to the chamber in steps of 250 pptv (at 06:30 and 06:50 UTC), 500 pptv (at 07:10 and 07:30 UTC), and 1 ppbv (at 07:50 and 08:10 UTC). After subsequent humidification for 44 min (starting at 08:41 UTC) and the exposure to daylight at 09:27 UTC, HONO was formed at levels of up to 400 pptv. Finally, after closing the chamber roof (14:23 UTC), HONO was removed by flushing with zero air (starting at 15:31 UTC). The HONO data from the IBBCEAS and LOPAP setups and the NO2 data from the IBBCEAS and CLS instruments showed good agreement on that day (Fig. 3).
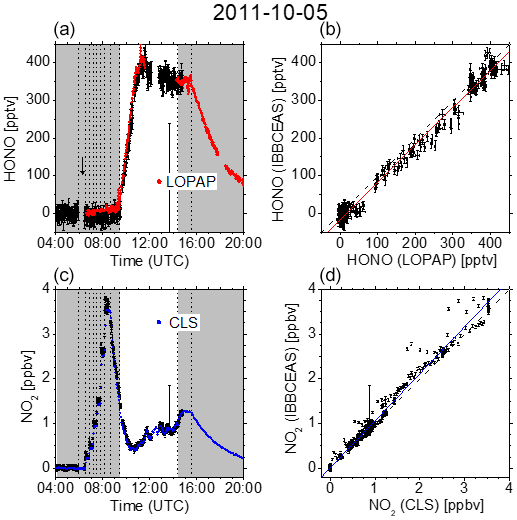
Figure 3(a, c) Time-dependent HONO and NO2 mixing ratios measured at SAPHIR on 5 October 2011. Dashed vertical lines indicate changes in the chamber conditions according to the experimental protocol: overnight flushing stopped (05:55 UTC), 250 pptv NO2 (06:30 and 06:50 UTC), 500 pptv NO2 (07:10 and 07:30 UTC), 1 ppbv NO2 (07:50 and 08:10 UTC), humidification started (08:41 UTC), humidification stopped (09:25 UTC), roof opened (09:27 UTC), roof closed (14:23 UTC), and flushing started (15:31 UTC). IBBCEAS data taken in the near-UV region of the spectrum (352–386 nm) are compared to LOPAP (red) and CLS (blue). The vertical black arrow indicates the time when I0 was measured (generally for 10 min). (b, d) Correlation plots of two instruments being compared against IBBCEAS. The dashed line represents the identity, and the coloured solid lines are linear regressions to the data. Results are listed in Table 1.
3.3 Measurements on 6 October 2011
Figure 4 summarizes the measurement on 6 October 2011. It is known that the photo-enhanced formation of HONO in the SAPHIR chamber can be described by an empirical function depending on relative humidity, solar irradiation, and temperature (Rohrer et al., 2005). Minimal HONO production was thus achieved by only humidifying the chamber for 42 min after overnight flushing with zero air. At 12:18 UTC the chamber was exposed to daylight, leading to the gradual formation based on vestiges of NOx on the chamber wall. The variation of temperature was limited to the natural variability. After a gradual increase, the HONO mixing ratios levelled off at ca. 250 pptv before the chamber was eventually closed at 16:24 UTC. The correlation between the data obtained with IBBCEAS and LOPAP, as represented by the correlation coefficient of r=0.970 (Table 1), is still rather satisfactory at these low levels. For NO2, however, the correlation is less pronounced on this day as there appears to be a gradual drift between data from the IBBCEAS and CLS instruments as evident through a discrepancy in the slope of ∼38 %. Even though this is the largest discrepancy observed (see Table 1), the data are all taken at NO2 mixing ratios below 300 pptv, which is close to the 2σ detection limit of 76 pptv. Approximately one-third of the data points are below that limit (see Fig. 4), which puts these values into perspective.
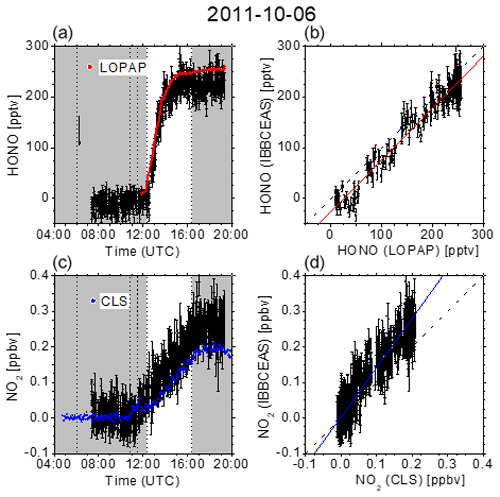
Figure 4(a, c) Time-dependent HONO and NO2 mixing ratios measured at SAPHIR on 6 October 2011. Dashed vertical lines indicate changes in the chamber conditions according to the experimental protocol: overnight flushing stopped (06:04 UTC), humidification started (10:47 UTC), humidification stopped (11:29 UTC), roof opened (12:18 UTC), and roof closed (16:24 UTC). IBBCEAS data taken in the near-UV region of the spectrum (352–386 nm) are compared to LOPAP (red) and CLS (blue) data. The vertical black arrow indicates the time when I0 was measured (generally for 10 min). (b, d) Correlation plots of two instruments being compared against IBBCEAS. The dashed line represents the identity, and the coloured solid lines are linear regressions to the data. Results are listed in Table 1.
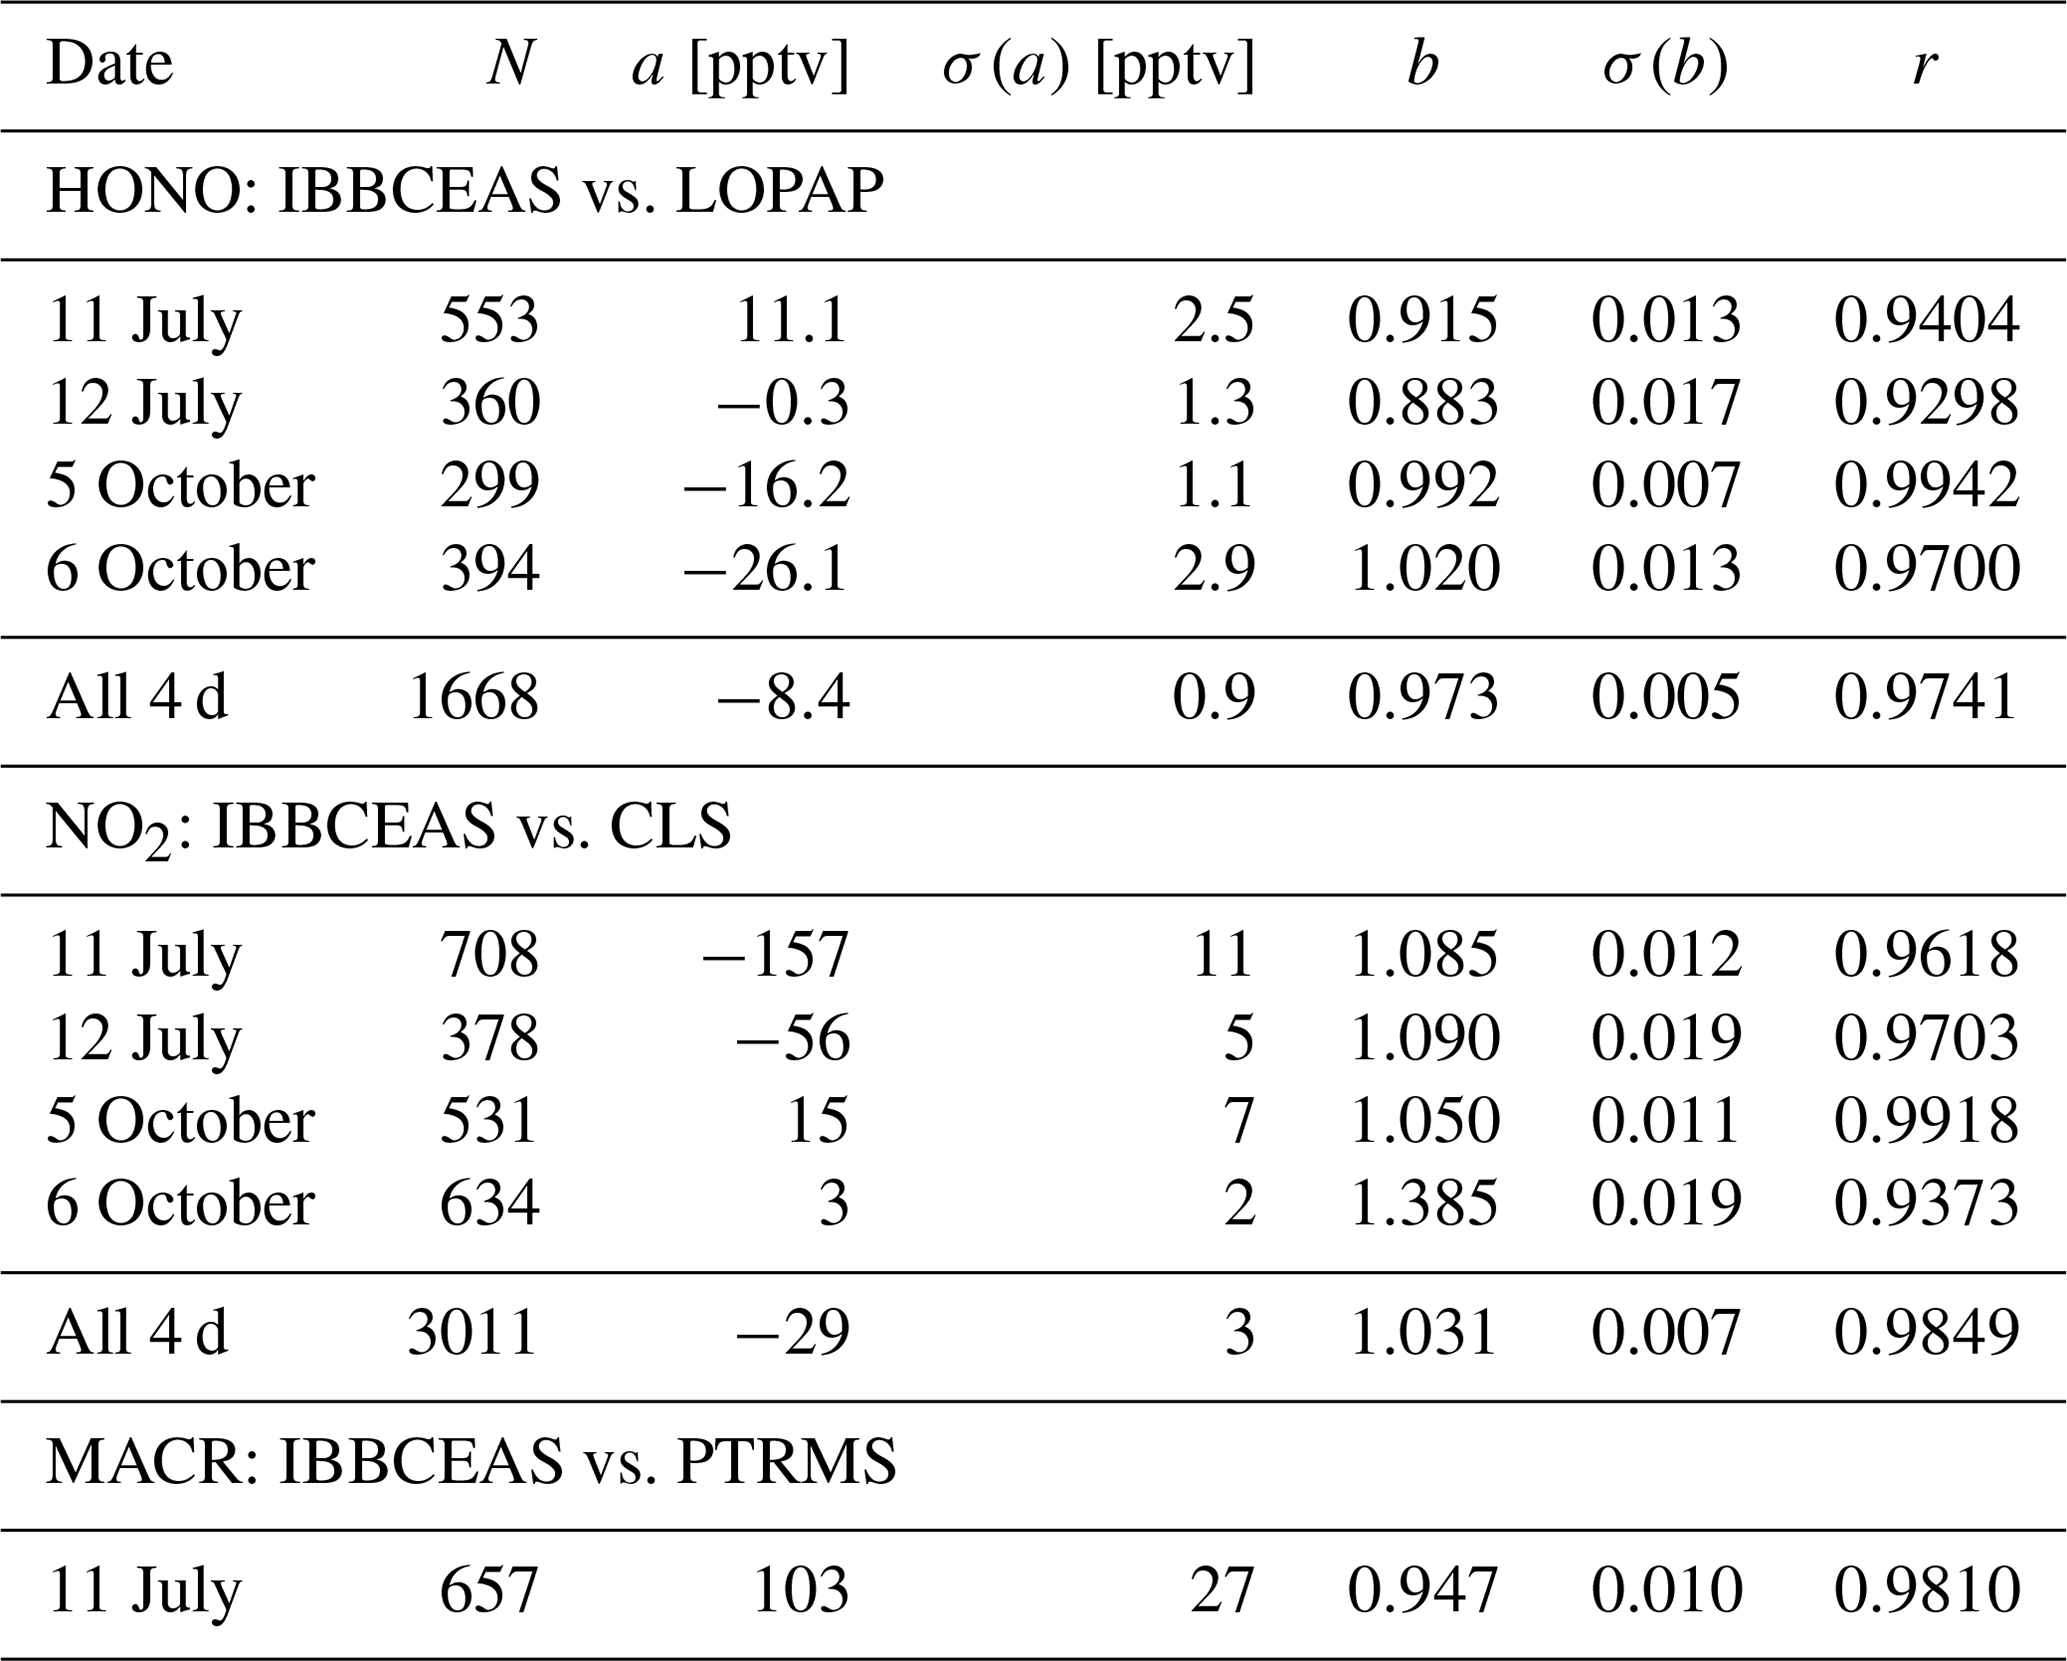
Table 1Comparison of correlation plot data. N: number of data points; a and b: regression coefficients; σ(a) and σ(b): bootstrap errors of the linear square fit (where y represent IBBCEAS data [pptv] and x the data [pptv] by either LOPAP, CLS, or PTRMS); r: Pearson linear correlation coefficients.
4.1 IBBCEAS instrument
The main experimental uncertainties determining the quality of the IBBCEAS data reported here are systematic; they are (a) the stability of the light source, (b) the in situ calibration of the mirror reflectivity, (c) the data analysis and concentration retrieval approach, and (d) the unspecified mechanical instabilities of the setup such as potential thermal drifts or deficiencies of the optomechanical components (Ruth et al., 2014). The latter become more critical with increasing cavity length since small changes in the optical alignment have a more severe influence on the instrument's performance; see Varma et al. (2009).
4.1.1 Lamp stability
Short-term intensity fluctuations are due to random spatial variations of the hot-spot plasma arc (small arc jumps), whose effects on the optical alignment were minimized by an active quadrant detector control unit (Varma et al., 2009). As long as intensity fluctuations of the lamp do not show any spectral dependence in the wavelength range of interest, the resulting baseline changes can in principle be accounted for in the fit of Eq. (1) to the measured data. If the fluctuations are however accompanied by random spectral variation, the retrieval by SVD becomes increasingly difficult. Spatial jumps that were at the compensation limit of the quadrant detector were also noted during experiments, leading to uncertainties in the baselines. One of these events may have occurred e.g. on 11 July at ∼ 09:30 UTC. Difficulties in the mixing ratio retrieval due to lamp instabilities occurred sporadically during the measurements in the summer but became more frequent and for occurred longer time periods after continued use of the lamp in the autumn. For instance the measurement on 6 October (Fig. 4) was affected by lamp stability issues, which is a sign of electrode ageing and the main cause for the hot-spot plasma arc to wander into a domain where the stabilization system is unable to fully compensate for the spatial displacement.
An unexplained change in performance started approximately 20 min before the addition of 750 ppbv of CO on 11 July at ca. 09:10 UTC (Fig. 2a). At that time the quality of the IBBCEAS data started to worsen, while the LOPAP performance remained largely unaffected (see Fig. 2). A small increase in HONO mixing ratios was subsequently observed in comparison to the LOPAP, and the noise of the IBBCEAS data was increased by roughly a factor of ∼2. There are no obvious reasons for this observed behaviour from a (photo)chemical point of view, since at the time the gas mixture was not altered. In open-path cavity setups similar behaviour can in principle be caused through increased scattering due to particle formation (Varma et al., 2009), but measurements of the particle number concentration showed no significant change on this occasion. Therefore, one conceivable explanation may be that the hot-spot arc in the Xe lamp may have moved to a steady location on the electrode where the control unit was at its performance limit to keep the arc steady. As the quadrant detector correction signal was not recorded, this is merely a tentative explanation of the sudden change in performance. Although there was an addition of CO a short time later, it is not plausible that potential impurities in the CO (purity >99.9 %) gas (or chemical reactions of same) might be the cause for this observation. LED-based IBBCEAS is generally less prone to sudden changes (Gherman et al., 2008) due to the higher stability of the light source, although slow drifts are still possible (Fouqueau et al., 2020).
4.1.2 Mirror reflectivity and calibration aspects
Retrieval of accurate mixing ratios by IBBCEAS requires the effective mirror reflectivity Reff to be known accurately as a function of wavelength. Calibration measurements were performed a few times over the course of the measurements presented here by introducing a known amount of NO2 into the dry SAPHIR chamber shortly after the cavity transmission of the clean and dry cavity, I0(λ), had been recorded (Ruth et al., 2014). The effective reflectivity was retrieved with Eq. (1) using the known cross section of NO2 and the mixing ratio from the CLS NOx monitor (e.g. using the measurements on 5 October 2011 where Reff=0.9978 at 352 nm and Reff=0.9986 at 386 nm; see Fig. S5). The lower limit of the absolute uncertainty (∼11 %) is based on the accuracy of the NO2 cross section (8 %) and that of the NOx measurement (7 %).
The initial calibration measurement of Reff was also used to determine the optical loss, LLLO(λ), of an anti-reflection-coated optic (referred to as “low loss optic”, LLO), which was in turn used on a daily basis (in the morning) to determine the reflectivity in the clean chamber instead of using NO2 as calibration gas (see also the Supplement and Figs. S4 and S6) (Varma et al., 2009, Ruth et al., 2014):
In the transmitter unit the LLO (RLLO (375 nm) <0.001, diameter 40 mm, parallelism 30 arcsec) was moved into and out of the cavity parallel to the mirror by means of an accurate translational stage with high reproducibility (Ruth and Lynch, 2008). Care was taken in designing the airtight LLO compartment (Fig. S1) where the optic was “parked” when not needed. The LLO was furthermore flushed with clean dry air while in the cavity to avoid (minimize) potential changes in its optical loss. When the LLO is used over the course of a simulation experiment, i.e. in a chamber with arbitrary gas mixture, the LLO measurements yield effective reflectivities that comprise extinction losses in the chamber at this particular time. Although only the Reff measured each morning in the clean dry and dark chamber was used to retrieve the concentrations of the target species (Eq. 1) for the entire day, repeated introductions of the LLO into the cavity over the course of the day were used for checking whether misalignments or potential drifts of the cavity had occurred.
4.1.3 Data evaluation
In order to judge the quality of the data evaluation an example of an IBBCEAS extinction spectrum and the corresponding fit of Eq. (1) to the measured data is shown in Fig. 1 (uppermost panel). The data for this example were chosen because on 11 July 2011 HONO, NO2 and MACR were simultaneously present in the chamber. The different panels in Fig. 1 show the individual absorption contributions of the three species to the measured spectrum together with the polynomial background determined in the fit analysis. The lowermost panel shows the fit residuals, Δε, illustrating the appropriate use of the reference absorption spectra of the three target species in this measurement.
4.1.4 Detection limits
For individually measured spectra a minimum extinction coefficient of cm−1 was determined for an acquisition time of 1 min (assuming a 1:1 signal-to-noise ratio), which corresponds to cm−1 Hz (1σ). For a series of measurements (see Fig. S7) this translates into a measured 3σ limit of detection (LOD) of the IBBCEAS instrument for a 1 min acquisition time of ∼39 pptv for HONO, ∼114 pptv for NO2, and ca. 510 pptv for MACR in the 352–386 nm wavelength range.
In comparison to the IBBCEAS instrument, the LOPAP instrument at SAPHIR featured a 3σ LOD of 10 pptv of HONO in 1 min. The LOD for NO2 by the standardized chemiluminescence technique at SAPHIR also compares favourably with a 3σ LOD of 13.4 pptv of NO2 for a 1 min acquisition time with an overall accuracy of 7% (Rohrer and Brüning, 1992; Fuchs et al., 2010) (the CLS detection limit for NO is ≈6.7 pptv). Mixing ratios of volatile organic compounds such as methacrolein can be only compared to data acquired with PTRMS, whose LOD for MACR is 8.5 pptv in 1 min (accuracy 8 %).
An overview of (2σ) detection limits for HONO of previously published IBBCEAS instruments was recently given by Jordan and Osthoff (2020). The 2σ detection limit of 26 pptv for HONO in 1 min presented here compares favourably to the IBBCEAS works by Gherman et al. (2008), Hoch et al. (2012), Wu et al. (2012), Donaldson et al. (2014), Scharko et al. (2014), Min et al. (2016), Yi et al. (2016), Nakashima and Sadanaga (2017), Duan et al. (2018), Jordan and Osthoff 2020, and Tang et al. (2020) – see Table 1 in the publication by Jordan and Osthoff (2020) and also Tang et al. (2020). A link to this table is given in the Supplement together with a summary of experimental parameters specifying the current IBBCEAS setup. It should be noted, however, that some of the quoted detection limits were established under field conditions, which bears challenges that are different from experiments with a large-scale simulation chamber. The low detection limits of the current setup are a result of the substantial cavity length, despite the fact that the effective cavity mirror reflectivity in this work was lower than in all other instruments reported.
4.2 LOPAP instrument
In a previous DOAS–LOPAP intercomparison (Kleffmann et al., 2006) the addition of ozone triggered issues concerning the use of proper reference data in the DOAS evaluation procedure at ppbv levels of HONO. This sort of difficulty was not observed with IBBCEAS at sub-ppbv mixing ratios of HONO.
However, when switching from illuminated to dark conditions the LOPAP instrument regularly showed an increase in HONO concentrations, while the IBBCEAS detector does not seem to follow this trend as strongly and reproducibly; see Fig. 2 (11 July 2011) or Fig. S10, for example. The systematically increasing HONO mixing ratios measured by the LOPAP instrument upon closing the roof and generating dark conditions was also observed on a few other days during the summer campaign, e.g. on 10 and 15 June (see Fig. S10). The reason for this behaviour is not fully understood yet. An effect of the presence of organic reaction products from the oxidation of methacrolein that cause an interference with the LOPAP technique upon stopping photolytic processes can be ruled out, because the effect was also observed in experiments with a clean humidified chamber solely filled with high-purity synthetic (zero) air. A possible interference of the LOPAP instrument towards N2O5 and/or NO3, which are both formed in the dark chamber in the presence of NO2 together with an excess of ozone, appears likely. However, laboratory investigations of Kleffmann et al. (2002, 2006) and Kleffmann and Wiesen (2008) found no evidence for a cross sensitivity for NO3 or N2O5 for a two-channel LOPAP instrument. This finding is supported by the IBBCEAS measurement data in our experiments which often show the same trend compared to elevated HONO concentrations in the dark after the roof was closed.
Another possible explanation may be based on the changing homogeneous and heterogeneous production rates of HONO versus its destruction rates under bright and dark conditions. For daytime conditions the steady-state HONO mixing ratio is mainly determined by photolysis of a yet unknown nitrogen-containing precursor adsorbed at the Teflon walls or dissolved in the surface water layer on the Teflon film versus the photolytic destruction of HONO into OH and NO. In the dark (closed) humidified chamber HONO can still be produced but predominantly through heterogeneous reactions with formation rates being at least a factor of ∼10 smaller than under illuminated conditions (i.e. with the roof open). Even though closing the roof stops efficient HONO production, it also eliminates the photolytical loss entirely, while HONO heterogeneous production within the aqueous phase on the chamber walls is still active (albeit with slowly decreasing efficiency). This can lead to changing the equilibrium such that the subsequent outgassing of HONO from the aqueous phase on the Teflon film can temporarily dominate the HONO production into the gas phase until the initially HONO-saturated aqueous phase also gets depleted, leading to the eventual decrease in HONO mixing ratios (Karl, 2004). The inlet of the LOPAP instrument is much closer to the chamber wall (ca. 30 cm) in comparison to the region probed by IBBCEAS, which averages across the whole length of the chamber near its centre. Thus, the effect is more likely to be apparent in the LOPAP data than in the IBBCEAS data. This tentative explanation of the observed trend upon closing the roof of the chamber warrants further investigation.
4.3 CLS and PTRMS instruments
The CLS and PTRMS data were used here as a reference guideline for the measurements and not for scrutinizing the performance of the respective instruments. Nevertheless, some discrepancies between IBBCEAS, CLS, and PTRMS were noted and are outlined here.
4.3.1 CLS
Mixing ratios of NO2 measured by CLS and IBBCEAS frequently appeared to differ somewhat during the humidification of the dark chamber. The CLS instrument appears to systematically record higher NO2 mixing ratios than IBBCEAS upon humidification of an initially clean chamber without the obvious presence of NO2. Examples of the observed behaviour are shown in Fig. 5 (see also Fig. S10).
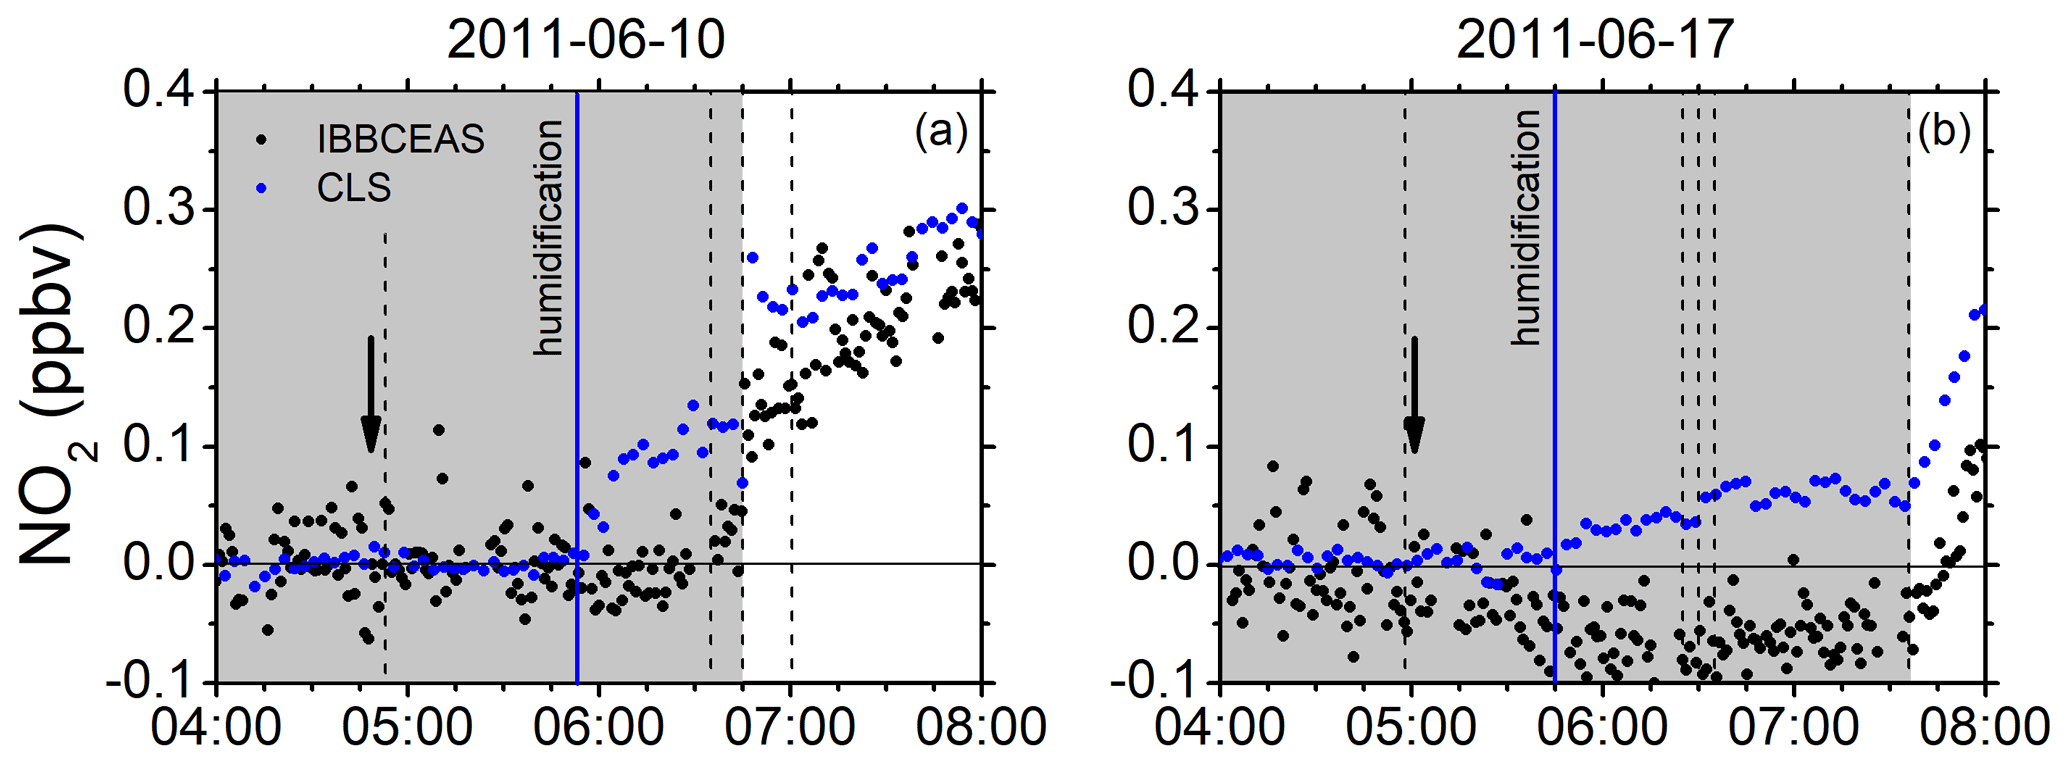
Figure 5Examples of the small increase in NO2 mixing ratios upon humidification in the dark chamber measured with CLS (blue dots) in comparison to those measured with IBBCEAS (black dots). (a) 10 June 2011: CO2 added (04:53 UTC), humidification started (05:52 UTC – vertical solid blue line), ozone added (06:36 UTC), roof opened (06:46 UTC), and isoprene added (07:01 UTC). (b) 17 June 2011: flushing of chamber stopped (04:58 UTC), humidification started (05:45 UTC), humidification ended (06:25 UTC), O3 added (06:30 UTC) in dark chamber, CO added (06:35 UTC), and roof opened (07:36 UTC). Vertical solid arrows indicate the time of the zeroing measurement (I0).
There are two possible scenarios that may explain these observations: (a) it could be an artefact in the chemiluminescence device, which may be due to a surface effect of the blue light converter (BLC). Switching from a dry to a humidified chamber leads to a severe change in the surface conditions of the BLC, which releases either NO or a substance that mimics an NO signal for some time until a new equilibrium has been reached. This type of behaviour has occurred before in measurement campaigns at SAPHIR, where small temporary discrepancies between model calculations and measurement were observed. The nature of the potentially released substance is unclear. HONO would be more likely to stick to the walls rather than to be released unless heterogenous reactions are at play, leading to the formation of NO. The effect is transient and vanishes after a short time. The fact that rapidly changing water vapour concentrations can affect the instrumental background of CLS detectors and lead to a non-trivial memory effect that cannot be easily corrected retrospectively has also been reported recently in the literature (Nussbaumer et al., 2021). (b) A small contamination of the Milli-Q water and differences in the sample quality used for humidification cannot be fully ruled out. Those contaminations have also been observed before. The increase in the NO2 signal upon humidification is supported by a significant increase in the NO signal (∼120 pptv) observed by CLS. However, on 10 June 2011 this increase seems to be over after ca. 15 min while the humidification is still ongoing. The reason why the IBBCEAS instrument does not detect the increase in NO2 if it is due to contamination is also unclear.
4.3.2 PTRMS
After introduction of MACR to the chamber on 11 July, initially higher mixing ratios were recorded by PTRMS rather than by IBBCEAS (between 11:50 and ca. 15:30 UTC). The mixing ratios measured with the two instrument gradually approach very similar values over the said time period until they agree rather well when the roof of the chamber was closed. The reason for this behaviour is not clear since no obvious interference in this period was present in the chamber.
4.4 Correlation of data obtained by different instrumental methods
For the combined data sets an overall good agreement for both trend and absolute mixing ratios was observed between IBBCEAS and the established instruments at SAPHIR as illustrated in the correlation plots in Fig. 6 and Table 1 (see also Figs. 2b, 3 and 4). The best agreement is observed on 5 October 2011 for both HONO and NO2, which may be attributed to the fact that the least amount of interfering species was present in the chamber at that time. Correlation coefficients r range from 0.930 to 0.994 for HONO and between 0.937 and 0.992 for NO2 (see also discussion at the end of Sect. 4.5). For the single measurement of MACR a correlation coefficient of r=0.981 is found between data from IBBCEAS and PTRMS.
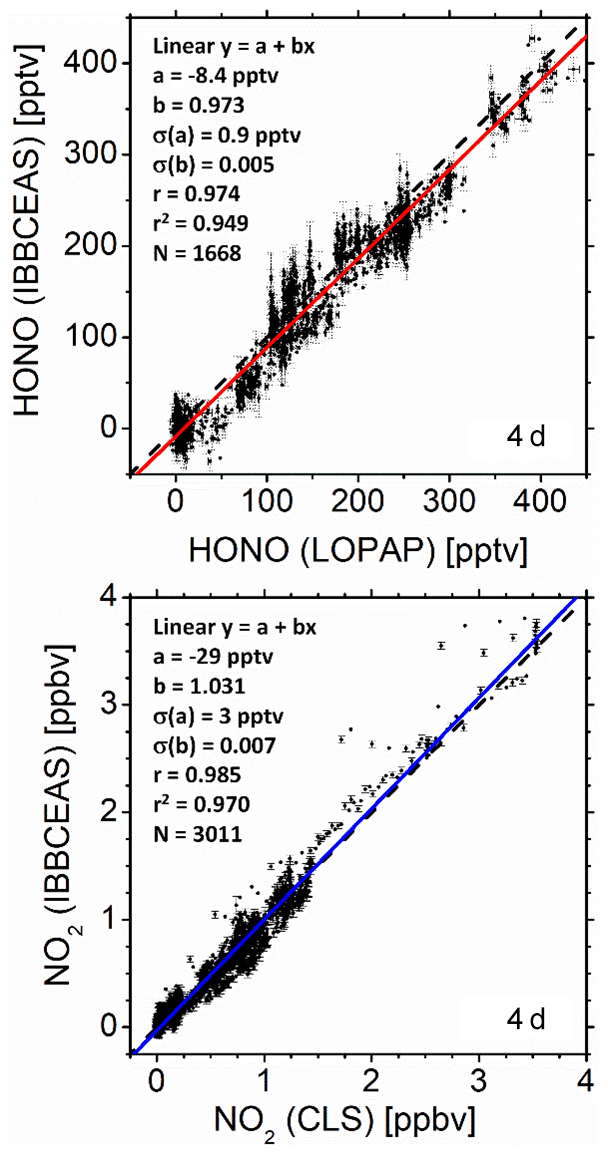
Figure 6Correlation plots of two instruments of the entire data set from the intercomparison. The dashed line represents the identity, and the coloured solid lines are linear regressions to the data (see also Table 1).
4.5 Overview of other measurement campaigns concerning HONO detection
A number of HONO detection campaigns, in which different experimental approaches were used side by side, have been published in the literature (Kleffmann et al., 2006; Ródenas et al., 2013; Pinto et al., 2014; Wu et al., 2014; Crilley et al., 2019; Yi et al., 2021). Several of these campaigns include IBBCEAS and LOPAP experimental approaches and describe instrument performances in the context of the measurement objectives for a given atmospheric (chamber of field) environment. An overview of the different campaign characteristics is summarized in Table 2 for information. Since the current study focussed on the development of a custom-designed long-cavity open-path IBBCEAS setup for the SAPHIR chamber, the motivation and objectives of our work differ substantially from those of the majority of the published campaigns. Thus, a detailed comparison of the observations is problematic, since the conditions and objectives are not compatible. Four of the studies listed in Table 2 are field campaigns with extractive (closed path) or no IBBCEAS instruments taking part. While the challenges in field work are substantial, the interfering species cannot be controlled. Pinto et al. (2014) pointed out that their instrument intercomparison is only valid and relevant for the specific field site in Texas where the study took place. Among the chamber studies only the latest one (Yi et al., 2021) uses an open-path IBBCEAS instrument. It is noteworthy that in contrast to the other chamber studies on HONO detection the measurements at SAPHIR were performed at HONO mixing ratios that are low and typical for urban environments, while the chamber measurement campaigns by Kleffmann et al. (2006), Ródenas et al. (2013), and Yi et al. (2021) used substantially higher mixing ratios (typically ∼ ppbv range are reported). Since a multi-pass White cell type DOAS system was used in Kleffmann et al. (2006) and no data from open-path IBBCEAS were published in the FIONA campaign, we will limit a brief comparison of our work with outcomes of the work by Yi et al. (2021):
Table 2Overview of other HONO detection campaigns in the literature in chronological order. The columns 2, 3, 7, and 8 represent chamber studies, and the columns 4–6 refer to field campaigns (Kleffmann et al., 2006, report measurements of both). The two main techniques that are subject of this paper, IBBCEAS and LOPAP, are shown in bold.

n/a: not applicable.
a Bresso, northern outskirts of Milan 5 km north of the city centre.
b Moody Tower at University of Houston 4 km south-east of Houston city centre.
c Suburban town of Tung Chung in south-western Hong Kong, adjacent to
Hong Kong International Airport.
d Chinese Academy of Sciences' Institute of Atmospheric Physics (IAP) tower
campus near the 4th Ring Road in northern Beijing.
e Zero here refers to below the detection limit.
f The types of techniques mentioned in the table are limited to HONO and
NO2 detection for comparison reasons.
IBBCEAS: Incoherent broadband cavity-enhanced absorption
spectroscopy. LOPAP: Long-path absorption photometry
CLS: Chemiluminescence spectroscopy.
PTRMS: Proton-transfer-reaction mass spectrometry.
(LP)-DOAS: (Long-path) differential optical absorption spectroscopy.
FTIR: Fourier transform infrared spectroscopy.
SC-AP: Stripping coil visible absorption photometry.
MC-IC: Mist chamber/ion chromatography.
QC-TILDAS: Quantum cascade tunable infrared laser differential absorption
spectroscopy.
IC-CIMS: Ion drift chemical ionization mass spectrometry.
TOF-CIMS: Time-of-flight chemical ionization mass spectrometer.
SIFT-MS: Selected ion flow tube mass spectrometer.
PF-LIF: Photo fragmentation laser-induced fluorescence.
LC-MS: Liquid chromatography mass spectrometer.
g Extractive (enclosed path) version of the open-path instrument in Wu et al. (2012).
h Instrument from Duan et al. (2018).
i Instrument reported in Kennedy et al. (2011), adapted for the
detection of HONO and NO2.
×n indicates the number of distinct instruments used for a
particular measurement approach.
In contrast to the measurements at SAPHIR (which is a 280 m3 fluorinated ethylene propylene (FEP) Teflon chamber) the measurements by Yi et al. (2021) were performed in a stainless-steel chamber (CESAM, Créteil, France) with a volume of ca. 4.2 m3. Therefore, the open-path cavity length used at CESAM is ca. 10 times shorter than that used at SAPHIR. Owing to the longer cavity length at SAPHIR a lower reflectivity (R∼ 0.9978–0.9986; see Fig. S5) could be used in comparison to Yi et al. (2021), who used R∼ 0.9992–0.9995. Despite this lower reflectivity at SAPHIR, the corresponding effective path length of ∼6.0 km is still longer than the one for the CESAM chamber, which was ∼3.3 km. Note that even if equal optical powers were assumed in both experiments, the lower reflectivity does not necessarily imply automatically a better signal-to-noise ratio, because generally less light can be imaged through a long cavity with finite mirror apertures than through a shorter cavity. Yi et al. (2021) used a thermalized 300 mW UV-LED (at 365 nm) which covered the range 351–378 nm. However, the detection limits were evaluated for a fit range of only 362–372 nm, since the lower intensity “wings” of the LED spectrum contribute to more noise, which impinges negatively on the fit reliability. While the optical powers of the UV-LED and our arc lamp are largely comparable, depending on the light collecting optics (see specs in the Supplement), the temporal stability of the LED and hence the constancy of I0(λ) can be expected to be better than that of a hot-spot arc lamp. For cavity-enhanced absorption measurements in chamber studies this is a crucial criterion, since I0 can only be established in the clean chamber and not easily during the experiments. Some unexpected variations in the HONO measurements in the current study are most likely attributed to the hot-spot arc stability (e.g. see Fig. 2a at 09:00 UTC). However, the limited spectral width of a single LED impinges on the achievable detection limits, which were ca. ∼160 pptv for HONO and ca. ∼340 pptv for NO2 in Yi et al. (2021). These limits were amended for an integration time of 1 min and a 2σ standard deviation to make them comparable with our limits of 26 pptv for HONO and 76 pptv for NO2. We attribute the smaller detection limits in the present study to two factors. (i) A larger spectral fit range, 352–386 nm, was used for the data evaluation. This range was determined by optical filters and the usable mirror reflectivity range. (ii) The effective absorption pathlength at SAPHIR was ca. twice that used at CESAM owing to the different sizes of the chambers. A third factor (iii) may be related to the lower mirror reflectivity in the SAPHIR experiment which in principle enables more light to be collected at the exit of the cavity. This advantage is however partly compensated for by the losses that occur in imaging light through a 10 times longer cavity. Argument (iii) is also biased by the use of different spectrometer/CCD assemblies in both experiments which can be expected to have different quantum yields in the relevant spectral range. The experiments at CESAM were executed at a different chemical regime with mixing ratios of HONO and NO2 in the range of tens of ppbv with up to 30 ppbv for HONO and up to 120 ppbv for NO2. In comparison, all SAPHIR measurements were executed at low mixing ratios of up to 400 pptv for HONO and up to 4 ppbv for NO2, which is more realistic in terms of ambient field concentrations. At these low mixing ratios and with potential instabilities in the excitation light source the correlation of data from IBBCEAS and LOPAP (r=0.974) and IBBCEAS and CLS (r=0.985) are overall very satisfactory (see Fig. 6 and Table 1). Despite the fact that Yi et al. (2021) used an expectedly more stable light source, the reported correlations coefficients of r=0.977 (IBBCEAS-LOPAP) and r=0.943 (IBBCEAS-FTIR) for HONO detection and r=0.993 (IBBCEAS-CLS) and r=0.941 (IBBCEAS-FTIR) for NO2 detection are comparable. The correlation coefficients in the field study by Wu et al. (2014) are lower in comparison; i.e. r=0.837 (IBBCEAS-LOPAP) and r=0.906 (IBBCEAS-CLS).
In 2011 an incoherent broadband open-path cavity-enhanced absorption spectroscopy (IBBCEAS) instrument was established at the SAPHIR chamber in Jülich and optimized for the detection of HONO and NO2 in the near-UV region (352–386 nm) using a bright hot-spot Xe-arc lamp and a UV-enhanced CCD detector. Based on an effective reflectivity of and a 20 m open-path cavity, a 2σ detection limit of 26 pptv for HONO and 76 pptv for NO2 was achieved for an integration time of 1 min. Methacrolein was also detected at mixing ratios below 5 ppbv. These detection limits are lower in comparison to those reported in the recent literature. The IBBCEAS instrument's performance for HONO and NO2 detection was compared to that of long-path absorption photometry (LOPAP) and chemiluminescent NOx detection, with R coefficients ranging from 0.930 to 0.994 for HONO and between 0.937 and 0.992 for NO2, respectively. At low concentrations, however, and especially upon humidification of the chamber, a small temporary water interference on NO2 mixing ratios was observed in CLS measurements which was not observed in the IBBCEAS data.
The data sets used in this study are available from the corresponding author Albert A. Ruth upon request (a.ruth@ucc.ie).
The supplement related to this article is available online at: https://doi.org/10.5194/amt-15-945-2022-supplement.
AAR and HPD designed and constructed the IBBCEAS setup. SD and HPD implemented the setup at SAPHIR. SD performed the IBBCEAS experiments (characterization, calibration, measurement, and data analysis) with advice from AAR and HPD. RH carried out the LOPAP measurements and analysis. FR carried out the CLS measurement and analysis. TB operated the SAPHIR chamber and contributed to the running of the campaign experiments. AAR wrote the manuscript with contributions from SD (layout), HPD, and FR.
The contact author has declared that neither they nor their co-authors have any competing interests.
Publisher’s note: Copernicus Publications remains neutral with regard to jurisdictional claims in published maps and institutional affiliations.
This article is part of the special issue “Simulation chambers as tools in atmospheric research (AMT/ACP/GMD inter-journal SI)”. It is not associated with a conference.
We thank Andreas Wahner of the Institute for Energy and Climate Research: Troposphere (IEK-8) at the Research Center in Jülich (Germany), as well as the team running the SAPHIR chamber, especially Ralf Tillmann, for providing the PTRMS data for this publication. The extraordinary craftsmanship of the mechanical workshop at Jülich in the context of this project is also gratefully recognized.
Sophie Dixneuf was funded through an IRCSET-Marie Curie International Mobility Fellowship in Science, Engineering and Technology (INSPIRE). This project has received funding for open-access publication costs from the European Union's Horizon 2020 research and innovation programme through the EUROCHAMP-2020 Infrastructure Activity (grant agreement no. 730997). This publication has in part emanated from research conducted with the financial support of Science Foundation Ireland (grant no. 21/FFP-A/8973).
This paper was edited by Mingjin Tang and reviewed by two anonymous referees.
Acker, K., Möller, D., Wieprecht, W., Meixner, F. X., Bohn, B., Gilge, S., Plass-Dülmer, C., and Berresheim, H.: Strong daytime production of OH from HNO2 at a rural mountain site, Geophys. Res. Lett., 33, L02809, https://doi.org/10.1029/2005GL024643, 2006.
Alicke, B., Geyer, A., Hofzumahaus, A., Holland, F., Konrad, S., Patz, H. W., Schäfer, J., Stutz, J., Volz-Thomas, A., and Platt, U.: OH formation by HONO photolysis during the BERLIOZ experiment, J. Geophys. Res., 108, 8247, https://doi.org/10.1029/2001JD000579, 2003.
Ashu-Ayem, E. R., Nitschke, U., Monahan, C., Chen, J., Darby, S. B., Smith, P. D., O'Dowd, C. D., Stengel, D. B., and Venables, D. S.: Coastal iodine emissions. 1. Release of I2 by Laminaria Digitata in chamber experiments, Environ. Sci. Technol., 46, 10413–10421, https://doi.org/10.1021/es204534v, 2012.
Aumont, B., Chervier, F., and Laval, S.: Contribution of HONO sources to the chemistry in the polluted boundary layer, Atmos. Environ., 37, 487–498, https://doi.org/10.1016/S1352-2310(02)00920-2, 2003.
Barney, W. S., Wingen, L. M., Lakin, M. J., Brauers, T., Stutz, J., and Finlayson-Pitts, B. J.: Infrared absorption cross-section measurements for nitrous acid (HONO) at room temperature, J. Phys. Chem. A, 104, 1692–1699, https://doi.org/10.1021/jp010734d, 2000.
Beine, H. J., Amoroso, A., Esposito, G., Sparapani, R., Ianniello, A., Georgiadis, T., Nardino, M., Bonasoni, P., Cristofanelli, P., and Dominé, F.: Deposition of atmospheric nitrous acid on alkaline snow surfaces, Geophys. Res. Lett., 32, L10808, https://doi.org/10.1029/2005GL022589, 2005.
Bitter, M., Ball, S. M., Povey, I. M., and Jones, R. L.: A broadband cavity ringdown spectrometer for in-situ measurements of atmospheric trace gases, Atmos. Chem. Phys., 5, 2547–2560, https://doi.org/10.5194/acp-5-2547-2005, 2005.
Bogumil, K., Orphal, J., Homann, T., Voigt, S., Spietz, P., Fleischmann, O. C., Vogel, A., Hartmann, M., Bovensmann, H., Frerick, J., and Burrows, J. P.: Measurements of molecular absorption spectra with the SCIAMACHY pre-flight model: Instrument characterization and reference data for atmospheric remote sensing in the 230-2380 nm region, J. Photoch. Photobio. A, 157, 167–184, https://doi.org/10.1016/S1010-6030(03)00062-5, 2003.
Bongartz, A., Kames, J., Schurath, U., George, C., Mirabel, P., and Ponche, J. L.: Experimental determination of HONO mass accomodation coefficients using two different techniques, J. Atmos. Chem., 18, 149–169, https://doi.org/10.1007/BF00696812, 1994.
Bottorff, B., Reidy, E., Mielke, L., Dusanter, S., and Stevens, P. S.: Development of a laser-photofragmentation laser-induced fluorescence instrument for the detection of nitrous acid and hydroxyl radicals in the atmosphere, Atmos. Meas. Tech., 14, 6039–6056, https://doi.org/10.5194/amt-14-6039-2021, 2021.
Bröske, R., Kleffmann, J., and Wiesen, P.: Heterogeneous conversion of NO2 on secondary organic aerosol surfaces: A possible source of nitrous acid (HONO) in the atmosphere?, Atmos. Chem. Phys., 3, 469–474, https://doi.org/10.5194/acp-3-469-2003, 2003.
Brust, A. S., Becker, K. H., Kleffmann, J., and Wiesen, P.: UV absorption cross sections of nitrous acid, Atmos. Environ., 34, 13–19, https://doi.org/10.1016/S1352-2310(99)00322-2, 2000.
Burrows, J. P., Dehn, A., Deters, B., Himmelmann, S., Richter, A., Voigt, S., and Orphal, J.: Atmospheric remote-sensing reference data from GOME: Part 1. Temperature-dependent absorption cross-sections of NO2 in the 231–794 nm range, J. Quant. Spectrosc. Ra., 60, 1025–1031, https://doi.org/10.1016/S0022-4073(97)00197-0, 1998.
Calvert, J. G., Yarwood, G., and Dunker, A. M.: An evaluation of the mechanism of nitrous acid formation in the urban atmosphere, Res. Chem. Intermediat., 20, 463–502, https://doi.org/10.1163/156856794X00423, 1994.
Chen, J., Wenger, J. C., and Venables, D. S.: Near-ultraviolet absorption cross sections of nitrophenols and their potential influence on tropospheric oxidation capacity, J. Phys. Chem. A, 115, 12235–12242, https://doi.org/10.1021/jp206929r, 2011.
Crilley, L. R., Kramer, L. J., Ouyang, B., Duan, J., Zhang, W., Tong, S., Ge, M., Tang, K., Qin, M., Xie, P., Shaw, M. D., Lewis, A. C., Mehra, A., Bannan, T. J., Worrall, S. D., Priestley, M., Bacak, A., Coe, H., Allan, J., Percival, C. J., Popoola, O. A. M., Jones, R. L., and Bloss, W. J.: Intercomparison of nitrous acid (HONO) measurement techniques in a megacity (Beijing), Atmos. Meas. Tech., 12, 6449–6463, https://doi.org/10.5194/amt-12-6449-2019, 2019.
Destaillats, H., Spaulding, R. S., and Charles, M. J.: Ambient air measurement of acrolein and other carbonyls at the Oakland-San Francisco bay bridge toll plaza, Environ. Sci. Technol., 36, 2227–2235, https://doi.org/10.1021/es011394c, 2002.
Dixneuf, S., Ruth, A. A., Vaughan, S., Varma, R. M., and Orphal, J.: The time dependence of molecular iodine emission from Laminaria digitata, Atmos. Chem. Phys., 9, 823–829, https://doi.org/10.5194/acp-9-823-2009, 2009.
Djehiche, M., Tomas, A., Fittschen, C., and Coddeville, P.: First direct detection of HONO in the reaction of methylnitrite (CH3ONO) with OH radicals, Environ. Sci. Technol., 45, 608–614, https://doi.org/10.1021/es103076e, 2011.
Donaldson, M. A., Berke, A. E., and Raff, J. D.: Uptake of gas phase nitrous acid onto boundary layer soil surfaces, Environ. Sci. Technol., 48, 375–383, https://doi.org/10.1021/es404156a, 2014.
Dorn, H.-P., Apodaca, R. L., Ball, S. M., Brauers, T., Brown, S. S., Crowley, J. N., Dubé, W. P., Fuchs, H., Häseler, R., Heitmann, U., Jones, R. L., Kiendler-Scharr, A., Labazan, I., Langridge, J. M., Meinen, J., Mentel, T. F., Platt, U., Pöhler, D., Rohrer, F., Ruth, A. A., Schlosser, E., Schuster, G., Shillings, A. J. L., Simpson, W. R., Thieser, J., Tillmann, R., Varma, R., Venables, D. S., and Wahner, A.: Intercomparison of NO3 radical detection instruments in the atmosphere simulation chamber SAPHIR, Atmos. Meas. Tech., 6, 1111–1140, https://doi.org/10.5194/amt-6-1111-2013, 2013.
Duan, J., Qin, M., Ouyang, B., Fang, W., Li, X., Lu, K., Tang, K., Liang, S., Meng, F., Hu, Z., Xie, P., Liu, W., and Häsler, R.: Development of an incoherent broadband cavity-enhanced absorption spectrometer for in situ measurements of HONO and NO2, Atmos. Meas. Tech., 11, 4531–4543, https://doi.org/10.5194/amt-11-4531-2018, 2018.
Febo, A., Perrino, C., and Allegrini, I.: Measurement of nitrous acid in Milan, Italy, by DOAS and diffusion denuders, Atmos. Environ., 30, 3599–3609, https://doi.org/10.1016/1352-2310(96)00069-6, 1996.
Fehsenfeld, F., Calvert, J., Fall, R., Goldan, P., Guenther, A., Hewitt, C. N., Lamb, B., Liu, S., Trainer, M., Westberg, H., and Zimmerman, P.: Emissions of volatile organic compounds from vegetation and the implications for atmospheric chemistry, Global Biogeochem. Cy., 6, 389–430, https://doi.org/10.1029/92GB02125, 1992.
Ferm, M. and Sjödin, A.: A sodium carbonate coated denuder for determination of nitrous acid in the atmosphere, Atmos. Environ., 19, 979–983, https://doi.org/10.1016/0004-6981(85)90243-4, 1985.
Fiedler, S. E., Hese, A., and Ruth, A. A.: Incoherent broad-band cavity-enhanced absorption spectroscopy, Chem. Phys. Lett., 371, 284–294, https://doi.org/10.1016/S0009-2614(03)00263-X, 2003.
Finlayson-Pitts, B. J., Wingen, L. M., Sumner, A. L., Syomin, D., and Ramazan, K. A.: The heterogeneous hydrolysis of NO2 in laboratory systems and in outdoor and indoor atmospheres: An integrated mechanism, Phys. Chem. Chem. Phys. 5, 223–242, https://doi.org/10.1039/B208564J, 2003.
Fouqueau, A., Cirtog, M., Cazaunau, M., Pangui, E., Zapf, P., Siour, G., Landsheere, X., Méjean, G., Romanini, D., and Picquet-Varrault, B.: Implementation of an incoherent broadband cavity-enhanced absorption spectroscopy technique in an atmospheric simulation chamber for in situ NO3 monitoring: characterization and validation for kinetic studies, Atmos. Meas. Tech., 13, 6311–6323, https://doi.org/10.5194/amt-13-6311-2020, 2020.
Fuchs, H., Ball, S. M., Bohn, B., Brauers, T., Cohen, R. C., Dorn, H.-P., Dubé, W. P., Fry, J. L., Häseler, R., Heitmann, U., Jones, R. L., Kleffmann, J., Mentel, T. F., Müsgen, P., Rohrer, F., Rollins, A. W., Ruth, A. A., Kiendler-Scharr, A., Schlosser, E., Shillings, A. J. L., Tillmann, R., Varma, R. M., Venables, D. S., Villena Tapia, G., Wahner, A., Wegener, R., Wooldridge, P. J., and Brown, S. S.: Intercomparison of measurements of NO2 concentrations in the atmosphere simulation chamber SAPHIR during the NO3Comp campaign, Atmos. Meas. Tech., 3, 21–37, https://doi.org/10.5194/amt-3-21-2010, 2010.
Fuchs, H., Acir, I.-H., Bohn, B., Brauers, T., Dorn, H.-P., Häseler, R., Hofzumahaus, A., Holland, F., Kaminski, M., Li, X., Lu, K., Lutz, A., Nehr, S., Rohrer, F., Tillmann, R., Wegener, R., and Wahner, A.: OH regeneration from methacrolein oxidation investigated in the atmosphere simulation chamber SAPHIR, Atmos. Chem. Phys., 14, 7895–7908, https://doi.org/10.5194/acp-14-7895-2014, 2014.
Gherman, T., Venables, D. S., Vaughan, S., Orphal, J., and Ruth, A. A.: Incoherent broadband cavity-enhanced absorption spectroscopy in the near-ultraviolet: Application to HONO and NO2, Environ. Sci. Technol., 42, 890–895, https://doi.org/10.1021/es0716913, 2008.
Häseler, R., Brauers, T., Holland, F., and Wahner, A.: Development and application of a new mobile LOPAP instrument for the measurement of HONO altitude profiles in the planetary boundary layer, Atmos. Meas. Tech. Discuss., 2, 2027–2054, https://doi.org/10.5194/amtd-2-2027-2009, 2009.
Hanst, P. L., Wong, N. W., and Bragin, J.: A long-path infrared study of Los Angeles smog, Atmos. Environ., 16, 969–981, https://doi.org/10.1016/0004-6981(82)90183-4, 1982.
Harder, J. W., Brault, J. W., Johnston, P. V., and Mount, G. H.: Temperature dependent NO2 cross sections at high spectral resolution, J. Geophys. Res., 102, 3861–3879, https://doi.org/10.1029/96JD03086, 1997.
Harrison, R. M. and Kitto, A. M. N.: Evidence for a surface source of atmospheric nitrous acid, Atmos. Environ., 28, 1089–1094, https://doi.org/10.1016/1352-2310(94)90286-0, 1994.
Heland, J., Kleffmann, J., Kurtenbach, R., and Wiesen, P.: A new instrument to measure gaseous nitrous acid (HONO) in the atmosphere, Environ. Sci. Technol., 35, 3207–3212, https://doi.org/10.1021/es000303t, 2001.
Hoch, D. J., Buxmann, J., Sihler, H., Pöhler, D., Zetzsch, C., and Platt, U.: A Cavity-Enhanced Differential Optical Absorption Spectroscopy instrument for measurement of BrO, HCHO, HONO and O3, Atmos. Meas. Tech. Discuss., 5, 3079–3115, https://doi.org/10.5194/amtd-5-3079-2012, 2012.
Huang, G., Zhou, X. L., Deng, G. H., Qiao, H. C., and Civerolo, K.: Measurements of atmospheric nitrous acid and nitric acid, Atmos. Environ., 36, 2225–2235, https://doi.org/10.1016/S1352-2310(02)00170-X, 2002.
Jain, C., Morajkar, P., Schoemaecker, C., Viskolcz, B., and Fittschen, C.: Measurement of absolute absorption cross sections for nitrous acid (HONO) in the near-infrared region by the continuous wave cavity ring-down spectroscopy (cw-CRDS) technique coupled to laser photolysis, J. Phys. Chem. A, 115, 10720–10728, https://doi.org/10.1021/jp203001y, 2011.
Johnston, H. S. and Graham, R.: Photochemistry of NOx and HNOx compounds, Can. J. Chem.-Rev. Can. Chim., 52, 1415–1423, https://doi.org/10.1139/v74-214, 1974.
Jordan, N. and Osthoff, H. D.: Quantification of nitrous acid (HONO) and nitrogen dioxide (NO2) in ambient air by broadband cavity-enhanced absorption spectroscopy (IBBCEAS) between 361 and 388 nm, Atmos. Meas. Tech., 13, 273–285, https://doi.org/10.5194/amt-13-273-2020, 2020.
Karl, M.: Modellierung atmosphärisch-chemischer Reaktionen in der Tageslicht-Atmosphären-Simulationskammer SAPHIR, Dissertation, Westfälische Wilhelms-Universität Münster, 1–216, 2004.
Keller-Rudek, H., Moortgat, G. K., Sander, R., and Sörensen, R.: The MPI-Mainz UV/VIS Spectral Atlas of Gaseous Molecules of Atmospheric Interest, Earth Syst. Sci. Data, 5, 365–373, https://doi.org/10.5194/essd-5-365-2013, 2013.
Kennedy, O. J., Ouyang, B., Langridge, J. M., Daniels, M. J. S., Bauguitte, S., Freshwater, R., McLeod, M. W., Ironmonger, C., Sendall, J., Norris, O., Nightingale, R., Ball, S. M., and Jones, R. L.: An aircraft based three channel broadband cavity enhanced absorption spectrometer for simultaneous measurements of NO3, N2O5 and NO2, Atmos. Meas. Tech., 4, 1759–1776, https://doi.org/10.5194/amt-4-1759-2011, 2011.
Kleffmann, J.: Daytime sources of nitrous acid (HONO) in the atmospheric boundary layer, Chem. Phys. Chem., 8, 1137–1144, https://doi.org/10.1002/cphc.200700016, 2007.
Kleffmann, J. and Wiesen, P.: Technical Note: Quantification of interferences of wet chemical HONO LOPAP measurements under simulated polar conditions, Atmos. Chem. Phys., 8, 6813–6822, https://doi.org/10.5194/acp-8-6813-2008, 2008.
Kleffmann, J., Heland, J., Kurtenbach, R., Lorzer, J., and Wiesen, P.: A new instrument (LOPAP) for the detection of nitrous acid (HONO), Environ. Sci. Pollut. Res., 4, 48–54, 2002.
Kleffmann, J., Kurtenbach, R., Lorzer, J., Wiesen, P., Kalthoff, N., Vogel, B., and Vogel, H.: Measured and simulated vertical profiles of nitrous acid – Part I: Field measurements, Atmos. Environ., 37, 2949–2955, https://doi.org/10.1016/S1352-2310(03)00242-5, 2003.
Kleffmann, J., Gavriloaiei, T., Hofzumahaus, A., Holland, F., Koppmann, R., Rupp, L., Schlosser, E., Siese, M., and Wahner, A.: Daytime formation of nitrous acid: A major source of OH radicals in a forest, Geophys. Res. Lett., 32, L05818, https://doi.org/10.1029/2005GL022524, 2005.
Kleffmann, J., Lörzer, J. C., Wiesen, P., Kern, C., Trick, S., Volkamer, R., Rodenas, M., and Wirtz, K.: Intercomparison of the DOAS and LOPAP techniques for the detection of nitrous acid (HONO), Atmos. Environ., 40, 3640–3652, https://doi.org/10.1016/j.atmosenv.2006.03.027, 2006.
Lammel, G. and Cape, J. N.: Nitrous acid and nitrite in the atmosphere, Chem. Soc. Rev., 25, 361–369, https://doi.org/10.1039/CS9962500361, 1996.
Langridge, J. M., Ball, S. M., and Jones, R. L.: A compact broadband cavity enhanced absorption spectrometer for detection of atmospheric NO2 using light emitting diodes, Analyst, 131, 916–922, https://doi.org/10.1039/B605636A, 2006.
Leigh, R. J., Ball, S. M., Whitehead, J., Leblanc, C., Shillings, A. J. L., Mahajan, A. S., Oetjen, H., Lee, J. D., Jones, C. E., Dorsey, J. R., Gallagher, M., Jones, R. L., Plane, J. M. C., Potin, P., and McFiggans, G.: Measurements and modelling of molecular iodine emissions, transport and photodestruction in the coastal region around Roscoff, Atmos. Chem. Phys., 10, 11823–11838, https://doi.org/10.5194/acp-10-11823-2010, 2010.
Li, X., Brauers, T., Häseler, R., Bohn, B., Fuchs, H., Hofzumahaus, A., Holland, F., Lou, S., Lu, K. D., Rohrer, F., Hu, M., Zeng, L. M., Zhang, Y. H., Garland, R. M., Su, H., Nowak, A., Wiedensohler, A., Takegawa, N., Shao, M., and Wahner, A.: Exploring the atmospheric chemistry of nitrous acid (HONO) at a rural site in Southern China, Atmos. Chem. Phys., 12, 1497–1513, https://doi.org/10.5194/acp-12-1497-2012, 2012.
Li, X., Rohrer, F., Hofzumahaus, A., Brauers, T., Häseler, R., Bohn, B., Broch, S., Fuchs, H., Gomm, S., Holland, F., Jäger, J., Kaiser, J., Keutsch, F. N., Lohse, I., Lu, K. D., Tillmann, R., Wegener, R., Wolfe, G. M., Mentel, T. F., Kiendler-Scharr, A., and Wahner, A.: Missing gas-phase source of HONO inferred from zeppelin measurements in the troposphere, Science, 344, 292–296, https://doi.org/10.1126/science.1248999, 2014.
Liao, W., Hecobian, A., Mastromarino, J., and Tan, D.: Development of a photo-fragmentation/laser-induced fluorescence measurement of atmospheric nitrous acid, Atmos. Environ., 40, 17–26, https://doi.org/10.1016/j.atmosenv.2005.07.001, 2006.
Liu, Y., Nie, W., Xu, Z., Wang, T., Wang, R., Li, Y., Wang, L., Chi, X., and Ding, A.: Semi-quantitative understanding of source contribution to nitrous acid (HONO) based on 1 year of continuous observation at the SORPES station in eastern China, Atmos. Chem. Phys., 19, 13289–13308, https://doi.org/10.5194/acp-19-13289-2019, 2019.
Meller, R.: personal communication to E.-P. Röth, R. Ruhnke, G. Moortgat, R. Meller, and W. Schneider, Berichte des Forschungszentums Jülich, jül-3341 (1997), http://satellite.mpic.de/spectral_atlas/cross_sections/Organics%20(carbonyls)/Aldehydes(aliphatic)/CH2=C(CH3)CHO_Meller(1990)_294K_237-391nm.txt (last access: 18 February 2022), 1990.
Mérienne, M. F., Jenouvrier, A., and Coquart, B.: The NO2 absorption-spectrum. I: Absorption cross-sections at ambient-temperature in the 300–500 nm region, J. Atmos. Chem., 20, 281–297, https://doi.org/10.1007/BF00694498, 1995.
Min, K.-E., Washenfelder, R. A., Dubé, W. P., Langford, A. O., Edwards, P. M., Zarzana, K. J., Stutz, J., Lu, K., Rohrer, F., Zhang, Y., and Brown, S. S.: A broadband cavity enhanced absorption spectrometer for aircraft measurements of glyoxal, methylglyoxal, nitrous acid, nitrogen dioxide, and water vapor, Atmos. Meas. Tech., 9, 423–440, https://doi.org/10.5194/amt-9-423-2016, 2016.
Montzka, S. A., Trainer, M., Goldan, P. D., Kuster, W. C., and Fehsenfeld, F. C.: Isoprene and its oxidation products, methyl vinyl ketone and methacrolein, in the rural troposphere, J. Geophys. Res., 98, 1101–1111, https://doi.org/10.1029/92JD02382, 1993.
Nakashima, Y. and Sadanaga, Y.: Validation of in situ measurements of atmospheric nitrous acid using incoherent broadband cavity-enhanced absorption spectroscopy, Analytical Sciences, 33, 519–524, https://doi.org/10.2116/analsci.33.519, 2017.
Nehr, S., Bohn, B., Dorn, H.-P., Fuchs, H., Häseler, R., Hofzumahaus, A., Li, X., Rohrer, F., Tillmann, R., and Wahner, A.: Atmospheric photochemistry of aromatic hydrocarbons: OH budgets during SAPHIR chamber experiments, Atmos. Chem. Phys., 14, 6941–6952, https://doi.org/10.5194/acp-14-6941-2014, 2014.
Nussbaumer, C. M., Parchatka, U., Tadic, I., Bohn, B., Marno, D., Martinez, M., Rohloff, R., Harder, H., Kluge, F., Pfeilsticker, K., Obersteiner, F., Zöger, M., Doerich, R., Crowley, J. N., Lelieveld, J., and Fischer, H.: Modification of a conventional photolytic converter for improving aircraft measurements of NO2 via chemiluminescence, Atmos. Meas. Tech., 14, 6759–6776, https://doi.org/10.5194/amt-14-6759-2021, 2021.
Oms, M. T., Jongejan, P. A. C., Veltkamp, A. C., Wyers, G. P., and Slanina, J.: Continuous monitoring of atmospheric HCl, HNO2, HNO3, and SO2, by wet-annular denuder air sampling with on-line chromatographic analysis, Int. J. Environ. An. Ch., 62, 207–218, https://doi.org/10.1080/03067319608028134, 1996.
Pierotti, D., Wofsy, S. C., Jacob, D., and Rasmussen, R. A.: Isoprene and its oxidation products: Methacrolein and methyl vinyl ketone, J. Geophys. Res., 95, 1871–1881, https://doi.org/10.1029/JD095iD02p01871, 1990.
Pinto, J. P., Dibb, J., Lee, B. H., Rappenglück, B., Wood, E. C., Levy, M., Zhang, R.-Y., Lefer, B., Ren, X.-R., Stutz, J., Tsai, C., Ackermann, L., Golovko, J., Herndon, S. C., Oakes, M., Meng, Q.-Y., Munger, J. W., Zahniser, M., and Zheng, J.: Intercomparison of field measurements of nitrous acid (HONO) during the SHARP campaign, J. Geophys. Res.-Atmos., 119, 5583–5601, https://doi.org/10.1002/2013JD020287, 2014.
Press, W. H., Flannery, T. S., and Vetterling, W. T.: Numerical Recipes: The Art of Scientific Computing, Cambridge University Press, pp. 51 and 670, ISBN 978-0-521-88068-8, 1986.
Ramazan, K. A., Syomin, D., and Finlayson-Pitts, B. J.: The photochemical production of HONO during the heterogeneous hydrolysis of NO2, Phys. Chem. Chem. Phys., 6, 3836–3843, https://doi.org/10.1039/B402195A, 2004.
Reisinger, A. R.: Observations of HNO2 in the polluted winter atmosphere: possible heterogeneous production on aerosols, Atmos. Environ., 34, 3865–3874, https://doi.org/10.1016/S1352-2310(00)00179-5, 2000.
Roberts, J. M. and Bertman, S. B.: The thermal decomposition of peroxy acetic nitric anhydride (PAN) and peroxymethacrylic nitric anhydride (MPAN), Int. J. Chem. Kinet., 24, 297–307, https://doi.org/10.1002/kin.550240307, 1992.
Ródenas, M., Munoz, A., Alacreu, F., Brauers, T., Dorn, H. P., Kleffmann, J., and Bloss, W.: Assessment of HONO Measurements: The FIONA Campaign at EUPHORE, in: Disposal of Dangerous Chemicals in Urban Areas and Mega Cities: Role of Oxides and Acids of Nitrogen in Atmospheric Chemistry, edited by: Barnes, I. and Rudzinski, K. J., Springer, Dordrecht, 45–58, https://doi.org/10.1007/978-94-007-5034-0_4, 2013.
Rodgers, M. O. and Davis, D. D.: A UV-photofragmentation laser-induced fluorescence sensor for detection of HONO, Environ. Sci. Technol., 23, 1106–1112, https://doi.org/10.1021/es00067a007, 1989.
Rohrer, F. and Brüning, D.: Surface NO and NO2 mixing ratios measured between 30∘ N and 30∘ S in the Atlantic region, J. Atmos. Chem., 15, 253–267, https://doi.org/10.1007/BF00115397, 1992.
Rohrer, F., Bohn, B., Brauers, T., Brüning, D., Johnen, F.-J., Wahner, A., and Kleffmann, J.: Characterisation of the photolytic HONO-source in the atmosphere simulation chamber SAPHIR, Atmos. Chem. Phys., 5, 2189–2201, https://doi.org/10.5194/acp-5-2189-2005, 2005.
Ruth, A. A. and Lynch, K. T.: Incoherent broadband cavity-enhanced total internal reflection spectroscopy of surface adsorbed metalloporphyrins, Phys. Chem. Chem. Phys., 10, 7098–7108, https://doi.org/10.1039/B809591D, 2008.
Ruth, A. A., Dixneuf, S., and Raghunandan, R.: Broadband cavity-enhanced absorption Spectroscopy with incoherent light, in: Cavity enhanced spectroscopy and sensing, edited by: Gagliardi, G. and Loock, H. P., Springer Series in Optical Sciences, 179, 485–517, https://doi.org/10.1007/978-3-642-40003-2, 2014.
Saiz-Lopez, A., Plane, J. M. C., McFiggans, G., Williams, P. I., Ball, S. M., Bitter, M., Jones, R. L., Hongwei, C., and Hoffmann, T.: Modelling molecular iodine emissions in a coastal marine environment: the link to new particle formation, Atmos. Chem. Phys., 6, 883–895, https://doi.org/10.5194/acp-6-883-2006, 2006.
Schiller, C. L., Locquiao, S., Johnson, T. J., and Harris, G. W.: Atmospheric measurements of HONO by tunable diode laser absorption spectroscopy, J. Atmos. Chem., 40, 275–293, https://doi.org/10.1023/A:1012264601306, 2001.
Scharko, N. K., Berke, A. E., and Raff, J. D.: Release of nitrous acid and nitrogen dioxide from nitrate photolysis in acidic aqueous solutions, Environ. Sci. Technol., 48, 11991–12001, https://doi.org/10.1021/es503088x, 2014.
Sleiman, M., Logue, J. M., Luo, W., Pankow, J. F., Gundel, L. A., and Destaillats, H.: Inhalable constituents of thirdhand tobacco smoke: Chemical characterization and health impact considerations, Environ. Sci. Technol., 48, 13093–13101, https://doi.org/10.1021/es5036333, 2014.
Simon, P. K. and Dasgupta, P. K.: Continuous automated measurement of gaseous nitrous and nitric acids and particulate nitrite and nitrate, Environ. Sci. Technol., 29, 1534–1541, https://doi.org/10.1021/es00006a015, 1995.
Spataro, F. and Ianniello, A.: Sources of atmospheric nitrous acid: State of the science, current research needs, and future prospects, J. Air Waste Manage., 64, 1232–1250, https://doi.org/10.1080/10962247.2014.952846, 2014.
Spindler, G., Hesper, J., Brüggemann, E., Dubois, R., Müller, T., and Herrmann, H.: Wet annular denuder measurements of nitrous acid: laboratory study of the artefact reaction of NO2 with S(IV) in aqueous solution and comparison with field measurements, Atmos. Environ., 37, 2643–2662, https://doi.org/10.1016/S1352-2310(03)00209-7, 2003.
Staffelbach, T., Neftel, A., and Horowitz, L. W.: Photochemical oxidant formation over southern Switzerland. 2. Model results, J. Geophys. Res., 102, 23363–23373, https://doi.org/10.1029/97JD00932, 1997.
Stemmler, K., Ammann, M., Donders, C., Kleffmann, J., and George, C.: Photosensitized reduction of nitrogen dioxide on humic acid as a source of nitrous acid, Nature, 440, 195–198, https://doi.org/10.1038/nature04603, 2006.
Stutz, J., Kim, E. S., Platt, U., Bruno, P., Perrino, C., and Febo, A.: UV-visible absorption cross sections of nitrous acid, J. Geophys. Res., 105, 14585–14592, https://doi.org/10.1029/2000JD900003, 2000.
Stutz, J., Oha, H.-J., Whitlow, S. I., Anderson, C., Dibb, J. E., Flynn, J. H., Rappenglück, B., and Lefer, B.: Simultaneous DOAS and mist-chamber IC measurements of HONO in Houston, TX, Atmos. Environ., 44, 4090–4098, https://doi.org/10.1016/j.atmosenv.2009.02.003, 2010.
Takenaka, N., Terada, H., Oro, Y., Hiroi, M., Yoshikawa, H., Okitsu, K., and Bandow, H.: A new method for the measurement of trace amounts of HONO in the atmosphere using an air-dragged aqua-membrane-type denuder and fluorescence detection, Analyst, 129, 1130–1136, https://doi.org/10.1039/B407726A, 2004.
Tang, K., Qin, M., Fang, W., Duan, J., Meng, F., Ye, K., Zhang, H., Xie, P., He, Y., Xu, W., Liu, J., and Liu, W.: Simultaneous detection of atmospheric HONO and NO2 utilising an IBBCEAS system based on an iterative algorithm, Atmos. Meas. Tech., 13, 6487–6499, https://doi.org/10.5194/amt-13-6487-2020, 2020.
Thalman, R. and Volkamer, R.: Inherent calibration of a blue LED-CE-DOAS instrument to measure iodine oxide, glyoxal, methyl glyoxal, nitrogen dioxide, water vapour and aerosol extinction in open cavity mode, Atmos. Meas. Tech., 3, 1797–1814, https://doi.org/10.5194/amt-3-1797-2010, 2010.
Vandaele, A. C., Hermans, C., Fally, S., Carleer, M., Colin, R., Mérienne, M.-F., and Jenouvrier, A.: High-resolution Fourier transform measurement of the NO2 visible and near-infrared absorption cross-section: Temperature and pressure effects, J. Geophys. Res., 107, ACH 3-1–ACH 3-12, https://doi.org/10.1029/2001JD000971, 2002.
Varma, R. M., Venables, D. S., Ruth, A. A., Heitmann, U., Schlosser, E., and Dixneuf, S.: Long optical cavities for open-path monitoring of atmospheric trace gases and aerosol extinction, Appl. Optics, 48, B159–B171, https://doi.org/10.1364/AO.48.00B159, 2009.
Varma, R. M., Ball, S. M., Brauers, T., Dorn, H.-P., Heitmann, U., Jones, R. L., Platt, U., Pöhler, D., Ruth, A. A., Shillings, A. J. L., Thieser, J., Wahner, A., and Venables, D. S.: Light extinction by secondary organic aerosol: an intercomparison of three broadband cavity spectrometers, Atmos. Meas. Tech., 6, 3115–3130, https://doi.org/10.5194/amt-6-3115-2013, 2013.
Vogel, B., Vogel, H., Kleffmann, J., and Kurtenbach, R.: Measured and simulated vertical profiles of nitrous acid – Part II. Model simulations and indications for a photolytic source, Atmos. Environ., 37, 2957–2966, https://doi.org/10.1016/S1352-2310(03)00243-7, 2003.
Voigt, S., Orphal, J., and Burrows, J. P.: The temperature and pressure dependence of the absorption cross-sections of NO2 in the 250–800 nm region measured by Fourier-transform spectroscopy, J. Photoch. Photobio. A, 149, 1–7, https://doi.org/10.1016/S1010-6030(01)00650-5, 2002.
Wang, L. M. and Zhang, J. S.: Detection of nitrous acid by cavity ring down spectroscopy, Environ. Sci. Technol., 34, 4221–4227, https://doi.org/10.1021/es0011055, 2000.
Warneke, C., Holzinger, R., Hansel, A., Jordan, A., Lindinger, W., Pöschl, U., Williams, J., Hoor, P., Fischer, H., Crutzen, P. J., Scheeren, H. A., and Lelieveld, J.: Isoprene and its oxidation products methyl vinyl ketone, methacrolein, and isoprene related peroxides measured online over the tropical rain forest of Surinam in March 1998, J. Atmos. Chem., 38, 167–185, https://doi.org/10.1023/A:1006326802432, 2001.
Washenfelder, R. A., Langford, A. O., Fuchs, H., and Brown, S. S.: Measurement of glyoxal using an incoherent broadband cavity enhanced absorption spectrometer, Atmos. Chem. Phys., 8, 7779–7793, https://doi.org/10.5194/acp-8-7779-2008, 2008.
Wennberg, P. O., Bates, K. H., Crounse, J. D., Dodson, L. G., McVay, R. C., Mertens, L. A., Nguyen, T. B., Praske, E., Schwantes, R. H., Smarte, M. D., StClair, J. M., Teng, A. P., Zhang, X., and Seinfeld, J. H.: Gas-phase reactions of isoprene and its major oxidation products, Chem. Rev., 118, 3337–3390, https://doi.org/10.1021/acs.chemrev.7b00439, 2018.
Wisthaler, A., Apel, E. C., Bossmeyer, J., Hansel, A., Junkermann, W., Koppmann, R., Meier, R., Müller, K., Solomon, S. J., Steinbrecher, R., Tillmann, R., and Brauers, T.: Technical Note: Intercomparison of formaldehyde measurements at the atmosphere simulation chamber SAPHIR, Atmos. Chem. Phys., 8, 2189–2200, https://doi.org/10.5194/acp-8-2189-2008, 2008.
Wu, T., Zhao, W., Chen, W., Zhang, W., and Gao, X.: Incoherent broadband cavity enhanced absorption spectroscopy for in situ measurements of NO2 with a blue light emitting diode, Appl. Phys. B-Lasers O., 94, 85–94, https://doi.org/10.1007/s00340-008-3308-8, 2009.
Wu, T., Chen, W., Fertein, E., Cazier, F., Dewaele, D., and Gao, X.: Development of an open-path incoherent broadband cavity-enhanced spectroscopy based instrument for simultaneous measurement of HONO and NO2 in ambient air, Appl. Phys. B-Lasers O., 106, 501–509, https://doi.org/10.1007/s00340-011-4818-3, 2012.
Wu, T., Zha, Q., Chen, W., Xu, Z., Wang, T., and He, X.: Development and deployment of a cavity enhanced UV-LED spectrometer for measurements of atmospheric HONO and NO2 in Hong Kong, Atmos. Environ., 95, 544–551, https://doi.org/10.1016/j.atmosenv.2014.07.016, 2014.
Yi, H., Wu, T., Wang, G., Zhao, W., Fertein, E., Coeur, C., Gao, X., Zhang, W., and Chen, W.: Sensing atmospheric reactive species using light emitting diode by incoherent broadband cavity enhanced absorption spectroscopy, Opt. Express, 24, A781–A790, https://doi.org/10.1364/OE.24.00A781, 2016.
Yi, H., Cazaunau, M., Gratien, A., Michoud, V., Pangui, E., Doussin, J.-F., and Chen, W.: Intercomparison of IBBCEAS, NitroMAC and FTIR analyses for HONO, NO2 and CH2O measurements during the reaction of NO2 with H2O vapour in the simulation chamber CESAM, Atmos. Meas. Tech., 14, 5701–5715, https://doi.org/10.5194/amt-14-5701-2021, 2021.
Zhou, X., Civerolo, K., Dai, H. P., Huang, G., Schwab, J., and Demerjian, K.: Summertime nitrous acid chemistry in the atmospheric boundary layer at a rural site in New York state, J. Geophys. Res., 107, 4590, https://doi.org/10.1029/2001JD001539, 2002a.
Zhou, X., He, Y., Huang, G., Thornberry, T. D., Carroll, M. A., and Bertman, S. B.: Photochemical production of nitrous acid on glass sample manifold surface, Geophys. Res. Lett., 29, 26-1–26-4, https://doi.org/10.1029/2002GL015080, 2002b.
Zhou, X., Gao, H. L., He, Y., Huang, G., Bertman, S. B., Civerolo, K., and Schwab, J.: Nitric acid photolysis on surfaces in low-NOx environments: Significant atmospheric implications, Geophys. Res. Lett., 30, 2217, https://doi.org/10.1029/2003GL018620, 2003.
SAPHIR: Simulation of Atmospheric PHotochemistry In a large Reaction chamber.