the Creative Commons Attribution 4.0 License.
the Creative Commons Attribution 4.0 License.
 | 02 Mar 2023
Development of an International System of Units (SI)-traceable transmission curve reference material to improve the quantitation and comparability of proton-transfer-reaction mass-spectrometry measurements
Sergi Moreno
Kieran O'Daly
Rupert Holzinger
Since its inception more than 2 decades ago, proton-transfer-reaction mass spectrometry (PTR-MS) has established itself as a powerful technique for the measurements of a wide range of volatile organic compounds (VOCs) with high time resolution and low detection limits and without the need for any sample pre-treatment. As this technology has matured and its application become more widespread, there is a growing need for accurate and traceable calibration to ensure measurement comparability. As a result of the large number of VOCs detectable with PTR-MS, it is impractical to have a calibration standard or standards that cover all observable compounds. However, recent work has demonstrated that quantitative measurements of uncalibrated compounds are possible provided that the transmission curve is accurately constrained. To enable this, a novel traceable multi-component gas reference material containing 20 compounds spanning a mass range of 32 to 671 has been developed. The development and compositional evolution of this reference material are described along with an evaluation of its accuracy and stability. This work demonstrates that for the majority of components the accuracy is < 5 % (most < 3 %; < 10 % for hexamethylcyclotrisiloxane (D3-siloxane) and 1,2,4-trichlorobenzene – 1,2,4-TCB) with stabilities of > 2 years (> 1 year for acetonitrile, methanol and perfluorotributylamine – PFTBA).
- Article
(1874 KB) - Full-text XML
-
Supplement
(674 KB) - BibTeX
- EndNote


Proton-transfer-reaction mass spectrometry (PTR-MS) is a technique that allows simultaneous measurements of multiple volatile organic compounds (VOCs) in real time (≤ 1 s) with low detection limits (pmol mol−1) and without any sample pre-treatment (Lindinger et al., 1998; Hansel et al., 1999). Most VOCs, with the exception of alkanes with less than five carbon atoms, have proton affinities larger than water (691±3 kJ mol−1) and are therefore detectable with PTR-MS. Also, because most VOCs have proton affinities below 900 kJ mol−1, there is minimal excess energy following proton transfer, resulting in minimal fragmentation. For these reasons it is a very convenient measurement technique for a wide range of applications. Over the last 2 decades PTR-MS has become an important and widely applied tool for VOC measurements that has resulted in major advances in the field of atmospheric sciences (De Gouw and Warneke, 2007; Park et al., 2013; Yuan et al., 2017). It has also been applied in the medical sector for the detection of VOCs to diagnose diseases or disease states (Beauchamp et al., 2013) and in the food and beverage industry for characterizing flavour and odour (Biasioli et al., 2011).
Multiple manufacturers now produce and commercially sell PTR-MS instruments globally that differ in the production and detection of ions including different types of mass spectrometers. Therefore, as its application becomes more widespread and more datasets are generated, there is an increasing need for accurate calibration and measurement comparability. Additionally, as part of the European-funded Aerosols, Clouds and Trace Gases Infrastructure (ACTRIS) project (https://www.actris.eu/, last access: 15 February 2023), there is an interest in establishing PTR-MS as a technique for long-term monitoring of VOCs, which emphasizes the need for a robust metrological infrastructure to control and ensure the quality of data produced by monitoring stations performing these measurements. However, the lack of traceable reference materials to calibrate PTR-MS instruments presents challenges in the pursuit of obtaining comparable results and is an obstacle to long-term studies. Primary reference materials (PRMs) prepared by gravimetry in high-pressure cylinders by national metrology institutes (NMIs) underpin the accuracy (trueness) and comparability of measurement data through traceability to the International System of Units (SI). Traceability has been demonstrated as a critical component for chemical measurements that ensures the comparability, stability, and coherence in measurements providing confidence in measurement results (Brown and Milton, 2007). PRMs produced by NMIs represent the highest point in the traceability chain, and the accuracy and international comparability are ensured through key comparisons organized within the Consultative Committee on Amount of Substance Gas Analysis Working Group (CCQM-GAWG) and in regional comparisons organized within the regional metrology organizations (RMOs), e.g. European Association of National Metrology Institutes (EURAMET) (Europe).
As a result of the numerous VOCs detectable with PTR-MS, it is impractical to have a calibration standard or standards that cover all observable compounds. However, since the conception of PTR-MS, there has been awareness of the potential of this technique to provide quantitative measurements for compounds without the need for specific calibration materials (Hansel et al., 1999). The basis for this is that the amount fraction of compound R ([R]) can be determined from Taipale et al. (2008)
where k is the proton-transfer-reaction rate coefficient, Δt is the reaction time, and I(RH+) and I(H3O+) are the observed ion count rates for the protonated ion of compound R (RH+) and the hydronium ion (H3O+), respectively. T (RH+) and T (H3O+) are the transmission efficiencies for RH+ and H3O+ ions, respectively. The transmission coefficients are predominantly mass-dependent, but they can also vary in time (de Gouw et al., 2003; Ammann et al., 2004; Steinbacher et al., 2004). Proton-transfer-reaction rate coefficients can be measured and/or predicted using quantum methods (Zhao and Zhang, 2004). If specific rate coefficients are agreed on within the community for specific compounds and are widely used, this would negate the role of different rate constants in measurement comparability (Table S1 in the Supplement). The reaction time and observed ion count rates are all measured parameters, leaving just the transmission coefficients as variables required for quantitative measurements without specific calibrations. Cappellin et al. (2012) demonstrated the quantitative properties of one type of PTR-MS instrument by assuming a theoretical transmission based on the duty cycle of the time-of-flight mass analyser. However, for newer-generation instruments that employ advanced ion optics to improve sensitivity, it is necessary to determine the mass-dependent transmission experimentally as the transmission of the system diverges from theory at low masses. Deviations can also occur at high masses due to poor tuning and/or ageing of the ion detection system (Müller et al., 2014).
There are several highly cited publications that explore best practices in PTR-MS measurements (e.g. Blake et al., 2009; de Gouw and Warneke, 2007; Yuan et al., 2017), including methods to calibrate and retrieve the mass-dependent transmission (Taipale et al., 2008). However, many of these methods are slow and labour-intensive, and as a result calibrations and transmission curve retrievals are not performed frequently enough. This has limited the application of PTR-MS to mostly short campaign-scale intensive deployments, and only a few groups have utilized PTR-MS for long-term studies (Holzinger et al., 2006; Taipale et al., 2008). However, recent work by Holzinger et al. (2019) has demonstrated (i) a new method to retrieve the mass-dependent transmission from fast calibrations that should enable more frequent calibrations and (ii) the validity of a simple reaction kinetics approach to quantify measurements of uncalibrated compounds from different PTR-MS instruments with an uncertainty of ≤30 % provided the transmission curve is accurately constrained. A prototype PRM, 0917a reported in this work, was initially developed by the National Physical Laboratory (NPL) and employed for the PTR-MS intercomparison campaign at the Cabauw Experimental Site for Atmospheric Research (CESAR) observatory in the central Netherlands (Holzinger et al., 2019). Following this comparison exercise, improvements to the composition were needed to include additional compounds in the mass-to-charge () 150–400 Th range to provide a more robust retrieval of the mass-dependent transmission.
In this paper, the development and compositional evolution of PRMs and certified reference materials (CRMs) specific to constraining the PTR-MS transmission curve are described, including an evaluation of the accuracy through comparisons validating the gravimetric preparation of various different PRMs of similar composition and an assessment of their long-term stabilities. For details on how to use the reference materials to constrain the PTR-MS transmission curve, the reader is directed to Holzinger et al. (2019).
2.1 Gravimetric preparation of primary reference materials
The PRMs were prepared at four distinct time points (September 2017, December–January 2018, August 2019 and August 2021) and the compositions evolved over this time frame (Table 1) due to improvements in the preparation and validation techniques (e.g. 1,2,4-trichlorobenzene; 1,2,4-TCB) or due to requests from the PTR-MS community for inclusion of new components (e.g. dimethyl sulfide; DMS). All the PRMs were prepared gravimetrically in accordance with ISO 6142-1:2015 (ISO, 2015) from pure components. All pure components were purity analysed in accordance with ISO 19229 (ISO, 2019). Table S2 provides the sources and purities for each component and shows that all chemicals with the exception of perfluorotributylamine (PFTBA) were ≥98 % pure. Table S2 also shows the boiling points and vapour pressures for all the compounds. All the components were liquids at room temperature and pressure, with the exception of propane (gas) and hexamethylcyclotrisiloxane (D3-siloxane; solid). As a solid under room temperature and pressure conditions, D3-siloxane needed to be dissolved into a solvent to enable its addition to the cylinder. Further details are given in the Supplement: “Preparation of D3-siloxane reference materials”.
Table 1Overview of the composition (name, formula, CAS no.) and the protonated monoisotopic molecular ion and any major fragment ions ( [Th]), formed following protonation in H3O+ mode, for 20 compounds included in the PRMs and CRMs and the key comparisons through which the traceability to the international community is derived.
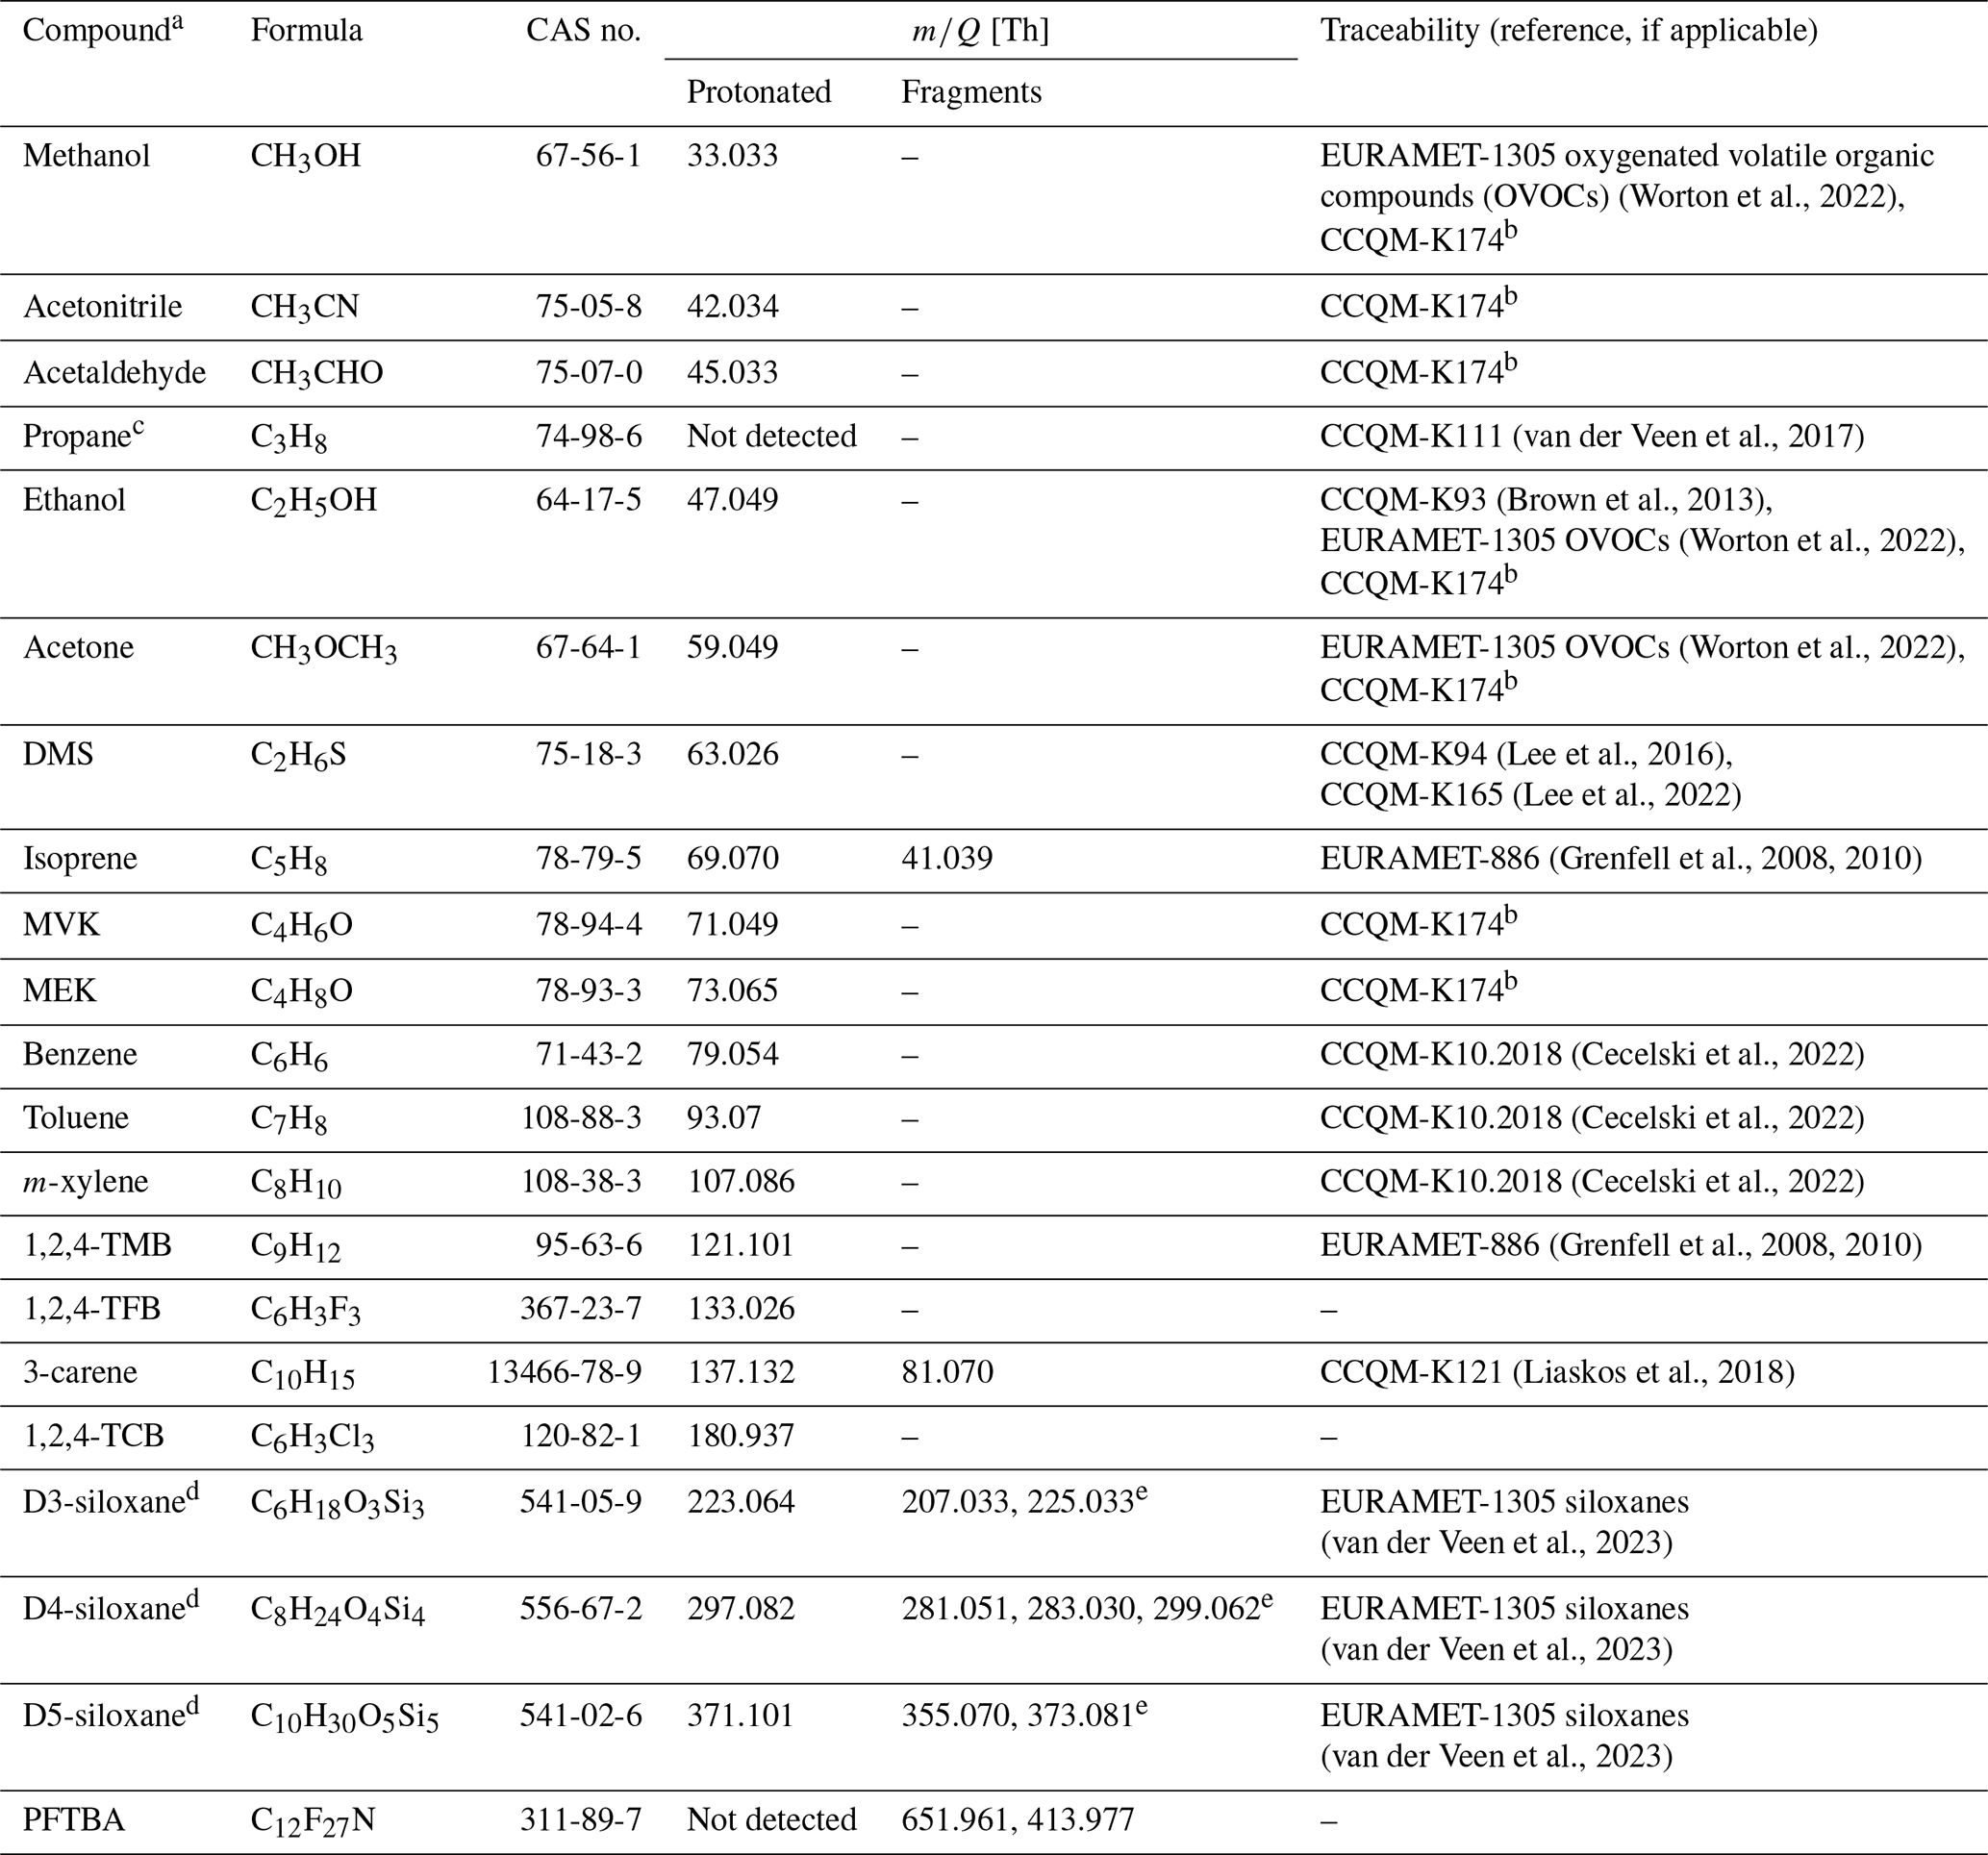
a Short names are shown here, but the preferred IUPAC names are propan-2-one (acetone), (methylsulfanyl)methane (dimethyl sulfide; DMS), 2-methylbuta-1,3-diene (isoprene), but-3-en-2-one (methyl vinyl ketone; MVK), butan-2-one (methyl ethyl ketone; MEK), 1,2,4-trimethyl benzene (1,2,4-TMB), 1,2,4-trifluoro benzene (1,2,4-TFB), 3,7,7-trimethylbicyclo[4.1.0]hept-3-ene (3-carene), 1,2,4-trichlorobenzene (1,2,4-TCB), hexamethylcyclotrisiloxane (D3-siloxane), octamethylcyclotetrasiloxane (D4-siloxane), decamethylcyclopentasiloxane (D5-siloxane), and perfluorotributylamine (PFTBA). b Comparison in progress at the time of publication. c Not detectable in PTR-MS in H3O+ mode but included as an internal standard. d Further information on the mechanisms yielding product ions and fragments in Fig. S4 in the Supplement. e Methyl/hydroxyl group switch.
All the PRMs were prepared in 10 L aluminium cylinders (Luxfer) with a proprietary passivation treatment (Spectraseal™, BOC) and BS341 no. 15 outlet diaphragm valves (Ceodeux). Cylinders were evacuated using an oil-free pump (Scrollvac SC15D, Leybold Vacuum) and a turbo-molecular pump with magnetic bearing (Turbovac 340M, Leybold Vacuum) to a pressure of mbar. Individual compounds were added to the evacuated cylinder via a transfer vessel (capped 3.2 mm diameter tube, with a nominal volume of 1 mL, Swagelok, electro-polished stainless steel). The transfer vessel was weighed against a tare vessel matched for size and shape before and after each addition into the evacuated cylinder (Mettler-Toledo XP2004S). The ultra-high-purity nitrogen balance gas (BIP+, Air Products) was added via direct addition into the cylinder through purged 1.6 mm tubing (Swagelok, electro-polished stainless steel). For the vast majority of the compounds, they were initially produced as binary parent mixtures at amount fractions >10 µmol mol−1 (typically 50 µmol mol−1), though some were produced as ternary or quaternary mixtures containing two or three compounds together in the same parent mixture. A full breakdown of the 50 parent mixtures used to prepare the six PRMs developed in this work is shown in Table 2. Aliquots of each of these parent mixtures were added by direct addition to an evacuated cylinder to produce a final mixture containing all 16 to 20 VOCs at nominal amount fractions of 1 µmol mol−1 in a balance of nitrogen.
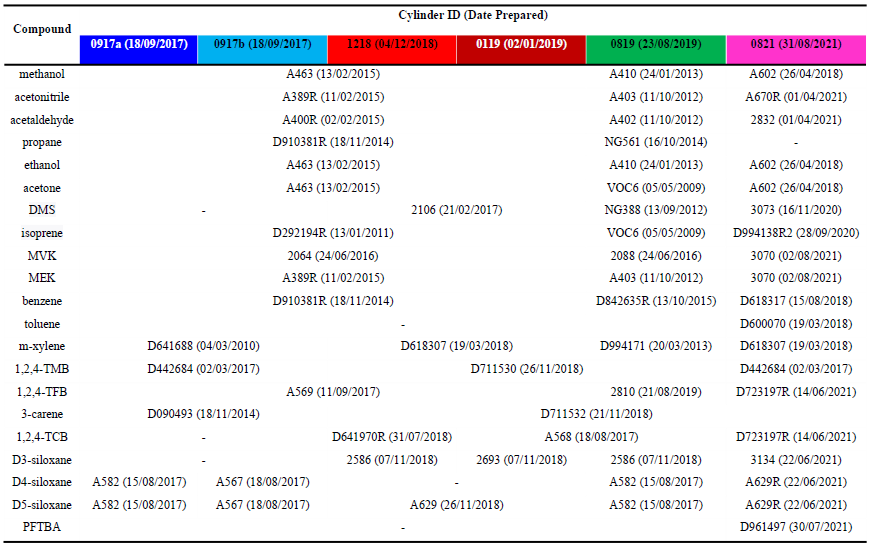
Table 2Composition, hierarchies and parent cylinder IDs (dates prepared) for all components for the six PRMs (0917a, 0917b, 1218, 0119, 0819, and 0821) prepared in this work. The PRMs are identified by the date and year of their preparation (MMYY). As the first two were produced at the same time, the suffixes a and b were added to distinguish them. The colour scheme in the table headers is matched to that used in the figures throughout the paper.
2.2 Analytical methods
To perform the analytical validation, a method was developed on a gas chromatograph (GC; Agilent Technologies 7890) instrument equipped with both a flame ionization detector (FID) and an electron ionization (70 eV) mass spectrometer (Agilent 5975; GC-FID/MS system). Samples were introduced using a six-port two-position valve (VICI) and a fixed sampling loop (1 mL). The column effluent was split into both detectors simultaneously by using a detector splitter plate (Agilent Technologies). Separation was achieved for all components using a DB-624 capillary column (J&W; 75 m × 0.53 mm, df = 3 µm). The carrier gas was helium and the flow was held constant at 5 mL min−1, with a temperature programme starting at 30 ∘C held for 10 min, ramped at 10 ∘C min−1 to 120 ∘C and held for 15 min before a final ramp of 50 ∘C min−1 was applied to a final temperature of 200 ∘C, which was held for a further 10 min. The total run time was 46 min.
Low FID responses for methanol and acetaldehyde presented some analytical challenges because the observed peaks were too small to achieve useable results due to poor reproducibility. As a result, another analytical method was developed on a second GC-FID instrument without an MS (Scion 456; Cryo-GC-FID system) that had a pre-concentration trap (15 cm of 3.2 mm tubing; 1 mL volume) packed with glass beads and cooled with liquid nitrogen that enabled trapping of larger volume samples yielding larger peaks and improved repeatability for both compounds. The pre-concentration trap was held at −185 ∘C for 2 min during sampling prior to being heated to 200 ∘C and back-flushed with carrier gas during the desorption cycle. Separation was achieved using a Rtx-624 capillary column (Restek; 105 m × 0.32 mm, df = 1.8 µm). The carrier gas was hydrogen and the flow rate was held constant at 1 mL min−1, with a temperature programme starting at 30 ∘C held for 5 min, ramped at 25 ∘C min−1 to 200 ∘C with a final hold of 25 min. The total run time was 42 min.
Figure 1 shows the chromatograms obtained from both instruments (Cryo-GC-FID, blue; GC-MS/FID, red) and demonstrates that all the compounds, with the exception of 1,2,4-trimethyl benzene (1,2,4-TMB) and 3-carene, and acetone and DMS, were baseline-separated. The chromatogram in Fig. 1 shows a valley between the 1,2,4-TMB and 3-carene peaks and between the acetone and DMS peaks that provides sufficient separation to obtain robust and repeatable peak areas for all four compounds.
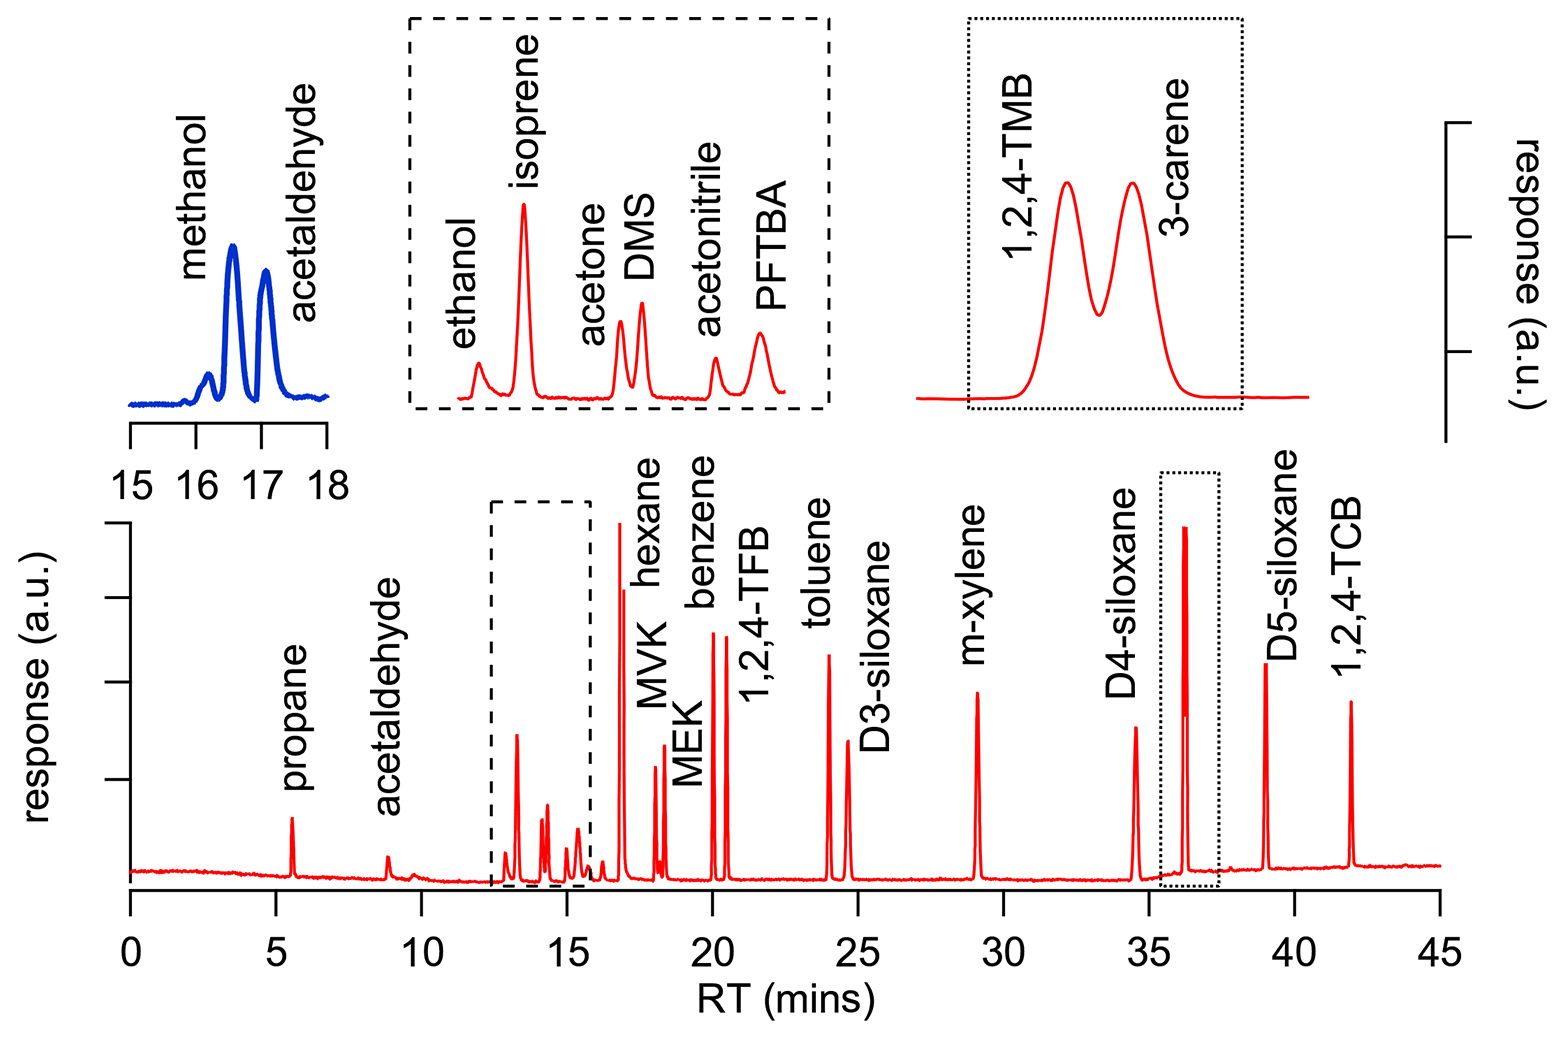
Figure 1Chromatogram of PRM 0819 showing separation of compounds in the GC-FID/MS (red trace) and Cryo-GC-FID (blue trace).
2.3 Stability assessment
The stability of all six PRMs was assessed by tracking the ratios of the FID responses of each component relative to an internal reference that was present in every mixture and that is known to be stable (Rhoderick, 2010; Rhoderick and Lin, 2013; Worton et al., 2022). Propane was originally included as an internal tracer to monitor stability, but as the PTR-MS in H3O+ mode cannot detect this compound, it was replaced by benzene. Benzene is a good internal tracer with a stability of >2 years that has been well demonstrated relative to propane and hexane for this cylinder type at 5 µmol mol−1 with an uncertainty of 0.5 % (Rhoderick et al., 2019). A similar performance would be expected at 1 µmol mol−1 and is demonstrated in this work, albeit with an uncertainty of 1 % (Fig. S1).
All the measurements used for the stability analysis were collected on the same GC-FID/MS instrument, with the exception of methanol and acetaldehyde (Cryo-GC-FID). Both instruments remained unchanged throughout the entire time period of the measurements, which spanned more than 4 years. The observed responses for each compound were corrected for differences in the gravimetric amount fraction and ratioed against the response of the internal reference compound benzene that was present in every mixture. The uncertainties in the observed ratios included uncertainties for the gravimetric preparation and the repeatability of the analyses. The combined standard uncertainties were multiplied by a coverage factor of 2 (k=2) providing a coverage probability of 95 %. The observed ratios were normalized to the average response of all data for that compound to enable comparisons between compounds with different FID responses. For this analysis the data for all six PRMs were considered together to enable an understanding of stability across a longer time period than would be possible for a single PRM. Least-square-fit straight-line regressions were modelled to the temporal evolution of the data to determine whether there was any statistically significant change in the amount fraction of any of the compounds in the PRMs. The slopes from these regression analyses were evaluated with an analysis of variance (ANOVA) test using the “StatsLinearRegression” function in IGOR pro 8.04 (Wavemetrics) (Zar, 1999; Snedecor and Cochran, 1989) to determine whether they were significantly different to zero using an F test, i.e. no drift in amount fraction during the measurement period (F<Fc).
2.4 Validation approach
Five PRMs (0917a, 0917b, 1218, 0119, 0819, and 0821) were validated against PRM 0819, with the exception of PFTBA and toluene, which were only present in the most recent PRM (0821). PRM 0819 was used as the reference for all the validations because the parents used for the preparation of this mixture were deliberately different from all other mixtures with the explicit goal of enabling the most robust validation. All the compounds were analysed on the GC-FID/MS system, with the exception of methanol and acetaldehyde (Cryo-GC-FID). Toluene was validated by comparison against an existing PRM containing BTEX (benzene, toluene, m-xylene, p-xylene and o-xylene) components that was prepared gravimetrically at NPL in 2018 and had been independently validated against other PRMs that were internationally compared as part of the NPL's participation in key comparison CCQM-K10.2018 (Cecelski et al., 2022). These BTEX PRMs are known to be stable for more than 5 years, and at the time of the comparisons the BTEX PRM was less than 3 years old. PFTBA was validated against the gravimetric data used to make two independent certified reference materials. The majority of the validation work took place between September and December 2020, with one in 2019 and 2022, respectively, and three in 2021 (Table S3). As such there is an influence of stability on the validation data as the PRMs differed in age at the time of validation.
Each comparison was conducted by running the PRMs (0917a, 0917b, 1218, 0119, and 0821) against PRM 0819 in a repeating alternating pattern, (AB)nA, where A represents PRM 0819 and B one of the other PRMs (j) and with the number of repeats ranging between 3 and 5 (n=3 to 5). The ratio in the response was determined by dividing B by the average response of the As immediately before and after each analysis of B. The average ratio was calculated for each compound based on the number of repeats along with the associated standard deviation. The assigned analytical value for compound i in PRM j ( was calculated by multiplying the average ratio by the gravimetrical amount fraction (xs,i) of compound i in PRM 0819. The relative difference (Δx) between the assigned analytical value and the gravimetric value of compound i in PRM j was calculated from
The uncertainty in the relative difference combined the standard uncertainty in the repeatability in the analysis with the gravimetric uncertainty. The combined standard uncertainty was multiplied by a coverage factor of 2 (k=2) providing a coverage probability of 95 %.
3.1 Composition
The PTR-MS transmission curve reference material contains 20 different VOCs that span a wide range of molecular masses, boiling points, vapour pressures (Table S2) and functional group classes including alcohol, aldehyde, ketone, alkene, aromatic, halocarbon and siloxane (Table 2). With the PTR-MS technique, most VOCs are entirely detected at their protonated mass as well as a few compounds that fragment during protonation (e.g. monoterpenes, siloxanes, and isoprene; see Table 1). The compounds were chosen by considering the needs of the PTR-MS user community to cover the full range of mass-to-charge ratios () encountered, their low fragmentation following proton transfer and because many are of relevance in atmospheric measurements, which was the initial intended target end-user group. Other compounds were included as a consequence of the preparation method, which is the case for n-hexane, which is present as the solvent for D3-siloxane, and propane, which was present in one of the parent mixtures and was originally included as an internal tracer to monitor stability. The composition evolved over time, as shown in Table 2, with DMS, 1,2,4-TCB, D3-siloxane, toluene and PFTBA being added at different times and propane being removed in the final iteration. For D4-siloxane there was a preparation error, and it was not added to either PRM 1218 or 0119.
An amount fraction of nominally 1 µmol mol−1 in a balance gas of nitrogen was selected as a compromise between preparation complexity and mixture stability. This amount fraction enabled many components to be prepared from parent mixtures of higher amount fractions (≥10 µmol mol−1), which substantially simplifies the preparation process. This amount fraction also provided a reasonable starting point for the stability of the wide range of function groups present in the mixture, some of which are known to have more limited stability at lower amount fractions (nmol mol−1) (Allen et al., 2018).
3.2 Traceability to the SI
Traceability of the primary realizations to the international community through CCQM key comparisons or regional EURAMET comparisons provides confidence in the accuracy of the amount fractions for all components. SI traceability is important for underpinning long-term measurements as it provides a stable anchor point with which to reference all measurements. Table 1 shows which comparisons underpin the traceability for each of the different components. All the components are underpinned by at least one CCQM or EURAMET comparison, with the exceptions of 1,2,4-TFB, 1,2,4-TCB, and PFTBA, for which there are currently no existing relevant comparisons.
3.3 Hierarchies
Table 2 shows all the parent mixtures and their preparation dates used to prepare all six PRMs (0917a, 0917b, 1218, 0119, 0819, and 0821), and in total 50 different parent mixtures were used. In general, parent mixtures were similar for PRMs 0917a, 0917b, 1218, and 0119 but were different to PRMs 0819 and 0821, providing independence and thus confidence in the validation work and in the preparations. There were a few exceptions. For m-xylene the parent used for PRMs 1218 and 0119 was the same as PRM 0821 but was different to 0917a, 0917b, and 0821. For 1,2,4-TMB only two parent mixtures were used, one for 0917a, 0917b, and 0821 and another for 1218, 0119, and 0819. For 3-carene only two parents were used, one for 0917a and 0917b and another for 1218, 0119, 0819, and 0821. For D3-siloxane three parents were used, one for 1218 and 0819, one for 0119, and another for 0821.
3.4 PRM validation
Figure 2 shows the relative differences (Δx) determined from Eq. (1) for all the compounds using all the validation data obtained from the 13 comparisons outlined in Table S3. In the majority of cases PRM 0819 was used as the reference to which all the others are compared. It was chosen as such because at that time it was the newest PRM to be produced and was used to benchmark all the others that had already been made. Thus, PRM 0821 was also referenced to PRM 0819 to provide a link between all six PRMs. All the data shown in Fig. 2 are the FID data from the GC-MS/FID instrument, with the exception of acetonitrile (MS data from the GC-MS/FID instrument), methanol, and acetaldehyde (FID data from the Cryo-GC-FID instrument). The MS data are used for acetonitrile because the FID data show a larger variability, which is likely attributed to the co-elution of an impurity in the FID that was present at different amount fractions in the different PRMs, but we do not have conclusive evidence to support this, and additional work is needed for confirmation. This variability is not observed in the MS data, providing better precision (Fig. S2).
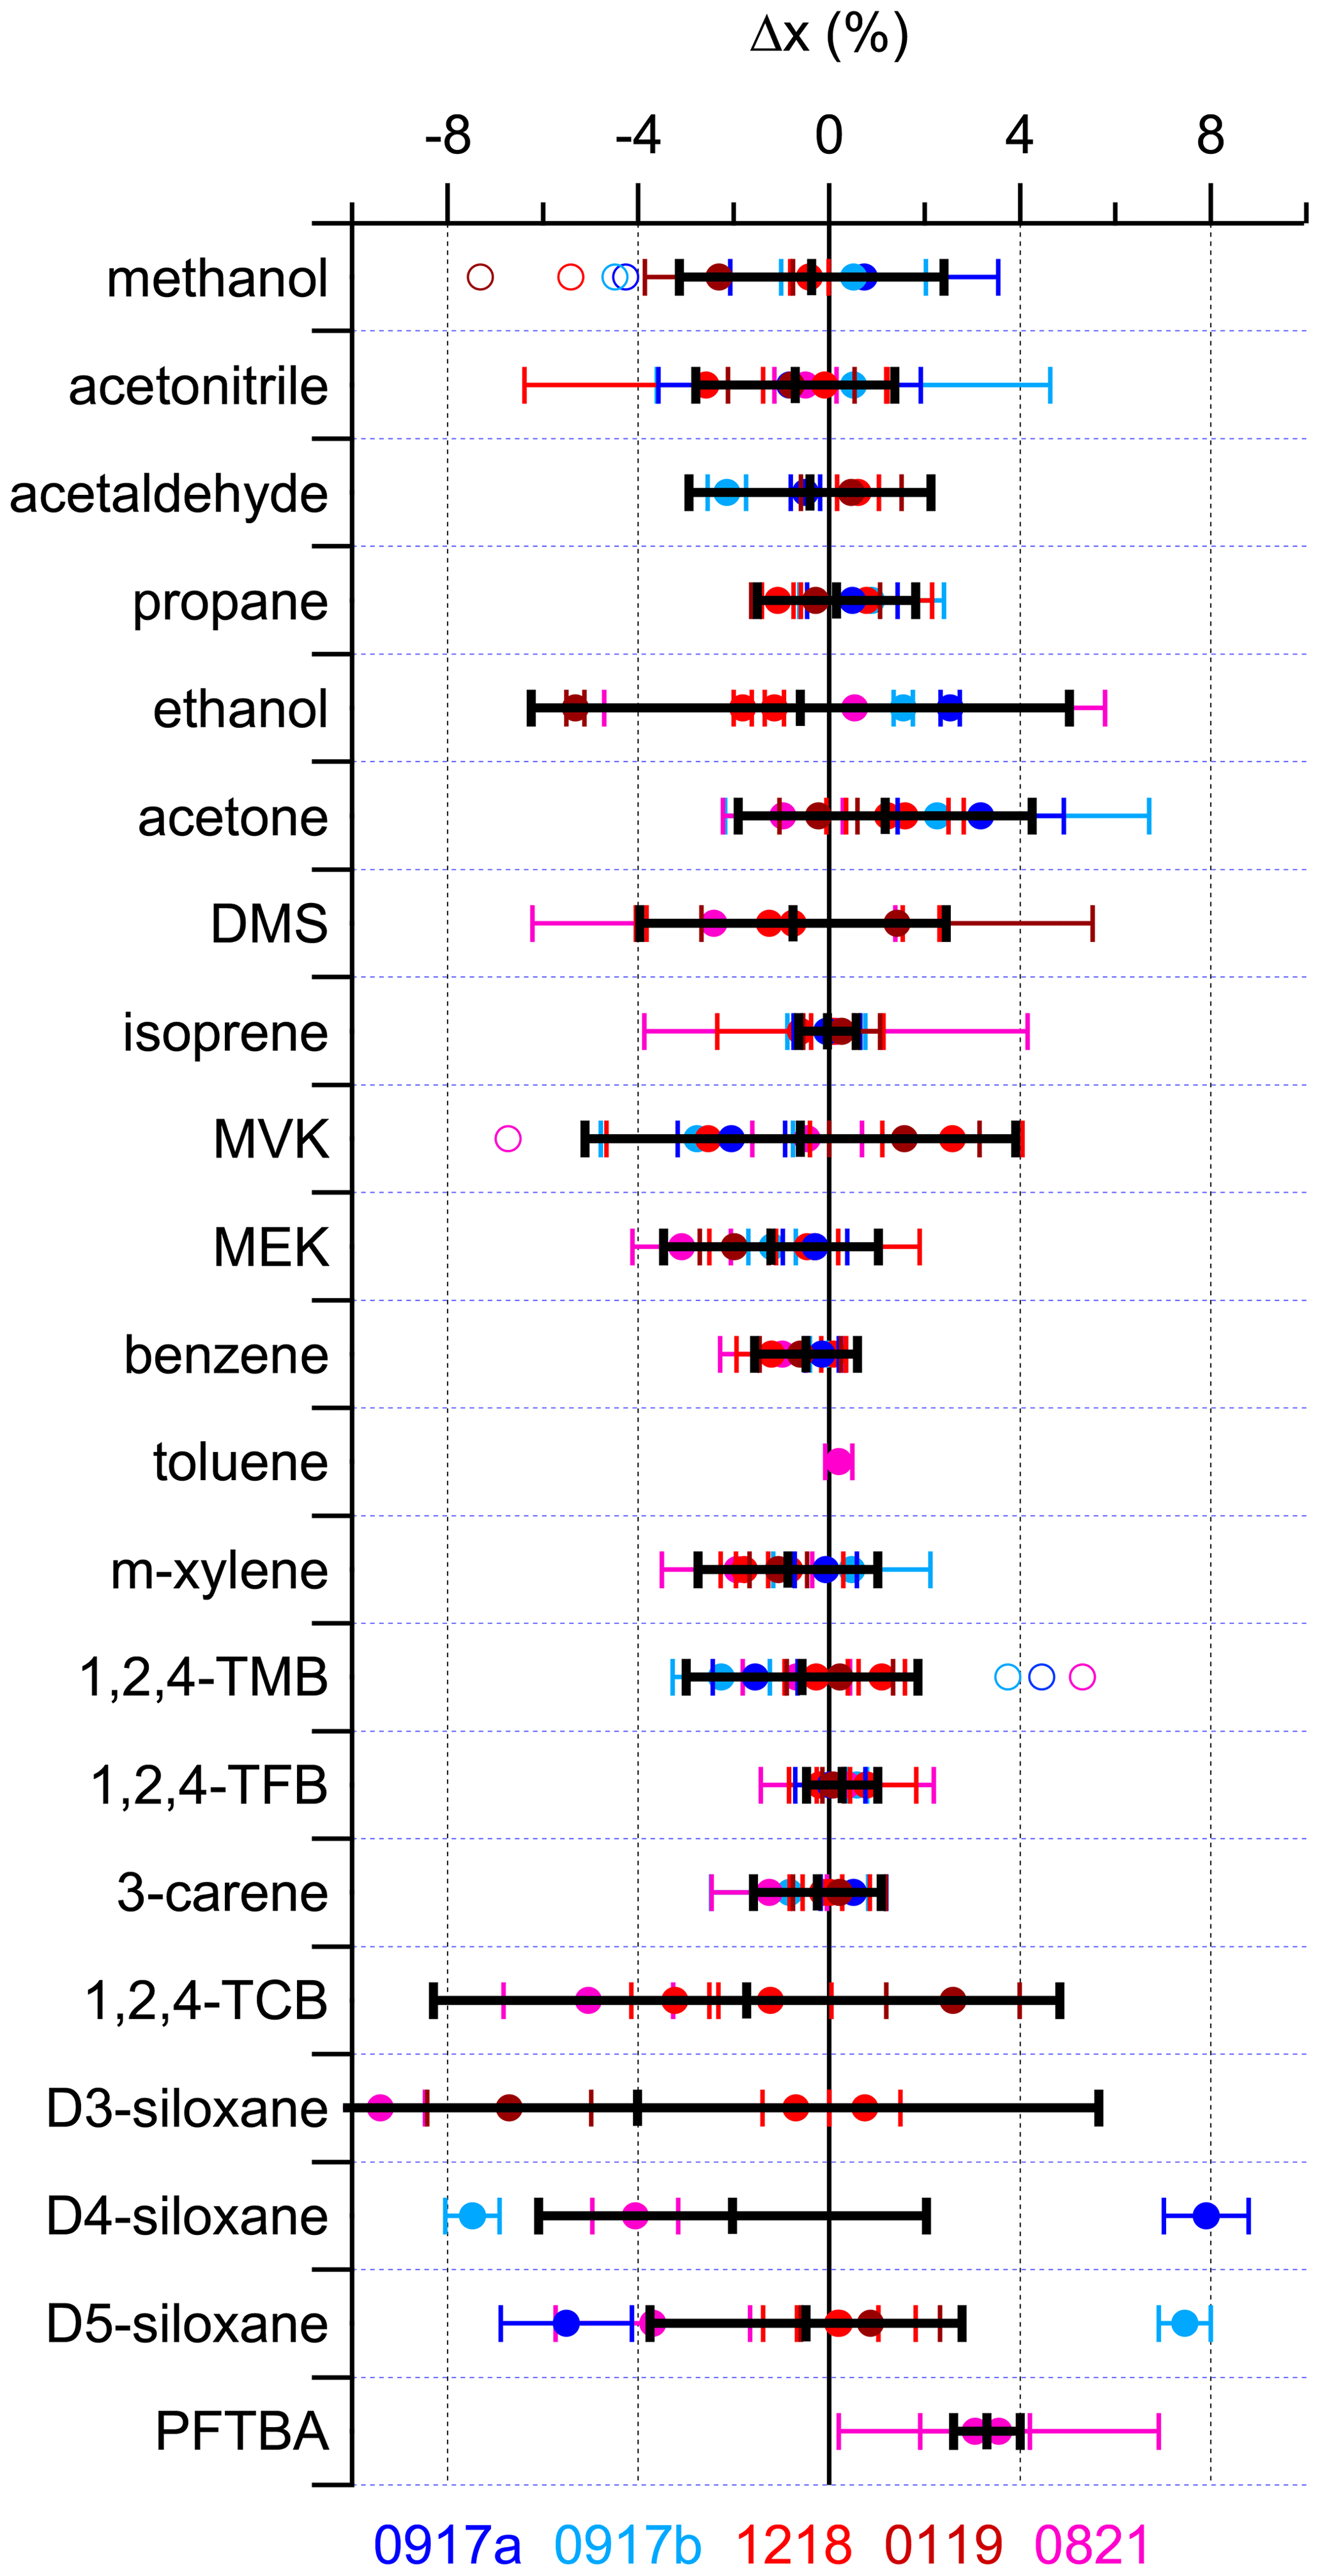
Figure 2Relative difference (Δx) using the FID data (except acetonitrile, which uses the MS data) for all components in five of the PRMs (0917a, 0917b, 1218, 0119 and 0821) relative to PRM 0819 (solid symbols). The solid black line represents the average of these validations, with the error bar representing the associated expanded uncertainty (2σ). For D4- and D5-siloxane, the averages do not include the validations from 0917a or 0917b. Methanol and acetaldehyde data are from the Cryo-GC-FID instrument, while all others are from the GC-FID/MS instrument. Open symbols represent the original data before correcting for biases observed in three of the parent mixtures (A410, 5 % low for methanol; 3070, 6.3 % low for MVK; D711530, 6 % low for 1,2,4-TMB). PFTBA and toluene were only included in the most recently prepared PRM (0821) and are not present in 0819. Their validation is described in the text. Supporting validation data from all the MS and FID measurements are shown in Fig. S2.
In general, the data from Fig. 2 could be split into three groups. The first group consisted of propane, isoprene, benzene, toluene, 3-carene, methanol, acetonitrile, acetaldehyde, m-xylene, 1,2,4-TMB, and methyl ethyl ketone (MEK), where the spread in the validation data is within 3 %, and these represent components where the NPL had substantial prior experience. The second group is acetone, DMS, methyl vinyl ketone (MVK), and PFTBA, where the spread in the validation data is within 5 %, and these are relatively new components where capabilities were developed more recently. Recognizing the challenges in preparing PRMs containing siloxanes as a result of their lower vapour pressures and observing the recent improvements in preparation since 2019, the D4-siloxanes and D5-siloxanes can also be categorized as group 2 after excluding the earliest parent preparations used for 0917a and 0917b in 2017, which are inconsistent with more recent work as part of the EURAMET-1305 siloxane comparison (van der Veen et al., 2023). The final group is comprised of D3-siloxane and 1,2,4-TCB, where the spread in validation data is within 10 %, and these compounds represent those which are the most challenging to prepare as a result of either unique phase transition properties or low vapour pressures, respectively. There is an observable bias of about 8 % between two groups of mixtures: one group is 1218 and 0819 and the other is 0119 and 0821. This reflects differences between the parent mixtures (2586, 2693, and 3134) that resulted from the challenges in preparation. Ethanol also sits with this group, in part due to the small size of the peak observed in the GC-MS/FID instrument and because of what looks like an outlier (0119), suggesting some potential losses during preparation that were unique to this one PRM.
Table 3Summary of the results of the least-squares straight-line regression analysis for all stability data shown in Figs. 3 and S2. Results are shown for the slope (±2σ), intercept (±2σ), ANOVA test statistics (F and Fc) used to evaluate the presence of a statistically significant trend (F>Fc), the calculated annual drift (±2σ) determined from the linear fit, and the average of the validation data (±2σ), also shown in Fig. 2.

a The GC-FID data for methanol and acetaldehyde were too small to be quantified, so these data are from the Cryo-GC-FID data and are limited. b Benzene stability was determined relative to isoprene. c Toluene and PFTBA were only included in the most recent PRM, so the assessment of stability is limited in its duration to only 200 d. d There was a clear bias between several of the PRMs caused by differences in the parent mixtures used, so the trends were fitted to the two obvious groupings. e Data from 0917a and 0917b were excluded from the regression analysis.
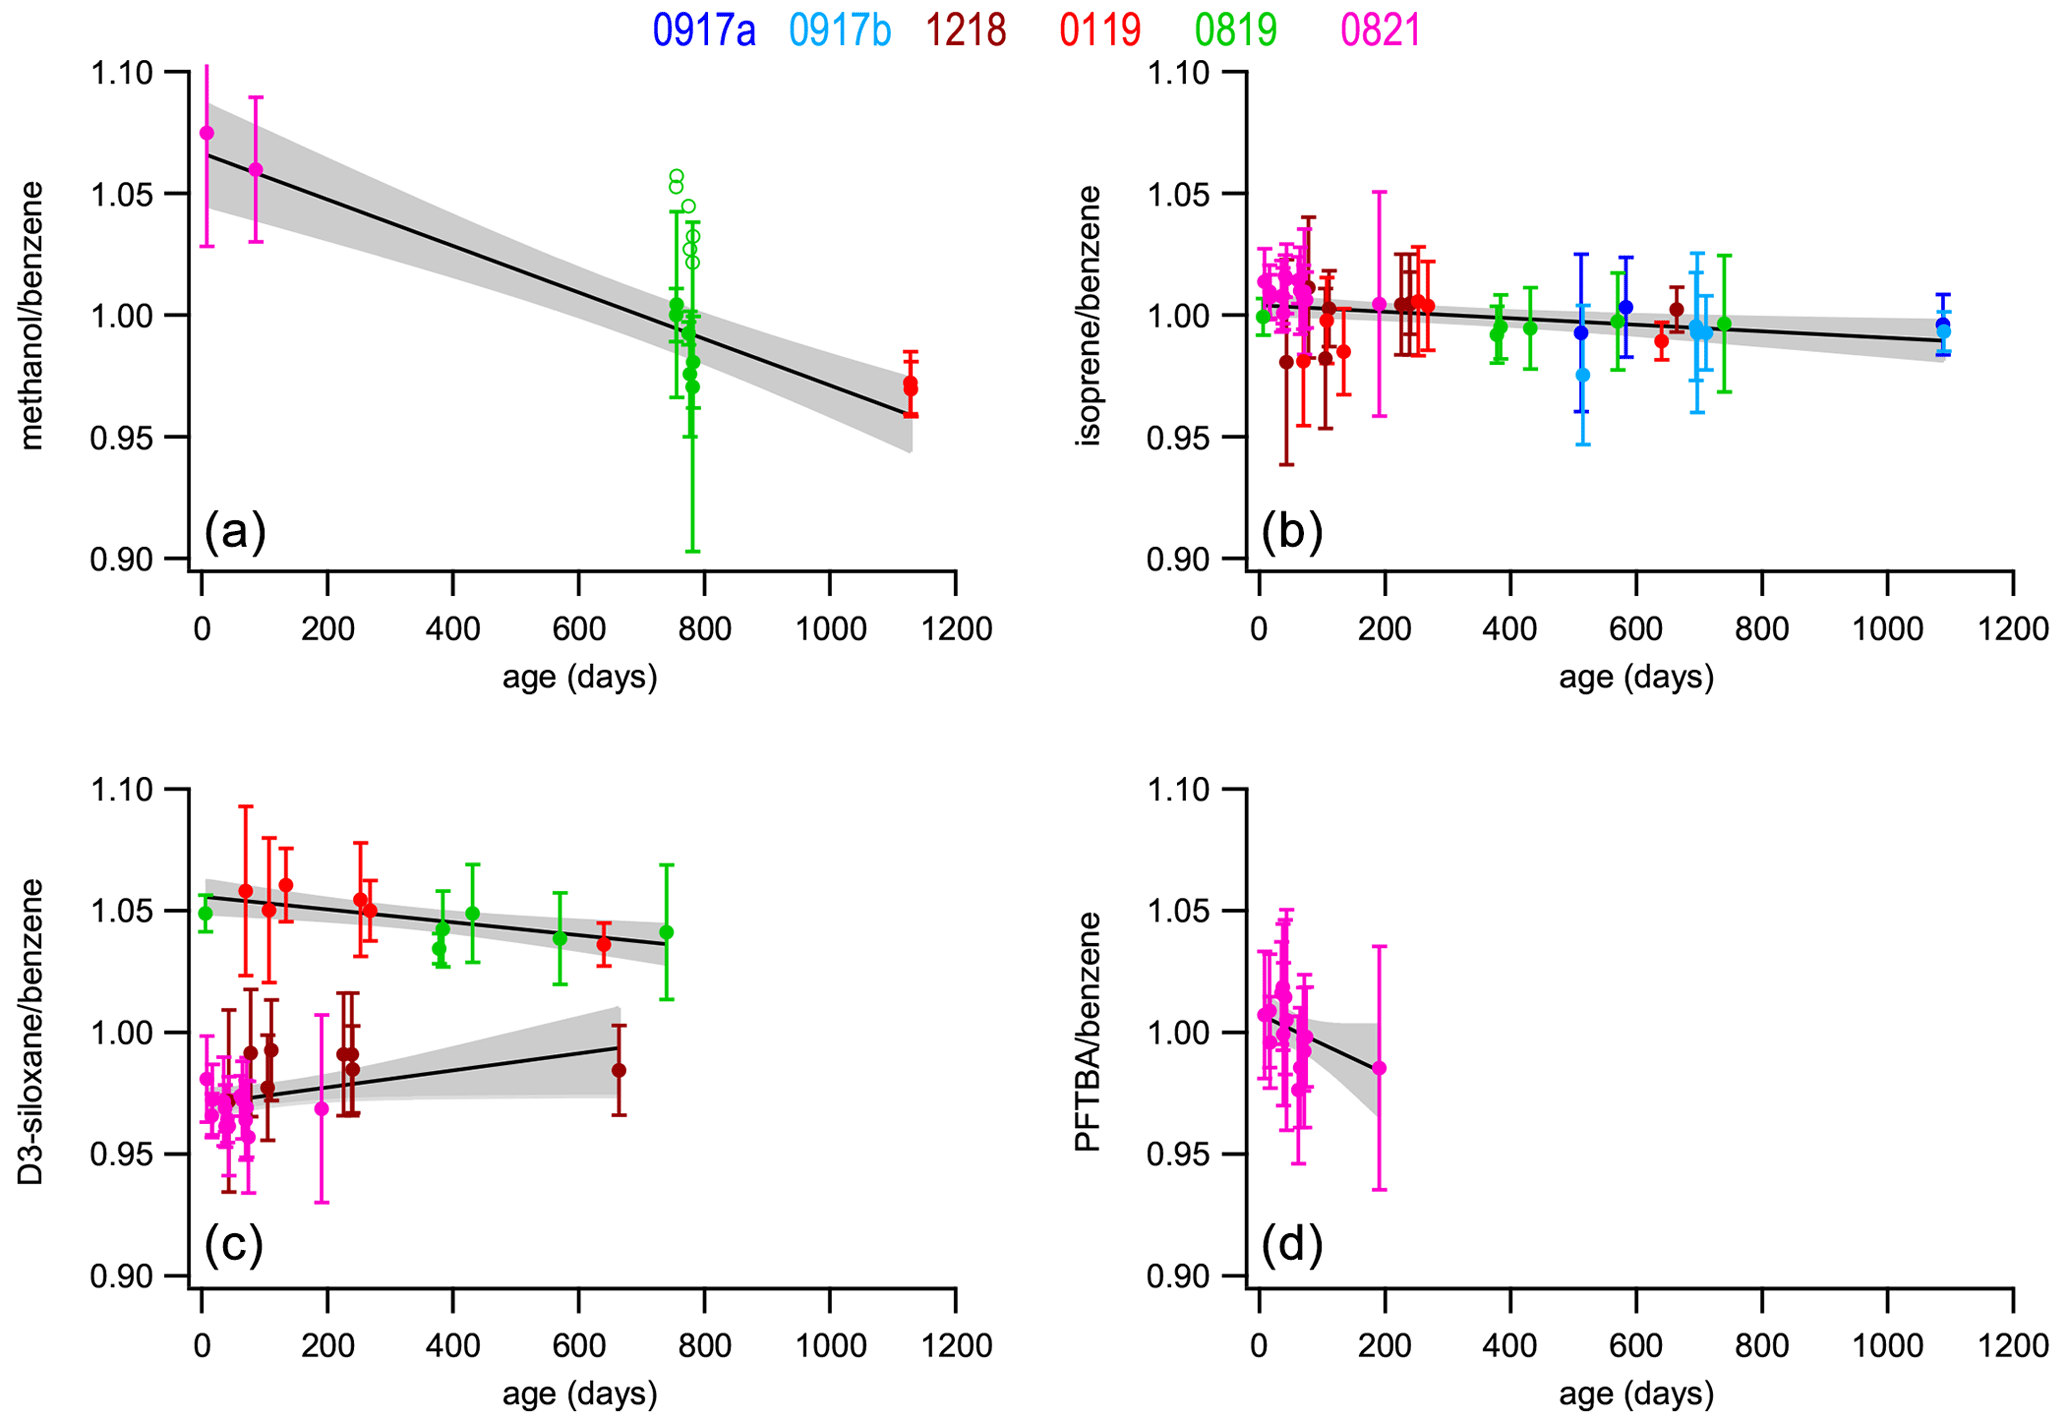
Figure 3Stability of the normalized response with time for four selected compounds relative to benzene, methanol (a), isoprene (b), D3-siloxane (c), and PFTBA (d) for all six PRMs (solid symbols). The open symbols (methanol; top left) show the original data before being corrected for an observed 5.0 % bias in the parent mixture (A410). The best-fit curves from least-squares straight-line regression analyses are shown (solid black line) along with the 95 % confidence interval of the fits (shaded area). The slope, intercept, and F-statistic data from the regression analyses are shown in Table 3. Stability plots for all the compounds are shown in Fig. S1.
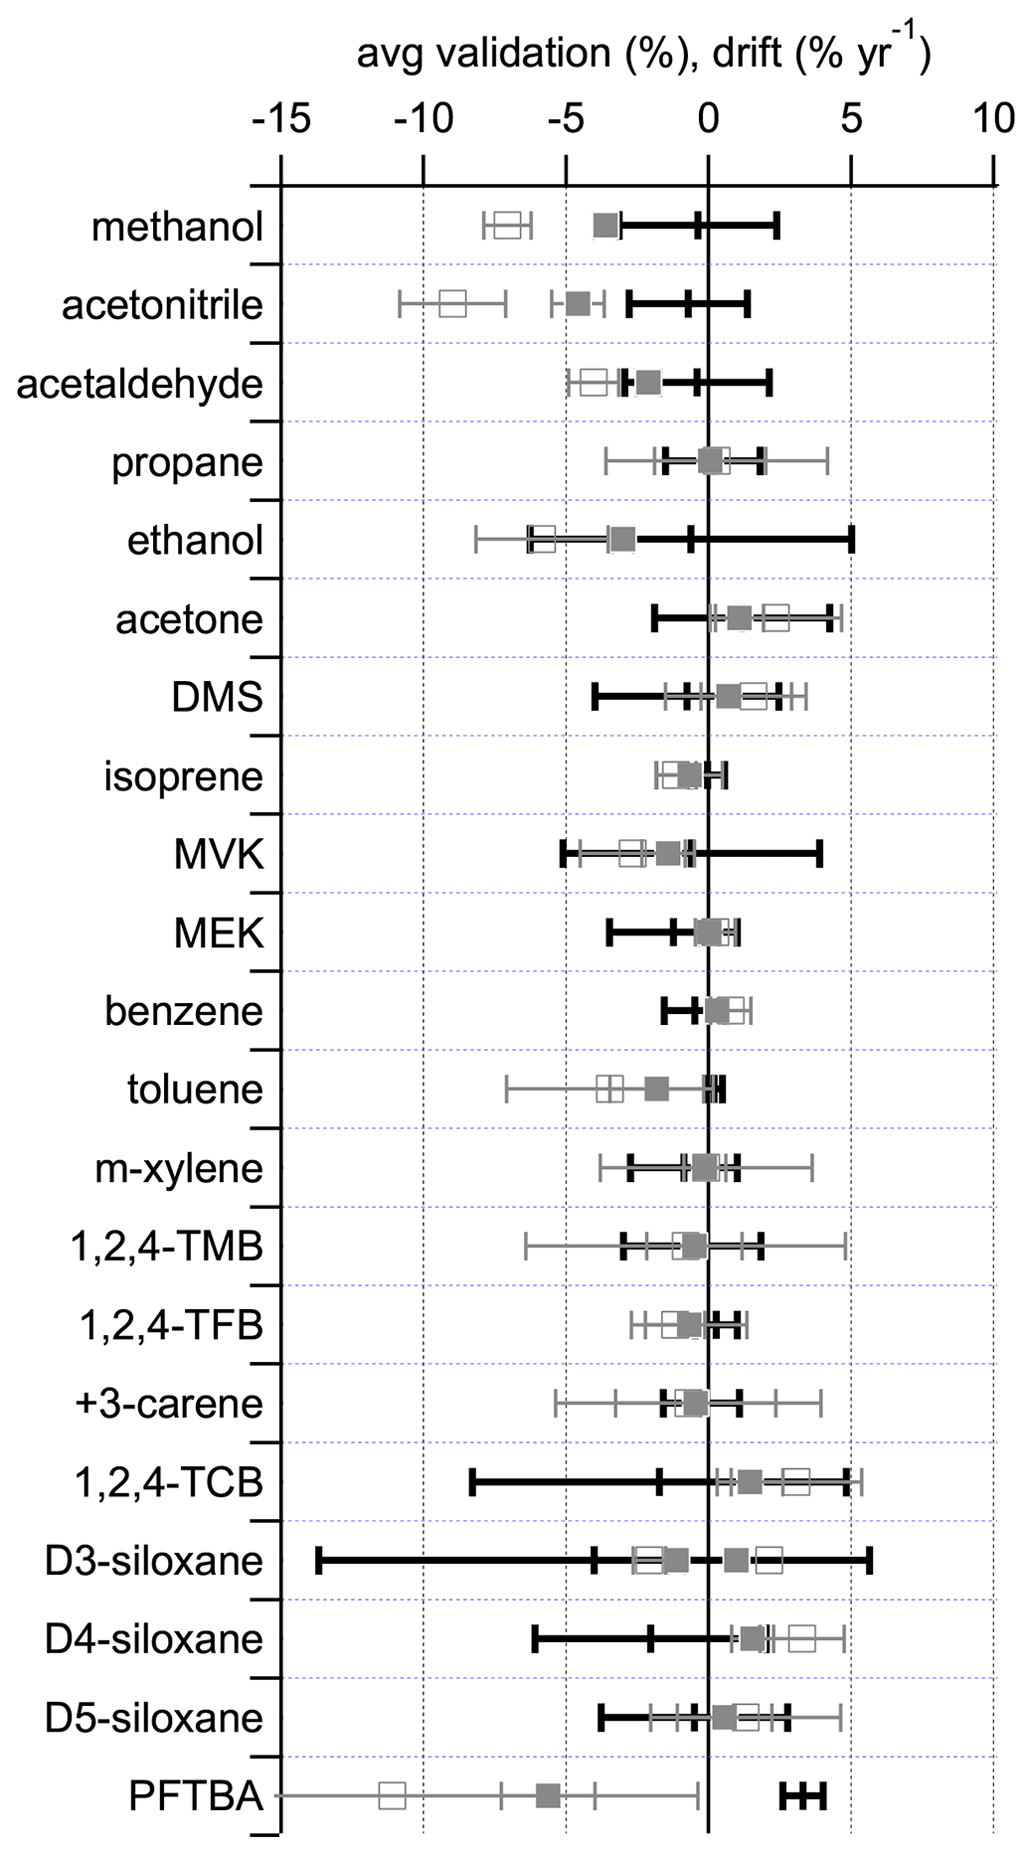
Figure 4Comparison of 1-year (filled grey squares) and 2-year (open grey squares) drift rates, calculated from the data in Table 3, with the average validation data (black bars) taken from Fig. 2. For D3-siloxane there are two data points for the drift corresponding to the two regressions shown in Table 3. The error bars represent the associated expanded uncertainties, representing the 95 % confidence limit.
All the FID and supporting MS data for all the compounds are shown in Fig. S2. No MS data were available for toluene, 1,2,4-TCB, or PFTBA because the relevant single ions had not been included in the MS single ion monitoring method at the time of analysis and methanol, where the MS signal was too small to provide a reliable response. Figure S2 shows very good agreement between the FID and MS validation, with all the components agreeing within the uncertainties, providing confidence in the validation results.
In addition to the observed bias in parent mixtures for D3-siloxane, three other parent mixtures were also discovered to be biased after re-analysis. The observed differences have been corrected for in Figs. 2 and S2. For methanol, one parent (A410) was confirmed to be 5.0 % high relative to the other parents (A463, A540, and A602). For MVK, one parent (3070) was confirmed to be 6.3 % low relative to the other parents (2064 and 2088). For 1,2,4-TMB, one parent, D711530, was confirmed to be 6.0 % low relative to D442684 and other in-house standards of 1,2,4-TMB not used in this work but used to prepare 30-component ozone precursor mixtures at the NPL (Grenfell et al., 2010).
3.5 CRM validation
To enable a more cost-effective and timely delivery to end users, a CRM was also developed. In contrast to the PRMs, the CRMs are not prepared by gravimetry but by the direct addition of multi-component mixtures derived from the original pure liquids. Further details of the preparation method are given in the Supplement text “Preparation and validation of certified reference materials”. The amount fractions for the components in the CRMs were assigned through analytical comparisons between each CRM and one or more of the PRMs. In this way, preparation is quicker and more cost-effective while maintaining the integrity of the values and their traceability. An additional advantage of the CRMs is that because the solid D3-siloxane is dissolved in the other components, no n-hexane is used, which avoids any potential interferences from the presence of reagent ions other than H3O+ like O and NO+. Initially with the developed CRM preparation method it was possible to produce mixtures that had blend tolerances of 20 %–30 % (Fig. S3), which are suitable for end users, but work is continuing to improve this with the aim of achieving better than 10 % blend tolerances in the near future. The blend tolerances are just an indication of the repeatability of the preparation process and do not reflect the uncertainties in the assigned value, which are between 3 % and 10 % (compound-dependent). These uncertainties were dominated by the observed differences between the PRMs.
3.6 Stability
Figure 3 shows stability data for four selected compounds: methanol, isoprene, D3-siloxane, and PFTBA. These were selected as representative examples of the different observed stability behaviours, although the stability data plots corresponding to all the compounds are shown in Fig. S1. The trend lines from the least-square-fit straight-line regressions shown in Figs. 3 and S1 were used to determine the annual drift rates shown in Table 3 and Fig. 4. From the ANOVA test there are statistically significant trends (F>Fc) for 10 of the compounds (methanol, acetonitrile, acetaldehyde, ethanol, acetone, DMS, isoprene, MVK, benzene, D3-siloxane), but these trends are small (< 2 % yr−1), except for methanol, acetonitrile, and PFTBA.
Methanol and acetaldehyde were the only two components that were measured on the Cryo-GC-FID, and hence the datasets are more limited. A result is that there is no overlap between the three PRMs, so any systematic differences between them may result in an artificial bias, which may exacerbate any stability trend. More work is needed to confirm this. The stability data for D3-siloxane reflect the observed validation bias and show two clear trends: one for 1218 and 0819 and the other for 0119 and 0821. For the regression analysis and drift calculations, these have been treated independently (Table 3).
All the compounds, with the exceptions of methanol, acetonitrile, and PFTBA, show trends similar to isoprene with good stability and annual drift rates of < 3 % yr−1 (Table 3). For acetonitrile the large spread in validation data (FID data; Fig. S2) leads to a noisy stability dataset that may play a role in the larger observed drift rate or this component maybe being less stable. As PFTBA was only included in the last PRM (0821), the stability data only represent about half a year, and extrapolating the current trend to 1 and 2 years results in a drift rate that is not accurate as interpolation of the data would suggest no statistical change in amount fraction and minimal drift. More data are needed to confirm the longer-term stability behaviour of PFTBA.
Given the age differences between the different PRMs at the time of validation (233–709 d; Table S2), it is not possible to deconvolute the contributions of stability and preparation to the observed validation differences. However, Fig. 4 shows that for the majority of compounds there is good agreement between the observed average validation data and the calculated drift for over 1–2 years, with the exceptions of methanol, acetonitrile, and PFTBA, which differ for the reasons discussed previously. These observations are consistent with the age differences of the different PRMs at the time of validation, indicating that stability was likely the major driver between the observed validation differences.
In this work the development of new SI-traceable primary reference materials (PRMs) and certified reference materials (CRMs) for constraining the mass-dependent transmission curve of PTR-MS instruments has been described along with an evaluation of the validation and stability of the PRMs and the repeatability in preparation (blend tolerances) for the CRMs. Six of these PRMs have been prepared to date from a suite of 50 parent mixtures, and these have been used to value-assign more than 10 CRMs that have been disseminated to end users. In general, there is evidence of very good agreement for the majority of the components, which supports the robustness of the preparation and 2 years of stability. Challenges were observed in preparation for the least volatile compounds, especially for D3-siloxane, due to it being a solid at room temperature and pressure. More work is needed to better describe the long-term stability of methanol, acetonitrile, and PFTBA. This work highlighted several challenges in analysis that could be resolved by the development of a new analytical method utilizing a single instrument equipped with both a pre-concentration trap and a dual-detector set-up (MS and FID). This work demonstrates what is currently possible with respect to composition, amount fraction, uncertainty, and stability and provides an important reference to which other gas standards that are in use with the PTR-MS can be compared and benchmarked to verify their accuracy to further improve the comparability of PTR-MS measurement data.
In the short term (next 5 years), the implementation of an SI-traceable transmission curve reference material, such as the one described in this work using a method similar to that described in Holzinger et al. (2019), is the most pragmatic approach to directly address improving the accuracy of quantitation and comparability between different PTR-MS instruments and users. This reflects the challenges and complications of rapidly developing a universally accepted calibration system based on pure liquids that is SI-traceable. The use of an SI-traceable reference material to properly constrain the transmission curve provides a readily applicable framework to ensure confidence in temporal and spatial data to support the use of PTR-MS in a broad range of application areas. The use of the transmission curve reference material approach should be seen as a pre-requisite and a complement to additional future efforts to provide alternative calibration efforts for specific target compounds where uncertainties of better than 30 % are needed. Alternative approaches would certainly be necessary for those compounds that are unsuitable for inclusion in high-pressure gas standards, possibly as a result of very low vapour pressures or other complicating factors such as chemical compatibility with other compounds.
Future work to improve the uncertainty of individual components that have the greatest influence on the transmission curve fit would have the biggest influence on the accuracy and repeatability of the transmission curve retrieval, thereby maximizing the impact of future improvements for the PTR-MS user community. For PTR-MS instruments that utilize time-of-flight mass spectrometers, the focus would be on improving the uncertainty of the largest molecular weight components, specifically the D3-, D4-, and D5-siloxanes and 1,2,4-TCB, which represent the greatest challenges in preparation due to their low vapour pressures.
All data used to produce the figures in this paper are available on request.
The supplement related to this article is available online at: https://doi.org/10.5194/amt-16-1061-2023-supplement.
DRW and RH conceptualized the work. DRW processed the data, produced the figures and tables, and wrote the paper. RH provided inputs to define the composition of the PTR-MS reference material and contributed to the writing of the paper. SM developed novel methods for the preparation of primary and certified reference materials, planned and prepared all the reference materials, conducted all the validation and stability data collection, and contributed to the writing of the paper. KOD contributed to the preparation of the reference materials, reprocessed some of the stability data, and worked with SM to prepare the certified reference materials. All the authors reviewed the paper.
The contact author has declared that none of the authors has any competing interests.
Publisher’s note: Copernicus Publications remains neutral with regard to jurisdictional claims in published maps and institutional affiliations.
The NPL was funded by the Department of Business Energy and Industrial Strategy (BEIS) National Measurement System. Rupert Holzinger was funded by the European Metrology Programme for Innovation and Research (EMPIR) programme (grant no. 19ENV06 MetClimVOC), co-financed by the Participating States, and by the European Union's Horizon 2020 research and innovation programme (ACTRIS-2) under grant agreement no. 654109.
This paper was edited by Hendrik Fuchs and reviewed by Wiebke Scholz and one anonymous referee.
Allen, N. D. C., Worton, D. R., Brewer, P. J., Pascale, C., and Niederhauser, B.: The importance of cylinder passivation for preparation and long-term stability of multicomponent monoterpene primary reference materials, Atmos. Meas. Tech., 11, 6429–6438, https://doi.org/10.5194/amt-11-6429-2018, 2018.
Ammann, C., Spirig, C., Neftel, A., Steinbacher, M., Komenda, M., and Schaub, A.: Application of PTR-MS for measurements of biogenic VOC in a deciduous forest, Int. J. Mass Spectrom., 239, 87–101, https://doi.org/10.1016/j.ijms.2004.08.012, 2004.
Beauchamp, J., Herbig, J., Dunkl, J., Singer, W., and Hansel, A.: On the performance of proton-transfer-reaction mass spectrometry for breath-relevant gas matrices, Meas. Sci. Technol., 24, 125003, https://doi.org/10.1088/0957-0233/24/12/125003, 2013.
Biasioli, F., Gasperi, F., Yeretzian, C., and Märk, T. D.: PTR-MS monitoring of VOCs and BVOCs in food science and technology, TrAC-Trend. Anal. Chem., 30, 968–977, https://doi.org/10.1016/j.trac.2011.03.009, 2011.
Blake, R. S., Monks, P. S., and Ellis, A. M.: Proton-Transfer Reaction Mass Spectrometry, Chem. Rev., 109, 861–896, https://doi.org/10.1021/cr800364q, 2009.
Brown, A. S., Milton, M. J. T., Brookes, C., Vargha, G. M., Downey, M. L., Uehara, S., Augusto, C. R., Fioravante, A. d. L., Sobrinho, D. G., Dias, F., Woo, J. C., Kim, B. M., Kim, J. S., Mace, T., Fükö, J. T., Qiao, H., Guenther, F., Rhoderick, J., Gameson, L., Botha, A., Tshilongo, J., Ntsasa, N. G., Val'ková, M., Durisova, Z., Kustikov, Y., Konopelko, L., Fatina, O., and Wessel, R.: Final report on CCQM-K93: Preparative comparison of ethanol in nitrogen, Metrologia, 50, 08025–08025, https://doi.org/10.1088/0026-1394/50/1a/08025, 2013.
Brown, R. J. C. and Milton, M. J. T.: Developments in accurate and traceable chemical measurements, Chem. Soc. Rev., 36, 904–913, https://doi.org/10.1039/b507452p, 2007.
Cappellin, L., Karl, T., Probst, M., Ismailova, O., Winkler, P. M., Soukoulis, C., Aprea, E., Märk, T. D., Gasperi, F., and Biasioli, F.: On Quantitative Determination of Volatile Organic Compound Concentrations Using Proton Transfer Reaction Time-of-Flight Mass Spectrometry, Environ. Sci. Technol., 46, 2283–2290, https://doi.org/10.1021/es203985t, 2012.
Cecelski, C. E., Rhoderick, G. C., Possolo, A. M., Carney, J., Vokoun, M., Privoznikova, J., Lee, S., Kang, J. H., Kim, Y. D., Kim, D. H., Macé, T., Sutour, C., Pascale, C., Ntsasa, N., Tshilongo, J., Jozela, M., Leshabane, N., Lekoto, G., Worton, D. R., Brewer, P. J., Farrow-Dunn, F., Moreno, S., Wirtz, K., Stummer, V., Konopelko, L. A., Kolobova, A. V., Kustikov, Y. A., Klimov, A. Y., Efremova, O. V., van Wijk, J. I. T., and van der Veen, A. M. H.: International comparison CCQM-K10.2018: BTEX in nitrogen at 5 nmol mol−1, Metrologia, 59, 08003, https://doi.org/10.1088/0026-1394/59/1a/08003, 2022.
de Gouw, J. and Warneke, C.: Measurements of volatile organic compounds in the earths atmosphere using proton-transfer-reaction mass spectrometry, Mass Spectrom. Rev., 26, 223–257, https://doi.org/10.1002/mas.20119, 2007.
de Gouw, J., Warneke, C., Karl, T., Eerdekens, G., van der Veen, C., and Fall, R.: Sensitivity and specificity of atmospheric trace gas detection by proton-transfer-reaction mass spectrometry, Int. J. Mass Spectrom., 223, 365–382, https://doi.org/10.1016/s1387-3806(02)00926-0, 2003.
Grenfell, R. J. P., Brookes, C., Vargha, G., Quincey, P., Milton, M., Woods, P. T., and Harris, P.: Euramet 886 Comparison of multi-component ambient VOC measurements, National Physical Laboratory, 94 pp., https://eprintspublications.npl.co.uk/4306/1/AS29.pdf (last access: 20 February 2023), 2008.
Grenfell, R. J. P., Milton, M. J. T., Harling, A. M., Vargha, G. M., Brookes, C., Quincey, P. G., and Woods, P. T.: Standard mixtures of ambient volatile organic compounds in synthetic and whole air with stable reference values, J. Geophys. Res.-Atmos., 115, D14302, https://doi.org/10.1029/2009jd012933, 2010.
Hansel, A., Jordan, A., Warneke, C., Holzinger, R., Wisthaler, A., and Lindinger, W.: Proton-transfer-reaction mass spectrometry (PTR-MS): on-line monitoring of volatile organic compounds at volume mixing ratios of a few pptv, Plasma Sources Sci. T., 8, 332–336, https://doi.org/10.1088/0963-0252/8/2/314, 1999.
Holzinger, R., Lee, A., McKay, M., and Goldstein, A. H.: Seasonal variability of monoterpene emission factors for a ponderosa pine plantation in California, Atmos. Chem. Phys., 6, 1267–1274, https://doi.org/10.5194/acp-6-1267-2006, 2006.
Holzinger, R., Acton, W. J. F., Bloss, W. J., Breitenlechner, M., Crilley, L. R., Dusanter, S., Gonin, M., Gros, V., Keutsch, F. N., Kiendler-Scharr, A., Kramer, L. J., Krechmer, J. E., Languille, B., Locoge, N., Lopez-Hilfiker, F., Materić, D., Moreno, S., Nemitz, E., Quéléver, L. L. J., Sarda Esteve, R., Sauvage, S., Schallhart, S., Sommariva, R., Tillmann, R., Wedel, S., Worton, D. R., Xu, K., and Zaytsev, A.: Validity and limitations of simple reaction kinetics to calculate concentrations of organic compounds from ion counts in PTR-MS, Atmos. Meas. Tech., 12, 6193–6208, https://doi.org/10.5194/amt-12-6193-2019, 2019.
ISO: 6142-1:2015 Gas analysis – Preparation of calibration gas mixtures – Gravimetric method for class I mixtures, International Organization for Standardisation (ISO), Geneva, Switzerland, 39 pp., https://www.iso.org/standard/59631.html (last access: 20 February 2023), 2015.
ISO: 19229:2019 Gas analysis – Purity analysis and the treatment of purity data, International Organization for Standardisation (ISO), Geneva, Switzerland, 18 pp., https://www.iso.org/standard/72010.html (last access: 20 February 2023), 2019.
Lee, S., Heo, G. S., Kim, Y., Oh, S., Han, Q., Wu, H., Konopelko, L. A., Kustikov, Y. A., Kolobova, A. V., Efremova, O. V., Pankratov, V. V., Pavlov, M. V., Culleton, L. P., Brown, A. S., Brookes, C., Li, J., Ziel, P. R., and van der Veen, A. M. H.: International key comparison CCQM-K94: 10 µmol/mol dimethyl sulfide in nitrogen, Metrologia, 53, 08002, https://doi.org/10.1088/0026-1394/53/1a/08002, 2016.
Lee, S., Kang, J. H., Kim, Y. D., Kim, D. H., Jung, J., Ma, H., Wu, H., Bartlett, S., Worton, D., Murugan, A., Brewer, P. J., Konopelko, L. A., Kolobova, A. V., Malginov, A. V., Dobryakov, Y. G., Pankratov, V. V., and Efremova, O. V.: International comparison CCQM-K165: dimethyl sulfide in nitrogen at 5 nmol mol−1, Metrologia, 59, 08011, https://doi.org/10.1088/0026-1394/59/1A/08011, 2022.
Liaskos, C., Rhoderick, G., Hodges, J., Possolo, A., Goodman, C., Kim, Y. D., Kim, D. H., Lee, S., Allen, N., Corbel, M., Worton, D., Brown, R., and Brewer, P.: CCQM-K121 – Monoterpenes in nitrogen at 2.5 nmol mol−1 final report, Metrologia, 55, 08019, https://doi.org/10.1088/0026-1394/55/1a/08019, 2018.
Lindinger, W., Hansel, A., and Jordan, A.: On-line monitoring of volatile organic compounds at pptv levels by means of proton-transfer-reaction mass spectrometry (PTR-MS) medical applications, food control and environmental research, Int. J. Mass Spectrom., 173, 191–241, https://doi.org/10.1016/S0168-1176(97)00281-4, 1998.
Müller, M., Mikoviny, T., and Wisthaler, A.: Detector aging induced mass discrimination and non-linearity effects in PTR-ToF-MS, Int. J. Mass Spectrom., 365–366, 93–97, https://doi.org/10.1016/j.ijms.2013.12.008, 2014.
Park, J.-H., Goldstein, A. H., Timkovsky, J., Fares, S., Weber, R., Karlik, J., and Holzinger, R.: Eddy covariance emission and deposition flux measurements using proton transfer reaction – time of flight – mass spectrometry (PTR-TOF-MS): comparison with PTR-MS measured vertical gradients and fluxes, Atmos. Chem. Phys., 13, 1439–1456, https://doi.org/10.5194/acp-13-1439-2013, 2013.
Rhoderick, G. C.: Stability assessment of gas mixtures containing terpenes at nominal 5 nmol/mol contained in treated aluminum gas cylinders, Anal. Bioanal. Chem., 398, 1417–1425, https://doi.org/10.1007/s00216-010-4058-0, 2010.
Rhoderick, G. C. and Lin, J.: Stability Assessment of Gas Mixtures Containing Monoterpenes in Varying Cylinder Materials and Treatments, Anal. Chem., 85, 4675–4685, https://doi.org/10.1021/ac400324v, 2013.
Rhoderick, G. C., Cecelski, C. E., Miller, W. R., Worton, D. R., Moreno, S., Brewer, P. J., Viallon, J., Idrees, F., Moussay, P., Kim, Y. D., Kim, D., Lee, S., Baldan, A., and Li, J.: Stability of gaseous volatile organic compounds contained in gas cylinders with different internal wall treatments, Elementa-Sci. Anthrop., 7, 22, https://doi.org/10.1525/elementa.366, 2019.
Snedecor, G. W. and Cochran, W. G.: Statistical methods, Iowa State University Press, 593 pp., ISBN 9780813815602, 1989.
Steinbacher, M., Dommen, J., Ammann, C., Spirig, C., Neftel, A., and Prevot, A. S. H.: Performance characteristics of a proton-transfer-reaction mass spectrometer (PTR-MS) derived from laboratory and field measurements, Int. J. Mass Spectrom., 239, 117–128, https://doi.org/10.1016/j.ijms.2004.07.015, 2004.
Taipale, R., Ruuskanen, T. M., Rinne, J., Kajos, M. K., Hakola, H., Pohja, T., and Kulmala, M.: Technical Note: Quantitative long-term measurements of VOC concentrations by PTR-MS – measurement, calibration, and volume mixing ratio calculation methods, Atmos. Chem. Phys., 8, 6681–6698, https://doi.org/10.5194/acp-8-6681-2008, 2008.
van der Veen, A. M. H., de Krom, I., Nieuwenkamp, G., Culleton, L. P., Worton, D. R., and Allden, J.: Bilateral comparison VSL-NPL on primary gas standards for the siloxane content in biomethane, Research Square, 26 pp., https://doi.org/10.21203/rs.3.rs-2598788/v1, 2023.
van der Veen, A. M. H., van der Hout, J. W., Ziel, P. R., Oudwater, R. J., Fioravante, A. L., Augusto, C. R., Brum, M. C., Uehara, S., Akima, D., Bae, H. K., Kang, N., Woo, J.-C., Liaskos, C. E., Rhoderick, G. C., Jozela, M., Tshilongo, J., Ntsasa, N. G., Botha, A., Brewer, P. J., Brown, A. S., Bartlett, S., Downey, M. L., Konopelko, L. A., Kolobova, A. V., Pankov, A. A., Orshanskaya, A. A., and Efremova, O. V.: International comparison CCQM-K111 – propane in nitrogen, Metrologia, 54, 08009, https://doi.org/10.1088/0026-1394/54/1a/08009, 2017.
Worton, D. R., Moreno, S., Brewer, P. J., Li, J., Baldan, A., and van der Veen, A. M. H.: Bilateral comparison of primary reference materials (PRMs) containing methanol, ethanol and acetone in nitrogen, Accredit. Qual. Assur., 27, 265–274, https://doi.org/10.1007/s00769-022-01513-y, 2022.
Yuan, B., Koss, A. R., Warneke, C., Coggon, M., Sekimoto, K., and de Gouw, J. A.: Proton-Transfer-Reaction Mass Spectrometry: Applications in Atmospheric Sciences, Chem. Rev., 117, 13187–13229, https://doi.org/10.1021/acs.chemrev.7b00325, 2017.
Zar, J. H.: Biostatistical Analysis, 4th, Prentice Hall, Englewood Cliffs, New Jersey, 718 pp., ISBN 9788126551385, 1999.
Zhao, J. and Zhang, R.: Proton transfer reaction rate constants between hydronium ion (H3O+) and volatile organic compounds, Atmos. Environ., 38, 2177–2185, https://doi.org/10.1016/j.atmosenv.2004.01.019, 2004.