the Creative Commons Attribution 4.0 License.
the Creative Commons Attribution 4.0 License.
 | 02 Mar 2023
Systematic analysis of virga and its impact on surface particulate matter observations
Ricardo K. Sakai
Rosa M. Fitzgerald
Charles Ichoku
Fernando Mercado
William R. Stockwell
Studies focusing on virga are rare, even though it is a commonly occurring phenomenon. In this study, we investigated aerosol backscatter profiles from a ceilometer located on The University of Texas at El Paso (UTEP) campus from 2015–2021 to identify virga events. Ceilometer data effectively captured virga events from regular precipitation based on the backscattering intensities. To characterize the virga phenomena, a systematic method was developed using ceilometer profiles, soundings, surface rain gauges, and radar data from the nearest National Weather Service (NWS) site. A total of 50 virga events were identified during the study period. These events appeared only during a specific time of the year, revealing a seasonal occurrence pattern. We identified and classified these virga events and investigated their impact on the surface measurements recorded by the on-campus Continuous Ambient Air Monitoring Station (CAMS). Virga events were classified as columnar and non-columnar events based on their aerosol profiles. We observed that during some of the columnar virga events, surface particulate matter (PM) levels displayed a sudden upward trend indicating aerosol loading in the surface layer after precipitation evaporation. In total, 20 of the virga events showed a columnar structure out of the 50 identified in this study. More detailed analysis of selected events shows that virga affects regional air quality. A significant result of this study is that analysis of sudden changes in local air quality needs to consider the possible effects of virga on the surface layer.
- Article
(7801 KB) - Full-text XML
- BibTeX
- EndNote


Extreme weather events and climate variability directly impact the hydrological cycle, which affects all life on Earth. Understanding hydrologic processes requires a quantitative description of the temporal variability in precipitation. Meteorologists define precipitation as liquid or solid water that falls from the sky to the ground. However, a type of precipitation known as virga never reaches the ground. Thus, virga has been defined as the rain that falls from the clouds but evaporates before making it to the ground (Petterssen, 1958). Virga is also described as a sudden change in the brightness of a precipitation (water or ice particles) shaft beneath a cloud (Fraser and Bohren, 1992). It is a commonly observed phenomenon in hot, arid regions. According to Ludlam (1980), the cumulus cloud bases in desert regions are higher above the ground (3–4 km), and that causes the precipitation on dry days to evaporate completely before reaching the ground.
Water has a high heat of vaporization (40.65 kJ mol−1; 540 calories g−1), so the transition from liquid to gas requires a significant amount of heat energy (Henderson-Sellers, 1984). Precipitation evaporating at a high altitude can heat up as it falls, due to adiabatic compression, resulting in a gusty downburst that can significantly and rapidly warm the surface temperature. The abrupt changes in the lower troposphere can therefore have a significant impact on weather forecasting, climate prediction, aviation, local air quality, and vegetation. Singh and O'Neil (2022) reviewed Earth's climate system using the second law of thermodynamics. However, the thermodynamics involved during the virga events is not entirely known. During virga, the rain changes from liquid to vapor form, removing significant amounts of heat from the air and causing various weather effects. Colder air parcels can descend quickly to the ground, causing wet or dry microbursts that can pose extreme danger to small planes and other aircraft. A well-known example is the tragic crash of Eastern Airlines Flight 66 on 24 June 1975, which occurred while approaching John F. Kennedy International Airport in New York, USA. Fujita and Byers (1977) coined the term “downburst” to describe the induced wind shear that affected the airport. The Joint Airport Weather Studies (JAWS) Project, designed to study the three-dimensional structure of microbursts in space and time, discovered that some microburst events were associated with virga shafts with little or no rain on the surface (McCarthy et al., 1982). Wilson et al. (1984) claimed that dry microbursts and wet microbursts exist, each with a different forcing mechanism, and associated dry microbursts with virga events using Doppler radar measurements from the JAWS Project.
Even though virga is a captivating visual phenomenon with broader research implications, scientific publications on the subject are scarce. Previous studies investigated it using remote sensing instruments such as ground-based or airborne radar and/or lidar and, in some cases, satellite observations. Wang et al. (2018) quantified global virga using spaceborne radars. They showed that it accounted for about 50 % and 30 % of overall false precipitation events detected by the Tropical Rainfall Measuring Mission (TRMM) Microwave Imager (TMI) and Global Precipitation Measurement (GPM) microwave imager, respectively, in arid regions. Using long-term measurements from the TRMM's Precipitation Radar data over India and the surrounding oceans, Saikranthi et al. (2014) discovered significant virga occurrences (20 % and 14 %) in the dry, semi-arid regions of northwestern India and southeastern peninsular India, respectively. They also discovered the highest occurrence of virga in India during the pre-monsoon period. Airey et al. (2021) derived the characteristics of desert precipitation in the UAE (United Arab Emirates) using a dataset of ceilometer observations spanning 2 years. They discovered that 28 of the 105 rain-producing events were virga, with small droplets, high cloud bases, reduced cloud depths, and cold cloud bases being multiple regional contributing factors. The authors also highlighted the significance of understanding the amount of precipitation in drought-prone arid regions with limited water resources for agriculture, irrigation, and domestic usage.
Cheng and Yi (2020) used ground-based lidars to observe mixed-phase virga from a thin supercooled liquid layer cloud base on 20 occasions. They discovered that the ice crystal particles in these virga cases had smaller mean diameters and narrower size distributions as altitude increased. Beynon and Hocke (2022) detected and studied snow virga in Bern, Switzerland, using a Doppler Micro Rain Radar (MRR). In their work, they specifically focused on a 22 h long snow virga event from 17 March 2013. The authors concluded that the 22 h virga was caused by prevailing wind shear, which carried moisture-saturated air in the upper air layers over the measuring station while the wind blew in the lower air layers, carrying unsaturated air with it. The authors also discovered a discrepancy between the MRR observations and the ERA-5 dataset, a global atmospheric reanalysis produced at the European Centre for Medium-Range Weather Forecasts (ECMWF) by the Copernicus Climate Change Service (C3S). Unlike MRR, which did not record any ground precipitation during the snow virga event, the latter showed drizzle on the ground for 4 h. The preceding work also highlights the importance of high-resolution and high-frequency radiosonde, lidar, radar, and radiometer observations for model validation or data assimilation (Beynon and Hocke, 2022). Similar snow virga has been detected and observed by Jullien et al. (2020) and Grazioli et al. (2017) in the Antarctic region. Virga was even linked with severe climatic events such as droughts. Evans et al. (2011) used radar data to classify precipitation over three locations in the Canadian Prairies during the 1994–2004 droughts. Evans et al. (2011) classified the precipitation over the drought region as convective, stratiform, or virga. Virga, with an average cloud base temperature greater than 0 ∘C, resulted in efficient sublimation loss of precipitation that contributed to decreased surface precipitation.
While all of the above studies clearly advanced knowledge and understanding of regional virga detection and its variations to a great extent, some critical questions remain unanswered. Although heterogeneous components and dissolved aqueous-phase constituents are released when cloud water or falling rain droplets (hydrometeors) either sublimate or evaporate, the contribution of this material towards local air quality is not yet well quantified. According to Tost et al. (2006), during this evaporation or sublimation process, any non-ionic, volatile compounds are converted to gas, scavenged by aerosol particles and redistributed into aerosols. Non-volatile components such as chlorides, sulfates, and similar ionic compounds could serve as condensation nuclei for cloud droplet formation. The quantification of the relationship between virga and the aerosol loading in the lower troposphere is an important new research question for atmospheric chemistry.
El Paso, with a semi-arid climate, is a border city at the western tip of Texas, USA. It lies on the border near the Mexican city of Ciudad Juárez, and together, this region hosts two large airports and several small aerodromes. As a result, it is critical to research regional virga events thoroughly. The current study focuses on two aspects of virga events observed in this region. First, the characterization of the virga seasonal pattern for the region is evaluated, and second, the analysis of ground measurements during the virga event is discussed. This region hosts a ceilometer located at The University of Texas at El Paso campus and has been functional since 2015. Virga events were detected primarily using the aerosol backscatter profiles from the ceilometer. El Paso is known for its high-ozone events during summer (Karle et al., 2020) and high-particulate-matter (PM) events during winter (Lara et al., 2022; Fitzgerald et al., 2021). Because virga's impact on local air quality has yet to be published, we present our observations, analysis, and discussion of the case studies of some of the events observed in El Paso.
The paper is structured as follows. In Sect. 1, we present an introduction to previous studies and their significance. Section 2 covers the instrumentation and datasets used and the data collection method. Section 3 discusses the criterion for selecting virga events for this study. Section 4 examines the seasonal pattern of virga events in this region, followed by two case studies. Section 5 discusses and concludes our findings.
Various datasets were used in this study to conduct a thorough analysis and consolidate observations and scientific claims to build substantial research. The dataset used in this work includes the ceilometer observations, vertical profiles from radiosondes and Doppler weather radar, and ground-based air quality in situ measurements.
2.1 Site description
The city of El Paso (31∘47′20′′ latitude, −106∘25′20′′ longitude; elevation of 1145 m a.s.l. – above sea level) is in the far-western corner of Texas, separated by the Rio Grande from the Mexican city of Juárez and surrounded by the Chihuahuan Desert. El Paso has a semi-arid climate characteristic of the southwestern USA. It is also known as “Sun City” because of its approximately 302 d of sunshine annually. Sun City's monsoon season starts on 15 June and runs through the end of September. The rainy period of the year lasts for around 4 months, from mid-June to the end of October, with a 31 d rainfall of at least 0.5 in. (1.27 cm). The month with the most rain in El Paso is August, with an average rainfall of 1.5 in. (1.27 cm). The rainless period of the year lasts for around 7–8 months, from the end of October to first week of June. The month with the least rain in El Paso is April, with an average rainfall of 0.2 in. (0.51 cm; Karle, 2021).
2.2 Instrument
2.2.1 Ceilometer CL31 and CL51
Based on attenuated aerosol backscatter profile measurements, the ceilometer is an essential instrument for its robust functionality and cost efficiency in detecting cloud cover, cloud base height, and aerosol layer height, which can be used to infer the planetary boundary layer (PBL). A ceilometer located at The University of Texas at El Paso (UTEP) campus is used to measure the intensity of backscatter caused by precipitation, clouds, fog, and haze and creates profiles of signal strength vs. height measured over time. Two Vaisala ceilometer models, CL31 and CL51, were used to monitor the aerosol layer in this region using aerosol backscatter profiles. Both ceilometers are eye-safe, single-lens, mini-lidar systems that detect cloud base heights and vertical visibility by continuously monitoring aerosol backscatter profiles at 910±10 nm wavelength (near-infrared spectral region). CL31 has an InGaAs metal–organic chemical vapor deposition (MOCVD) diode with a pulse frequency of 10 kHz and a measurement range of 0–7.7 km. The typical uncertainty in the attenuation of the backscatter coefficient for a 30 min average duration is 20 %.
A CL31 was installed on The University of Texas at El Paso (UTEP) campus in March 2015. It was subsequently replaced, and a new CL51 was commissioned in August 2020. The CL51 has a spatial resolution of 10 m and can measure clouds and aerosol layers up to 15 400 m vertically. CL51's diode laser technology, like that of CL31, is a semiconductor InGaAs diode laser with a wavelength of 910±10 nm. The CL51, on the other hand, has a more powerful laser, with a pulse energy of 3 µJ, which is higher than the CL31's 1.2 µJ, and a pulse frequency of 6.5 kHz. Furthermore, the instrument's single-lens optics allow it to detect anomalies in a measurement range of approximately 50 m above the ground surface.
2.2.2 Data processing
The ceilometer's laser pulses are scattered back by all types of hydrometeors. Although the ceilometer is primarily meant to offer a constant indication of cloud base height, it also keeps a complete record of the returned signal strength as a function of height. An analysis of the backscatter signal can be in terms of the vertical profiles of the backscattering coefficient and the extinction coefficient using the lidar equation. The ceilometer data include profiles through rain, snow, haze, and strong returns from the cloud base because it operates continually. Rogers et al. (1997), in their work, have discussed the extinction and backscattering by these atmospheric constituents in detail. The Vaisala Boundary Layer View (BL-View) proprietary software (version 2.1.1) was used extensively in this work for data analysis. The software uses a combination of gradient methods, along with built-in sky condition algorithms containing five modules, to detect and measure cloud base heights and the planetary boundary layer heights from the measured attenuated backscatter profiles (Schafer et al., 2004). Both the spatial and temporal aerosol backscatter intensity profiles for the detection of virga events were obtained by processing them using BLView.
2.2.3 Next-generation radar information
The Weather Surveillance Radar (WSR-88D), developed in 1988 with a Doppler capability, is part of the next-generation radar (NEXRAD) network. There are over 158 such WSR-88Ds that operate around the United States. With a power output of 750 000 W, it is one of the world's most powerful radars. Its 28 ft (8.53 m) diameter antenna inside the dome can gaze at 14 different elevations every 5 min. A detailed description of the WSR-88D instrument is available on the web page of the National Weather Service (NWS; https://www.weather.gov/iwx/wsr_88d, last access: 6 February 2022). During the virga occurrences, data from the Doppler radar at the NWS in Santa Teresa, New Mexico, were vital for detecting and confirming precipitation in the air. We obtained and used 5 min resolution data for each day of the virga event from https://www.ncdc.noaa.gov/nexradinv/ (last access: 7 May 2022). We extensively used the open-source National Oceanic and Atmospheric Administration (NOAA) National Centers for Environmental Information (NCEI) radar software (https://www.ncdc.noaa.gov/wct/, last access: 7 May 2022) for data visualization and analysis.
2.3 Vertical profiles from the National Weather Service
Radiosonde observations were obtained from the nearest NWS (31∘52′33′′ N, 106∘36′39′′ W) located at Santa Teresa, New Mexico, 21 km away from the study site. The local NWS launches two radiosondes daily at 00:00 UTC (UTC−6 for mountain daylight time, MDT, and UTC−7 for mountain standard time, MST) and 12:00 UTC. Skew-T plots helped us to analyze the upper-air conditions, especially the temperature and moisture content on the event days. These skew-T graphs were useful for analyzing the thermodynamics of the atmospheric profiles. All the atmospheric soundings data used in this study were obtained from the University of Wyoming Atmospheric Science Radiosonde Archive database (https://weather.uwyo.edu/upperair/sounding.html, last access: 5 January 2023).
2.4 Continuous Ambient Monitoring Station (CAMS)
There are 12 Continuous Ambient Air Monitoring Station (CAMS) that have been installed in various parts of El Paso for decades. These sites continuously monitor the ambient air and report and issue warnings when pollution anomalies occur. CAMS 12, located on the UTEP campus (EPA side no. 48-141-0037; 31∘76′82′′ N, 106∘50′12′′ W), is one such station operated and maintained by the Texas Commission on Environmental Quality (TCEQ) El Paso regional office. This station provided local meteorological data such as temperature, relative humidity, dew point temperature, wind speed, and maximum wind gusts. Usually, CAMS data are provided on an hourly basis, and the same was done in this research. The hourly data from the CAMS were used to calculate the rate of change in meteorological variables during virga events to investigate the changes associated with the virga on the surface layer. Later, linear regression was used to determine any correlations between these parameters and to investigate virga's impact on them.
One of the critical factors for precipitation is the acceptable moisture content in the air between the ground and the cloud base. These humid conditions facilitate the precipitation falling from the clouds to make it to the ground. However, when the layer of air between the cloud base and the ground is dry, then precipitation evaporates before reaching the ground. This evaporating precipitation appears as streaks extending down the cloud. Extensive use of the UTEP ceilometer for analyzing planetary boundary layer heights (PBLHs) and their impact on local air quality is well documented (Karle, 2017; Karle et al., 2020; Karle, 2021; Karle et al., 2021). Several precipitation events with streaks extending down the cloud were observed during the investigation of the aerosol backscatter profiles for PBLH measurements from 2015 to 2021 for these studies. We investigated the events further using ground measurements and other remote sensing data for the region and identified them to be virga occurrences.
Since the literature on virga and detection of its various forms is scarce, we decided to establish our criteria based on a combination of available datasets from various sources. In our method, backscatter intensity profiles from the ceilometer were the primary source of virga detection. Days on which precipitation below the cloud base was observed to fade as it fell towards the ground were chosen. All the selected events had virga detected for at least an hour. There were also instances in which precipitation was observed before or after the virga events. NWS radiosonde vertical profiles were used to estimate the cloud base and analyze the dryness in the air near the surface. Radar data from NWS confirmed the presence of precipitation of rain clouds, and finally, using the data from the CAMS located at UTEP, the absence of any precipitation was confirmed. By combining these data sources, we ruled out the possibility that the virga event described in this study was not part of the precipitation that reached the ground in the form of light rain.
Figure 1 depicts an attenuated aerosol backscatter profile obtained from Vaisala CL31 on 25 January 2017 from 00:00–15:00 UTC. The strongest signal (indicated in red) is from precipitation below the cloud base, and the remaining signal (light blue, green, and yellow, with increasing intensity) is from aerosol backscatter. A streak of precipitation is observed to extend downwards from 07:45 to 13:30 UTC. Base reflectivity imagery from the NEXRAD WSR-88D located at the NWS, Santa Teresa, New Mexico (purple dot), is examined (Fig. 2). We observe light precipitation at the research site of UTEP (shown with a red dot in Fig. 2). The base reflectivity color over the UTEP site at 08:56 UTC corresponds to the intensity of the radiation received by the radar antenna at NWS (KEPZ). A threshold of 20 dBZ is usually the point at which light rain begins, as seen in this case over the study site UTEP (red dot) in Fig. 2. However, no precipitation was recorded at the ground station at UTEP, indicating that the precipitation had not reached the ground, thus confirming the occurrence of virga. The NWS (KEPZ) vertical profiles at 00:00 (17:00 MST) and 12:00 UTC (05:00 MST) revealed a large gap between T (temperature in red) and Td (dew point temperature in blue) above the surface, indicating dry air (Fig. 3). In the 12:00 UTC profile, at 680 hPa, we notice that the T and Td are close to each other, implying moist air, and at 560 hPa, T and Td overlap, indicating saturated air.
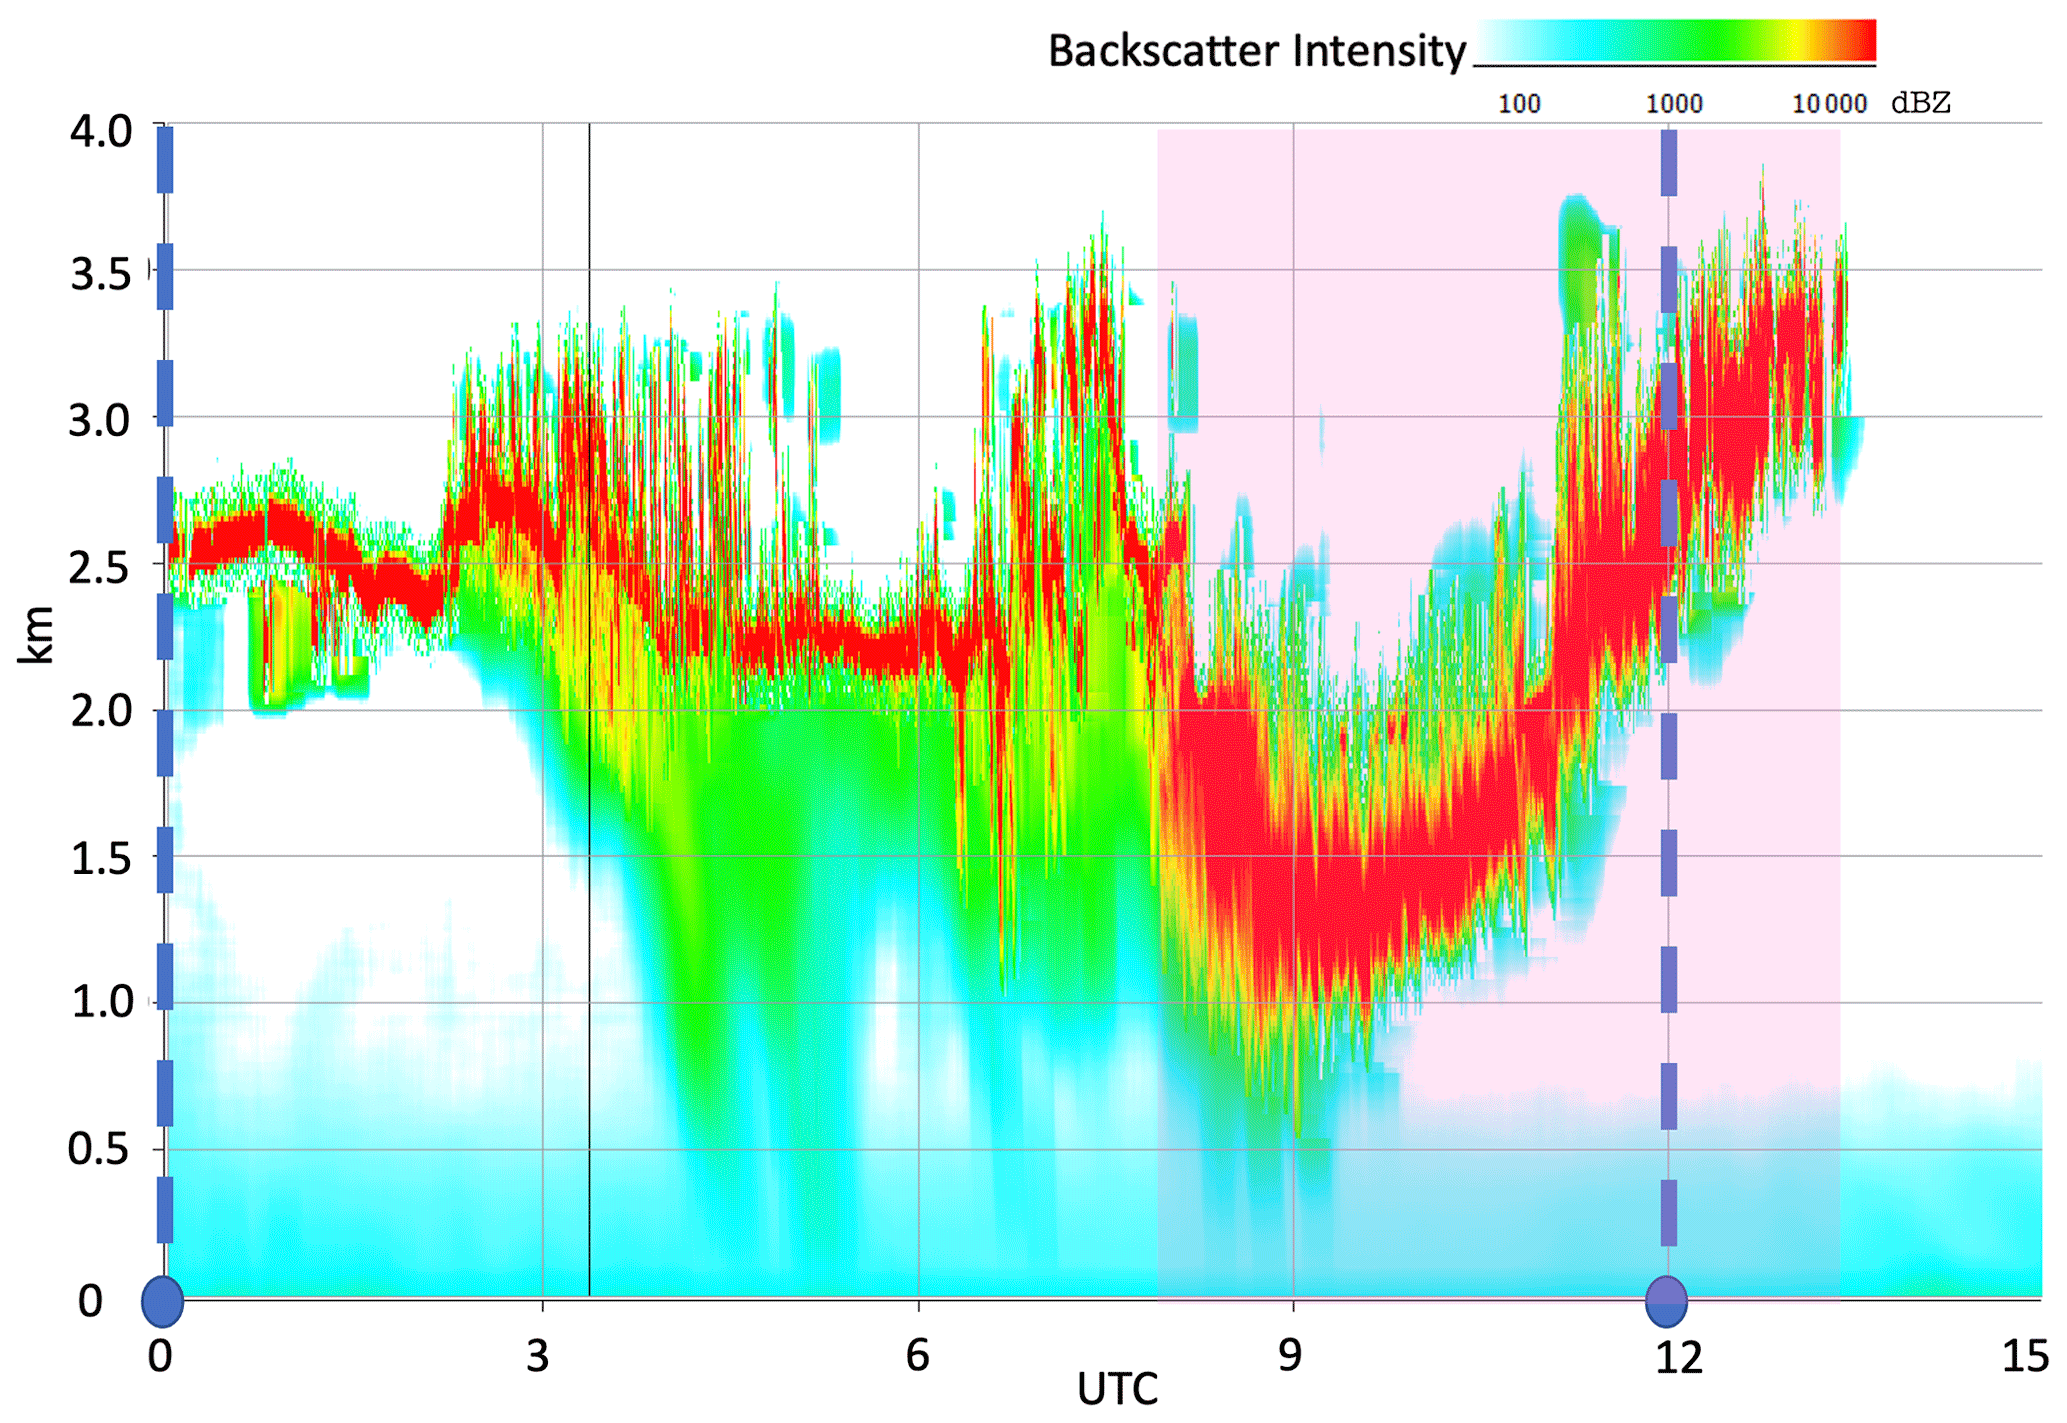
Figure 1Aerosol backscatter profile obtained from CL31 for 25 January 2017, from 00:00–15:00 UTC, showing virga occurrence from 08:00 to 13:00 UTC (shaded region). The dashed blue lines and circles indicate the availability of radiosonde data.
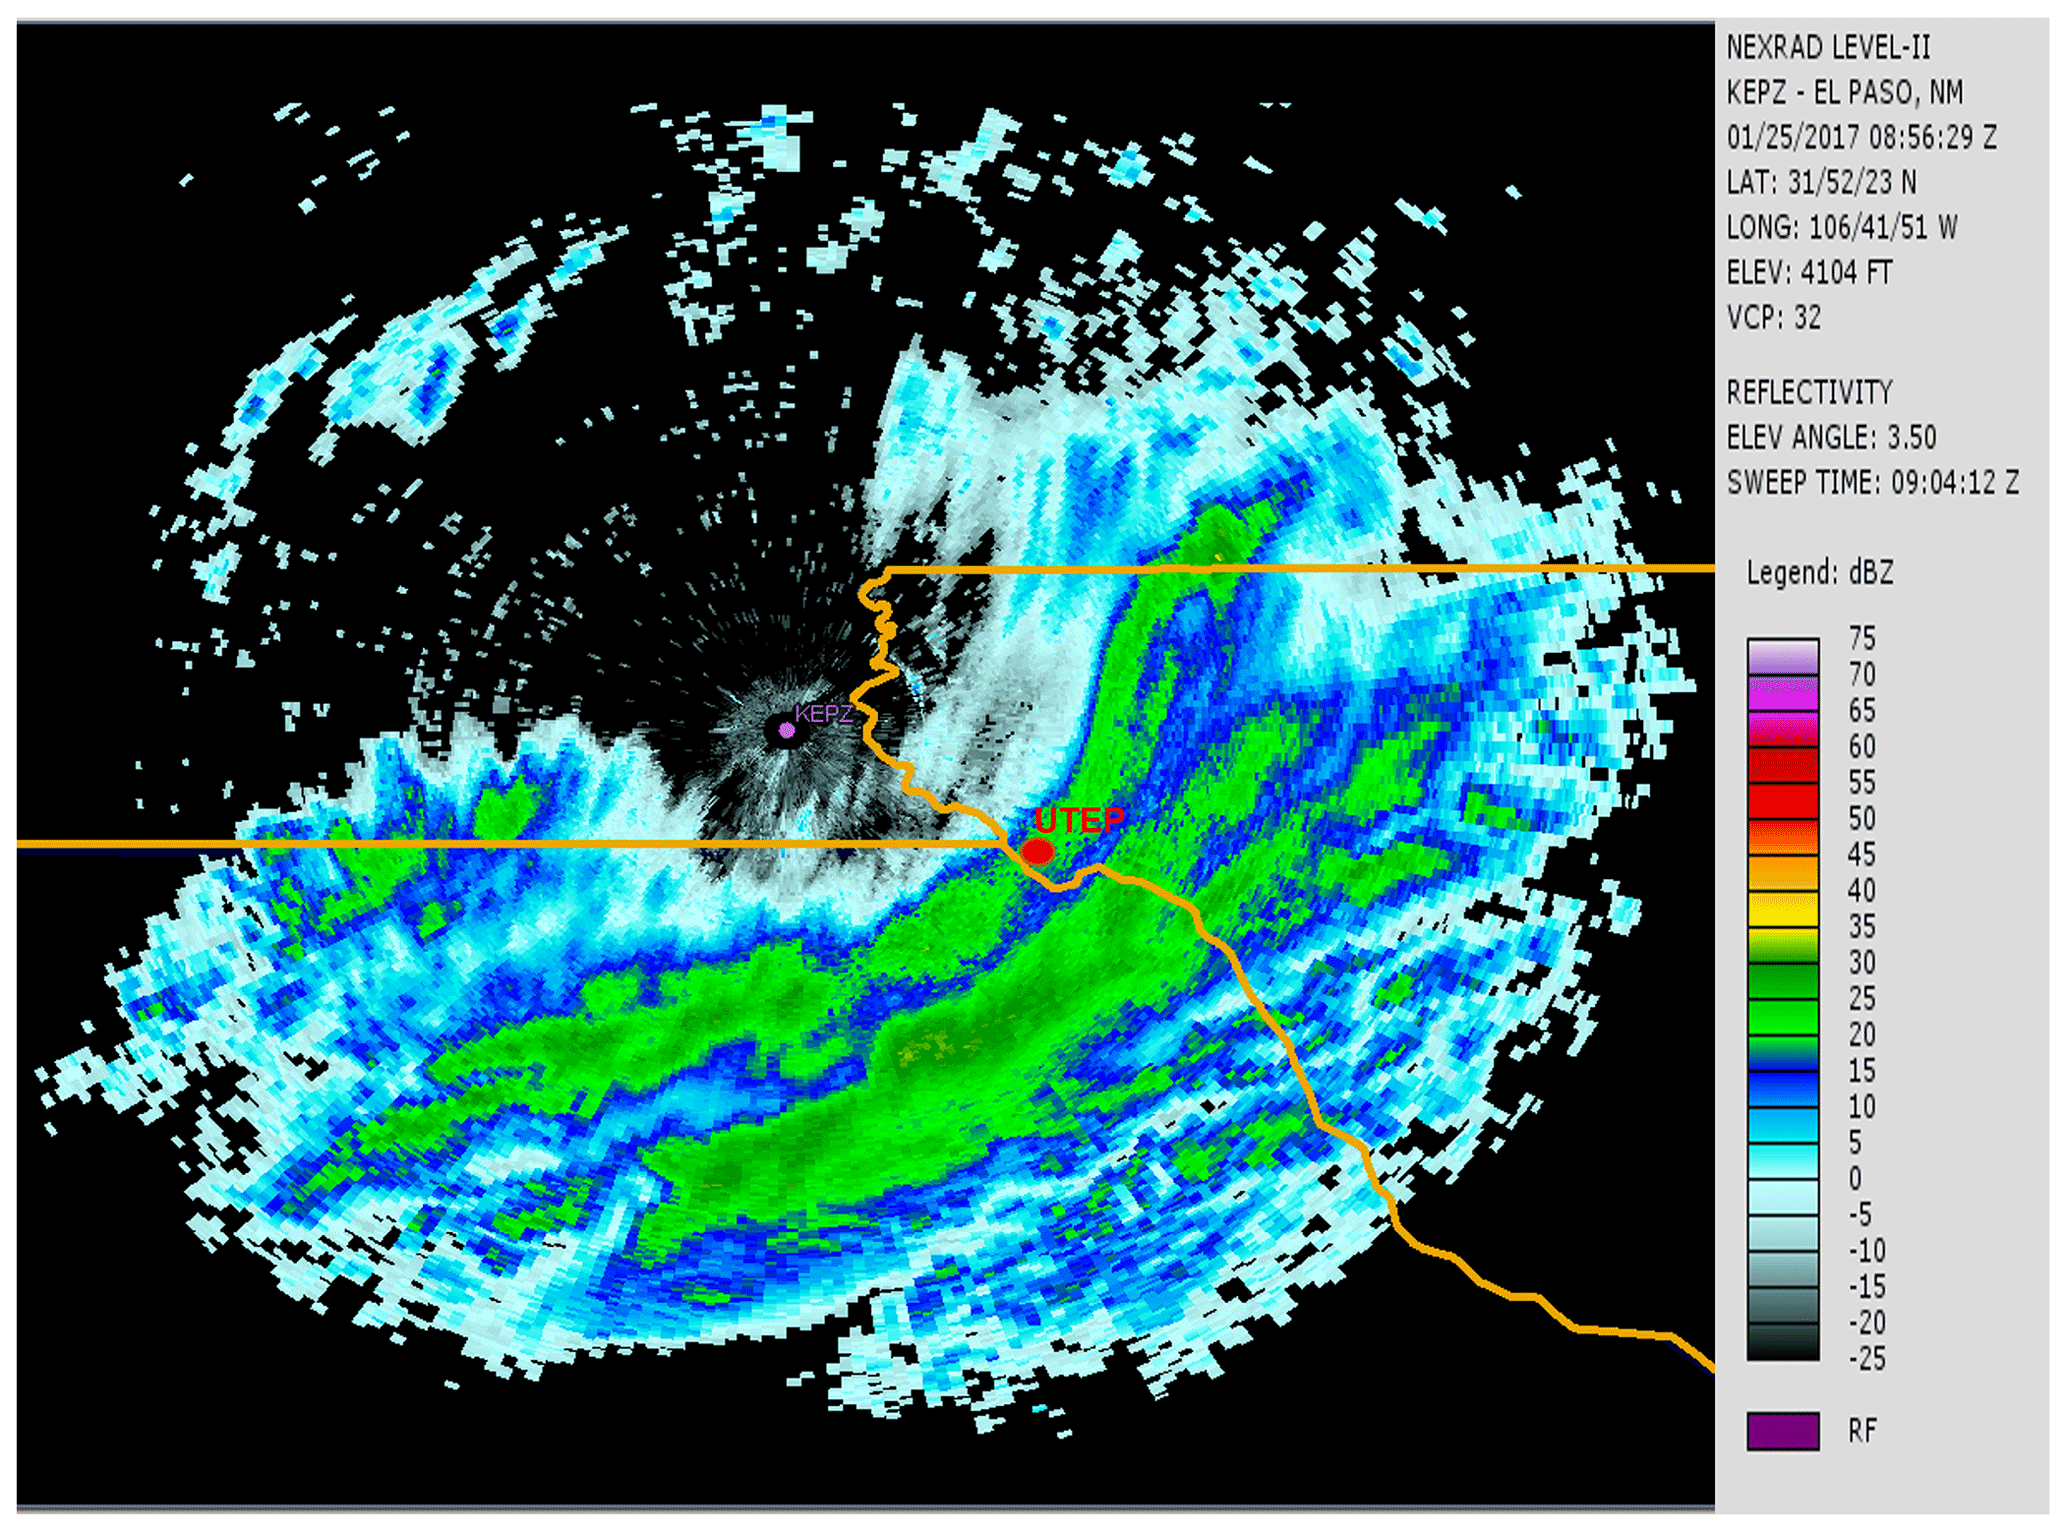
Figure 2Base reflectivity imagery from the NEXRAD WSR-88D located at National Weather Service (NWS), Santa Teresa, New Mexico (purple dot). We can observe light precipitation at the research site of UTEP (red dot). However, no precipitation is recorded at the ground station, thus indicating the occurrence of virga. Source: NOAA Weather and Climate Toolkit (https://www.ncdc.noaa.gov/wct/, last access: 4 September 2022).
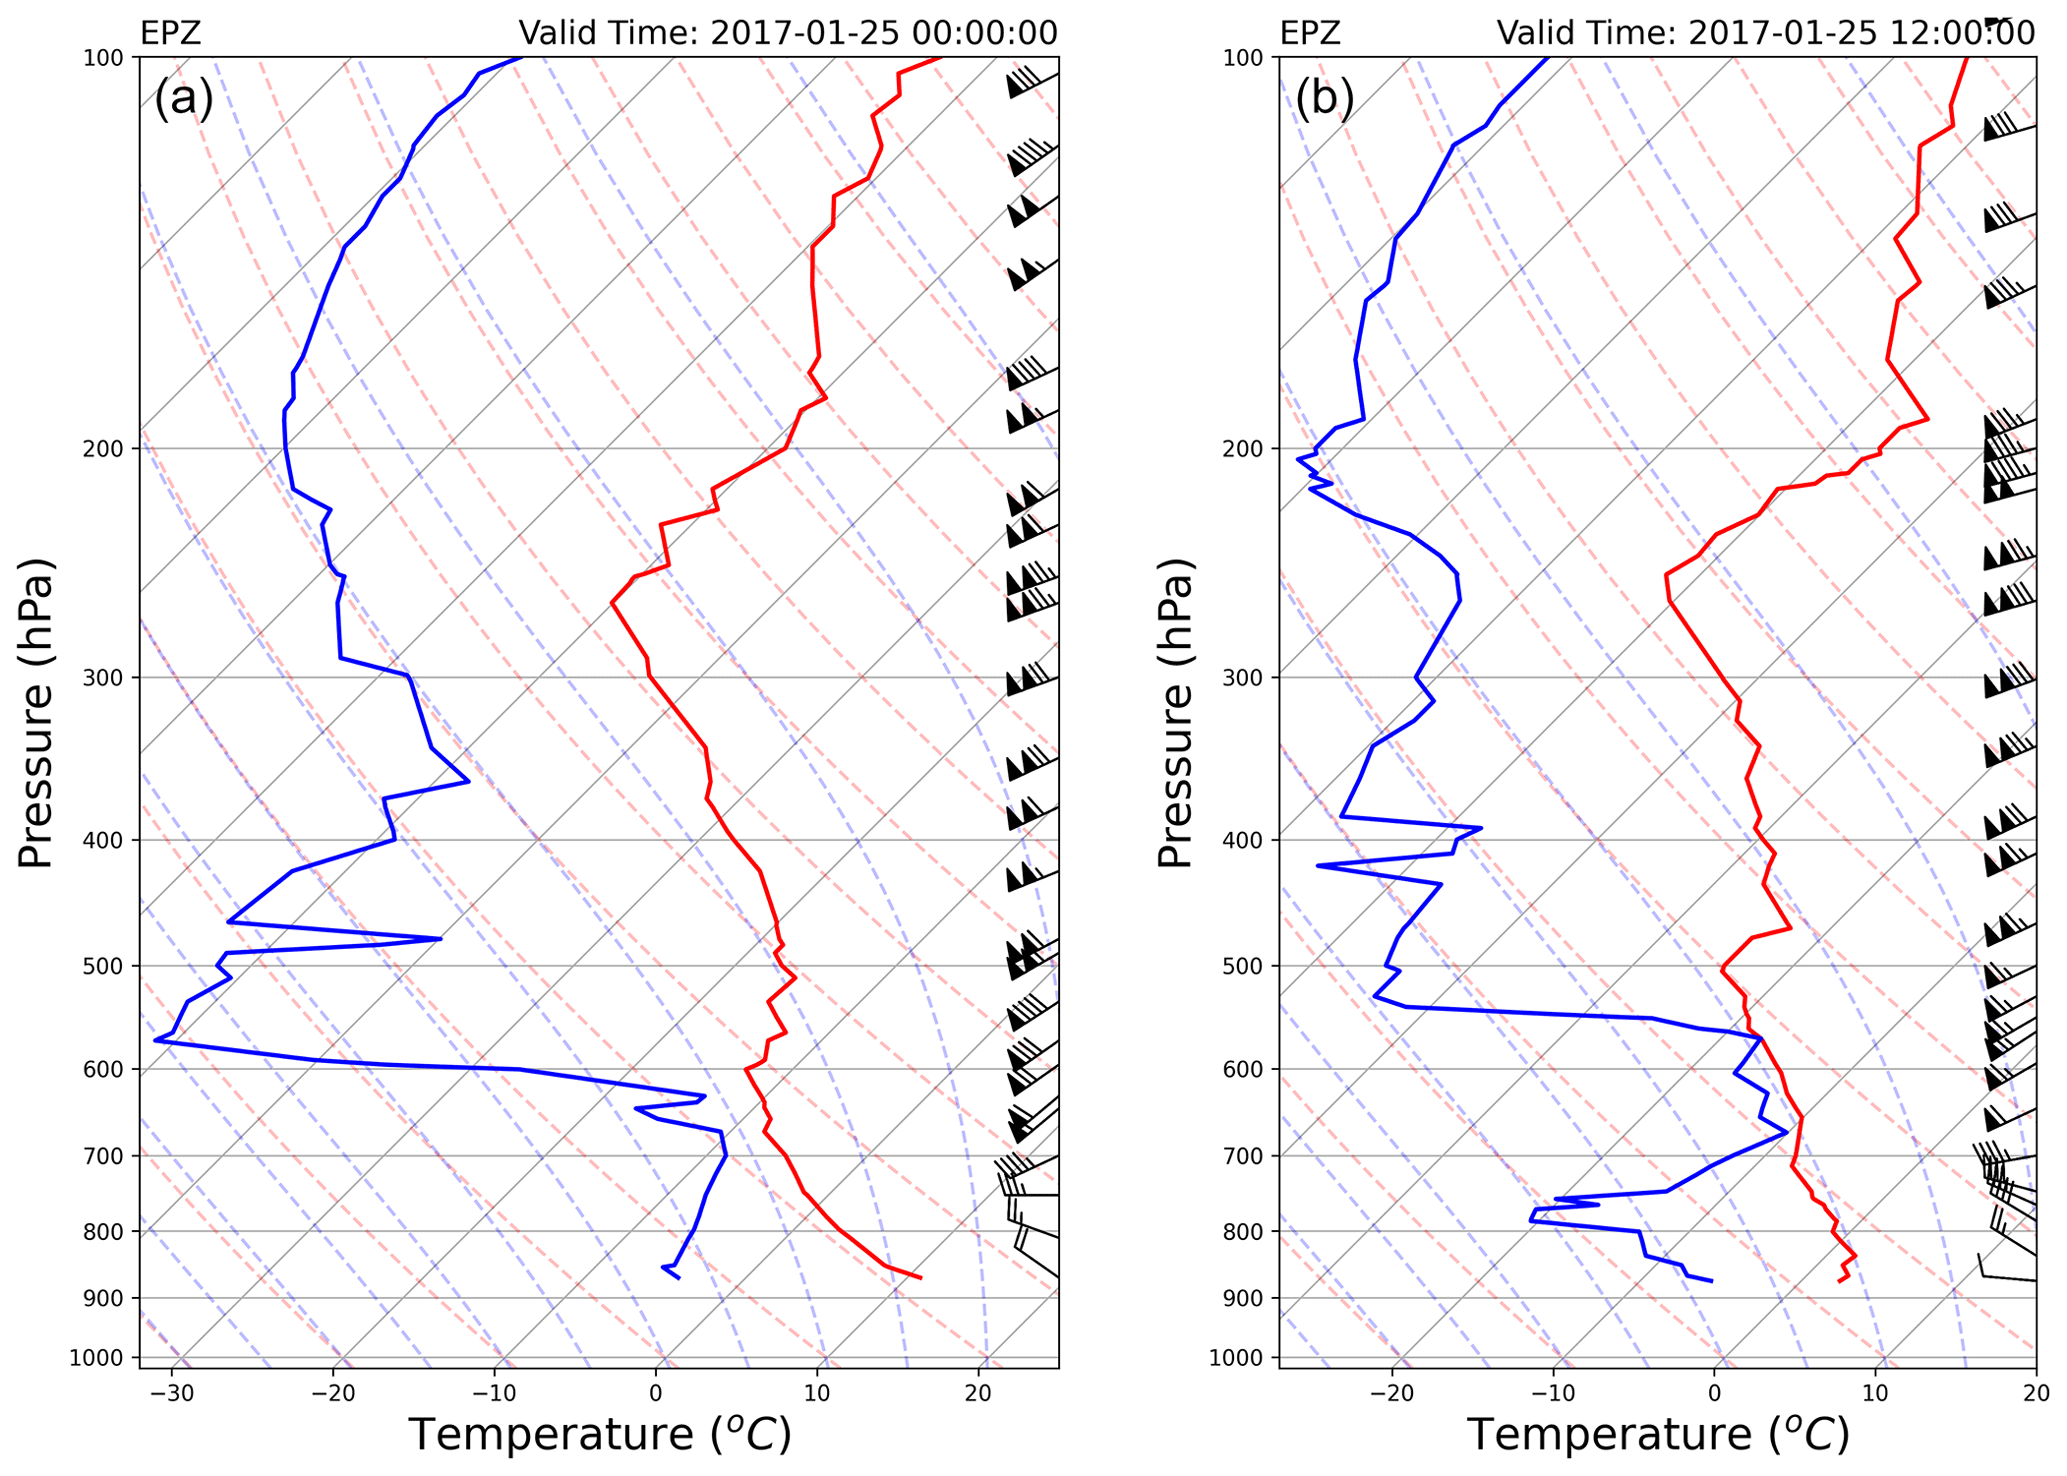
Figure 3Skew-T plot for 25 January 2017, at 00:00 UTC (a) and 12:00 UTC (b), of the radiosonde data from the NWS, Santa Teresa, New Mexico. The dew point temperature Td is indicated with blue line, and temperature T is indicated with red line. The wind barbs on the right side of each skew-T plot provide wind speed and direction at the corresponding air pressure and altitude.
The above case serves as an example of the steps followed for determining and confirming virga events during the study period of 2015–2021. This criterion is not flawless but serves as a good starting point with the data availability for this region. All events that met the above criteria were visually inspected and ascertained to be examples of virga. The next section will review the total virga found during the study and the search for patterns in their occurrences.
When virga was classified by season, a finer temporal resolution revealed important patterns. Different characteristics of virga, like any precipitation, are unique to each location, emphasizing the variability and evolution of humidity and dryness in the air. In total, 7 years' worth of backscatter profiles from the ceilometer installed at the UTEP campus was examined, and a long-term pattern of virga was established for this region. The ceilometer detected 50 virga events during the study period which met the detection criteria described in Sect. 3. Figure 4 depicts the distribution of virga events throughout the study period (March 2015–December 2021). The burgundy squares characterize days with virga, while the red squares represent days on which the ceilometer data were unavailable. Figure 4a illustrates that virga events occurred during the dry months of the year, with most of the events occurring during the winter and spring seasons. Some occurrences have also been reported in the early and late fall seasons.
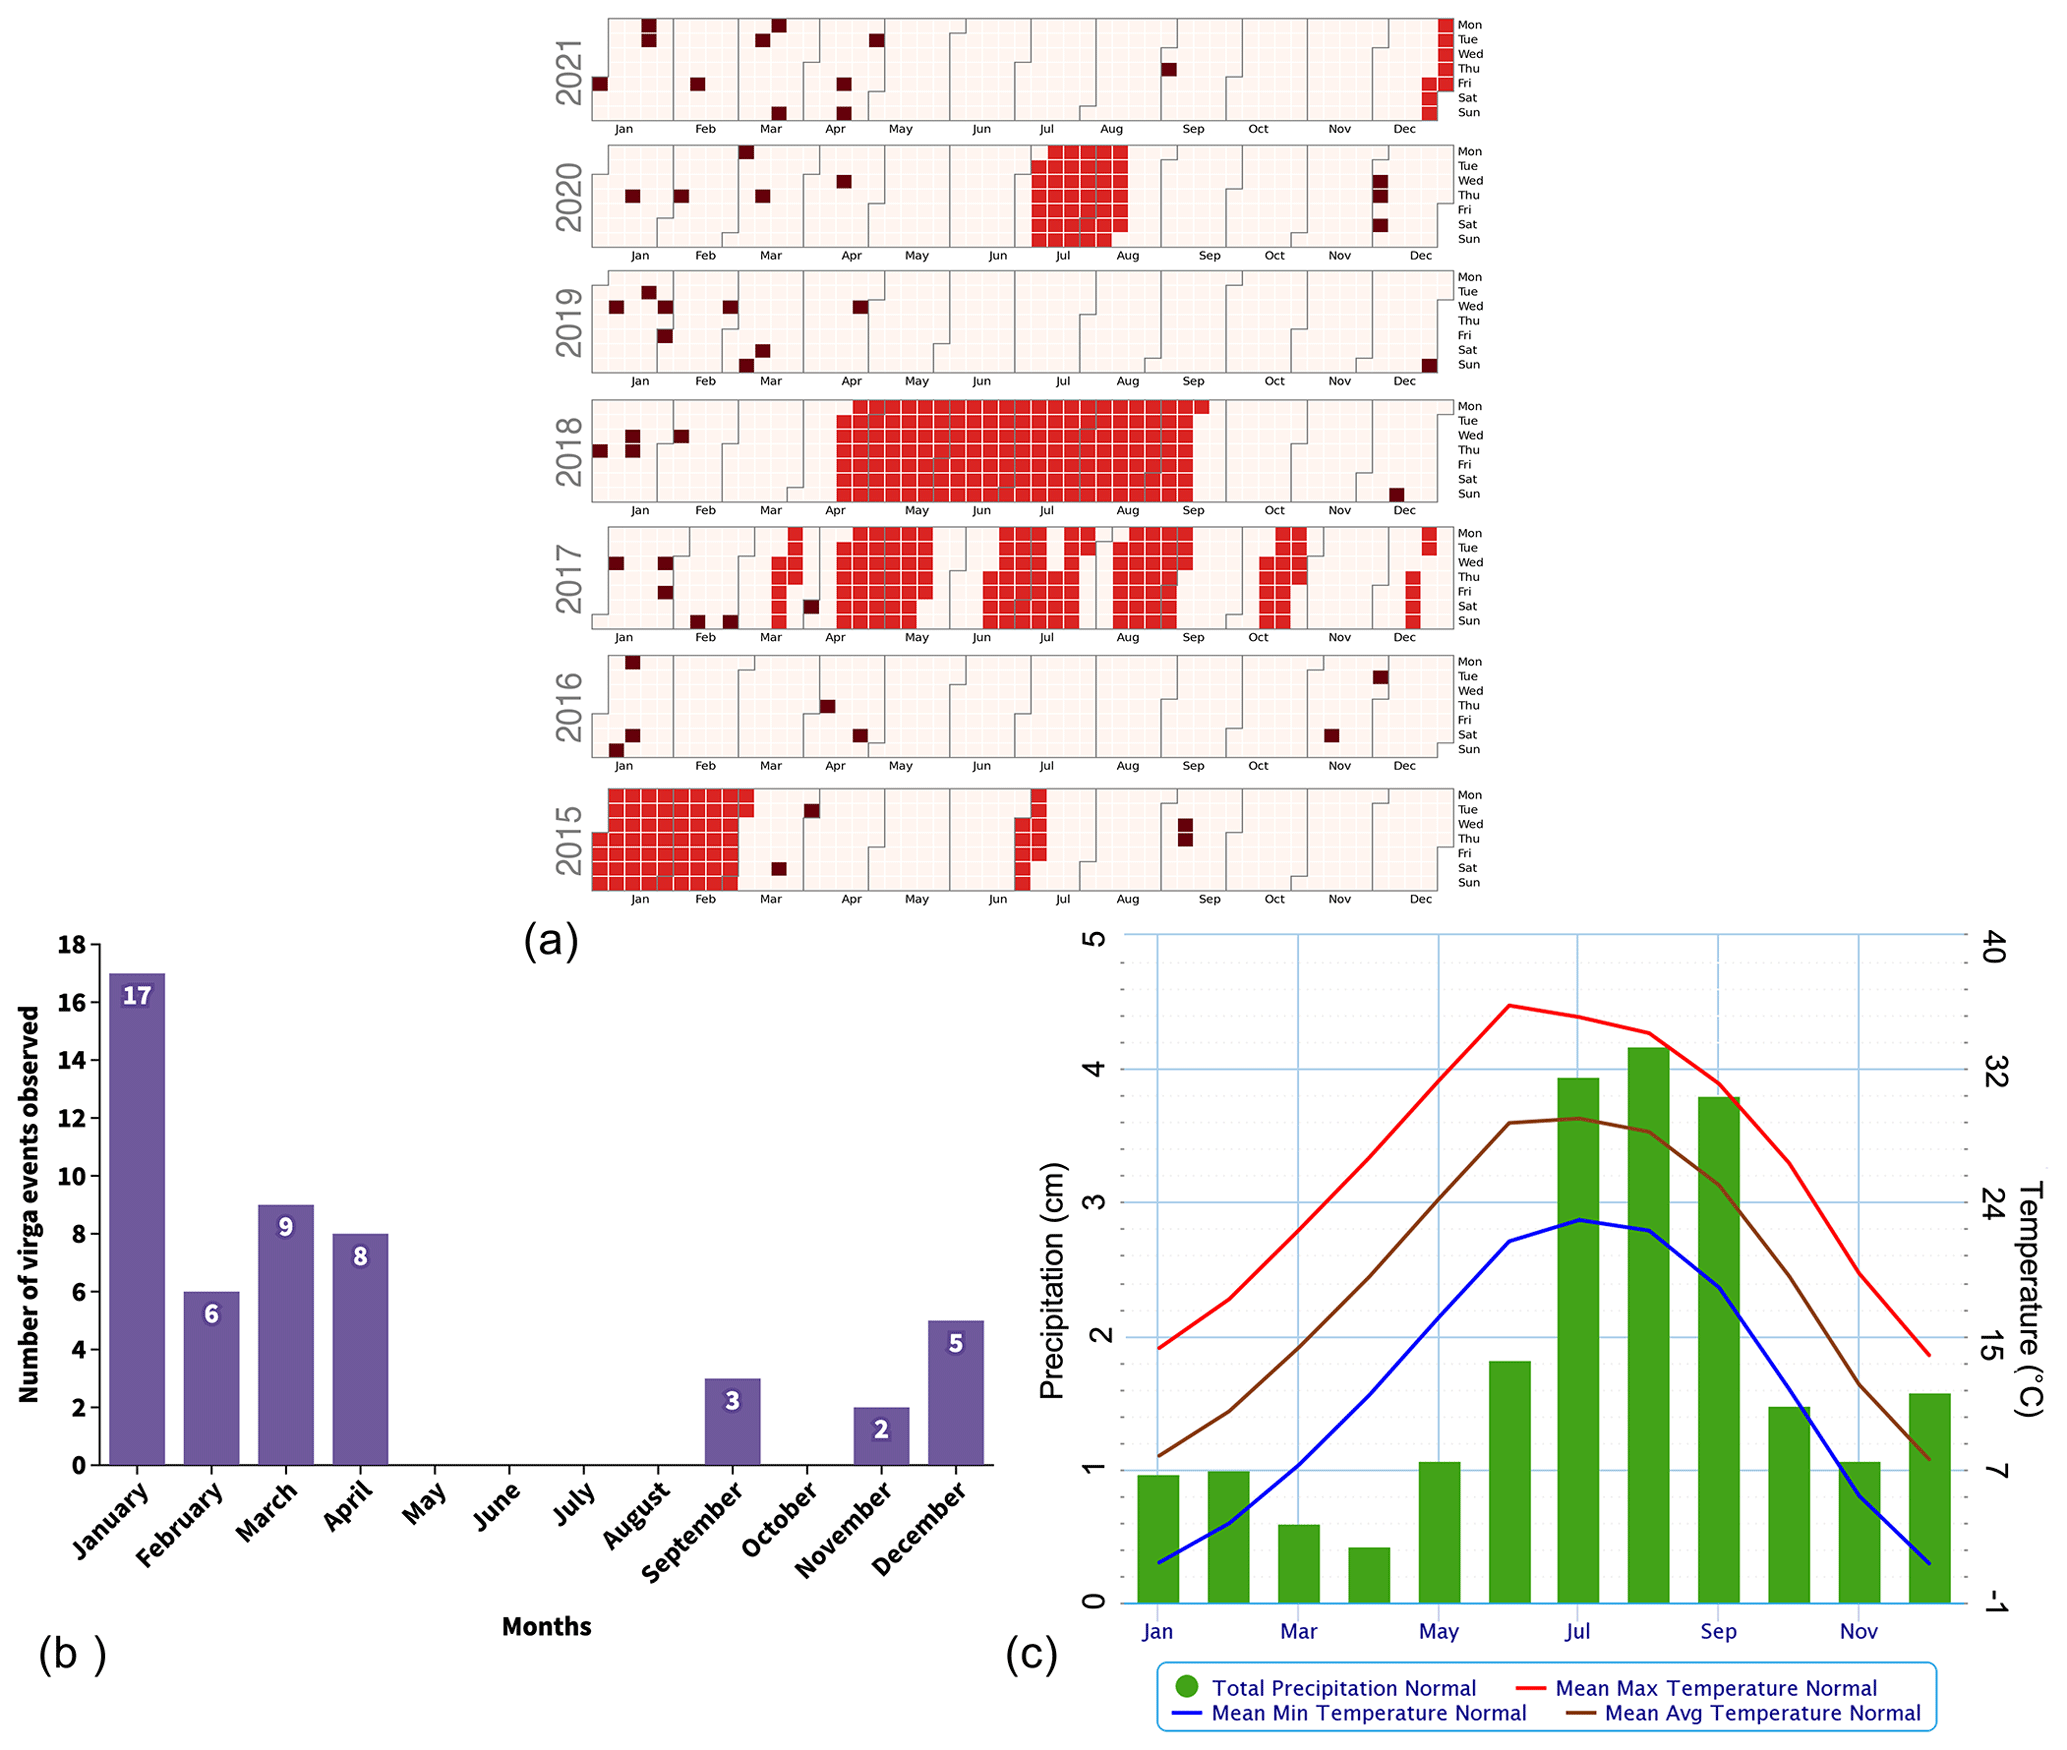
Figure 4(a) A total of 50 virga events (burgundy) observed over the 7 years of study (2015–2021). There are days on which the instrument was not functional, and such days are marked in red. (b) Monthly distribution of the virga events during the study period. (c) Monthly climate deemed normal (1991–2020) for El Paso, Texas. Image courtesy of the National Weather Service (https://www.weather.gov/, last access: 11 October 2022).
Throughout the study, the year 2021 had the highest number of virga events. This high rate of successful virga detection can be attributed to two factors, namely a new ceilometer CL51 (which was commissioned in August 2020), with a greater vertical range and more powerful laser replacing the previous CL31, and the instrument's continuous operation. Most virga events in 2021 occurred during the winter and spring seasons, with only one occurring in the early fall. Three virga events were recorded in December 2020, with one event each in January, February, and April and two in March. Similar to 2021, most of the virga events in 2019 occurred during the winter and spring months, with only one occurring in late December. The year 2015 had the fewest virga events, followed by 2018 and 2017, due to the unavailability of the ceilometer dataset as a result of technical difficulties and maintenance issues. Even though continuous ceilometer data were available throughout the year, the year of 2016 saw the fewest virga events.
Figure 4b reveals a pattern in virga occurrences. Not a single virga event was recorded in May, June, July, and August. From June to October, El Paso has humid days on which the average monthly precipitation ranges from 0.43–1.67 in. (1.09–4.24 cm; as seen in Fig. 4c). Even though September has an average of 1.52 in. (3.86 cm) of precipitation, three virga events were observed. On the remaining days of the year, this region is dry, with plenty of sunlight (Karle et al., 2020). During the summer monsoon season, conditions are mostly humid and thus not ideal for virga occurrence. January recorded the most virga events, followed by March and April, which are some of the driest months of the year, with an average precipitation of less than 0.4 in. (1.02 cm). Not a single event was observed in October, and only two were recorded in November.
The observed virga events were classified into the following two types based on a thorough analysis of the aerosol backscatter profiles: columnar and non-columnar virga events. We observed a columnar aerosol profile from the base of the virga entering the surface layer in columnar occurrences using a ceilometer, whereas aerosols were not detected between the virga and the surface aerosol layer in non-columnar events. Of the 50 events observed, 20 were columnar, while the remaining 30 were non-columnar. In the following section, we will examine two case studies representing each of the virga types mentioned above.
5.1 Case study 1: columnar virga event of 31 March 2015
The virga event on 31 March 2015 was unusual in several ways. The virga occurred between 11:00 and 15:00 UTC (local time is UTC−7) and lasted for an hour. The occurrences, however, were not continuous, and we suspect that the cloud moved away from the ceilometer, hence causing the discontinuity in virga detection. At 17:00 UTC, we witnessed another virga event lasting more than 5 h (until 22:45 UTC). The initial height of the virga (precipitation depth, in red in Fig. 5, from below the base of the cloud until it completely evaporates, i.e., no precipitation signal traced by the ceilometer) is slightly more than 0.5 km. However, as seen in Fig. 5, the streak of aerosols (green) elongates below the precipitation and enters the surface aerosol layer (blue), forming a columnar structure. During the virga episode, the cloud base appears to be well above 4 km.
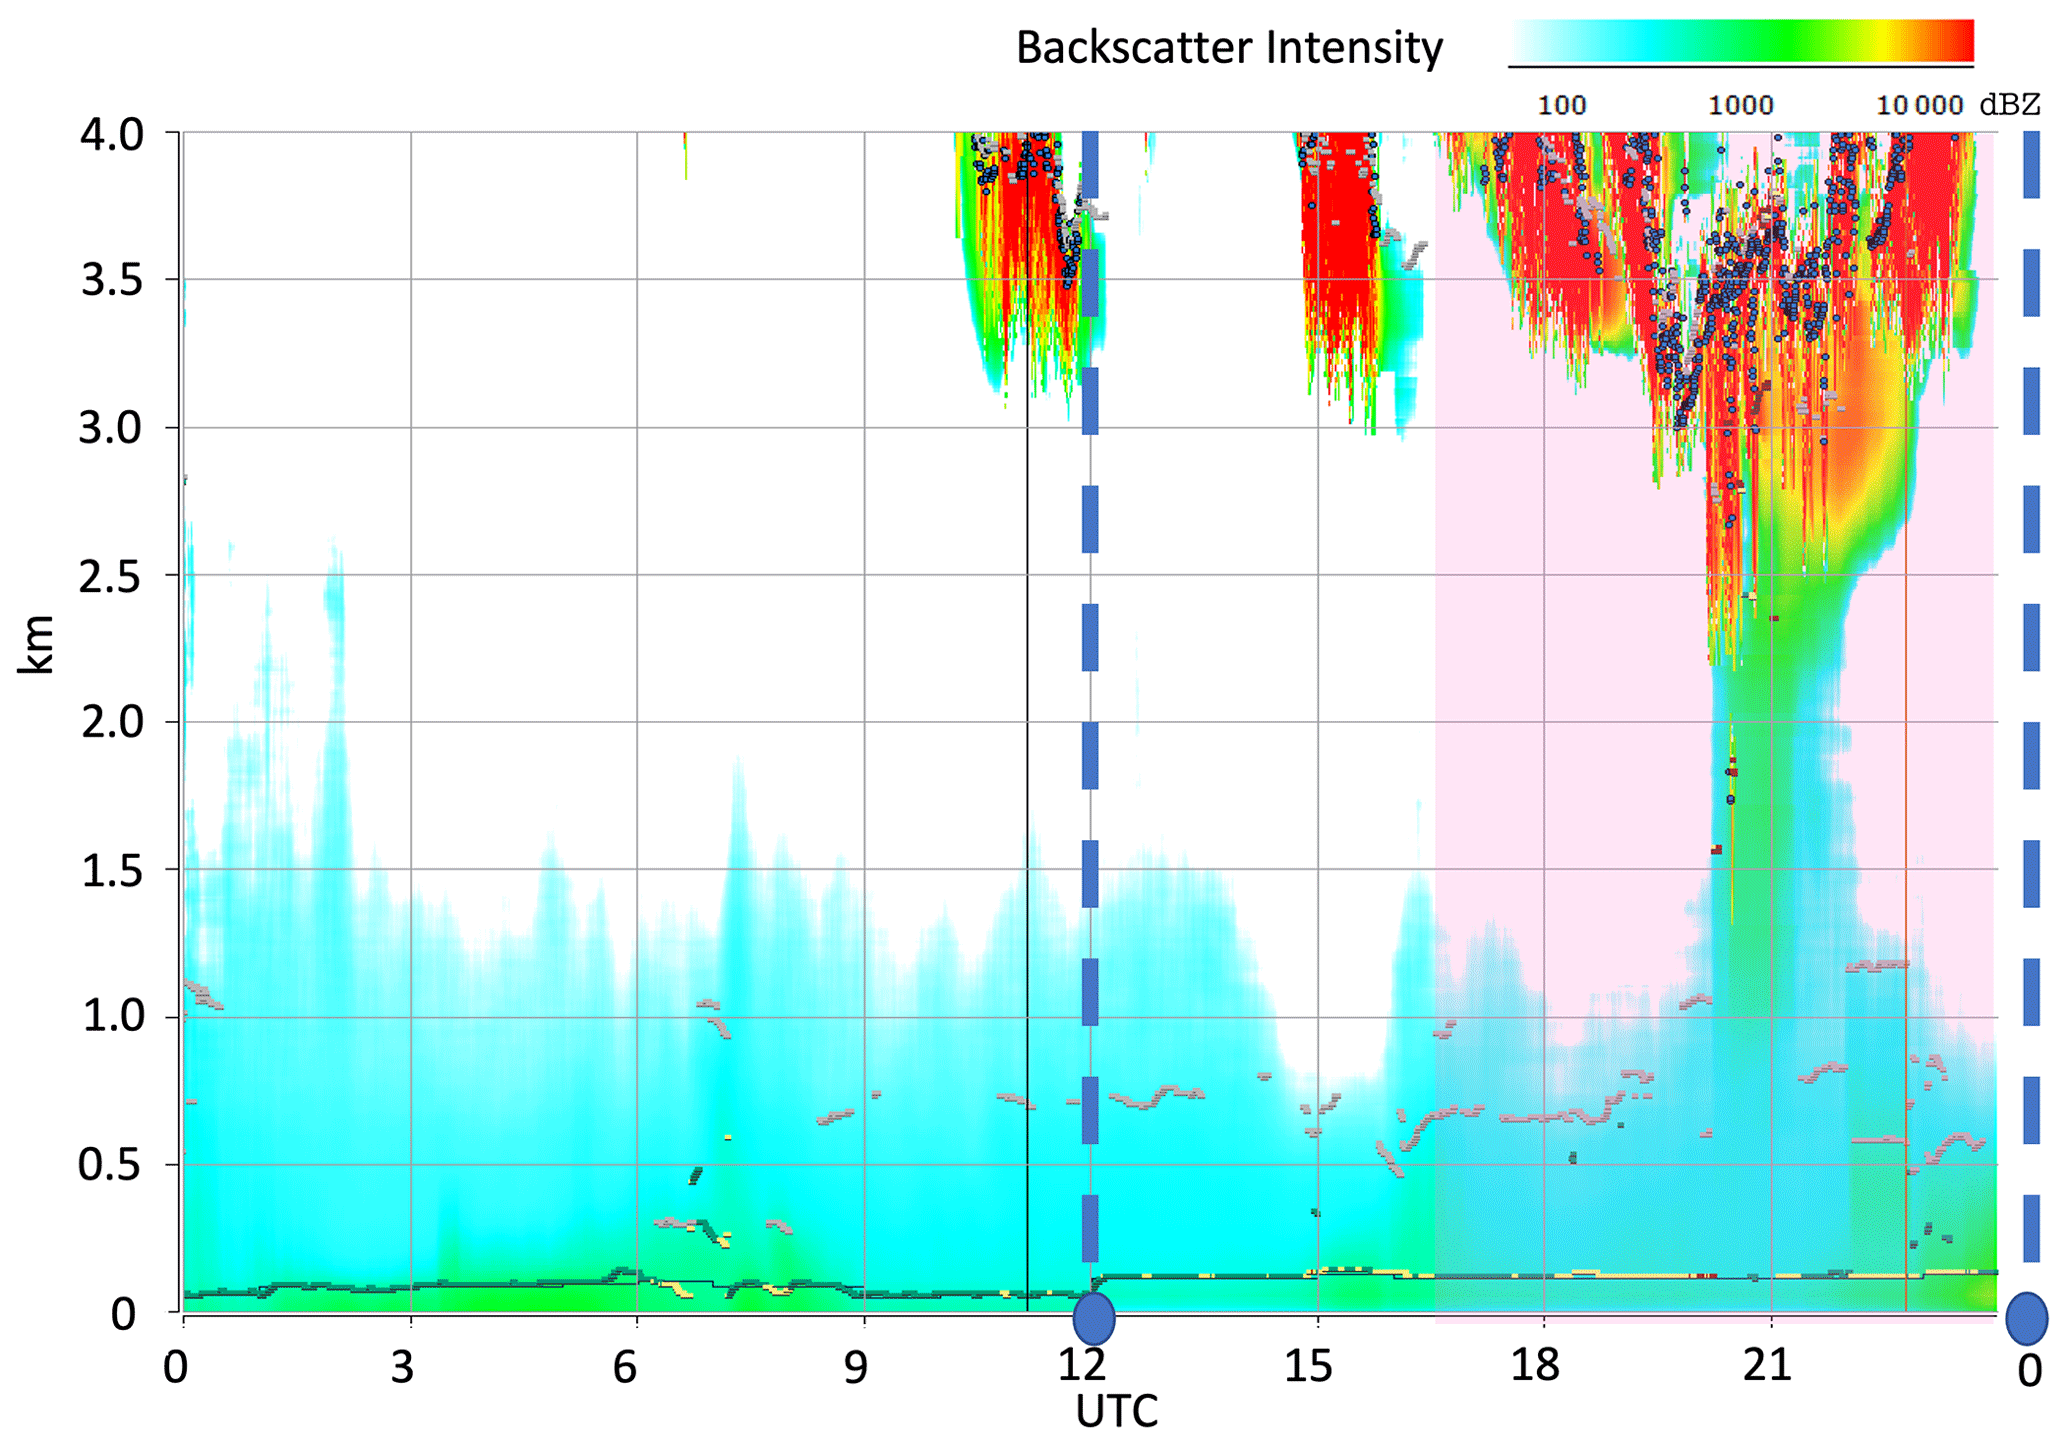
Figure 5Virga event from 31 March 2015 (shaded region), when a columnar aerosol profile can be seen at approximately 20:00–22:00 UTC, reaching the surface aerosol layer. The dashed blue lines and circles indicate the availability of radiosonde data.
Figure 6a, c, and d depict hourly (in UTC) measurements from the CAMS 12 for 31 March 2015. According to Theodore Fujita (1990) and Wakimoto (1985), a downburst (microburst) is a strong downdraft that causes an outflow of intense winds at or near the surface. Wind speed and maximum wind gust accelerated after 19:00 UTC and reached their maximum values (6.5 and 12.3 m s−1, respectively) for the day between 21:00 and 22:00 UTC. However, since the ground measurements were hourly averaged, the spike in wind gust due to dry microbursts is missing (Fig. 6a). The precipitation evaporated after descending below the cloud base and into the dry layer, causing the air to cool and become negatively buoyant, as shown in Fig. 5. During the virga event, the evaporation or sublimation of the hydrometeors is accompanied by the absorption of latent heat, which eventually leads to a progressive cooling of the lower atmospheric layers, especially below 1.5 km (Lolli et al., 2017). Since the vertical profiles of temperature and dew point temperature in Fig. 6b exhibit a deep and dry layer, changes in wind speed and maximum wind gust at 19:00 UTC can also be attributed to dry microbursts due to the availability of favorable environmental conditions. On the other hand, temperatures show a steep decline during this period, indicating that the moisture content in the air from the virga contributed to surface cooling (Fig. 6a). The relative humidity and dew point temperature have a local peak at 12:00 and 15:00 UTC, respectively, before falling precipitously (as seen in Fig. 6c). At 19:00 UTC, the relative humidity and dew point temperature rise dramatically, peaking at 23:00 UTC, thus providing another good characteristic of the virga phenomenon detected by the ceilometer. In Fig. 6d, the particulate matter (PM) concentration charts exhibit varying characteristics, and, at the beginning of the day between 00:00 and 04:00 UTC, both PM2.5 and PM10 display an increase in concentration. However, at 19:00–22:00 UTC, when the ceilometer observes the columnar structure from the virga, we see a collective increase in the PM concentrations, especially at 22:00 UTC, when we observe PM2.5 (11.6 µg m−3) and PM10 (81.4 µg m−3). We believe that, when the virga-produced dry microburst air hits the ground, it spreads out. The increase in the maximum wind gust represented the gust front which led to the increase in the PM concentrations by lifting the aerosols from the ground into the air. Another possibility which could explain the increase in PM2.5 levels is the cloud condensation nuclei (CCN) that reached the ground after the evaporation of the droplets.
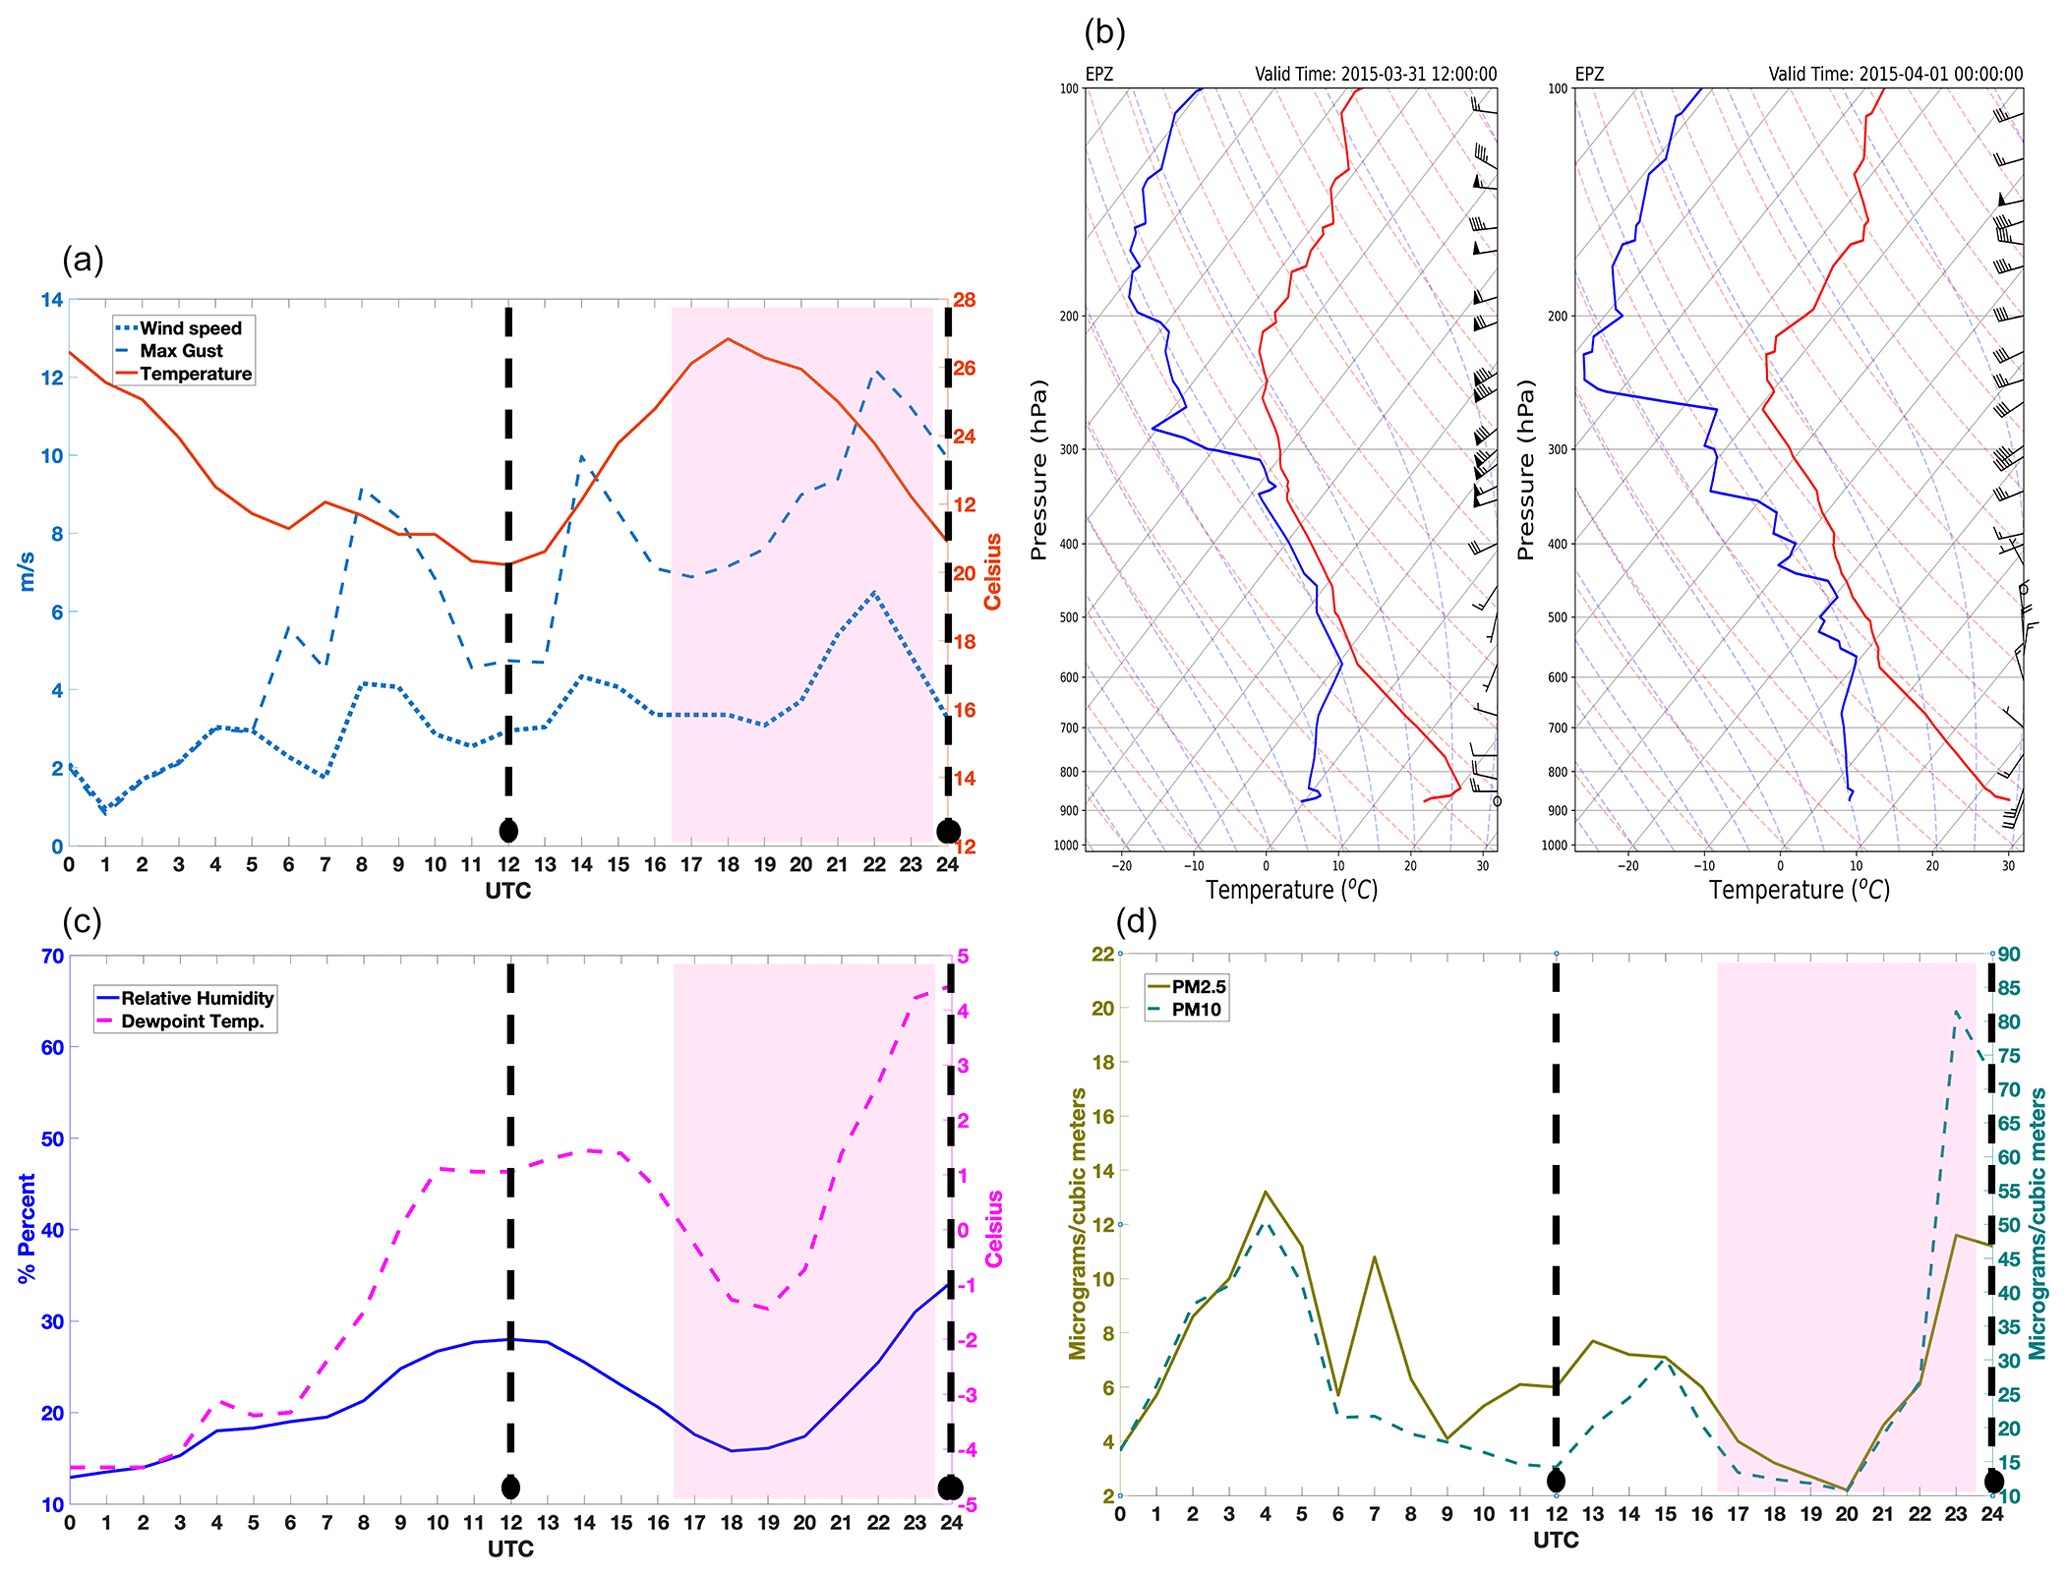
Figure 6Hourly measurements from TCEQ CAMS 12 UTEP for 31 March 2015. (a) Wind speed (dotted blue), maximum wind gust (dashed blue; m s−1), and surface temperature (red; ∘C). (b) Sounding along with wind barbs from NWS for 31 March 2015 at 12:00 UTC and 1 April 2015 at 00:00 UTC (Td in blue; T in red). (c) Relative humidity (purple) and dew point temperature (dashed pink). (d) PM2.5 concentration (olive) and PM10 concentration (dashed teal). Shaded portions represent virga events, and dashed black lines and dots represent the availability of radiosonde data.
Figure 6a shows an increase in surface wind speed and maximum gusts during the virga event (shaded). The daytime temperature peaks at 19:00 UTC and then begins to fall. The radiosonde vertical profiles on 31 March 2015 at 12:00 UTC and 1 April 2015 at 00:00 UTC provide a better understanding of the thermodynamic state of the atmosphere within and above the boundary layer (Fig. 6b). Temperature (red) and dew point temperature (blue) are further apart, between 876 mb (1.3 km a.s.l.) and 577 mb (4.7 km a.s.l.), indicating lower relative humidity at these levels. In the 00:00 UTC sounding, we observe the temperature drifting from the adiabatic ascent curve, showing a diabatic behavior. This loss of latent heat energy of the air parcel can be attributed to the air column which has cooled down after the evaporation of precipitation underneath the clouds. Another important piece of information that we obtain from the soundings is the wind intensity near the surface. As seen in the wind barbs associated with the 12:00 and 00:00 UTC sounding, winds are calm between 732 mb (2.7 km a.s.l.) and 655 mb (3.7 km a.s.l.). However, near the surface, we observe strong winds (around 10–11 m s−1), which appear to be decoupled from winds between the cloud base and the surface. Based on the thermodynamic and meteorological evidence, it can be concluded that the virga in case study 1 was intense in nature.
5.2 Case study 2: virga event of 10 March 2019
On 10 March 2019, the ceilometer recorded a 16 h long virga event beginning approximately at 10:30 UTC and ending at 23:00 UTC, followed by precipitation. Figure 7 depicts the CL31 ceilometer's attenuated aerosol backscattering. The cloud base height is roughly 4 km. Again, the ceilometer cloud detection algorithm fails to calculate the cloud base height accurately and misidentifies signals from larger rain droplets as clouds. The virga's height ranges between 1 and 1.5 km, from 10:00–00:00 UTC, and gradually decreases. We observe some precipitation reaching the ground at around 03:00 UTC, but the ground instrument (rain gauge) fails to capture this relatively small amount of precipitation. The red profile indicates a strong backscatter signal that indicates rain, while the yellow and green profiles indicate reduced intensities. At 15:00 UTC, we see a small section of virga entering the surface layer, but it is not as noticeable as in case study 1 with the columnar section. Between 10:00–15:00 and 15:30–22:00 UTC, no aerosol signal is recorded between the virga and the surface layer, indicating a disconnect between the virga and the surface aerosol layer.
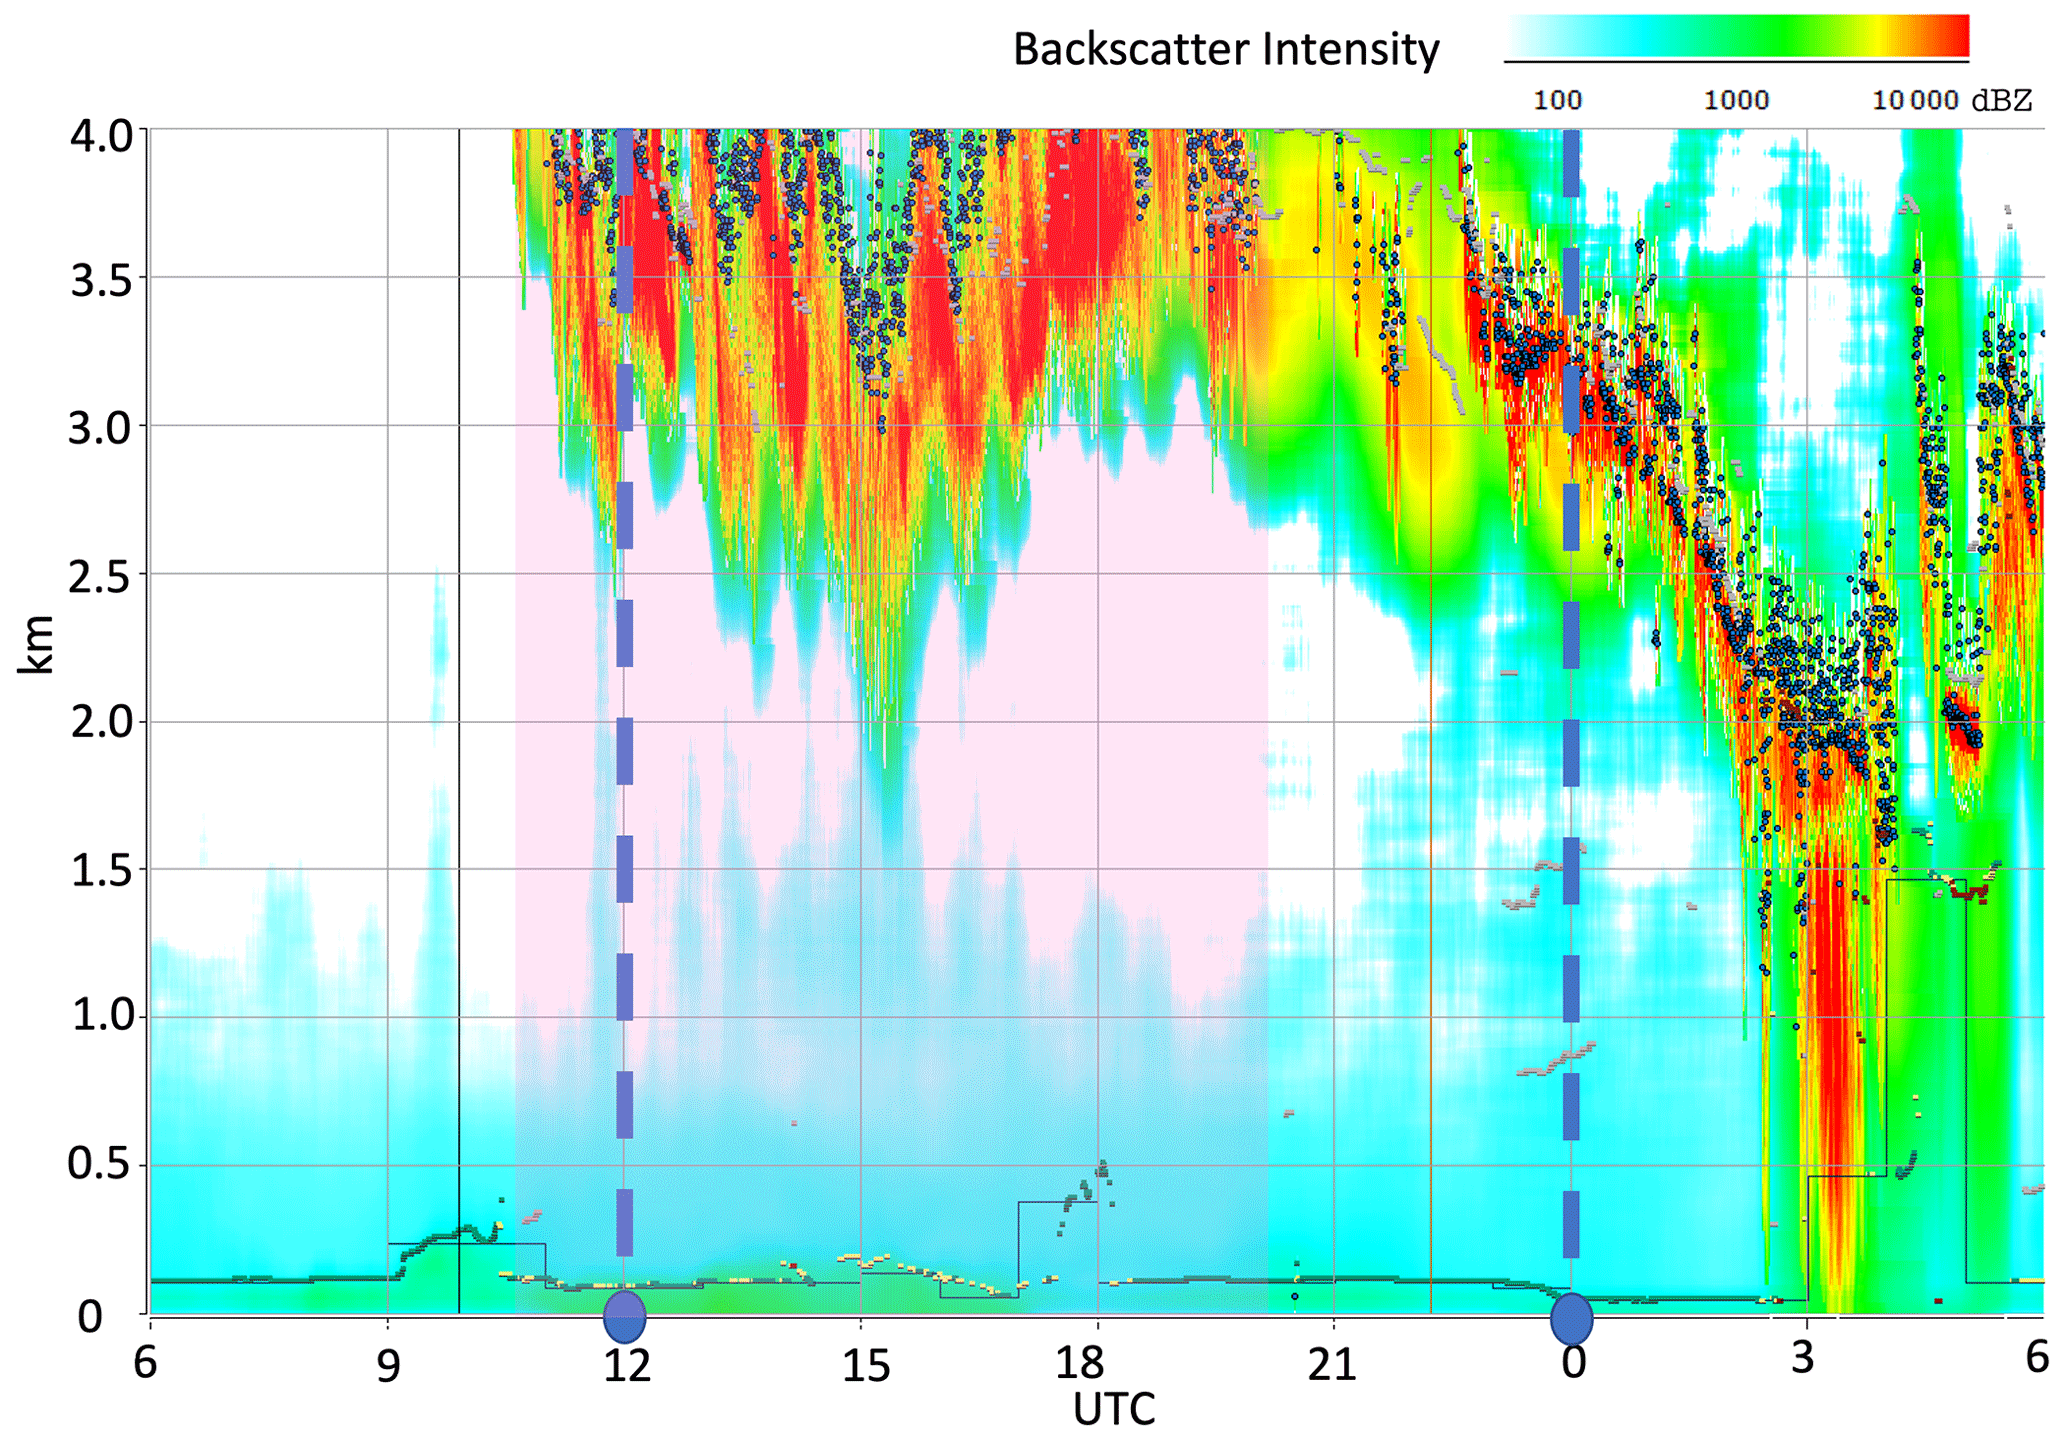
Figure 7Virga event from 10–11 March 2019 (shaded region), starting from 10:30–20:00 UTC. Light precipitation can also be observed between 03:00 and 04:00 UTC.
Maximum wind gusts were higher from 12:00 to 20:00 UTC, as shown in Fig. 8a. The temperature gradually rose after sunrise at 11:00 UTC and peaked at 17:00 UTC, before sharply declining. We attribute the sudden drop in temperature to a significant increase in air humidity (Fig. 8c). Sounding profiles show the presence of dry air near and above the surface, especially at 00:00 UTC, because the difference between Td and T is large at the surface and peaks at 677 mb (Fig. 8b). The 12:00 UTC profile is no different; dry air can be seen at the surface, even though the difference between Td and T is not as large as at 00:00 UTC. The air aloft appears to be moister as the difference between Td and T shrinks, and they come closer at 605 mb. The moisture in the upper atmosphere can be ascribed to the virga. The sudden huge increase in maximum wind gusts after 11:00 UTC is another clear indication of virga-induced dry microbursts. However, unlike in case study 1, no significant fluctuations in PM concentrations were observed, even though maximum wind gusts were recorded during the virga event (Fig. 8d). This leads us to infer that no aerosol loading occurred in the surface layer following precipitation evaporation. Another significant difference between the two case studies is the humidity in the air. In case study 1, we observe the percent of relative humidity increasing from 16 % to 31 % during the time of the virga event. In this case study, however, we observe that the percent relative humidity does not show a lot of fluctuation from 11:00–17:00 UTC but eventually shows sudden growth at around 18:00 UTC.
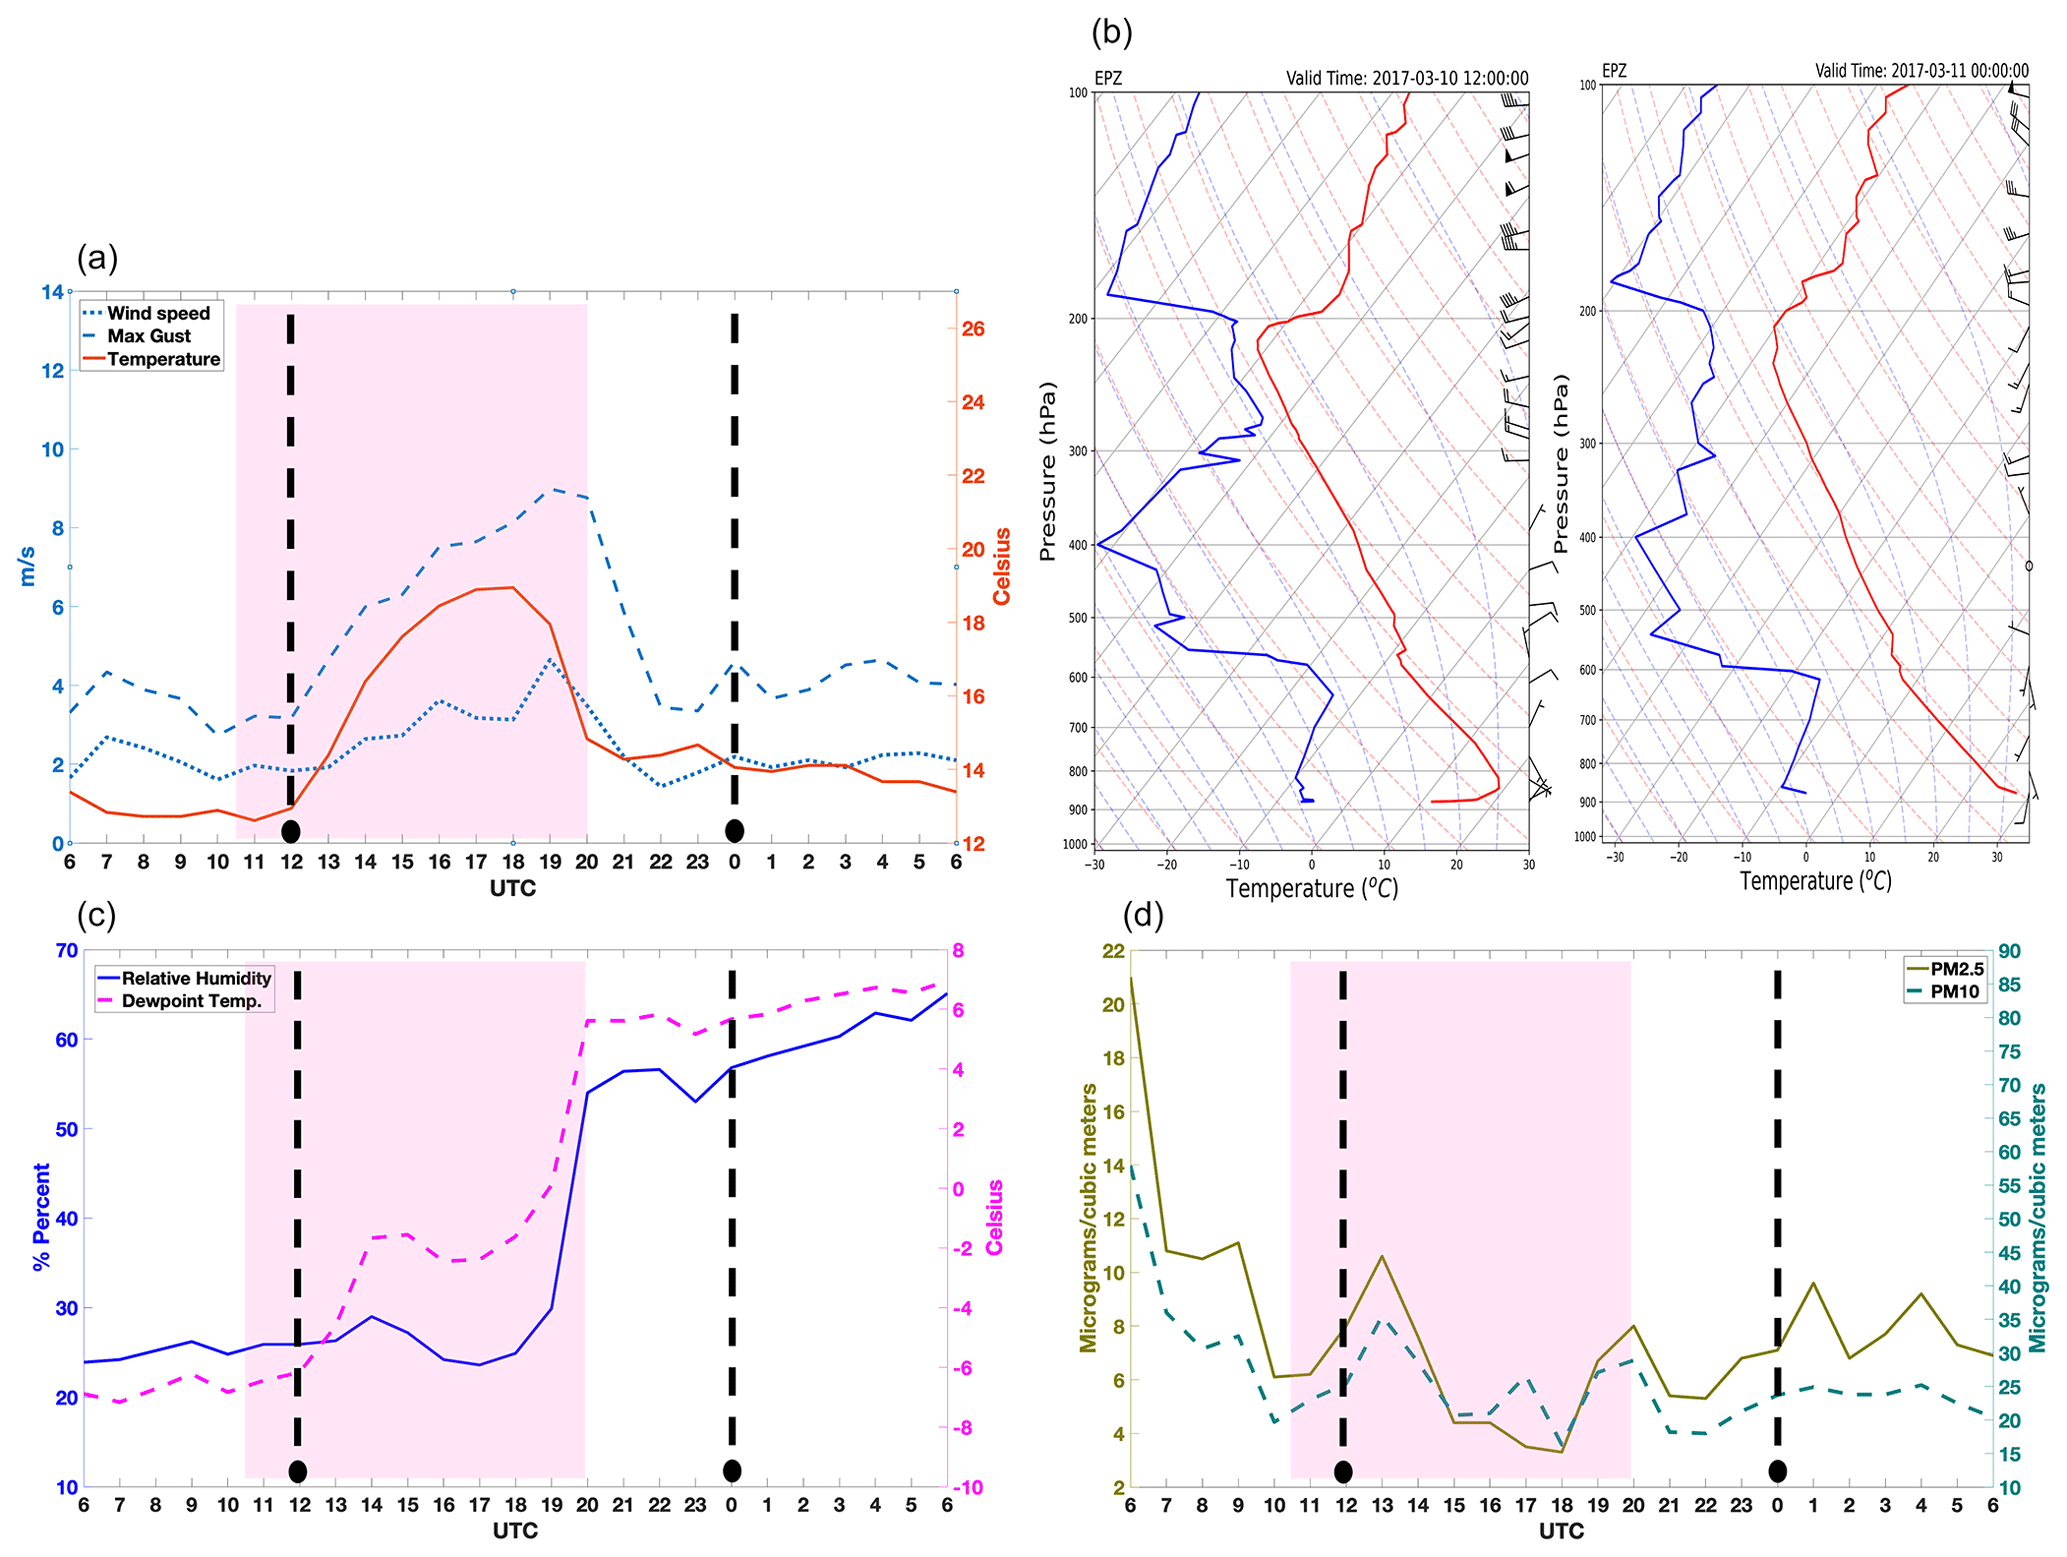
Figure 8Hourly surface measurements in UTC from the CAMS 12 at UTEP for 10–11 March 2019. (a) Wind speed (dotted blue), maximum wind gust (dashed blue; m s−1), and surface temperature (red; ∘C). (b) Sounding along with wind barbs from NWS for 10 March 2017 at 12:00 UTC and 11 March 2017 at 00:00 UTC (Td in blue; T in red). (c) Relative humidity (purple) and dew point temperature (dashed pink). (d) PM2.5 concentration (olive) and PM10 concentration (dashed teal). Shaded portions represent the virga event, and dashed black lines and dots represent the availability of radiosonde data.
The radiosonde vertical profiles reveal the absence of strong winds on the surface and within the boundary layer in the case of non-columnar virga. The 12:00 UTC profile overlaps with the virga's initial phase, whereas the 00:00 UTC profile provides information after the virga has ended (Fig. 8b). Both soundings indicate the presence of dry layers between 900 and 600 mb and 600 and 300 mb, respectively. In contrast to the columnar virga, the temperature profile at 00:00 UTC follows the adiabatic ascent curve between 880 and 600 mb. Figure 8a shows that the surface wind and gust intensity were lower than what was observed in the columnar case. Based on ground measurements, we can see (in Fig. 8c) that the surface was relatively more humid than in the columnar case and that the percent relative humidity increased rapidly at the end of the virga event. Based on the evidence presented above, we hypothesize that the virga intensity was lower in the non-columnar case, resulting in mild winds at the surface (as shown in Fig. 8d); hence, there were relatively lower concentrations of fine aerosol loading into the atmosphere. Furthermore, the higher moisture content in the air resulted in lower PM concentrations.
5.3 Relationship between ground measurements during virga events
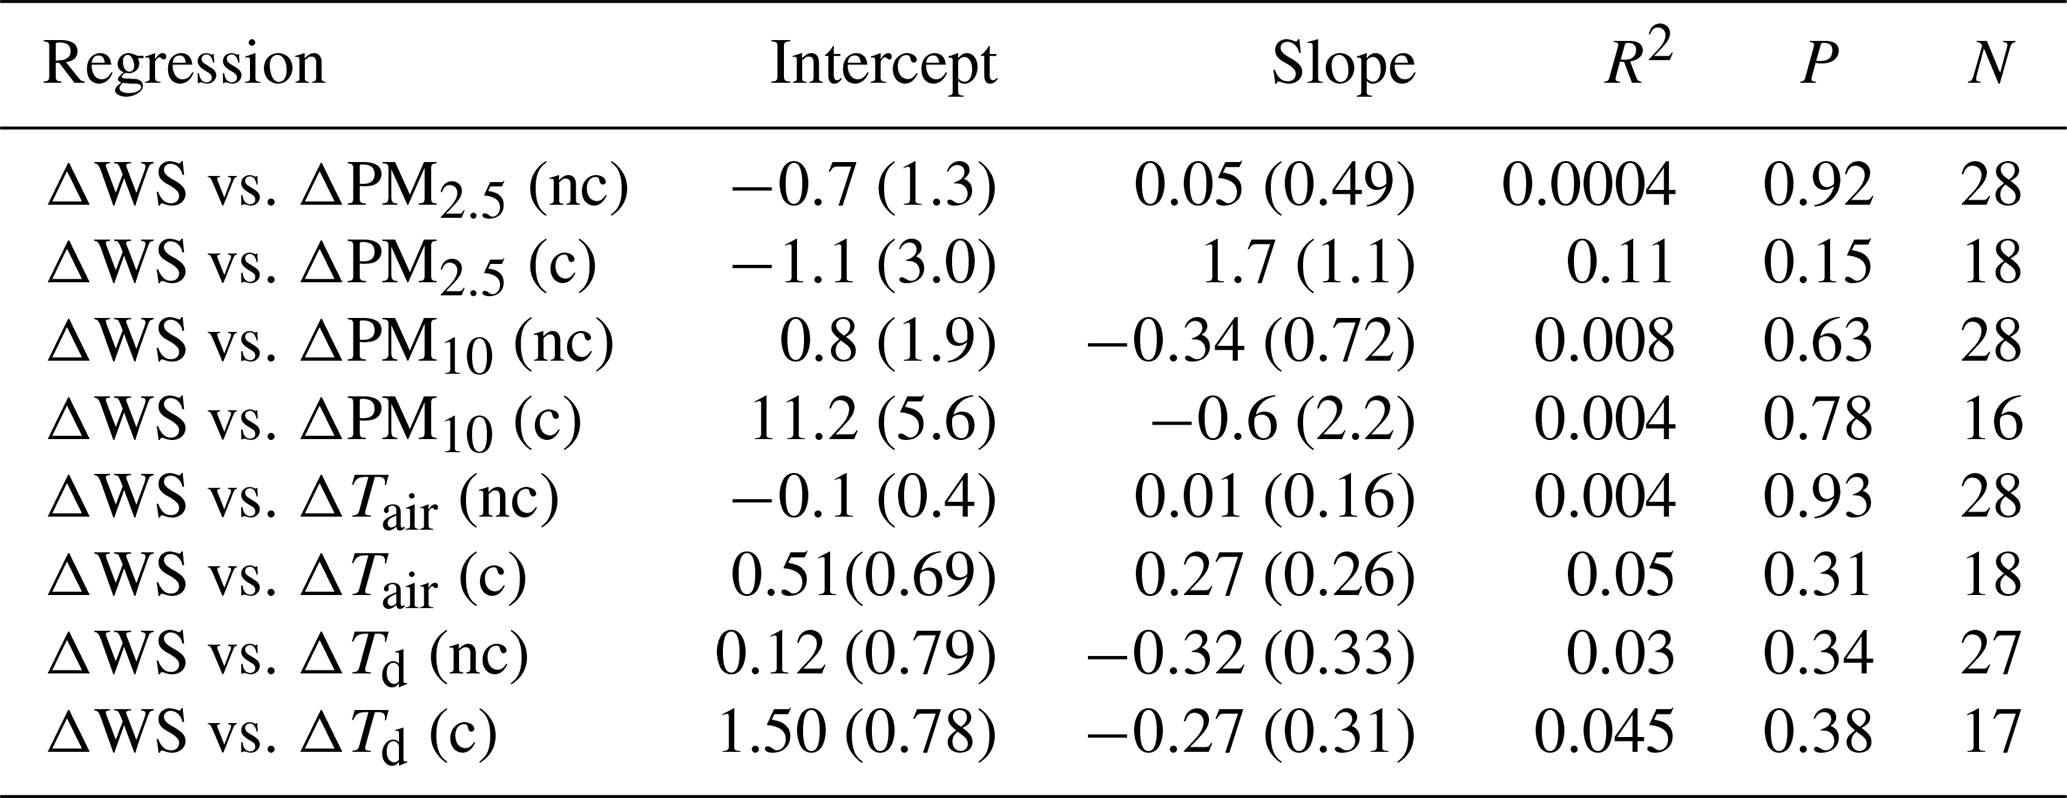
We performed linear regression analyses for several ground measurements during the virga events to quantify and analyze changes at the ground level. The rate of change in wind speed (ΔWS) during the episode was compared with that of ΔPM2.5, ΔPM10, ΔTair, and ΔTd during both the columnar and non-columnar virga events (as seen in Table 1). We calculated the p value, a statistical parameter to validate a hypothesis against observed data, and observed that all p values were higher than 0.05, meaning that we cannot affirm that the slope calculated for the linear regression is not zero with 95 % confidence interval. The R2 values show a slight improvement for most of the regressions for column virga cases. ΔWS vs. ΔPM2.5 had a higher R2 value in columnar episodes than in the other cases. All of this indicates that the hourly surface values, which were obtained from the CAMS, hinder the detection of the virga and the microburst effects on the surface measurement time series.
Table 1Regression parameters for several surface variables of the Column virga cases (c) and not column virga cases (nc). WS is the wind speed, PM2.5 is the particulate matter at 2.5 µm, PM10 is the particulate matter at 10 µm, Tair is the air temperature, and Td is the dew point temperature. The linear fit parameters are as follows: R2 is the squared correlation coefficient, P is the p value, and N is the sample size. Values in parenthesis are the standard error.
This study investigated and characterized virga events in El Paso, Texas, using a combination of ceilometer, radiosonde, radar, meteorological, and PM ground measurements and analyzed its impact on local air quality. In the literature, very few studies cover a wide range of virga forms and circumstances. However, this work has special merit due to the many events that were detected, classified, and analyzed. Our research extends the literature by providing an initial investigation into virga's impact on ground-level PM concentrations. A gradient in attenuated aerosol backscatter intensities detected by ceilometers (CL31 and CL51) helped to identify virga. Retrieving the cloud base height during some virga events was difficult due to large rain droplets. Backscatter profiles from 2015 to 2021 revealed 50 virga events that occurred locally. The inspection of virga events during the study period revealed a seasonal pattern of occurrence. No virga event was observed during the summer season when the moisture content in the region is high due to the arrival of the North American monsoon. It was further shown that the month of January, followed by March, reported the maximum virga events.
Every event observed and analyzed during this work was unique in its way, and no two events were the same. However, we identified and categorized these 50 events into two types, namely columnar and non-columnar events. Columnar virga events displayed a column-like aerosol structure below the virga entering the surface layer, whereas non-columnar events displayed no such structures. Instead, we observe the absence of aerosol between the virga and surface layer for non-columnar events. Since it was impossible to discuss all 50 events in this paper, we presented only the most significant ones as case studies. The virga cases discussed in this work lasted for more than 4 h, during which no precipitation was recorded at the ground level, even though the surface measurements did indicate an increase in moisture content in the air. Both events were characterized by gusty winds, as indicated by the hourly maximum wind gusts data. The non-columnar virga case of 10 March 2019 was gustier than the columnar event. Relative humidity and dew point temperature data in both of those cases showed a sudden increase during the virga phase, indicating a sudden increase in the moisture content in the air. The sudden increase in PM concentrations in the columnar virga episode on 10 March 2019 can be attributed to a microburst-produced gust front, which caused a sudden spike in PM levels by lifting aerosols from the ground into the air. Another possible explanation for the sudden increase in PM2.5 levels is CCN reaching the ground after droplet evaporation. We also observe that, with the gradual increase in humidity levels, the PM levels eventually drop, since this PM would serve as the raindrop nuclei.
This study also shows that a ceilometer can be a good and affordable alternative to lidars for the detection of virga episodes and could provide more information on dry microbursts. Ceilometers are available at all airports in the United States, but they gather mostly cloud height information. If the attenuated aerosol backscatter profiles from these ceilometers are made available, then they can provide useful information on phenomena such as virga and dry microbursts.
The availability of higher temporal resolution ground measurements will undoubtedly improve and solidify the correlation between the various parameters discussed in Table 1. If funds are available, using an all-sky camera (capable of capturing finer-temporal-resolution images) in conjunction with the ceilometer would greatly aid in capturing the virga precipitation. During the virga event, launching co-located radiosondes could provide an excellent dataset of vertical atmospheric profiles, especially of the wind flows. A comprehensive study that includes such instrumentation and approaches would allow researchers to investigate the possibility of a strong connection between vertical winds, virga, and a local rise in PM levels. It also emphasizes the importance of having diverse instrumentation at the El Paso site, such as sonic anemometers, wind profilers, and barometers, which will provide a comprehensive dataset that will further enhance our understanding of virga and dry microbursts in the region. This research work will undoubtedly be a starting point for researchers to better comprehend the link between virga events and air quality. It will be worth analyzing the impact virga has on the climatology of precipitation in semi-arid regions.
Data and additional graphs related to this article are available upon request to the corresponding author.
The conceptualization was performed by NNK, RKS, RMF, and WRS. FM provided the ground measurements, and NNK and RKS curated the data. The methodology and investigation were completed by NNK and RKS. NNK, RKS, RMF, and WRS performed the analysis. NNK drafted the original paper, which was reviewed and edited by RMF and WRS. CI contributed significantly to improving this work. Supervising was the responsibility of RKS and WRS, and RMF acquired funding for the project.
The contact author has declared that none of the authors has any competing interests.
Publisher's note: Copernicus Publications remains neutral with regard to jurisdictional claims in published maps and institutional affiliations.
The authors want to specially thank Belay Demoz, for providing useful research suggestions pertaining to virga. We are thankful to the Texas Commission on Environmental Quality (TCEQ) and the National Weather Service (NWS), for supporting the data collection and archiving. Special thanks are extended to NOAA Cooperative Science Center for Atmospheric Sciences and Meteorology (NCAS-M), for the continuous support.
The research has partly been supported by the U.S. Department of Commerce, the National Oceanic and Atmospheric Administration Educational Partnership Program (grant no. NA22SEC4810015), the NOAA cooperative science Center for Atmospheric Sciences and Meteorology (NCAS-M), and the Texas Commission on Environmental Quality (TCEQ).
This paper was edited by Can Li and reviewed by two anonymous referees.
Airey, M. W., Nicoll, K. A., Harrison, R. G., and Marlton, G. J.: Characteristics of Desert Precipitation in the UAE Derived from a Ceilometer Dataset, Atmosphere, 12, 1245, https://doi.org/10.3390/atmos12101245, 2021.
Beynon, R. and Hocke, K.: Snow Virga above the Swiss Plateau Observed by a Micro Rain Radar, Remote Sensing, 14, 890, https://doi.org/10.3390/rs14040890, 2022.
Cheng, C. and Yi, F.: Falling Mixed-Phase Ice Virga and their Liquid Parent Cloud Layers as Observed by Ground-Based Lidars, Remote Sensing, 12, 2094, https://doi.org/10.3390/rs12132094, 2020.
Evans, E., Stewart, R. E., Henson, W., and Saunders, K.: On Precipitation and Virga over Three Locations during the 1999–2004 Canadian Prairie Drought, Atmos. Ocean, 49, 366–379, https://doi.org/10.1080/07055900.2011.608343, 2011.
Fitzgerald, R. M., Karle, N. N., Lara, P., Polanco Gonzalez, J., and Stockwell, W. R.: Optical Measurements of Particulate Matter in the El Paso-Juarez Region: Natural Mineral Dust and Soot, EM, 6 pp., https://airandwmapa.sharepoint.com/sites/AWMA_Website/Shared%20Documents/em-do%20not%20delete/2021/10/fitzgerald.pdf (last access: 24 February 2023), 2021.
Fraser, A. B. and Bohren, C. F.: Is Virga Rain That Evaporates before Reaching the Ground?, Mon. Weather Rev., 120, 1565–1571, https://doi.org/10.1175/1520-0493(1992)120<1565:IVRTEB>2.0.CO;2, 1992.
Fujita, T. T. and Byers, H. R.: Spearhead Echo and Downburst in the Crash of an Airliner, Mon. Weather Rev., 105, 129–146, https://doi.org/10.1175/1520-0493(1977)105<0129:SEADIT>2.0.CO;2, 1977.
Grazioli, J., Madeleine, J.-B., Gallée, H., Forbes, R. M., Genthon, C., Krinner, G., and Berne, A.: Katabatic winds diminish precipitation contribution to the Antarctic ice mass balance, P. Natl. Acad. Sci. USA, 114, 10858–10863, https://doi.org/10.1073/pnas.1707633114, 2017.
Henderson-Sellers, B.: A new formula for latent heat of vaporization of water as a function of temperature, Q. J. Roy. Meteor. Soc., 110, 1186–1190, https://doi.org/10.1002/qj.49711046626, 1984.
Jullien, N., Vignon, É., Sprenger, M., Aemisegger, F., and Berne, A.: Synoptic conditions and atmospheric moisture pathways associated with virga and precipitation over coastal Adélie Land in Antarctica, The Cryosphere, 14, 1685–1702, https://doi.org/10.5194/tc-14-1685-2020, 2020.
Karle, N. N.: Study of the Urban Heat Island and its Effect on the Planetary Boundary Layer for the El Paso-Juarez Airshed, American Geophysical Union (AGU) annual meeting, New Orleans, LA, 15 December 2017, A51A-2032, https://doi.org/10.13140/RG.2.2.22859.49449/1, 2017.
Karle, N. N.: Studies of the Planetary Boundary Layer and their Impact on Air Pollution in a Semi-Arid Region with Complex Terrain, PhD thesis, The University of Texas at El Paso, Texas, United States, 179 pp., ISBN 9798544272649, 2021.
Karle, N. N., Mahmud, S., Sakai, R. K., Fitzgerald, R. M., Morris, V. R., and Stockwell, W. R.: Investigation of the Successive Ozone Episodes in the El Paso–Juarez Region in the Summer of 2017, Atmosphere, 11, 532, https://doi.org/10.3390/atmos11050532, 2020.
Karle, N. N., Fitzgerald, R. M., Sakai, R. K., Sullivan, D. W., and Stockwell, W. R.: Multi-Scale Atmospheric Emissions, Circulation and Meteorological Drivers of Ozone Episodes in El Paso-Juárez Airshed, Atmosphere, 12, 1575, https://doi.org/10.3390/atmos12121575, 2021.
Lara, P., Fitzgerald, R. M., Karle, N. N., Talamantes, J., Miranda, M., Baumgardner, D., and Stockwell, W. R.: Winter and Wildfire Season Optical Characterization of Black and Brown Carbon in the El Paso-Ciudad Juárez Airshed, Atmosphere, 13, 1201, https://doi.org/10.3390/atmos13081201, 2022.
Lolli, S., Girolamo, P. D., Demoz, B., Li, X., and Welton, E. J.: Rain Evaporation Rate Estimates from Dual-Wavelength Lidar Measurements and Intercomparison against a Model Analytical Solution, J. Atmos. Ocean. Tech., 34, 829–839, https://doi.org/10.1175/JTECH-D-16-0146.1, 2017.
Ludlam, F. H.: Clouds and storms: the behavior and effect of water in the atmosphere, Pennsylvania State University Press, University Park, 405 pp., ISBN: 02-710-05157, 1980.
McCarthy, J., Wilson, J. W., and Fujita, T. T.: The Joint Airport Weather Studies Project, B. Am. Meteorol. Soc., 63, 15–22, https://doi.org/10.1175/1520-0477(1982)063<0015:TJAWSP>2.0.CO;2, 1982.
Petterssen, S.: Introduction to Meteorology, 2nd edn., McGraw Hill, 371 pp., ISBN-10: 0070497206, 1958.
Rogers, R. R., Lamoureux, M.-F., Bissonnette, L. R., and Peters, R. M.: Quantitative Interpretation of Laser Ceilometer Intensity Profiles, J. Atmos. Ocean. Tech., 14, 396–411, https://doi.org/10.1175/1520-0426(1997)014<0396:QIOLCI>2.0.CO;2, 1997.
Saikranthi, K., Narayana Rao, T., Radhakrishna, B., and Rao, S. V. B.: Morphology of the vertical structure of precipitation over India and adjoining oceans based on long-term measurements of TRMM PR, J. Geophys. Res.-Atmos., 119, 8433–8449, https://doi.org/10.1002/2014JD021774, 2014.
Schafer, K., Emeis, S. M., Rauch, A., Munkel, C., and Vogt, S.: Determination of mixing layer heights from ceilometer data, in: Remote Sensing of Clouds and the Atmosphere IX, Remote Sensing of Clouds and the Atmosphere IX, 248–259, https://doi.org/10.1117/12.565592, 2004.
Singh, M. S. and O'Neill, M. E.: The climate system and the second law of thermodynamics, Rev. Mod. Phys., 94, 015001, https://doi.org/10.1103/RevModPhys.94.015001, 2022.
Theodore Fujita, T.: Downbursts: meteorological features and wind field characteristics, J. Wind Eng. Ind. Aerod., 36, 75–86, https://doi.org/10.1016/0167-6105(90)90294-M, 1990.
Tost, H., Jöckel, P., Kerkweg, A., Sander, R., and Lelieveld, J.: Technical note: A new comprehensive SCAVenging submodel for global atmospheric chemistry modelling, Atmos. Chem. Phys., 6, 565–574, https://doi.org/10.5194/acp-6-565-2006, 2006.
Wakimoto, R. M.: Forecasting Dry Microburst Activity over the High Plains, Mon. Weather Rev., 113, 1131–1143, https://doi.org/10.1175/1520-0493(1985)113<1131:FDMAOT>2.0.CO;2, 1985.
Wang, Y., You, Y., and Kulie, M.: Global Virga Precipitation Distribution Derived From Three Spaceborne Radars and Its Contribution to the False Radiometer Precipitation Detection, Geophys. Res. Lett., 45, 4446–4455, https://doi.org/10.1029/2018GL077891, 2018.
Wilson, J. W., Roberts, R. D., Kessinger, C., and McCarthy, J.: Microburst Wind Structure and Evaluation of Doppler Radar for Airport Wind Shear Detection, J. Appl. Meteorol. Clim., 23, 898–915, https://doi.org/10.1175/1520-0450(1984)023<0898:MWSAEO>2.0.CO;2, 1984.
- Abstract
- Introduction
- Dataset and methodology
- Virga event selection criteria
- Regional seasonal virga patterns
- Impact of virga on ground measurements
- Discussion and conclusions
- Data availability
- Author contributions
- Competing interests
- Disclaimer
- Acknowledgements
- Financial support
- Review statement
- References