the Creative Commons Attribution 4.0 License.
the Creative Commons Attribution 4.0 License.
 | 07 Mar 2023
Characterization of offline analysis of particulate matter with FIGAERO-CIMS
Jing Cai
Kaspar R. Daellenbach
Yan Zheng
Feixue Zheng
Sophie L. Haslett
Markku Kulmala
Measurements of the molecular composition of organic aerosol (OA) constituents improve our understanding of sources, formation processes, and physicochemical properties of OA. One instrument providing such data at a time resolution of minutes to hours is the chemical ionization time-of-flight mass spectrometer with filter inlet for gases and aerosols (FIGAERO-CIMS). The technique collects particles on a filter, which are subsequently desorbed, and the evaporated molecules are ionized and analyzed in the mass spectrometer. However, long-term measurements using this technique and/or field deployments at several sites simultaneously require substantial human and financial resources. The analysis of filter samples collected outside the instrument (offline) may provide a more cost-efficient alternative and makes this technology available for the large number of particle filter samples collected routinely at many different sites globally. Filter-based offline use of the FIGAERO-CIMS limits this method, albeit to particle-phase analyses, which is likely at a reduced time resolution compared to online deployments. Here we present the application and assessment of offline FIGAERO-CIMS, using Teflon and quartz fiber filter samples that were collected in autumn 2018 in urban Beijing. We demonstrate the feasibility of the offline application with a “sandwich” sample preparation for the over 900 identified organic compounds with (1) high signal-to-noise ratios, (2) high repeatability, and (3) linear signal response to the filter loadings. Comparable overall signals were observed between the quartz fiber and Teflon filters for 12 and 24 h samples but with larger signals for semi-volatile compounds for the quartz fiber filters, likely due to adsorption artifacts. We also compare desorption profile (thermogram) shapes for the two filter materials. Thermograms are used to derive volatility qualitatively based on the desorption temperature at which the maximum signal intensity of a compound is observed (Tmax). While we find that Tmax can be determined with high repeatability (±5.7 ∘C) from the duplicate tests for one filter type, we observe considerable differences in Tmax between the quartz and Teflon filters, warranting further investigation into the thermal desorption characteristics of different filter types. Overall, this study provides a basis for expanding OA molecular characterization by FIGAERO-CIMS to situations where and when deployment of the instrument itself is not possible.
- Article
(3773 KB) - Full-text XML
-
Supplement
(1782 KB) - BibTeX
- EndNote


Molecular information on organic aerosol (OA) composition is important for understanding the role that OA plays in the atmosphere regarding its impacts on air quality, human health, and the climate (Daellenbach et al., 2020; Huang et al., 2014; Cappa et al., 2012; Yao et al., 2018; Riipinen et al., 2012). Such data can be obtained from offline filter collection and analysis in the laboratory using optical (e.g., Fourier transform infrared spectroscopy, FTIR) and magnetic (e.g., nuclear magnetic resonance spectroscopy, NMR) spectroscopy or, more commonly, high-resolution mass spectrometer methods, which include gas/liquid chromatography coupled to mass spectrometry (GC/LC-MS), ultrahigh-performance liquid chromatography coupled to Orbitrap mass spectrometry, and electrospray ionization mass spectrometry (ESI-MS; Noziere et al., 2015). In contrast, online mass spectrometers provide direct and in situ information on the molecular composition of particles, e.g., the filter inlet for gases and aerosols coupled to a high-resolution time-of-flight chemical ionization mass spectrometer (FIGAERO-HR-ToF-CIMS; Aerodyne Research Inc., USA; hereafter FIGAERO-CIMS; Lopez-Hilfiker et al., 2014), single particle mass spectrometers (Cai et al., 2015, 2017), or the extractive electrospray ionization time-of-flight mass spectrometer (EESI-MS; Lopez-Hilfiker et al., 2019). Since the particle-phase measurement by FIGAERO-CIMS is filter based, it has the potential to be used for offline analysis. Briefly, in the FIGAERO, particles are collected on a Teflon™ (hereafter Teflon) filter and analyzed via thermal desorption. When coupled to a high-resolution time-of-flight chemical-ionization mass spectrometer (hereafter CIMS), molecular composition information of inorganic and organic aerosol compounds that evaporate at temperatures up to 200 ∘C can be achieved. Having the advantage of combining molecular composition and volatility information, FIGAERO-CIMS has been widely used for measuring OA compounds in many different environments including, e.g., forests (Lopez-Hilfiker et al., 2016; Lee et al., 2016, 2018; Mohr et al., 2019), rural and urban areas (Le Breton et al., 2019; Huang et al., 2019a; Cai et al., 2022), indoor air (Farmer et al., 2019), and for cooking emissions (Masoud et al., 2022).
Both online and offline techniques have their advantages and disadvantages and are associated with artifacts (Turpin and Lim, 2001; Turpin et al., 2000). Offline techniques are an easy alternative to demanding online in situ approaches requiring large human and financial resources. Moreover, one collected filter can be used for different analysis methods and purposes. However, the offline approaches are susceptible to sample handling and storage artifacts. The condensation and re-evaporation of vapors and potential reactions on the filter during sampling and storage can result in both positive and negative sampling biases (Turpin et al., 2000; Cheng et al., 2009). Online instruments generally allow for measurements at a higher time resolution, which is an advantage when studying rapid atmospheric processes, and no sample storage is needed before analysis. However, the deployment of the FIGAERO-CIMS outside the laboratory requires a well-equipped site that is easily accessible. In addition, long-term maintenance of these complex mass spectrometers needs substantial human and financial resources. Therefore, deployments are often achieved only for short periods (i.e., campaigns lasting from a couple of weeks to months), which limits the application of this technique for monitoring and simultaneous measurements at multiple sites. Furthermore, FIGAERO gas-phase measurements have to be interrupted regularly for particle-phase analysis in online usage, which could be a problem for measurements requiring high time resolution data (e.g., chamber studies). Using the FIGAERO-CIMS for analyzing filters collected elsewhere (offline application) may therefore provide a valid alternative for long-term monitoring or simultaneous measurements at multiple sites. Whereas the online FIGAERO-CIMS technique typically uses Teflon filters to reduce interferences from the gas phase, quartz fiber filters are widely used for offline sampling of OA due to their high melting point and insolubility in water and typical organic solvents (Watson and Chow, 2002; Tao et al., 2017; Schauer et al., 2002; Gustafson and Dickhut, 1997). Up to now, only a few studies have used the FIGAERO-CIMS in offline mode with Teflon filters (Siegel et al., 2022; Huang et al., 2019b), and an in-depth characterization of the method is missing. The performance of quartz fiber filters in FIGAERO-CIMS needs to be assessed and compared to Teflon filters.
Here, we describe the application of FIGAERO-CIMS in offline mode for the analysis of particles deposited on Teflon and quartz fiber filters in urban Beijing during the autumn and winter of 2018. The filter deposition time varies from 30 min to 24 h. We assess the performance of FIGAERO-CIMS for offline characterization of OA in addition to inorganic compounds and discuss background determination, reproducibility, and linearity of response for the two filter types. We describe filter handling and offline analysis procedures and show the comparison of signals from different mass loadings collected on both filter types. The utility of the FIGAERO for offline use is demonstrated in this study. The potential to broaden its application for OA component measurements in future research is also discussed. We note, however, that it is not the scope of this paper to discuss aspects of offline FIGAERO-CIMS that also apply to its online deployment, such as, e.g., the general percentage of recovery from the filter or calibrations.
2.1 Filter sampling
The sampling site is situated on the west campus of the Beijing University of Chemical Technology (BUCT; 39∘56′31′′ N, 116∘17′50′′ E). BUCT is located near the western Third Ring Road of Beijing, surrounded by residential areas. A more detailed description of the sampling site can be found elsewhere (Cai et al., 2020; Kontkanen et al., 2020; Liu et al., 2020, 2021; Yao et al., 2020; Fan et al., 2021; Guo et al., 2021; Du et al., 2022). From November to December 2018, samples of fine particulate matter with an aerodynamic diameter of up to 2.5 µm (PM2.5) were collected by a four-channel sampler (TH-16A, Wuhan Tianhong Instruments Co., Ltd, China) with a sampling flow rate of 16.7 L min−1, installed on the rooftop of a five-story building (∼ 20 m above ground). Both Teflon (Zefluor™ polytetrafluoroethylene (PTFE) membrane, 1 µm pore size, 47 mm diameter; Pall Corporation, USA) and quartz fiber filters (7202, 47 mm diameter; Pall Corporation, USA) were collected simultaneously at separate channels. The four parallel channels of the sampler had a shared PM10 cyclone inlet and were equipped with four independent PM2.5 cyclones and auto-flow controllers for each channel. All channels were measuring the same size range of particles. A sizing effect from the interactions between different channels can therefore be neglected. The setup of filter type for each channel was as follows: channel 1 with Teflon (12 h or 0.5 h), channel 2 with quartz (12 h or 0.5 h), channel 3 with Teflon (24 h or 2.5 h), and channel 4 with quartz filters (24 h or 2.5 h). This is listed in Table 1. The flow rate was regularly calibrated individually for each channel during the sampling process.
Table 1Testing objectives, filter deposition dates and times, flows, filter material (T is for Teflon; Q is for quartz fiber), filter mass loadings of OA, number of samples, and number of sample repeats (filter punches) for the same filter.
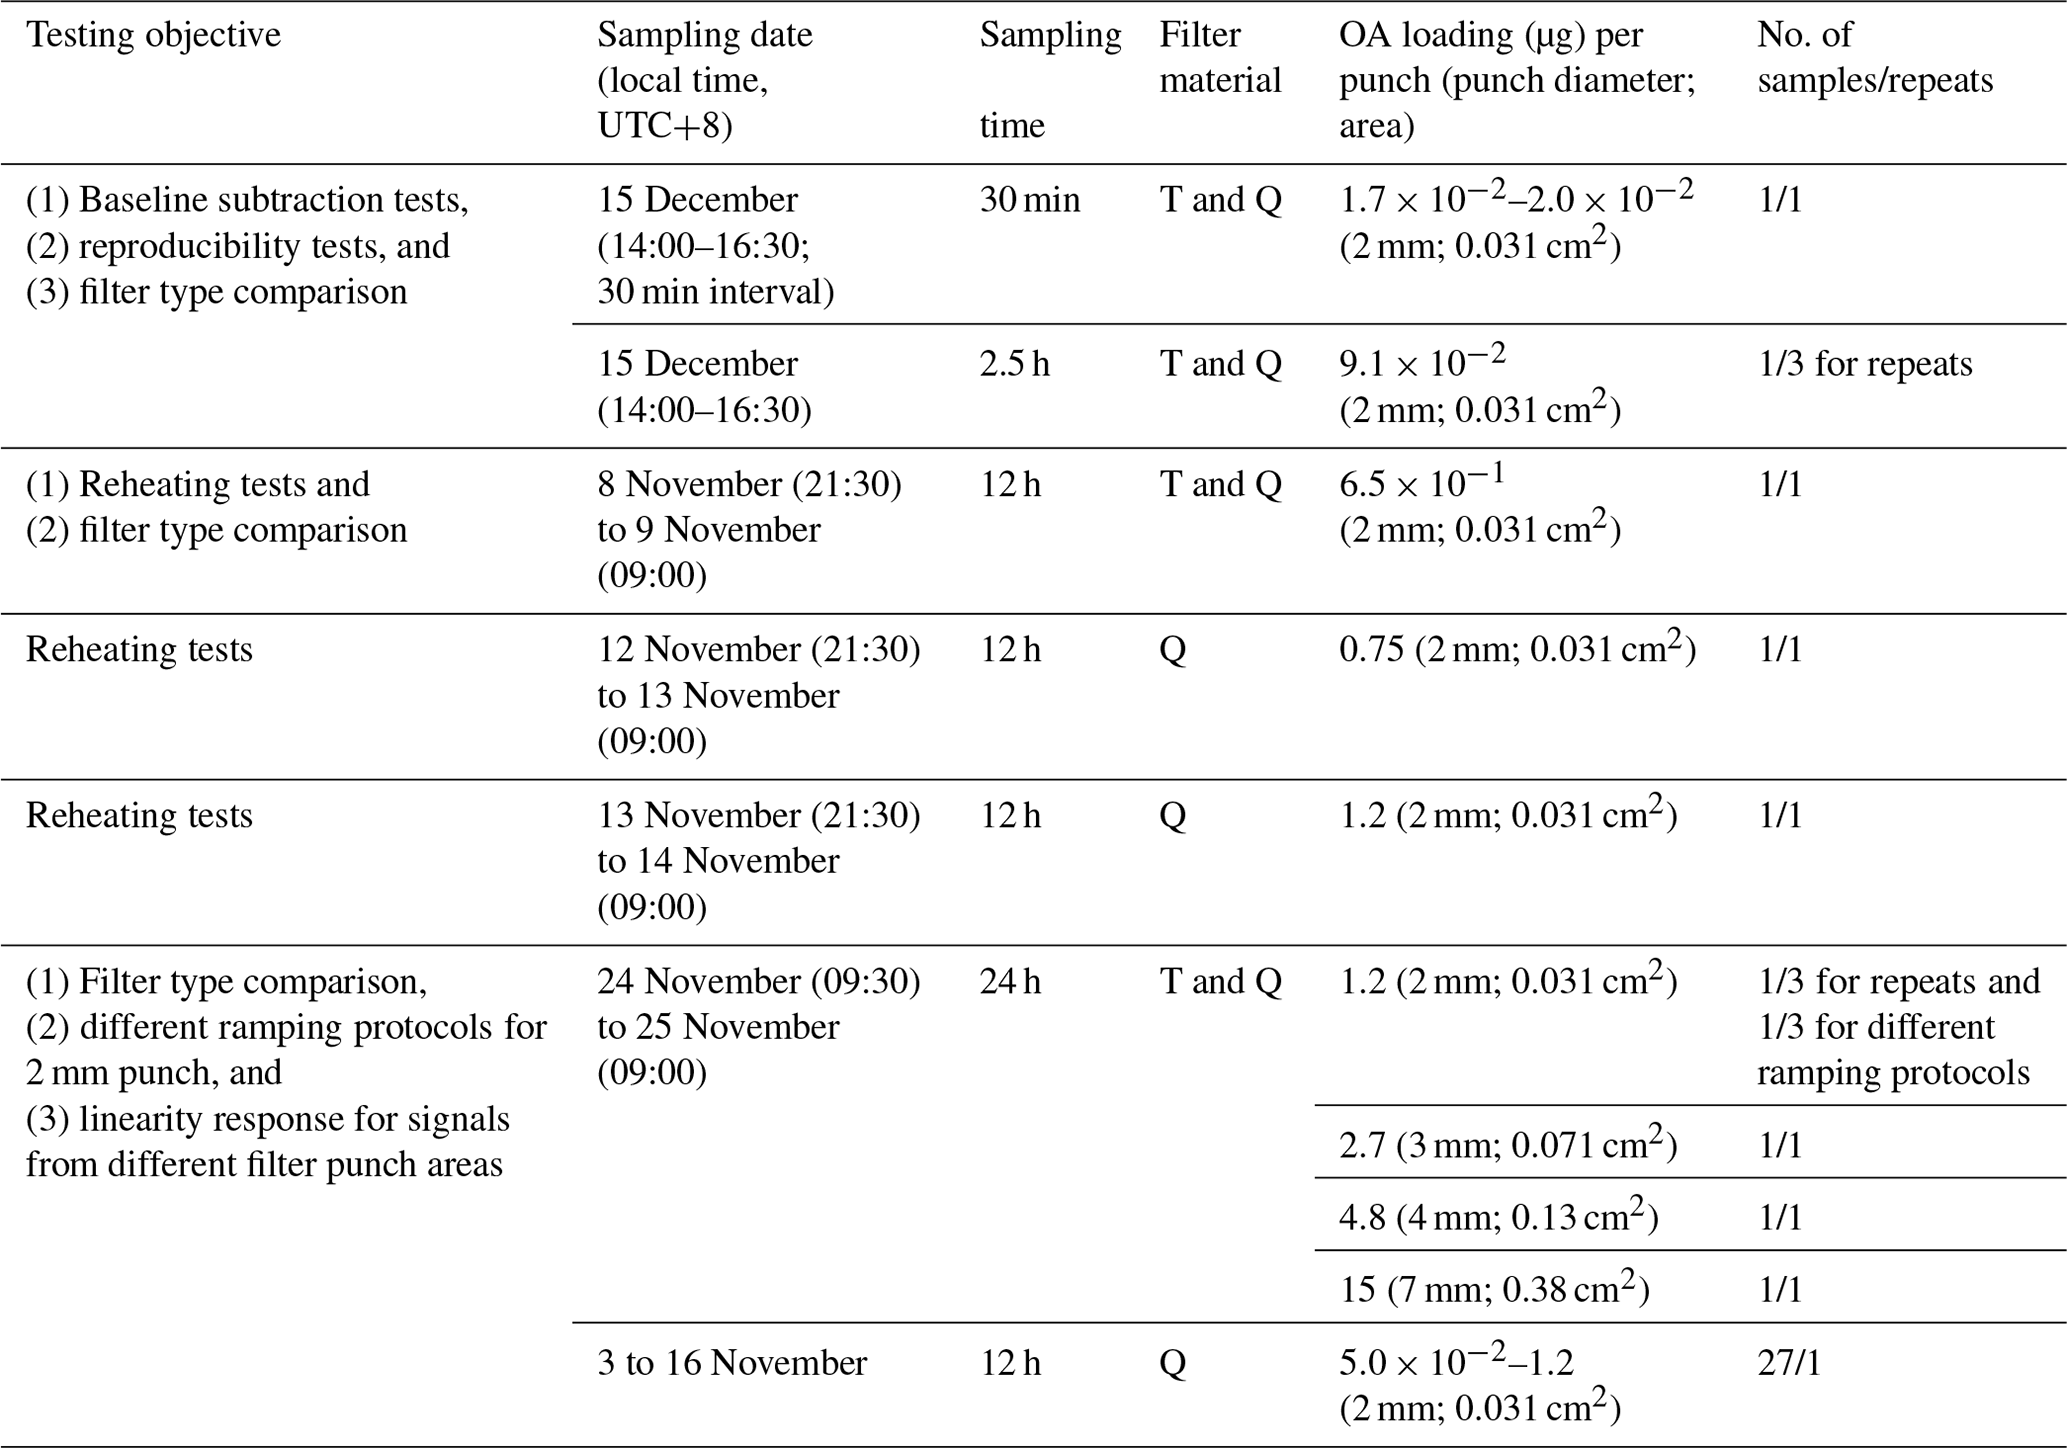
To investigate the influence of filter mass loadings and collection time on the signal response, the following filter samples were taken: (1) five pairs of samples (Teflon/quartz fiber filters; channels 1 and 2) with 30 min deposition time on 15 December 2018 between 14:00 and 16:30 LT (hereafter all times are in local time, UTC+8, unless stated otherwise; Table 1). At the same time, an additional pair of Teflon/quartz samples were deposited for 2.5 h using the other two separate channels of the sampler (channels 3 and 4). (2) Then, 12 h samples of quartz/Teflon filters (channels 1 and 2) from 26 to 30 October and 3 to 24 November (here only the quartz filters from 3 to 16 November were analyzed, with a total of 27 pairs of samples; shown in Table 1). (3) Finally, 24 h quartz/Teflon samples (channels 3 and 4) from 26 to 30 October and 3 to 25 November (here only one pair of Teflon/quartz filters was analyzed; shown in Table 1). During the last sampling period, high PM2.5 and relative humidity (RH) conditions prevailed (3 November is 181 µg m−3 and 60 %; 13 November is 227 µg m−3 and 75 %), and the channel of the 24 h sampling Teflon filter became clogged. Thus, only one pair of 24 h Teflon/quartz samples from this period was analyzed (Table 1).
Detailed information on the sampling protocol is listed in Table 1. Three pairs (Teflon/quartz) of field blank samples were also collected during the sampling period. Before sampling, Teflon filters were baked for 2 h at 200 ∘C, which is much longer than the typical desorption time for FIGAERO-CIMS online usage (Ylisirniö et al., 2021), and quartz filters were baked for 4.5 h at 550 ∘C (Liu et al., 2016) in order to minimize contamination. After sampling, samples were put in filter holders wrapped in prebaked aluminum foil, individually sealed in a sealed bag, and stored in a freezer at −20 ∘C for 7 months until being analyzed in the laboratory.
To calculate the OA mass loadings of the samples, an online time-of-flight-aerosol chemical speciation monitor (hereafter ToF-ACSM; Aerodyne Research Inc., USA) equipped with a PM2.5 lens and standard vaporizer was operated during the sampling period at the same site. Details of the ToF-ACSM settings can be found in Cai et al. (2022). The OA loading on each filter (OAfilter) was determined by relying on the OA concentrations from the co-located ToF-ACSM (OAACSM), the offline filter sampling flow rate (16.7 L min−1), the sampling time, the surface of the entire offline filter sample (Afilter), and the analyzed offline filter sample (Apunch; Eq. 1):
2.2 Offline application of FIGAERO-CIMS
2.2.1 Measurement approach
FIGAERO-CIMS setup
The molecular composition of OA collected on the filter samples was characterized with FIGAERO-CIMS using iodide (I−) as the reagent ion. In a typical online FIGAERO-CIMS operation, particles are collected on a filter (Zefluor™ Teflon filters) with a sampling time of a few minutes to hours and then thermally desorbed by a flow of temperature-controlled ultrapure nitrogen (99.999 %) immediately following deposition. The thermally desorbed compounds are charged by clustering with I−, which is typically generated through the exposure of methyl iodide to an X-ray or a radioactive source for FIGAERO-CIMS (Po210 in our study). In this study, we used the FIGAERO-CIMS in the laboratory to analyze filter samples collected earlier in the field. These samples were placed manually one by one in the dedicated filter holder of the FIGAERO-CIMS, and the desorption procedure was started (see the subsection of temperature ramping protocols in Sect. 2).
Sample preparation and test design
Since the total particle mass collected on one filter was generally too large to be analyzed at once in its entirety by FIGAERO-CIMS (due to the risk of titration of the reagent ion), we only analyzed small circular punches of the collected filters. The default punching area was 3.1 × 10⁻² cm2 (punch diameter d = 2 mm). In addition, to test the linearity of response to sample mass loadings, punch areas for the same filter were varied between 3.1 × 10⁻² cm2 (d = 2 mm) and 0.38 cm2 (d = 7 mm), resulting in variation in mass loadings by a factor of 10 (shown in Table 1). Since the filter punches were too small for the filter holder of the FIGAERO, we put them between two prebaked originally sized (d = 25 mm) Zefluor™ Teflon filters (“sandwich” technique; Fig. 1a). Field blanks were prepared analogously.
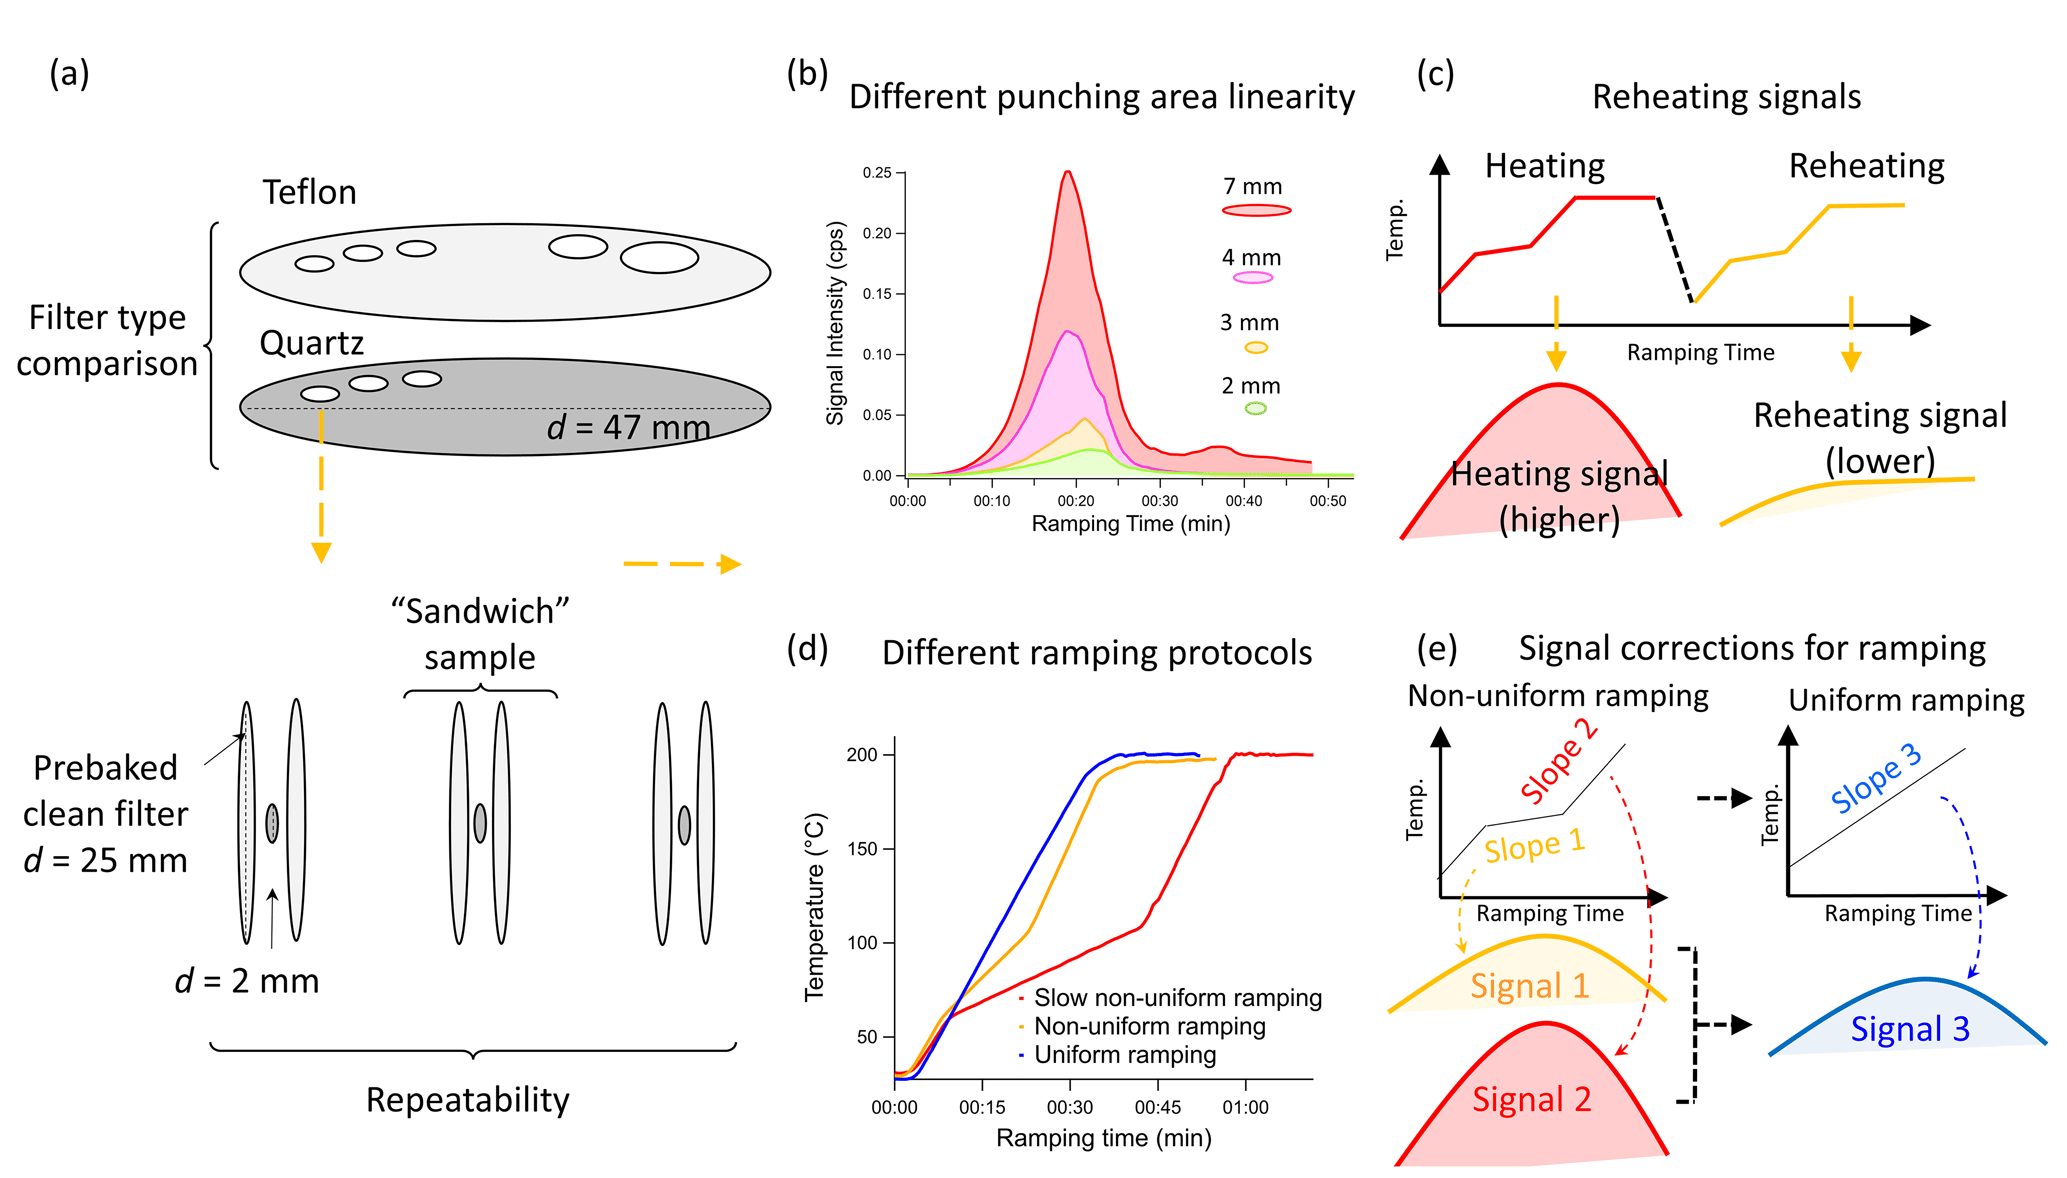
Figure 1Schematic of the tests conducted in this study. (a) Sample preparation using punching areas of different sizes of the Teflon and quartz fiber filters and squeezing them between two original-sized filters for analysis. (b) Signal intensities of different punching areas from the same sample with the same analytical procedure. (c) Reheating tests by conducting two consecutive heating cycles. (d) Different temperature procedures. (e) Signal intensity correction from non-uniform ramping to uniform ramping.
The OA mass loadings of the filter punches were estimated with the co-located ToF-ACSM in this study (details shown in Table 1). To test the performance of the method, we did the following tests (Fig. 1; Table 1): (1) reheating a few filters to determine backgrounds (see Sect. 2.2.4), (2) assessing different background subtraction methods, (3) checking the reproducibility of signals from the same filter (Sect. 3.2), (4) checking the linearity of signal response from different punching areas from the same filter (Sect. 3.4), (5) comparing signals from different ramping protocols (see the subsection of temperature ramping protocols in Sect. 2), (6) comparing offline FIGAERO-CIMS and online ToF-ACSM results (Sect. 3.5), (7) comparing signals from different filter types (Sect. 3.6), and (8) using thermograms from different types of filters (Sect. 3.7).
Temperature ramping protocols
Reagent ion depletion is undesired as it can create nonlinearities in the instrument response (Koss et al., 2018; Zheng et al., 2021). To avoid reagent ion depletion in FIGAERO-CIMS, the concentration of sample ions entering the instrument is controlled, typically by modifying the particle mass loading on the filter and/or the heating rate. While the particle mass loading can be varied easily when operating the FIGAERO-CIMS online through adjustment of sampling time and flow, in the offline mode with pre-collected samples, this can only be modified by the fraction of the filter surface being analyzed. For our Beijing filter samples, even when using the smallest punch size (3.1 × 10⁻² cm2), mass loadings of especially nitric acid (HNO3) were still high enough to lead to titration of the reagent ion. We note that this can also be an issue for online measurements in presence of high nitrate concentrations, e.g., in highly polluted areas. In order to reduce reagent ion depletion between the 60 and 105 ∘C desorption temperature, where HNO3 exhibits a maximum signal, we used a heating protocol with a non-uniform temperature ramping procedure. Instead of ramping from room temperature to 200 ∘C with a constant heating rate, we divided the temperature ramp into several periods, namely (1) from room temperature (∼ 25 ∘C) to 60 ∘C in 8 min (4.4 ∘C min−1), (2) from 60 to 105 ∘C in 15 min (3 ∘C min−1), and (3) from 105 to 200 ∘C in 12 min (7.9 ∘C min−1). The ramp period was followed by a 20 min soaking period (200 ∘C) to allow signals to return to background levels. We called this temperature ramping protocol a non-uniform temperature ramping and used it as the default desorption procedure in this study. The maximum reagent ion depletion achieved in this way was ∼ 35 % for the samples with the highest mass loadings on a 2 mm punch, which was mostly used in this study. We also tested two alternative heating protocols.
-
Slow non-uniform temperature ramping. This is the same as the non-uniform ramping protocol but with point (2) above slowed down to 1.5 ∘C min−1. The total heating time for this protocol was 70 min, and the maximum reagent ion depletion was ∼ 20 %.
-
Uniform temperature ramping. The temperature was increased from room temperature to 200 ∘C in 31.5 min (5.7 ∘C min−1). Including the 20 min soak, the total heating was 51.5 min, and the maximum reagent ion depletion was around 50 %. In order to limit reagent ion depletion, the heating rate was 1.8–3.5 times slower than typical rates used for online FIGAERO-CIMS applications (10–20 ∘C min−1; Thornton et al., 2020).
The three temperature ramping protocols are displayed in Fig. 1d. As different heating rates lead to different thermogram shapes and Tmax for individual compounds, we developed a correction method in an effort to be able to compare desorption-derived volatility for the different ramping protocols. This will be further discussed in Sect. 3.3.
2.2.2 Data analysis
In this study, FIGAERO-CIMS data were analyzed with the Tofware package (v.3.1.0, TOFWERK AG, Switzerland, and Aerodyne Research Inc., USA) within the Igor Pro software (v.7.08, WaveMetrics, USA). Mass accuracies of low-to-high mass species (∼ 130 to 500 Da) were within ±10 ppm (parts per million) for all samples. A total of ∼ 1200 peaks were found in the range of 46 and 500 Da, of which 916 were identified as organic species. Detailed information about the identified chemical compounds can be found in Cai et al. (2022). The total signal of a compound per filter sample, defined as the integrated signals (Is), calculated by first normalizing by the signals of the primary ions (I−) and then integrating the entire thermogram (ramping and soaking; normalized by the signals of I−). Signals of the first 1.5 min of ramping and the last 1.5 min of soaking periods were excluded in order to remove potential interference from switching to and from the heating status. In this study, we use the term CHOX to represent all organic compounds identified by FIGAERO-CIMS, Cx≥1Hy≥1Oz≥1X0−n, detected as clustered with I−, with X being different atoms including N, S, and Cl or a combination of them.
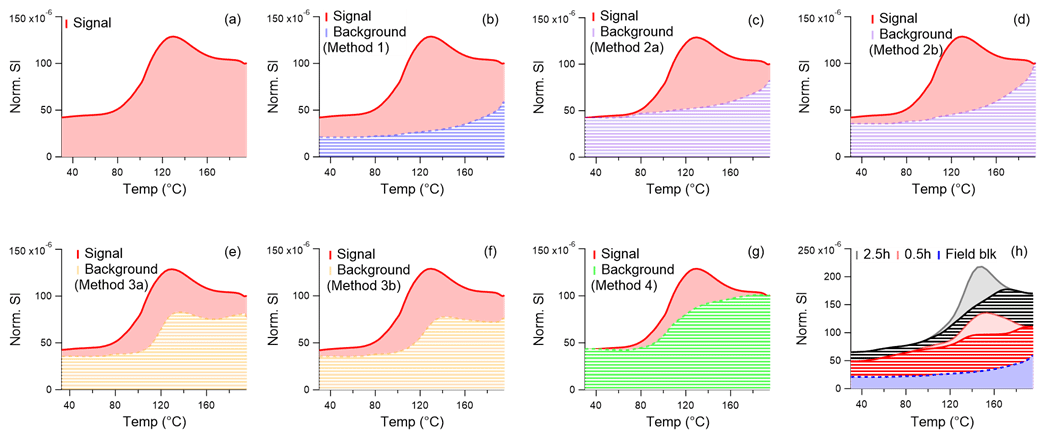
Figure 2Schematic of a compound's signal and background thermograms for different background determination methods. The x axis is the temperature during ramping, and the y axis is the signal intensity normalized by the primary ion (I−). (a) Total sample signal of a model compound without blank subtraction, (b) Method 1 is the field blank only, (c) Method 2a is the scaling field blank to the start of ramping, (d) Method 2b is the scaling field blank to the end of soaking, and (e) Method 3a is the reheating of a subset of filters and using the average signal ratio from reheated and heated filters as background signal for all filters (individual compound based). (f) Method 3b is the reheating of a subset of filters and using an exponential fit to the entire mass range of the average signal ratio from reheated and heated filters as background signal for all filters. (g) Method 4 is the thermal baseline using a spline algorithm. (h) One 0.5 h and one 2.5 h sample with blank subtraction. Ideally, the Is of the 2.5 h collection sample (Is2.5 h) would be close to the sum of the five paralleled 0.5 h collection samples (Is0.5 h).
2.2.3 Background subtraction
The background in offline FIGAERO-CIMS is a combination of instrument background and field blank. The field blanks provide information on the sampling and handling artifacts, while the instrument background is mainly from (1) the desorption of semi-volatile or low-volatile compounds adsorbed on instrument surfaces (such as the ion–molecule reaction region, IMR) and (2) the impurity of the reagent ion precursors and carrier gases. Thus, instrument background signal can vary for different samples and depends on the instrument status. For FIGAERO-CIMS online deployments, frequent blank measurements and calibrations are recommended (Bannan et al., 2019; Thornton et al., 2020). The common method for online FIGAERO-CIMS of placing an additional filter upstream of the FIGAERO filter is impossible for offline pre-sampled filters. Given (1) the large variation in the filter sample loadings (∼ 1 × 10⁻²–1.2 µg), which influences the number of compounds that can potentially adsorb to instrument surfaces, (2) the general scarcity of field blanks in offline mode compared to background filter samples in online FIGAERO-CIMS, and (3) that the instrument background can be influenced by instrument history very different from the offline sample due to the temporal separation of sample and analysis, choosing an appropriate instrumental and field blank determination method is crucial and challenging for offline FIGAERO-CIMS analysis. Here we describe and discuss performance of six different background subtraction methods (schematically shown in Fig. 2).
-
Method 1. The background is the average integrated signal intensity (Is, which is the integrated signal of the thermograms shown in Fig. 2a) of field blanks (), which are three in our case (Fig. 2b). The integrated background-subtracted signal for compound i (Isblksub,i) is then Is.
-
Method 2. The background is a field blank average (; see Method 1) scaled to the ratio of ambient sample and field blank signals during a reference period (ref period) either prior to the start of heating (the first 1.5 to 3 min of the ramping procedure before the temperature starts to increase; Method 2a) or at the end of the soaking (the last 1.5 to 3 min of the soaking period; Method 2b). Method 2 corrects for variation in instrument background that is not necessarily related to the sample to be analyzed. The integrated background-subtracted signal for compound i (Isblksub,i) is then as follows:
By using Method 2a, it is assumed that the signal measured before heating, but with the filter already in place, is due to instrument background, which can vary between the measurement of a sample filter and a blank filter (Fig. 2c). However, this method may lead to the underestimation of the sample signal for compounds that already evaporate at room temperature.
By using Method 2b, it is assumed that the signal measured at the end of soaking is due to the instrument background, which can vary between the measurement of a sample filter and a blank filter. The variation in instrument background is taken into account at maximum heating temperature (200 ∘C), and thus elevated temperature of surfaces downstream of the filter, and at the end of the soaking period when presumably all material that can evaporate from the filter has evaporated (shown in Fig. S1 in the Supplement). -
Method 3. In this method (Siegel et al., 2021), the instrument background is assessed by heating the same filter twice, assuming that, during the first heating cycle, all detectable material has evaporated and that what is measured in a reheating cycle is the instrument background signal. Ideally, reheating would be done for each sample individually. Since this was not done for our dataset, the instrument background determined based on a few reheats (three in our case; the details of the reheating samples are shown in Table 1) had to be extrapolated to all samples (Methods 3a and 3b). It is clearly shown that the signals from the reheating cycle are much lower than those from the first heating (Fig. S1), without a clear peak in thermograms for both filter types, suggesting that sampled compounds were well desorbed in the original heating cycle. Simple reheating does not consider the field blanks, which need to be subtracted in addition.
For Method 3a, we assumed that the ratio of the integrated signal of the second heating cycle (heating C2) and first heating cycle (heating C1) of the same filter is influenced by volatility and therefore compound dependent. Here we used the average ratio from three reheating tests done for this dataset (Fig. S2). The distribution of the ratios is shown in Fig. S3. The Isblksub,i was then calculated following Eq. (3), where the instrument background is the fraction of the sample signal established from the reheating, and added to the signal from the field blank, which is calculated in the same way.For Method 3b, we assumed that the ratio of heating C2 to heating C1 exhibits a signal dependency (relatively higher background for compounds with lower signal), calculated using an exponential fit to the data from the three reheat tests (Fig. S4) using Eq. (4) with the constants A, B, and C. The field blanks are calculated in the same way. Then the Isblksub can be calculated as in Eq. (3).
-
Method 4. This is the thermal baseline subtraction. In this method, we determined, for every thermogram of each compound, a background thermogram termed the thermal baseline (Isthbsl). The thermal baseline was computed using a spline algorithm initially developed by Wang et al. (2018) to determine the background concentration of a pollutant using its concentration time series (by determining the spline of background from varying time intervals). Thermogram data were pre-averaged to 1.8 min (corresponding to four data points of the original time resolution of 27 s) to reduce noise for the thermal baseline computation. Field blanks were handled in the same way (shown in Fig. S5). Thus, the blank-subtracted signal Isblksub of a compound i is as follows:
Is and Is represent the integrated signals of the thermal baseline of compound i for samples and field blanks, respectively.
2.2.4 Thermograms and Tmax recovery
The number of compounds coming off the filter at a certain temperature varies as a function of temperature ramping rates, resulting in different thermogram shapes and Tmax (shown in Fig. 1d). This is especially important for the non-uniform ramping protocols in our case. In an attempt to make the different cases comparable for qualitative volatility studies, we developed a thermogram correction in which the blank-subtracted signal as a function of temperature for each compound i is redistributed to constant temperature intervals (Eq. 6), as follows:
Considering the ∼ 2 ∘C variation in thermogram reproducibility reported from an online FIGAERO-CIMS study (Lopez-Hilfiker et al., 2014), the temperature interval ΔT used in this study is 3 ∘C.
3.1 Assessment of the background: signal comparison between different blank subtraction methods
To assess the influence of the six background methods on the resulting signal, quartz fiber filter samples from five different 0.5 h samples (OA is ∼ 2.0 × 10⁻² µg for each punch) and a 2.5 h sample collected in parallel (OA is 9.1 × 10⁻² µg) were used, and the sum of their background-subtracted integrated signals (Isblksub) were compared (Fig. 2h). Without background subtraction, the sum of the signals from the five 0.5 h samples was generally higher than the Is of the 2.5 h sample (shown in Fig. 3a). An exception to this is HNO, which has the highest signal of all compounds and therefore is the least influenced by background. The higher Is for the sum of the five 0.5 h samples is likely because of the low signal-to-noise ratio compared to the 2.5 h sample. Subtracting only the field blank (Method 1) therefore yielded the same result (Fig. 3b). Scaling the heating baseline (Methods 2a and 2b) led to a better agreement between the sum of the five 0.5 h and the 2.5 h samples (Fig. 3c and d). Compounds with high abundance generally fall on a 1 : 1 line (slope range 0.5–2) when using these two background subtraction methods. With the thermal baseline subtraction method (Method 4), the results were comparable between 2.5 h and five 0.5 h samples. For the approach using filter reheating (Method 3), there was a lesser agreement between the sum of the 0.5 h samples and the 2.5 h sample (Fig. 3e and f). We speculate that this could be improved with a reheating cycle for every sample. For future offline FIGAERO-CIMS analyses, we recommend carefully determining the background. Following our assessment of blank determination methods, we suggest regular collections of field blanks and scaling their signal (Methods 2a and b) and, if field blanks are not available, computing a thermal baseline (Method 4). If using the reheating approach as in a previous study with FIGAERO-CIMS in offline mode (Siegel et al., 2021), then the background should be determined by conducting reheating desorption cycles for each sample and blank individually.
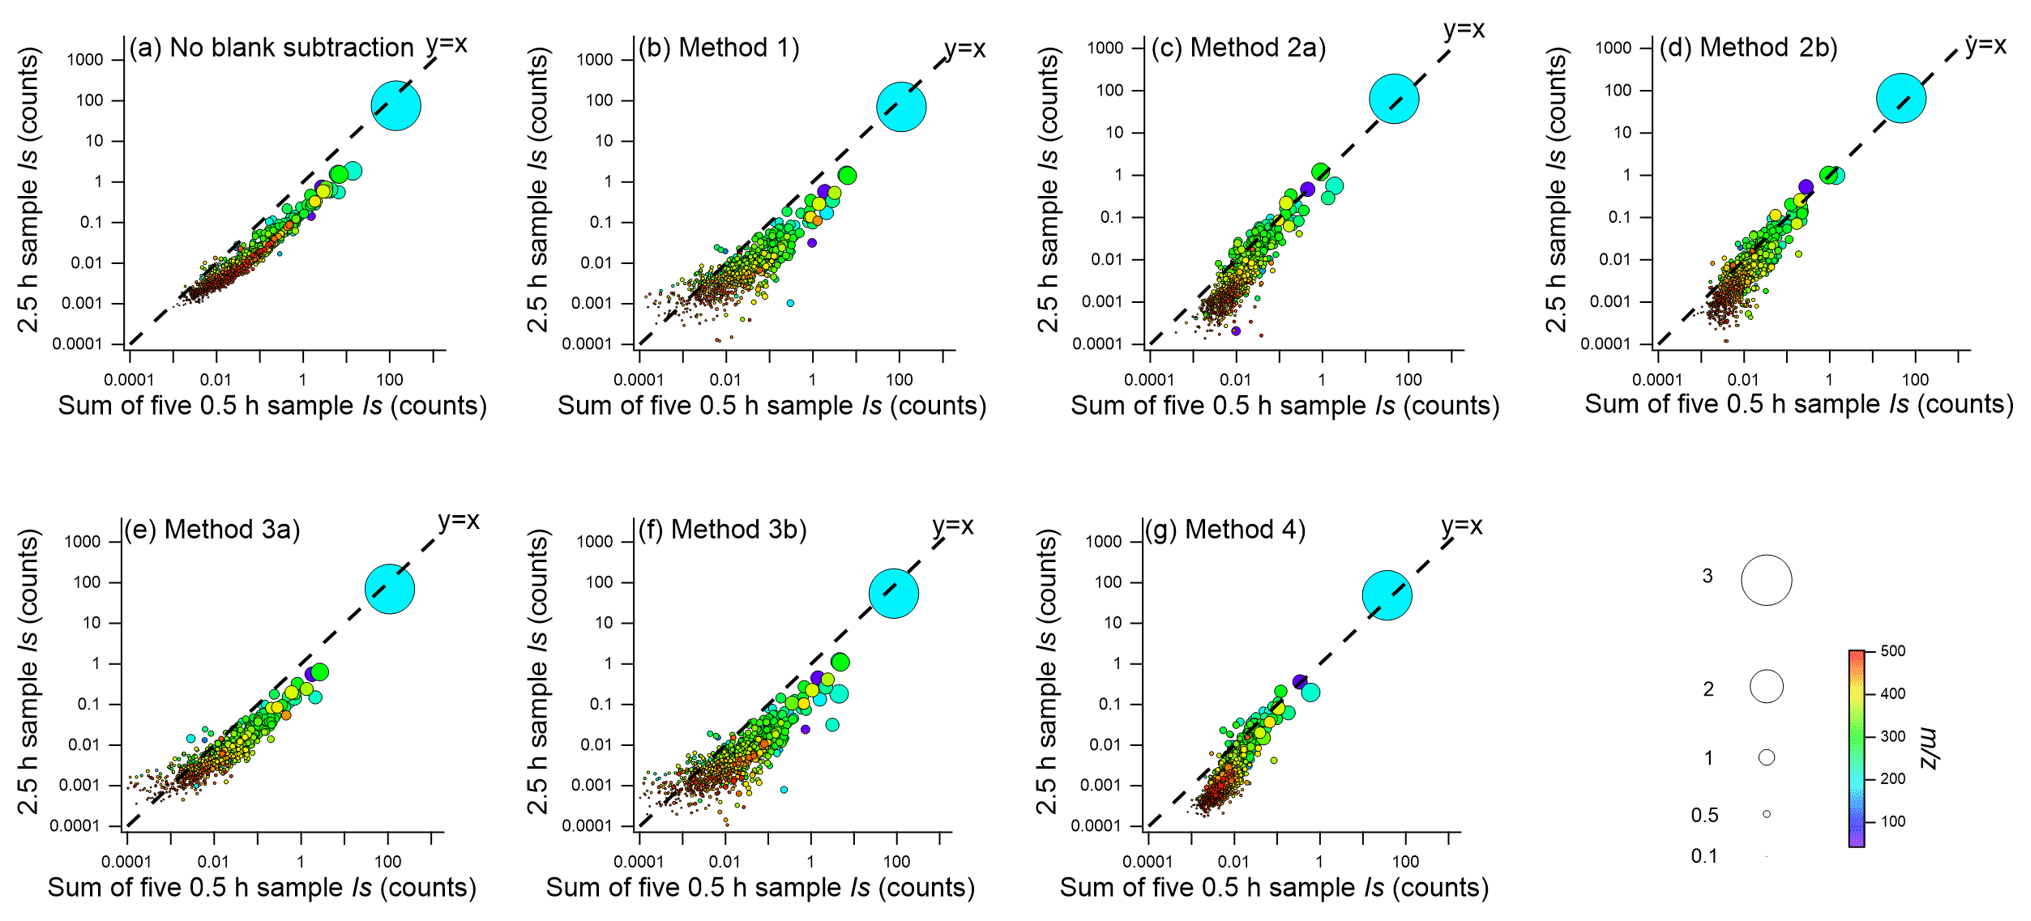
Figure 3Comparison of the integrated signals (Is) for the 2.5 h versus sum of 0.5 h samples (a) without blank subtraction and with blank subtraction, using (b) Method 1, (c) Method 2a, (d) Method 2b, (e) Method 3a, (f) Method 3b, and (g) Method 4. The size of dots is proportional to the fourth root of integrated signal intensities of compounds, and they are color-coded by the (mass-to-charge ratio) of the ions.
In general, as expected, high mass loadings are less sensitive to the various background subtraction methods due to the higher signal-to-noise ratio (for example, 12 h/24 h sampling with OA loading of ∼ 1 µg; Fig. S6). Besides filter loadings, baseline levels can also be influenced by the properties of compounds (e.g., stickiness) and instrument geometry. In summary, of all the background subtraction methods shown here, Methods 2a, 2b, and 4 achieved the best agreement in signal intensities between the sum of 0.5 and 2.5 h samples (Fig. S7). With these methods, 82 % to 93 % of high-signal compounds (25 % highest signal) fell into a signal ratio of ∼ 1 (0–2; Fig. S8). This shows the importance of correctly assessing the instrument background, especially for compounds with low signal.
In this study, we applied Method 2b in the following discussions due to its better performance for the compounds with both higher (Is > 0.1 counts) and lower signal (Is < 0.01 counts; Fig. 3d). First, we examined the signal-to-noise ratios for offline FIGAERO-CIMS, defined as the ratio of the blank-subtracted signal to the standard deviation (SD) of the background determined (using Method 2b) per compound. Most of the identified compounds are above the estimated detection limit (3 times the SDs of the backgrounds) for both filter types (87 % and 87 % of CHOX peaks for both 24 h quartz and Teflon filters; OA loadings of 1.2 µg/3.1 × 10−2 cm2 with a 2 mm punch). For the 12 h samples (OA loadings of 0.58 µg/3.1 × 10−2 cm2 with a 2 mm punch), 84 % and 70 % of CHOX compounds were above the detection limit for quartz and Teflon filters, respectively (Fig. S9). This varies for different filter loadings and punch areas.
3.2 Reproducibility of signal
We performed reproducibility tests using three 2 mm punches from the same 24 and 2.5 h samples of both Teflon and quartz filters and checked the signal response with the non-uniform temperature ramping procedure. The comparisons of the blank-subtracted CHOX Is for the 24 and 2.5 h sample punches for both filter types are displayed in Figs. 4 and S10, respectively.
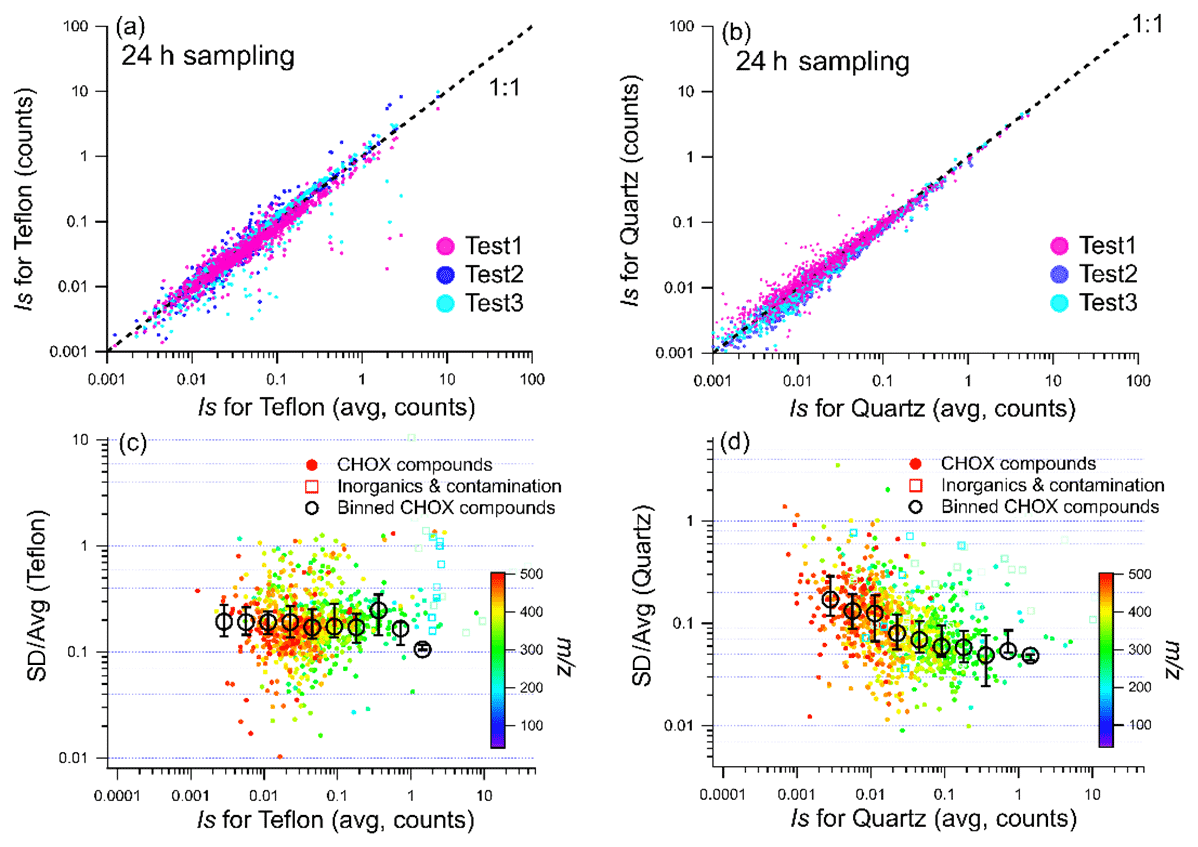
Figure 4Comparison of the integrated signals from duplicate tests of the same 24 h sample for (a) Teflon and (b) quartz fiber filters. The relative error (Is ratio of standard deviation/average) value of the three duplicate tests as a function of Is for (c) Teflon and (d) quartz filters. In panels (c) and (d), CHOX compounds are shown as dots, and inorganics and contaminants are shown as squares colored by the . The black circles in panels (c) and (d) represent median values of signal intensity bins (with log Is intervals of 0.3 for the Is range of 0 to 2), and error bars represent the 25th and 75th percentile of binned values of SD(Is) Avg(Is) for CHOX.
In Fig. 4a and b, we plotted the signal of the compounds from one punch versus their average signal from all three punches for the Teflon and quartz filters, respectively. We observe a high correlation between the individual and average signals (Spearman correlation coefficients, Rsp, are 0.95–0.96 and 0.97–0.99 for Teflon and quartz filters, respectively). For each CHOX compound, we also computed the relative error (standard deviation average signals (SD(Is) Avg(Is) for the three punches) versus the average signal (Fig. 4c, d). The relative error for a CHOX compound was 9 % for quartz and 18 % for Teflon (median relative errors) for 24 h samples (Fig. 4c, d). The relative error decreased with higher signal intensities (Fig. 4c, d), especially for the quartz filters, suggesting that abundant compounds are measured more precisely than less abundant compounds. This trend is less apparent for Teflon filters, which is likely caused by less reproducibility for high Is compounds. Possible explanations could be the uneven distribution of particulate mass on the filter or larger uncertainties in the punching process for Teflon filters due to the extension of the material. In total, 86 % and 94 % of all CHOX compounds for Teflon and quartz filters, respectively, had > 3 times higher signals than the variability from the duplicate tests (Fig. S9). For the 2.5 h filter samples (Fig. S10), the relative error is higher compared to the 24 h samples (25 % for quartz; 31 % for Teflon). This is likely due to the lower OA loadings (9.1 × 10⁻² µg per punch) of the 2.5 h sample compared to the 24 h sample (1.2 µg per punch), which leads to higher uncertainties for blank subtraction and peak fitting. Still, the analytical reproducibility is acceptable, even for samples with OA loadings as low as ∼ 0.1 µg. The relative error between repeats reported here is slightly larger (∼ 9 % and 18 % for ∼ 1 µg OA per punch for quartz and Teflon filters; 25 % for quartz and 31 % for Teflon for ∼ 0.1 µg OA per punch) compared to the variability in the signal for online FIGAERO-CIMS (5 %–10 % for 1 µg OA; Lopez-Hilfiker et al., 2014).
3.3 Comparison of signal for different temperature ramping protocols
Here we compare the signal from different ramping protocols for the punches from the same 24 h quartz and Teflon filters (Table 1). Since, as suggested in Sect. 2.2.2, the Is were calculated by the integration of the normalized signals (normalized to the primary ion; I−), which, to some extent, compensates for reagent ion depletion. The signal of the field blanks is largely dominated by instrument background (i.e., there is no distinct peak in the thermogram; Fig. S1e); thus, the Is of the field blanks is highly influenced by integration time. Since the field blanks were only analyzed with non-uniform ramping, the Is for slow non-uniform and uniform ramping protocols were assumed to be the Is of non-uniform scaled by their integration time ratios.
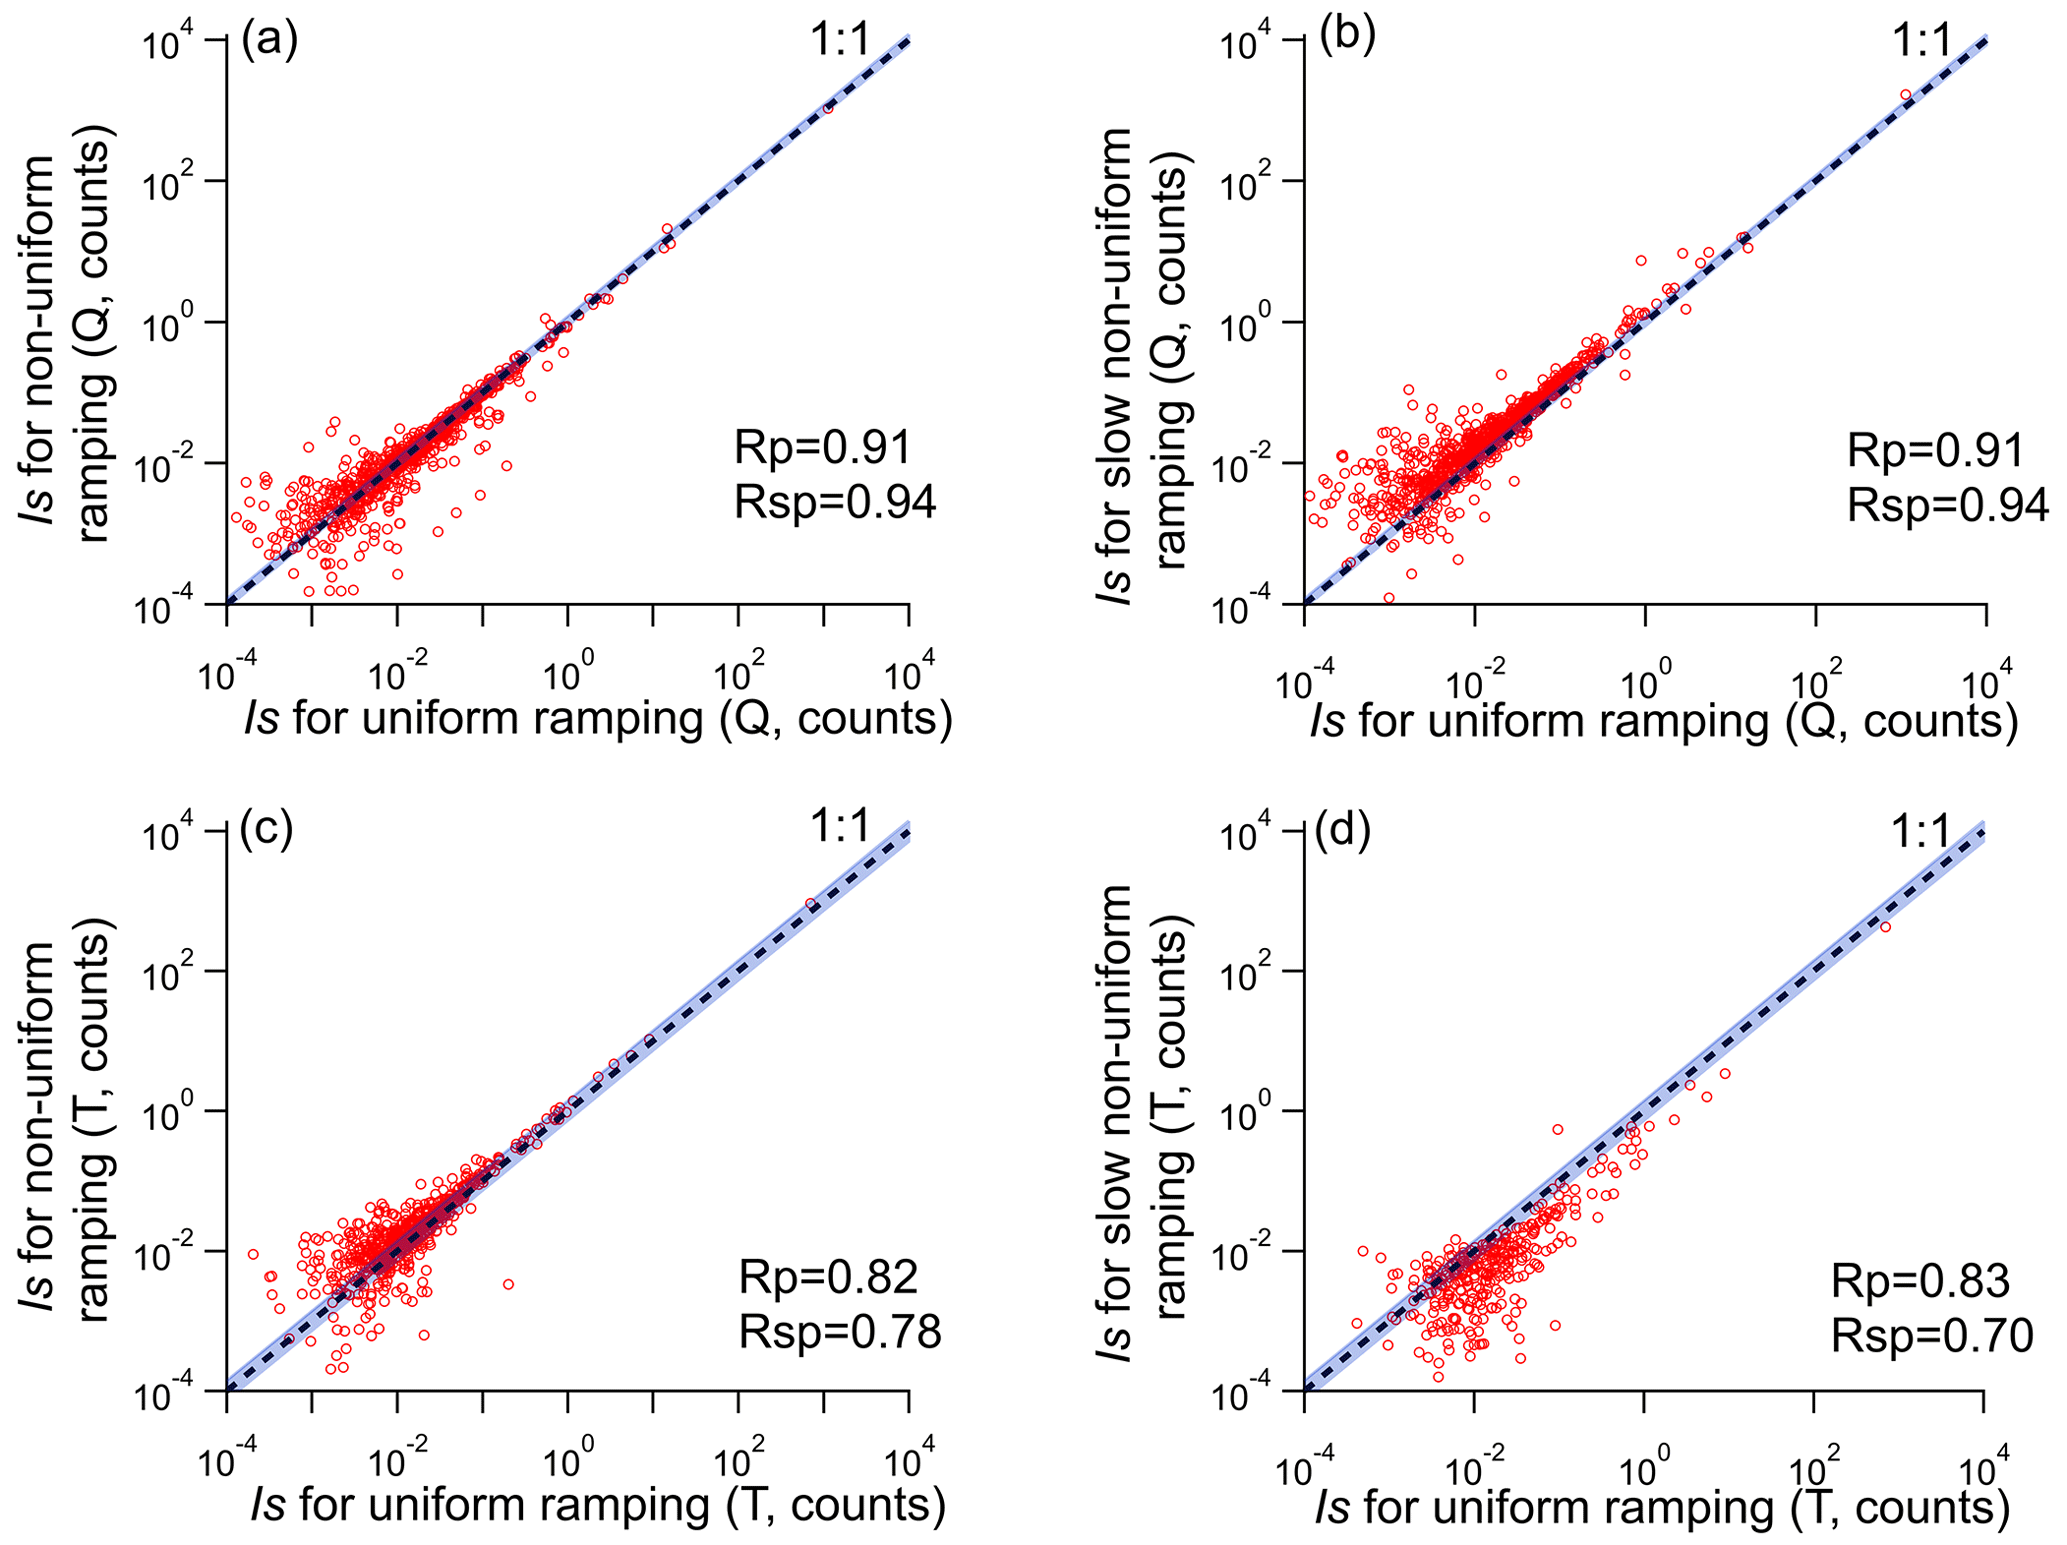
Figure 5Comparison of Is from the different temperature ramping protocols of the 24 h quartz (Q) and Teflon (T) filter samples, (a) non-uniform and uniform ramping (quartz sample), (b) slow non-uniform and uniform ramping (quartz sample), (c) non-uniform and uniform ramping (Teflon sample), and (d) slow non-uniform and uniform ramping (Teflon sample). The blue shaded areas represent the relative error in the signal assessed in the reproducibility tests of the 24 h samples (18 % for Teflon and 9 % for quartz filters). The upper and lower limits for the reproducibility-based variation are calculated as (1 + 18 %) (1 − 18 %) and (1 − 18 %) (1 + 18 %), respectively. The upper and lower limits for the Is distribution of quartz caused by reproducibility are calculated as (1 + 9 %) (1 − 9 %) and (1 − 9 %) (1 + 9 %), respectively.
The comparison of the background-subtracted Is of all identified compounds from different ramping protocols for a pair of 24 h quartz and Teflon filters each is shown in Fig. 5. Since the integrated signals of the compounds within a mass spectrum are lognormally distributed (shown in Fig. S11a and b), a linear fit would be strongly biased by high-signal compounds such as HNO3I− or C6H10O5I−. Thus, we calculated the correlation coefficients of the log-transformed signal intensities in the comparison. The Pearson correlation coefficients (Rp) and Spearman correlation coefficients (Rsp) are as follows: for quartz filters, Rp = 0.91, Rsp = 0.94 for non-uniform vs. uniform, and Rp = 0.91, Rsp = 0.94 for slow non-uniform vs. uniform protocols. For Teflon filters, Rp = 0.82, Rsp = 0.78 for non-uniform vs. uniform, and Rp = 0.83, Rsp = 0.70 for slow non-uniform vs. uniform protocols.
These numbers suggest that the quartz samples were less affected by different temperature ramping protocols than the Teflon samples. We also note that Teflon samples exhibited lower reproducibility than quartz samples (see Sect. 3.2). The lowest Rp and Rsp were observed for the comparison between the slow non-uniform ramping and the uniform ramping procedure for Teflon filters (Fig. 5d). Possible explanations could be the higher background and thus the lower signal-to-noise ratios for Teflon filters in the low ramping rate region (1.3 ∘C min−1 for the range of 60 to 105 ∘C) of the slow non-uniform ramping protocol. Thus, care needs to be taken when using very slow heating rates, and backgrounds need to be carefully assessed, especially for Teflon filters.
For further analyses, we use the results from the non-uniform temperature ramping protocol, which represents a good balance between the influence of background, due to low signal-to-noise ratios, and I− depletion. The good agreement between offline FIGAERO-CIMS and ToF-ACSM discussed in Sect. 3.5 further implies that such a ramping protocol is suitable for the OA loadings observed in our study.
3.4 Linearity of signal response
To assess the linearity of signal response to the amount of sample collected on the filter, we used punches with varying areas from one single filter. We used punch diameters of 2, 3, 4, and 7 mm for a Teflon filter and 2 and 3 mm for a quartz filter. The analytical protocol was kept constant between the individual sample punches (non-uniform ramping protocol and Method 2b for background subtraction). The mass loadings of the analyzed filter punches ranged from 1.2 to 15 µg OA (2.2 to 27 µg PM2.5) for the Teflon filter and from 1.2 to 2.7 µg OA (2.2 to 5.0 µg PM2.5) for the quartz filter (Table 1). The blank-subtracted Is from the different punching areas for the quartz and Teflon filters is shown in Fig. 6. Overall, the offline FIGAERO-CIMS approach responds linearly to changes in filter mass loadings. The integrated signal ratios of CHOX are consistent with their respective area ratios (Fig. 6a, b), within uncertainty. In Fig. 6c, we also plot the signal ratios of the 2 mm punch to the other punches, which are normalized by the punching area (where 1 signifies perfect linearity). These ratios are generally in the range of the possible variability caused by the relative error from the reproducibility tests.
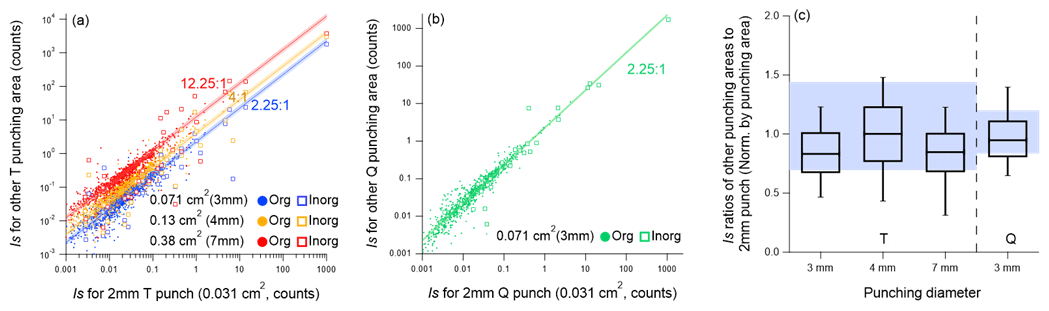
Figure 6Comparison of the Is between signals from punches (a) with 3, 4, 7, and 2 mm diameter for the same Teflon filter and (b) with 3 and 2 mm diameter for the same quartz filter. The lines in panels (a) and (b) represent the punching area ratios. The shaded areas in panels (a) and (b) represent the area ratio plus or minus the relative errors (9 % for quartz and 18 % for Teflon) from the reproducibility tests. (c) The distribution of Is ratios normalized by the punching area ratios (3, 4, and 7 to 2 mm diameter punches for Teflon and 3 to 2 mm diameter punches for quartz). Within each box, the median (middle horizontal line), 25th and 75th percentiles (lower and upper ends of the box), and 10th and 90th percentiles (lower and upper whiskers) are shown. The shaded area in panel (c) represents the possible distribution of the Is ratios due to the relative error established from the 24 h sample reproducibility tests (18 % for Teflon and 9 % for quartz filters). The upper and lower limits for the Teflon Is ratio distribution are calculated as (1 + 18 %) (1 − 18 %) and (1 − 18 %) (1 + 18 %), respectively. The upper and lower limits for the quartz Is ratio distribution are calculated as (1 + 9 %) (1 − 9 %) and (1 − 9 %) (1 + 9 %), respectively.
For compounds with very high signals, the response Is ratio can deviate from the punch area ratio, not least also due to the varying degree of reagent ion depletion. The highest I− depletions were ∼ 35 %, ∼ 60 %, ∼ 68 %, and ∼ 70 % for 2, 3, 4, and 7 mm punches, respectively. For the highest inorganic (HNO3I−) and organic (C6H10O5I−) ions, for example, the Is from a 7 mm punch is only 30 % and 67 %, respectively, of what would be expected based on punching area ratios (7 to 2 mm). For smaller punches (4 mm/3 mm), 75 %/80 % and 105 %/107 % of the expected HNO3I− and C6H10O5I− signals, respectively, are detected. This indicates that, for reduced amounts of desorbing material provided by smaller filter fractions, the amount of reagent ion is sufficient during the whole ramping process (lowest I− C6H10O5I− signal ratio is ∼ 103). In other words, if the titration of the reagent ion can be avoided as much as possible (e.g., I− target ion signal ratio of ∼ 103), then the Is responds linearly to concentration changes. In this study, titration is non-apparent for OA loadings of < 5 µg and I− signals of . Therefore, it is recommended that the OA loadings of the samples are calculated prior analysis to determine the punching sizes in offline FIGAERO-CIMS analysis.
3.5 Comparison between offline FIGAERO-CIMS and in situ ToF-ACSM
In the following, we compare the time series of the signals from offline FIGAERO-CIMS from quartz filters and the corresponding chemical components from online ToF-ACSM measurement. The comparison between the total signal of all identified CHOX compounds and OA concentrations from the ToF-ACSM is displayed in Fig. 7a. Here, the FIGAERO-CIMS signals of five polyols (C8H18O5I−, C10H22O6I−, C12H26O7I−, C14H30O8I−, and C16H34O9I−) were excluded, which were contaminants from the lab due to their inexplicably high Is in 3 of the 27 12 h samples and the usage of diethylene glycol (DEG) in the lab. To compare with the PM2.5 component concentrations from the ToF-ACSM, for each 12 h filter, we compute the sum of integrated signals (Is, signal integration over the entire thermogram, and counts) multiplied by their molecular weight (MW; g mol−1) of all compounds from FIGAERO-CIMS for comparison to the corresponding PM2.5 component concentrations from the ToF-ACSM. Even though I− is selective towards oxygenated organic compounds, the total MW-weighted CHOX signal measured by offline FIGAERO-CIMS in this study highly correlates with OA measured by the ToF-ACSM (Rp = 0.94), which is known to be dominated by secondary organic aerosols (SOAs; Cai et al., 2020; Kulmala et al., 2021; Jia et al., 2008).
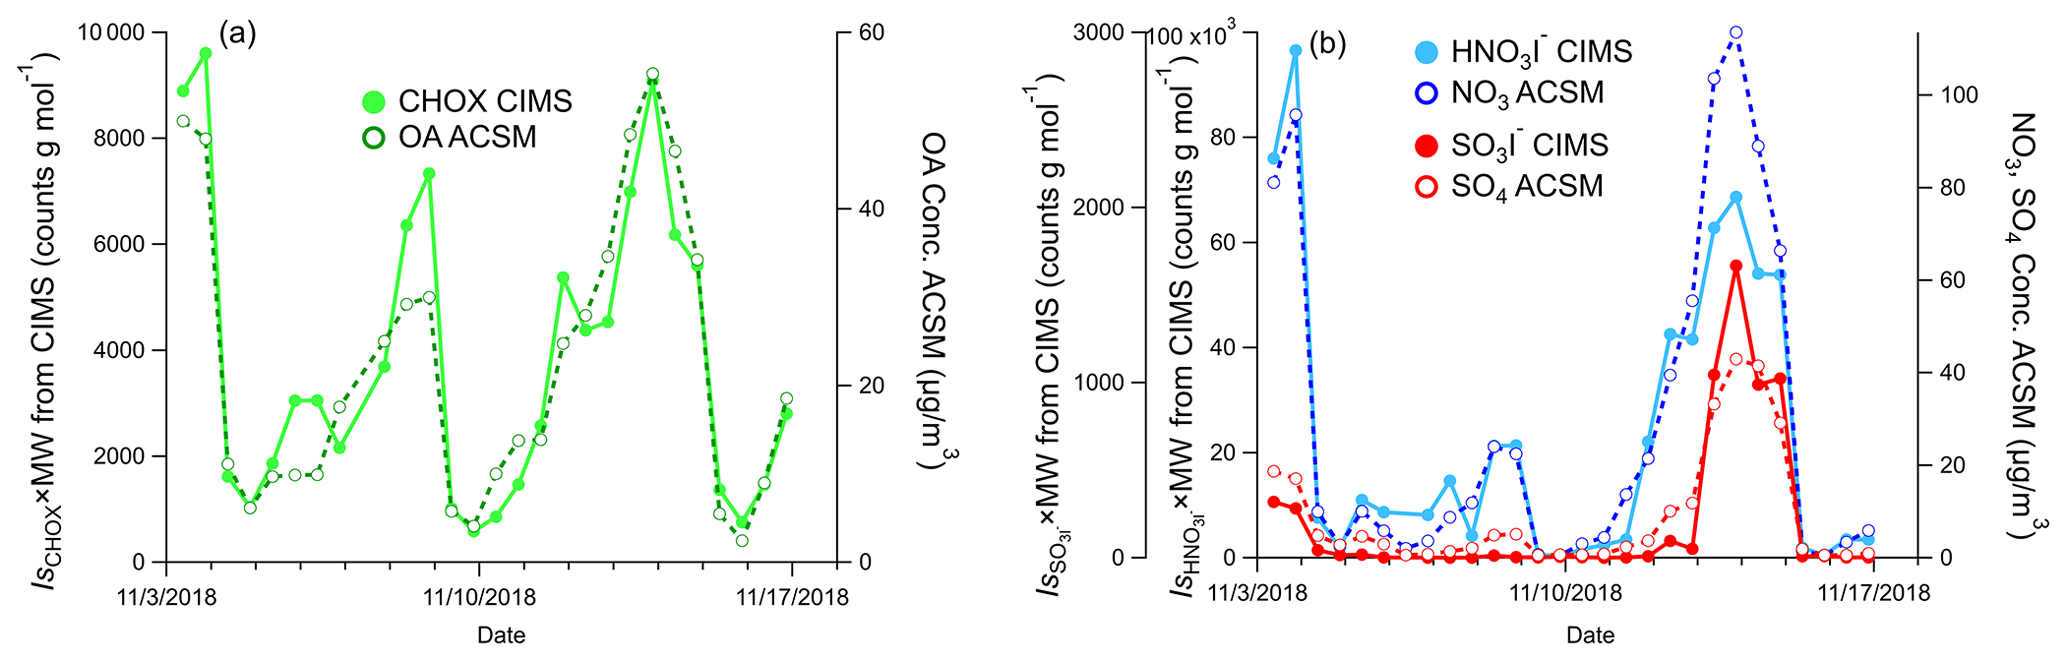
Figure 7Comparison of the time series of the integrated signals of inorganic and organic compounds from 12 h samples (2 mm punches) analyzed by offline FIGAERO-CIMS and chemical components measured in situ by ToF-ACSM. (a) Total CHOX from FIGAERO-CIMS and OA from ToF-ACSM. (b) HNO3I− from FIGAERO-CIMS and NO3 from ToF-ACSM. (c) SO3I− from FIGAERO-CIMS and SO4 from ToF-ACSM. To compare with the PM2.5 component concentrations from the ToF-ACSM, the Is of each compound from FIGAERO-CIMS was multiplied by their molecular weight (MW) in panels (a) and (b). Note that FIGAERO-CIMS and ToF-ACSM data are on different axes.
The time series of the 12 h Is for HNO3I− and SO3I− measured by offline FIGAERO-CIMS correlate well with the NO3 and SO4 concentrations from ToF-ACSM (Rp = 0.94 and 0.95; Fig. 7b). The signal of HNO3I− in the particle phase measured by FIGAERO-CIMS is an indicator of the particulate nitrate and organonitrate (Lee et al., 2016), and the signal of SO3I− is related to inorganic sulfate and sulfur-containing organics (Ye et al., 2021; Cao et al., 2019). Following the same method, after calibrations, the quantified CHOX mass concentrations of offline FIGAERO-CIMS were found to be highly correlated with OA and SOAs from ToF-ACSM in another dataset at the Peking University campus (PKU) in Beijing, indicating that offline FIGAERO-CIMS analysis can be quantitative with proper calibrations (shown in Fig. S12; Zheng et al., 2021). Like other offline sampling methods, the offline FIGAERO-CIMS method may be affected by artifacts from the sampling and storage of the filters. Both positive (adsorption of gaseous OA) and negative artifacts (volatilization of collected OA) may occur during the sampling and storage, even if filters were stored in freezing conditions (Cheng et al., 2009). However, the signals from FIGAERO-CIMS generally correlate well with major components measured by ToF-ACSM, suggesting that those artifacts can be considered to be minor in our study, at least in terms of bulk PM constituents (Fig. 7).
3.6 Comparison of quartz and Teflon filters
In the following, we compare the Is from simultaneously collected quartz and Teflon filter samples (collection times at 2.5, 12, and 24 h; see Table 1). Figure 8a and b show the comparison of the average Is of compounds (three samples each) for both filter types, with 2.5 h (OA loading of 9.1 × 10⁻² µg) and 24 h (OA loading of 1.2 µg) collection times. The mass spectra show an overall similar pattern, and we observe a non-negligible difference, especially for the 2.5 h samples (Fig. 8a). The log-transformed signals from quartz and Teflon samples correlate better for 24 h samples (Rp = 0.96; Rsp = 0.95; Fig. S11d) than for the 2.5 h samples (Rp = 0.88; Rsp = 0.87; Fig. S11c). In addition, the signal observed for quartz filter samples is generally slightly lower than for Teflon filter samples (Fig. 8c, d). Compounds with high-signal ratios for quartz Teflon are, in general, semi- or low volatile compounds (operationally defined as having a Tmax < 60 ∘C). These compounds tend to be in the CHO and especially CHON category and exhibit a higher degree of unsaturation (e.g., C8H6O3I−, C6H5NO3I−, and C7H6NO3I−). They can be aromatics or their thermal fragmentation products (Liu et al., 2019). Due to the high surface area of the quartz filters, semi- or low volatile compounds are more easily adsorbed than on Teflon filters, potentially resulting in higher positive artifacts. Compounds with low-signal ratios for quartz Teflon tend to have a low signal overall. Despite the application of a blank determination method that takes instrument backgrounds into account (Method 2b), higher residuals were still observed for the lower signal compounds, especially for the Teflon filters (as seen also for the 2.5 and 0.5 h sample comparison; Fig. 3d). In contrast, compounds with a higher signal tend to be in the range of Q T ratios that are expected based on the observed variability from the reproducibility tests (shown in Fig. 8c and d).
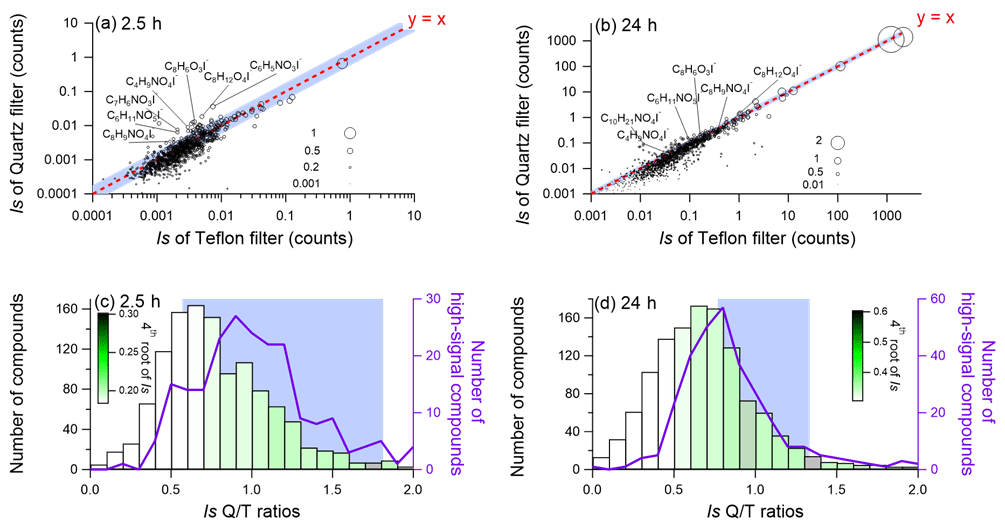
Figure 8Comparison of the integrated signal intensities of all identified compounds for the quartz fiber and Teflon filter samples for (a) 2.5 h samples and (b) 24 h samples. The size of symbols in panels (a) and (b) is proportional to the fourth root of the signal intensity of each compound from the quartz filter. The frequency distribution (number of compounds) per signal ratio of quartz Teflon for all compounds (green bars) and high-signal compounds (highest 25 % signal compounds) only (purple lines) for 2.5 h samples (c) and 24 h samples (d) are shown. The bars in panels (c) and (d) are colored by the average of the fourth root of the signal intensity of the quartz filter. The blue shaded area in each panel represents the possible distribution of Is ratios of quartz Teflon from the relative errors from the duplicate tests of 2.5 h (25 % for quartz and 31 % for Teflon) and 24 h (9 % for quartz and 18 % for Teflon) samples. The upper and lower limits for the 2.5 h quartz Teflon Is ratios were calculated as (1 + 25 %) (1 − 31 %) and (1 − 25 %) (1 + 31 %), respectively. The upper and lower limits for the 24 h quartz Teflon Is ratios were calculated as (1 + 9 %) (1 − 18 %) and (1 − 9 %) (1 + 18 %), respectively.
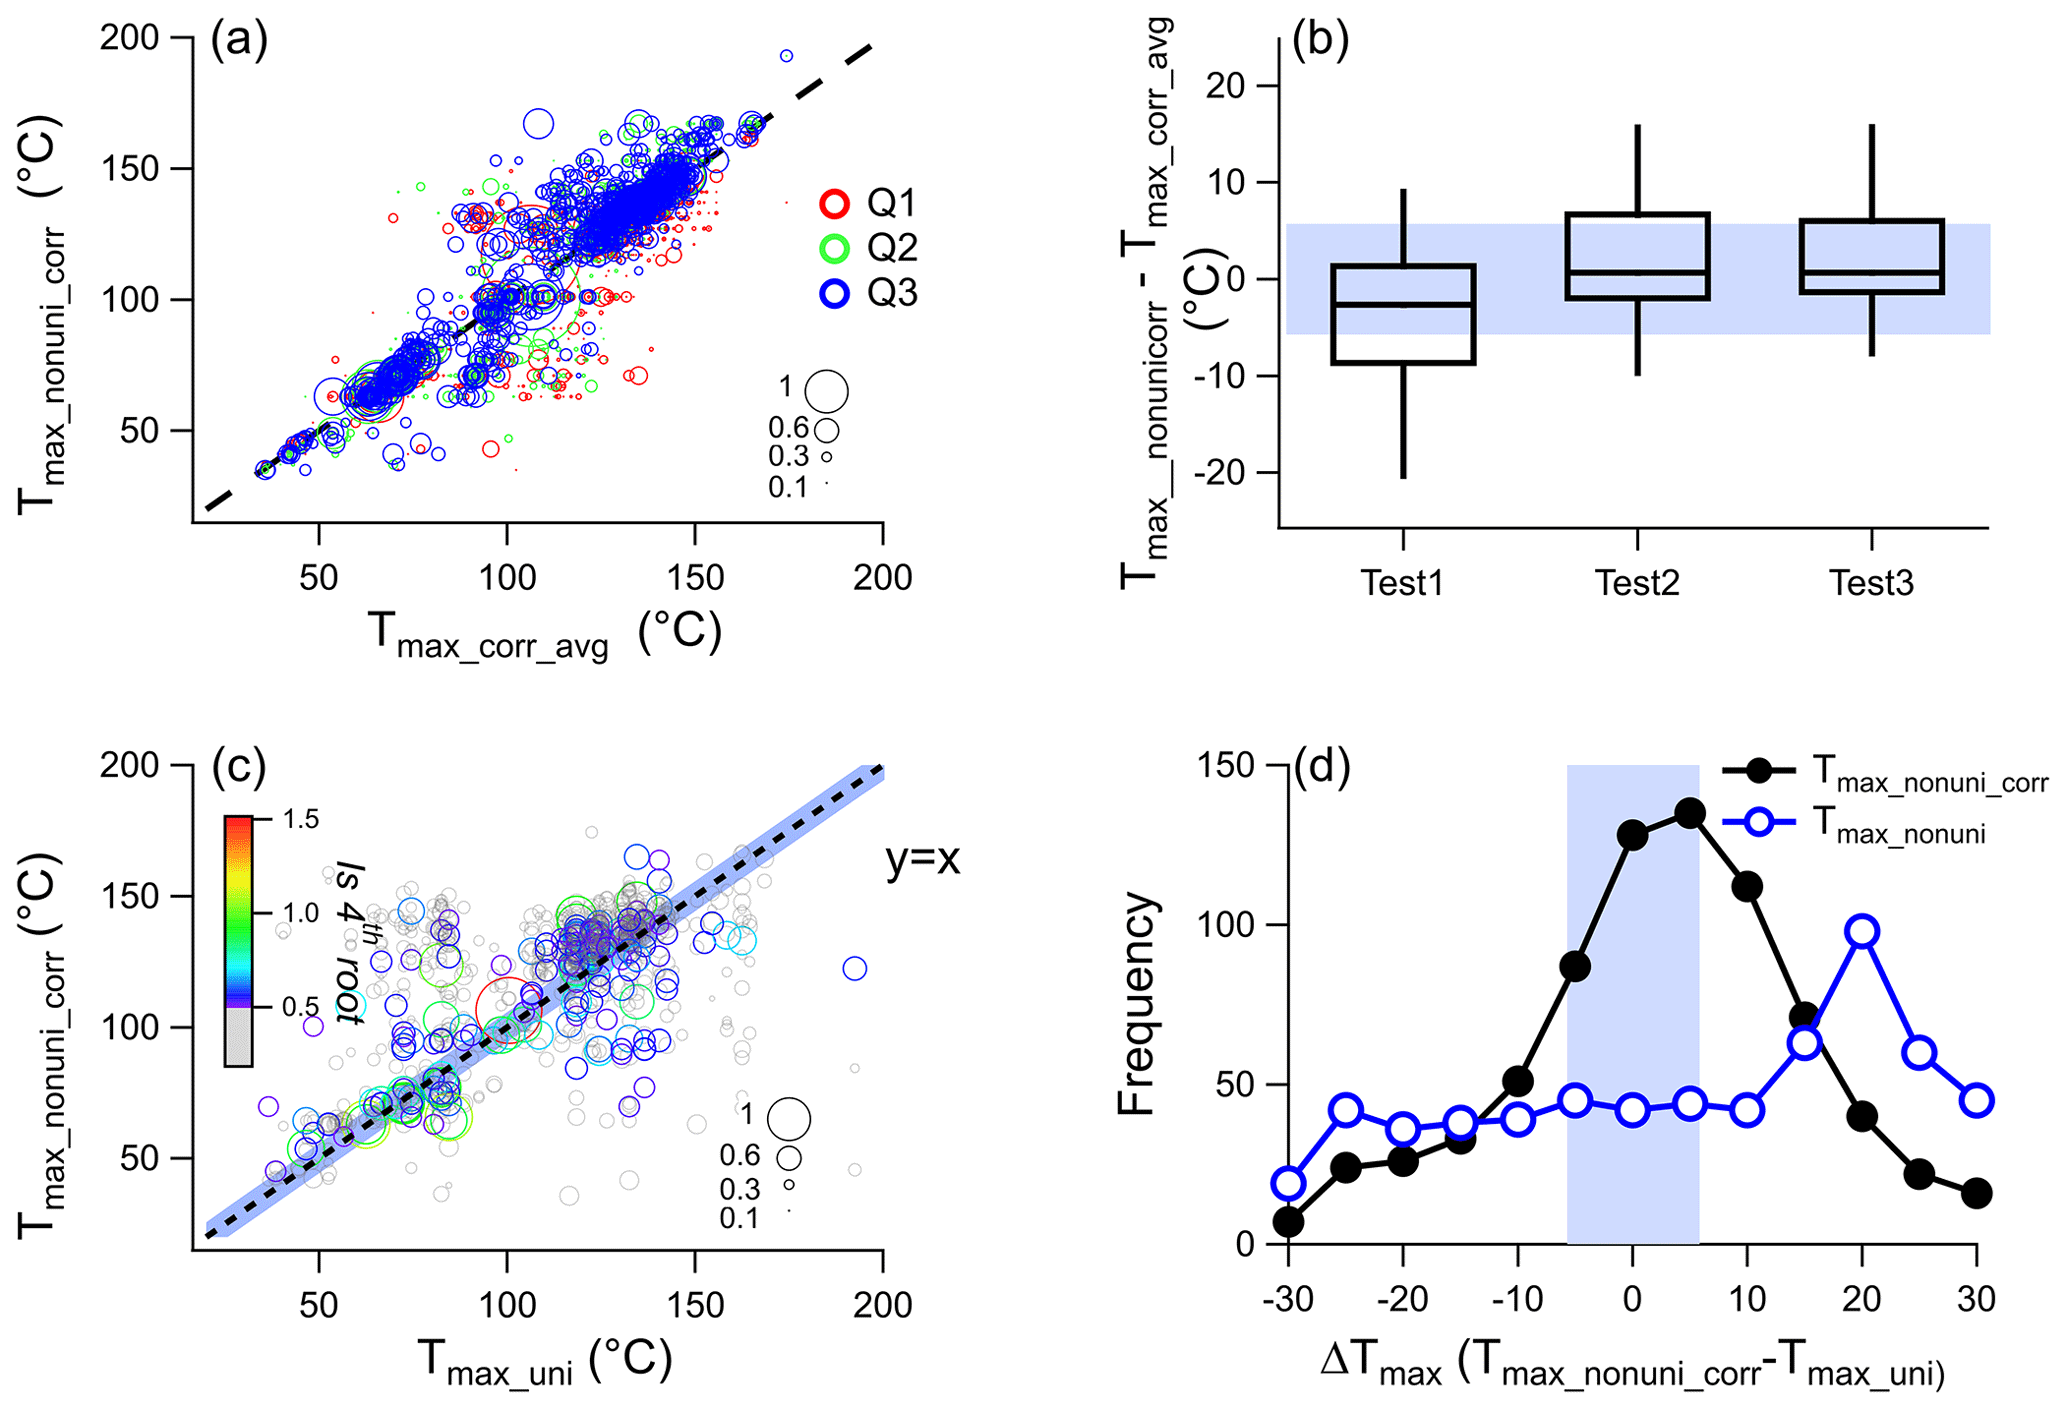
Figure 9(a) Comparison of Tmax_nonuni_corr from the three duplicate tests and their average (Tmax_corr_avg). (b) Distribution of the difference between the three triplicate tests and the Tmax_corr_avg. (c) Comparison of Tmax from the corrected non-uniform ramping and uniform ramping protocol (Tmax_uni). (d) Histogram of ΔTmax between Tmax from the uniform ramping protocol (Tmax_uni) and non-uniform with (Tmax_nonuni_corr) or without (Tmax_nonuni) correction. The size of symbols in panels (a) and (b) is proportional to the fourth root of the integrated signal intensity. The fourth root of the signal intensity < 0.5 is shown in gray. The uniform ramping protocol test and three duplicate non-uniform ramping protocol tests were conducted for the same 24 h quartz filter (23 to 24 November). The shaded areas in panels (b), (c), and (d) represent the Tmax variation (±5.7 ∘C) from the duplicate tests.
3.7 Tmax: influence of temperature ramping protocol and filter type
Non-uniform ramping of the temperature due to reagent ion titration is more likely needed when the FIGAERO-CIMS is run in offline mode compared to online mode because sampling times and resulting filter mass loadings can be adjusted more easily for the online mode. We have therefore developed a method (see Sect. 2.2.4) to recover Tmax from non-uniform ramping protocols, i.e., to make it comparable to Tmax from uniform ramping protocols. Compared to the raw thermograms, the shape of the corrected thermograms is more similar to that of the uniform protocol (Figs. S13 and S14), since the thermograms were regridded to the same temperature intervals (3 ∘C).
First, we tested the variation in Tmax from the three duplicate tests of the quartz filters using the non-uniform ramping protocol and thermogram correction (Fig. 9a). After correction, the corrected Tmax (Tmax_nonuni_corr) from individual tests was highly correlated with their average (Tmax_corr_avg; Rp = 0.87–0.93). The median value of the difference between Tmax_nonuni_corr of duplicate tests and their average for all compounds ranges from −2.7–0.7 ∘C (shown in Fig. 9b). The majority of compounds (52 %–70 %) have a Tmax difference within 5 ∘C, which is close to the value reported previously (∼ 2 ∘C; Lopez-Hilfiker et al., 2014). The median standard deviation of the difference between the corrected Tmax of individual tests (Tmax_nonuni_corr) and their average (Tmax_corr_avg) from all compounds is 5.7 ∘C, which is defined as the variation in Tmax for duplicate tests.
We take the uniform sampling protocol (see Fig. 1d) as the basis, since this is the commonly used protocol for FIGAERO-CIMS in online mode. The comparison of Tmax from the corrected non-uniform and the uniform ramping protocols is shown in Fig. 9c. Generally, after correction for the non-uniform ramping, the Pearson correlation coefficient of Tmax_nonuni_corr and Tmax_uni is higher (Rp = 0.60) compared to the uncorrected ones with the uniform protocol (Rp = 0.20; Tmax_nonuni vs. Tmax_uni). The correlation coefficients were even higher (0.72 and 0.84) for the 400 and 100 compounds with the highest signal intensity. In Fig. 9d, we plot the frequency distribution of the differences between the corrected Tmax (Tmax_nonuni_corr) and Tmax from the uniform protocol (Tmax_uni) for each CHOX compound in the spectrum. For 73 % of the compounds, the difference in Tmax between the two ramping protocols lies between −15 and 15 ∘C, and 41 % of compounds exhibit a difference of 0–±5 ∘C.

Figure 10Normalized thermograms for Teflon (T; dashed lines) and quartz (Q; solid lines) filters of (a) HNO3I−, (b) C6H5NO3I−, (c) C7H7NO3I−, (d) CH4SO3I−, (e) C2H4SO4I−, (f) C3H4O4I−, (g) C4H6O4I−, (h) C5H8O4I−, (i) C6H8O4I−, (j) C6H10O4I−, and (k) C6H10O5I−. The thermograms were first corrected (Sect. 2.2.4) and then normalized to signals at Tmax and colored by the OA mass loading. The sampling information of the thermograms presented here is listed in Table S1.
In the next step, we compared the volatility derived from Tmax for quartz fiber and Teflon filters. We selected a number of inorganic and organic compounds, based on their high average signals for the whole sampling period, for comparison of thermograms from 12 and 24 h Teflon and quartz filters sampled in parallel (Table S1; Fig. 10). Compounds include HNO3I−, CHON (C6H5NO3I−; C7H7NO3I−), and CHOS (CH4SO3I−; C2H4SO4I−) compounds, as well as CHO compounds with Cnum ≥ 3 (C3H4O4I−, C4H6O4I−, C5H8O4I−, C6H8O4I−, C6H10O4I−, and C6H10O5I−). Compounds with Cnum < 3 (e.g., CH2O2I−) were excluded due to possible gas-phase interference and were more likely influenced by thermal decomposition. Some compounds exhibited similar thermogram shapes for the two types of filters, such as C6H10O5I− and CH4SO3I−, while, for some other species, the thermograms were different. Taking C3H4O4I− as an example, a bimodal thermogram shape with peaks around 100 and 150 ∘C was observed for the quartz filter, while only a unimodal peak around 90 ∘C was observed for the Teflon filter. The different thermogram shapes of the individual compounds for the different filter types might warrant further investigation with a focus on the role of filter type properties (such as pore size, thickness, absorption, and hydrophobic/hydrophilic properties).
In addition, we found that compounds with higher mass loadings appeared to have a higher Tmax (e.g., C2H4SO4I− and C7H7NO3I−; shown in Fig. 10), which is consistent with previous findings using Teflon filters (Huang et al., 2018; Ylisirniö et al., 2021). The variability in Tmax induced by varying PM loadings is within 5 ∘C for 29 % of compounds, within 15 ∘C for 54 % of all compounds for quartz filters, and between 35 % and 57 % of compounds, respectively, for Teflon samples. The higher Tmax variation for different OA loading samples compared to the duplicate samples (±5.7 ∘C; Fig. 9b) is likely caused by other factors, such as particle viscosity, the particles on the filter, and/or mass loadings on the filter (Huang et al., 2018; Ylisirniö et al., 2021; Wu et al., 2021; Graham et al., 2022). The Tmax variation due to filter type (Rp = 0.27) is much larger than the one induced by filter loadings. Thus, the direct comparison of Tmax between quartz and Teflon filters is not feasible, thus warranting further research.
This study introduces methods and assesses the performance of using the FIGAERO-CIMS in offline mode, i.e., to analyze particulate matter collected temporally and locally distant from the instrument on filters (quartz and Teflon). Such an approach greatly enhances the capabilities of the FIGAERO-CIMS for analyzing atmospheric samples, as it enables the probing of the air at locations at which and on occasions when in situ deployments are difficult.
Due to the difficulties in background determination for offline FIGAERO-CIMS, in this study, we propose different background determination methods, which were further assessed by the comparison between samples from five different 0.5 h samples and a 2.5 h sample collected in parallel. We applied non-uniform temperature ramping to avoid reagent ion titration and a background scaling method, taking the interference of variable instrument backgrounds into account. In general, the offline FIGAERO-CIMS approach using the methods presented in this study can be used to provide OA composition information with typical offline sampling times (e.g., 12 and 24 h) for samples. (1) The reproducibility of integrated signal intensity is within ±20 % for both filter types (18 % for Teflon and 9 % for quartz), (2) the detected signals respond linearly to changes in the mass loadings of the samples, (3) the signals of CHOX and SO3I− and HNO3I− correlated well with the corresponding PM2.5 chemical component concentrations of OA, SO4, and NO3 measured by ToF-ACSM (Rp = 0.94 to 0.95), and (4) the log-transformed mass spectra are highly correlated (Rp > 0.9) between quartz and Teflon filters for typical offline sampling times (e.g., 12 and 24 h), and for high-signal compounds, the Is ratios between quartz and Teflon filters are generally within the reproducibility variation. Overall, this highlights the possibility of using widely available and stored quartz filters to identify CHOX molecular composition with FIGAERO-CIMS.
Tmax retrieved from corrected thermograms of desorption with non-uniform ramping protocols are comparable to Tmax from the uniform ramping protocol for high signal intensity compounds (Rp = 0.72–0.84). More than 50 % of compounds have Tmax values that are reproducible within 5 ∘C for duplicate tests (Rp = 0.87–0.93) of the same sample, and for > 50 % of compounds, Tmax varies within 15 ∘C for different mass loadings. Yet, Tmax is strongly affected by the filter material (Teflon vs. quartz), leading to a large discrepancy in Tmax between quartz and Teflon samples (Rp = 0.27), hindering direct comparisons, and warranting further research.
In summary, using FIGAERO-CIMS to analyze offline samples is a useful and simple way to investigate OA molecular composition, but care needs to be taken for Tmax analyses. This opens broad applications to the study of OA molecular composition, sources, and formation processes at several sites simultaneously and in long-term deployments.
The peak list, time series of the total signals, and chemical components of ACSM are available at https://doi.org/10.5281/zenodo.5771527 (Cai, 2021).
The supplement related to this article is available online at: https://doi.org/10.5194/amt-16-1147-2023-supplement.
JC, KRD, CM, and MK designed the research. JC, FZ, and WD collected the samples at the BUCT site. JC, CW, SLH, KRD, and CM analyzed the samples and interpreted the data. YZ and QC analyzed the samples collected at the Peking University campus site. CM, KRD, and MK supervised this research. JC, KRD, and CM wrote the paper, with contributions from all co-authors. All authors have given approval to the final version of this work.
The contact author has declared that none of the authors has any competing interests.
Publisher’s note: Copernicus Publications remains neutral with regard to jurisdictional claims in published maps and institutional affiliations.
The work has been supported by the Knut and Alice Wallenberg Foundation (WAF project CLOUDFORM; grant no. 2017.0165), the Academy of Finland (Center of Excellence in Atmospheric Sciences, project no. 307331; PROFI3 funding, grant no. 311932; ACCC Flagship, grant no. 337549), the European Research Council via ATM-GTP (grant no. 742206), the Jenny and Antti Wihuri Foundation, and the Jane and Aatos Erkko Foundation. Kaspar R. Daellenbach acknowledges support by the Schweizerischer Nationalfonds (SNF) mobility grant (grant no. P2EZP2_181599) and Ambizione grant (grant no. PZPGP2_201992). The authors also would like to thank Federico Bianchi's kind help and suggestions and the effort from all the researchers in the BUCT project in maintaining the BUCT site.
This research has been supported by the Knut and Alice Wallenberg Foundation (WAF project CLOUDFORM; grant no. 2017.0165), the Academy of Finland, Luonnontieteiden ja Tekniikan Tutkimuksen Toimikunta (Center of Excellence in Atmospheric Sciences, project no. 307331; PROFI3 funding, project no. 311932; ACCC Flagship, project no. 337549), the European Research Council via ATM-GTP (grant no. 742206), the Jenny and Antti Wihuri Foundation, the Jane and Aatos Erkko Foundation, and the Schweizerischer Nationalfonds (SNF) mobility grant (grant no. P2EZP2_181599) and Ambizione grant (grant no. PZPGP2_201992).
This paper was edited by Albert Presto and reviewed by two anonymous referees.
Bannan, T. J., Le Breton, M., Priestley, M., Worrall, S. D., Bacak, A., Marsden, N. A., Mehra, A., Hammes, J., Hallquist, M., Alfarra, M. R., Krieger, U. K., Reid, J. P., Jayne, J., Robinson, W., McFiggans, G., Coe, H., Percival, C. J., and Topping, D.: A method for extracting calibrated volatility information from the FIGAERO-HR-ToF-CIMS and its experimental application, Atmos. Meas. Tech., 12, 1429–1439, https://doi.org/10.5194/amt-12-1429-2019, 2019.
Cai, J.: Influence of organic aerosol composition determined by offline FIGAERO-CIMS on particle absorptive properties in autumn Beijing, Zenodo [data set], https://doi.org/10.5281/zenodo.5771527, 2021.
Cai, J., Zheng, M., Yan, C., Fu, H.-Y., Zhang, Y.-J., Li, M., Zhou, Z., and Zhang, Y.-H.: Application and Progress of Single Particle Aerosol Time-of-Flight Mass Spectrometry in Fine Particulate Matter Research, Chinese J. Anal. Chem., 43, 765–774, https://doi.org/10.1016/S1872-2040(15)60825-8, 2015.
Cai, J., Wang, J., Zhang, Y., Tian, H., Zhu, C., Gross, D. S., Hu, M., Hao, J., He, K., Wang, S., and Zheng, M.: Source apportionment of Pb-containing particles in Beijing during January 2013, Environ. Pollut., 226, 30–40, https://doi.org/10.1016/j.envpol.2017.04.004, 2017.
Cai, J., Chu, B., Yao, L., Yan, C., Heikkinen, L. M., Zheng, F., Li, C., Fan, X., Zhang, S., Yang, D., Wang, Y., Kokkonen, T. V., Chan, T., Zhou, Y., Dada, L., Liu, Y., He, H., Paasonen, P., Kujansuu, J. T., Petäjä, T., Mohr, C., Kangasluoma, J., Bianchi, F., Sun, Y., Croteau, P. L., Worsnop, D. R., Kerminen, V.-M., Du, W., Kulmala, M., and Daellenbach, K. R.: Size-segregated particle number and mass concentrations from different emission sources in urban Beijing, Atmos. Chem. Phys., 20, 12721–12740, https://doi.org/10.5194/acp-20-12721-2020, 2020.
Cai, J., Wu, C., Wang, J., Du, W., Zheng, F., Hakala, S., Fan, X., Chu, B., Yao, L., Feng, Z., Liu, Y., Sun, Y., Zheng, J., Yan, C., Bianchi, F., Kulmala, M., Mohr, C., and Daellenbach, K. R.: Influence of organic aerosol molecular composition on particle absorptive properties in autumn Beijing, Atmos. Chem. Phys., 22, 1251–1269, https://doi.org/10.5194/acp-22-1251-2022, 2022.
Cao, L. M., Huang, X. F., Wang, C., Zhu, Q., and He, L. Y.: Characterization of submicron aerosol volatility in the regional atmosphere in Southern China, Chemosphere, 236, 124383, https://doi.org/10.1016/j.chemosphere.2019.124383, 2019.
Cappa, C. D., Onasch, T. B., Massoli, P., Worsnop, D. R., Bates, T. S., Cross, E. S., Davidovits, P., Hakala, J., Hayden, K. L., Jobson, B. T., Kolesar, K. R., Lack, D. A., Lerner, B. M., Li, S.-M., Mellon, D., Nuaaman, I., Olfert, J. S., Petäjä, T., Quinn, P. K., Song, C., Subramanian, R., Williams, E. J., and Zaveri, R. A.: Radiative Absorption Enhancements Due to the Mixing State of Atmospheric Black Carbon, Science, 337, 1078–1081, 2012.
Cheng, Y., He, K. B., Duan, F. K., Zheng, M., Ma, Y. L., and Tan, J. H.: Measurement of semivolatile carbonaceous aerosols and its implications: a review, Environ. Int., 35, 674–681, https://doi.org/10.1016/j.envint.2008.11.007, 2009.
Daellenbach, K. R., Uzu, G., Jiang, J., Cassagnes, L. E., Leni, Z., Vlachou, A., Stefenelli, G., Canonaco, F., Weber, S., Segers, A., Kuenen, J. J. P., Schaap, M., Favez, O., Albinet, A., Aksoyoglu, S., Dommen, J., Baltensperger, U., Geiser, M., El Haddad, I., Jaffrezo, J. L., and Prevot, A. S. H.: Sources of particulate-matter air pollution and its oxidative potential in Europe, Nature, 587, 414–419, https://doi.org/10.1038/s41586-020-2902-8, 2020.
Du, W., Cai, J., Zheng, F., Yan, C., Zhou, Y., Guo, Y., Chu, B., Yao, L., Heikkinen, L. M., Fan, X., Wang, Y., Cai, R., Hakala, S., Chan, T., Kontkanen, J., Tuovinen, S., Petäjä, T., Kangasluoma, J., Bianchi, F., Paasonen, P., Sun, Y., Kerminen, V.-M., Liu, Y., Daellenbach, K. R., Dada, L., and Kulmala, M.: Influence of Aerosol Chemical Composition on Condensation Sink Efficiency and New Particle Formation in Beijing, Environ. Sci. Technol. Lett., 9, 375–382, https://doi.org/10.1021/acs.estlett.2c00159, 2022.
Fan, X., Cai, J., Yan, C., Zhao, J., Guo, Y., Li, C., Dällenbach, K. R., Zheng, F., Lin, Z., Chu, B., Wang, Y., Dada, L., Zha, Q., Du, W., Kontkanen, J., Kurtén, T., Iyer, S., Kujansuu, J. T., Petäjä, T., Worsnop, D. R., Kerminen, V.-M., Liu, Y., Bianchi, F., Tham, Y. J., Yao, L., and Kulmala, M.: Atmospheric gaseous hydrochloric and hydrobromic acid in urban Beijing, China: detection, source identification and potential atmospheric impacts, Atmos. Chem. Phys., 21, 11437–11452, https://doi.org/10.5194/acp-21-11437-2021, 2021.
Farmer, D. K., Vance, M. E., Abbatt, J. P. D., Abeleira, A., Alves, M. R., Arata, C., Boedicker, E., Bourne, S., Cardoso-Saldana, F., Corsi, R., DeCarlo, P. F., Goldstein, A. H., Grassian, V. H., Hildebrandt Ruiz, L., Jimenez, J. L., Kahan, T. F., Katz, E. F., Mattila, J. M., Nazaroff, W. W., Novoselac, A., O'Brien, R. E., Or, V. W., Patel, S., Sankhyan, S., Stevens, P. S., Tian, Y., Wade, M., Wang, C., Zhou, S., and Zhou, Y.: Overview of HOMEChem: House Observations of Microbial and Environmental Chemistry, Environ. Sci.-Proc. Imp., 21, 1280–1300, https://doi.org/10.1039/c9em00228f, 2019.
Graham, E. L., Wu, C., Bell, D. M., Bertrand, A., Haslett, S. L., Baltensperger, U., El Haddad, I., Krejci, R., Riipinen, I., and Mohr, C.: Volatility of aerosol particles from NO3 oxidation of various biogenic organic precursors, EGUsphere [preprint], https://doi.org/10.5194/egusphere-2022-1043, 2022.
Guo, Y., Yan, C., Li, C., Ma, W., Feng, Z., Zhou, Y., Lin, Z., Dada, L., Stolzenburg, D., Yin, R., Kontkanen, J., Daellenbach, K. R., Kangasluoma, J., Yao, L., Chu, B., Wang, Y., Cai, R., Bianchi, F., Liu, Y., and Kulmala, M.: Formation of nighttime sulfuric acid from the ozonolysis of alkenes in Beijing, Atmos. Chem. Phys., 21, 5499–5511, https://doi.org/10.5194/acp-21-5499-2021, 2021.
Gustafson, K. E. and Dickhut, R. M.: Particle/Gas Concentrations and Distributions of PAHs in the Atmosphere of Southern Chesapeake Bay, Environ. Sci. Technol., 31, 140–147, https://doi.org/10.1021/es9602197, 1997.
Huang, R. J., Zhang, Y., Bozzetti, C., Ho, K. F., Cao, J. J., Han, Y., Daellenbach, K. R., Slowik, J. G., Platt, S. M., Canonaco, F., Zotter, P., Wolf, R., Pieber, S. M., Bruns, E. A., Crippa, M., Ciarelli, G., Piazzalunga, A., Schwikowski, M., Abbaszade, G., Schnelle-Kreis, J., Zimmermann, R., An, Z., Szidat, S., Baltensperger, U., El Haddad, I., and Prevot, A. S.: High secondary aerosol contribution to particulate pollution during haze events in China, Nature, 514, 218–222, https://doi.org/10.1038/nature13774, 2014.
Huang, W., Saathoff, H., Pajunoja, A., Shen, X., Naumann, K.-H., Wagner, R., Virtanen, A., Leisner, T., and Mohr, C.: α-Pinene secondary organic aerosol at low temperature: chemical composition and implications for particle viscosity, Atmos. Chem. Phys., 18, 2883–2898, https://doi.org/10.5194/acp-18-2883-2018, 2018.
Huang, W., Saathoff, H., Shen, X., Ramisetty, R., Leisner, T., and Mohr, C.: Chemical Characterization of Highly Functionalized Organonitrates Contributing to Night-Time Organic Aerosol Mass Loadings and Particle Growth, Environ. Sci. Technol., 53, 1165–1174, https://doi.org/10.1021/acs.est.8b05826, 2019a.
Huang, W., Saathoff, H., Shen, X., Ramisetty, R., Leisner, T., and Mohr, C.: Seasonal characteristics of organic aerosol chemical composition and volatility in Stuttgart, Germany, Atmos. Chem. Phys., 19, 11687–11700, https://doi.org/10.5194/acp-19-11687-2019, 2019b.
Jia, Y., Rahn, K. A., He, K., Wen, T., and Wang, Y.: A novel technique for quantifying the regional component of urban aerosol solely from its sawtooth cycles, J. Geophys. Res., 113, D21309, https://doi.org/10.1029/2008jd010389, 2008.
Kontkanen, J., Deng, C., Fu, Y., Dada, L., Zhou, Y., Cai, J., Daellenbach, K. R., Hakala, S., Kokkonen, T. V., Lin, Z., Liu, Y., Wang, Y., Yan, C., Petäjä, T., Jiang, J., Kulmala, M., and Paasonen, P.: Size-resolved particle number emissions in Beijing determined from measured particle size distributions, Atmos. Chem. Phys., 20, 11329–11348, https://doi.org/10.5194/acp-20-11329-2020, 2020.
Koss, A. R., Sekimoto, K., Gilman, J. B., Selimovic, V., Coggon, M. M., Zarzana, K. J., Yuan, B., Lerner, B. M., Brown, S. S., Jimenez, J. L., Krechmer, J., Roberts, J. M., Warneke, C., Yokelson, R. J., and de Gouw, J.: Non-methane organic gas emissions from biomass burning: identification, quantification, and emission factors from PTR-ToF during the FIREX 2016 laboratory experiment, Atmos. Chem. Phys., 18, 3299–3319, https://doi.org/10.5194/acp-18-3299-2018, 2018.
Kulmala, M., Dada, L., Daellenbach, K. R., Yan, C., Stolzenburg, D., Kontkanen, J., Ezhova, E., Hakala, S., Tuovinen, S., Kokkonen, T. V., Kurppa, M., Cai, R., Zhou, Y., Yin, R., Baalbaki, R., Chan, T., Chu, B., Deng, C., Fu, Y., Ge, M., He, H., Heikkinen, L., Junninen, H., Liu, Y., Lu, Y., Nie, W., Rusanen, A., Vakkari, V., Wang, Y., Yang, G., Yao, L., Zheng, J., Kujansuu, J., Kangasluoma, J., Petaja, T., Paasonen, P., Jarvi, L., Worsnop, D., Ding, A., Liu, Y., Wang, L., Jiang, J., Bianchi, F., and Kerminen, V. M.: Is reducing new particle formation a plausible solution to mitigate particulate air pollution in Beijing and other Chinese megacities?, Faraday Discuss., 226, 334–347, https://doi.org/10.1039/d0fd00078g, 2021.
Le Breton, M., Psichoudaki, M., Hallquist, M., Watne, Å. K., Lutz, A., and Hallquist, Å. M.: Application of a FIGAERO ToF CIMS for on-line characterization of real-world fresh and aged particle emissions from buses, Aerosol Sci. Tech., 53, 244–259, https://doi.org/10.1080/02786826.2019.1566592, 2019.
Lee, B. H., Mohr, C., Lopez-Hilfiker, F. D., Lutz, A., Hallquist, M., Lee, L., Romer, P., Cohen, R. C., Iyer, S., Kurten, T., Hu, W., Day, D. A., Campuzano-Jost, P., Jimenez, J. L., Xu, L., Ng, N. L., Guo, H., Weber, R. J., Wild, R. J., Brown, S. S., Koss, A., de Gouw, J., Olson, K., Goldstein, A. H., Seco, R., Kim, S., McAvey, K., Shepson, P. B., Starn, T., Baumann, K., Edgerton, E. S., Liu, J., Shilling, J. E., Miller, D. O., Brune, W., Schobesberger, S., D'Ambro, E. L., and Thornton, J. A.: Highly functionalized organic nitrates in the southeast United States: Contribution to secondary organic aerosol and reactive nitrogen budgets, P. Natl. Acad. Sci. USA, 113, 1516–1521, https://doi.org/10.1073/pnas.1508108113, 2016.
Lee, B. H., Lopez-Hilfiker, F. D., D'Ambro, E. L., Zhou, P., Boy, M., Petäjä, T., Hao, L., Virtanen, A., and Thornton, J. A.: Semi-volatile and highly oxygenated gaseous and particulate organic compounds observed above a boreal forest canopy, Atmos. Chem. Phys., 18, 11547–11562, https://doi.org/10.5194/acp-18-11547-2018, 2018.
Liu, L., Rao, Z., Wang, Y., Arandiyan, H., Gong, J., Liang, M., and Guo, F.: Characteristics and Health Risk Assessment of Semi-Volatile Organic Contaminants in Rural Pond Water of Hebei Province, Int. J. Env. Res. Pub. He., 16, 4481, https://doi.org/10.3390/ijerph16224481, 2019.
Liu, Q., Baumgartner, J., Zhang, Y., and Schauer, J. J.: Source apportionment of Beijing air pollution during a severe winter haze event and associated pro-inflammatory responses in lung epithelial cells, Atmos. Environ., 126, 28–35, https://doi.org/10.1016/j.atmosenv.2015.11.031, 2016.
Liu, Y., Zhang, Y., Lian, C., Yan, C., Feng, Z., Zheng, F., Fan, X., Chen, Y., Wang, W., Chu, B., Wang, Y., Cai, J., Du, W., Daellenbach, K. R., Kangasluoma, J., Bianchi, F., Kujansuu, J., Petäjä, T., Wang, X., Hu, B., Wang, Y., Ge, M., He, H., and Kulmala, M.: The promotion effect of nitrous acid on aerosol formation in wintertime in Beijing: the possible contribution of traffic-related emissions, Atmos. Chem. Phys., 20, 13023–13040, https://doi.org/10.5194/acp-20-13023-2020, 2020.
Liu, Y., Feng, Z., Zheng, F., Bao, X., Liu, P., Ge, Y., Zhao, Y., Jiang, T., Liao, Y., Zhang, Y., Fan, X., Yan, C., Chu, B., Wang, Y., Du, W., Cai, J., Bianchi, F., Petäjä, T., Mu, Y., He, H., and Kulmala, M.: Ammonium nitrate promotes sulfate formation through uptake kinetic regime, Atmos. Chem. Phys., 21, 13269–13286, https://doi.org/10.5194/acp-21-13269-2021, 2021.
Lopez-Hilfiker, F. D., Mohr, C., Ehn, M., Rubach, F., Kleist, E., Wildt, J., Mentel, Th. F., Lutz, A., Hallquist, M., Worsnop, D., and Thornton, J. A.: A novel method for online analysis of gas and particle composition: description and evaluation of a Filter Inlet for Gases and AEROsols (FIGAERO), Atmos. Meas. Tech., 7, 983–1001, https://doi.org/10.5194/amt-7-983-2014, 2014.
Lopez-Hilfiker, F. D., Mohr, C., D'Ambro, E. L., Lutz, A., Riedel, T. P., Gaston, C. J., Iyer, S., Zhang, Z., Gold, A., Surratt, J. D., Lee, B. H., Kurten, T., Hu, W. W., Jimenez, J., Hallquist, M., and Thornton, J. A.: Molecular Composition and Volatility of Organic Aerosol in the Southeastern U.S.: Implications for IEPOX Derived SOA, Environ. Sci. Technol., 50, 2200–2209, https://doi.org/10.1021/acs.est.5b04769, 2016.
Lopez-Hilfiker, F. D., Pospisilova, V., Huang, W., Kalberer, M., Mohr, C., Stefenelli, G., Thornton, J. A., Baltensperger, U., Prevot, A. S. H., and Slowik, J. G.: An extractive electrospray ionization time-of-flight mass spectrometer (EESI-TOF) for online measurement of atmospheric aerosol particles, Atmos. Meas. Tech., 12, 4867–4886, https://doi.org/10.5194/amt-12-4867-2019, 2019.
Masoud, C. G., Li, Y., Wang, D. S., Katz, E. F., DeCarlo, P. F., Farmer, D. K., Vance, M. E., Shiraiwa, M., and Hildebrandt Ruiz, L.: Molecular composition and gas-particle partitioning of indoor cooking aerosol: Insights from a FIGAERO-CIMS and kinetic aerosol modeling, Aerosol Sci. Tech., 56, 1156–1173, https://doi.org/10.1080/02786826.2022.2133593, 2022.
Mohr, C., Thornton, J. A., Heitto, A., Lopez-Hilfiker, F. D., Lutz, A., Riipinen, I., Hong, J., Donahue, N. M., Hallquist, M., Petaja, T., Kulmala, M., and Yli-Juuti, T.: Molecular identification of organic vapors driving atmospheric nanoparticle growth, Nat. Commun., 10, 4442, https://doi.org/10.1038/s41467-019-12473-2, 2019.
Noziere, B., Kalberer, M., Claeys, M., Allan, J., D'Anna, B., Decesari, S., Finessi, E., Glasius, M., Grgic, I., Hamilton, J. F., Hoffmann, T., Iinuma, Y., Jaoui, M., Kahnt, A., Kampf, C. J., Kourtchev, I., Maenhaut, W., Marsden, N., Saarikoski, S., Schnelle-Kreis, J., Surratt, J. D., Szidat, S., Szmigielski, R., and Wisthaler, A.: The molecular identification of organic compounds in the atmosphere: state of the art and challenges, Chem. Rev., 115, 3919–3983, https://doi.org/10.1021/cr5003485, 2015.
Riipinen, I., Yli-Juuti, T., Pierce, J. R., Petäjä, T., Worsnop, D. R., Kulmala, M., and Donahue, N. M.: The contribution of organics to atmospheric nanoparticle growth, Nat. Geosci., 5, 453–458, https://doi.org/10.1038/ngeo1499, 2012.
Schauer, J. J., Kleeman, M. J., Cass, G. R., and Simoneit, B. R. T.: Measurement of Emissions from Air Pollution Sources. 4. C1–C27 Organic Compounds from Cooking with Seed Oils, Environ. Sci. Technol., 36, 567–575, https://doi.org/10.1021/es002053m, 2002.
Siegel, K., Karlsson, L., Zieger, P., Baccarini, A., Schmale, J., Lawler, M., Salter, M., Leck, C., Ekman, A. M. L., Riipinen, I., and Mohr, C.: Insights into the molecular composition of semi-volatile aerosols in the summertime central Arctic Ocean using FIGAERO-CIMS, Environmental Science: Atmospheres, 1, 161–175, https://doi.org/10.1039/d0ea00023j, 2021.
Siegel, K., Neuberger, A., Karlsson, L., Zieger, P., Mattsson, F., Duplessis, P., Dada, L., Daellenbach, K., Schmale, J., Baccarini, A., Krejci, R., Svenningsson, B., Chang, R., Ekman, A. M. L., Riipinen, I., and Mohr, C.: Using Novel Molecular-Level Chemical Composition Observations of High Arctic Organic Aerosol for Predictions of Cloud Condensation Nuclei, Environ. Sci. Technol., 56, 13888–13899, https://doi.org/10.1021/acs.est.2c02162, 2022.
Tao, J., Zhang, L., Cao, J., and Zhang, R.: A review of current knowledge concerning PM2.5 chemical composition, aerosol optical properties and their relationships across China, Atmos. Chem. Phys., 17, 9485–9518, https://doi.org/10.5194/acp-17-9485-2017, 2017.
Thornton, J. A., Mohr, C., Schobesberger, S., D'Ambro, E. L., Lee, B. H., and Lopez-Hilfiker, F. D.: Evaluating Organic Aerosol Sources and Evolution with a Combined Molecular Composition and Volatility Framework Using the Filter Inlet for Gases and Aerosols (FIGAERO), Accounts Chem. Res., 53, 1415–1426, https://doi.org/10.1021/acs.accounts.0c00259, 2020.
Turpin, B. J. and Lim, H.-J.: Species Contributions to PM2.5 Mass Concentrations: Revisiting Common Assumptions for Estimating Organic Mass, Aerosol Sci. Tech., 35, 602–610, https://doi.org/10.1080/02786820119445, 2001.
Turpin, B. J., Saxena, P., and Andrews, E.: Measuring and simulating particulate organics in the atmosphere: problems and prospects, Atmos. Environ., 34, 2983–3013, https://doi.org/10.1016/S1352-2310(99)00501-4, 2000.
Wang, J. M., Jeong, C.-H., Hilker, N., Shairsingh, K. K., Healy, R. M., Sofowote, U., Debosz, J., Su, Y., McGaughey, M., Doerksen, G., Munoz, T., White, L., Herod, D., and Evans, G. J.: Near-Road Air Pollutant Measurements: Accounting for Inter-Site Variability Using Emission Factors, Environ. Sci. Technol., 52, 9495–9504, https://doi.org/10.1021/acs.est.8b01914, 2018.
Watson, J. G. and Chow, J. C.: Comparison and evaluation of in situ and filter carbon measurements at the Fresno Supersite, J. Geophys. Res.-Atmos., 107, ICC 3-1–ICC 3-15, https://doi.org/10.1029/2001jd000573, 2002.
Wu, C., Bell, D. M., Graham, E. L., Haslett, S., Riipinen, I., Baltensperger, U., Bertrand, A., Giannoukos, S., Schoonbaert, J., El Haddad, I., Prevot, A. S. H., Huang, W., and Mohr, C.: Photolytically induced changes in composition and volatility of biogenic secondary organic aerosol from nitrate radical oxidation during night-to-day transition, Atmos. Chem. Phys., 21, 14907–14925, https://doi.org/10.5194/acp-21-14907-2021, 2021.
Yao, L., Garmash, O., Bianchi, F., Zheng, J., Yan, C., Kontkanen, J., Junninen, H., Mazon, S. B., Ehn, M., Paasonen, P., Sipila, M., Wang, M. Y., Wang, X. K., Xiao, S., Chen, H. F., Lu, Y. Q., Zhang, B. W., Wang, D. F., Fu, Q. Y., Geng, F. H., Li, L., Wang, H. L., Qiao, L. P., Yang, X., Chen, J. M., Kerminen, V. M., Petaja, T., Worsnop, D. R., Kulmala, M., and Wang, L.: Atmospheric new particle formation from sulfuric acid and amines in a Chinese megacity, Science, 361, 278–281, https://doi.org/10.1126/science.aao4839, 2018.
Yao, L., Fan, X., Yan, C., Kurten, T., Daellenbach, K. R., Li, C., Wang, Y., Guo, Y., Dada, L., Rissanen, M. P., Cai, J., Tham, Y. J., Zha, Q., Zhang, S., Du, W., Yu, M., Zheng, F., Zhou, Y., Kontkanen, J., Chan, T., Shen, J., Kujansuu, J. T., Kangasluoma, J., Jiang, J., Wang, L., Worsnop, D. R., Petaja, T., Kerminen, V. M., Liu, Y., Chu, B., He, H., Kulmala, M., and Bianchi, F.: Unprecedented Ambient Sulfur Trioxide (SO3) Detection: Possible Formation Mechanism and Atmospheric Implications, Environ. Sci. Technol. Lett., 7, 809–818, https://doi.org/10.1021/acs.estlett.0c00615, 2020.
Ye, C., Yuan, B., Lin, Y., Wang, Z., Hu, W., Li, T., Chen, W., Wu, C., Wang, C., Huang, S., Qi, J., Wang, B., Wang, C., Song, W., Wang, X., Zheng, E., Krechmer, J. E., Ye, P., Zhang, Z., Wang, X., Worsnop, D. R., and Shao, M.: Chemical characterization of oxygenated organic compounds in the gas phase and particle phase using iodide CIMS with FIGAERO in urban air, Atmos. Chem. Phys., 21, 8455–8478, https://doi.org/10.5194/acp-21-8455-2021, 2021.
Ylisirniö, A., Barreira, L. M. F., Pullinen, I., Buchholz, A., Jayne, J., Krechmer, J. E., Worsnop, D. R., Virtanen, A., and Schobesberger, S.: On the calibration of FIGAERO-ToF-CIMS: importance and impact of calibrant delivery for the particle-phase calibration, Atmos. Meas. Tech., 14, 355–367, https://doi.org/10.5194/amt-14-355-2021, 2021.
Zheng, Y., Chen, Q., Cheng, X., Mohr, C., Cai, J., Huang, W., Shrivastava, M., Ye, P., Fu, P., Shi, X., Ge, Y., Liao, K., Miao, R., Qiu, X., Koenig, T. K., and Chen, S.: Precursors and Pathways Leading to Enhanced Secondary Organic Aerosol Formation during Severe Haze Episodes, Environ. Sci. Technol., 55, 15680–15693, https://doi.org/10.1021/acs.est.1c04255, 2021.