the Creative Commons Attribution 4.0 License.
the Creative Commons Attribution 4.0 License.
 | 10 Mar 2023
Typhoon-associated air quality over the Guangdong–Hong Kong–Macao Greater Bay Area, China: machine-learning-based prediction and assessment
Yilin Chen
Yuanjian Yang
The summertime air pollution events endangering public health in the Guangdong–Hong Kong–Macao Greater Bay Area are connected with typhoons. The wind of the typhoon periphery results in poor diffusion conditions and favorable conditions for transboundary air pollution. Random forest models are established to predict typhoon-associated air quality in the area. The correlation coefficients and the root mean square errors in the air quality index (AQI) and PM2.5, PM10, SO2, NO2 and O3 concentrations are 0.84 (14.88), 0.86 (10.31 µg m−3), 0.84 (17.03 µg m−3), 0.51 (8.13 µg m−3), 0.80 (13.64 µg m−3) and 0.89 (22.43 µg m−3), respectively. Additionally, the prediction models for non-typhoon days are established. According to the feature importance output of the models, the differences in the meteorological drivers of typhoon days and non-typhoon days are revealed. On typhoon days, the air quality is dominated by local source emission and accumulation as the sink of pollutants reduces significantly under stagnant weather, while it is dominated by the transportation and scavenging effect of sea breeze on non-typhoon days. Therefore, our findings suggest that different air pollution control strategies for typhoon days and non-typhoon days should be proposed.
- Article
(11632 KB) - Full-text XML
-
Supplement
(6750 KB) - BibTeX
- EndNote


The rapid and continuous economic and industrial development of China in recent decades has resulted in a mounting air pollution problem in the country. Major atmospheric pollutants, such as particulate matter (PM), O3, SO2 and NO2, not only have important impacts on ecosystems, traffic safety and weather/climate but also seriously exacerbate human health issues and increase morbidity and mortality from cardiovascular and respiratory diseases (Che et al., 2005, 2014; Lolli et al., 2018; Lolli, 2021; Zheng et al., 2020; Zhu et al., 2021). The Guangdong–Hong Kong–Macao Greater Bay Area (GBA), located in southern China, comprises nine municipalities of Guangdong Province, including Guangzhou and Shenzhen, and two Special Administrative Regions, Hong Kong and Macao. With a high population density of over 1100 people per square kilometer, the GBA is one of China's most heavily populated and urbanized areas. As a result, the area sees a high intensity of air pollutant emissions and frequent air pollution events (Deng et al., 2008, 2011; Hou et al., 2019). As well as the intense emission of pollutants, the other main factor influencing the air quality is the weather circulation pattern (Yang et al., 2018, 2020a; Zong et al., 2021). For instance, when light breezes and a temperature inversion layer occur in the surface layer of the GBA, the air quality deteriorates (Tong et al., 2018a; Ding et al., 2004; Huang et al., 2005; Yang et al., 2012). In contrast, the air quality is good when the wind speed in the area is high – for example, the strong southerly winds in summer and northerly winds that cross the northern mountains in winter (Chen et al., 2016; Tong et al., 2018a, b).
The GBA is continually affected by typhoons in summer (Ying et al., 2014; Lu et al., 2021), and as they make landfall, the air quality and synoptic situation in the region changes significantly (Ding et al., 2004; Huang et al., 2005; Lam et al., 2005; Feng et al., 2007; Wei et al., 2007, 2016; Yang et al., 2012; Wang et al., 2022). The causes of typhoon-associated air pollution can be concluded as follows. On the one hand, the downdraft of the typhoon periphery leads to a large-scale temperature inversion layer, meaning light air and adverse pollutant diffusion conditions prevail in the area (Feng et al., 2007; Yang et al., 2012; Deng et al., 2019). Additionally, pollutants in the upper level are transported down to the lower atmosphere, where they accumulate under the impact of the downdraft. Consequently, the accumulation of local source emissions is aggravated, making the air quality bad or even severe (Huang et al., 2005; Wei et al., 2016). On the other hand, the various wind patterns of the typhoon periphery (mostly northerlies during pollution events) provide favorable conditions for transboundary air pollution from both outside the GBA and cities inside the GBA (Chow et al., 2018; Lam et al., 2018; Luo et al., 2018; Deng et al., 2019; Yim et al., 2019; Yang et al., 2019). However, there are still two issues with respect to typhoon-associated air quality in the GBA that have yet to be fully understood. (1) Which local meteorological factors play the dominant role in the change in different atmospheric pollutants during typhoon processes? (2) What are the differences in the dominant local meteorological factors between typhoon and non-typhoon processes? These two issues are of great significance to the forecast of air quality and the adaptions of air pollution in the GBA.
Quantitative analysis and the prediction of pollutant concentrations have become a focus in this field of study. Existing methods include numerical forecasting, statistical forecasting and machine learning. In terms of numerical forecasting, several models have been developed, such as CMAQ (Community Modeling and Analysis System; developed by the US EPA) and NAQPMS (a nested air quality prediction modeling system developed by the Institute of Atmospheric Physics, Chinese Academy of Sciences) (Arnold et al., 2003; Li et al., 2011). These models have been applied by some researchers to study typhoon-associated air quality, and results have revealed the impacts of meteorological conditions on the transportation and diffusion of air pollutants – for example, the downdraft, northerly winds and high near-surface air temperatures that boost the photochemical reaction that generates O3 (Wei et al., 2016). Numerical experiments also led to the discovery that the contribution of cross-regional transportation varies with the wind field, and these studies reflect one of the advantages of the numerical modeling method, which is that they can analyze the formation mechanism of a specific pollution event (Huang et al., 2005; Lam et al., 2005). However, this approach also has its drawbacks, such as computational complexity and high data requirements. As for statistical methods, examples include clustering and multiple regression methods based on meteorological factors and weather types (Su et al., 2009; Singh et al., 2012). Although the calculations involved in these statistical methods are simple, their predicted results exhibit uncertainties with large errors and local dependence (Ross et al., 2007; Singh et al., 2012). In contrast, machine learning methods perform very well in terms of accuracy and are already leveraged in many fields such as meteorology and the environmental sciences (Li et al., 2021; Zheng et al., 2021; Bochenek and Ustrnul, 2022; Chen et al., 2022). The forecasting of air quality is no exception. The most widely used algorithms include random forest (RF), support vector machines, extreme gradient boosting (XGBoost) and neural networks. The input variables include meteorological data and traffic flow data. Among the machine learning models, RF is an ensemble machine learning algorithm based on decision trees, which has certain advantages in capturing the nonlinear relationship between variables. Attempts made to employ RF in predicting air quality have produced promising results (Kamińska, 2018; Bai et al., 2019; Hu et al., 2021; Ding et al., 2022; Liu et al., 2022).
It is clear from the literature, as reviewed above, that there is a definite link between typhoons and air quality in the GBA. Nevertheless, the meteorological determinants of different kinds of pollutants during a typhoon event are still unclear. There is also little research on applying machine learning to predicting air quality with typhoon location and intensity data, and the accuracy of such predictions remains unknown. Therefore, in order to improve the accuracy of air quality prediction for the GBA during typhoon processes, the present research establishes an RF prediction model of typhoon-associated air quality in the GBA with air quality data (air quality index (AQI), PM2.5, PM10, SO2, NO2, O3) from 39 air quality monitoring stations in 10 cities in the region, the China Meteorological Administration (CMA) tropical cyclone best-track dataset from 2014–2020, and meteorological data from the fifth major global reanalysis produced by the European Centre for Medium-Range Weather Forecasts (ERA5). Also, for the non-typhoon days (NTY days) in the typhoon season (June–September), RF prediction models based on meteorological elements are established to analyze the changes in local meteorological determinants. The aim of this study is to improve the prediction and assessment of typhoon-associated air quality in the GBA, which not only is important from a scientific viewpoint but also has considerable practical application value for tackling the socioeconomic effects of typhoons and associated air quality.
2.1 Data
The present study takes 39 air quality monitoring stations in 10 cities in the GBA (Guangzhou, Shenzhen, Zhuhai, Foshan, Zhaoqin, Jiangmen, Huizhou, Dongguan, Zhongshan, Hong Kong) as research objects. Three of these stations from Guangzhou, Shenzhen and Hong Kong are used for independent testing and are excluded from the training stage. The input variables of the model are
-
the latitude and longitude of the monitoring stations, hourly average AQI, and concentrations of PM2.5, PM10, SO2, NO2 and O3;
-
the typhoon center latitude (Tlat), longitude (Tlon) and minimum pressure (Tpres), as well as the typhoon near-center maximum wind speed (Tws), from the CMA tropical cyclone best-track dataset produced by the CMA Tropical Cyclone Data Center;
-
ERA5 reanalysis meteorological data, including the eastward component of the 10 m wind (U10 m), northward component of the 10 m wind (V10 m), 2 m dew-point temperature (d2 m) and air temperature (T2 m), planetary boundary layer height (PBLH), surface pressure (SP), total precipitation (TP), vertical velocity at 850 hPa (W850) and 700 hPa (W700), and static stability (St) (defined as the potential temperature at 700 hPa minus that at 1000 hPa).
Using the model constructed with the data above, the future air quality under the effect of the typhoon can be predicted. To be specific, the forecasted air quality can be acquired by replacing the ERA5 reanalysis meteorological data with the ECMWF's forecast field and introducing the predicted typhoon location and intensity (for example, from the CMA). The distribution of all typhoon samples and air quality monitoring stations is shown in Fig. 1. The data preprocessing procedure is given in Sect. S1 in the Supplement.
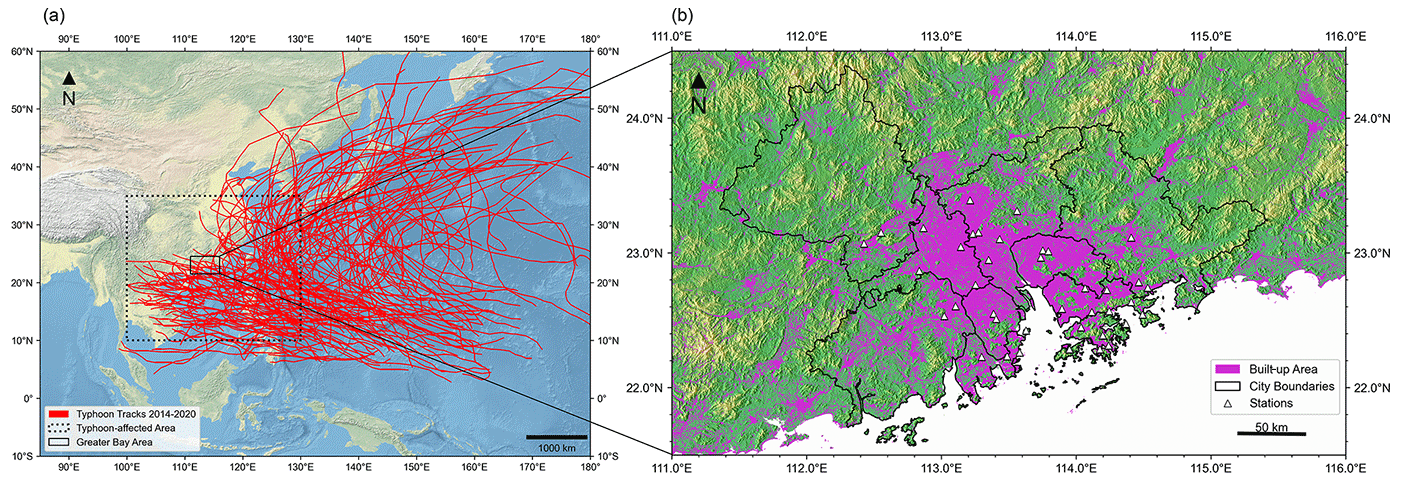
Figure 1Overview of the data used in this study: (a) tracks of the studied typhoons (only those typhoons within the dotted box area are introduced into the model); (b) locations of the 39 observation stations.
2.2 RF model
The RF algorithm, first proposed by Breiman (2001), is a kind of ensemble machine learning algorithm. The process for establishing the model is follows. Select a random sample with the replacement of the training set and train a large number of decision trees. For each tree, calculate the error at the node and split with the minimum error as the criterion until the designated maximum tree depth is reached. The average of the output of all trees is calculated as the model output.
One of the strengths of the RF model is that it can calculate the importance of features based on impurity, which means that it can calculate the feature's importance by the degree of error reduction brought about by it. The higher the importance value is, the more influential the feature will be. Because of these advantages, RF models have been applied to analyze causal relationships between variables and provide a powerful tool for determining the dominant factors among variables (Wang et al., 2019; Yang et al., 2020b; Zeng et al., 2020; Li et al., 2021; Venter et al., 2021; Chen et al., 2022).
Figure 2 presents the technology roadmap for establishing the RF model, which is described as follows.
Step 1: data acquisition and matching. This paper uses the scikit-learn package in Python to construct the RF forecast model with the typhoon location and intensity data (on typhoon days, TY days), the location of monitoring stations and meteorological data as input variables, and the AQI and concentrations of PM2.5, PM10, SO2, NO2 and O3 as the predicted variables.
Step 2: RF model establishment and cross-validation. First, the dataset (data from 36 stations) is randomly divided into a 70 % training set and 30 % testing set. The hyperparameter tuning and model training process is conducted on the training set. The hyperparameter tuning process refers to determining the best hyperparameters, which means the parameters must be set manually in advance. The testing set is used for evaluating the RF model's ability to predict the unseen data. To avoid the bias caused by the splitting of the training and testing sets, 10-fold cross-validation (CV) is adopted in the training set, which is to say that the training set is divided into 10 parts, 9 of which are used as the training set of the tuning process, and then the performance of the remaining one, called the validation set, is tested. This therefore ensures that the optimal parameters of the model that are found are not affected by data partitioning. The hyperparameters adjusted in the present study are described in Sect. S2. Afterward, the training set and the testing set were applied to the optimal model, and the feature importance of the model output was analyzed to obtain the dominant meteorological factors of each model.
Step 3: model prediction and verification. Once the optimal model is established, the training set, testing set and data from testing stations in Guangzhou, Shenzhen and Hong Kong are applied to the model separately, and a series of model evaluation metrics are calculated, including the mean absolute error (MAE), root mean square error (RMSE), bias, correlation coefficient between the observed and predicted value (R), standard deviation of the observation (SDO), standard deviation of the prediction (SDP), and index of agreement (IA). The definitions of these metrics are given in Table 1. Among these indicators, the smaller the bias, MAE and RMSE are, the better the model performs; the closer R and IA are to 1, the more ideal the result is; and the closer SDO and SDP are, the better the model is overall. If RMSE is lower than SDO, the IA is high, and SDO is close to SDP, then the prediction is satisfactory (Lu et al., 1997).
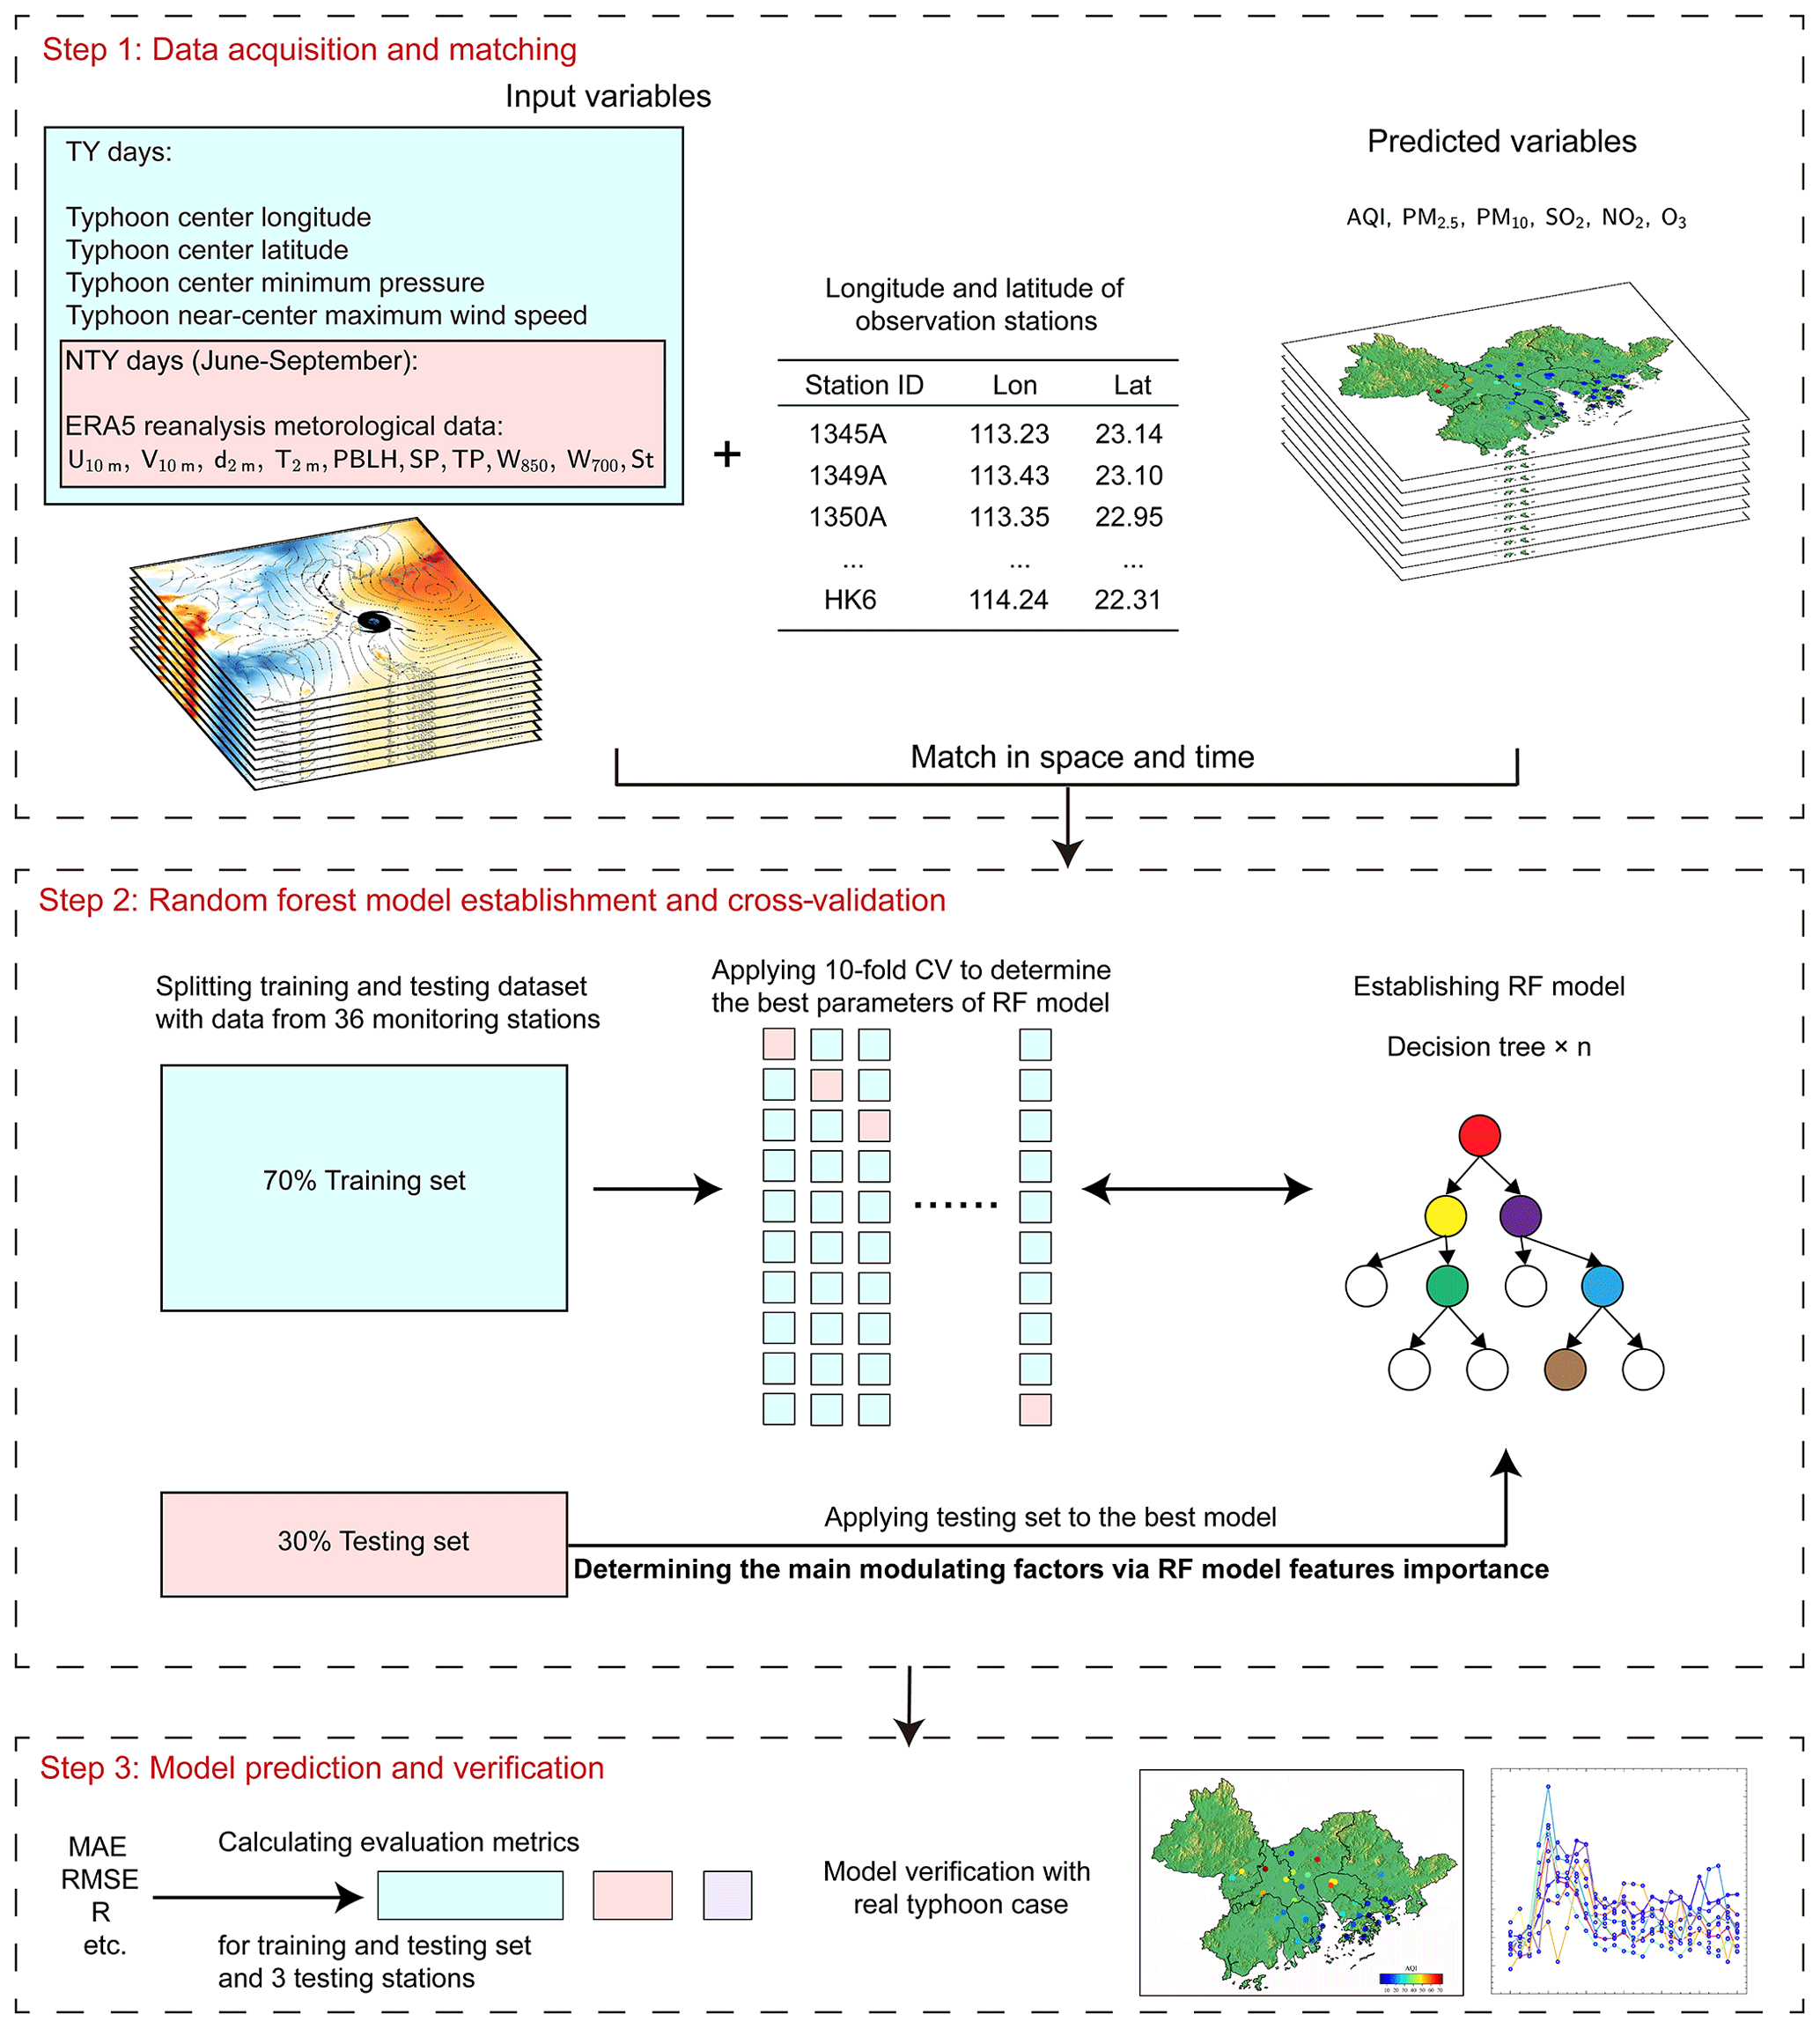
Figure 2Flow chart of the study framework.
Table 1The definition of evaluation metrics of the model.
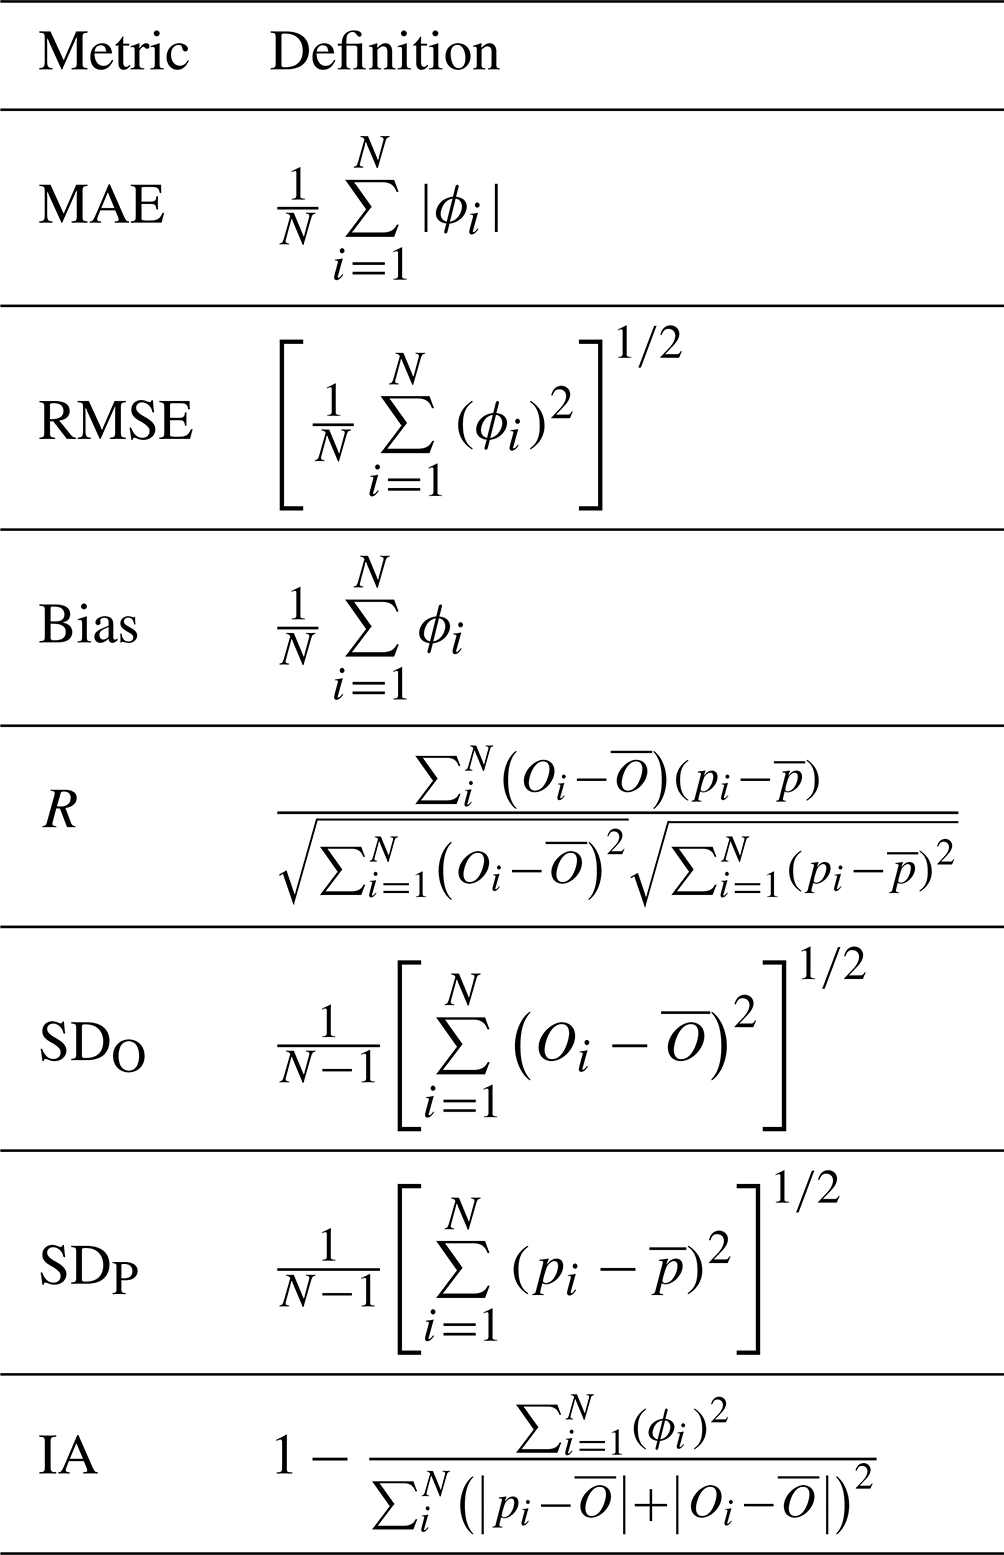
Notation: pi is the predicted value, Oi is the observed value, N is sample size, is the mean of observed value, is the mean of predicted value, and ϕi is the difference between the predicted and observed values.
3.1 RF model evaluation
3.1.1 TY-associated model
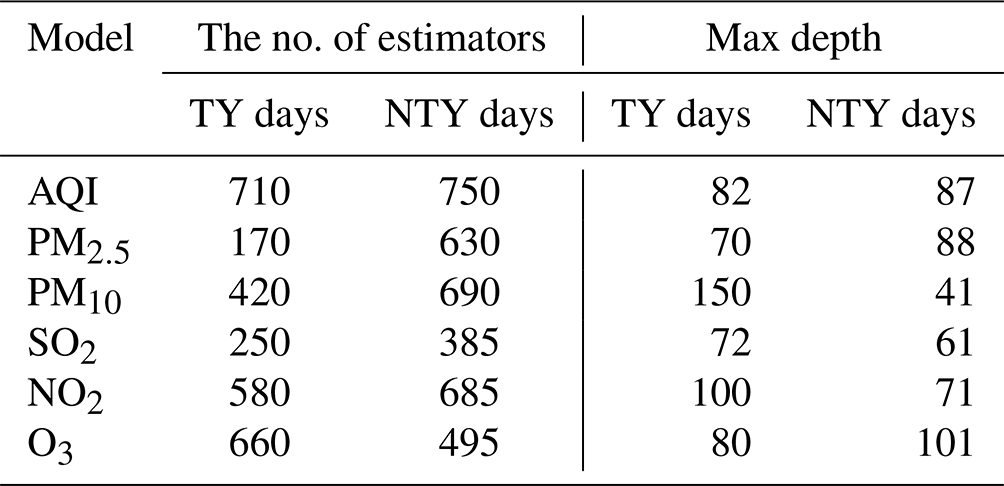
The RF model is applied to the AQI and five pollutants to establish six distinct RF models (the hyperparameters of the six models can be seen in Table 2; 70 % of the samples from 36 stations are used as the training set and 30 % as the testing set).
The training and testing results for the AQI, PM2.5 and PM10 are shown in Fig. 3a, b, d, e, g and h. The R values between the observed and predicted value of the training set (testing set) are 0.986 (0.843), 0.986 (0.859) and 0.983 (0.837), respectively; the RMSEs are 5.43 (14.88), 3.88 µg m−3 (10.31 µg m−3) and 6.33 µg m−3 (17.03 µg m−3); and the biases are 0.10 (−0.07), 0.06 µg m−3 (0.20 µg m−3) and 0.19 µg m−3 (0.16 µg m−3). As for the MAE and IA, the RF model also performs well. The IA of the testing is as high as 0.894, 0.906 and 0.895. It can be seen that the red points in the training set are mostly close to the diagonal line, which means that the RF model makes an accurate prediction over the majority of the samples. Although the data points for the testing set are not as dense as those for the training set, the sample with the most frequency is still relatively close to the y=x line, indicating that the RF model has good predictive ability for unseen data. Concerning the feature importance (Fig. 3c, f, i), the dominant factor of the AQI is d2 m, which represents the atmospheric humidity, followed by the static stability. The first two factors have approximate importance values, reflecting that the meteorological determinants of the AQI in the GBA during typhoon events are humidity and static stability. Among all the typhoon information data, the importance of Tlon and Tlat is intermediate among all the variables, while the importance of Tpres and Tws is the lowest. It can be concluded that the typhoon center location rather than the typhoon intensity is the key to modifying the synoptic situation in the GBA, thereby changing the AQI value. Similarly, Figs. S1–S3 in the Supplement show the R (RMSE) values of the testing set for SO2, NO2 and O3 are 0.510 (8.13 µg m−3), 0.799 (13.64 µg m−3) and 0.894 (22.43 µg m−3), respectively. The IA of all pollutants except SO2 exceeds 0.85, reflecting that the RF model has strong predictive ability for these pollutants.
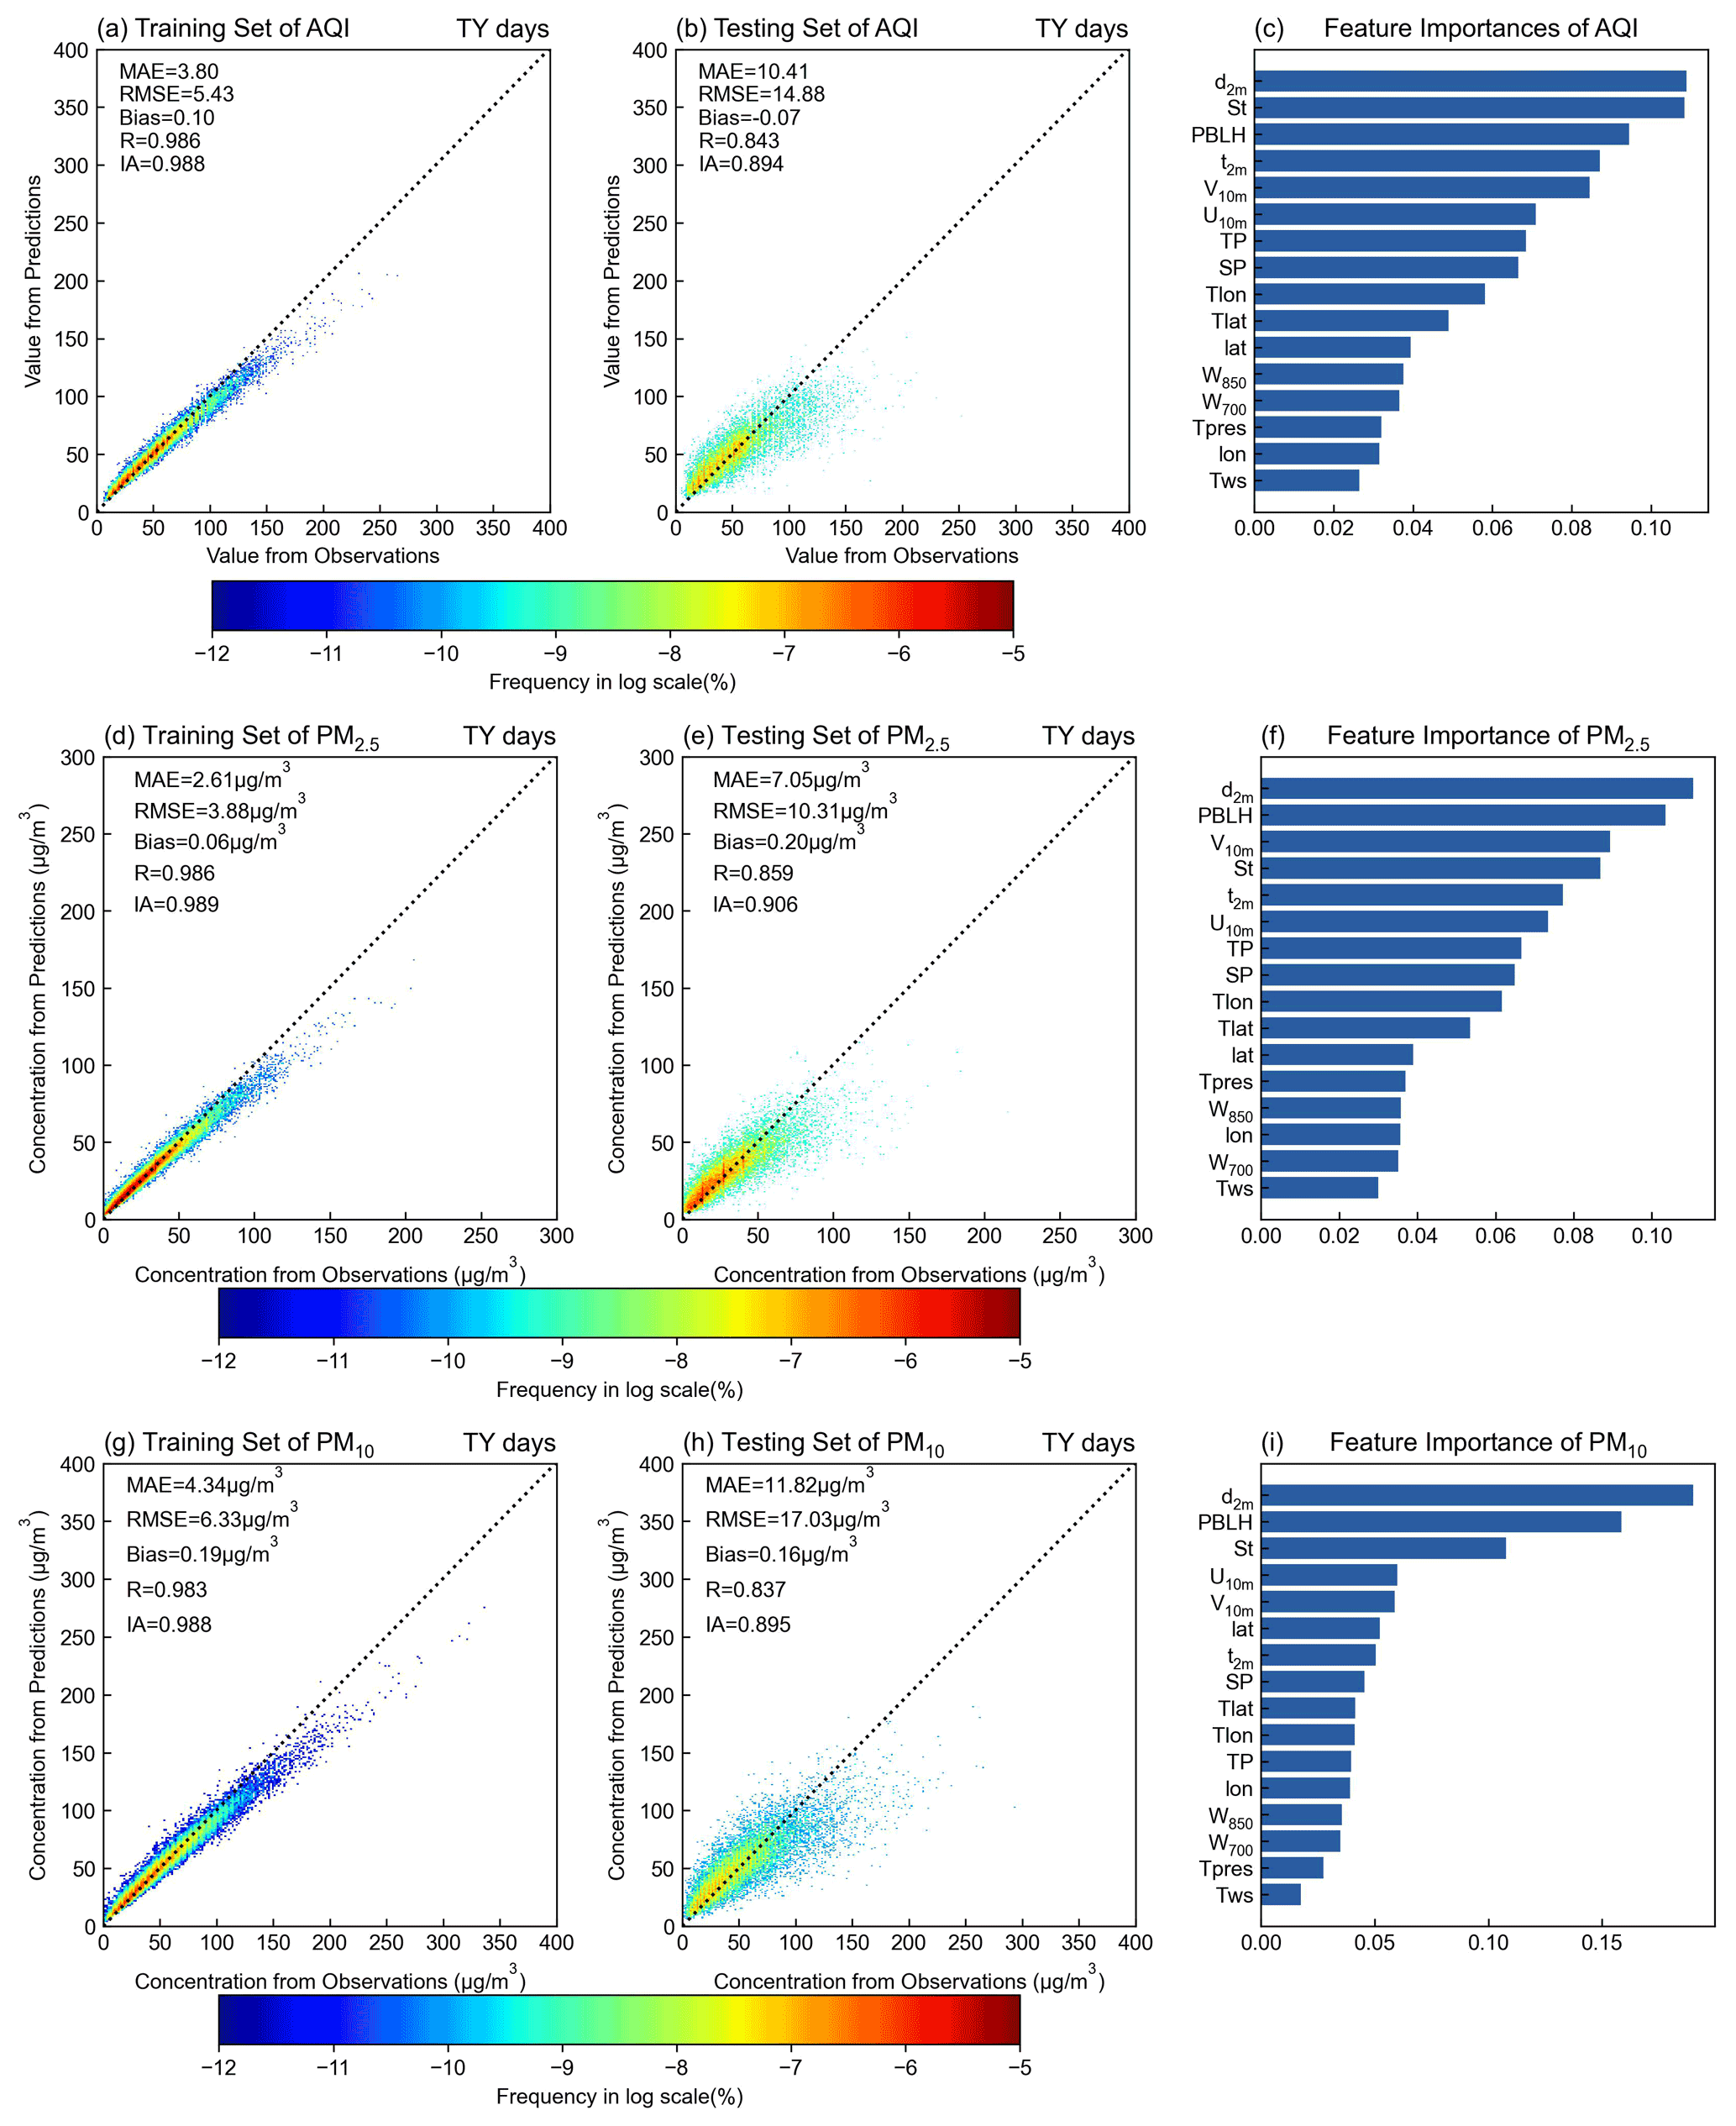
Figure 3The results of TY days' AQI, PM2.5 and PM10 predicted by the RF model: (a) training set of AQI; (b) testing set of AQI; (c) feature importance of AQI; (d–i) training set of (d) PM2.5 and (g) PM10; testing set of (e) PM2.5 and (h) PM10; feature importance of (f) PM2.5 and (i) PM10.
The pollutants can be classified into two categories based on the feature importance output of the RF model with respect to the major meteorological controlling factors. The first category is the d2 m-driven type, which includes PM2.5 and PM10, whose dominant meteorological driving factor is d2 m, followed by the PBLH, which is consistent with the AQI. The reason for this could be that d2 m reflects not only the humidity but also the precipitation and temperature to some extent. When there is rainfall related to a typhoon in the GBA, wet deposition will reduce the concentration of PM. The reason why total precipitation is less important than d2 m could be that the latter always has a value and is more variable. The similarity between the AQI, PM2.5 and PM10 results reveals that the major pollutant in the ambient air of the GBA during typhoon events is PM, since the AQI value is the highest of the individual air quality index. The other category is the PBLH-driven type, which includes SO2, NO2 and O3. Obviously, the major meteorological influence in this case during typhoon events is the PBLH. Nevertheless, the situation for SO2 is unlike that of the other two. The most important variables affecting the SO2 concentration after the PBLH are U10 m and V10 m. Indeed, this is the highest U10 m and V10 m importance among the six models, indicating that the SO2 in the GBA may mainly derive from transboundary transportation. The variable importance for NO2 and O3 exhibits very similar characteristics because they are both pollutants closely related to photochemical reactions. Under certain conditions, the free radical reaction of NO2 can generate O3 (Lam et al., 2005, 2018; Zhang et al., 2013; Deng et al., 2019). It is also worth noting for these two pollutants that the PBLH, which has the highest rank of importance among all variables, is more than twice as important as the second-highest variable, and this is distinct from the other four models.
Additionally, this paper uses three testing stations in Guangzhou, Shenzhen and Hong Kong, which are excluded from the training and testing set mentioned above, to further investigate the generalization ability of the model. The results for the AQI, PM2.5 and PM10 of TY days are shown in Fig. 4a–c. The R (RMSE) values for AQI, PM2.5 and PM10 are 0.868 (11.70), 0.900 (7.16 µg m−3) and 0.841 (13.45 µg m−3), respectively. As for SO2, NO2 and O3, Fig. S4a–c show the R (RMSE) values of the testing set for SO2, NO2 and O3 are 0.496 (5.38 µg m−3), 0.538 (27.94 µg m−3) and 0.878 (22.45 µg m−3), respectively. These results are not significantly different from the results for the previous 36 stations, indicating that models trained with some station data also predict equally well in new locations, which is to say that the RF model successfully captures the correlation between the typhoon's location and the monitoring stations' location. Though the input stations changed, the model still produces accurate predictions based on the relative position of the station and the typhoon.
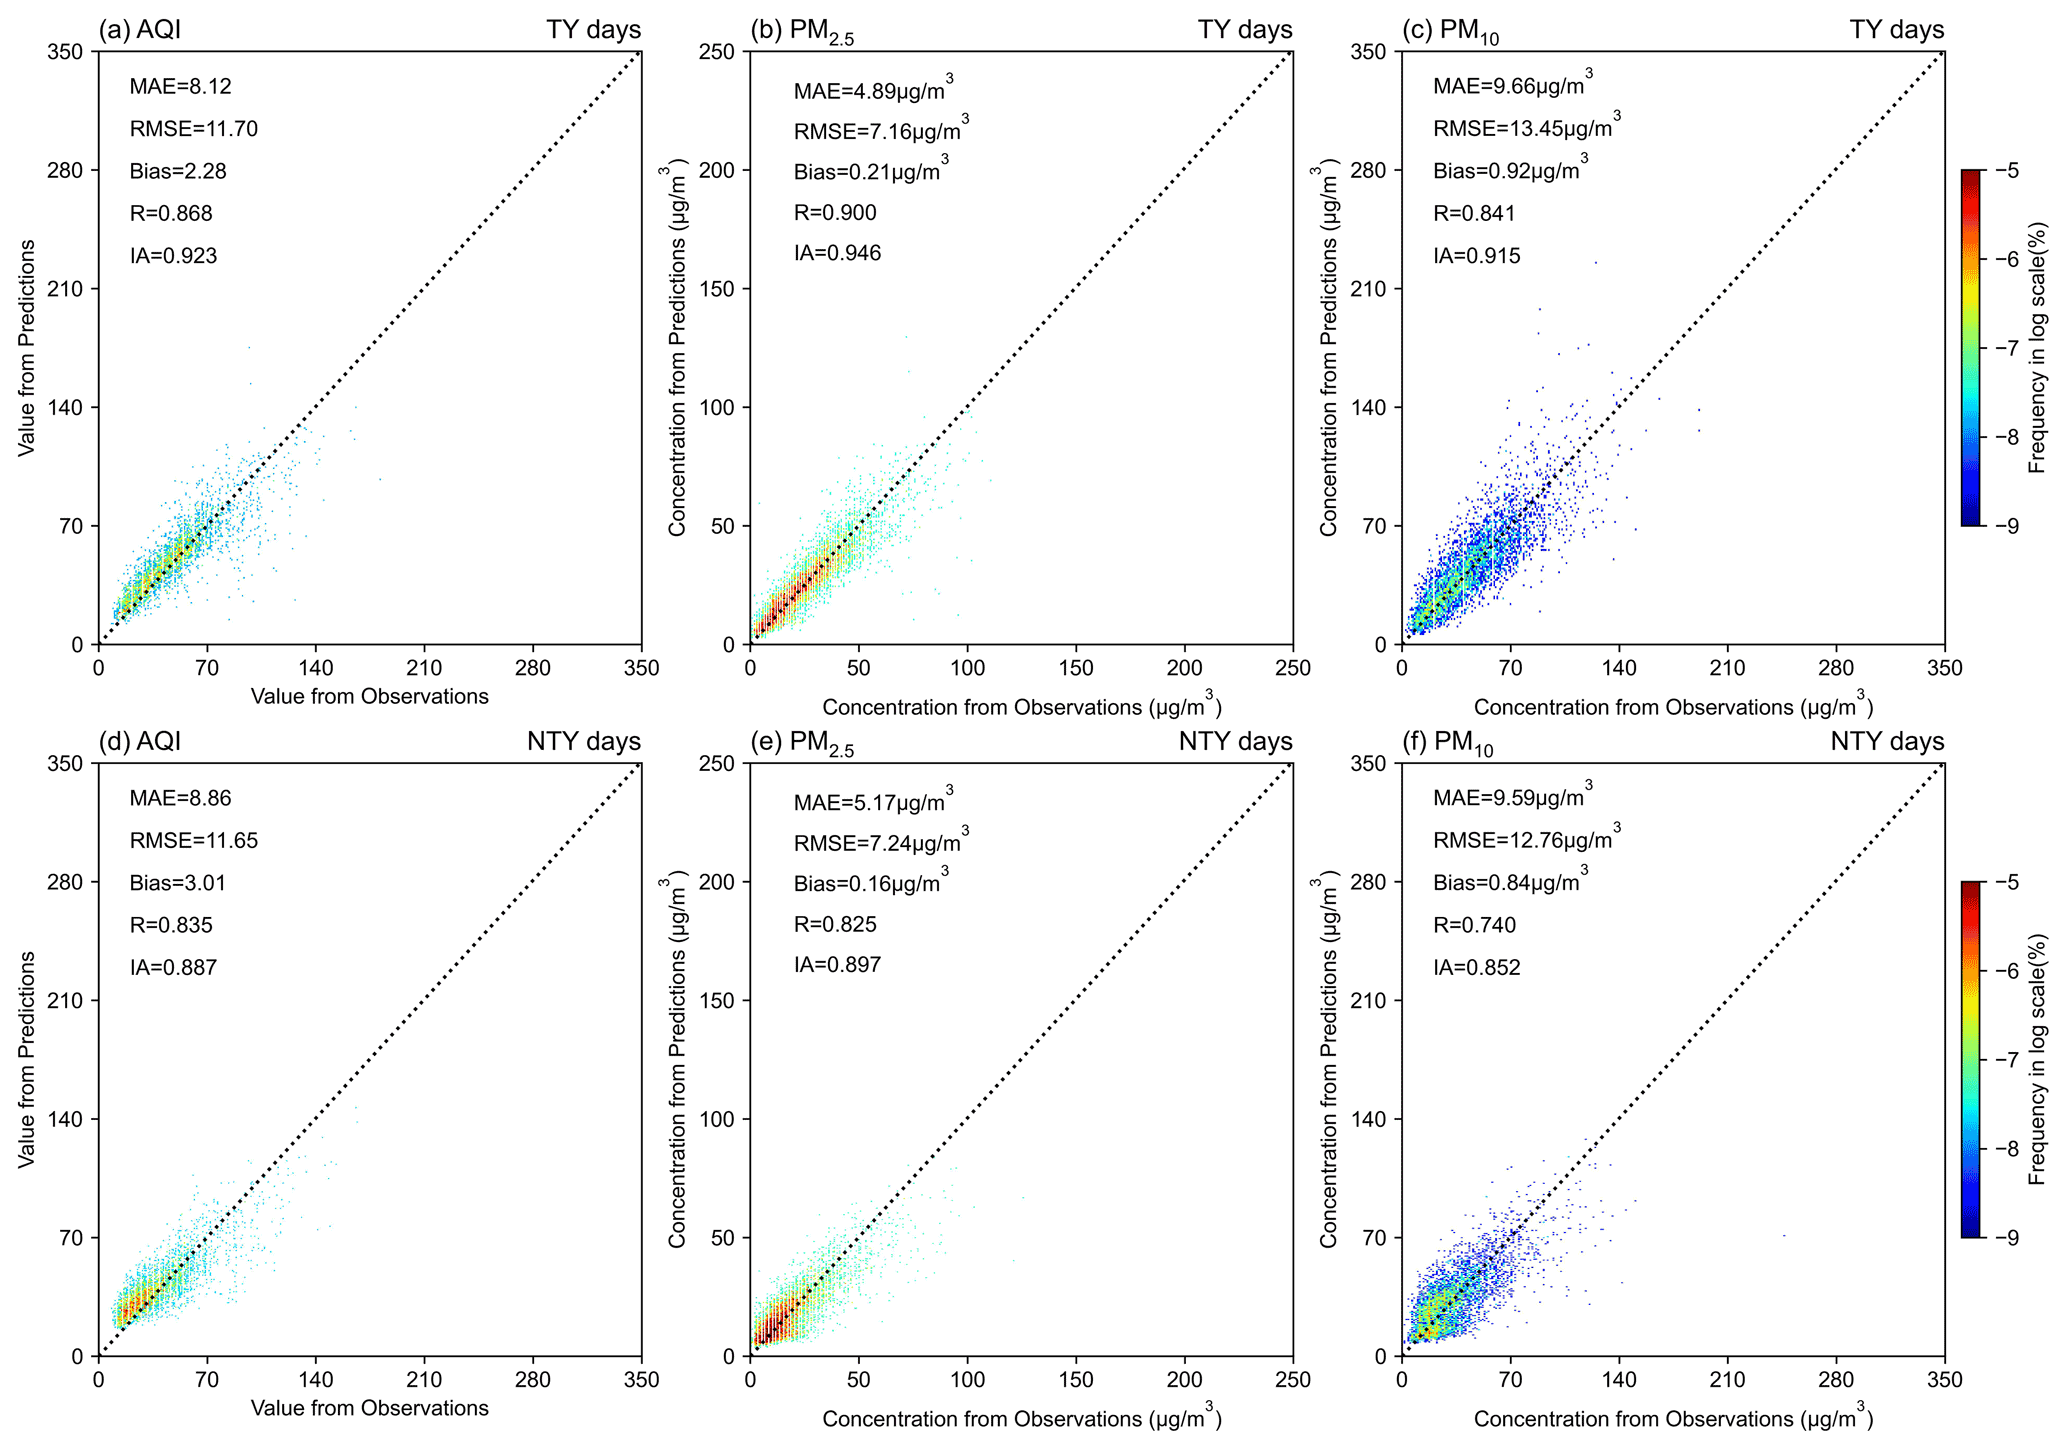
Figure 4The results of AQI, PM2.5 and PM10 of three testing stations predicted by the RF model: (a) AQI of TY days; (b) PM2.5 of TY days; (c) PM10 of TY days; (d) AQI of NTY days; (e) PM2.5 of NTY days; (f) PM10 of NTY days.
Overall, the model has outstanding predictive ability for the AQI and five air pollutants and makes correct predictions for the new stations that are unseen in the training stage. The present study also highlights that the typhoon location variables of Tlat and Tlon are more important than the typhoon intensity variables of Tpres and Tws, showing that the major driving factor in modifying the synoptic situation in the GBA and thereby changing the AQI value is typhoon location. The role of typhoon intensity requires further study. The dominant meteorological drivers of typhoon-associated air quality are also revealed by the RF model: for the AQI and concentrations of PM2.5 and PM10 it is d2 m, while for SO2, NO2 and O3 it is the PBLH.
3.1.2 NTY-associated model
We then use the meteorological data, station location and air quality data of the NTY days during the typhoon season (June–September) to build RF models (the hyperparameters of the six models can be seen in Table 2). Similarly, the model prediction accuracy and output feature importance are calculated and compared with the results of TY days. The training and testing results for the AQI, PM2.5 and PM10 are shown in Fig. 5a, b, d, e, g and h. The R values between the observed and predicted value of the training set (testing set) are 0.979 (0.745), 0.978 (0.744) and 0.978 (0.708), respectively; the RMSEs are 5.52 (15.11), 3.60 µg m−3 (9.68 µg m−3) and 5.65 µg m−3 (15.45 µg m−3); and the biases are 0.19 (0.57), 0.12 µg m−3 (0.27 µg m−3) and 0.18 µg m−3 (0.48 µg m−3). Compared with the prediction results of the TY days, the prediction accuracy is significantly reduced, and the R values are all reduced to below 0.8. Figures S5–S7 show the R (RMSE) values of the testing set for SO2, NO2 and O3 are 0.452 (7.00 µg m−3), 0.744 (11.63 µg m−3) and 0.867 (24.18 µg m−3), respectively. The prediction accuracy of the model is significantly poorer compared with the model of TY days, and it can be seen that the maximum pollutant concentration on NTY days is significantly larger than that on TY days, indicating that the period of air quality deterioration in the GBA coincides with the period of typhoon activity.
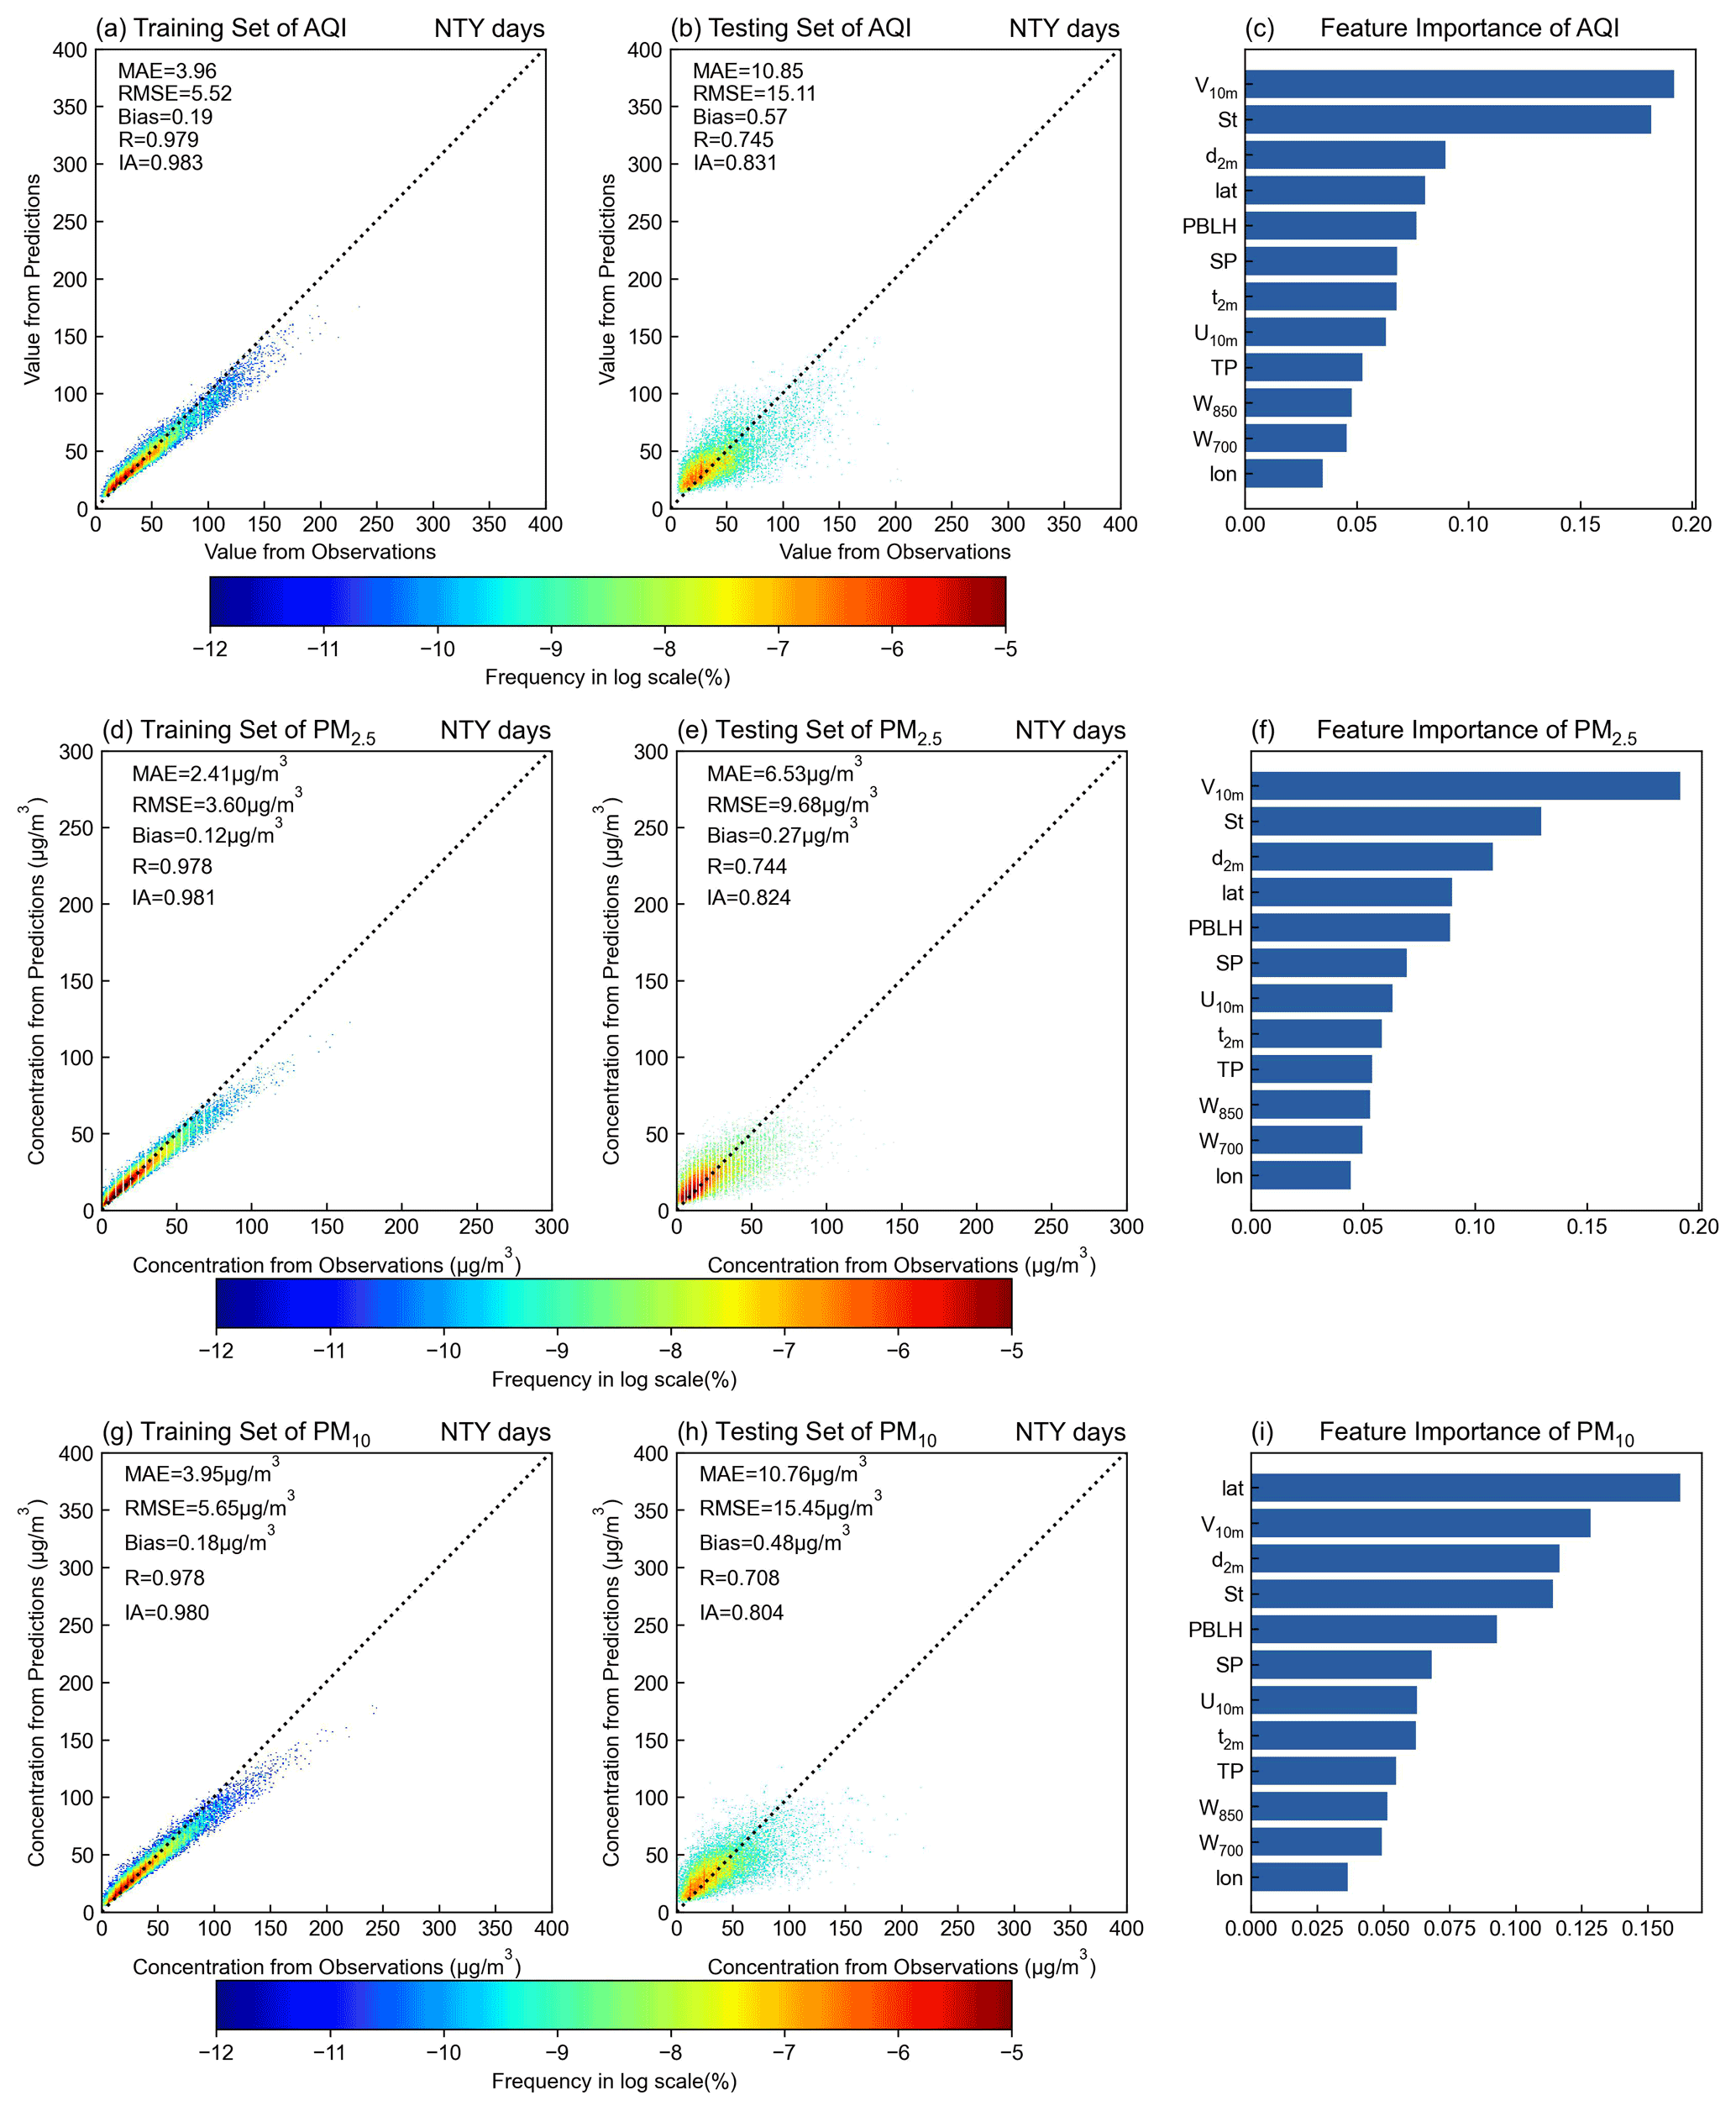
Figure 5The results of NTY days' AQI, PM2.5 and PM10 predicted by the RF model: (a) training set of AQI; (b) testing set of AQI; (c) feature importance of AQI; training set of (d) PM2.5 and (g) PM10; testing set of (e) PM2.5 and (h) PM10; feature importance of (f) PM2.5 and (i) PM10.
The feature importance of model predictions on NTY days is significantly different from that on TY days. For AQI and PM2.5, the meteorological driver is longitudinal wind (V10 m), while for PM10 it is the latitude of the monitoring station (lat). Considering that the southern part of the GBA is close to the sea, and the farther north one goes, the farther it is from the sea, V10 m can represent the strength of the sea breeze and land breeze, and lat can be seen as the distance from the sea. By contrast, their meteorological determinants are all d2 m on TY days, and this change indicates that the typhoon deters the pollutants from being blown away and replaced by clean air from the ocean, which is the major sink of pollutants on NTY days. Therefore, haze occurs. As for the pollutants classified as the PBLH-driven type – SO2, NO2 and O3 – their meteorological drivers on NTY days are V10 m, St and PBLH, respectively.
Consistent with the TY-associated model, three testing stations from Guangzhou, Shenzhen and Hong Kong are introduced into the NTY-associated model. The results for the AQI, PM2.5 and PM10 of NTY days are shown in Fig. 4d–f. The R (RMSE) values for AQI, PM2.5 and PM10 are 0.835 (11.65), 0.825 (7.24 µg m−3) and 0.740 (12.76 µg m−3), respectively. As for SO2, NO2 and O3, Fig. S4d–f show the R (RMSE) values of the testing set for SO2, NO2 and O3 are 0.344 (6.45 µg m−3), 0.413 (25.58 µg m−3) and 0.881 (20.71 µg m−3), respectively. Two comparisons are made: (1) by comparing the results of three testing stations with the results of 36 training stations on NTY days, this shows that the result of testing stations is not worse than 36 training stations; i.e., the model has a robust ability to predict the stations in the new location; (2) by comparing the results of three testing stations on TY days and NTY days, the results show that the prediction accuracy of the model on NTY days is significantly poorer compared with the TY days model, which is in agreement with previous findings.
In general, the prediction results indicate that the RF model can accurately and effectively capture the mechanism of the impact of typhoons on air quality. Additionally, differences in meteorological determinants between TY and NTY days also have important implications for air quality in the GBA: for PM, the prevailing sea breeze is the major scavenging mechanism on NTY days and is deterred by the various wind patterns of the typhoon periphery on TY days, while for SO2, NO2 and O3, on TY days, their concentrations are strongly affected by the PBLH, and the effects of local emission and accumulations are more dramatic than transboundary air pollution, causing pollution events. In contrast, on NTY days, transboundary air pollution is more obvious than the local pollutant emissions. These findings shed new light on the control of regional air pollution in the GBA, which is to say that different strategies should be adopted on TY and NTY days. On NTY days, countermeasures should focus more on source emission control and make full use of the diffusion and cleaning effect of the sea breeze to reduce air pollution. Coordinated emission reduction in the region should be strengthened to reduce the concentration of pollutants in the entire region at the same time. On TY days, more focus should be on increasing the sink of pollutants (which is decreased due to the static and stable weather of the typhoon periphery). Countermeasures should be taken to increase the sedimentation and decomposition of pollutants in the area, such as more road watering.
3.2 Model-predicted correlation between air quality and typhoon center location
To further investigate the RF model's ability to capture the correlation between typhoon location and air quality in the GBA, each position within the research area (at a spatial interval of 0.5∘) is input into the RF model as the position of the typhoon to predict the AQI and concentrations of PM2.5, PM10, SO2, NO2 and O3 (the typhoon intensity and meteorological variable values are the averages of all typhoons within the specified spatial interval). Figure 6 shows the average of the predictions across all stations. In all six models, the RF model predicts a low level of air pollution in the GBA when the typhoon is located in the southwest sea area of the GBA, close to Hainan Island. This is because of the relatively clean southerly winds from the sea brought by the cyclonic circulation, significant wind speed and precipitation when typhoons are located here. All these meteorological conditions are highly favorable for the deposition and removal of pollutants, and the result is consistent with the findings of previous studies (Yang et al., 2012; Chow et al., 2018; Luo et al., 2018; Yang et al., 2019). By contrast, the air quality in the GBA deteriorates when a typhoon is located over the waters from the Philippines to the island of Taiwan and in the most northerly area over the waters near 30∘ N. The maximum average concentration of PM10 exceeds 80 µg m−3. It is worth noting that the spatial distribution characteristics of the AQI, PM2.5 and PM10 are very similar because the primary pollutant in the GBA during typhoon weather is likely to be PM, as mentioned above. The distribution of typhoons during SO2 pollution weather is mainly over the sea area to the east of the island of Taiwan (16–27∘ N), with the maximum SO2 concentration predicted by the model reaching 20 µg m−3. However, the prediction results for NO2 and O3 are scattered, which may be because their associated photochemical reactions are greatly affected by solar radiation, so the concentrations of these two pollutants possess diurnal variation, which will cause uncertainty in the predictions of the RF model. Nevertheless, the model still accurately captures the overall spatial distribution characteristics; when a typhoon is located over the waters on the southwest side of the GBA, near Hainan Island, the pollutant concentrations are low, but when a typhoon is over the waters near the island of Taiwan (117–125∘ E), they are high.
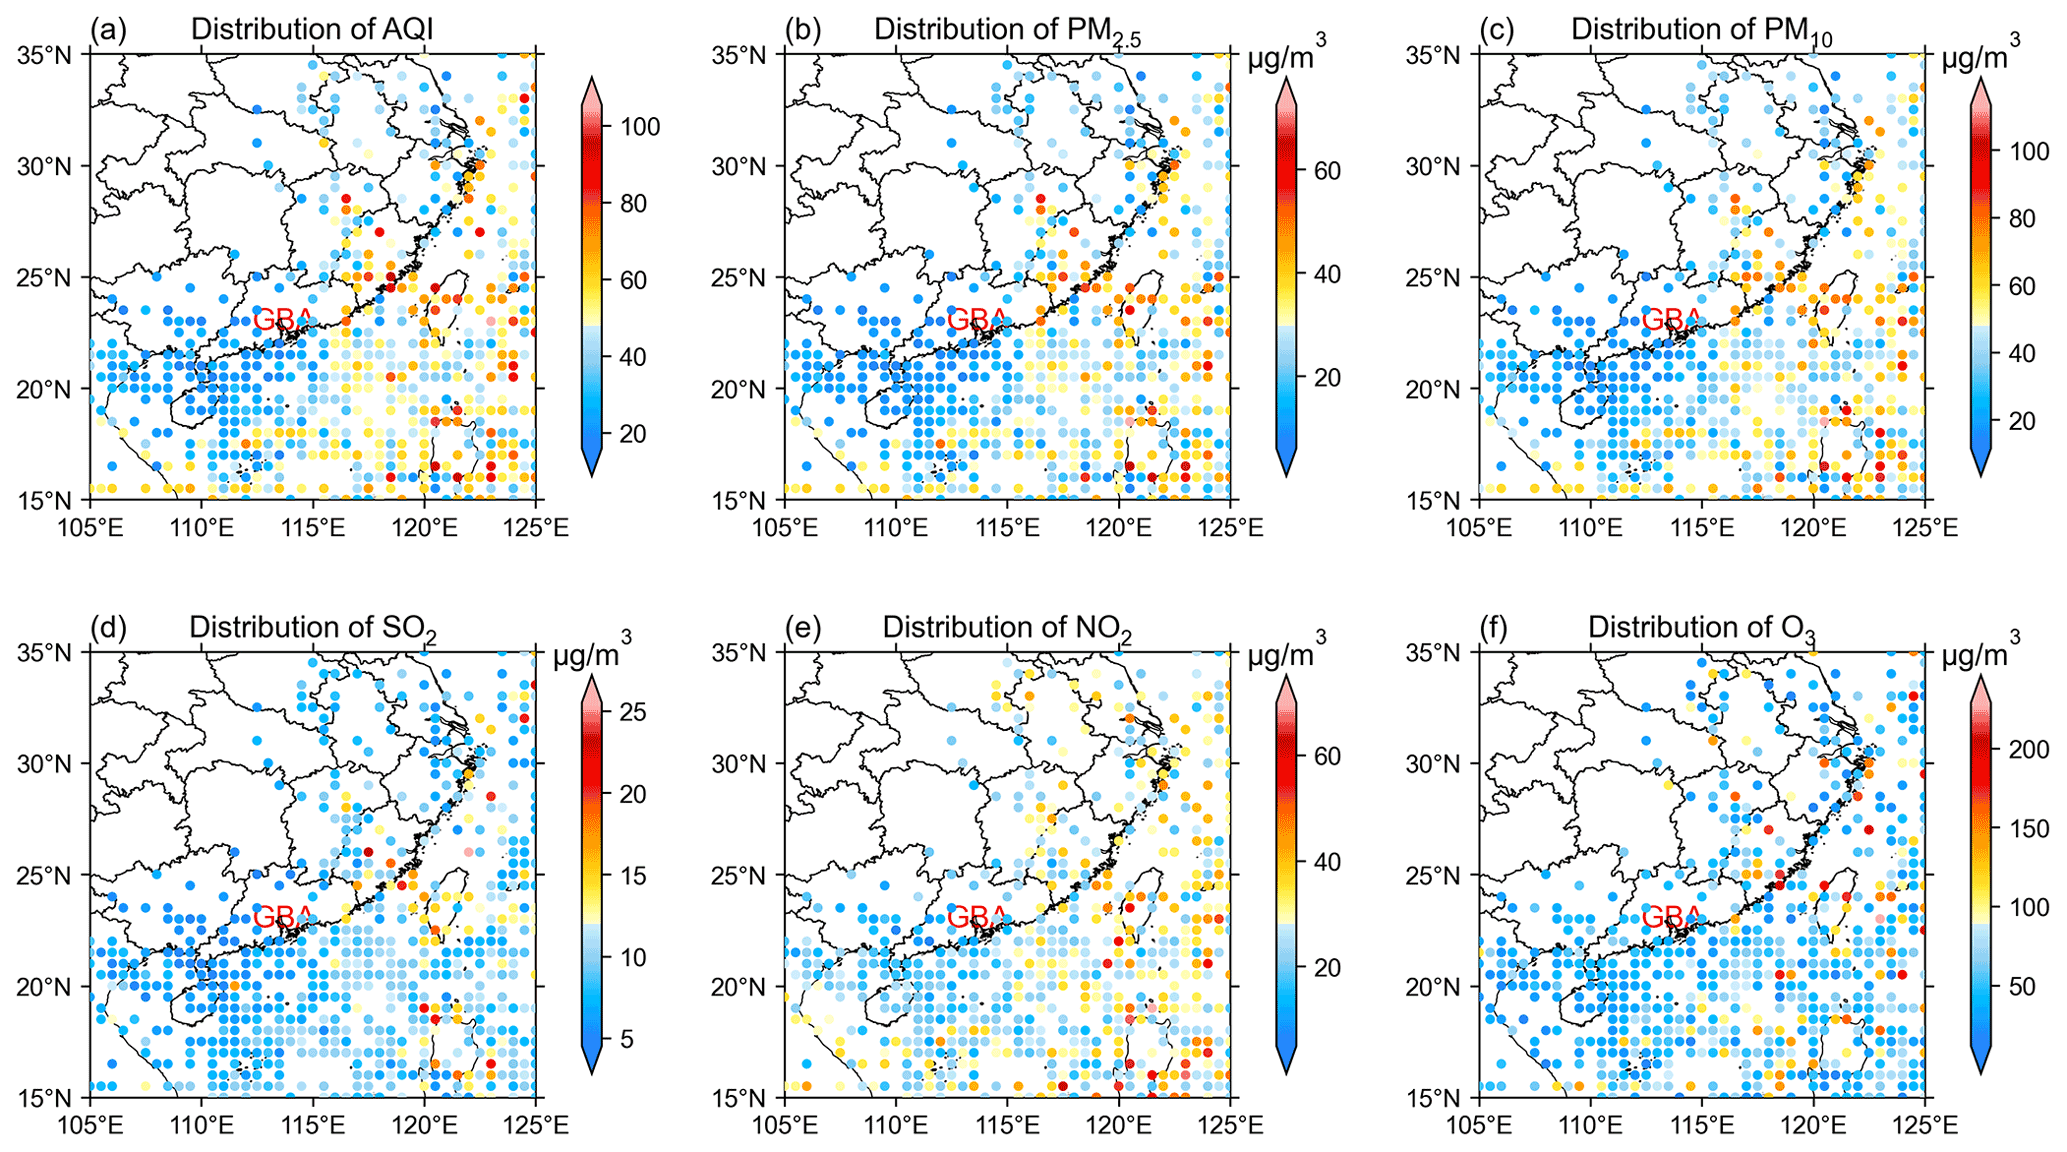
Figure 6The correlation of air quality over the GBA and typhoon center location predicted by the model. (a) The correlation of AQI and typhoon center location predicted by the model, as well as for (b) PM2.5, (c) PM10, (d) SO2, (e) NO2 and (f) O3. The scattering points indicate the average value of air quality when the typhoon is located in the corresponding location.
3.3 Case verification
This paper takes Typhoon Danas (2019) as an independent case to analyze the model's ability to predict typhoon-associated air quality over the GBA. For better evaluation of the RF model, Typhoon Danas's data have been removed from the dataset in the training and testing steps. The active time of Danas was 14–21 July 2019, with a minimum central pressure of 980 hPa. It did not make landfall in China, and its path traveled northwards along the eastern coast of the island of Taiwan. During this typhoon event, a significant pollution episode occurred in the GBA (Fig. 7). The synoptic chart shows northerly winds from inland prevailed in the GBA during the event (17–19 July), which caused pollutants to be transported from inland to the GBA. Meanwhile, the GBA was under high pressure, which was also unfavorable for the diffusion of pollutants (Fig. S8). Figure 7 presents the observed and predicted AQI value and concentrations of PM2.5, PM10, SO2, NO2 and O3. As Fig. 7a depicts, the track of Danas was L-shaped, which coincides quite well with the typhoon locations that cause pollution as predicted by the RF model. Around 16 July, the typhoon turned north over the sea near the Philippines and then moved along 123∘ E longitude, gradually increasing in intensity. The observed data also show a pollution event in the GBA during this period.
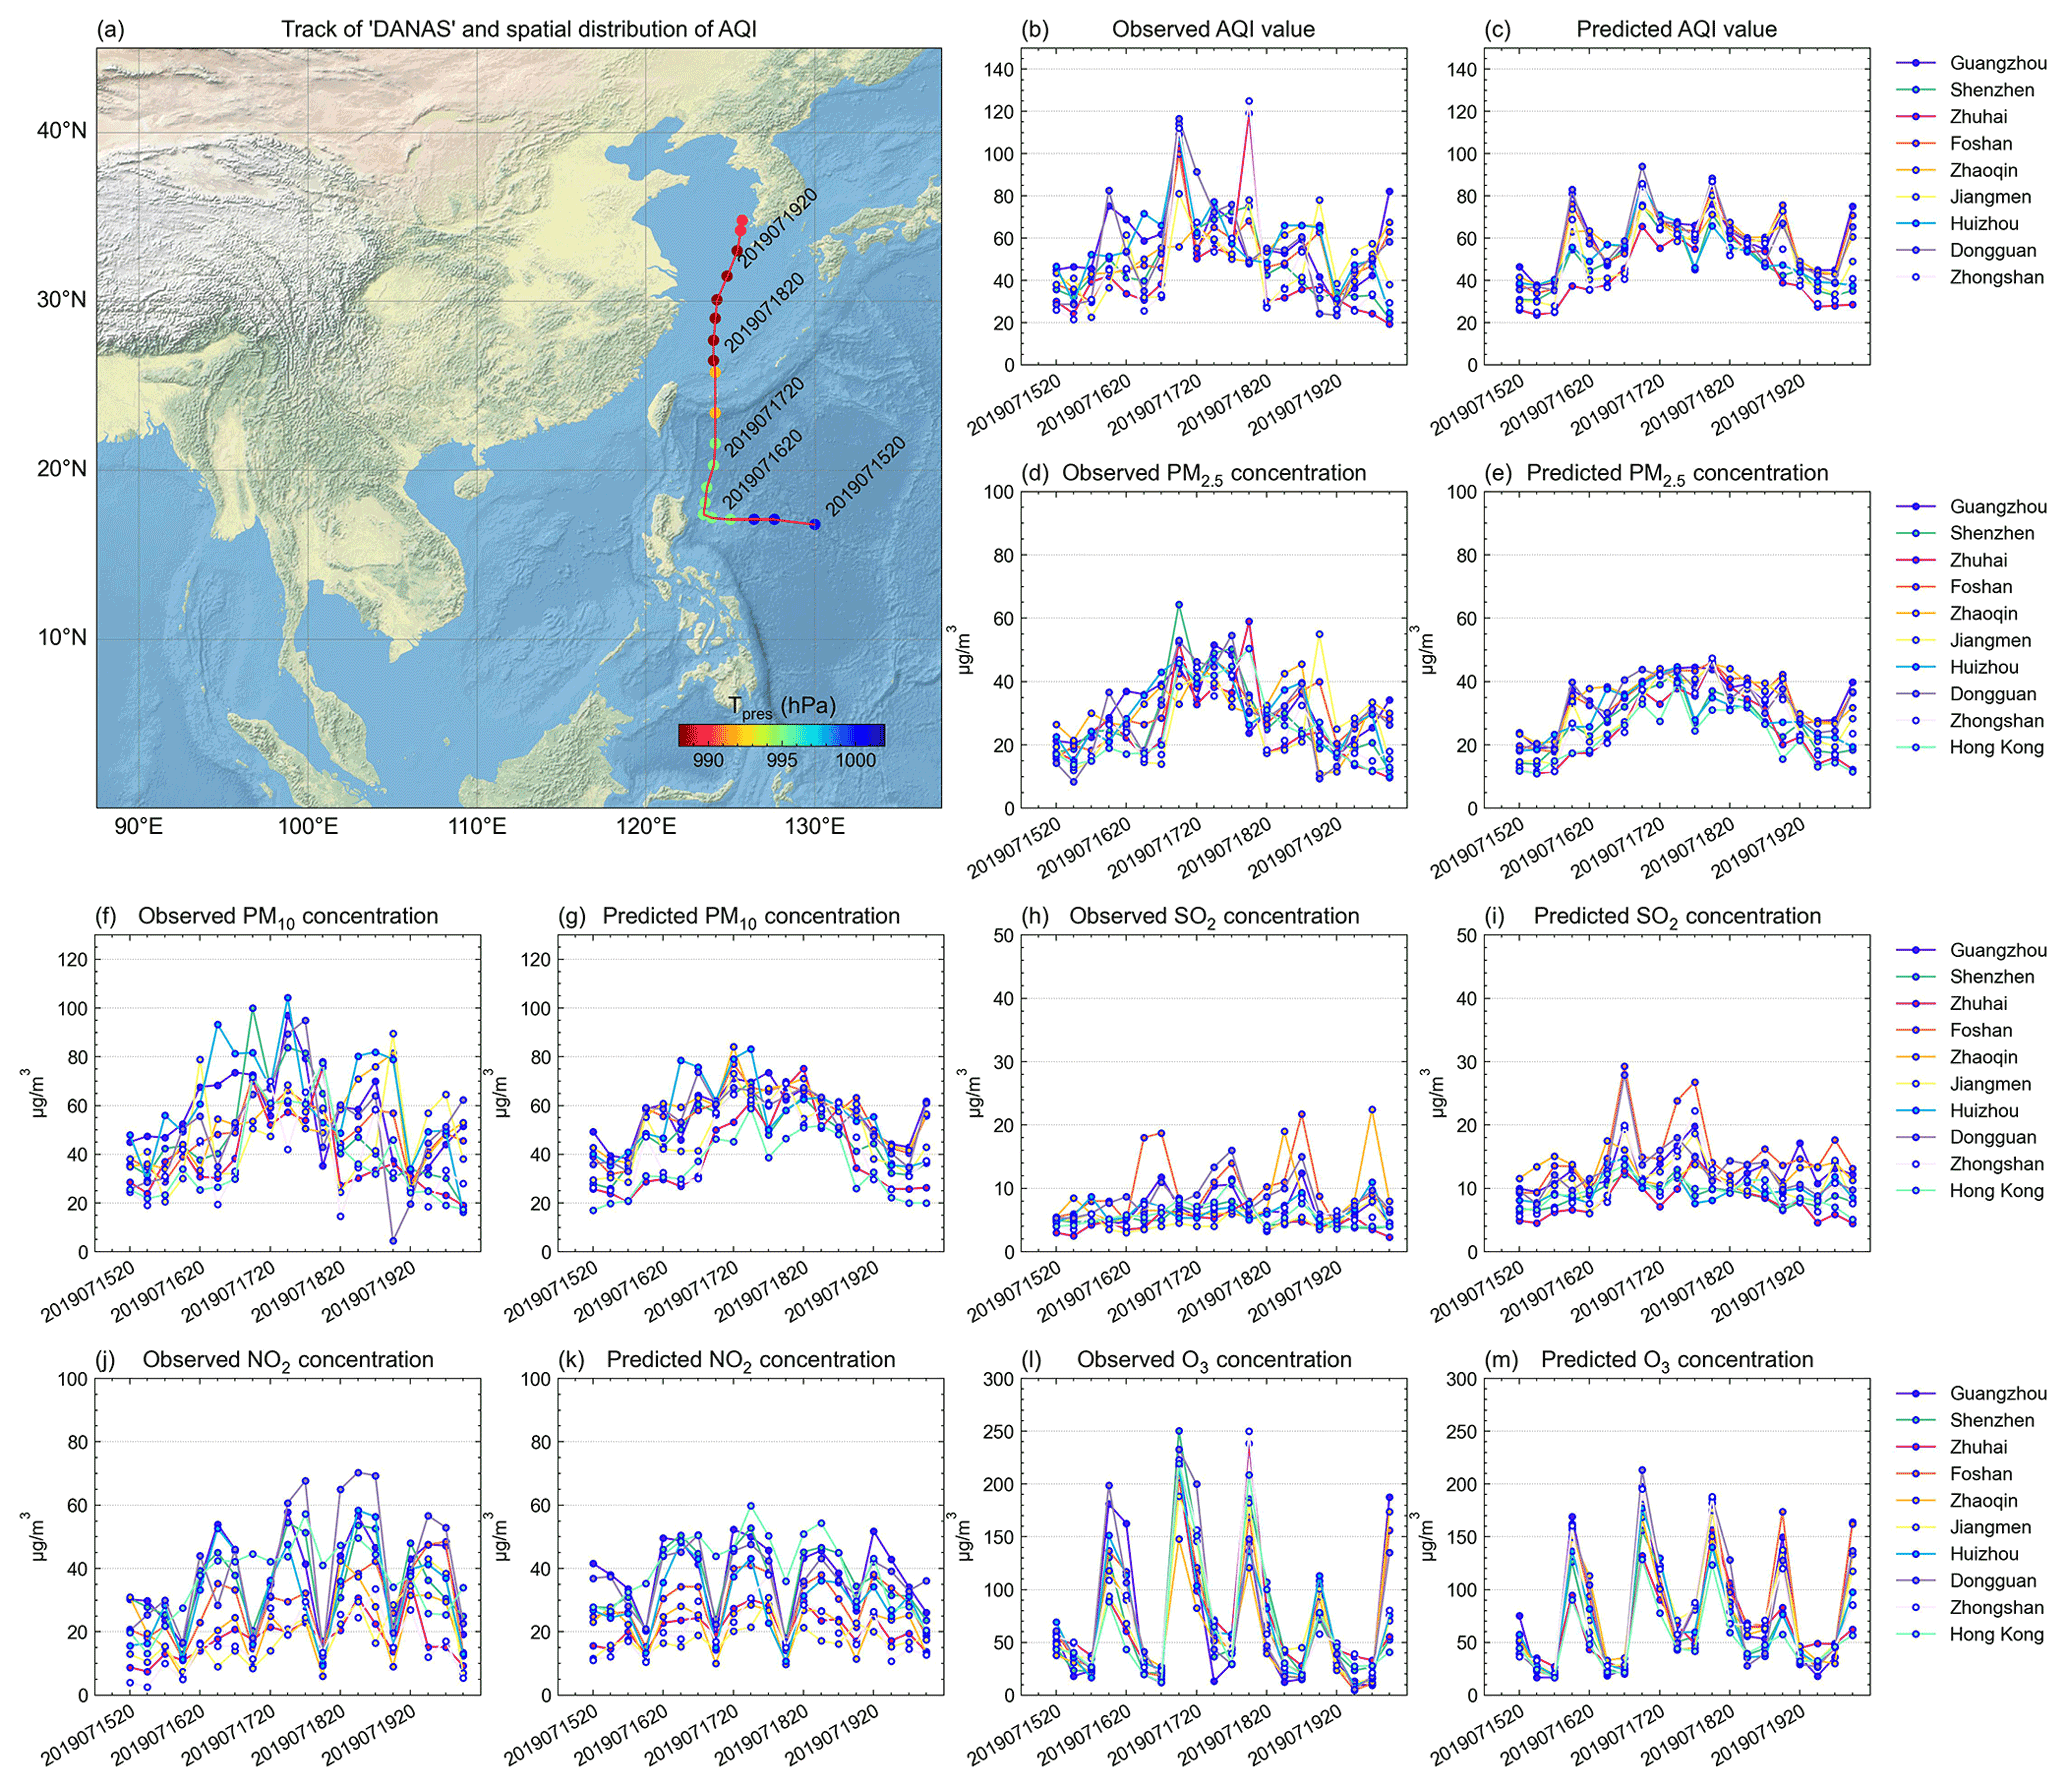
Figure 7Track of Typhoon Danas (2019) and the observed and model-predicted air quality (the value of a city is the mean value of all its stations): (a) track and minimum pressure of Typhoon Danas from 20:00 CST (China standard time) on 15 July 2019 to 14:00 CST on 20 July 2019; (b) the observed AQI value; (c) the model-predicted AQI value; (d) the observed PM2.5 concentration; (e) the model-predicted PM2.5 concentration; (f) the observed PM10 concentration; (g) the model-predicted PM10 concentration; (h) the observed SO2 concentration; (i) the model-predicted SO2 concentration; (j) the observed NO2 concentration; (k) the model-predicted NO2 concentration; (l) the observed O3 concentration; (m) the model-predicted O3 concentration.
First, we examine the spatial distribution of the AQI (Fig. 8a–b). The AQI of the GBA is higher in the northern area than in the southern area during the pollution event. This may be because the southern part is closer to the sea and is affected by a stronger sea breeze, and the RF model successfully predicts this distribution with high accuracy. The distributions of PM2.5 (Fig. 8c–d) and PM10 (Fig. 8e–f) are similar, but the model slightly overestimates their concentrations. The spatial distributions of the SO2, NO2 and O3 (Fig. 8g–l) concentrations are relatively scattered, and, except for the underestimated concentration of SO2, the predicted results are quite accurate.
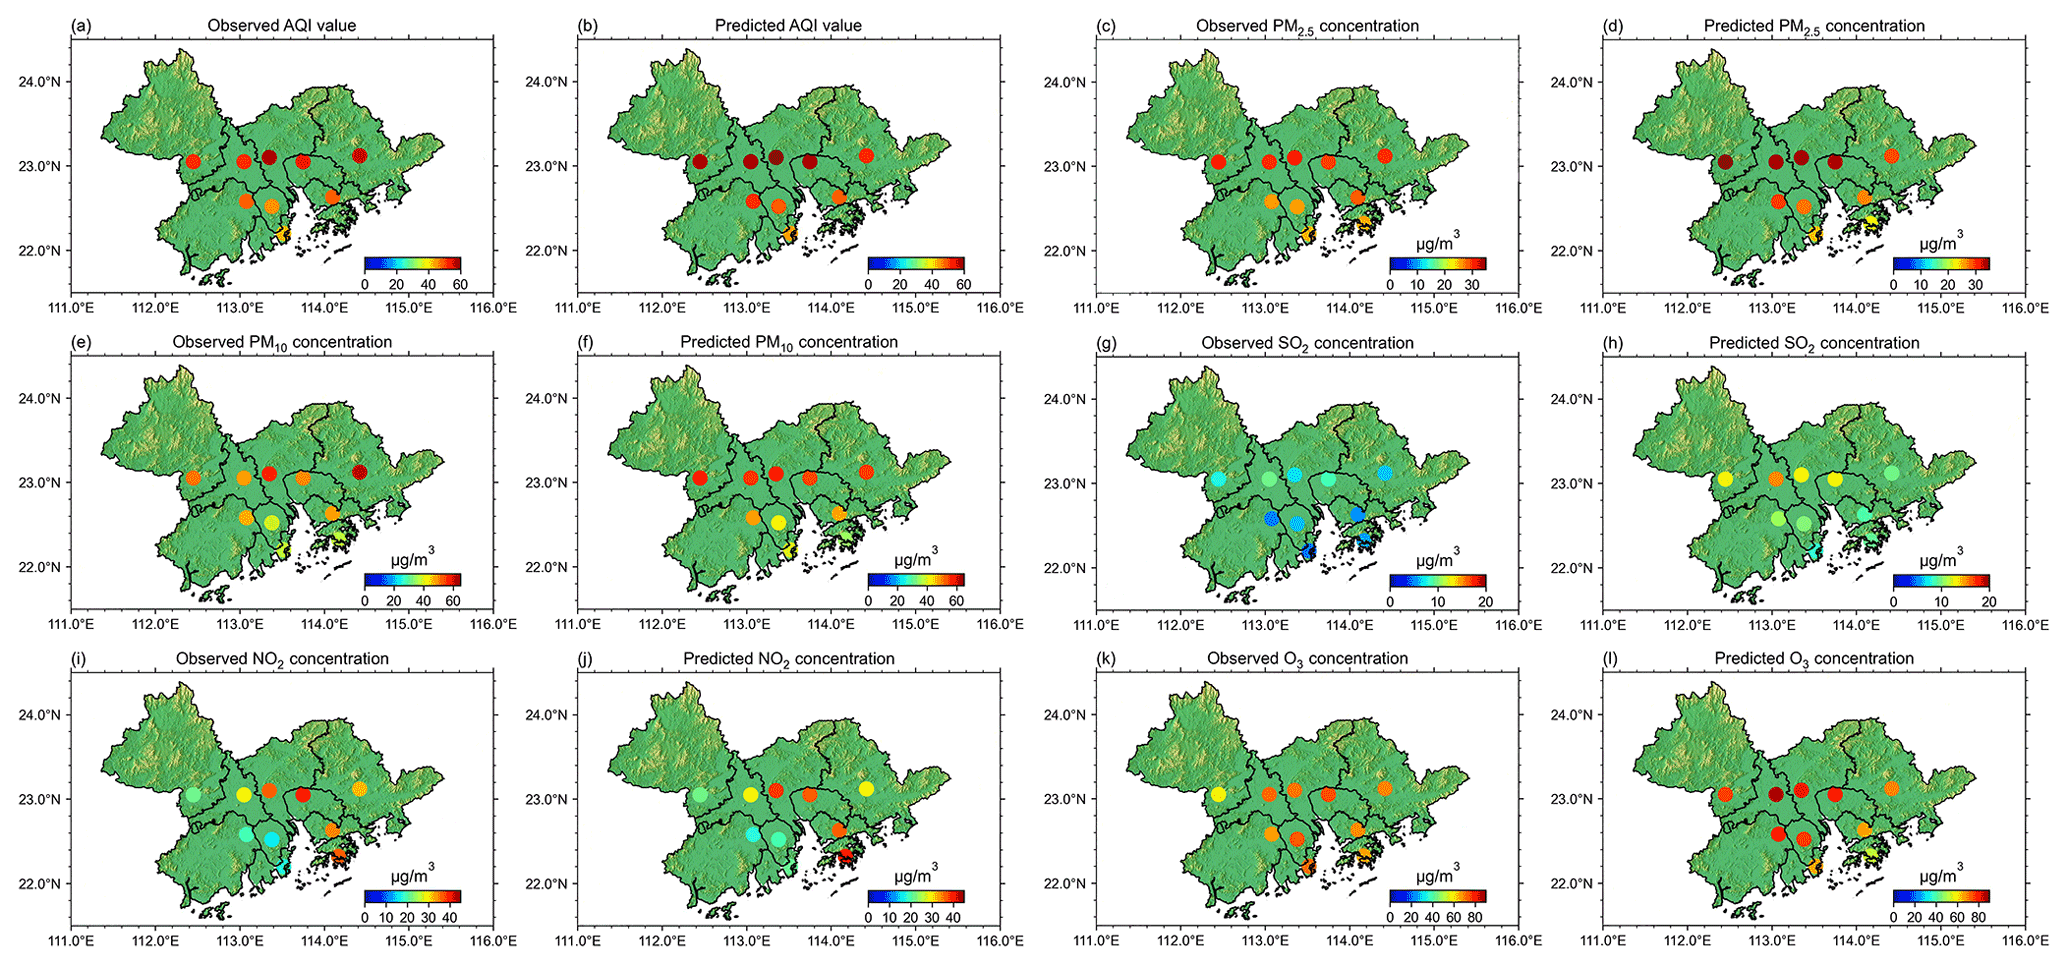
Figure 8The spatial distribution of AQI and five pollutants during Typhoon Danas. Observed and predicted (a–b) AQI value, (c–d) PM2.5, (e–f) PM10, (g–h) SO2, (i–j) NO2 and (k–l) O3.
Regarding the numerical accuracy of the prediction, Table 3 lists the model evaluation metrics calculated by the average model output. In terms of MAE and RMSE, the largest values are for the predicted O3, which are 15.047 and 18.319 µg m−3, respectively. Meanwhile, the smallest MAE (RMSE) is found for PM2.5 (SO2), which is 4.117 (4.876) µg m−3. The R values between the observations and predictions of the AQI and five pollutants all exceed 0.7, with that of the AQI and O3 even exceeding 0.85. The bias values of the predicted AQI and five pollutants are all less than 0, indicating that the RF model tends to underestimate in this case. The RMSEs of the result of the AQI, PM2.5, PM10, NO2 and O3 are lower than the SDO values, and the SDO and SDP values of all the pollutants are quite close. Furthermore, the IA is high. Among all the models, the IA of the AQI, PM2.5 and O3 exceeds 0.9, indicating that these three air quality parameters perform the best in this case. The evaluation metrics of the results in 10 cities are listed in Tables S1–S10 in the Supplement, revealing that 39 (66 %) of all air quality parameter predictions in these cities have an RMSE less than the SDO, and 31 (53 %) have an IA exceeding 0.8. Generally, the best-performing pollutants are PM2.5 and O3, as judged by the metrics, while the performance with respect to SO2 needs improvement. The MAE and RMSE values obtained by city are both larger than the values obtained by the average over the entire GBA because the averaging process eliminates some random errors.
Table 3Evaluation metrics of the model prediction of the case of Danas in the GBA.
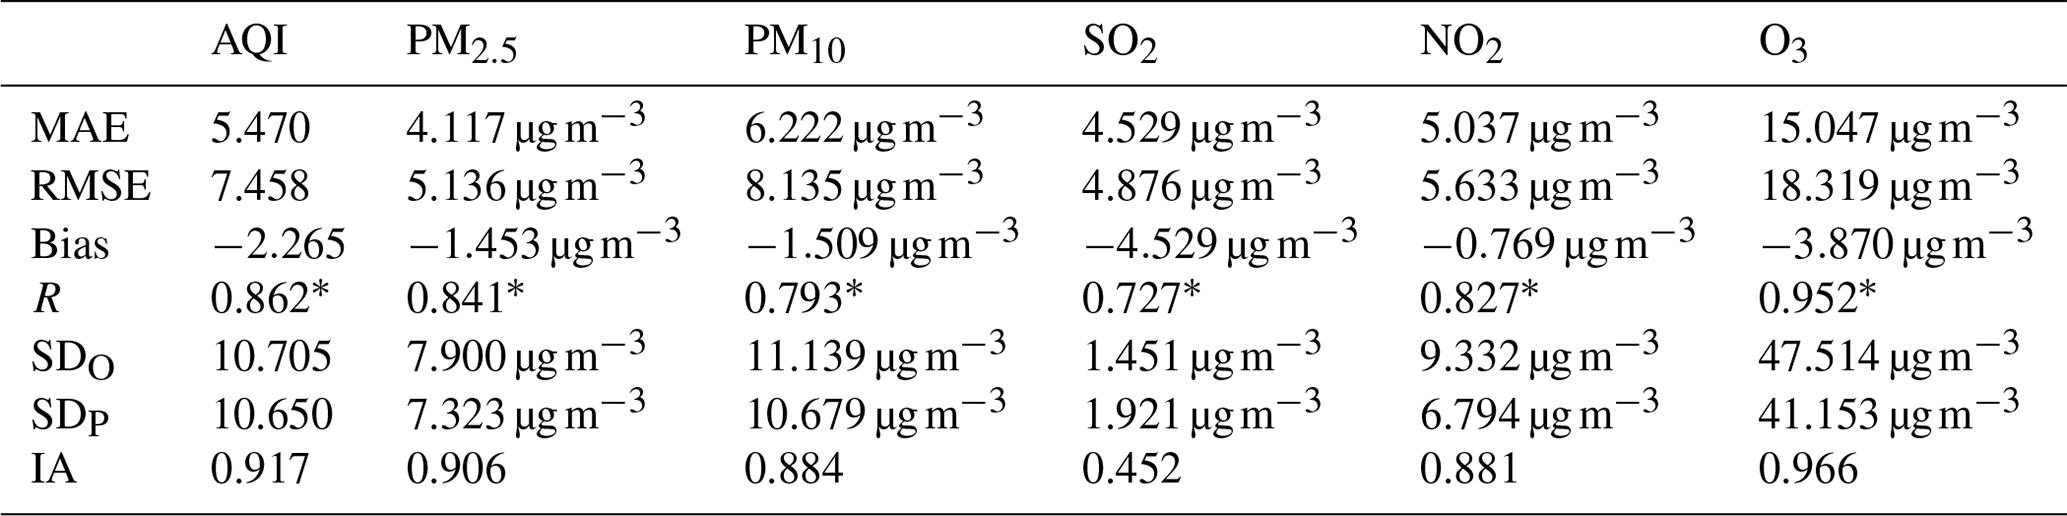
Note: the correlation coefficient marked with “*” is significant with a significance level of 0.05.
In summary, the evaluation metric results are extremely encouraging and indicate a satisfactory prediction by the RF model of the Danas-associated air quality in the GBA. Moreover, the RF model obtains temporal information from the diurnal variation in the input features such as typhoon intensity to accurately predict the diurnal fluctuations in NO2 and O3, which reflects the model's ability to capture the nonlinear relationship and its potential for tackling complex prediction problems.
Typhoons are highly active weather systems in summer that have substantial effects on the synoptic situation in the entire southern part of China, including the Guangdong–Hong Kong–Macao Greater Bay Area. In addition to causing violent winds, rainfall and storm surges in the area close to their location, typhoons also affect the background circulation situation in areas more distant from their immediate vicinity. For instance, the typhoon periphery downdraft brings about light winds, stagnant weather, high temperatures and a low planetary boundary layer, and consequently it has a detrimental impact on the generation, transportation and diffusion of air pollutants, causing hazy weather. The Guangdong–Hong Kong–Macao Greater Bay Area, located at the southernmost tip of the Chinese mainland, is often affected by typhoons. Therefore, air pollution events associated with typhoons in the GBA are prevalent in summer.
The present study employs the RF model to predict the typhoon-associated air quality quantitatively. The R (RMSE) values of the testing set for the AQI, PM2.5, PM10, SO2, NO2 and O3 are 0.843 (14.88), 0.859 (10.31 µg m−3), 0.837 (17.03 µg m−3), 0.510 (8.13 µg m−3), 0.799 (13.64 µg m−3) and 0.894 (22.43 µg m−3), respectively. To test the generalization ability of the model, three monitoring stations in Guangzhou, Shenzhen and Hong Kong are selected as testing stations and are excluded from the training procedure. For these three stations, the R (RMSE) values for AQI, PM2.5, PM10, SO2, NO2 and O3 on TY days are 0.868 (11.70), 0.900 (7.16 µg m−3), 0.841 (13.45 µg m−3), 0.496 (5.38 µg m−3), 0.538 (27.94 µg m−3) and 0.878 (22.45 µg m−3), respectively. The results are satisfactory overall. Then, the model is verified using the case of Typhoon Danas (2019). The results are averaged over the GBA, and the R (RMSE) values of the AQI, PM2.5, PM10, SO2, NO2 and O3 are 0.862 (7.458), 0.841 (5.136 µg m−3), 0.793 (8.135 µg m−3), 0.727 (4.876 µg m−3), 0.827 (5.633 µg m−3) and 0.952 (18.319 µg m−3), respectively. The prediction is accurate for both the air quality of one city and the average air quality in the GBA. In contrast, using meteorological data to predict the air quality of NTY days, the accuracy is significantly lower than the results of TY days, indicating that the impact mechanism of typhoons on air pollution is accurately captured by the model, and it is important for the improvement in model prediction accuracy.
Another important finding of the present study is the difference in feature importance output by the RF model on TY days and NTY days. On TY days, the meteorological driver of AQI, PM2.5 and PM10 is the d2 m that represents the air humidity, while SO2, NO2 and O3 are dominated by the height of the boundary layer. Differently, on NTY days, their dominant meteorological factors were changed, and the importance of variables representing regional transportation and sea breeze diffusion was significantly higher than that in TY days. These findings suggest that the prevailing sea breeze is the major scavenging mechanism of pollutants on NTY days and is deterred by the various wind patterns of the typhoon periphery on TY days. This implies that different control strategies should be adopted on TY days and NTY days. On TY days, countermeasures should be taken to increase the sink of pollutants in order to compensate for the effect of the weakened sea breeze and the hindered diffusion of pollutants caused by the static and stable weather of the typhoon periphery.
Moreover, the present study also highlights the following.
-
The feature importance output by the RF model indicates that the typhoon location is more important than the intensity, suggesting that the most significant factor in modifying the synoptic condition, and thereby changing the air quality, is the location of the typhoon center.
-
By sampling at a spatial interval of 0.5∘ and inputting the data into the RF model as the typhoon center location, the prediction result is consistent with previous studies; the air quality in the GBA deteriorates when the typhoon passes over the waters near the island of Taiwan.
-
The concentrations of NO2 and O3 possess diurnal variation as a result of their photochemical reactions in the atmosphere, and the RF model predicts this diurnal cycle with high accuracy because of the diurnal variation in the input variables such as air temperature, PBLH, typhoon intensity and wind speed.
Overall, the RF model achieves good results in predicting typhoon-associated air quality. Compared with approaches adopted in previous research, such as numerical simulation and statistical modeling, the RF model has the advantages of high accuracy and convenient application and produces a precise quantitative prediction of typhoon-associated air quality in the GBA. At the same time, the importance of features revealed by the model also shed new light on regional pollution control on typhoon days. Of course, the impact of typhoons on air quality is not limited to the GBA, but the model structure provided in the present study can be applied conveniently to various areas, which gives it significant application value for air pollution prevention and control. It is worth mentioning that not all typhoons affect the air quality in their area of impact because of the substantial variability in typhoon tracks. The R and RMSE values in the case study are better than those of the whole dataset, reflecting that some typhoons in the dataset do not directly affect the air quality in the GBA. Meanwhile, as mentioned earlier, the air quality is also affected by factors such as source emissions. The RF model's prediction of the air quality in the GBA under these scenarios merits further study.
The model in this paper is based on the scikit-learn package in Python (Pedregosa et al., 2011), and the implementation and analysis code are available upon request to the corresponding author (yyj1985@nuist.edu.cn).
The datasets that are analyzed and used to support the findings of this study are available in the public domain: the air quality observation data are deposited at https://doi.org/10.5281/zenodo.7451539 (Chen, 2022), which are provided by the China National Environmental Monitoring Center and the Environmental Protection Interactive Centre of the Environmental Protection Department, Hong Kong Special Administrative Region government. The CMA tropical cyclone best-track dataset can be obtained from the CMA Tropical Cyclone Data Center (https://tcdata.typhoon.org.cn/en/zjljsjj_zlhq.html, last access: 23 May 2022; Ying et al., 2014, https://doi.org/10.1175/JTECH-D-12-00119.1; Lu et al., 2021, https://doi.org/10.1007/s00376-020-0211-7). The ERA5 reanalysis dataset is available at the European Centre for Medium-Range Weather Forecasts (https://doi.org/10.24381/cds.adbb2d47, Hersbach et al., 2018b, and https://doi.org/10.24381/cds.bd0915c6, Hersbach et al., 2018a).
The supplement related to this article is available online at: https://doi.org/10.5194/amt-16-1279-2023-supplement.
YY was responsible for conceptualization, supervision and funding acquisition. YC were responsible for data curation, programming and original draft preparation. MG made critical comments on this study. YC and YY developed the methodology and carried out formal analysis. YC, MG and YY were responsible for results discussion, text review and editing.
The contact author has declared that none of the authors has any competing interests.
Publisher’s note: Copernicus Publications remains neutral with regard to jurisdictional claims in published maps and institutional affiliations.
The authors thank the editor and four anonymous reviewers for their valuable time spent on reviewing the manuscript.
This research has been supported by the National Natural Science Foundation of China (grant no. 42175098).
This paper was edited by Simone Lolli and reviewed by four anonymous referees.
Arnold, J. R., Dennis, R. L., and Tonnesen, G. S.: Diagnostic evaluation of numerical air quality models with specialized ambient observations: testing the Community Multiscale Air Quality modeling system (CMAQ) at selected SOS 95 ground sites, Atmos. Environ., 37, 1185–1198, https://doi.org/10.1016/S1352-2310(02)01008-7, 2003.
Bai, K., Li, K., Chang, N.-B., and Gao, W.: Advancing the prediction accuracy of satellite-based PM2.5 concentration mapping: A perspective of data mining through in situ PM2.5 measurements, Environ. Pollut., 254, 113047, https://doi.org/10.1016/j.envpol.2019.113047, 2019.
Bochenek, B. and Ustrnul, Z.: Machine Learning in Weather Prediction and Climate Analyses–Applications and Perspectives, Atmosphere, 13, 180, https://doi.org/10.3390/atmos13020180, 2022.
Breiman, L.: Random Forests, Mach. Learn., 45, 5–32, https://doi.org/10.1023/A:1010933404324, 2001.
Che, H., Xia, X., Zhu, J., Li, Z., Dubovik, O., Holben, B., Goloub, P., Chen, H., Estelles, V., Cuevas-Agulló, E., Blarel, L., Wang, H., Zhao, H., Zhang, X., Wang, Y., Sun, J., Tao, R., Zhang, X., and Shi, G.: Column aerosol optical properties and aerosol radiative forcing during a serious haze-fog month over North China Plain in 2013 based on ground-based sunphotometer measurements, Atmos. Chem. Phys., 14, 2125–2138, https://doi.org/10.5194/acp-14-2125-2014, 2014.
Che, H. Z., Shi, G. Y., Zhang, X. Y., Arimoto, R., Zhao, J. Q., Xu, L., Wang, B., and Chen, Z. H.: Analysis of 40 years of solar radiation data from China, 1961–2000, Geophys. Res. Lett., 32, L06803, https://doi.org/10.1029/2004GL022322, 2005.
Chen, S., Yang, Y., Deng, F., Zhang, Y., Liu, D., Liu, C., and Gao, Z.: A high-resolution monitoring approach of canopy urban heat island using a random forest model and multi-platform observations, Atmos. Meas. Tech., 15, 735–756, https://doi.org/10.5194/amt-15-735-2022, 2022.
Chen, W., Wang, X., Cohen, J. B., Zhou, S., Zhang, Z., Chang, M., and Chan, C.-Y.: Properties of aerosols and formation mechanisms over southern China during the monsoon season, Atmos. Chem. Phys., 16, 13271–13289, https://doi.org/10.5194/acp-16-13271-2016, 2016.
Chen, Y.: Air quality data from the article “Typhoon associated air quality over the Guangdong-Hong Kong-Macao Greater Bay Area, China: machine-learning-based prediction and assessment”, Version 2, Zenodo [data set], https://doi.org/10.5281/zenodo.7451539, 2022.
Chow, E. C. H., Li, R. C. Y., and Zhou, W.: Influence of Tropical Cyclones on Hong Kong Air Quality, Adv. Atmos. Sci., 35, 1177–1188, https://doi.org/10.1007/s00376-018-7225-4, 2018.
Deng, T., Wang, T., Wang, S., Zou, Y., Yin, C., Li, F., Liu, L., Wang, N., Song, L., Wu, C., and Wu, D.: Impact of typhoon periphery on high ozone and high aerosol pollution in the Pearl River Delta region, Sci. Total Environ., 668, 617–630, https://doi.org/10.1016/j.scitotenv.2019.02.450, 2019.
Deng, X., Tie, X., Wu, D., Zhou, X., Bi, X., Tan, H., Li, F., and Jiang, C.: Long-term trend of visibility and its characterizations in the Pearl River Delta (PRD) region, China, Atmos. Environ., 42, 1424–1435, https://doi.org/10.1016/j.atmosenv.2007.11.025, 2008.
Deng, X., Zhou, X., Wu, D., Tie, X., Tan, H., Li, F., Bi, X., Deng, T., and Jiang, D.: Effect of atmospheric aerosol on surface ozone variation over the Pearl River Delta region, Sci. China Earth Sci., 54, 744–752, https://doi.org/10.1007/s11430-011-4172-7, 2011.
Ding, A., Wang, T., Zhao, M., Wang, T., and Li, Z.: Simulation of sea-land breezes and a discussion of their implications on the transport of air pollution during a multi-day ozone episode in the Pearl River Delta of China, Atmos. Environ., 38, 6737–6750, https://doi.org/10.1016/j.atmosenv.2004.09.017, 2004.
Ding, J., Dai, Q., Fan, W., Lu, M., Zhang, Y., Han, S., and Feng, Y.: Impact of meteorology and precursor emission changes on O3 variation in Tianjin, China from 2015 to 2021, J. Environ. Sci., S1001074222001267, https://doi.org/10.1016/j.jes.2022.03.010, 2022.
Feng, Y., Wang, A., Wu, D., and Xu, X.: The influence of tropical cyclone Melor on PM10 concentrations during an aerosol episode over the Pearl River Delta region of China: Numerical modeling versus observational analysis, Atmos. Environ., 41, 4349–4365, https://doi.org/10.1016/j.atmosenv.2007.01.055, 2007.
Hersbach, H., Bell, B., Berrisford, P., Biavati, G., Horányi, A., Muñoz Sabater, J., Nicolas, J., Peubey, C., Radu, R., Rozum, I., Schepers, D., Simmons, A., Soci, C., Dee, D., and Thépaut, J.-N.: ERA5 hourly data on pressure levels from 1959 to present, Copernicus Climate Change Service (C3S) Climate Data Store (CDS) [data set], https://doi.org/10.24381/cds.bd0915c6, 2018a.
Hersbach, H., Bell, B., Berrisford, P., Biavati, G., Horányi, A., Muñoz Sabater, J., Nicolas, J., Peubey, C., Radu, R., Rozum, I., Schepers, D., Simmons, A., Soci, C., Dee, D., and Thépaut, J.-N.: ERA5 hourly data on single levels from 1959 to present, Copernicus Climate Change Service (C3S) Climate Data Store (CDS) [data set], https://doi.org/10.24381/cds.adbb2d47, 2018b.
Hou, X., Chan, C. K., Dong, G. H., and Yim, S. H. L.: Impacts of transboundary air pollution and local emissions on PM2.5 pollution in the Pearl River Delta region of China and the public health, and the policy implications, Environ. Res. Lett., 14, 034005, https://doi.org/10.1088/1748-9326/aaf493, 2019.
Hu, J., Pan, Y., He, Y., Chi, X., Zhang, Q., Song, T., and Shen, W.: Changes in air pollutants during the COVID-19 lockdown in Beijing: Insights from a machine-learning technique and implications for future control policy, Atmospheric and Oceanic Science Letters, 14, 100060, https://doi.org/10.1016/j.aosl.2021.100060, 2021.
Huang, J.-P., Fung, J. C. H., Lau, A. K. H., and Qin, Y.: Numerical simulation and process analysis of typhoon-related ozone episodes in Hong Kong, J. Geophys. Res.-Atmos., 110, D05301, https://doi.org/10.1029/2004JD004914, 2005.
Kamińska, J. A.: The use of random forests in modelling short-term air pollution effects based on traffic and meteorological conditions: A case study in Wrocław, J. Environ. Manage., 217, 164–174, https://doi.org/10.1016/j.jenvman.2018.03.094, 2018.
Lam, K., Wang, T., Wu, C., and Li, Y.: Study on an ozone episode in hot season in Hong Kong and transboundary air pollution over Pearl River Delta region of China, Atmos. Environ., 39, 1967–1977, https://doi.org/10.1016/j.atmosenv.2004.11.023, 2005.
Lam, Y. F., Cheung, H. M., and Ying, C. C.: Impact of tropical cyclone track change on regional air quality, Sci. Total Environ., 610–611, 1347–1355, https://doi.org/10.1016/j.scitotenv.2017.08.100, 2018.
Li, J., Wang, Z., Wang, X., Yamaji, K., Takigawa, M., Kanaya, Y., Pochanart, P., Liu, Y., Irie, H., Hu, B., Tanimoto, H., and Akimoto, H.: Impacts of aerosols on summertime tropospheric photolysis frequencies and photochemistry over Central Eastern China, Atmos. Environ., 45, 1817–1829, https://doi.org/10.1016/j.atmosenv.2011.01.016, 2011.
Li, X., Yang, Y., Mi, J., Bi, X., Zhao, Y., Huang, Z., Liu, C., Zong, L., and Li, W.: Leveraging machine learning for quantitative precipitation estimation from Fengyun-4 geostationary observations and ground meteorological measurements, Atmos. Meas. Tech., 14, 7007–7023, https://doi.org/10.5194/amt-14-7007-2021, 2021.
Liu, H., Yue, F., and Xie, Z.: Quantify the role of anthropogenic emission and meteorology on air pollution using machine learning approach: A case study of PM2.5 during the COVID-19 outbreak in Hubei Province, China, Environ. Pollut., 300, 118932, https://doi.org/10.1016/j.envpol.2022.118932, 2022.
Lolli, S.: Is the Air Too Polluted for Outdoor Activities? Check by Using Your Photovoltaic System as an Air-Quality Monitoring Device, Sensors, 21, 6342, https://doi.org/10.3390/s21196342, 2021.
Lolli, S., Madonna, F., Rosoldi, M., Campbell, J. R., Welton, E. J., Lewis, J. R., Gu, Y., and Pappalardo, G.: Impact of varying lidar measurement and data processing techniques in evaluating cirrus cloud and aerosol direct radiative effects, Atmos. Meas. Tech., 11, 1639–1651, https://doi.org/10.5194/amt-11-1639-2018, 2018.
Lu, R., Turco, R. P., and Jacobson, M. Z.: An integrated air pollution modeling system for urban and regional scales: 2. Simulations for SCAQS 1987, J. Geophys. Res.-Atmos., 102, 6081–6098, https://doi.org/10.1029/96JD03502, 1997.
Lu, X., Yu, H., Ying, M., Zhao, B., Zhang, S., Lin, L., Bai, L., and Wan, R.: Western North Pacific Tropical Cyclone Database Created by the China Meteorological Administration, Adv. Atmos. Sci., 38, 690–699, https://doi.org/10.1007/s00376-020-0211-7, 2021 (data available at: https://tcdata.typhoon.org.cn/en/zjljsjj_zlhq.html, last access: 23 May 2022).
Luo, M., Hou, X., Gu, Y., Lau, N.-C., and Yim, S. H.-L.: Trans-boundary air pollution in a city under various atmospheric conditions, Sci. Total Environ., 618, 132–141, https://doi.org/10.1016/j.scitotenv.2017.11.001, 2018.
Pedregosa, F., Varoquaux, G., Gramfort, A., Michel, V., Thirion, B., Grisel, O., Blondel, M., Prettenhofer, P., Weiss, R., Dubourg, V., Vanderplas, J., Passos, A., Cournapeau, D., Brucher, M., Perrot, M., and Duchesnay, É.: Scikit-learn: Machine learning in python, J. Mach. Learn. Res., 12, 2825–2830, 2011.
Ross, Z., Jerrett, M., Ito, K., Tempalski, B., and Thurston, G.: A land use regression for predicting fine particulate matter concentrations in the New York City region, Atmos. Environ., 41, 2255–2269, https://doi.org/10.1016/j.atmosenv.2006.11.012, 2007.
Singh, K. P., Gupta, S., Kumar, A., and Shukla, S. P.: Linear and nonlinear modeling approaches for urban air quality prediction, Sci. Total Environ., 426, 244–255, https://doi.org/10.1016/j.scitotenv.2012.03.076, 2012.
Su, J. G., Jerrett, M., Beckerman, B., Wilhelm, M., Ghosh, J. K., and Ritz, B.: Predicting traffic-related air pollution in Los Angeles using a distance decay regression selection strategy, Environ. Res., 109, 657–670, https://doi.org/10.1016/j.envres.2009.06.001, 2009.
Tong, C. H. M., Yim, S. H. L., Rothenberg, D., Wang, C., Lin, C.-Y., Chen, Y. D., and Lau, N. C.: Assessing the impacts of seasonal and vertical atmospheric conditions on air quality over the Pearl River Delta region, Atmos. Environ., 180, 69–78, https://doi.org/10.1016/j.atmosenv.2018.02.039, 2018a.
Tong, C. H. M., Yim, S. H. L., Rothenberg, D., Wang, C., Lin, C.-Y., Chen, Y. D., and Lau, N. C.: Projecting the impacts of atmospheric conditions under climate change on air quality over the Pearl River Delta region, Atmos. Environ., 193, 79–87, https://doi.org/10.1016/j.atmosenv.2018.08.053, 2018b.
Venter, Z. S., Chakraborty, T., and Lee, X.: Crowdsourced air temperatures contrast satellite measures of the urban heat island and its mechanisms, Sci. Adv., 7, eabb9569, https://doi.org/10.1126/sciadv.abb9569, 2021.
Wang, H., Li, J., Gao, Z., Yim, S. H. L., Shen, H., Ho, H. C., Li, Z., Zeng, Z., Liu, C., Li, Y., Ning, G., and Yang, Y.: High-Spatial-Resolution Population Exposure to PM2.5 Pollution Based on Multi-Satellite Retrievals: A Case Study of Seasonal Variation in the Yangtze River Delta, China in 2013, Remote Sens., 11, 2724, https://doi.org/10.3390/rs11232724, 2019.
Wang, N., Huang, X., Xu, J., Wang, T., Tan, Z., and Ding, A.: Typhoon-boosted biogenic emission aggravates cross-regional ozone pollution in China, Sci. Adv., 8, eabl6166, https://doi.org/10.1126/sciadv.abl6166, 2022.
Wei, X., Lam, K., Cao, C., Li, H., and He, J.: Dynamics of the Typhoon Haitang Related High Ozone Episode over Hong Kong, Adv. Meteorol., 2016, 1–12, https://doi.org/10.1155/2016/6089154, 2016.
Wei, X. L., Li, Y. S., Lam, K. S., Wang, A. Y., and Wang, T. J.: Impact of biogenic VOC emissions on a tropical cyclone-related ozone episode in the Pearl River Delta region, China, Atmos. Environ., 41, 7851–7864, https://doi.org/10.1016/j.atmosenv.2007.06.012, 2007.
Yang, J. X., Lau, A. K. H., Fung, J. C. H., Zhou, W., and Wenig, M.: An air pollution episode and its formation mechanism during the tropical cyclone Nuri's landfall in a coastal city of south China, Atmos. Environ., 54, 746–753, https://doi.org/10.1016/j.atmosenv.2011.12.023, 2012.
Yang, Y., Zheng, X., Gao, Z., Wang, H., Wang, T., Li, Y., Lau, G. N. C., and Yim, S. H. L.: Long-Term Trends of Persistent Synoptic Circulation Events in Planetary Boundary Layer and Their Relationships With Haze Pollution in Winter Half Year Over Eastern China, J. Geophys. Res.-Atmos., 123, 10991–11007, https://doi.org/10.1029/2018JD028982, 2018.
Yang, Y., Yim, S. H. L., Haywood, J., Osborne, M., Chan, J. C. S., Zeng, Z., and Cheng, J. C. H.: Characteristics of Heavy Particulate Matter Pollution Events Over Hong Kong and Their Relationships With Vertical Wind Profiles Using High-Time-Resolution Doppler Lidar Measurements, J. Geophys. Res.-Atmos., 124, 9609–9623, https://doi.org/10.1029/2019JD031140, 2019.
Yang, Y., Fan, S., Wang, L., Gao, Z., Zhang, Y., Zou, H., Miao, S., Li, Y., Huang, M., Yim, S. H. L., and Lolli, S.: Diurnal Evolution of the Wintertime Boundary Layer in Urban Beijing, China: Insights from Doppler Lidar and a 325-m Meteorological Tower, Remote Sensing, 12, 3935, https://doi.org/10.3390/rs12233935, 2020a.
Yang, Y., Zhang, M., Li, Q., Chen, B., Gao, Z., Ning, G., Liu, C., Li, Y., and Luo, M.: Modulations of surface thermal environment and agricultural activity on intraseasonal variations of summer diurnal temperature range in the Yangtze River Delta of China, Sci. Total Environ., 736, 139445, https://doi.org/10.1016/j.scitotenv.2020.139445, 2020b.
Yim, S. H. L., Wang, M., Gu, Y., Yang, Y., Dong, G., and Li, Q.: Effect of Urbanization on Ozone and Resultant Health Effects in the Pearl River Delta Region of China, J. Geophys. Res.-Atmos., 124, 11568–11579, https://doi.org/10.1029/2019JD030562, 2019.
Ying, M., Zhang, W., Yu, H., Lu, X., Feng, J., Fan, Y., Zhu, Y., and Chen, D.: An Overview of the China Meteorological Administration Tropical Cyclone Database, J. Atmos. Ocean. Tech., 31, 287–301, https://doi.org/10.1175/JTECH-D-12-00119.1, 2014 (data available at: https://tcdata.typhoon.org.cn/en/zjljsjj_zlhq.html, last access: 23 May 2022).
Zeng, Z., Wang, Z., Gui, K., Yan, X., Gao, M., Luo, M., Geng, H., Liao, T., Li, X., An, J., Liu, H., He, C., Ning, G., and Yang, Y.: Daily Global Solar Radiation in China Estimated From High-Density Meteorological Observations: A Random Forest Model Framework, Earth. Space. Sci., 7, e2019EA001058, https://doi.org/10.1029/2019EA001058, 2020.
Zhang, Y., Mao, H., Ding, A., Zhou, D., and Fu, C.: Impact of synoptic weather patterns on spatio-temporal variation in surface O3 levels in Hong Kong during 1999–2011, Atmos. Environ., 73, 41–50, https://doi.org/10.1016/j.atmosenv.2013.02.047, 2013.
Zheng, L., Lin, R., Wang, X., and Chen, W.: The Development and Application of Machine Learning in Atmospheric Environment Studies, Remote Sens., 13, 4839, https://doi.org/10.3390/rs13234839, 2021.
Zheng, Z., Zhao, C., Lolli, S., Wang, X., Wang, Y., Ma, X., Li, Q., and Yang, Y.: Diurnal variation of summer precipitation modulated by air pollution: observational evidences in the beijing metropolitan area, Environ. Res. Lett., 15, 094053, https://doi.org/10.1088/1748-9326/ab99fc, 2020.
Zhu, C., Maharajan, K., Liu, K., and Zhang, Y.: Role of atmospheric particulate matter exposure in COVID-19 and other health risks in human: A review, Environ. Res., 198, 111281, https://doi.org/10.1016/j.envres.2021.111281, 2021.
Zong, L., Yang, Y., Gao, M., Wang, H., Wang, P., Zhang, H., Wang, L., Ning, G., Liu, C., Li, Y., and Gao, Z.: Large-scale synoptic drivers of co-occurring summertime ozone and PM2.5 pollution in eastern China, Atmos. Chem. Phys., 21, 9105–9124, https://doi.org/10.5194/acp-21-9105-2021, 2021.