the Creative Commons Attribution 4.0 License.
the Creative Commons Attribution 4.0 License.
 | 24 Mar 2023
Short-term variability of atmospheric helium revealed through a cryo-enrichment method
Eric Morgan
Ralph F. Keeling
Tropospheric helium variations are tightly linked to CO2 due to the co-emission of He and CO2 from natural-gas burning. Recently, Birner et al. (2022a) showed that the global consumption of natural gas has measurably increased the He content of the atmosphere. Like CO2, He is also predicted to exhibit complex spatial and temporal variability on shorter timescales, but measurements of these short-term variations are lacking. Here, we present the development of an improved gas delivery and purification system for the semi-continuous mass spectrometric measurement of the atmospheric He-to-nitrogen ratio (). The method replaces the chemical getter used previously by Birner et al. (2021, 2022a) to preconcentrate He in an air stream with a cryogenic trap which can be more simply regenerated by heating and which improves the precision of the measurement to 22 per meg (i.e., 0.022 ‰) in 10 min (1σ). Using this “cryo-enrichment” method, we measured the ratios in ambient air at La Jolla (California, USA) over 5 weeks in 2022. During this period, was strongly correlated with atmospheric CO2 concentrations, as expected from anthropogenic emissions, with a diurnal cycle of 450–500 per meg (max–min) caused by the sea–land breeze pattern of local winds, which modulates the influence of local pollution sources.
- Article
(3033 KB) - Full-text XML
-
Supplement
(375 KB) - BibTeX
- EndNote


The helium content of air is a promising tracer for anthropogenic perturbation of the carbon cycle because He and CO2 emissions are coupled in the use of natural gas on a global scale (Birner et al., 2021; Boucher et al., 2018a; Lupton and Evans, 2013, 2004; Oliver et al., 1984; Sano et al., 1989, 2010; Pierson-Wickmann et al., 2001), as demonstrated recently by Birner et al. (2022a). The more abundant isotope of helium, 4-helium (4He), is produced by the alpha decay of uranium- and thorium-baring minerals in the subsurface and accumulates on geological timescales in the same underground reservoirs as natural gas. Natural-gas extraction therefore also extracts He, which is released into the atmosphere during purification, storage, or burning of natural gas. Since other fossil fuels are thought to contain much less helium than natural gas (Oliver et al., 1984; Pierson-Wickmann et al., 2001), helium may prove to be a valuable conservative tracer for the consumption of natural gas, which could aid efforts to quantify global emissions with top-down techniques.
Relying on archived air samples, Birner et al. (2022a) used a new, highly precise method for quantifying changes in the atmospheric helium-to-nitrogen ratio () to show that the atmospheric concentration of 4He has increased by 1.930 ± 0.140 ‰ since 1974. Observed differences in (or , with M being the total moles of dry air) between samples and an atmospheric air reference gas are reported here in units of per meg (1000 per meg = 1 ‰) using delta notation:
The atmospheric build-up has accelerated over time, paralleling natural-gas usage, yielding a rate of rise in 2020 of ∼ 66 per meg per year, based on the published curve fit.
The measurements by Birner et al. (2021, 2022a) relied on a gettering method which resolved small changes in the 4He mole fraction () of dry air by stabilizing the flow of an air sample and air-like reference gas to a continuously evacuated magnetic sector mass spectrometer (MS). By keeping the air flow constant regardless of the gas source, changes in 4He+ ion beam intensity reflect changes in the helium mole fraction between the sample and reference. Directly upstream of the MS, the He is concentrated by removing (“gettering”) the non-noble gases using a hot titanium sponge. The observed changes in are subsequently converted to equivalent changes in by taking account of changes in the major components of air constrained by separate observations of CO2, O2, and Ar (see Sect. 2.6). The He preconcentration step is necessary to achieve strong He+ beams and the highest precision but precludes a direct measurement of . However, reporting changes in terms of has the advantage that N2 is present at near-constant levels in the atmosphere, while denominator M may change from a variety of different processes that affect the overall composition of air (Keeling and Shertz, 1992; Keeling et al., 1998; Birner et al., 2022a, 2021). In any case, for most air samples, the correction from to is small because changes in CO2 and O2 partially cancel each other. Natural-gas emissions must cause to vary on a wide range of spatial scales and timescales that remain to be resolved. For such applications, the published “getter-helium” method has the limitation of requiring large air samples, substantial analysis time, and regular replacement of the getter material. This makes the method inconvenient for routine measurements of short-term changes in , which are needed for tracing local pollution sources and evaluating air transport effects.
Here, we present an alternative He measurement method that uses a different pressure-stabilization and switching system and substitutes a cryogenic trap for the titanium sponge getter. This “cryo-enrichment” method avoids the flow corrections of Birner et al. (2021, 2022a), improves precision, and allows automated and nearly continuous measurements because the cryo-trap can be regenerated by a brief 25 min warming cycle. We illustrate the method by detecting quasi-continuous variations over several weeks in air drawn from the pier of Scripps Institution of Oceanography (“Scripps Pier”) in La Jolla, California, USA.
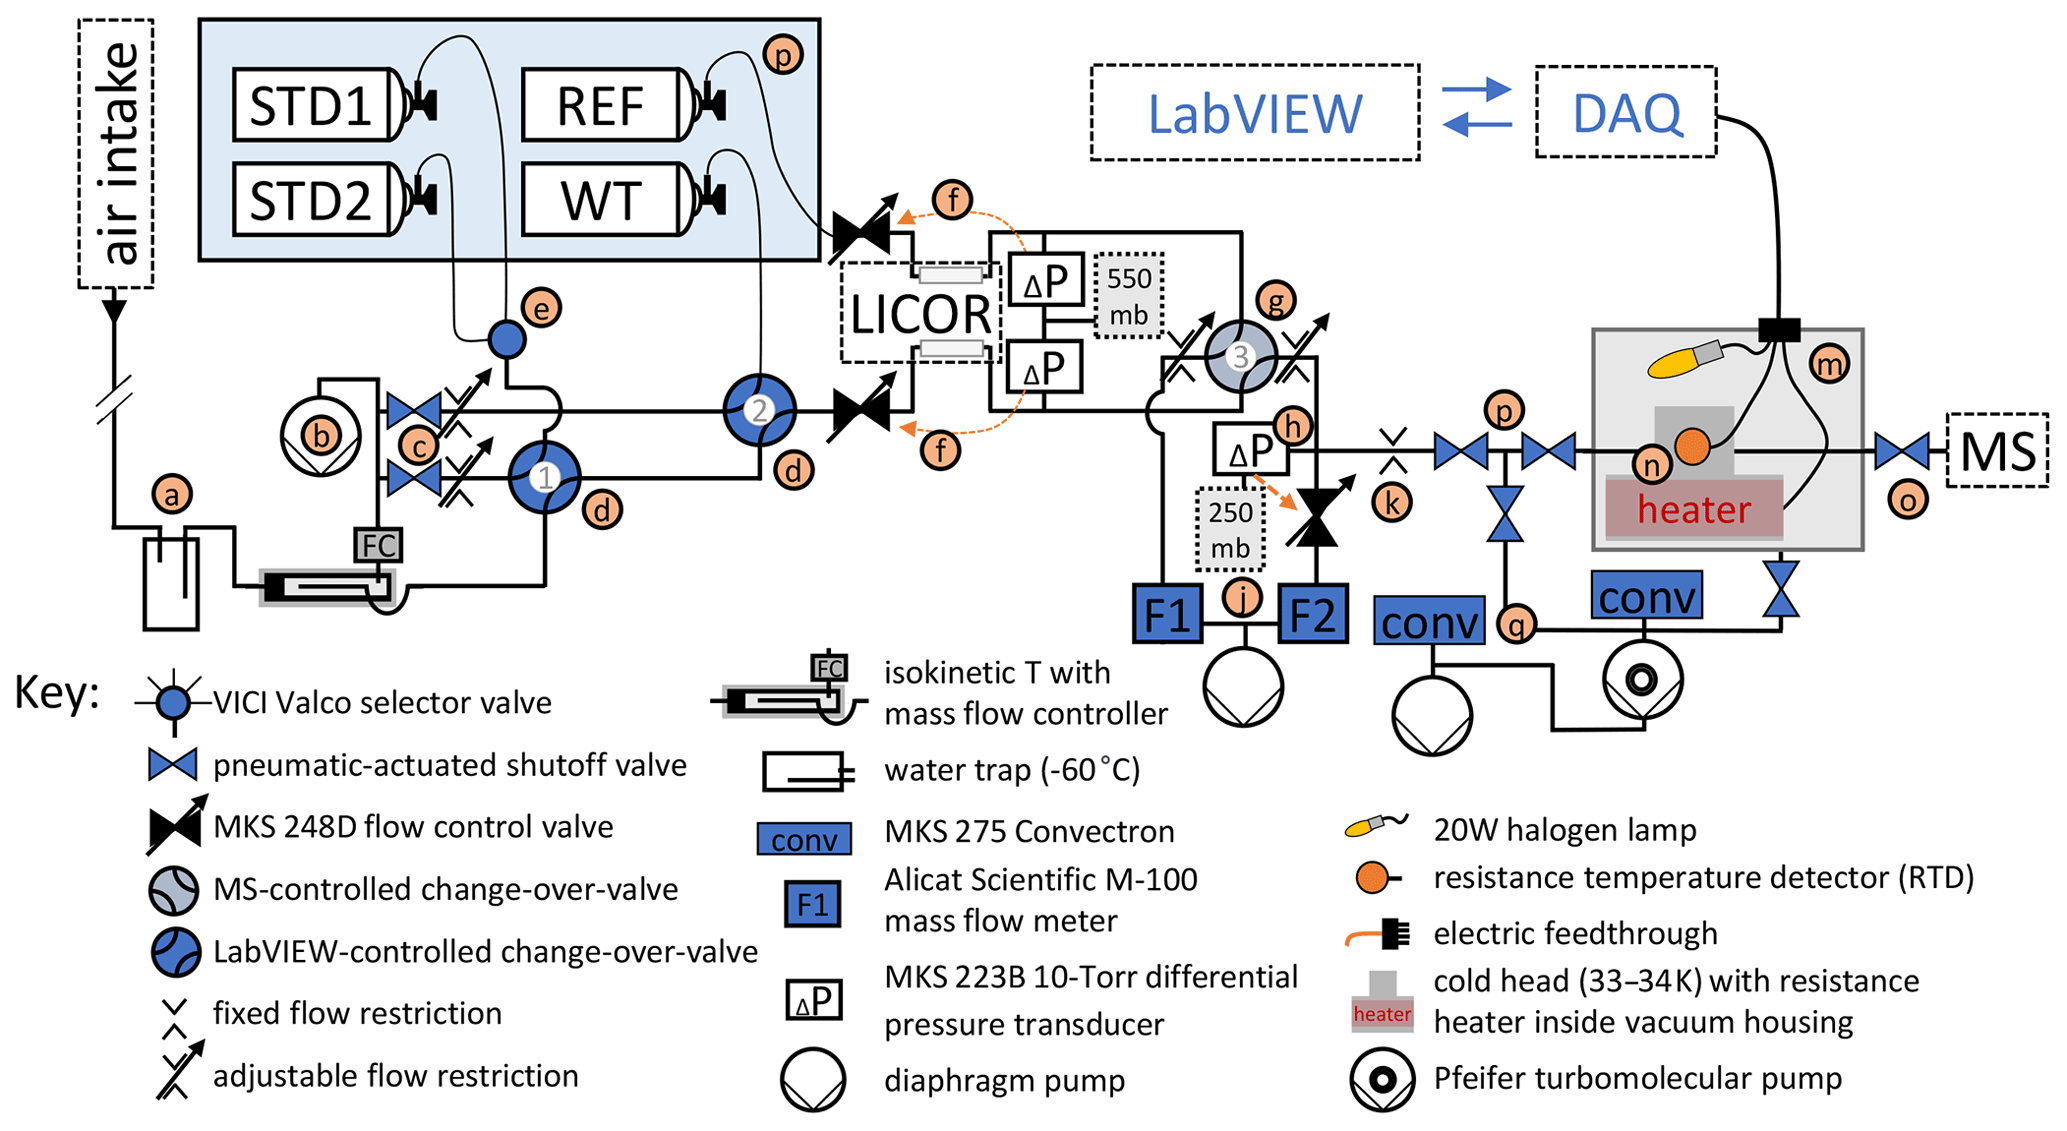
Figure 1Schematic of gas delivery and purification for measurements. Orange arrows indicate an analogue control loop using a MKS 250E flow control module. Letters highlight sections discussed in the text. All elements shown in blue face color are connected to a data acquisition system (DAQ) and controlled using LabVIEW software.
2.1 Description of the gas delivery system
The gas delivery and purification components of the cryo-enrichment system for He analysis are illustrated in Fig. 1. In the method, gas from an air intake and several reference gas cylinders is dried and routed through a LI-COR non-dispersive infrared CO2 analyzer to our He detection system. The gas flow is precisely stabilized for rapid and robust sample–reference comparison before entry into a cryo-enrichment system (gray box in Fig. 1), where incondensable gases become concentrated in the gas stream in preparation for the helium mole fraction measurement on a dynamically pumped magnetic sector mass spectrometer (MS). The MS used for our experiments is a GV IsoPrime 100, which is functionally comparable here to the MAT 253 used by Birner et al. (2022a) in previous measurements.
Gas is drawn through an aspirated intake (Blaine et al., 2006) located near the landward end of the Scripps Pier through ∼ 250 m of in. Synflex tubing (i.e., “Pier Line II”) to the laboratory facility at a flow of ∼ 330 cm3 min−1 STP and dried in a cold trap held at −60 ∘C (a). In an isokinetic T, ∼ 10 % of the Pier Line II gas stream is split off for analysis, while the rest flows, metered at 300 cm3 min−1 STP, to a diaphragm pump (b), which also serves to pull the air from the pier through the main sampling line. Calibrated CO2 span gases (e.g., STD1 and STD2), a working standard (WT), and the air-like instrument reference gas (REF) are stored horizontally in a thermal enclosure (p). Gas for analysis is selected by a combination of a selector valve (e) and three pneumatically actuated change-over valves (COV, d and g). Pneumatic shutoff valves and manually adjustable flow restrictions (c) located downstream of COV-1 and 2 allow gases that are currently not selected for analysis to be purged at a set rate if desired. Regulators on the cylinders maintain a constant pressure of ∼ 700 hPa above ambient in the delivery lines of the calibration gases upstream of the flow control valves (f), whereas the pressure in the Pier Line II line drops modestly below ambient from the aspirated intake to the flow control valves. Together with downstream differential pressure transducers, the two flow control valves (f) establish a constant pressure of ∼ 550 hPa in the sample and reference gas lines, regardless of gas source, where the air flows through a LI-COR LI-6251 non-dispersive infrared CO2 analyzer. COV-3 (g) is responsible for rapid switching between sample and reference gas and is automatically triggered by the MS software, IonVantage, every 10 s. The air from one port of COV-3 is directed toward the mass spectrometer, while air from the other port is discarded.
Immediately downstream of the sampling and waste ports of COV-3 (g), the pressure is reduced again across two manual flow restrictions. The restriction on the sampling port allows for a second pressure stabilization point (h) held at 250 hPa to very high precision using a back-pressure regulation scheme consisting of a flow control valve in combination with a sensitive (10 Torr) differential pressure gauge referenced to a static volume. From that stabilization point, ∼ 0.3 is picked off to flow towards the cryo-trap (m) at the inlet of the GV IsoPrime 100 magnetic sector mass spectrometer (MS), while the rest is discarded to a second diaphragm vacuum pump. Flows through both outlets of COV-3 are carefully matched to a value of ∼ 30 cm3 min−1 STP by adjusting the manual flow restrictions using flow meters F1 and F2 (j) for diagnosis. The pick-off flow into the cryo-system (through crimp k) is measured by briefly stopping the pick-off flow (using valve p) and measuring changes on F2. Maintaining constant pressure at the 250 hPa stabilization point is critical to ensure constant flow of gas to the MS, regardless of the position of COV-3.
2.2 Cryo-trap
In the cryo-trap (m), air passes through a 0.005 in. thin-walled in. o.d. (outer diameter) stainless-steel tubing which is fit tightly into a T-shaped cold head (n) housed inside a vacuum chamber. The tubing is cooled by the cold head (n) attached to a Sunpower Inc. GTLT cryocooler (not shown) to a temperature of 33–34 K, which freezes out most of the N2, O2, Ar, CO2, and other condensable trace gases in the air stream, thereby increasing the He mole fraction in the exit flow by several orders of magnitude compared to the inlet flow. The cryocooler is equipped with a proportional integral controller and an RTD, installed on the cold head (n), which maintain cryogenic temperatures to within less than ± 0.015 K. The trap is regenerated by temperature cycling to ∼ 300 K and pumping away the trapped gases while isolating the MS with a shutoff valve (o). To warm up, power is supplied to a heater combination consisting of a 180 W polyimide-coated resistance heater mounted inside the cold head and a 20 W halogen lamp while the cryocooler is turned off temporarily. The complete heating and cool-down sequence takes approximately 25 min and is fully automated. A set of three valves (p) isolates the gas purification system from the gas delivery system during regeneration but allows gas to be pumped away from the cryo-trap at all times while warming up to prevent critical overpressure. Pressure in the vacuum system is monitored using two Convectron sensors (q).
An optimum target temperature for the cryocooler was determined empirically by maximizing the 4He+ beam strength. Operating at this optimum also very conveniently minimizes the sensitivity of the He ion beam to temperature fluctuations in the trap. We speculate that this maximum exists because a finite amount of N2 increases the ionization efficiency of the He. Below the optimum temperature, N2 levels are too low to achieve maximum ionization efficiency, while above the optimum, N2 levels are too high to achieve maximum efficiency. The optimum temperature was found to be in the range of 33–34 K. This optimum temperature, which is based on the cold-head temperature rather than the temperature of the in. tubing, is likely slightly somewhat sensitive to the specific ion source filament and the thermal conductivity between the cold head and the in. tubing.
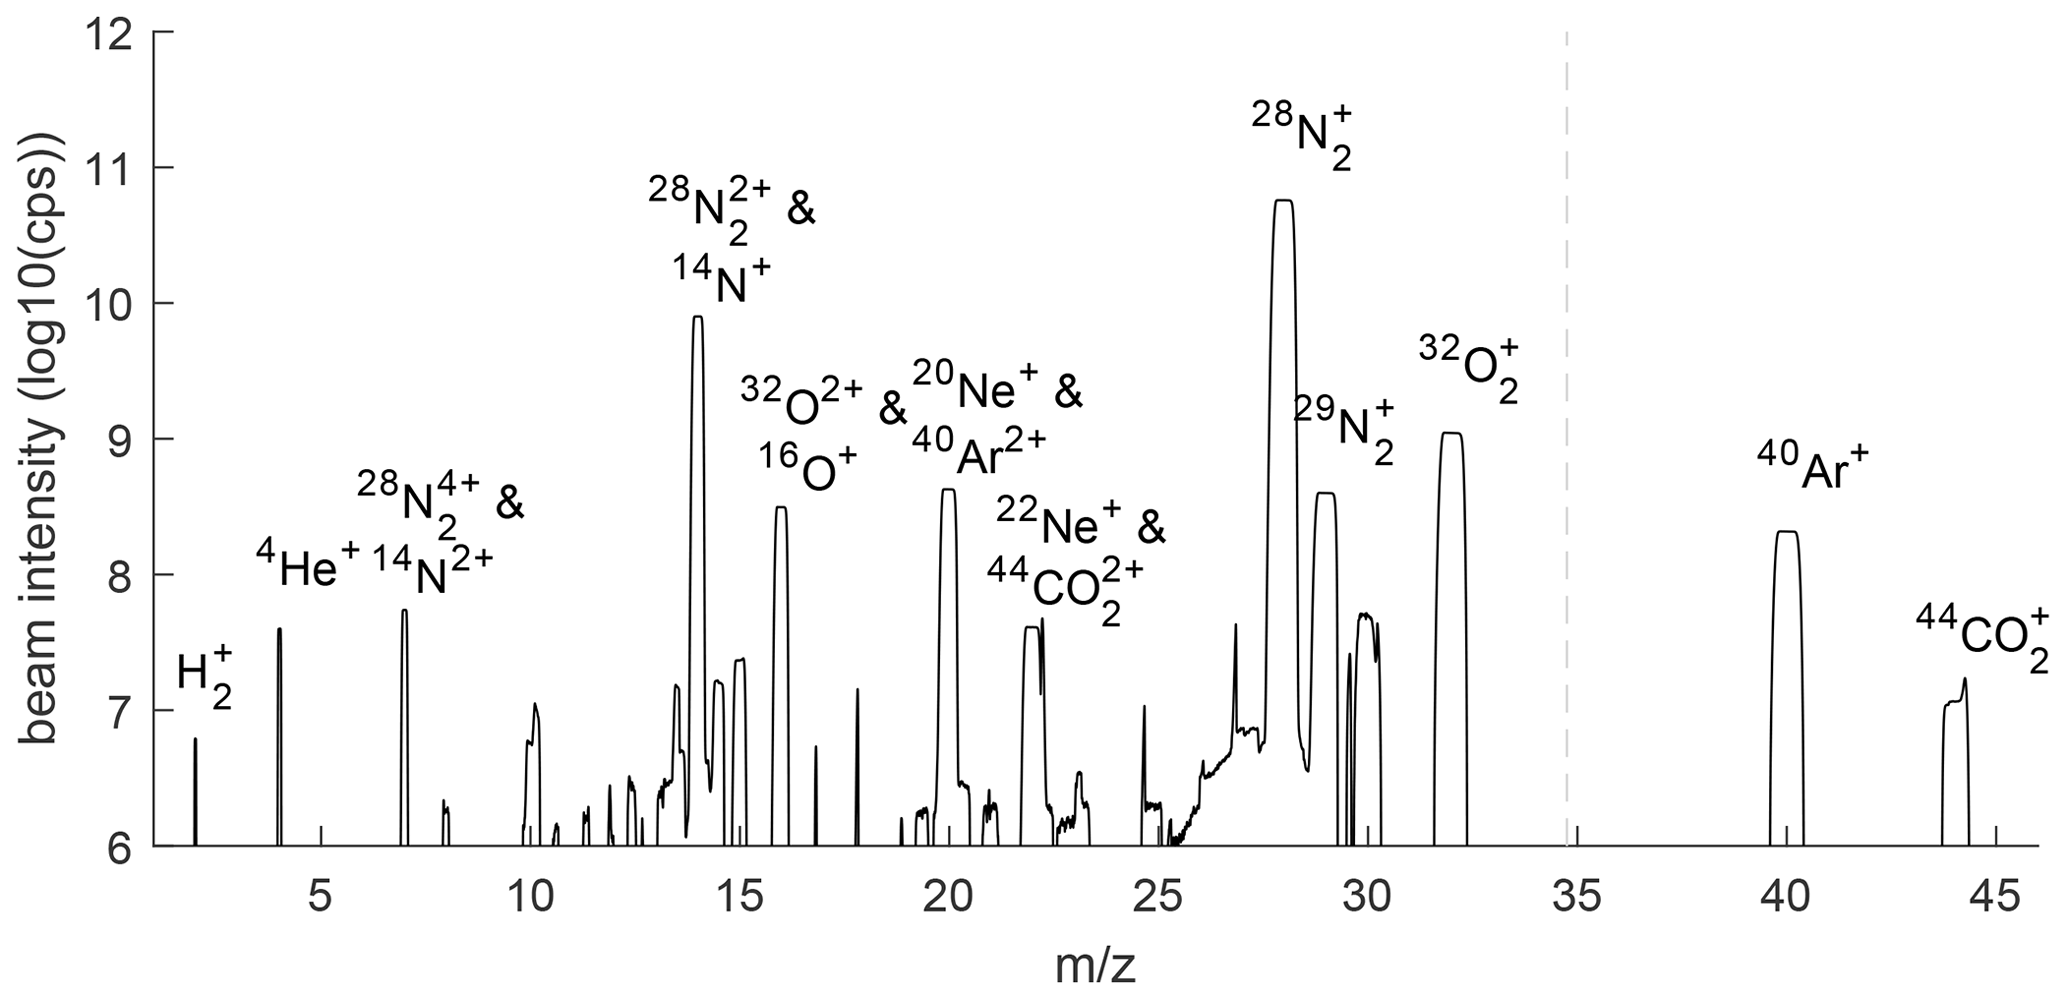
Figure 2Mass scan of gas mixture reaching the MS for helium analysis. Scans from two differently positioned Faraday cups are combined at the dashed vertical line to extend the region covered in the scan. Background concentrations of ions in the isolated MS have been removed. Unlabeled peaks are likely artifactual and the result of beam reflections or other beam aberrations in the flight tube.
There is an inherent engineering and design conflict between minimizing the flushing time of the trap section, which determines the fastest permissible frequency of sample–reference comparisons, and the total trap capacity. On the one hand, a larger trap can hold more frozen gas before blocking the flow and thus allows for longer operation periods before regeneration and/or for higher gas flow and thus ion beam intensities, yielding better precision. On the other hand, a larger trap takes longer to flush completely and thus needs longer dead times during sample–reference switching. In the end, we settled on in. tubing, which gave an acceptable dead time of 4 s for flushing out the trap section and allowed for 80–100 min of measurement time before regeneration. Further optimization of design choices in this realm are likely possible.
2.3 Gas composition reaching the MS
The gas mixture reaching the He MS after purification in the cryo-trap consists mostly of N2 but is greatly enriched in He, Ne, and H2 relative to air (Fig. 2). Although the measured 4He+ beam is still 1450 times smaller than the beam due to the residual vapor pressure of N2 at ∼ 33 K, we estimate that the ratio is increased 1000- to 1500-fold, taking into account the ∼ 10× lower ionization efficiency of He. The ratios of and are also considerably lower in the gas mixture reaching the MS than in air because Ar, O2, and CO2 are more readily frozen out of the gas stream than N2 is. A fraction of all ions becomes doubly charged in the MS, and molecular species may be broken up in the ion source. These ions are visible as interferences at lower mass-to-charge ratios (), such as and 14N+ at = 14.
2.4 CO2 measurements and calibration scheme
and CO2 were measured in parallel on the cryo-enrichment system by comparing a sample gas stream against the instrument reference gas (REF; see Fig. 1). In the sample stream, we analyzed air drawn either from Scripps Pier or from any of several calibration tanks containing compressed air at high pressure. To determine the long-term stability of the cryo-enrichment system, a working tank (WT) was treated as an unknown and was measured repeatedly over the course of the observation period, usually for 20 min every 2 h. This caused the WT to be measured at different times in the regeneration and measurement cycle of the cryo-trap and on occasion caused the WT analysis to be missed when the timing coincided with the regeneration cycle of the gas purification system. Calibrated high- and low-CO2-span tanks (STD1 and STD2) were analyzed for 2 × 20 min each on one day roughly once a week to provide a two-point calibration for the CO2 analyzer. Unfortunately, insufficient purging of stagnant gases in the pressure regulator and the delivery lines led to problems with the STD1–STD2 calibration, and systematic differences of up to 0.15 ppm are evident between the first and second consecutive 20 min measurements of these standards. Therefore, we consider CO2 data measured on the cryo-enrichment system (i.e., Pier Line II) to only be calibrated to ± 1 ppm, which is nevertheless sufficient to reliably resolve the large observed atmospheric changes in air drawn from the Scripps Pier. All CO2 data are reported in the SIO CO2 scale X12. data are reported in delta values (Eq. 1) relative to the instrument reference gas cylinder HA2373, which contains unpolluted air collected on 10 February 2022.
2.5 data acquisition and corrections
The scheduling of all data acquisition is controlled by LabVIEW, which communicates with the IsoPrime MS using ActiveX controls. Every 10 min, a new data acquisition is triggered by LabVIEW to maintain synchronization of the computer and MS internal clocks. Acquisitions consist of 58 regular switches between sample and reference gas, each lasting a total of 20 s (10 s sample and 10 s reference). A total of 4 s of data are discarded after each switch followed by 6 s of integration, taking into account a 1.8 s delay between the switching event and the arrival of the switched gas at the MS.
Raw values provided by the MS and LabVIEW software environment need to be corrected for incomplete flush out during switching and the electronic baselines of the detector. This was done using two heuristic factors:
where raw delta values are defined as , is the ion beam intensity of the sample averaged over a given 6 s integration window, and and are same for the reference gas in the windows before and after the given sample window. The electronic baseline or “background” signal ≈ 1 nA is determined during periods when no gas is flowing into the MS, and ≈ 9 nA is the 4He+ beam measured when the sample is entering the MS. The first factor in Eq. (2) accounts for the missing electronic baseline and has a magnitude of 112 %. The second factor in Eq. (2) is close to 103 % and corrects the raw delta values for a bias introduced by integrating data over 4 to 10 s after a switch between SA and REF gas while there is still residual drift in the ion beam from switching, which is characterized by an exponential with an e-folding scale of ∼ 1.4 s.
To minimize artifacts associated with the transient response following changes between gas sources (e.g., air from the pier vs from a standard) or between starting and stopping flow, we discard data from certain periods in the measurement cycle. We reject all data points within (i) 120 s after restarting gas flow through the trap following a regeneration, (ii) 120 s (180 s for CO2) after switching between gas sources (e.g., WT and Pier Line II air), and (iii) 120 s after stopping gas flow to the MS for 4HeBG determination. These times were chosen empirically from visible drift in the LI-COR and MS signals, respectively. In addition, the first delta value of each new MS acquisition is rejected along with a small number of data points (∼ 0.025 %) for which the running standard deviation of the 4He+ signal exceeded 8 fA, corresponding to over 10 times the variability expected from ion-counting statistics. Finally, Pier Line II air data are averaged to 10 min, where valid data were available for at least of the 10 min interval.
2.6 Measurements of Ar, O2, and CO2 to derive from
To convert data from into , we use concurrent measurements of , , and the CO2 mole fraction made routinely in the laboratory of R. Keeling at Scripps (see Fig. S1 in the Supplement). These analyses are performed with a combination of a LI-COR LI-6251 CO2 analyzer, a custom-built interferometric O2 analyzer, and a second GV IsoPrime 100 mass spectrometer for measurements, which have been described in detail by Keeling et al. (Keeling et al., 2004, 1998). Like the cryo-enrichment system, these instruments are equipped with a in. gas delivery line drawing in air from Scripps Pier (i.e., “Pier Line I”). The gas delivery lines for the Ar, O2, and CO2 measurement system are separate from “Pier Line II”, but the intake points are in close proximity, and we find no systematic temporal offset between signals in both lines. This allows us to combine 10 min resolution observations from both sources as needed to calculate from according to Eq. (3), given by Birner et al. (2020):
where = 0.2095 and XAr = 0.00934 are representative values of the atmospheric oxygen and argon mole fraction, and represents differences in the CO2 mole fraction from a preindustrial value of 280 ppm. This correction averages −27.5 per meg and varies little over time, with over 92 % of all corrections falling within 20 per meg or less of the average correction. The , , and CO2 corrections contribute negligible imprecision to the measurement based on their high precision relative to the measurement of and because they are scaled down by factors and XAr.
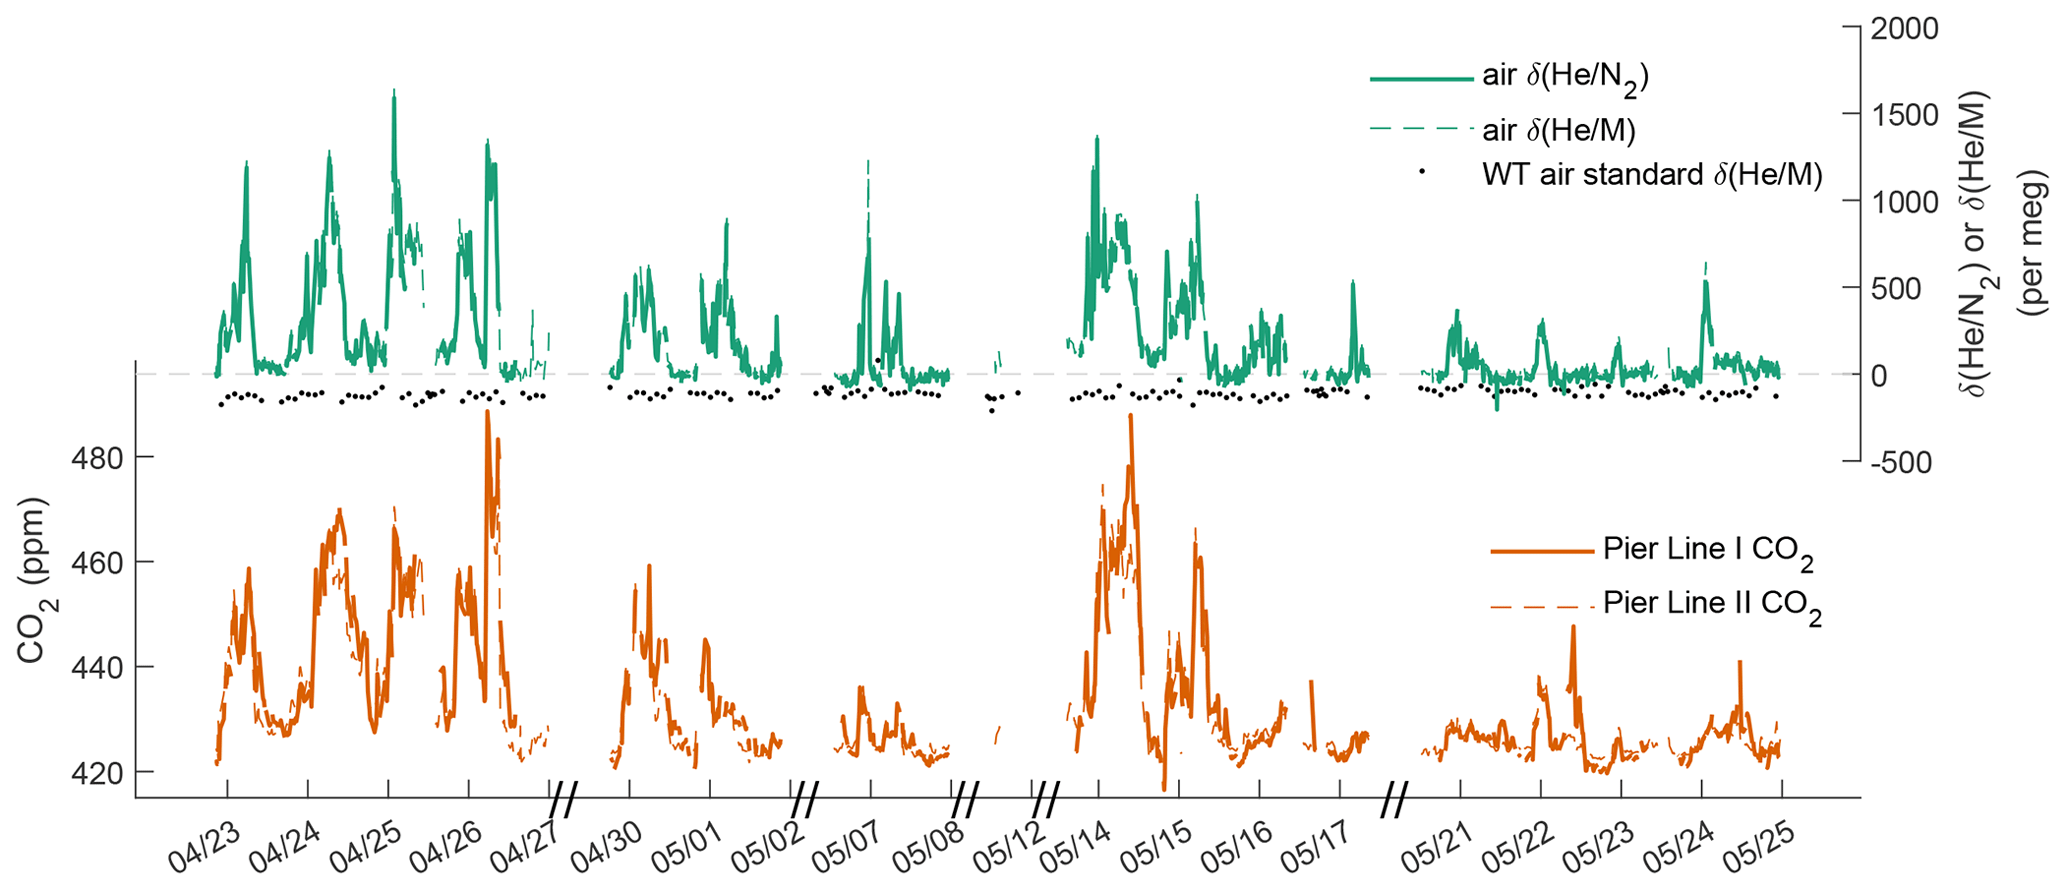
Figure 3Time series of , , and CO2 at Scripps Pier from Pier Lines I and II. Repeat measurements of the WT standard offset by +100 per meg are shown to illustrate the stability of the system.
3.1 Results for air measurements from the Scripps Pier
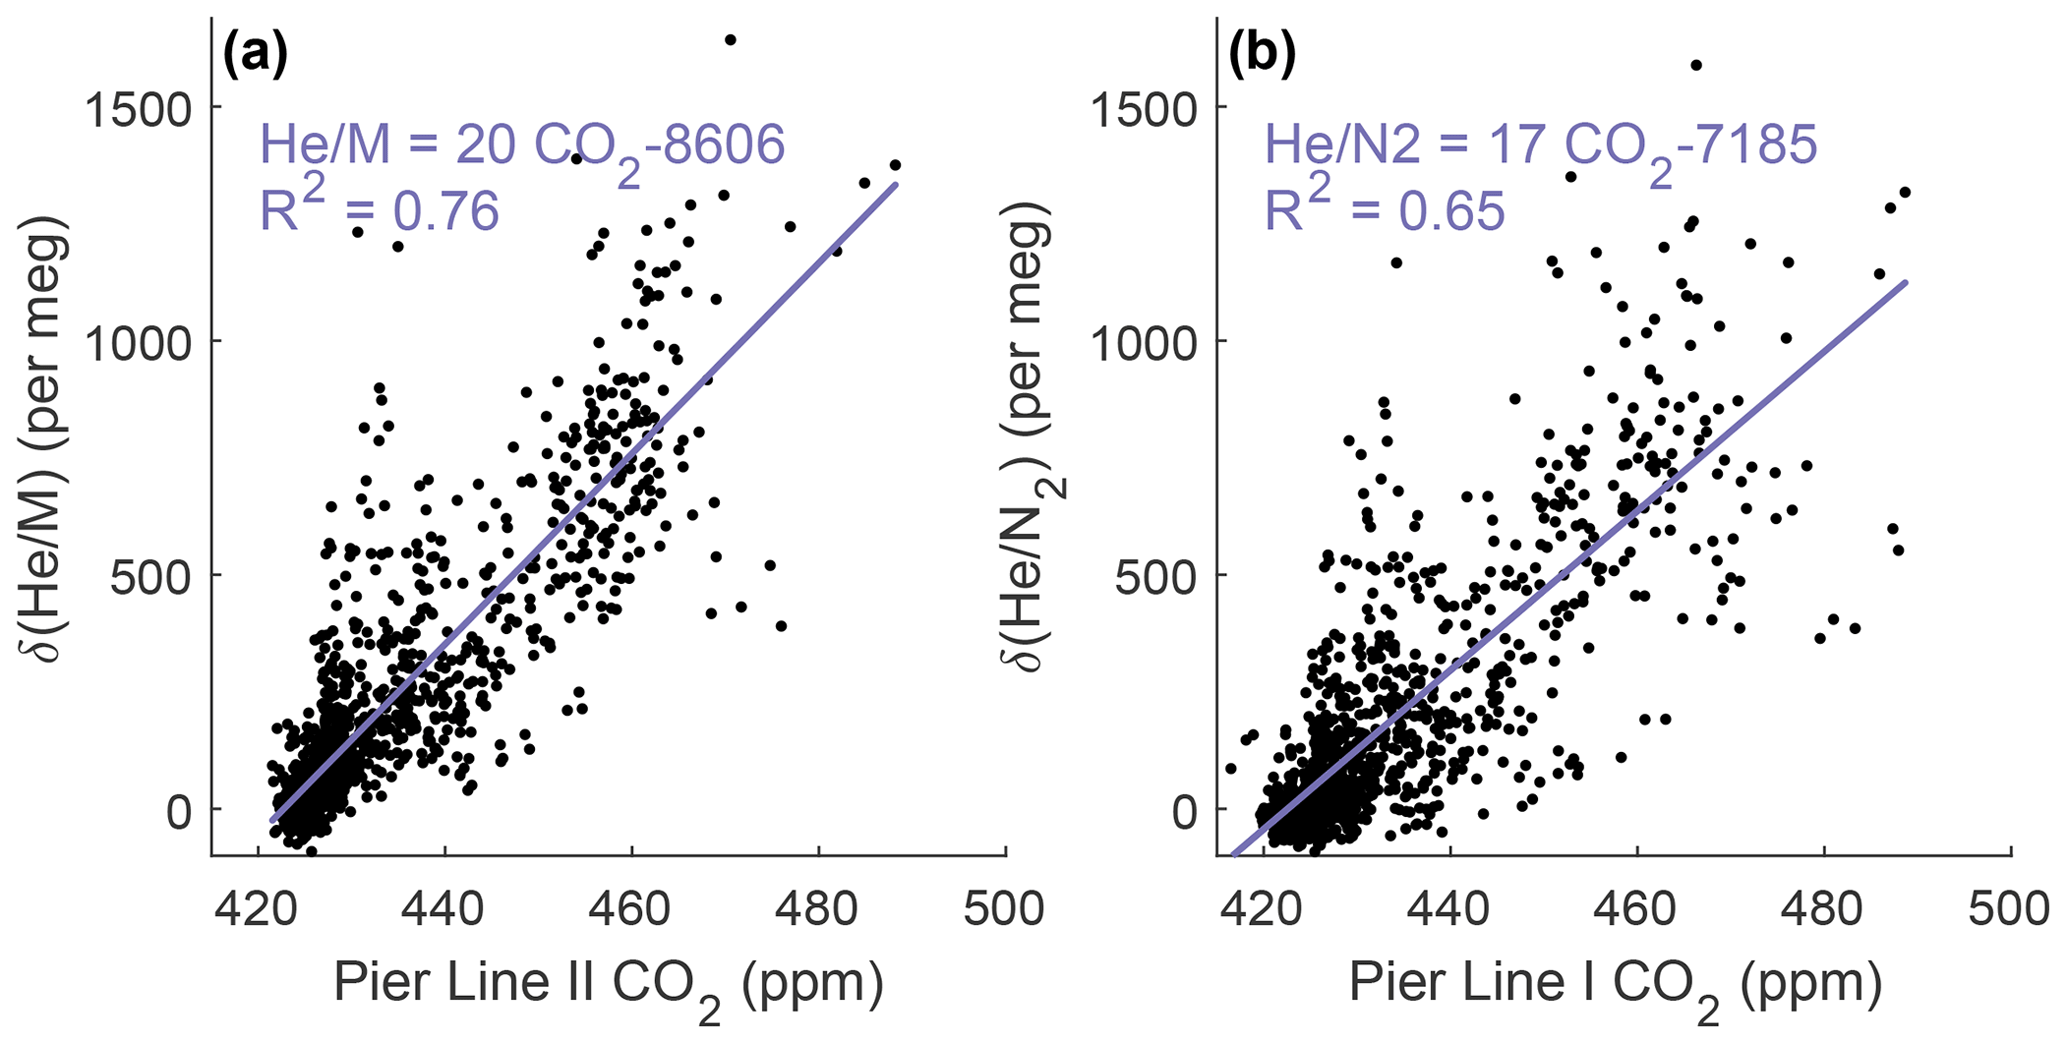
We used the newly developed cryo-enrichment system and associated gas handling (Fig. 1) to measure and CO2 in the air at Scripps Pier, La Jolla, intermittently over a 5-week period in April and May 2022, with 178 h of total analysis time. He and CO2 exhibit substantial diurnal and day-to-day variability (Fig. 3). and vary by up to ∼ 1500 per meg hour to hour, and changes are tightly correlated with variability in CO2 (Fig. 4). A linear model of their relationship yields a slope of ∼ 20 per meg ppm−1 for and CO2 from Pier Line II and of ∼ 17 per meg ppm−1 for the combination of and CO2 from Pier Line I. Differences of several parts per million (ppm) occur between CO2 data from the two LI-CORs measuring Pier Line I and Pier Line II at times (Fig. 3). We speculate that these differences may reflect the impacts of very local emissions and small-scale transport features. This is supported by the stronger correlation between He and CO2 data from the shared Pier Line II compared to the separate Pier Line I, suggesting that the offsets reflect true atmospheric signals.
He and CO2 at Scripps Pier are controlled by several factors, including local fossil fuel activity and atmospheric transport. Main local sources and sinks of CO2 include gasoline, diesel, and natural-gas emissions, as well as the exchange of CO2 with the local biosphere and soils. Contributions from these sources and sinks to the observed signals at Scripps Pier are modulated by local atmospheric transport. Although the high correlation of He and CO2 signals suggests that local variability is dominated by fossil fuel usage, as expected, there are a few episodes when the relationship between He and CO2 deviates by more than 500 per meg from the fit line in Fig. 4, a decoupling of potential interest (if real) that warrants further investigation of local He and CO2 sources. Air exchange with the He-rich stratosphere may also influence local tropospheric He levels while leaving CO2 largely unaffected, but these He signals are expected to be much smaller than the observed variations (Birner et al., 2021).
The diurnal variations in CO2 and He at Scripps Pier (Fig. 5) follow a land-breeze–sea-breeze pattern of local wind direction, as previously seen in decades of quasi-continuous CO2 measurements at coastal sites in California (e.g., Manning et al., 1999; Riley et al., 2005). This diurnal cycle has an average max–min amplitude of 450–500 per meg in over our specific observation period. During the day, enhanced vertical mixing and onshore winds bring in relatively pollution-free marine boundary layer air, leading to lower He and CO2 concentrations at Scripps Pier. At night, the pattern reverses, with reduced vertical mixing and stronger influences from emissions on land (fuel burning and respiration) increasing both CO2 and He. Correspondingly, CO2 and vary substantially from day to day during the night and in the early morning, whereas in the afternoon, CO2 and converge towards a more stable background level.
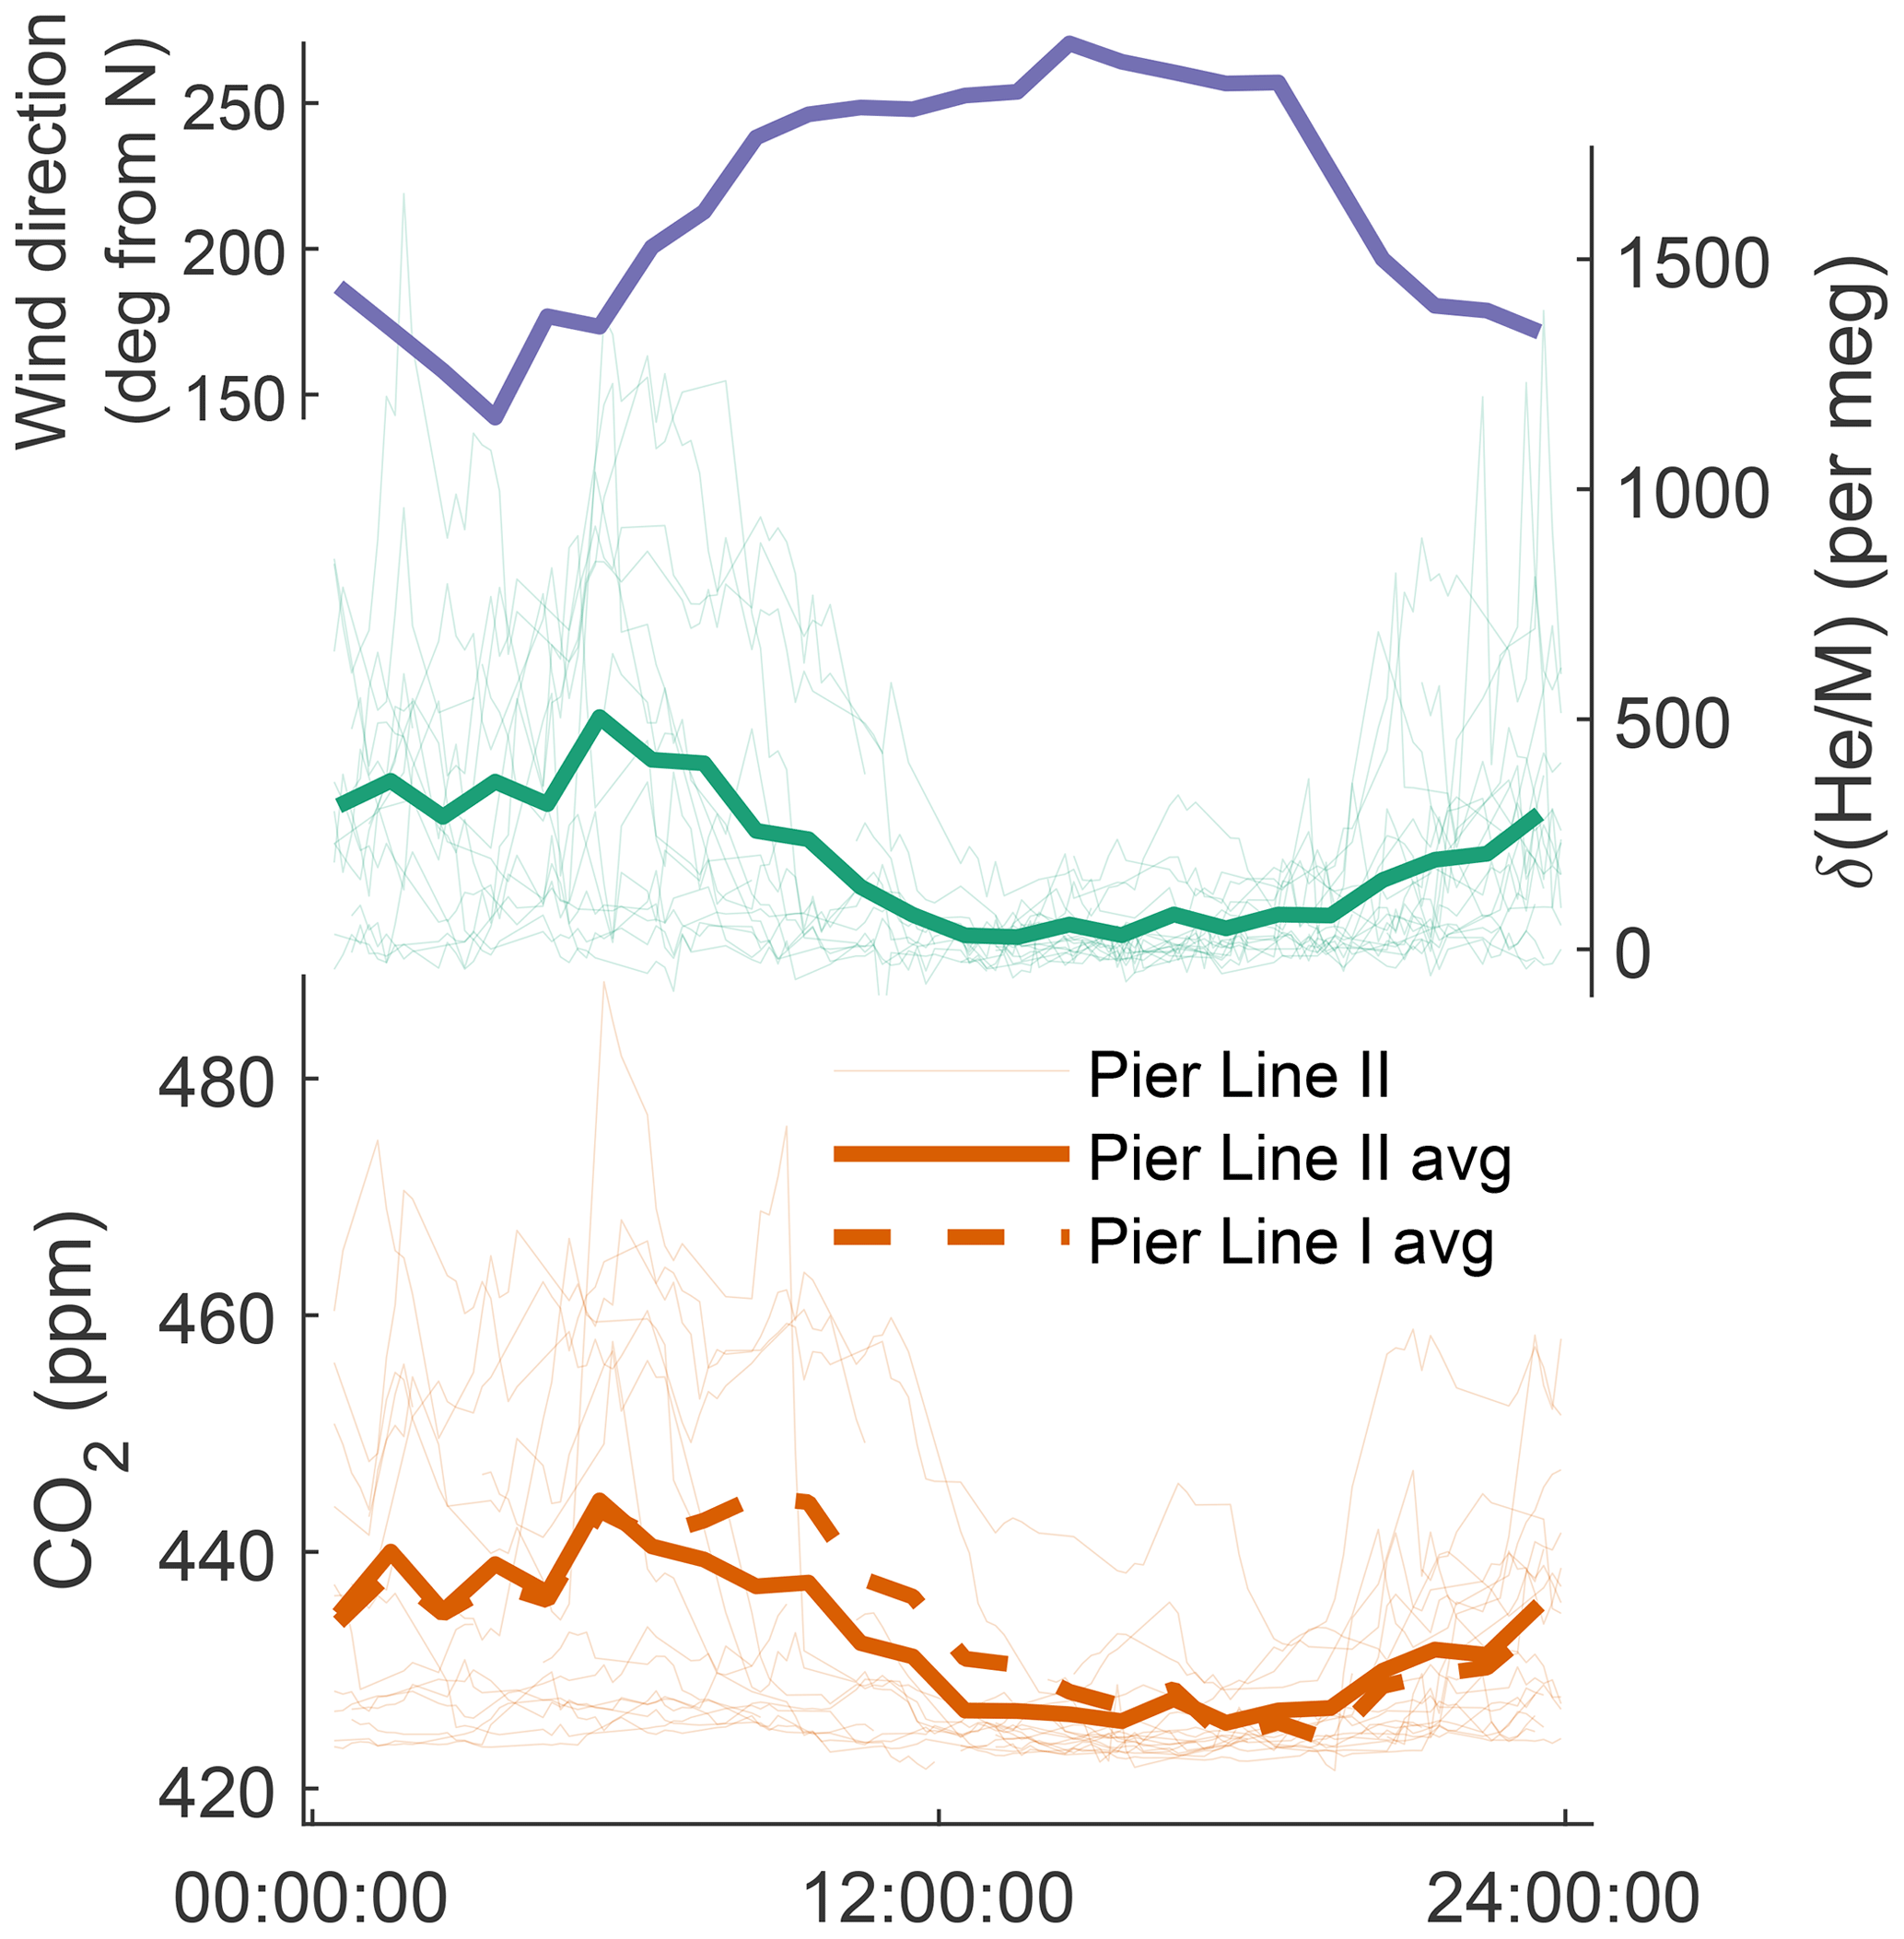
Figure 5Diurnal cycle at Scripps Pier of prevailing wind direction, , and CO2 from Pier Line I and Pier Line II. (Vector) averages are computed from the time series shown in Fig. 3 and are reported in Pacific Standard Time. Wind data for the same period are provided by Coastal Data Information Program Station 073, available at https://cdip.ucsd.edu (last access: 14 May 2022).
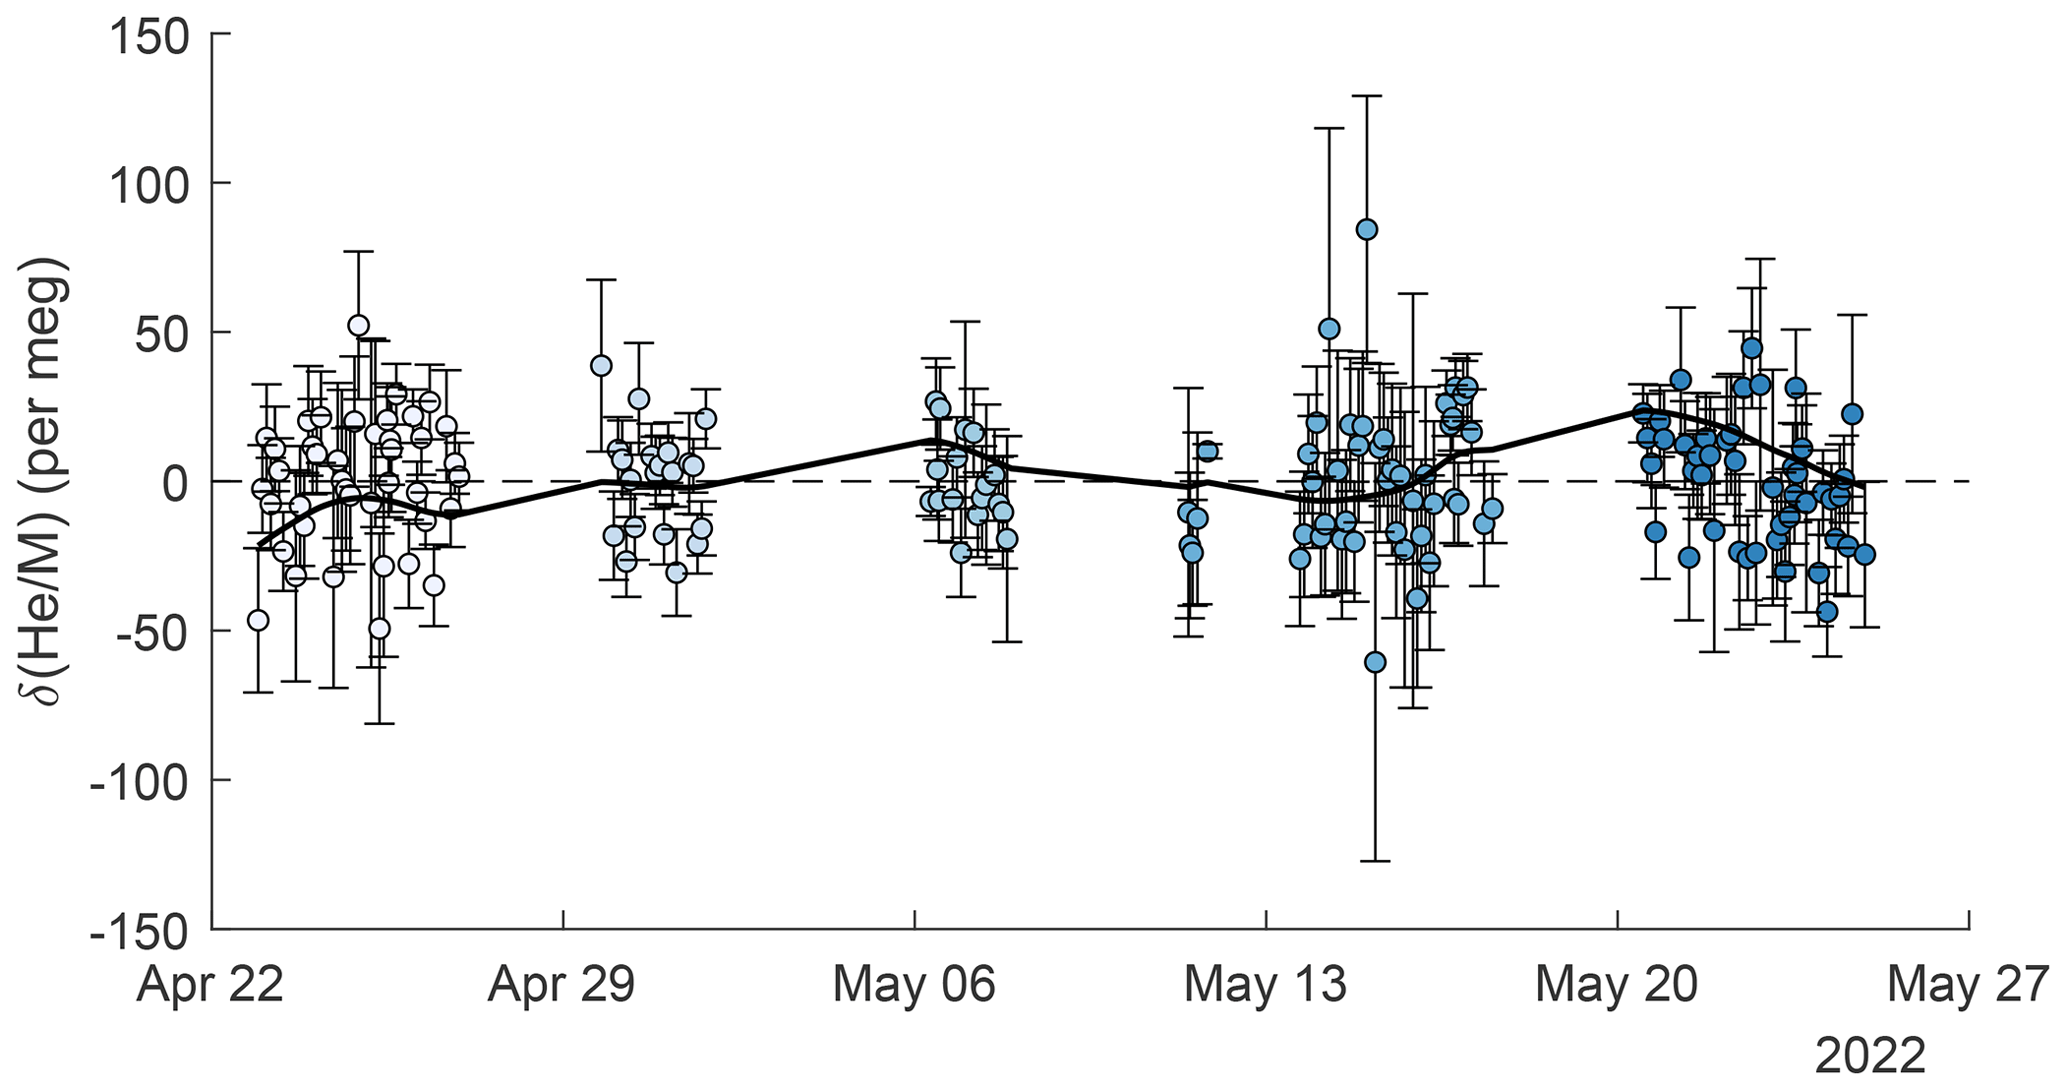
Figure 6Repeat comparison of the working-tank standard and the instrument reference gas. Error bars are calculated as the standard error of all standard-to-reference comparisons contributing to individual data points and differ in size, mostly because some replicates consist of different numbers of comparisons. Marker face colors show the clustering into the five groups used for ANOVA analysis (see text). A smooth spline is fit to the data and is shown as a solid black line.
3.2 System stability
Repeat analyses of the working tank (WT) suggest that the cryo-enrichment system for He analysis maintained good reproducibility over the 5-week period of the pier line measurements. Repeat comparisons of the WT against the instrument reference gas every 2–4 h are shown in Figs. 3 and 6. These measurements show little drift by eye, but a one-way ANOVA analysis reveals significant (p = 1.3 × 10−07) differences between measurements clustered by time into five groups. Average values have a standard deviation of ± 10.5 per meg between groups. The origin of this variability remains unknown, but we speculate that it may be caused by a small and variable thermal fractionation effect as gas is taken out of the high-pressure cylinders. To address this small drift regardless of origin, we apply a smooth spline to all WT data (see Fig. 6), which we use as a time-varying correction for all observations. The standard deviation of all replicate WT measurements after removing this fit line is 18.6 per meg and is thus about 1.3 times greater than the 14.1 per meg variability expected from ion-counting statistics alone. Based on the 1.3 ratio of WT repeatability to ion-counting noise and an average of 24 valid data points contained in a 10 min interval, we estimate the average uncertainty of 10 min and data to be ∼ 22 per meg.
3.3 He in local emissions
Assuming the ratios measured at Scripps Pier are characteristic of San Diego County, one can estimate the He abundance in local natural gas from our observed ratio. Natural gas was, on average, responsible for 7.8 % or 1.37 Mt C of 19.01 Mt C total carbon emissions in San Diego County between 2011 and 2015 (Gurney et al., 2020). Assuming an atmospheric He content of 5.24 ppm (Glückauf, 1944), the observed relationship between the He and CO2 mole fraction of 20 per meg ppm−1 can be alternatively expressed as 1.05 × 10⁻⁴ ppm He per ppm of CO2. Taking into account the dilution of 1.37 Mt C from natural-gas emissions by 17.64 Mt C from He-free fossil CO2 emission sources (e.g., petroleum), we estimate an average He content of natural gas used in San Diego of 1.05 × 10 = 0.13 % (mol He per mol CO2). This is about 4 times greater than the global He content of natural gas reported by Birner et al. (2022a). Although a higher local He content is consistent with anomalously high He levels previously reported in US natural-gas resources (Oliver et al., 1984), US natural-gas production has largely transitioned to fracking with a potentially different helium signature, since this estimate was made in 1984.
3.4 Implications of high-frequency variability for archived air samples
Birner et al. (2022a) briefly discussed the possibility that some of the scatter seen in measurements of archived air from Scripps Pier may be the result of real in situ variability and may reflect varying levels of local pollution. Although our cryo-enrichment method indeed revealed hourly variability of over 1000 per meg at Scripps Pier, this variability likely did not substantially bias the archived air samples because they were generally filled under west-wind conditions to minimize local pollution influences. In addition, many of the samples were evaluated previously for several other tracers and yielded background values (Mühle et al., 2010). However, real atmospheric variability at the level of ∼ 50 per meg captured by the tanks cannot be excluded on the basis of these observations alone.
3.5 Future applications
The ratio is expected to feature rich variability on a wide range of spatial and temporal scales (Birner et al., 2021). We expect a seasonal cycle in the He mole fraction of unpolluted air caused by exchanges of N2 and He with the ocean due to temperature-driven solubility changes. The seasonal cycle in polluted air, in contrast, should reflect seasonal changes in natural-gas usage and large-scale changes in prevalent wind direction which modulate the influence of regional and national pollution sources. In addition, may vary interannually due to exchange of air with the stratosphere (Holton et al., 1995), where He is likely enriched, compared with the troposphere by gravitational fractionation, which has been shown to deplete in the stratosphere (Birner et al., 2021, 2020; Ishidoya et al., 2013, 2008). The quasi-biennial oscillation (QBO) modulates the stratosphere–troposphere exchange and thus the interannual variability in the troposphere of several tracers, including N2O, chlorofluorocarbons (CFCs), and 14C (e.g., Graven et al., 2012; Montzka et al., 2018; Nevison et al., 2011; Ray et al., 2020; Salby and Callaghan, 2006). A similar QBO signal is expected in the He mole fraction at locations with significant stratospheric influence, such as La Jolla (Škerlak et al., 2014), although the magnitude of such a signal remains uncertain. Decadal to centennial variability of atmospheric He levels is controlled by anthropogenic fossil fuel usage. Based on a curve fit to measurements of archived air from 1974 to 2020, the global atmospheric ratio increased by ∼ 66 per meg yr−1 in 2020 (Birner et al., 2022a), which should emerge from the noise with only several months of observations at one location, such as Scripps Pier, given sufficient stability of standard gases, as supported by the good reproducibility of repeat measurements of a single standard cylinder shown here. We also expect spatial gradients in He because natural-gas emissions are concentrated in the Northern Hemisphere, likely producing a clear interhemispheric difference. Spatial gradients may also occur on smaller scales, related to human or geological emissions that so far have been too small to quantify well using other observational methods (Boucher et al., 2018b; Sano et al., 2010).
The cryo-enrichment method seems suitable, not just for continuous in situ measurements of but also for flask measurements, enabling the targeting of these spatial and temporal signals. The improved precision (22 per meg in 10 min) and small sample consumption (300 mL in 10 min) of the cryo-enrichment method enable interfacing with a setup for air sample flask analysis and/or the establishment of in situ monitoring stations in different locations. In situ and flask monitoring of atmospheric He levels at local and global scales will also allow the inclusion of He as a new tracer into atmospheric inversion frameworks, where it may provide valuable information on carbon emission sources by clearly attributing some fraction of emissions to natural-gas usage. For this application to succeed, He characteristic of natural gas used must also be known, driving a need for future sampling of either pipeline gas directly or of exhaust gas of power plants. Analysis of flasks from different sampling locations will provide a means to study spatial heterogeneity in atmospheric helium as well, which has additional useful applications. For example, the magnitude of the interhemispheric gradient may inform our understanding of interhemispheric mixing, similarly to previous studies using SF6 (e.g., Patra et al., 2009).
3.6 Measuring H2 and Ne
The cryo-enrichment method may also be suitable for high-precision measurements of other ratios, including , neon isotopes, and in atmospheric samples. H2 levels in the atmosphere have increased over time, and additional emissions are expected from a transition to hydrogen fuels (Patterson et al., 2021), but current H2 analysis methods suffer from non-linearity in the detector response, requiring sophisticated calibration schemes and typically achieving a moderate precision of roughly 1 ‰ (Jordan and Steinberg, 2011). Atmospheric Ne has no large known sources or sinks, and therefore, no substantial spatial or temporal variability is expected in its isotopes, but this has not been confirmed observationally due to a lack of sufficiently precise measurements. The ratio should generally be controlled by variations in atmospheric He levels and mimic the behavior of but may provide additional information in the analysis of gas mixtures from some natural geological sources which can be enriched or depleted in N2. Both H2 and Ne are readily detectable on our system because both have sufficiently low boiling points that they can pass through our cryo-enrichment unit without getting trapped. Ion beams of H2 and the two most common Ne isotopes are clearly distinguishable from the backgrounds in a mass scan (Fig. 2), suggesting that a precision substantially below 100 per meg may be attainable. However, H2 measurements are complicated by large and variable background levels in the instrument, and 20Ne and 22Ne suffer from interferences of doubly charged 40Ar and 44CO2. Although adjusting the trap temperature and ion source setting may help reduce these artifacts, some correction will likely be needed. Assuming 1 % of Ar and CO2 ions become doubly charged in the MS, corrections would amount to 0.5 % and 0.3 % of the 20Ne and 22Ne beams, respectively. This seems acceptable, given that the presence of Ar and CO2 can be measured precisely and is primarily a function of trap temperature and is thus not expected to vary substantially during sample–reference switching.
High-precision measurements of atmospheric helium levels in situ and in sample flasks, enabled by the cryo-enrichment method presented here, have great potential to improve our understanding of the anthropogenic carbon cycle, to which helium is intimately connected through co-emission of He and CO2. The validation experiments and semi-continuous measurements of during local pollution events at Scripps Pier shown here demonstrate that the new method further improves precision and overcomes previous ease-of-use limitations of the “getter-helium” method employed by Birner et al. (2022a, 2021), thereby paving the way for establishing He as an important part of the trace-gas toolkit in carbon cycle studies.
All data are publicly available at the UC San Diego Library Digital Collections https://doi.org/10.6075/J0J966JF (Birner et al., 2022b).
The supplement related to this article is available online at: https://doi.org/10.5194/amt-16-1551-2023-supplement.
BB conceptualized, built, and tested the cryo-enrichment system in collaboration with EM and RK. BB developed the methodology and carried out the investigation. BB also performed all data curation and analysis and prepared the paper with contributions from all co-authors. This project was supervised by RK, and primary funding for this work was provided through an NSF grant to RK, co-prepared by BB and RK.
The contact author has declared that none of the authors has any competing interests.
Publisher's note: Copernicus Publications remains neutral with regard to jurisdictional claims in published maps and institutional affiliations.
We thank Jeff Severinghaus, Jacob Morgan, Jessica Ng, Julia Dohner, Ross Beaudette, Bill Paplawsky, and Jennifer Seibel for the insightful discussions and laboratory support in the development of the cryo-enrichment method. We also thank Bill Paplawsky, Jennifer Seibel, and Shane Clark for maintaining and operating the , , and CO2 analysis systems in the Keeling laboratory. A patent application (US 63,393,478) describing the cryogenic gas purification system was filed on 29 July 2022 and contains further analytical advances that allow for truly continuous He measurements.
This work was supported by the National Science Foundation (grant nos. AGS-1940361 and OPP-1922922) and by Eric and Wendy Schmidt via recommendation of the Schmidt Futures program.
This paper was edited by Huilin Chen and reviewed by two anonymous referees.
Birner, B., Chipperfield, M. P., Morgan, E. J., Stephens, B. B., Linz, M., Feng, W., Wilson, C., Bent, J. D., Wofsy, S. C., Severinghaus, J., and Keeling, R. F.: Gravitational separation of and age of air in the lowermost stratosphere in airborne observations and a chemical transport model, Atmos. Chem. Phys., 20, 12391–12408, https://doi.org/10.5194/acp-20-12391-2020, 2020.
Birner, B., Paplawsky, W., Severinghaus, J., and Keeling, R. F.: A method for resolving changes in atmospheric as an indicator of fossil fuel extraction and stratospheric circulation, Atmos. Meas. Tech., 14, 2515–2527, https://doi.org/10.5194/amt-14-2515-2021, 2021.
Birner, B., Severinghaus, J., Paplawsky, B., and Keeling, R. F.: Increasing atmospheric helium due to fossil fuel exploitation, Nat. Geosci., 15, 346–348, https://doi.org/10.1038/s41561-022-00932-3, 2022a.
Birner, B., Morgan, E., and Keeling, R.: Data from: Short-term variability of atmospheric helium revealed through a cryo-enrichment method, UC San Diego Library Digital Collections [data set], https://doi.org/10.6075/J0J966JF, 2022b.
Blaine, T. W., Keeling, R. F., and Paplawsky, W. J.: An improved inlet for precisely measuring the atmospheric ratio, Atmos. Chem. Phys., 6, 1181–1184, https://doi.org/10.5194/acp-6-1181-2006, 2006.
Boucher, C., Marty, B., Zimmermann, L., and Langenfelds, R.: Atmospheric helium isotopic ratio from 1910 to 2016 recorded in stainless steel containers, Geochem. Perspect. Lett., 6, 23–27, https://doi.org/10.7185/geochemlet.1804, 2018a.
Boucher, C., Lan, T., Mabry, J., Bekaert, D. V., Burnard, P. G., and Marty, B.: Spatial analysis of the atmospheric helium isotopic composition: Geochemical and environmental implications, Geochim. Cosmochim. Ac., 237, 120–130, https://doi.org/10.1016/j.gca.2018.06.010, 2018b.
Glückauf, E.: A simple analysis of the helium content of air, T. Faraday Soc., 44, 436–439, 1944.
Graven, H. D., Guilderson, T. P., and Keeling, R. F.: Observations of radiocarbon in CO2 at La Jolla, California, USA 1992-2007: Analysis of the long-term trend, J. Geophys. Res.-Atmos., 117, 1–14, https://doi.org/10.1029/2011JD016533, 2012.
Gurney, K. R., Liang, J., Patarasuk, R., Song, Y., Huang, J., and Roest, G.: The Vulcan Version 3.0 High-Resolution Fossil Fuel CO2 Emissions for the United States, J. Geophys. Res.-Atmos., 125, 1–27, https://doi.org/10.1029/2020JD032974, 2020.
Holton, J. R., Haynes, P. H., Mcintyre, M. E., Douglass, A. R., and Rood, B.: Stratosphere-Troposphere exchange, Rev. Geophys., 33, 403–439, 1995.
Ishidoya, S., Sugawara, S., Morimoto, S., Aoki, S., and Nakazawa, T.: Gravitational separation of major atmospheric components of nitrogen and oxygen in the stratosphere, Geophys. Res. Lett., 35, 1–5, https://doi.org/10.1029/2007GL030456, 2008.
Ishidoya, S., Sugawara, S., Morimoto, S., Aoki, S., Nakazawa, T., Honda, H., and Murayama, S.: Gravitational separation in the stratosphere – a new indicator of atmospheric circulation, Atmos. Chem. Phys., 13, 8787–8796, https://doi.org/10.5194/acp-13-8787-2013, 2013.
Jordan, A. and Steinberg, B.: Calibration of atmospheric hydrogen measurements, Atmos. Meas. Tech., 4, 509–521, https://doi.org/10.5194/amt-4-509-2011, 2011.
Keeling, R. and Shertz, S.: Atmospheric oxygen and implications for the global carbon cycle, Nature, 358, 723–727, https://doi.org/10.1038/358723a0, 1992.
Keeling, R. F., Manning, A. C., McEvoy, E. M., and Shertz, S. R.: Methods for measuring changes in atmospheric O2 concentration and their application in southern hemisphere air, J. Geophys. Res., 103, 3381–3397, https://doi.org/10.1029/97JD02537, 1998.
Keeling, R. F., Blaine, T., Paplawsky, B., Katz, L., Atwood, C., and Brockwell, T.: Measurement of changes in atmospheric ratio using a rapid-switching, single-capillary mass spectrometer system, Tellus, 56B, 322–338, https://doi.org/10.1111/j.1600-0889.2004.00117.x, 2004.
Lupton, J. and Evans, L.: The atmospheric helium isotope ratio: Is it changing?, Geophys. Res. Lett., 31, 1–4, https://doi.org/10.1029/2004GL020041, 2004.
Lupton, J. and Evans, L.: Changes in the atmospheric helium isotope ratio over the past 40 years, Geophys. Res. Lett., 40, 6271–6275, https://doi.org/10.1002/2013GL057681, 2013.
Manning, A. C., Keeling, R. F., and Severinghaus, P.: Precise atmospheric oxygen measurements with a paramagnetic oxygen analyzer several repeated measurements interval various aspects of the global The analyzer was used to measure atmospheric period strongly changes sources to define, Global Biogeochem. Cy., 13, 1107–1115, 1999.
Montzka, S. A., Dutton, G. S., Yu, P., Ray, E., Portmann, R. W., Daniel, J. S., Kuijpers, L., Hall, B. D., Mondeel, D., Siso, C., Nance, J. D., Rigby, M., Manning, A. J., Hu, L., Moore, F., Miller, B. R., and Elkins, J. W.: An unexpected and persistent increase in global emissions of ozone-depleting CFC-11, Nature, 557, 413–417, https://doi.org/10.1038/s41586-018-0106-2, 2018.
Mühle, J., Ganesan, A. L., Miller, B. R., Salameh, P. K., Harth, C. M., Greally, B. R., Rigby, M., Porter, L. W., Steele, L. P., Trudinger, C. M., Krummel, P. B., O'Doherty, S., Fraser, P. J., Simmonds, P. G., Prinn, R. G., and Weiss, R. F.: Perfluorocarbons in the global atmosphere: tetrafluoromethane, hexafluoroethane, and octafluoropropane, Atmos. Chem. Phys., 10, 5145–5164, https://doi.org/10.5194/acp-10-5145-2010, 2010.
Nevison, C. D., Dlugokencky, E., Dutton, G., Elkins, J. W., Fraser, P., Hall, B., Krummel, P. B., Langenfelds, R. L., O'Doherty, S., Prinn, R. G., Steele, L. P., and Weiss, R. F.: Exploring causes of interannual variability in the seasonal cycles of tropospheric nitrous oxide, Atmos. Chem. Phys., 11, 3713–3730, https://doi.org/10.5194/acp-11-3713-2011, 2011.
Oliver, B. M., Bradley, J. G., and Farrar IV, H.: Helium concentration in the Earth's lower atmosphere, Geochim. Cosmochim. Ac., 48, 1759–1767, https://doi.org/10.1016/0016-7037(84)90030-9, 1984.
Patra, P. K., Takigawa, M., Dutton, G. S., Uhse, K., Ishijima, K., Lintner, B. R., Miyazaki, K., and Elkins, J. W.: Transport mechanisms for synoptic, seasonal and interannual SF6 variations and “age” of air in troposphere, Atmos. Chem. Phys., 9, 1209–1225, https://doi.org/10.5194/acp-9-1209-2009, 2009.
Patterson, J. D., Aydin, M., Crotwell, A. M., Pétron, G., Severinghaus, J. P., Krummel, P. B., Langenfelds, R. L., and Saltzman, E. S.: H2 in Antarctic firn air: Atmospheric reconstructions and implications for anthropogenic emissions, P. Natl. Acad. Sci. USA, 118, 1–8, https://doi.org/10.1073/pnas.2103335118, 2021.
Pierson-Wickmann, A. C., Marty, B., and Ploquin, A.: Helium trapped in historical slags: A search for temporal variation of the He isotopic composition of air, Earth Planet. Sc. Lett., 194, 165–175, https://doi.org/10.1016/S0012-821X(01)00554-4, 2001.
Ray, E. A., Portmann, R. W., Yu, P., Daniel, J., Montzka, S. A., Dutton, G. S., Hall, B. D., Moore, F. L., and Rosenlof, K. H.: The influence of the stratospheric Quasi-Biennial Oscillation on trace gas levels at the Earth's surface, Nat. Geosci., 13, 22–27, https://doi.org/10.1038/s41561-019-0507-3, 2020.
Riley, W. J., Randerson, J. T., Foster, P. N., and Lueker, T. J.: Influence of terrestrial ecosystems and topography on coastal CO2 measurements: A case study at Trinidad Head, California, J. Geophys. Res., 110, 1–15, https://doi.org/10.1029/2004jg000007, 2005.
Salby, M. L. and Callaghan, P. F.: Influence of the Brewer-Dobson circulation on stratosphere-troposphere exchange, J. Geophys. Res.-Atmos., 111, 1–9, https://doi.org/10.1029/2006JD007051, 2006.
Sano, Y., Wakita, H., Makide, Y., and Tominaga, T.: A ten-year decrease in the atmospheric helium isotope ratio possibly caused by human activity, Geophys. Res. Lett., 16, 1371–1374, https://doi.org/10.1029/GL016i012p01371, 1989.
Sano, Y., Furukawa, Y., and Takahata, N.: Atmospheric helium isotope ratio: Possible temporal and spatial variations, Geochim. Cosmochim. Ac., 74, 4893–4901, https://doi.org/10.1016/j.gca.2010.06.003, 2010.
Škerlak, B., Sprenger, M., and Wernli, H.: A global climatology of stratosphere–troposphere exchange using the ERA-Interim data set from 1979 to 2011, Atmos. Chem. Phys., 14, 913–937, https://doi.org/10.5194/acp-14-913-2014, 2014.