the Creative Commons Attribution 4.0 License.
the Creative Commons Attribution 4.0 License.
 | 29 Mar 2023
The Virga-Sniffer – a new tool to identify precipitation evaporation using ground-based remote-sensing observations
Heike Kalesse-Los
Anton Kötsche
Andreas Foth
Johannes Röttenbacher
Teresa Vogl
Jonas Witthuhn
Continuous long-term ground-based remote-sensing observations combined with vertically pointing cloud radar and ceilometer measurements are well suited for identifying precipitation evaporation fall streaks (so-called virga). Here we introduce the functionality and workflow of a new open-source tool, the Virga-Sniffer, which was developed within the framework of RV Meteor observations during the ElUcidating the RolE of Cloud–Circulation Coupling in ClimAte (EUREC4A) field experiment in January–February 2020 in the tropical western Atlantic. The Virga-Sniffer Python package is highly modular and configurable and can be applied to multilayer cloud situations. In the simplest approach, it detects virga from time–height fields of cloud radar reflectivity and time series of ceilometer cloud base height. In addition, optional parameters like lifting condensation level, a surface rain flag, and time–height fields of cloud radar mean Doppler velocity can be added to refine virga event identifications. The netCDF-output files consist of Boolean flags of virga and cloud detection, as well as base and top heights and depth for the detected clouds and virga. The sensitivity of the Virga-Sniffer results to different settings is explored (in the Appendix). The performance of the Virga-Sniffer was assessed by comparing its results to the CloudNet target classification resulting from using the CloudNet processing chain. A total of 86 % of pixels identified as virga correspond to CloudNet target classifications of precipitation. The remaining 14 % of virga pixels correspond to CloudNet target classifications of aerosols and insects (about 10 %), cloud droplets (about 2 %), or clear sky (2 %). Some discrepancies of the virga identification and the CloudNet target classification can be attributed to temporal smoothing that was applied. Additionally, it was found that CloudNet mostly classified aerosols and insects at virga edges, which points to a misclassification caused by CloudNet internal thresholds. For the RV Meteor observations in the downstream winter trades during EUREC4A, about 42 % of all detected clouds with bases below the trade inversion were found to produce precipitation that fully evaporates before reaching the ground. A proportion of 56 % of the detected virga originated from trade wind cumuli. Virga with depths less than 0.2 km most frequently occurred from shallow clouds with depths less than 0.5 km, while virga depths larger than 1 km were mainly associated with clouds of larger depths, ranging between 0.5 and 1 km. The presented results substantiate the importance of complete low-level precipitation evaporation in the downstream winter trades. Possible applications of the Virga-Sniffer within the framework of EUREC4A include detailed studies of precipitation evaporation with a focus on cold pools or cloud organization or distinguishing moist processes based on water vapor isotopic observations. However, we envision extended use of the Virga-Sniffer for other cloud regimes or scientific foci as well.
- Article
(6984 KB) - Full-text XML
- BibTeX
- EndNote


Trade wind cumuli are the dominant cloud type in the subtropical Atlantic. They typically occur in the form of shallow cumulus humilis or deeper cumulus with a cloud base located near the lifting condensation level (LCL) below 1 km. Trade wind cumuli make up about two-thirds of the cloud coverage in the subtropical Atlantic. The other third consists of clouds with bases higher than 1 km, mainly stratiform cloud layers or cloud edges near the trade wind inversion at 2–3 km (Nuijens et al., 2014, 2015). As suggested in Vial et al. (2019), we decided to follow the cloud classification nomenclature of the broader trade cumulus community and will call the stratocumulus cumulogenitus class of the World Meteorological Organization (WMO) cloud atlas “stratiform cloud layers”. Precipitation in these clouds mainly forms at temperatures greater than the freezing point by collision and coalescence among droplets formed on the numerous and small cloud condensation nuclei (Reiche and Lasher-Trapp, 2010). Therefore, precipitation generally occurs as light rain/drizzle from stratiform cloud layers or as showers from well-developed trade wind cumuli (Austin et al., 1995; Baker, 1993). The drop size distribution (DSD) of precipitation is modified by a variety of microphysical processes like coalescence or breakup of drops as they fall through unsaturated air (Xie et al., 2016). However, evaporation is the only warm subcloud microphysical process that changes the overall amount of liquid water and includes a phase change (Tridon et al., 2017). Precipitation underneath a cloud base is often visible as fall streaks. If the precipitation fully evaporates before reaching the ground, these fall streaks are called virga. Evaporation strength and the resulting cooling rate of air primarily depend on the DSD of the precipitation and on the relative humidity (RH) of the environment. Large droplets evaporate more slowly than small droplets; at the same time, high relative humidities in the subcloud environment result in slower evaporation, whereas low relative humidities accelerate it (e.g. Xie et al., 2016; Tridon et al., 2017).
While both – full subcloud evaporation of precipitation resulting in virga and partial precipitation evaporation in which rain still reaches the ground – are important, the focus of this paper is to introduce a tool that allows for identification of virga. Besides the need to distinguish partial vs. full evaporation due to their different implications for the biosphere, the tool could be used to evaluate satellite-based rain statistics which suffer from blind-zone effects in the near-surface region, leading to biases in total precipitation estimates as, e.g., shown by Valdivia et al. (2022). However, for ground-based radar observations, overestimations of surface rain rate retrievals also result when evaporation effects are neglected (Rosenfeld and Mintz, 1988; Li and Srivastava, 2001). Case studies of radar-based precipitation evaporation have been performed using observations with sophisticated micro rain radar (MMR) and polarimetric X-band radar (Xie et al., 2016) or dual-frequency Doppler radar spectra (Tridon et al., 2017). Here, we aim to make use of widely available long-term single-frequency vertically pointing millimeter Doppler cloud radar observations in combination with ceilometer measurements.
Partial and total precipitation evaporation contribute to the moisture and heat budgets of clouds themselves (Emanuel et al., 1994) but also influence the subcloud environment, e.g., due to the formation of cold pools typically caused by precipitation evaporation underneath convective clouds (Langhans and Romps, 2015). Schlemmer and Hohenegger (2014) also found that cold pools resulting from the evaporation of precipitation lead to an increase of the degree of organization of convection, meaning the aggregation of clouds into larger clusters. The strength of low-level precipitation evaporation and the resulting evaporative cooling causes differences in cold-pool strength and size, which has an effect on the evolution of the convection (Dawson et al., 2010). This shows that, on the one hand, precipitation evaporation is important for the organization and regeneration of cloud fields via cold pools, but on the other hand, this organization of cloud fields is important for precipitation formation. This close connection results in an impact of precipitation evaporation on the radiation budget, as well as moisture and heat fluxes (Snodgrass et al., 2009). To summarize, these studies highlight the need to detect the strength of precipitation evaporation below convective clouds reliably.
The numerous research efforts made to further understand trade wind clouds, precipitation formation within them, and the connection to cloud microphysics as well as cloud organization culminated in the field campaign for ElUcidating the RolE of Cloud–Circulation Coupling in ClimAte (EUREC4A; Bony et al., 2017; Stevens et al., 2021). EUREC4A was “the most ambitious effort ever to quantify how cloud properties co-vary with their atmospheric and oceanic environment across an enormous (mm to Mm) range of scales” (Stevens et al., 2021). The campaign consisted of about 5 weeks of measurements in the winter (dry season) trades of the tropical North Atlantic upstream of Barbados in January and February 2020. It included observations of cloud microphysics, cloud–circulation interactions, air–sea interaction, ocean sub-mesoscale processes, and ocean mesoscale eddies (Stevens et al., 2021). Airborne measurements were carried out by four research airplanes, 2600 radio- and dropsondes, and several uncrewed aerial systems. Shipborne measurements were realized by multiple unmanned drifters, five sail drones, and four research vessels. In this study, ground-based remote-sensing observations performed on board the research vessel (RV) Meteor operating about 200 km upwind of Barbados between 12.5 and 14.5 ∘ N along the 57.25∘ W meridian are utilized to detect and characterize virga.
The structure of the paper is as follows: the relevant instrumentation and data sets for detection of clouds, precipitation, and virga including the CloudNet target classification are described briefly in Sect. 2. The Virga-Sniffer tool developed in this study is introduced in Sect. 3. To validate the tool, Virga-Sniffer results are compared to the CloudNet target classification in Sect. 4. This section also presents statistical results of detected virga from clouds below the trade inversion height in context with cloud macrophysical properties for the entire EUREC4A RV Meteor observations (18 January to 19 February 2020). Section 5 comprises a summary, conclusions, and an outlook.
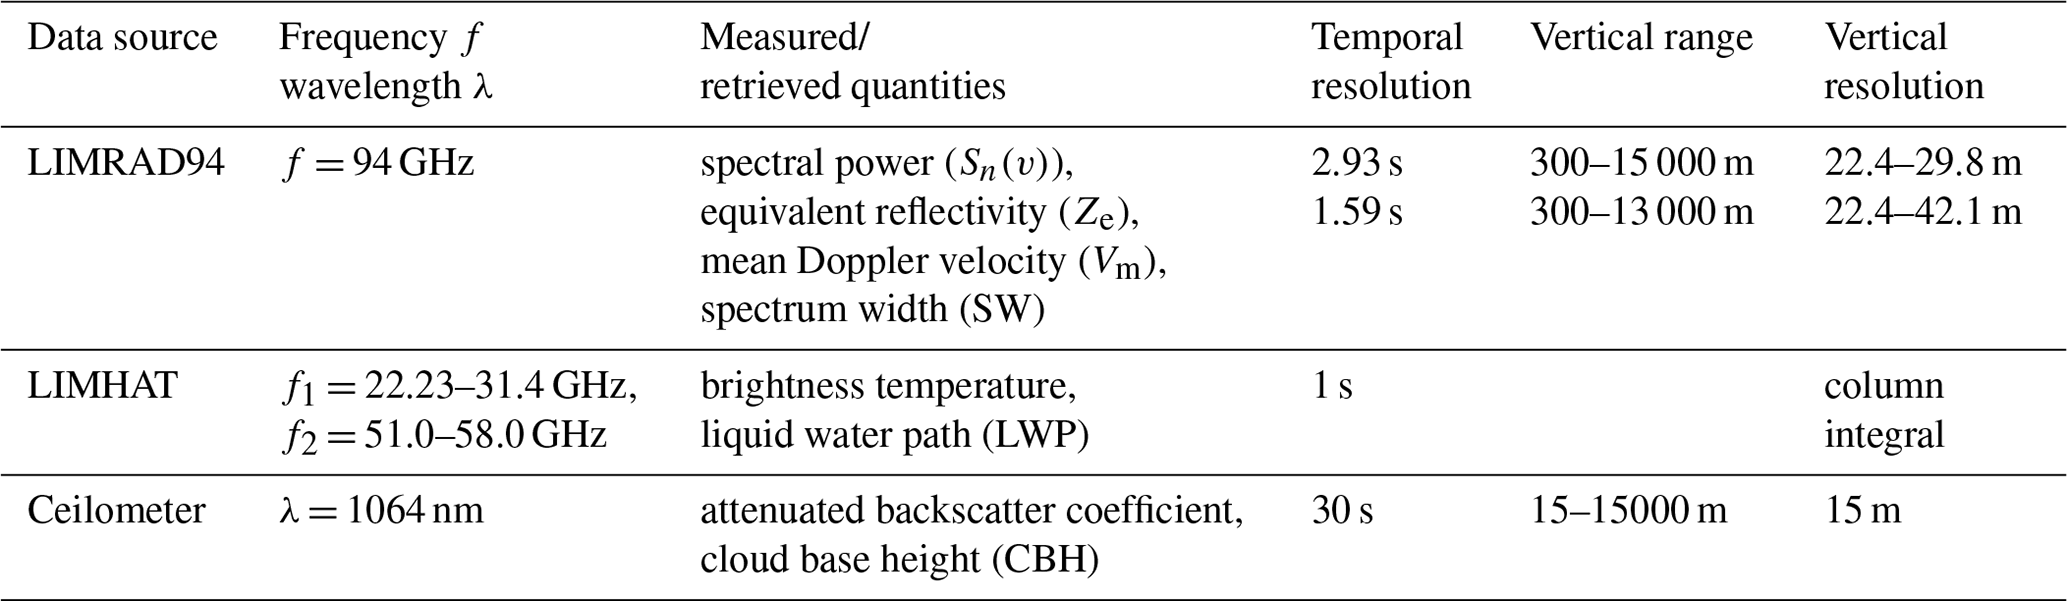
For the development of the Virga-Sniffer, ground-based remote-sensing observations from a Doppler cloud radar and a ceilometer operated on board RV Meteor during EUREC4A for the period from 18 January to 19 February 2020 were utilized. In the following, the instrumentation and data sets used, which are publicly available on the EUREC4A AERIS portal (https://observations.ipsl.fr/aeris/eurec4a/, last access: 12 August 2022), are briefly described. A summary of instrument specifications is given in Table 1. The CloudNet processing chain is also briefly presented. As additional data, observations from the onboard RV Meteor weather station operated by the German Meteorological Service (DWD) that provided continuous observations of standard meteorological parameters such as pressure, temperature, relative humidity, dew point temperature, and precipitation were used, e.g., for flagging times when rain was observed at the ground and to determine the lifting condensation level (LCL).
Table 1Specifications of instruments and measured/retrieved quantities. For LIMRAD94, in the last three columns the upper values refer to the first chirp table used; the lower values refer to the second chirp table (see Table 2). The values in the last three rows refer to all the measured/retrieved quantities of the respective data source.
2.1 Doppler cloud radar LIMRAD94
The Doppler cloud radar that was installed on board RV Meteor is a bistatic frequency-modulated continuous wave (FMCW) radar–radiometer system of type RPG-FMCW-94-DP operating actively in the W-band (94 GHz) and containing a passive radiometer channel at 89 GHz (Küchler et al., 2017). The cloud radar was operated by the Leipzig Institute for Meteorology (LIM) of Leipzig University, and the instrument is named “LIMRAD94” in the following. While it had previously been used for long-term high-resolution cloud-profiling observations on land (Vogl et al., 2022; Schimmel et al., 2022), EUREC4A was the first ship deployment of LIMRAD94. To avoid sea spray accumulating on the cloud radar antenna radomes, the radar was placed on the navigation deck of the ship at 15.8 m above sea level, 4.1 m in the starboard direction and 11 m from the center of the ship towards the stern.
Table 2Specifications and program settings for LIMRAD94. Two main chirp tables with slightly different settings were used during the campaign. The upper row denotes the first chirp table operated from 17 to 29 January 2020 18:00 UTC, and the second row refers to the second chirp table operated from 31 January 2020 22:28 UTC to 29 February 2020 (here data until 19 February 2020 obtained in the EUREC4A region of interest were used).
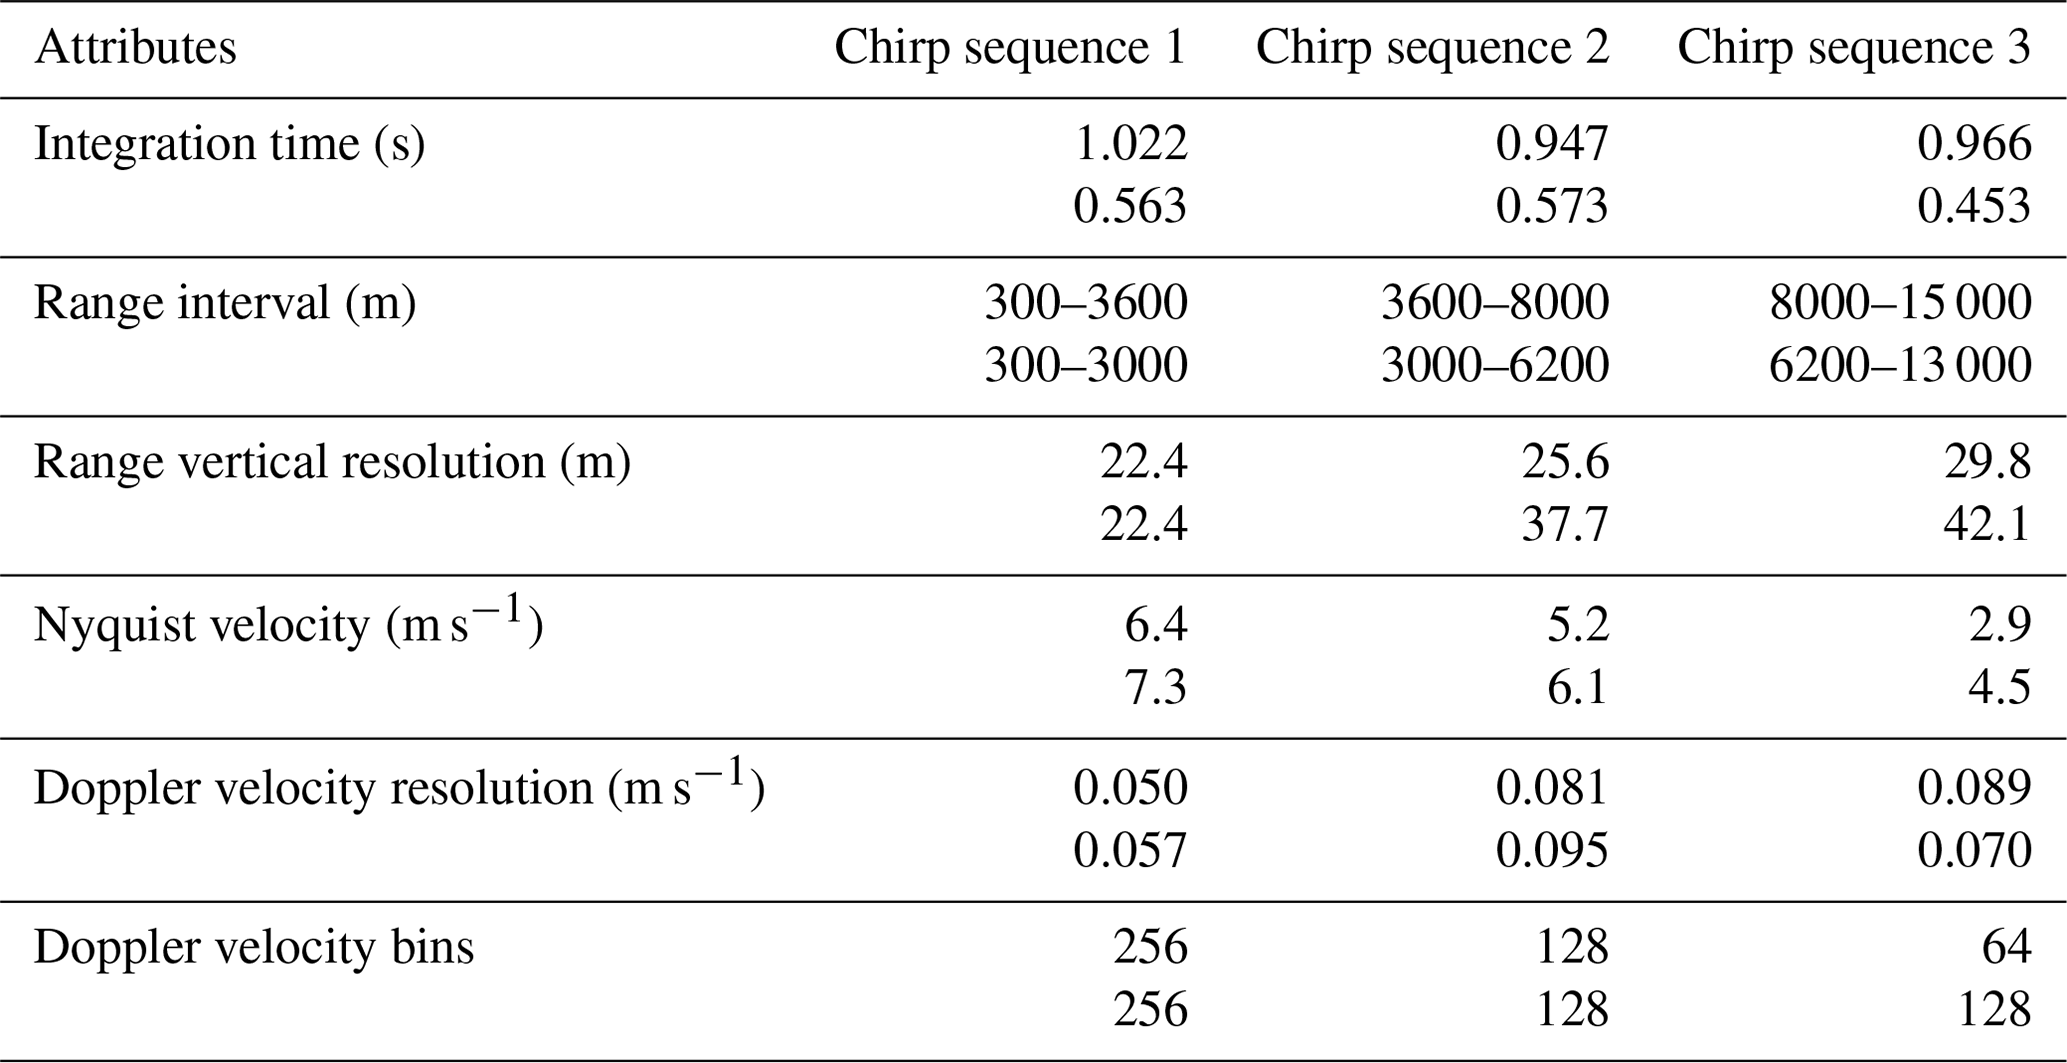
The two radar chirp program settings, respectively used from 17–29 and 31 January 2020 onwards, are shown in Table 2. Due to tests and maintenance, no cloud radar data are available for 30 January 2020. The vertical range covered by the cloud radar observations using the two different chirp table settings was 300–15 000 and 300–13 000 m, respectively. Vertical range-gate spacing was between 22–42 m, and the temporal resolution amounted to 2.9 and 1.6 s, respectively. More details on the different chirp sequence settings are given in Table 2.
To exclude the effect of horizontal wind on the observed radar Doppler velocities, the radar needs to point to zenith. To assure that, the instrument was operated within a novel two-axle cardanic mount stabilization designed and manufactured by Radiometer Physics GmbH, Meckenheim, Germany, that allowed for “free swinging” of the radar to compensate for ship roll and pitch angles of up to ±20∘. An illustration of the radar setup with the cardanic mount is given in Fig. 1. Continuous attitude angle measurements by radar built-in motion sensors sampling at 0.5 Hz with an accuracy of 0.02∘ showed that absolute values of roll and pitch angles experienced by the radar generally were less than 0.36 ± 0.31∘ (mean ± standard deviation). These small attitude angles do not affect the virga detection performance. A detailed description of the performance of the radar stabilization platform is beyond the scope of this paper and will be discussed in a separate paper.
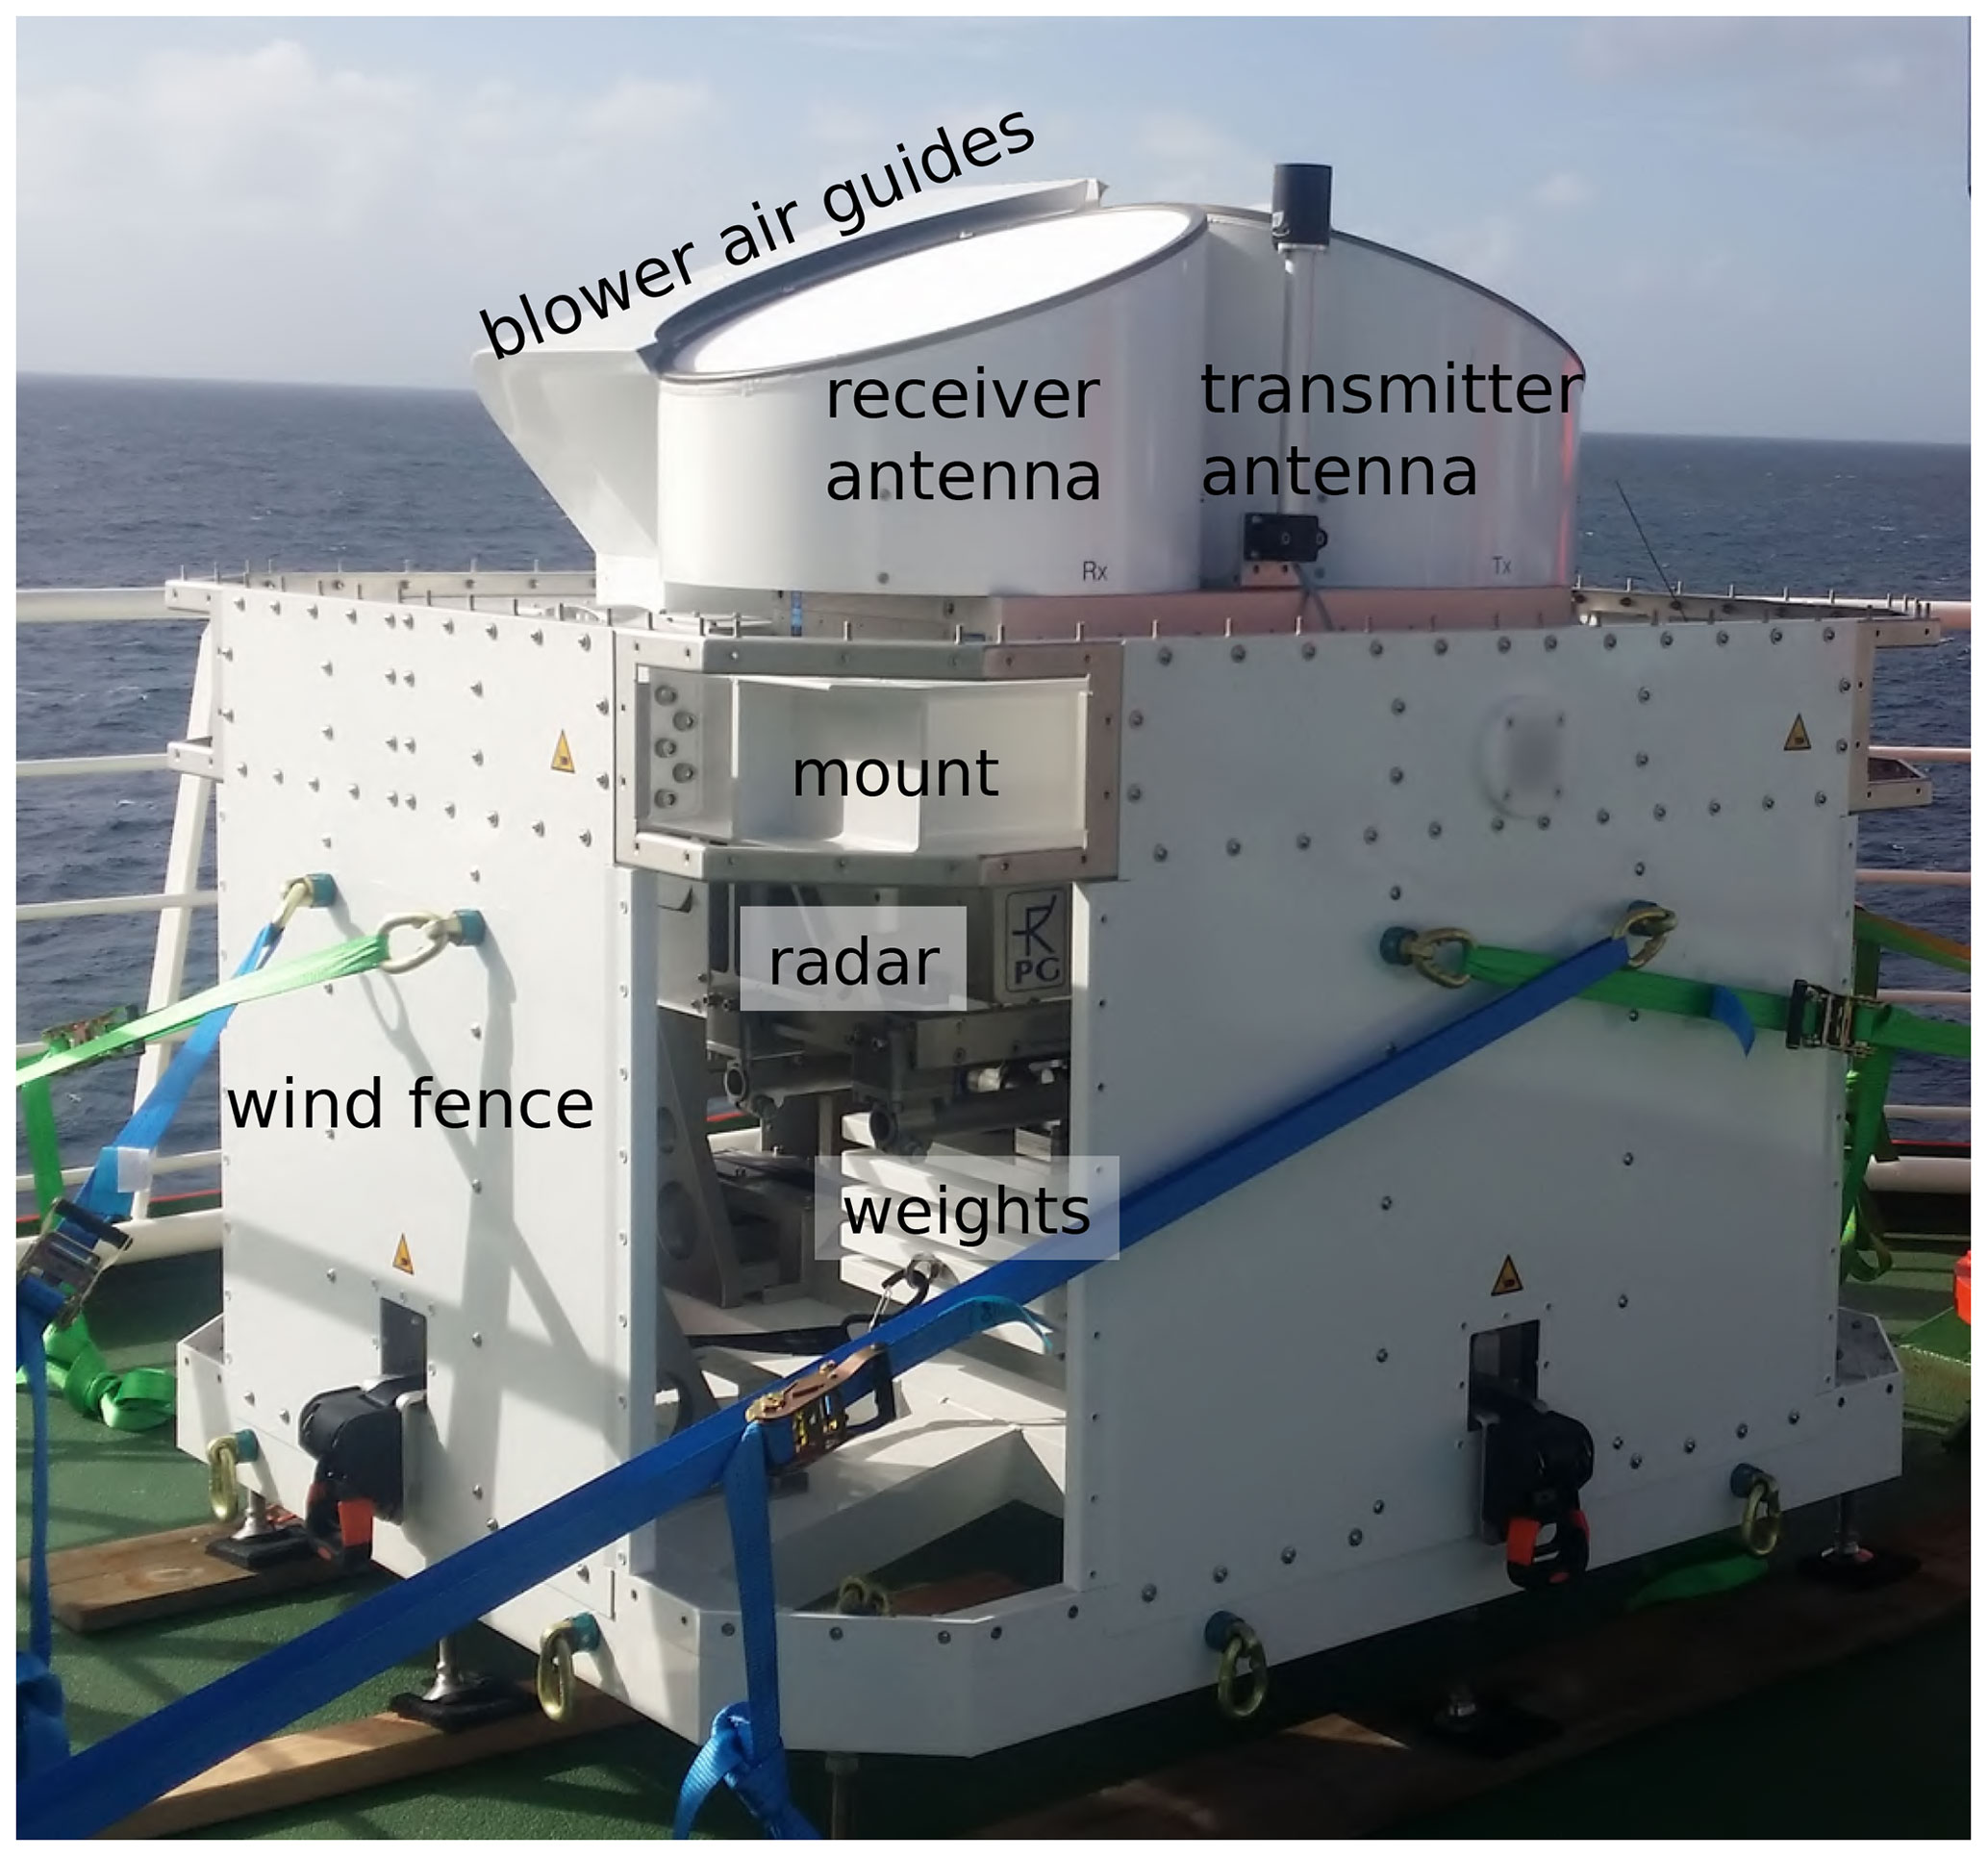
Figure 194 GHz FMCW cloud radar “LIMRAD94” inside the cardanic mount. Specific parts of the radar and the cardanic mount are labeled. Photo taken by Heike Kalesse-Los.
As a post-processing step to correct for vertical heave of the vessel, a heave correction as described in Acquistapace et al. (2022) was applied to the cloud radar data. Note that contrarily to Acquistapace et al. (2022), the heave correction was directly applied to the full Doppler spectrum of the W-band radar, instead of to the mean Doppler velocity. Further radar data processing included signal clutter filtering as well as Doppler spectra dealiasing using pyLARDA software (Bühl et al., 2021).
2.2 Ceilometer
Profiles of attenuated backscatter coefficient at a wavelength of 1064 nm are obtained with a Jenoptik CHM15kx ceilometer. From these profiles, cloud bases were determined using the internal ceilometer cloud base detection algorithm. The ceilometer observations had a range resolution of 15 m and a time resolution of 30 s. It was operated by the Max Planck Institute (MPI) for Meteorology, Hamburg, Germany. For the CHM179158 ceilometer, deployed on board RV Meteor at 20 m above sea level, the normalization factor (the so-called TBC value) was 0.496633. In order to obtain the attenuated backscatter coefficient, an additional factor of 3.2 × 10⁻¹² is needed, resulting in an overall ceilometer calibration factor of 1.5892256 × 10⁻¹² (Friedhelm Jansen, MPI for Meteorology, Hamburg, personal communication, 2020), which is prescribed during CloudNet processing (see Sect. 2.4) via a metadata dictionary.
2.3 Microwave radiometer LIMHAT
Column-integrated values of liquid water path (LWP) were retrieved with a RPG-HATPRO Generation 5 microwave radiometer (MWR) that was placed in the vicinity of the cloud radar on the navigation deck of the RV Meteor. The passive instrument measures brightness temperatures over a range of different frequencies at the center and slopes of the atmospheric water vapor absorption line (22.23–31.4 GHz) and the oxygen absorption complex (51.26–58.0 GHz). To retrieve LWP from the measured brightness temperatures, statistical algorithms were used by means of a multilinear regression between modeled brightness temperatures and atmospheric profiles (Löhnert and Crewell, 2003). The retrieval algorithms are based on a radiosonde data set gathered in the subtropical Atlantic (Barbados).
2.4 CloudNet target classification
The CloudNet processing scheme (Illingworth et al., 2007) combines ground-based remote-sensing observations from cloud radar, backscatter lidar (e.g., ceilometer), and microwave radiometer with additional information from a numerical weather prediction model to yield a variety of CloudNet products, which describe the cloud properties in the vertical column above the observation site. One of these products is the CloudNet target classification, which indicates which parts of the atmosphere above the site contain ice, liquid, aerosol, and insects, etc. Here, we are using the CloudNet target classification classes for consistency checks of the virga detection method.
To obtain the CloudNet target classification mask, we applied code from the CloudnetPy package (version 1.33.0, Tukiainen et al., 2020a), i.e., a Python package implementing the CloudNet processing scheme, to the ground-based remote-sensing observations obtained during EUREC4A on board the RV Meteor. With respect to the original CloudNet software written in MATLAB and C, several updates have been made in the Python version, including, e.g., improvements in the detection of the melting layer, of liquid layers and of insects that still need to be evaluated. CloudnetPy is an open source project which is being actively developed by a growing community of users. For these reasons, the Python version of the code was chosen instead of the original (proprietary) MATLAB and C implementation of the CloudNet processing scheme.
For the LIMRAD94 cloud radar, filtering of the data was performed to exclude periods when the chosen radar settings are not supported by CloudnetPy and would lead to erroneous results. Data are filtered on the complete days of 27, 29, 30, and 31 January 2020. During these days, frequent switching between chirp programs is performed for testing. Hourly profiles of pressure, temperature, and relative humidity from the European Centre for Medium-Range Weather Forecasts Integrated Forecasting System (ECMWF-IFS) complemented the input to CloudnetPy.
The Virga-Sniffer is a profile-based detection scheme for virga events. It is a self-developed Python package (Witthuhn et al., 2022). The detection is based on a set of empirical thresholds, which are manually tuned on the EUREC4A data set (Sect. 2) and summarized with their default values in Appendix A. This package provides a tool for detecting precipitation, virga, and clouds from profile-by-profile observations of vertically pointing cloud radar reflectivity and ceilometer observations of cloud base height (CBH), taking into account multilayer cloud situations. The radar data serve as a basis, as they define the temporal and vertical resolution for the Virga-Sniffer, which in the case of the EUREC4A data set is 1.6–2.9 s and 22–42 m, respectively (see Sect. 2.1). The main result is Boolean masks, which mark clouds, virga, and/or precipitation on the radar coordinates (range gates and time steps). It is highly configurable and modular and therefore usable for different measurement setups. In addition, virga detection can be refined by additionally considering radar mean Doppler velocity, LCL, and surface rain detection. Example cases presented in the following are based on the default settings of the Virga-Sniffer to process the EUREC4A data set.
The workflow of the virga detection is separated into three parts, as summarized in Fig. 2:
-
preprocessing of CBH
-
precipitation and cloud detection
-
virga detection
- a.
masking rain events
- b.
(optional) virga mask refinement.
- a.
Note that all modules of the virga mask refinement are entirely optional (step 3b). In order to separate rain and virga events (step 3a) the mask_rain_ze module is used, which is based on the radar reflectivity values in the lowest range gate. Potentially, the Virga-Sniffer can be used to mask both rain reaching the surface and virga by opting out of using the rain masks mask_rain_ze and mask_rain.
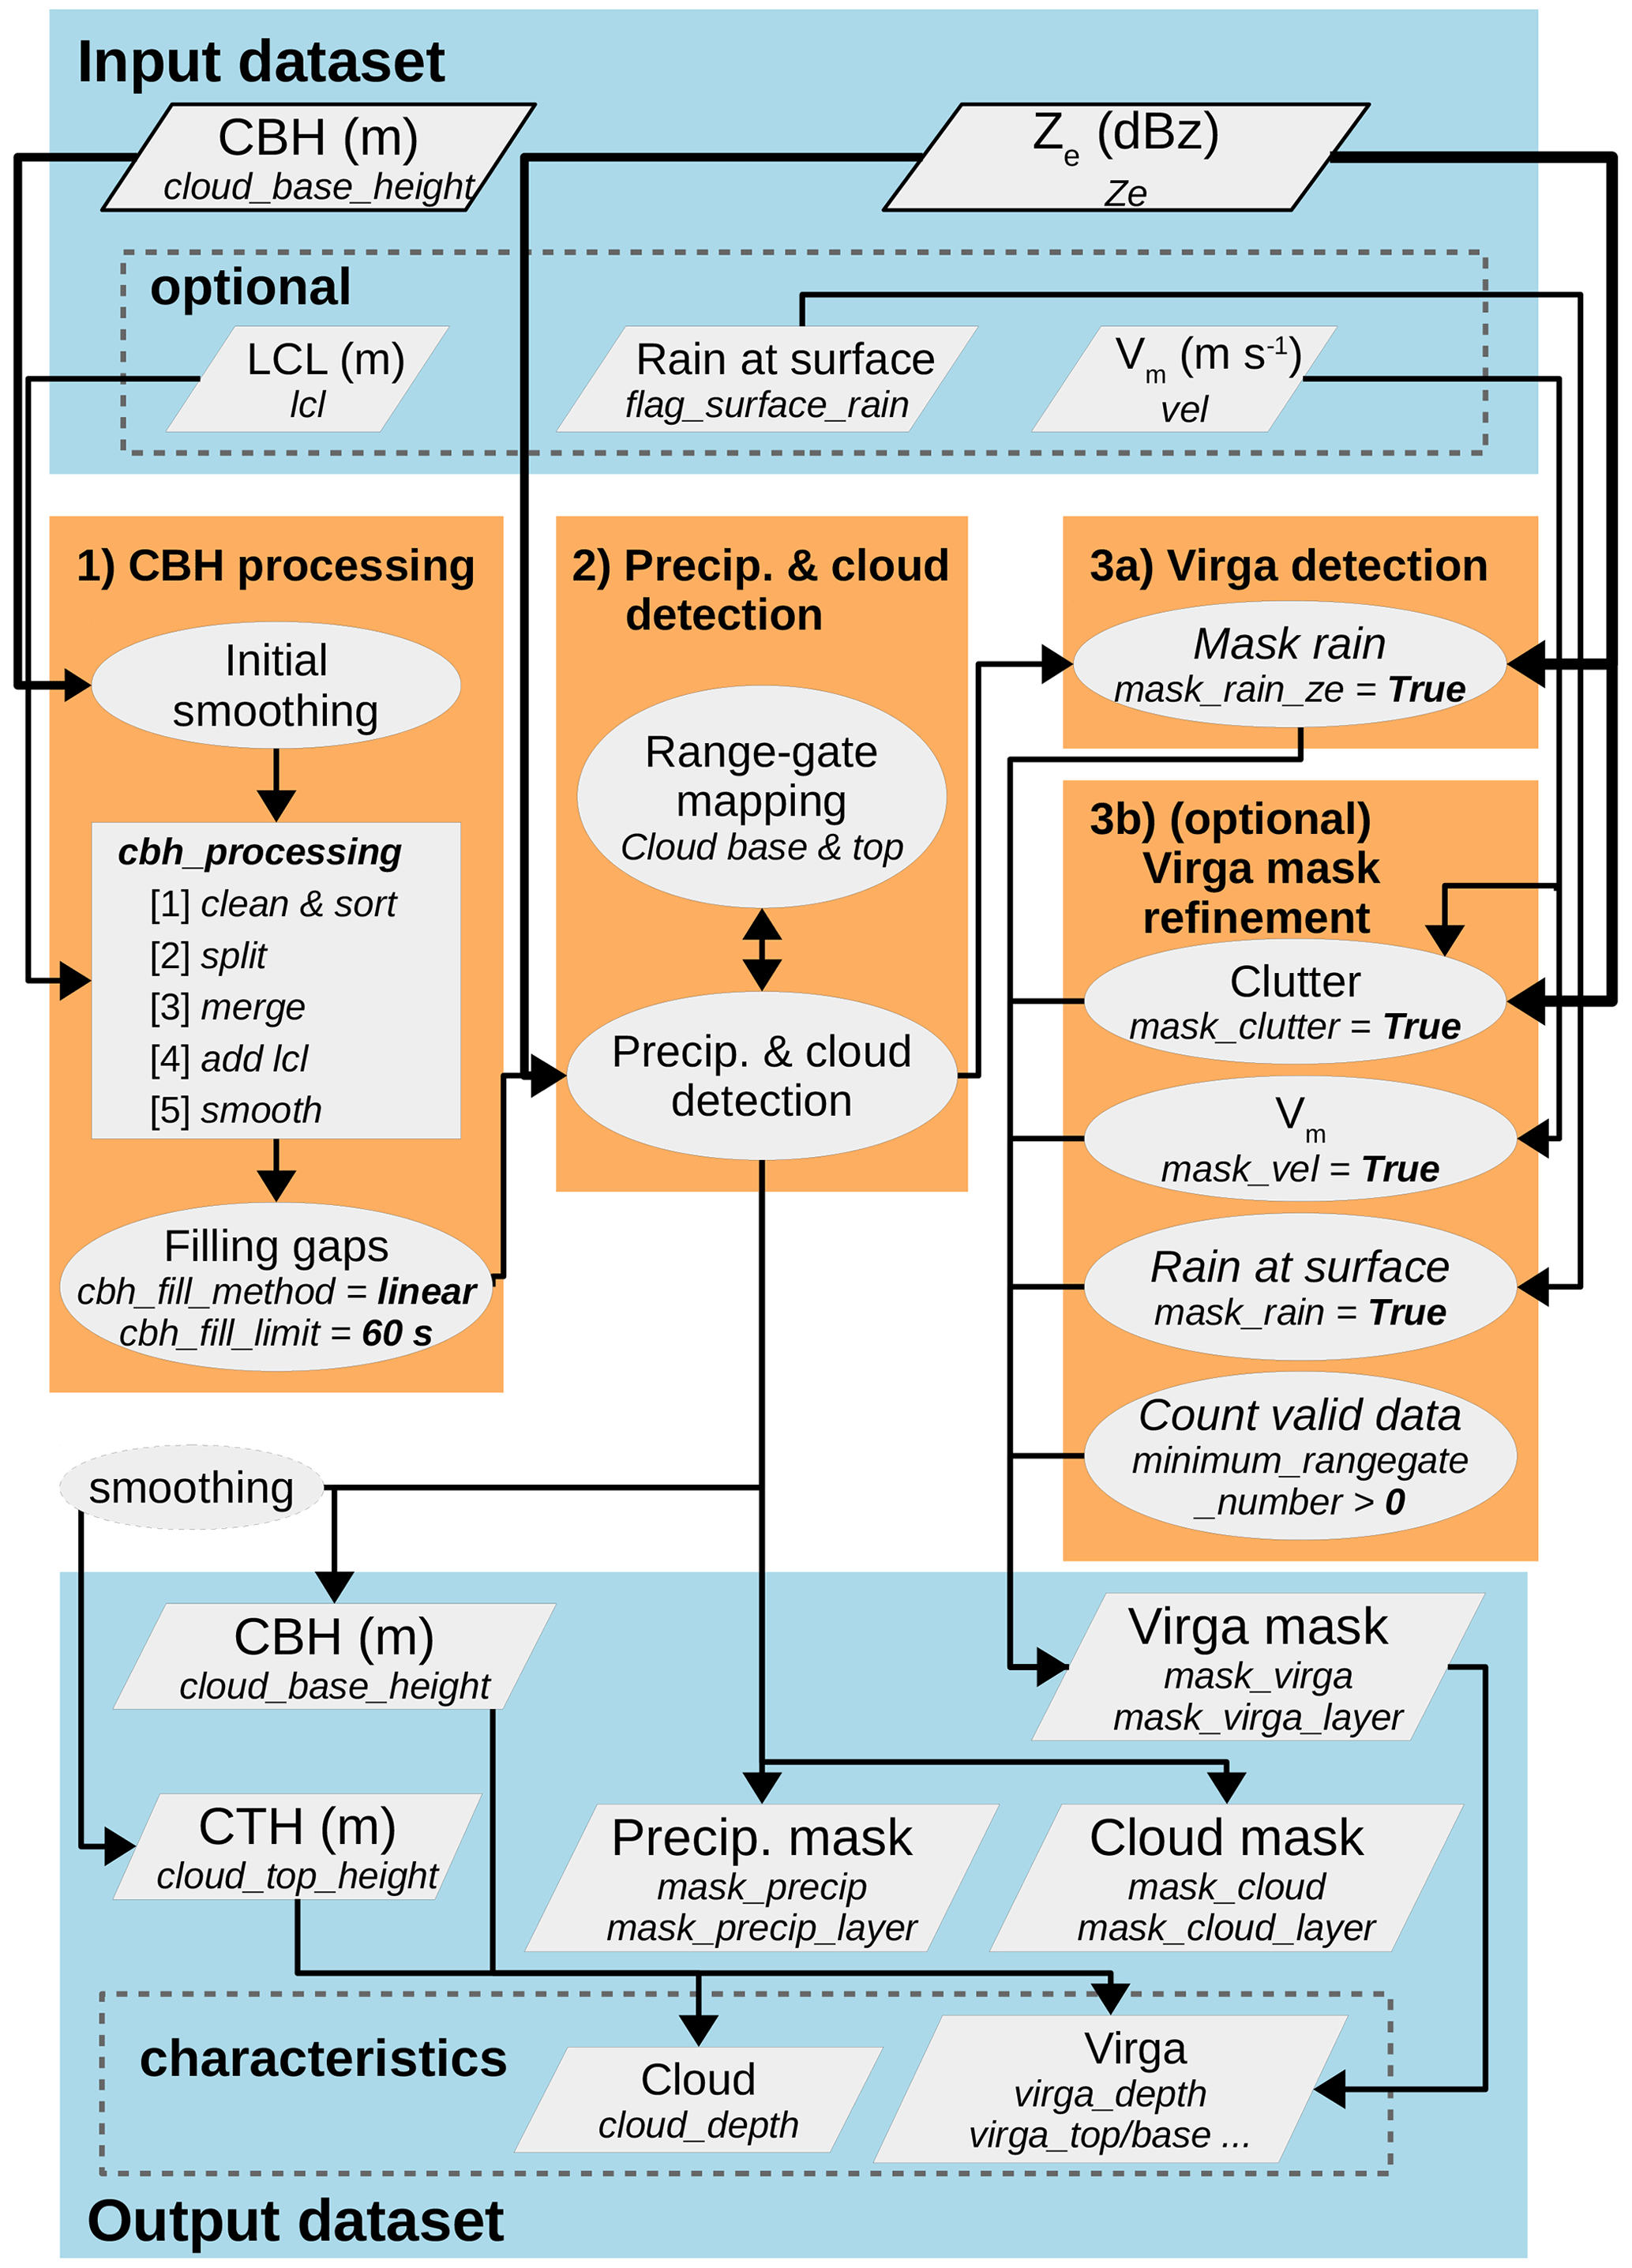
Figure 2The workflow of the Virga-Sniffer virga detection. Data sets are shown as polygons and applied methods as ellipses. The submodule cbh_processing is shown as a square, listing implemented methods. Ze and Vm refer to the radar variables reflectivity and mean Doppler velocity, respectively. The arrows show the data flow within the Virga-Sniffer. The data are processed from the input data set step by step, starting with (1) CBH processing, until they are stored in the output data set. Flags to enable certain virga mask refinements are denoted in italics with their default setting.
3.1 Cloud base preprocessing
The ceilometer provides the input values of the CBH. The CBH is a data product of the internal ceilometer processing. For multilayer cloud situations, multiple CBHs are being output, until the ceilometer signal is fully attenuated. Thus, depending on the type of ceilometer and the underlying internal CBH determination algorithm, multilayer cloud situations can also be taken into account. In the Virga-Sniffer, cloud layers within a processing interval are sorted, which depends on the given input data (here daily data). Clouds are assigned to specific cloud layers within the processing interval. A cloud layer is identified by the mean CBH of individual clouds assigned to it, which on average differs from other layers over the processing interval by more than the set threshold of 500 m (cbh_layer_thres; see Appendix A). The term “layer” is used if a variable is tied to a specific cloud layer, as the term “CBH layer” refers to the cloud base height of one cloud layer.
The CBH input data from the ceilometer must be preprocessed to achieve a sorted CBH layer data set before they can be used for virga and cloud detection (see Fig. 2, orange box 1). As the Virga-Sniffer is designed to work on the radar data coordinates, the CBH input data, on a temporal resolution of 30 s, are interpolated to the radar time steps (1.6–2.9 s). Prior to configurable preprocessing, CBH data are smoothed to avoid outliers in the input data that would complicate preprocessing. For the preprocessing, modular methods are applied to the CBH input data, which can be individually configured. In total, five modules are available. These modules are named clean & sort, split, merge, add LCL, and smooth. Flags and thresholds used to control the modules, and their default values are summarized in Appendix A.
As a default, two iterations of the combination split, merge, and add LCL are considered. The clean & sort module is applied between each step to continuously filter outliers. After these two iterations, a last smoothing step is applied. As a final step, gaps in the processed CBH data smaller than the threshold cbh_fill_limit, which is 1 min by default, are filled by linear interpolation (the filling method can be chosen with the option cbh_fill_method; see Appendix A). This step to fill gaps in the CBH layers is applied to increase the detection coverage, assuming negligible variability of CBH during a time frame controlled by the cbh_fill_limit threshold. Larger CBH gaps remain, as filling them might lead to non-physical results of CBH and false positive virga detection.
The individual modules are described below:
-
clean & sort. The valid data points of each CBH layer are counted and compared to the number of data points for the total processing interval. If the number is lower than the given threshold of 5 % by default, the data of this layer are removed (clean). After the cleaning, the remaining layers are sorted in ascending order by comparing their mean height over the processing interval (sort).
-
split. The CBH data set is iterated successively layer by layer. For each layer, outliers according to given threshold settings (by default 500 m above and below the current layer mean) are identified and added to new layers created above and below the current layer. This process is re-iterated until no new layers are created.
-
merge. CBH layer data are merged by successively iterating all layers and comparing lower layers to all layers above them. If the distance of the compared layers is smaller than the given threshold setting (by default 500 m above current layer mean), upper-layer data will be re-assigned to the lower layer or merged by mean value if both layers hold valid data.
-
add LCL. If LCL is provided, it is smoothed by applying a running-median filter of a window size of 5 min by default. Then the lowest CBH layer is replaced with the LCL data by default; optionally it can be set to only replace nan (not a number) values of the lowest CBH layer.
-
smooth. Each layer of the CBH data set is smoothed by applying a running-median filter with a window size of 1 min.
Note that the add LCL module is used here, which utilizes the optional LCL data. With the additional information about the LCL, the lowest potential cloud layer can be estimated. This supplements the CBH data of the lowest cloud layer, filling in gaps that may occur in the ceilometer data. This ultimately leads to a more complete virga and cloud mask in the Virga-Sniffer output. Nevertheless, the use of the module is optional, since the main CBH information is provided by the ceilometer. To use the full potential of the Virga-Sniffer, the LCL is included here. The LCL is calculated from surface observations of atmospheric pressure, temperature, and humidity from the meteorological observation station on the RV Meteor using the method of Romps (2017) built into the utilities of the Virga-Sniffer package.
3.2 Precipitation and cloud detection
After the preprocessing of CBH, the radar reflectivity values are used for the initial step of detecting precipitation, clouds, and cloud top heights (CTH) (see Fig. 2, orange box 2). Figure 3 shows a demonstration example for precipitation, virga, and cloud detection. A Boolean mask is created, which yields a true value if the radar reflectivity value is not a nan value, meaning any kind of particles are detected by the radar at the given time and altitude. This mask is successively iterated, starting from each cloud base in both an up- and downward direction. To do this, the values of the cloud base must be mapped to the radar range-gate resolution. Precipitation events are generally detected downwards from the range gate containing the measured cloud base, whereas clouds are detected upwards from the next higher range gate. This step is referred to as range-gate mapping in Fig. 2.
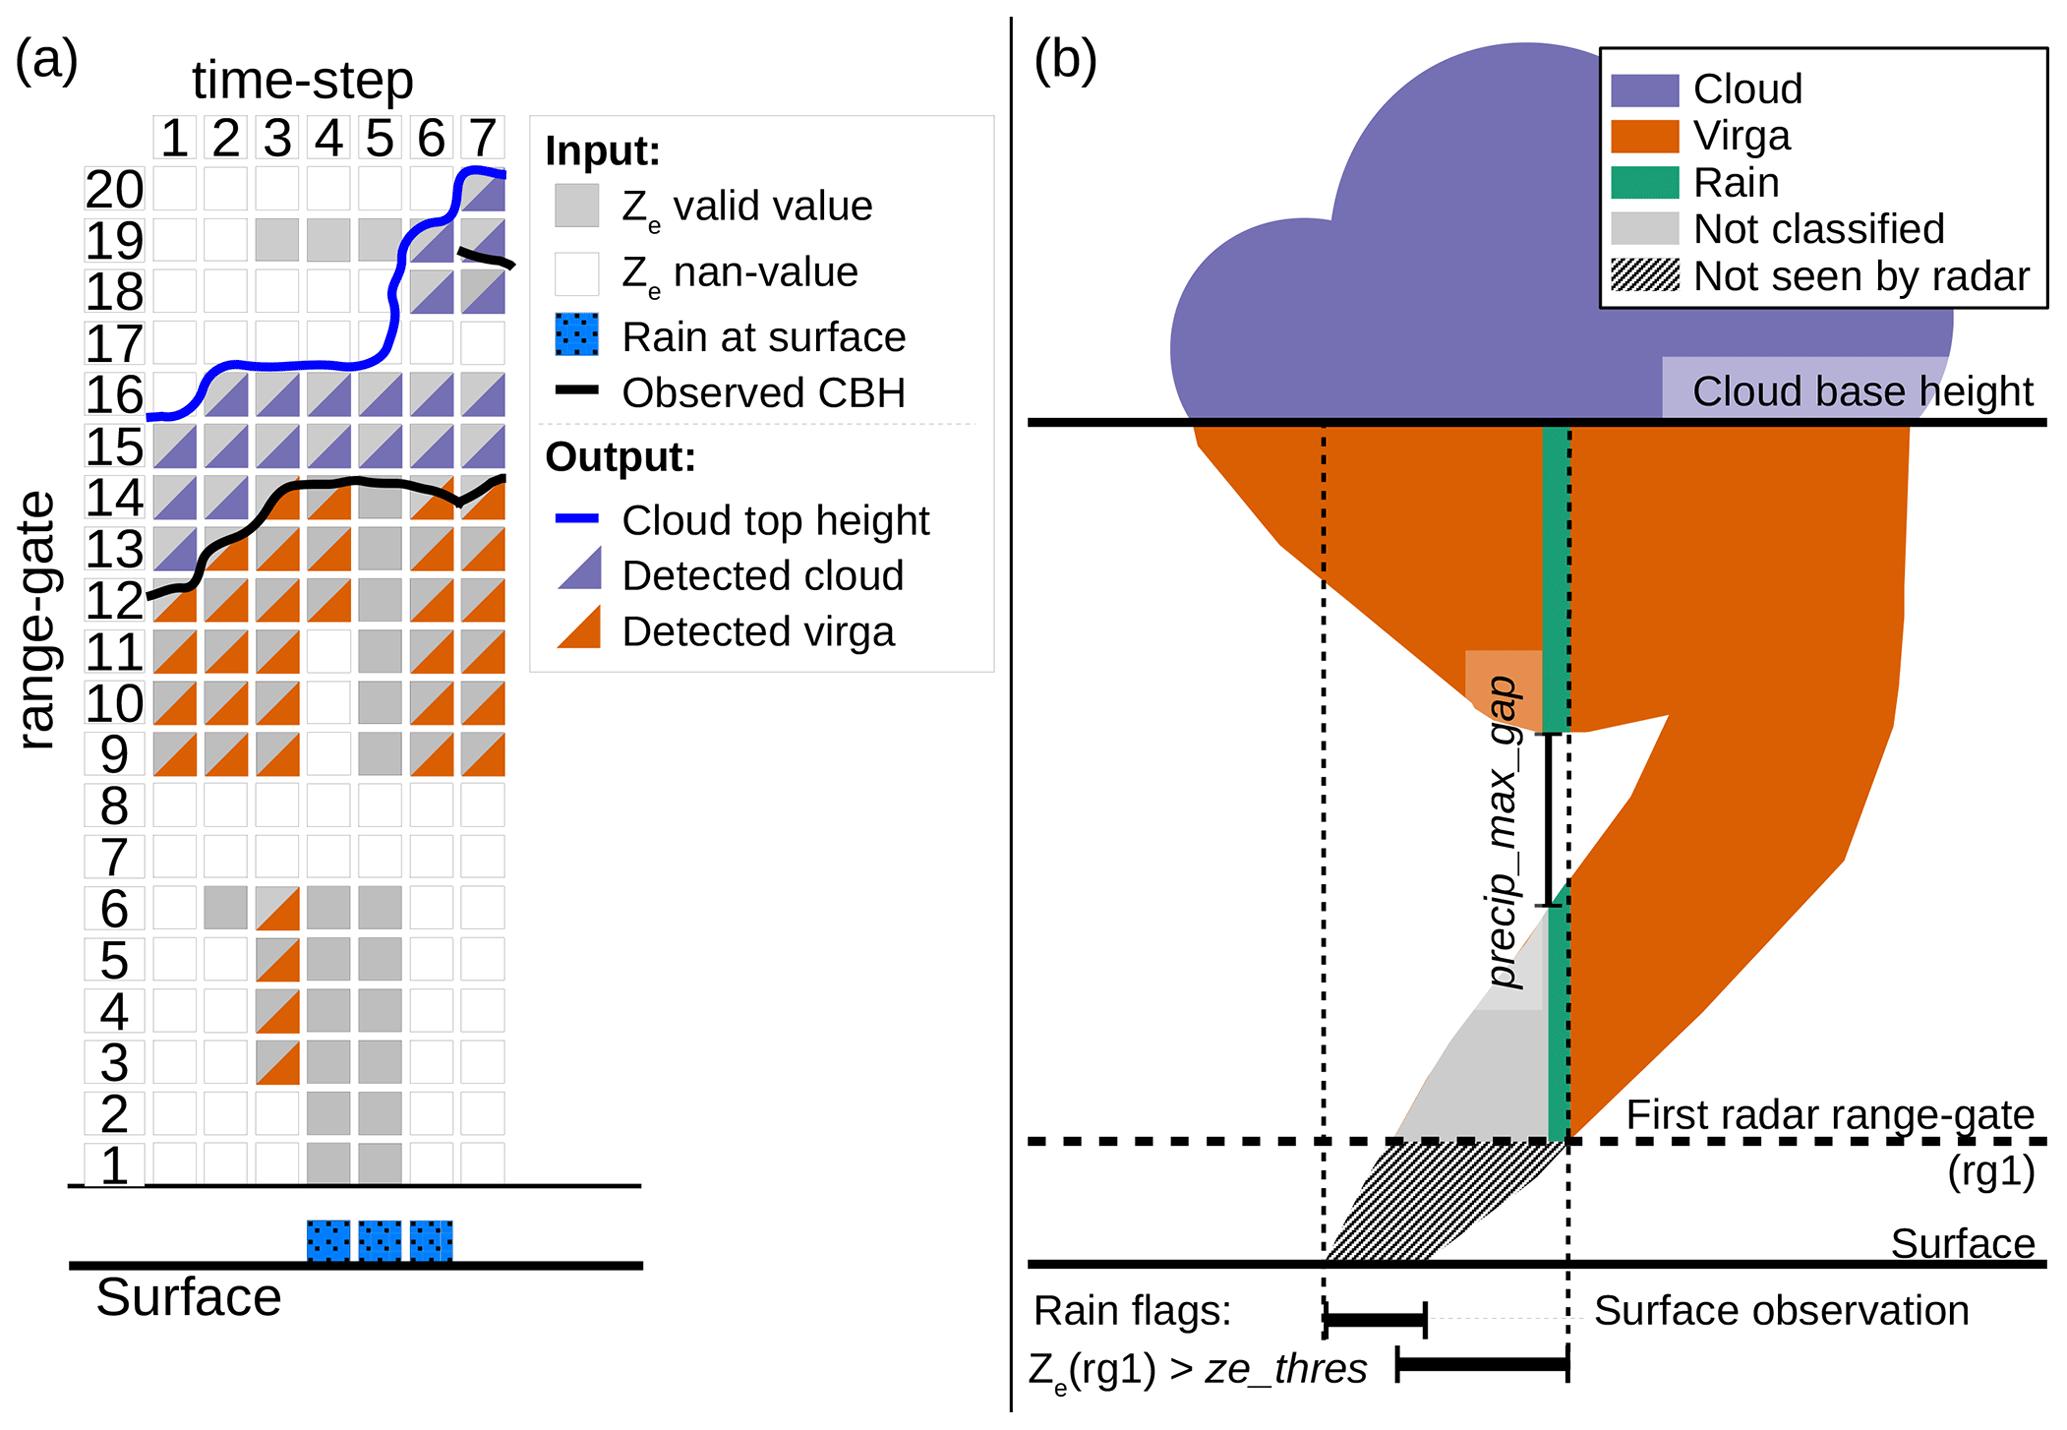
Figure 3Illustration (not to scale) of cloud, precipitation and virga detection from radar reflectivity Ze, surface rain flag, and cloud base height data, corresponding to step 2 and 3 of Fig. 2. In panel (a) the behavior of the Virga-Sniffer in certain situations is shown in detail. Panel (b) shows the benefit and influence of different rain flags, as well as the threshold value of the rain gaps allowed (precip_max_gap).
Clouds are detected from iterating the radar reflectivity mask from the cloud base upward, until a gap (nan value in radar reflectivity) larger than the threshold cloud_max_gap, of 150 m by default, occurs (see Appendix A and Fig. 3). The CTH value is assigned to the radar range-gate value (top of range gate) of the last valid radar reflectivity value below the gap. Note that the detection of clouds is always limited to the area between cloud base and top, meaning virga or precipitation cannot be detected in this range.
Precipitation is detected at each range gate of the radar reflectivity mask iterating downward from CBH until a gap occurs, which is larger than the threshold precip_max_gap of 700 m by default (see Appendix A and Fig. 3). This threshold is large by choice, to also capture precipitation which can be observed from tilted fall streaks advected to the radar viewing volume by wind shear. At the same time, the threshold is still small enough to mask out any clutter or a lower cloud layer when the cloud layers are vertically well separated. Since the detection of clouds and precipitation with the Virga-Sniffer is carried out for individual profiles and no horizontal linking (in the temporal sense) of these profiles takes place, the handling of tilted fall streaks is one of the most challenging aspects and is realized exclusively by the threshold value of the allowed gap size. The challenges associated with these thresholds (cloud_max_gap and precip_max_gap) are discussed in Sect. 3.6. In Appendix B2 the sensitivity of the Virga-Sniffer results to different settings of these two thresholds is analyzed.
A special case occurs when there are no gaps in radar reflectivity between some cloud base layers, which happens when precipitation originating from a higher cloud falls into a lower layer. In the default setting, the lowest CBH is retained, and higher CBH layers are omitted from the processing because no distinction can be made between clouds and precipitation. The lowest CBH in such an event is therefore assigned to initialize precipitation and cloud detection. Note that the handling of this kind of event can be changed to assign the highest cloud base instead by the configuration flag cbh_connect2top (see Appendix A).
Finally, the detected cloud top values are smoothed as a last step after the processing. The smoothing is applied in the same way as the cloud base by utilizing a rolling median filter of a 1 min window size by default (cbh_smooth_window). After this processing step, an index mapping of CTH and CBH values to the upper edge of radar range-gate heights is conducted for further processing. This mapping is used to separate the cloud, precipitation, and virga masks for the cloud layers respectively, so that the masks can be narrowed down to individual cloud layers.
3.3 Virga detection
Until this point, the identification of clouds and precipitation is solely based on the CBH and radar reflectivity (see Fig. 2, orange box 3a). To actually detect virga instead of precipitation that might not fully evaporate in the subcloud layer, surface rain information is required. Based solely on CBH and radar reflectivity, this is achieved by testing the lowest range-gate reflectivity value against the ze_thres threshold of 0 dBz by default (see Appendix A). If the radar reflectivity is larger, the precipitation is assumed to reach the surface. These situations are therefore excluded from the virga detection mask.
Virga and cloud detection is sketched in Fig. 3 to demonstrate the usage of thresholds handling gaps in the radar reflectivity signal. The specific cases of Fig. 3a are as follows:
-
time step = 1. This is the standard case when precipitation and cloud are detected from the observed CBH. No further considerations have to be made.
-
time step = 2. The gap (range gate (rg) 7–8) is smaller than the maximum allowed gap for virga (precip_max_gap = 700 m) to count rg 6 as virga, but rg 6 is filtered since the requirement of a minimum length of two rg's is not met, which is a requirement of the virga mask refinement based on the minimum_rangegate_number threshold (see Sect. 3.4 and Appendix A).
-
time step = 3. The gap (rg 7–8) is smaller than the threshold; therefore rg 3–6 are counted as virga. In addition, the gap (rg 17–18) is larger than the maximum allowed gap for clouds (cloud_max_gap = 150 m); therefore rg 19 is not counted as cloud. In this case, rg 19 could be a cloud, but since the Virga-Sniffer detection is tied to the CBH input data, rg 19 cannot be identified. Missing information about the second cloud layer can occur if the ceilometer signal is strongly attenuated by the clouds of the lower layer or by strong precipitation.
-
time step = 4. The gap (rg 7–11) is larger than the threshold; therefore rg 1–6 are not counted as virga. Therefore, the rain flag at the surface has no effect, as the virga detected in rg 12–14 does not reach the first rg.
-
time step = 5. Precipitation is detected from rg 1–14 as the gap (rg 7–8) is smaller than the threshold. Due to the rain flag at the surface (either by the additional data of surface rain flag or by exceeding the radar reflectivity threshold in the lowest radar rg, ze_thres = 0 dBz), no virga is assigned in this profile.
-
time step = 6. This is the same as time step = 1. In addition, the gap (rg 17) is smaller than the maximum allowed gap for clouds; therefore rg 18–19 are counted as cloud. The surface rain flag does not lead to a reclassification of the detected virga towards rain, as the first rg has no data.
-
time step = 7. This is the same as time step = 6. In addition, another CBH layer is observed right below rg 19. This CBH layer is not considered, as the gap at rg 17 is smaller than the maximum allowed gap for clouds, and it is not possible to distinguish between clouds and precipitation due to that. Therefore, the lowest CBH is assigned, as in time step = 6, to initialize the detection of clouds and precipitation, and the higher CBH is ignored by default (cbh_connect2top = false).
Figure 3b demonstrates how rain flags influence the precipitation or virga detection. Since radar observations only provide data starting at a certain height above ground, there may be an offset between the rain flag observed at the surface and the rain flag obtained from the radar signal. In Appendix B3 it is shown how the choice of rain flag affects the virga and cloud detection based on the EUREC4A data set. In addition, Fig. 3b again shows how the choice of the threshold for the maximum permissible gaps influences the detection of precipitation and the handling of tilted fall streaks.
3.4 Virga mask refinement (optional)
Cloud and precipitation detection solely based on radar reflectivity and CBH is refined by using additional data of mean Doppler velocity and surface rain flag (see Fig. 2, orange box 3b).
To mask rain events from the virga detection, the Virga-Sniffer provides two methods. The first is based on the radar reflectivity value at the lowest range gate (here: 300 m), which is compared to the threshold ze_thres of 0 dBz as described in Sect. 3.3. If additional data of surface rain detection are included, this can be incorporated to refine the masking of rain events. In this study, surface rain detection is acquired from the precipitation sensor of the ship's meteorological station.
By using the radar mean Doppler velocity, two additional refinements of the virga mask can be enabled. Firstly, to restrict virga to only falling hydrometeors, each data point is checked against the threshold vel_thres of 0 m s−1 by default. Data points with positive values of mean Doppler velocity (upward) are omitted from the virga mask (mask_vel; see Fig. A1). Secondly, to mask clutter events, the virga mask is restricted to data points fulfilling the following dependency:
where Vm and Ze denotes the input mean Doppler velocity (m s−1) and radar reflectivity factor (dBz), respectively. For convenience, Ze is scaled by 60 dBz, as −60 dBz is the minimum valid reflectivity value of LIMRAD94 (for the radar chirp settings used, see Table 2). The slope and intercept of the threshold line are denoted as m (m s−1) and c (m s−1), respectively. A data point is considered virga only if Eq. (1) is fulfilled. With default configuration of clutter_m (m=4) and clutter_c (), unusual combinations of low Ze and Vm are filtered (mask_clutter; see Fig. A1).
In addition to the clutter mask based on the mean Doppler velocity, isolated precipitation events spanning fewer range gates than the threshold minimum_rangegate_number of two by default are excluded. This removes false positive detection due to clutter, which cannot be identified by the combination of high mean Doppler velocity and low radar signal (see Fig. 3, time step = 2).
3.5 Virga-Sniffer output examples
Example cases of virga detection from RV Meteor observations during EUREC4A, for which all outlined Virga-Sniffer workflow steps were applied, are shown in Fig. 4. The case study examples illustrate the applicability of the Virga-Sniffer to different cloud scenarios, such as stratiform cloud layers with virga and a precipitation system (“flower” type, following the cloud organization pattern naming convention of Stevens et al., 2019) with virga (Fig. 4a and b), stratiform cloud layers producing virga (Fig. 4a–d), and virga originating from trade wind cumuli in different development stages (Fig. 4a–f) including multilayer cloud situations.
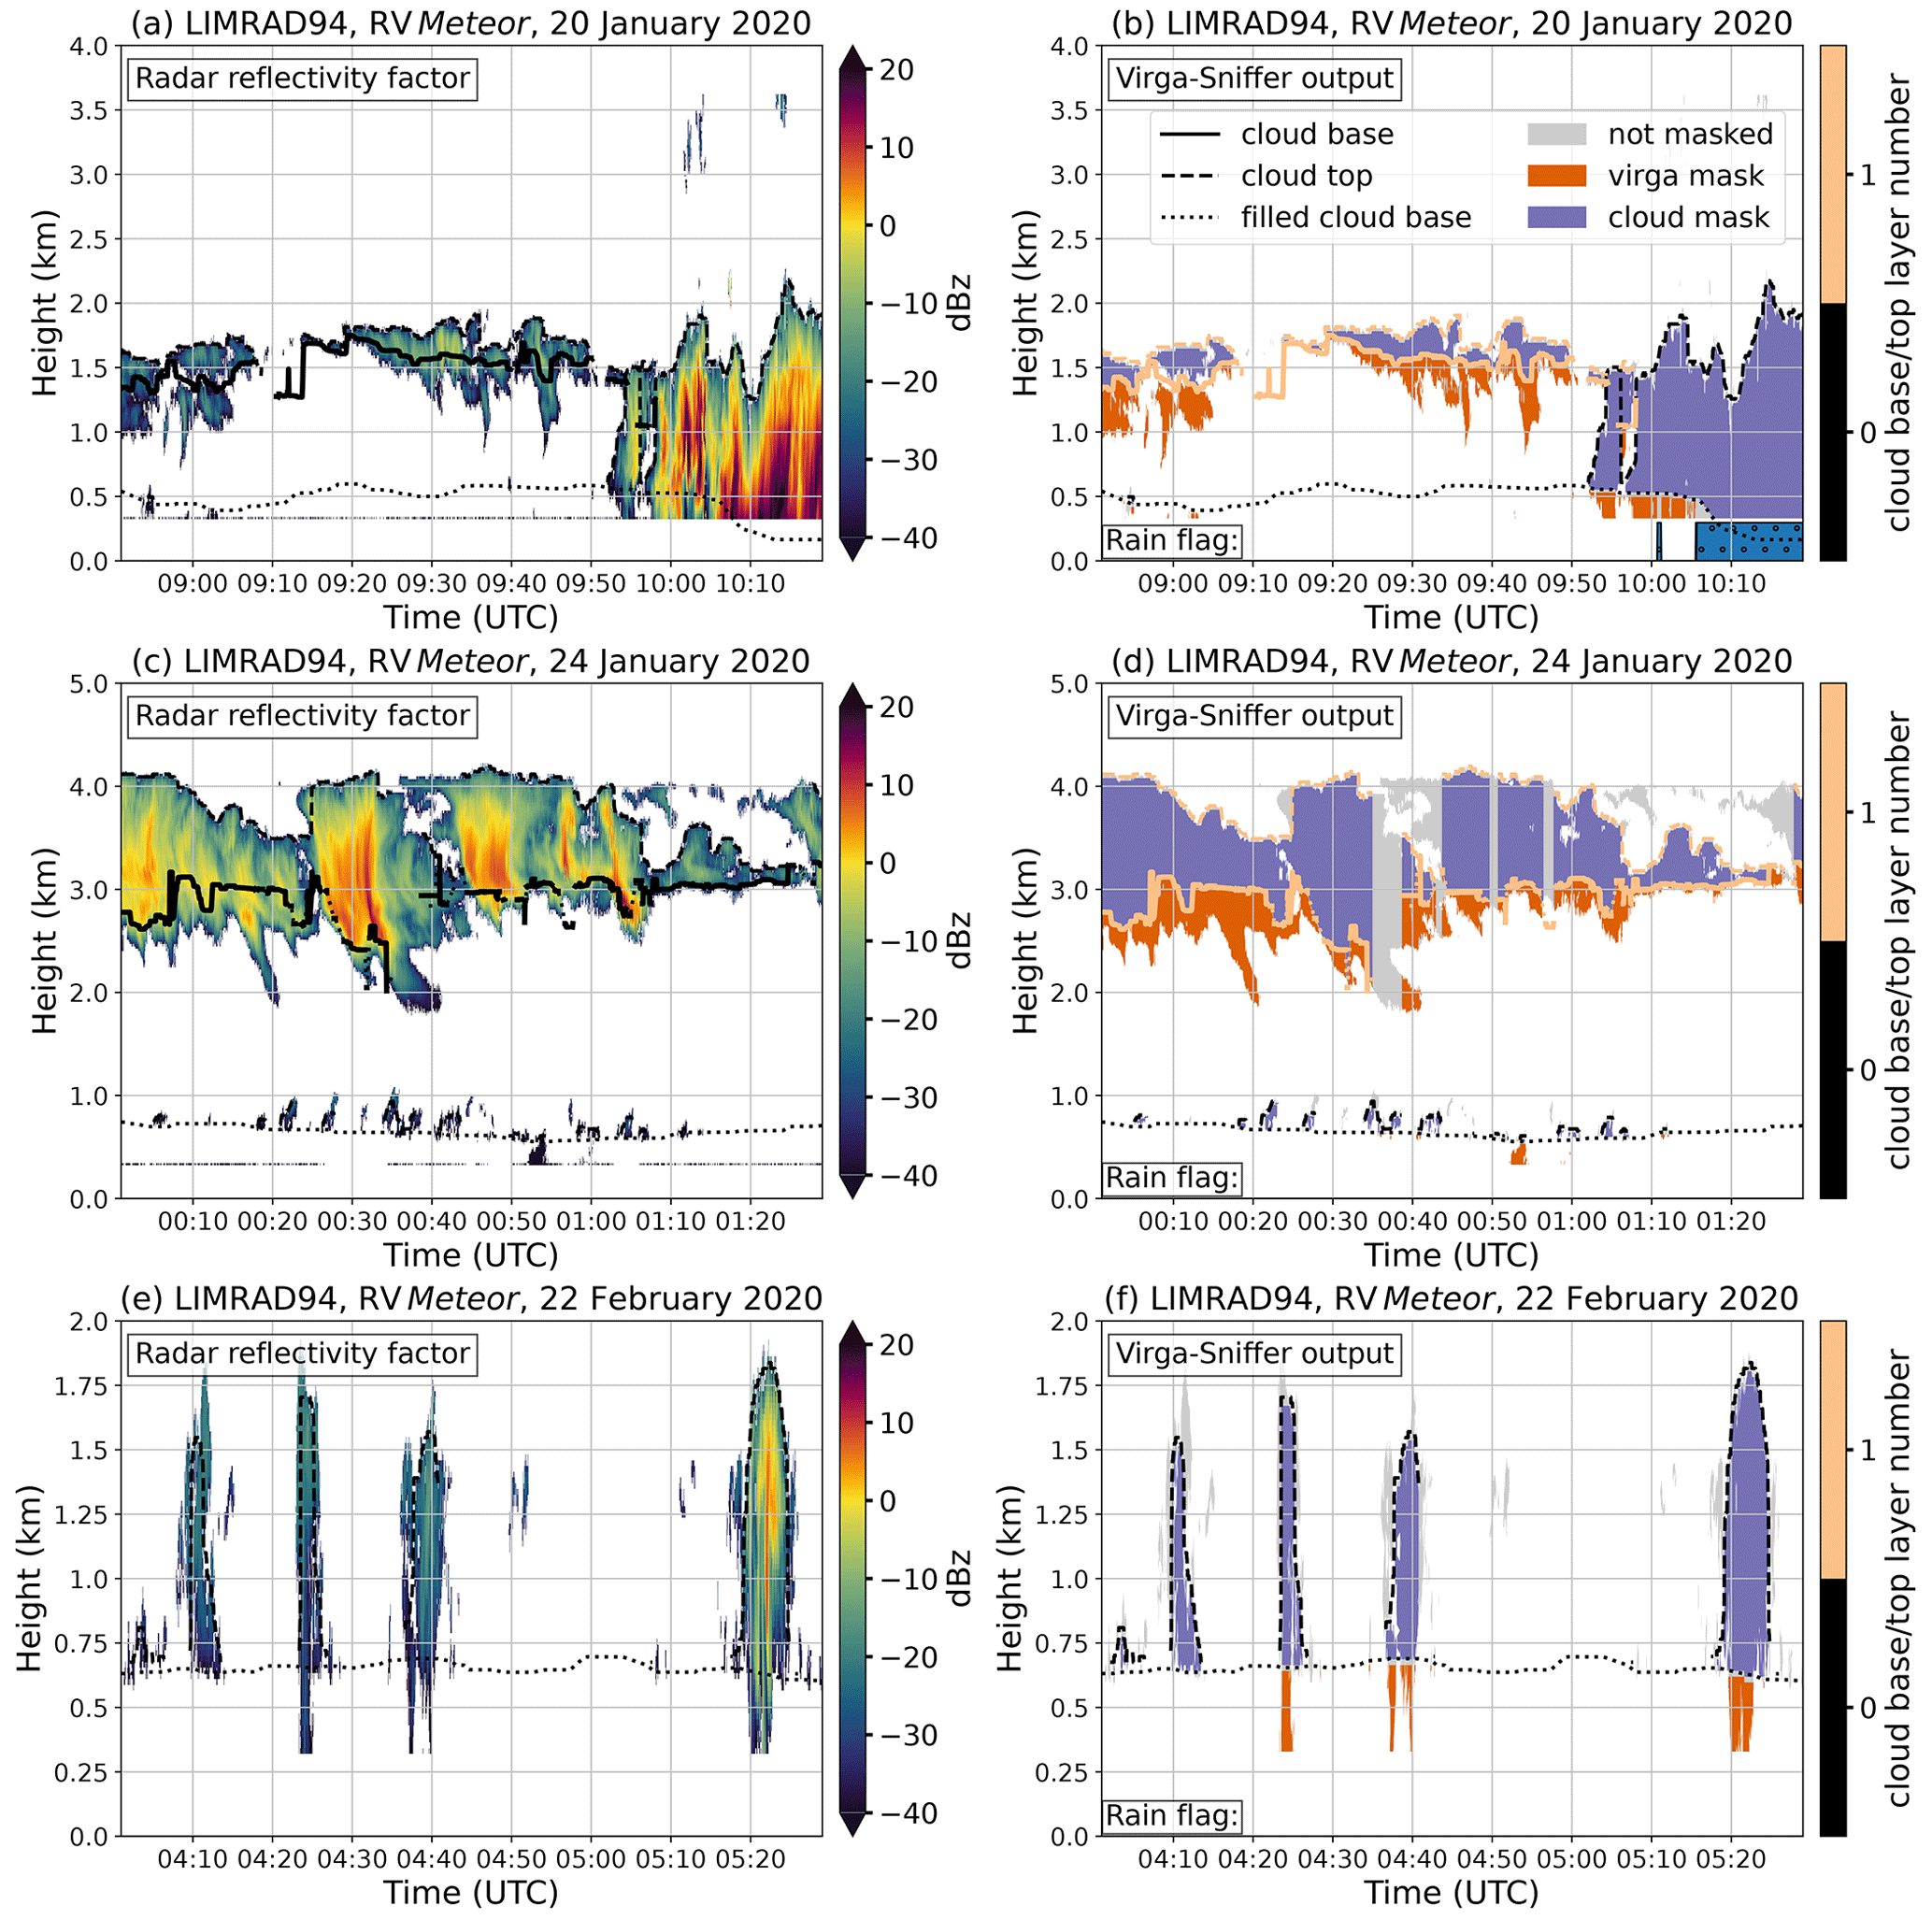
Figure 4LIMRAD94 reflectivity factor Ze (a, c, e), and Virga-Sniffer output for different cloud situations during EUREC4A based on RV Meteor observations (b, d, f). The color bar on the right side panels denotes the maximum number of cloud layers detected during the case study days (count starts at zero for the lowest layer). Panels (a) and (b) show stratiform cloud layers with virga and a warm precipitation system, panels (c) and (d) stratiform cloud layers with virga, and panels (e) and (f) trade wind cumuli with virga. The dotted line labeled “filled cloud base” refers to either LCL values which fill in gaps during the CBH preprocessing or CBH gaps which are filled by interpolation (see Sect. 3.1 and Appendix A).
For easy usability of the Virga-Sniffer results, the virga and cloud detection masks are stored in an output data set as Boolean flags with the same dimensions (time, height) as the radar reflectivity input data. In addition, the processed cloud and virga base and top heights are stored, as well as some basic characteristics such as cloud depth and virga depth for each profile. When calculating virga depths, the maximum geometric extent is the difference between the initial values of the virga base and top heights. The output variable is called virga_depth_maximum_extent and contains the gaps allowed in the detection. Using this value to calculate volumetric features (e.g., LWP) can lead to errors because the liquid water content is then distributed within the gaps that do not physically contain water. Instead, the output variable virga_depth should be used for calculating LWP, as all virga gaps are subtracted in this variable.
3.6 Limitations
The virga detection is strongly tuned and manually evaluated for best performance with the EUREC4A RV Meteor data set (see Sect. 2) and relies on threshold-based tests which might not work in other measurement conditions or different instrumental setups (see Appendix A). Nevertheless, major caveats using this version of the Virga-Sniffer are outlined in this section.
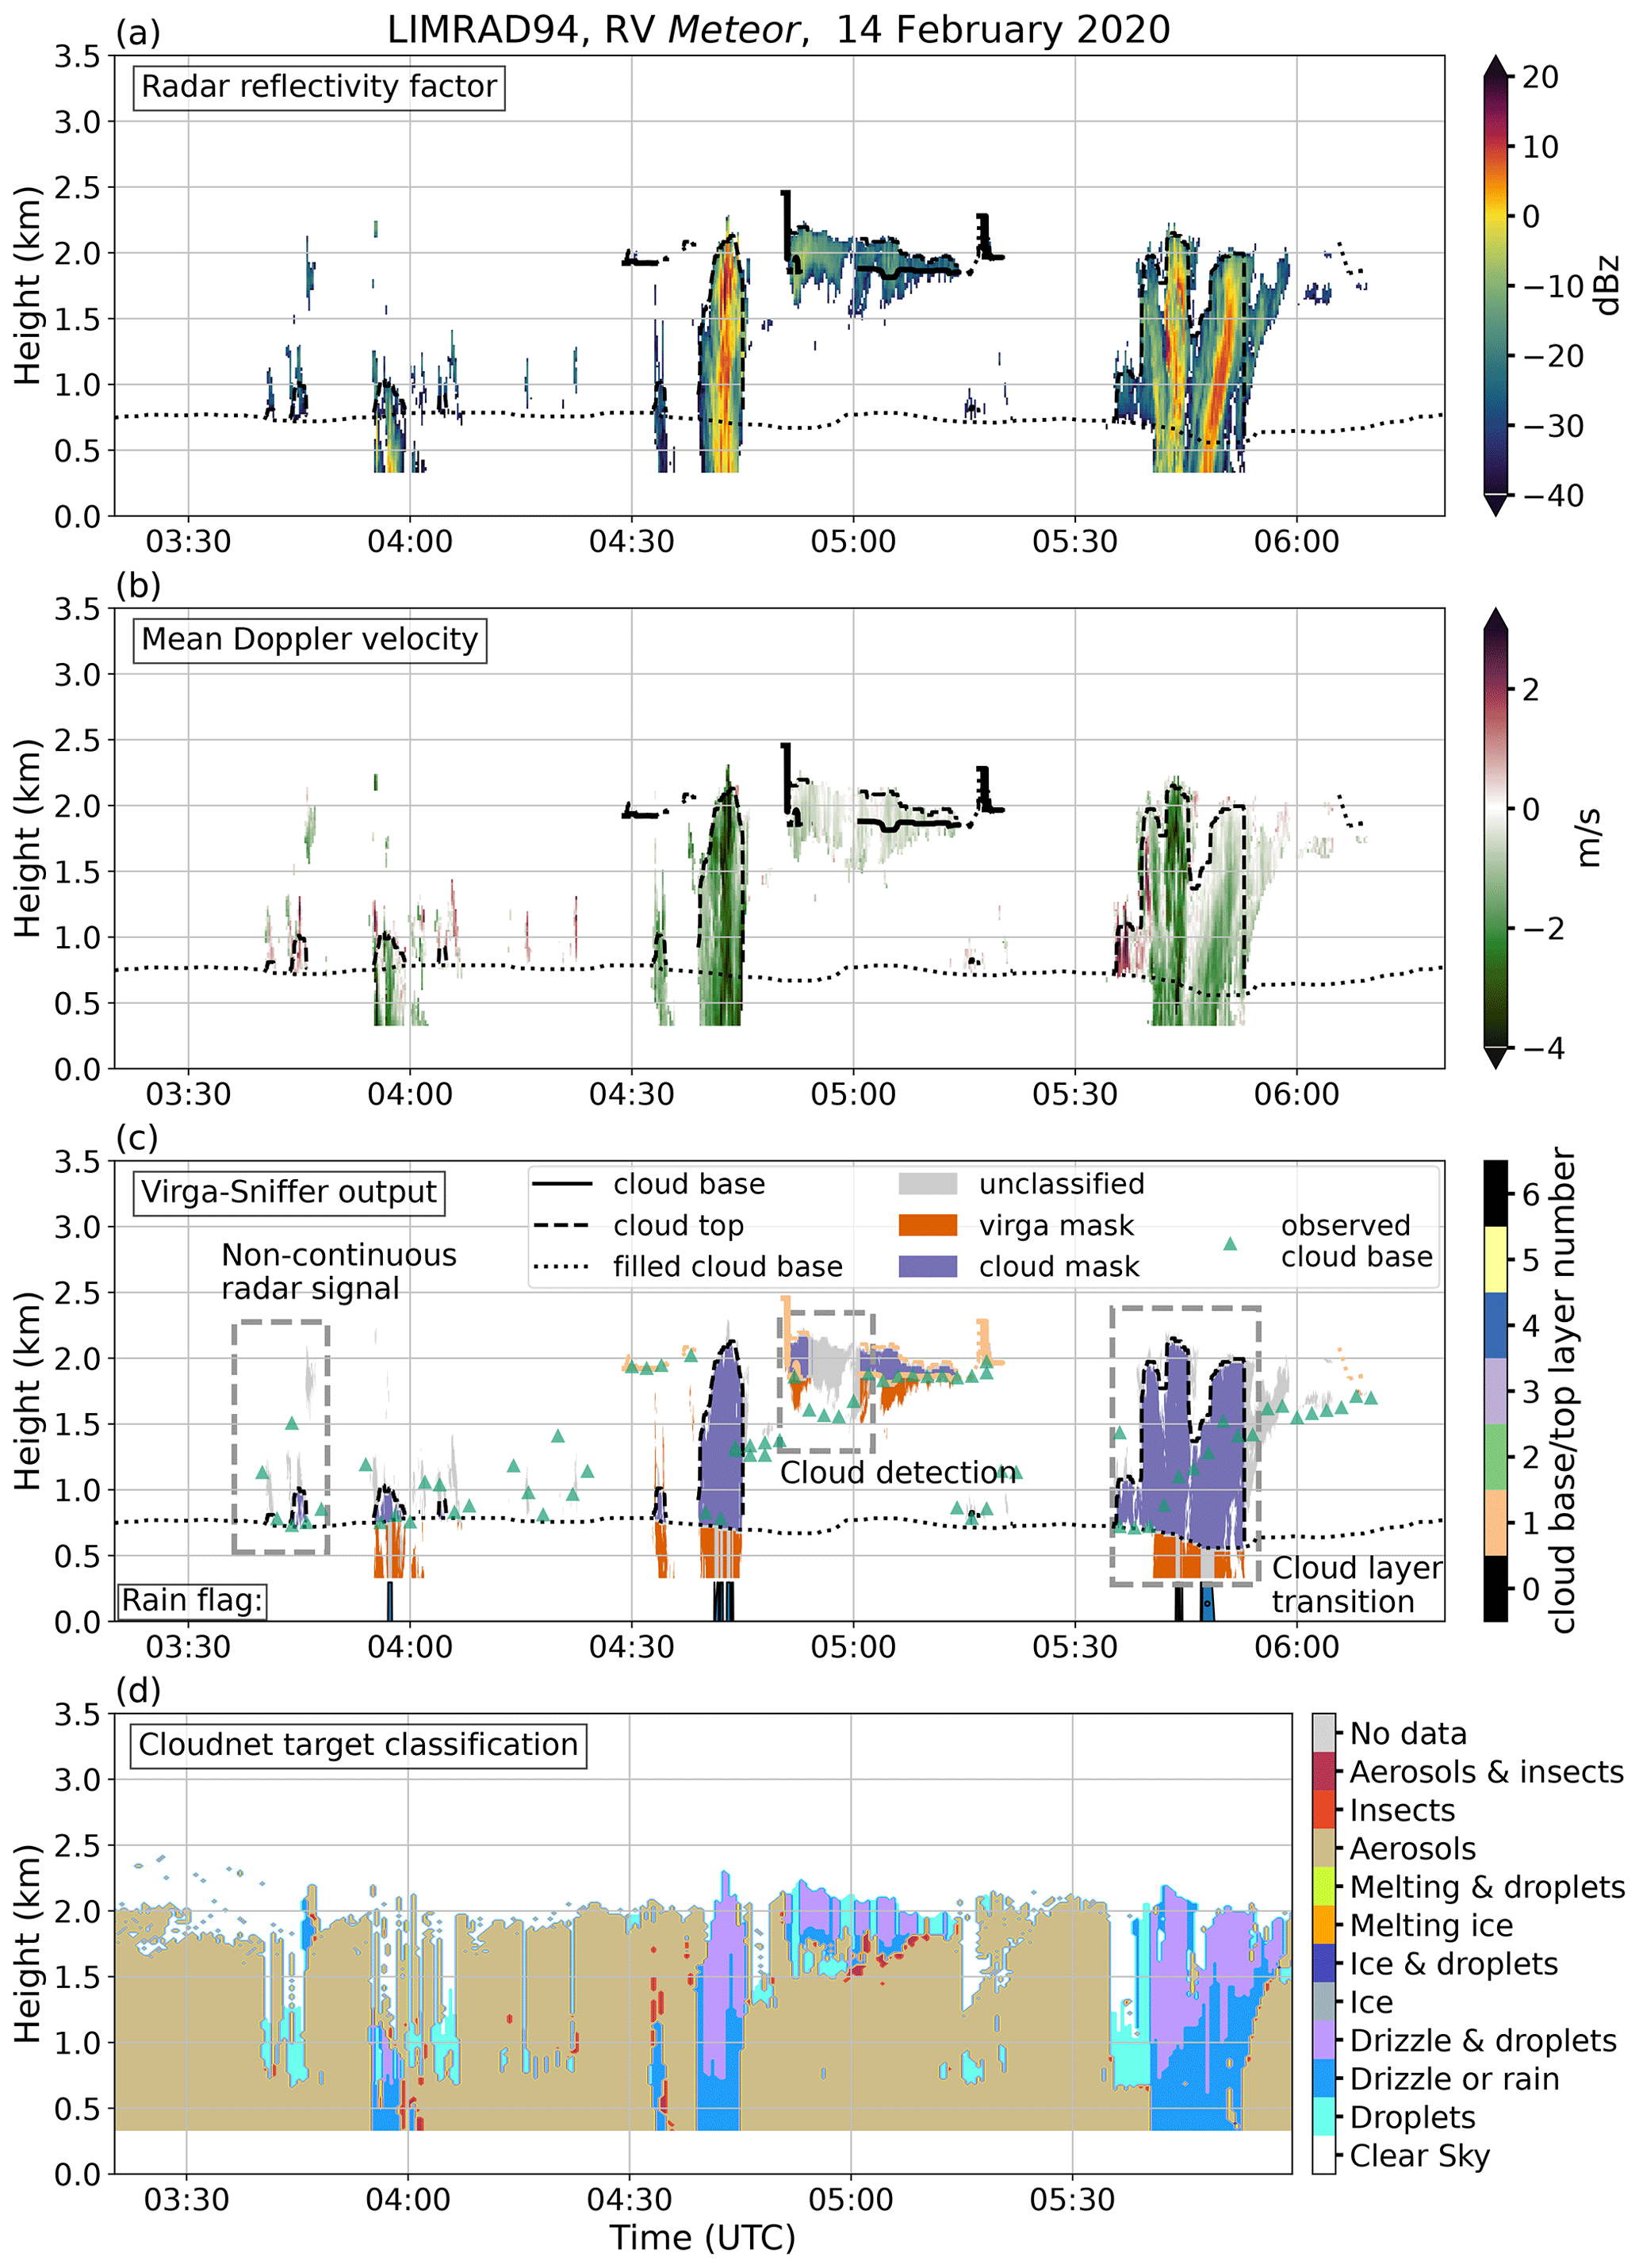
Figure 5(a) LIMRAD94 reflectivity factor, (b) mean Doppler velocity, (c) Virga-Sniffer output, and (d) CloudNet target classification for 14 February 2020 as observed from RV Meteor. The Virga-Sniffer output is marked (dashed boxes) to reveal some caveats which include non-continuous radar signals (03:45 UTC), cloud detection (05:00 UTC), and multilayer cloud transition (05:45 UTC). For comparison, the observed CBH from the ceilometer is shown in panel (c). The color bar denotes the number of cloud layers detected on that day (count starts at zero for the lowest layer).
Precipitation below CBH, which does not reach the surface, is considered virga. Data points classified as virga are assigned to a certain CBH. In the case of a vertical non-continuous radar signal (see Fig. 5 at around 03:45 UTC), it is uncertain if the signal originates from a cloud or from precipitation. In the case shown in the figure, the signal is unclassified, as the gaps to the cloud base below, at LCL, are larger than the maximum allowed gap for precipitation. In this situation, there is another cloud layer in an altitude larger than 4 km. In the hypothetical case, these cloud bases were less separated in the vertical, or the maximum gap thresholds were larger, so these signals would be classified as virga or cloud by chance, which is potentially false detection. The virga mask refinement using the radar mean Doppler velocity helps to mitigate false detection of clouds and precipitation. Anyway, this caveat can be circumvented completely by not allowing for gaps in virga and clouds, which can be achieved by setting the maximum allowed gaps to zero (precip_max_gap and cloud_max_gap; see Sect. 3.2 and Appendix A). Doing this would however mean to filter out virga events in strongly tilted fall streaks or those that are slightly disconnected from the observed cloud base.
If clouds are present in multiple levels, virga detection is challenging, as only the cloud base is known a priori and the vertical extent of the precipitating cloud is not. The Virga-Sniffer includes cloud top detection, which is heavily sensitive to the threshold of maximum allowed gaps in the cloud detection. This raises two issues if upper-layer clouds are present. First, the maximum allowed gap is too small: due to uncertainties in observational CBH or radar reflectivity data, misalignment of both data, or the coarse resolution of radar range gates, ceilometer-detected cloud bases might not connect directly to a valid radar signal. Assume the CBH value is below the first range gate with a valid radar signal, and the signal gap is larger than the maximum allowed gap (as it is the case in Fig. 5 at around 05:00 UTC): the cloud will not be detected, and no cloud top will be assigned. In turn, these range gates, which are not marked as cloud due to that, could potentially be marked as virga if there was a higher-level cloud with precipitation (this is not the case in Fig. 5). Second, the maximum allowed gap between range gates with a valid radar signal is too large: in this case, clouds will expand over the precipitation from a potential upper-layer cloud when they are close to the lower-layer cloud top height (not the case in Fig. 5 but illustrated in Fig. 3 time step 7).
The data points of radar reflectivity might vertically connect through multiple layers of clouds defined by the ceilometer observed CBH. This is the case for example in Fig. 5 at around 05:45 UTC. In this case, the observed cloud base (triangles) is different from the LCL, but only the LCL is retained in the Virga-Sniffer output. During processing with the Virga-Sniffer, with the default setting, the cloud bases are assumed to be connected and only the lowest CBH layer is retained. But, the handling of this situation can be changed by the configuration flag cbh_connect2top (see Appendix A). Retaining the highest CBH layer by setting the cbh_connect2top flag to true however raises an issue: the result of the virga mask might show sudden jumps of virga extent if gaps in layers of cloud base height occur (see also Fig. B1). These gaps might occur when the ceilometer beam is attenuated by the lower-level cloud to a large extent. Gaps in ceilometer data can be filled by increasing the layer filling threshold to increase the coverage of upper-layer clouds but might result in false positive detection. In sum, it is challenging to define cloud bases in precipitating clouds, especially if multiple layers of clouds cannot easily be disentangled from the observations. This situation is likely the source of most false positive virga detections. The most conservative option is setting the cbh_connect2top flag to false (default), to mitigate this issue.
The limitations identified in this section strongly depend on the input data and atmospheric situation. They can occur at any time. This section is intended to alert potential users of the software of these pitfalls, which may occur to varying degrees in their data set. To be more precise, the issues with noncontinuous radar signal and cloud detection originate from the fact that (i) CBH data might be incomplete and (ii) the radar reflectivity might have some gaps if very small cloud droplets are not seen by the radar, which are however detected by the ceilometer. The cloud layer transition problem is a bit more tangible. It does not occur very often when cloud layers in the atmosphere are clearly separable (as it is mostly the case for the EUREC4A RV Meteor data set). It can become a frequent problem when cloud layers have very large height variations over the course of a measurement period and/or are vertically not well separated.
4.1 Comparison to CloudNet target classification
In order to assess the credibility of the Virga-Sniffer, a comparison to the CloudNet target classification is made for the RV Meteor observations during EUREC4A. Fig. 6 (inner ring) shows the relative frequency of occurrence of the CloudNet target classification within virga identified by the Virga-Sniffer. The outer ring gives the summarized portions of grouped target classifications such as liquid only, ice-containing, and aerosols and insects. Around 55 % of the hydrometeors within the detected virga are classified by CloudNet as liquid only, summarizing droplets, drizzle or rain, and the target class drizzle and droplets. Among these targets, only a small fraction (less than 2.5 %) corresponds to droplets, meaning the Virga-Sniffer performs well in detecting liquid precipitation. Around 33 % of the pixel identified as virga are among the ice-containing CloudNet target classes comprised of ice, ice and droplets, melting ice, or melting ice and droplets. In total, 86 % of the pixels identified as virga are classified as precipitation by CloudNet (47.7 % drizzle or rain + 4.9 % drizzle and droplets + 33 % ice). It can thus be concluded that the Virga-Sniffer also performs well in detecting ice precipitation. A small fraction of virga-pixel (2 %) are classified as clear sky by CloudNet. This can be attributed to smoothing of the input radar reflectivity and mean Doppler velocity values at precipitation edges used in the Virga-Sniffer algorithm. About 10 % of the virga pixels are CloudNet-classified as aerosols and insects.
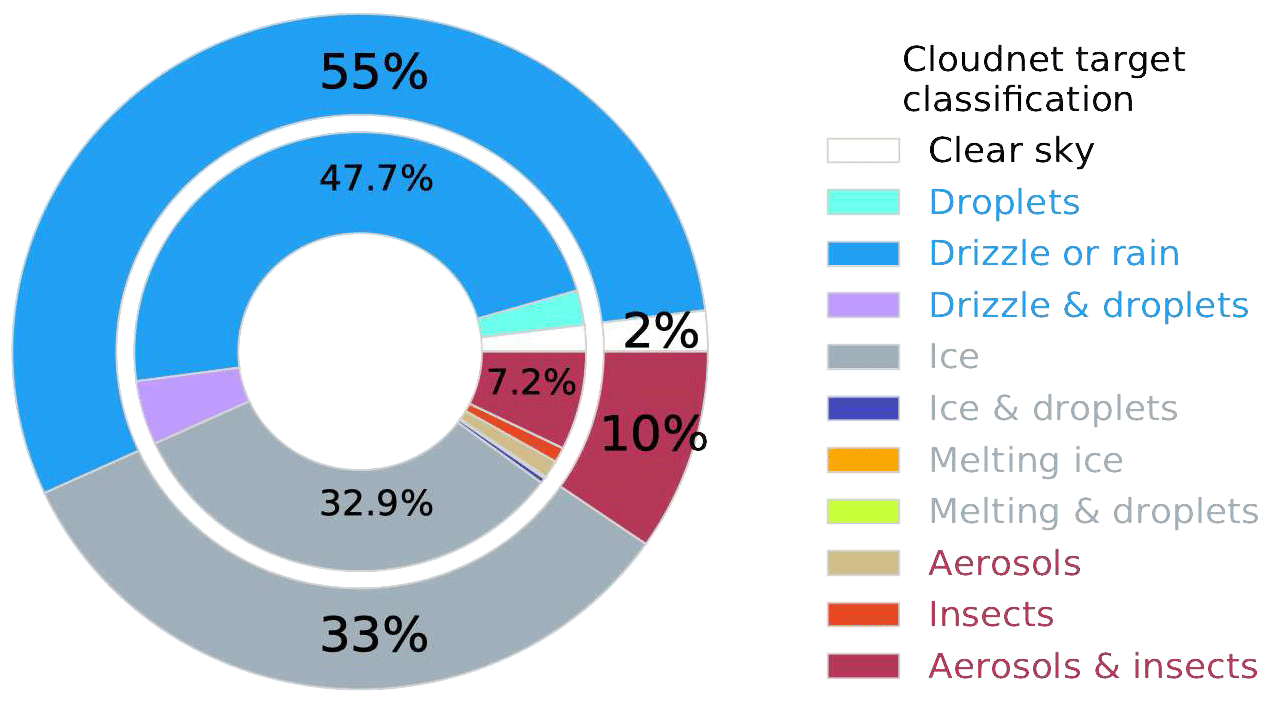
Figure 6Relative frequency of occurrence of the CloudNet target classification results within virga identified by the Virga-Sniffer. The inner ring displays the percentage of the individual CloudNet target classifications, whereas the outer ring shows the portion of grouped CloudNet target classes for liquid-only, ice-containing, and aerosols and insects indicated by the label color in the legend.
It is also possible to assess the performance of the Virga-Sniffer by only taking into account situations without rain reaching the ground, no rain observed in the lowest radar range gate, and the virga classified by the Virga-Sniffer. During these situations the Virga-Sniffer misses 15 % of cloud- and precipitation-related CloudNet targets (excluding clear sky, aerosol, or insect targets). This is mainly due to the determination of the cloud base in the Virga-Sniffer. In certain situations, the cloud base used in the Virga-Sniffer is lower than the cloud base used in CloudnetPy. As a result, data points between the cloud bases from CloudnetPy and the Virga-Sniffer are identified as the drizzle or rain CloudNet class but as cloud by the Virga-Sniffer. These situations include (i) when precipitation connects multiple layers of clouds, where the Virga-Sniffer retains the lowest CBH only (see Sect. 3.2), and (ii) when the LCL, which is usually lower than the observed CBH, replaces the lowest CBH layer of the Virga-Sniffer (see Sect. 3.1).
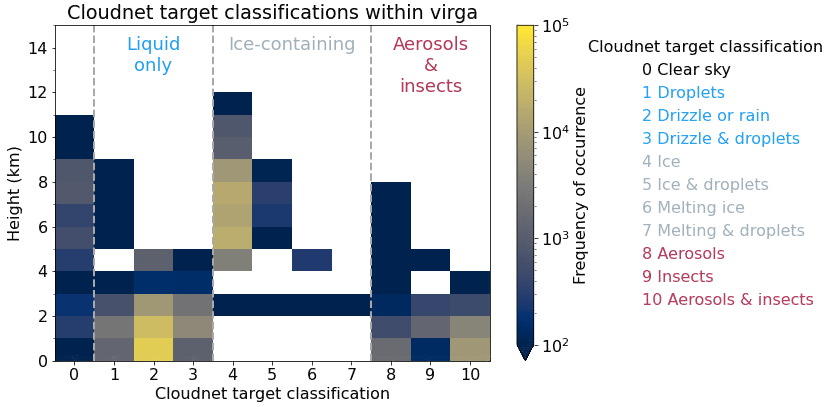
Figure 7Height-resolved frequency of occurrence of the CloudNet target classification results within virga identified by the Virga-Sniffer. The target classes are grouped into three combined target classes: liquid-only, ice-containing, and aerosols and insects.
As illustrated in the height-resolved overview of the frequency of occurrence of CloudNet target classification results within virga in Fig. 7, aerosols and insects detected within virga mostly occurred within the lowermost 2 km and at virga edges (see Fig. 5d). This unexpected CloudNet insect classification near virga edges is likely caused by strong evaporation leading to radar reflectivity values falling below a threshold value which will be investigated by us in the near future. This effect was observed on many different days during the field experiment. Figure 7 also shows that the liquid-only group of CloudNet targets occurs mostly below 3 km, while the ice-containing class was mostly detected above 5 km. The separation of the CloudNet liquid and ice classes is thus according to the mean freezing level at 4.8 km determined from radiosonde data. The majority of ice-containing targets between 4 and 10 km were observed between 14 and 16 February 2020. Those days featured continuous and deep cirrostratus and altostratus.
4.2 Virga properties
The statistics in Table 3 and the subsequent plots were created using output of the Virga-Sniffer. The results show the importance of subcloud precipitation evaporation in the winter trades of the tropical western Atlantic. In the following analysis, only clouds with bases below 4 km, i.e., below the trade inversion height (TIH), are considered. Such clouds were the focus of EUREC4A. The relation of virga depth to cloud macrophysical properties, cloud base height, and cloud depth is analyzed.
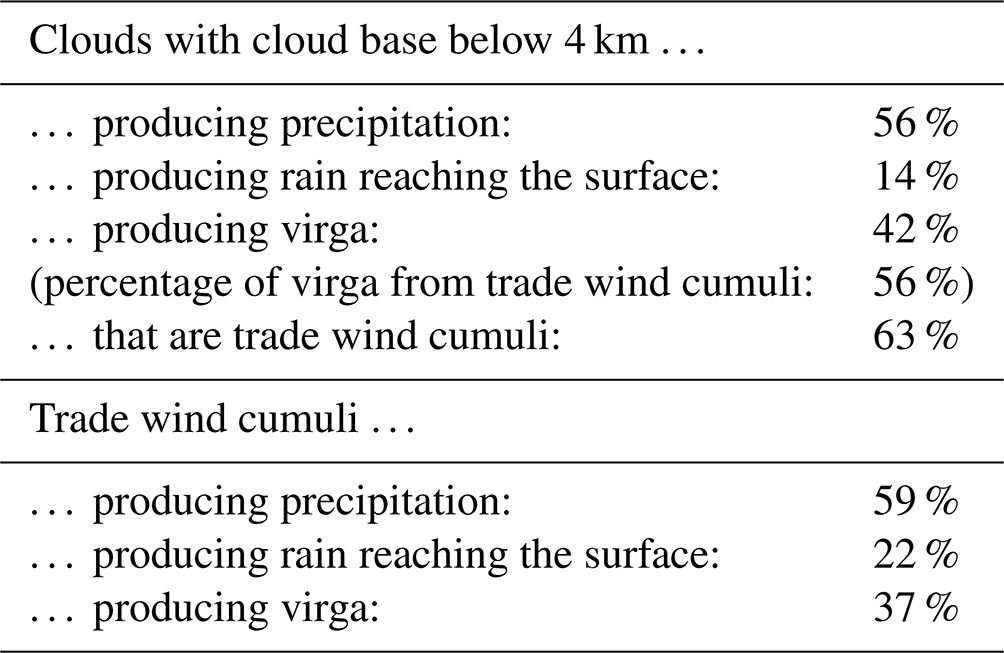
Table 3Precipitation and virga statistics. Precipitation-producing clouds are defined as clouds that either produce virga or rain that reaches the ground. Clouds with their base below 4 km make up about 73 % of the data set. Clouds with ceilometer-detected cloud base below 1 km are classified as trade wind cumuli and considered individually. These clouds make up about 46 % of the entire data set.
4.2.1 Virga statistics
About 73 % of all clouds observed on RV Meteor during EUREC4A had a cloud base below 4 km i.e., below the TIH. Of these 73 %, 56 % produced precipitation that was either detected as virga by the Virga-Sniffer or as rain reaching the ground by the WS100-UMB surface rain sensor (see Table 3). These 56 % of precipitating clouds can be subdivided into about 42 % that produced virga and around 14 % that produced rain reaching the rain sensor on board the RV Meteor. Of all clouds with bases below the trade inversion, 63 % were trade wind cumuli (CBH below 1 km). Approximately 59 % of the trade wind cumuli were precipitating, but only 22 % of all trade wind cumuli produced precipitation that was detected by the DWD rain sensor. The remaining 37 % were cumuli that produced virga. With respect to all detected virga from clouds with bases below TIH, trade wind cumuli made up about 56 %, and the remaining 44 % of virga originated from clouds with bases between 1 km and TIH.
4.2.2 Virga depth and cloud base height
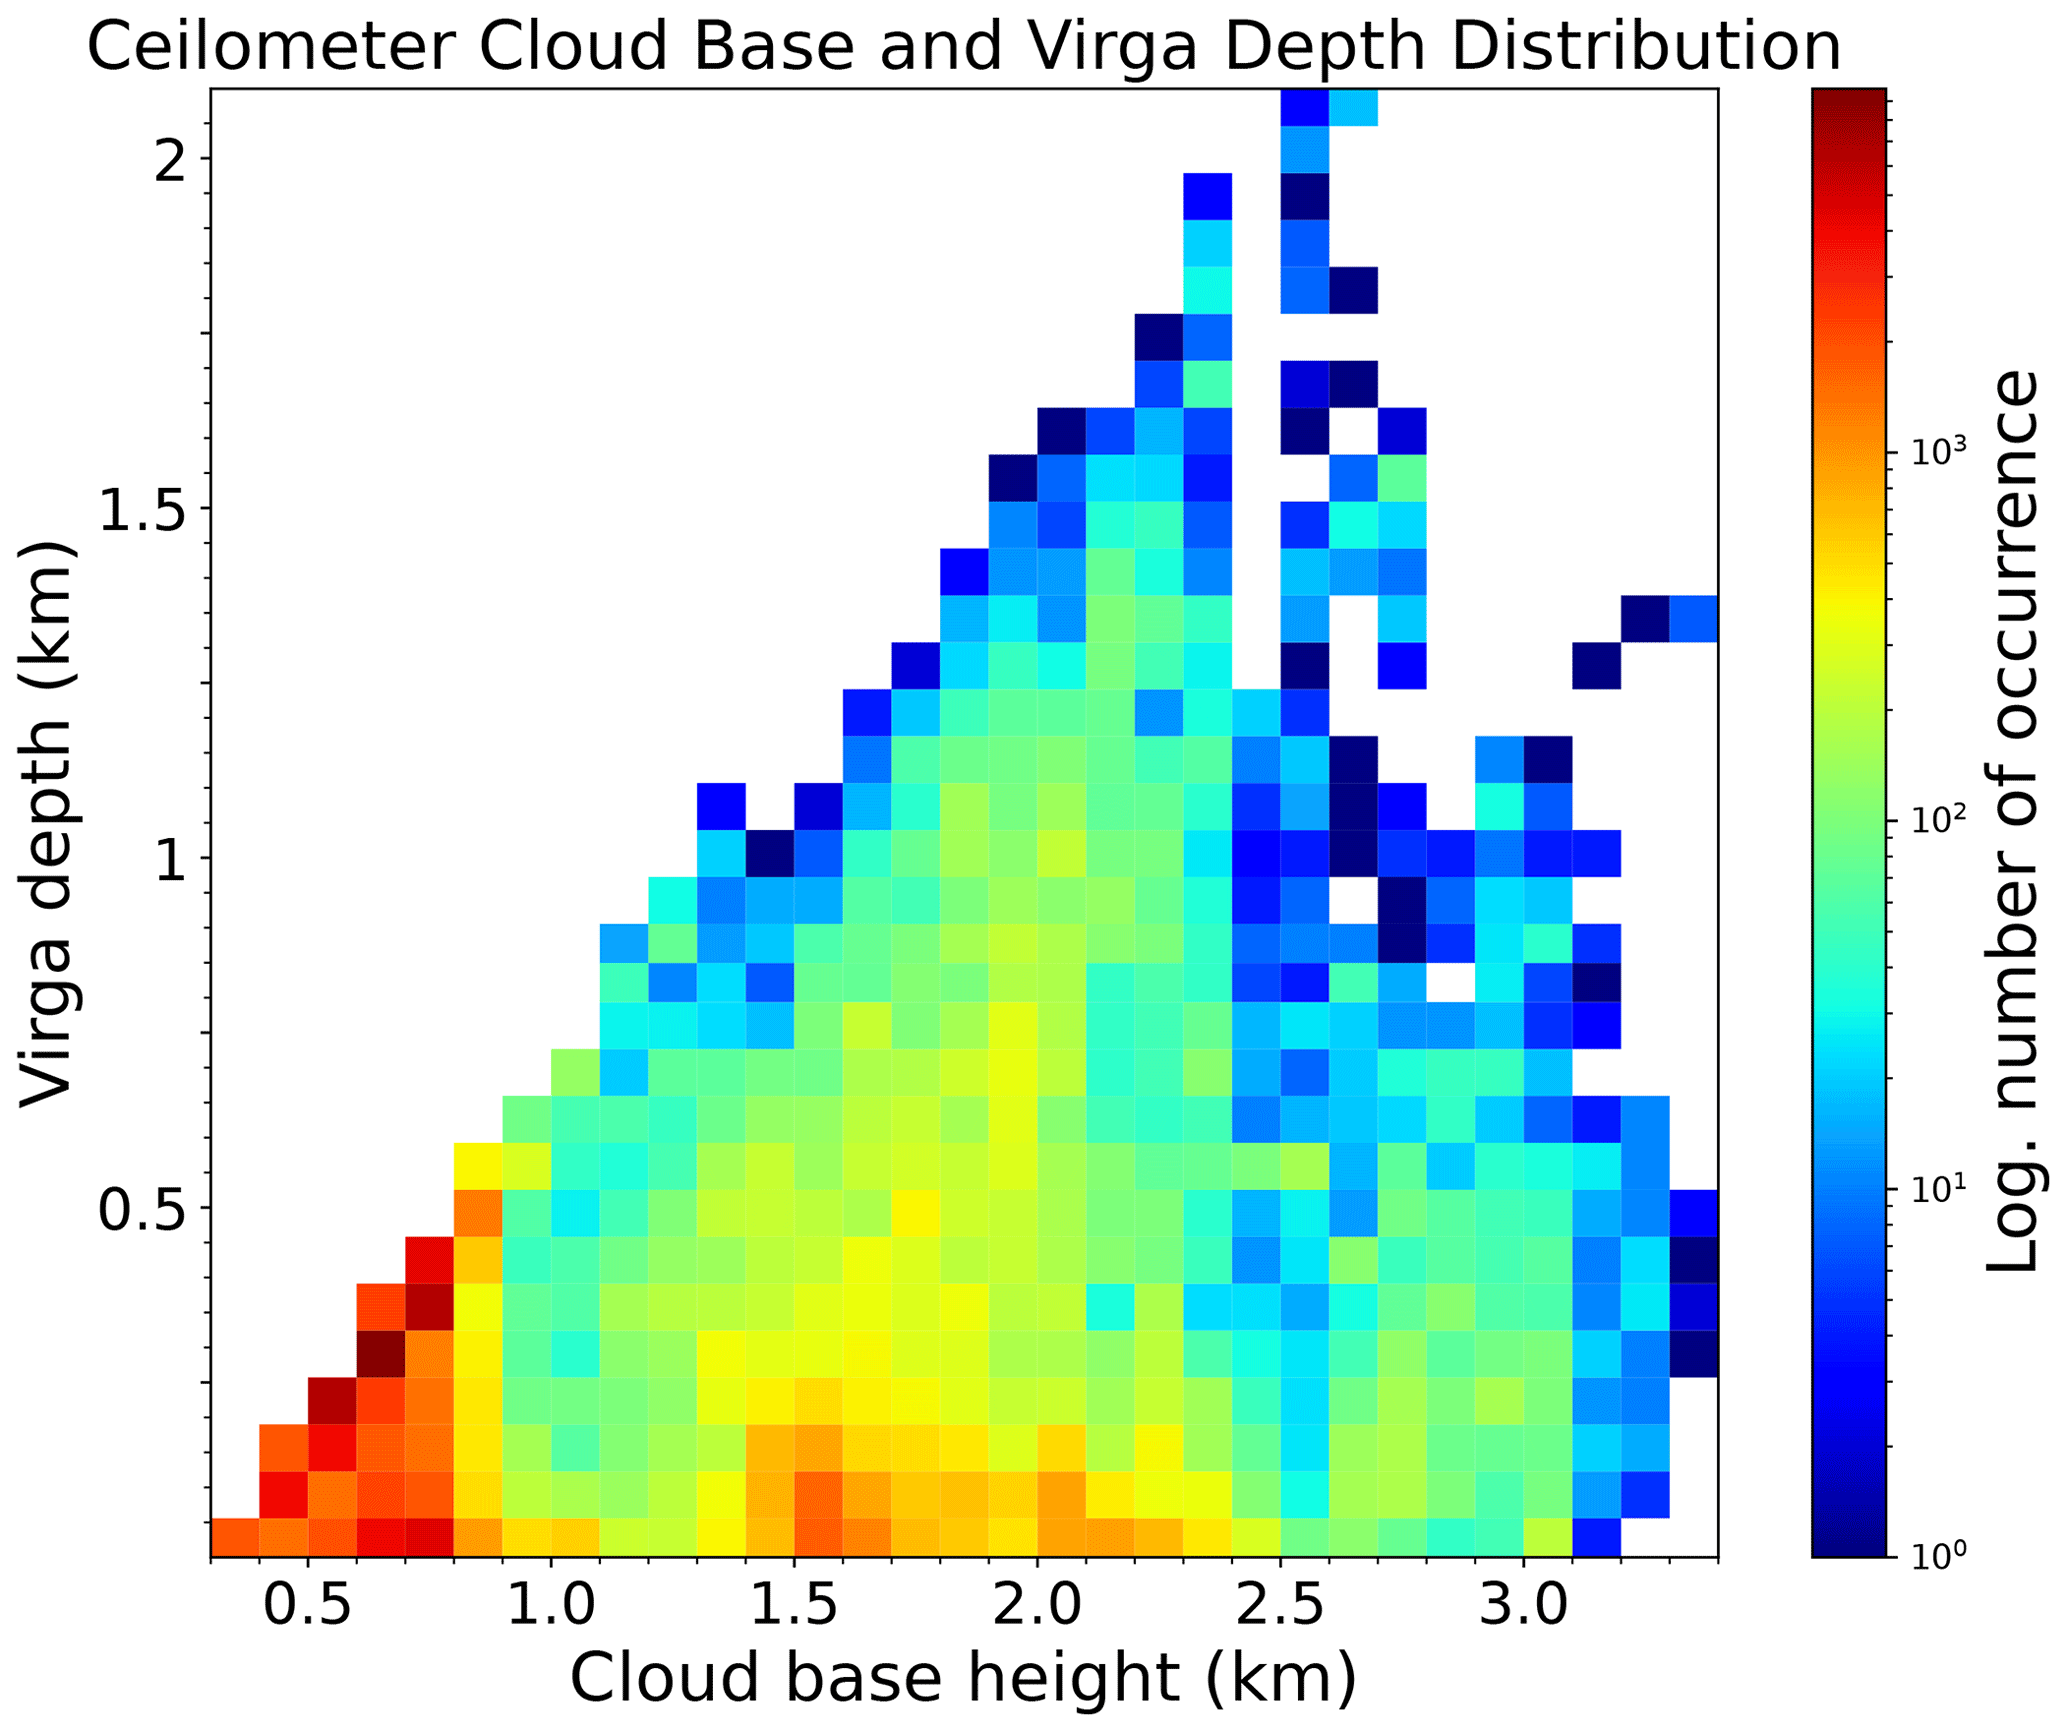
Figure 8 shows a 2D histogram of virga depth vs. cloud base height. The pronounced cutoff extending from the lower left to upper right of the plot is caused by virga reaching the lowest radar range gate at 0.3 km, since radar-based detected virga depth cannot be larger than CBH minus the lowest radar range-gate height. Numerous virga with varying depths originate from trade wind cumuli which have cloud bases at the LCL between 0.6 and 0.8 km. These virga reach the lowest radar range gate most frequently and evaporate near the surface. Clouds with bases around 1.5 and 2.5 km most often produce shallow virga with depths up to 0.2 km. In these heights, mostly stratiform cloud layers are present, reaching up to the base of the trade inversion. From these mostly shallow clouds, shallow virga originate that evaporate before reaching the lowest radar range gate. However, occasionally virga from these clouds can also reach the lowest radar range gate, which evaporate before reaching the surface and are thus not detected by the WS100-UMB sensor. This underlines the importance of precipitation evaporation, especially in the lowest 0.3 km of the mostly well-mixed subcloud layer.
4.2.3 Virga depth and cloud depth
Figure 9 illustrates the relation of cloud depth and virga depth. Figure 9a shows this relation for clouds with their base below 1 km, i.e., the trade wind cumuli. No clear dependency between virga depth and cloud depth can be seen. Large cloud depths combined with small virga depths are likely stronger convective cells (cumulus congestus) with a CBH near the LCL and higher vertical extent. The maximum virga depth the Virga-Sniffer can determine is confined by the distance between cloud base and lowest radar range gate. Thus, virga depth values in Fig. 9a are restricted to a few hundred meters. Figure 9b only includes clouds with their base above 1 km and below the TIH. Those are mostly stratiform cloud layers, cloud edges, and anvils of convective cells spreading under the trade inversion. Virga depths smaller than 0.3 km often occur from shallow stratiform cloud layers with depths below 0.5 km. For cloud depths between 0.5 and 1 km, the occurrence of virga depths between 0.3 and 1 km is rather evenly distributed. This shows that, inside these boundaries, virga depth is not very dependent on cloud depth. This is also valid for cloud depths between 1 and 1.5 km and virga depths up to 1 km, although these combinations are detected less frequently. Virga depths above 1 km are most frequently produced by clouds with depths between 0.5 and 1 km. Those clouds are the stratiform cloud layers and anvils below the trade inversion, with a cloud base that is high enough to produce deep virga. In a further analysis, the relation of virga depths and liquid water path (LWP) was studied. It is not presented, since no strong dependency of virga depth on column-integrated liquid water path was found.
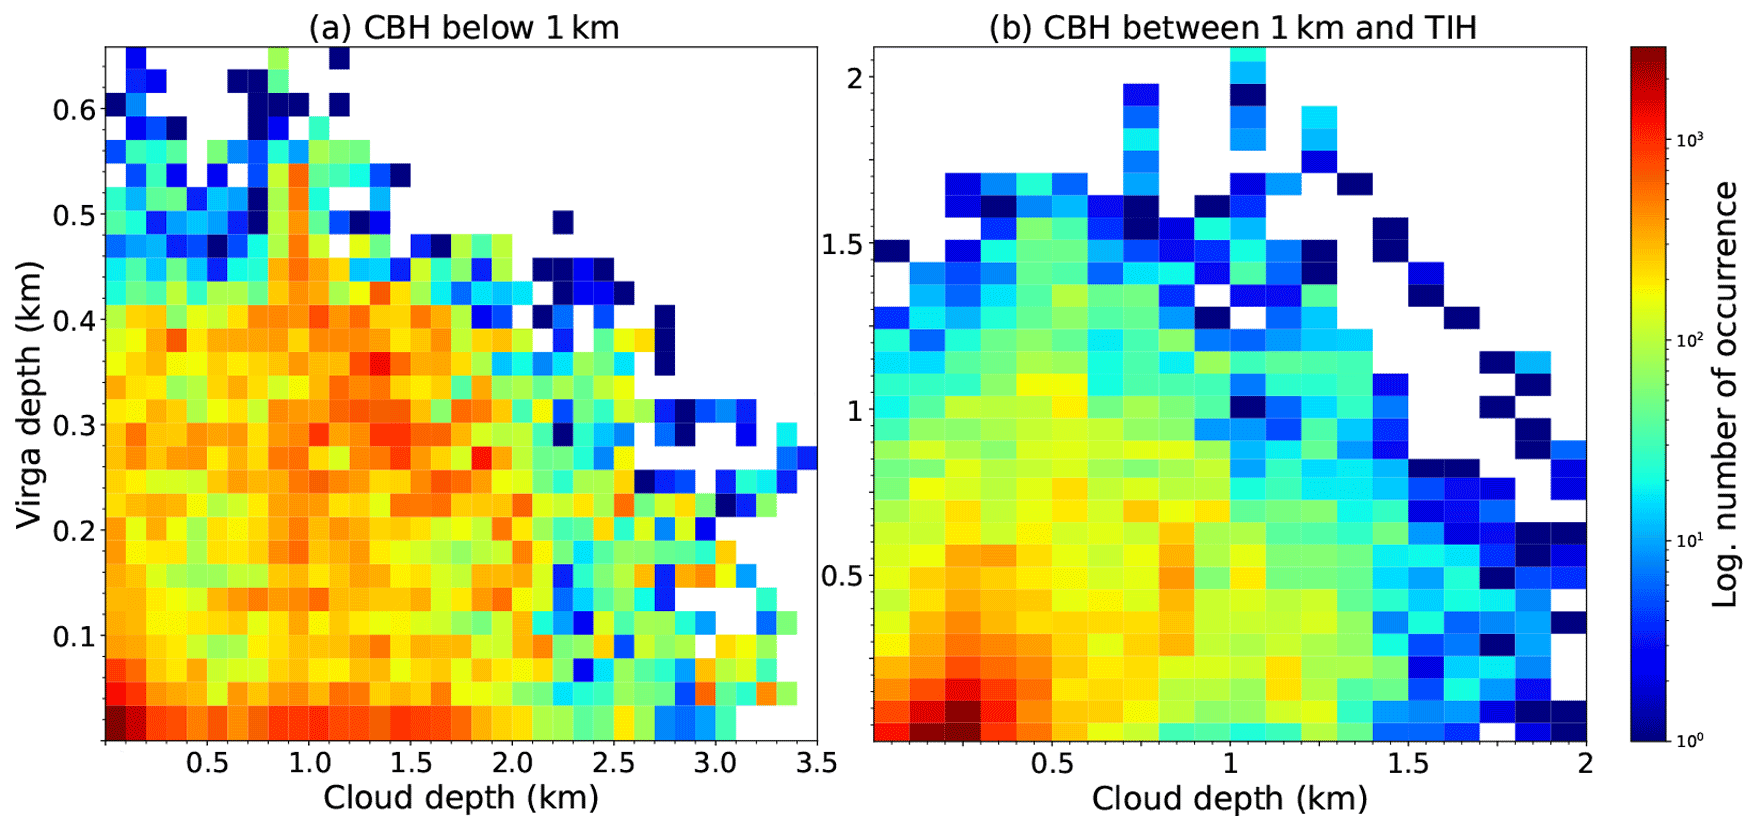
Figure 92D Histograms of cloud depth and virga depth. The color bar is logarithmic. In panel (a) cloud depths and virga depths for clouds with a base below 1 km are shown. Panel (b) shows the same but for clouds with their base between 1 km and the trade inversion height (TIH).
Based on the importance to identify precipitation evaporation reliably, we developed the so-called Virga-Sniffer, a new freely available Python package (Witthuhn et al., 2022). It uses profile-by-profile ground-based remote-sensing observations of ceilometers for cloud base height detection and vertically pointing Doppler cloud radar to identify clouds and partially or fully evaporating precipitation and is applicable to multilayer cloud situations. The Virga-Sniffer tool is modular and highly configurable and can thus be applied to different measurement setups.
In this paper, the functionality and workflow of the Virga-Sniffer tool are explained in detail. It is noteworthy that while for the most basic approach, only time–height fields of cloud radar reflectivity and time series of cloud base height (CBH) are required, the modular approach of the Virga-Sniffer allows for including other optional parameters such as LCL, a surface rain flag, and time–height fields of cloud radar mean Doppler velocity. These additional data make refinements of the virga event identification possible. The Virga-Sniffer output does not only contain the actual Boolean flags of virga and cloud detections in the same time–height grid as the radar input data, but it also provides several virga and cloud properties, including base and top heights, as well as depth. In addition, the output contains the flags for the identification of rain reaching the surface. Limitations of the Virga-Sniffer are also described. We would like to point out that the virga detection with the Virga-Sniffer was developed and optimized for the RV Meteor data set obtained during EUREC4A. For different instrument setups, cloud types, or climate zones, threshold modifications by the Virga-Sniffer user are needed to optimize the results.
To evaluate the Virga-Sniffer, we compared the detected virga events to the CloudNet target classifications. To summarize, within all pixels classified as virga by the Virga-Sniffer, 86 % were classified by CloudNet as precipitation (52 % liquid-phase, 34 % ice-phase). The remaining 14 % are either CloudNet-classified as aerosols and insects (about 10 %), cloud droplets (roughly 2 %), or clear sky (2 %). We conclude that the performance of the Virga-Sniffer compared to the CloudNet target classification is good. Some discrepancies are expected due to smoothing at precipitation edges as well as ceilometer CBH smoothing as part of the preprocessing of the Virga-Sniffer. The CloudNet target classification of aerosols and insects mostly occurred at virga edges and is likely related to CloudNet thresholds for target classifications, which we will explore further.
The Virga-Sniffer tool was used for virga identification for the entire RV Meteor data set gathered within the framework of EUREC4A from 18 January to 19 February 2020. Statistical results showed that 73 % of the observed clouds had bases below 4 km; 63 % of them were trade wind cumuli with a cloud base below 1 km. For the RV Meteor data set, 42 % of all clouds below 4 km produced precipitation that fully evaporated before reaching the ground. This marks the importance of strong precipitation evaporation in the downstream winter trade wind zone. With respect to all detected virga from clouds with bases below the TIH, virga from trade wind cumuli make up about 56 %. Trade wind cumuli were found to produce virga of varying depths, but a large fraction of these virga tend to reach the lowest radar range gate in 0.3 km. This means the precipitation evaporates between 0.3 km and ground level and therefore has a strong contribution to near-surface evaporation. Clouds with bases between 1 and 4 km, which are either stratiform cloud layers or cloud edges of convective cells below the trade inversion, were identified as important virga producers. Stratiform cloud layers with their base around 1.5 and 2.5 km frequently produce either virga with small depths up to 0.2 km or virga reaching the lowest radar range gate. This means their virga can reach depths of over 1.5 km and shows that they also contribute to low-level evaporation.
We would like to finish this study with highlighting for which kinds of studies the Virga-Sniffer might for example be used in the future. A straightforward application is to use the Virga-Sniffer for identifying virga and determining macrophysical properties such as virga depth in relation to cloud base height and cloud depth as they are a prerequisite for detailed evaporation studies as, e.g., done by Xie et al. (2016) and Tridon et al. (2017). Other possible applications of the Virga-Sniffer include enhancing studies of precipitation evaporation in the context of cold pools and cloud organization within the framework of EUREC4A as, e.g., done by Vogel et al. (2021) and Touzé-Peiffer et al. (2022). Additionally, studying precipitation and virga characteristics coupled with water vapor isotopic measurements, which was also a focus of EUREC4A (Bailey et al., 2023), can help to discern the balance of moist processes which set the humidity profiles. As a near-future goal, we would like to apply it to the long-term remote-sensing data set of the Barbados Cloud Observatory (BCO; Stevens et al., 2016) to contrast precipitation evaporation in the dry and wet season. While the Virga-Sniffer was developed within the context of EUREC4A and the results shown here focus on warm clouds, the tool is highly modular and configurable and thus applicable to study precipitation evaporation or sublimation originating from other cloud types such as ice and mixed-phase clouds and can be used in other geographic settings such as orographic terrain or the Arctic. Our virga identification tool might also help to evaluate satellite-based surface precipitation statistics suffering from blind-zone effects, as indicated by Maahn et al. (2014) and Valdivia et al. (2022).
The Virga-Sniffer utilizes a variety of flags and thresholds to detect virga from the given input data. The configuration is freely user-configurable via a configuration dictionary, which is merged with the default values. In the following all default values of configuration flags, thresholds, and settings are summarized. This default setup is used to process the EUREC4A RV Meteor data set described in Sect. 2. A full description of each configuration parameter can be found in the documentation (Witthuhn et al., 2022, https://virga-sniffer.readthedocs.io, last access 10 January 2023).
A1 Flags
Flags are Boolean values which control certain functionalities of the Virga-Sniffer:
-
cbh_connect2top = false. This flag changes how situations where precipitation falling from the upper into lower CBH layers are handled. In the default setting (false), the lowest CBH is retained, and higher CBH layers are omitted from processing because no distinction can be made between clouds and precipitation from higher layers if there is a continuous radar signal in the profile. Therefore, the default setting is most conservative to avoid false detection of virga. For true, the top CBH layer is retained and the lower CBH layer is omitted from processing. This approach results in more precipitation data points, but it is prone to misclassification of cloud droplets as precipitation.
-
lcl_replace_cbh = true. When additional LCL data are provided, this flag changes the behavior of the add LCL module for CBH preprocessing (see Sect. 3.1). In the default setting (true), the LCL data completely replace the lowest ceilometer CBH layer. If false, the LCL data are merged with the lowest ceilometer CBH layer by only replacing missing values.
-
require_cbh = true. In the default setting, detected precipitation must always be related to a CBH value. This prevents, in the case of data gaps in the ceilometer CBH data, a cloud from being misclassified as precipitation.
-
mask_clutter = true. The virga mask is refined by filtering data which is probably clutter based on Eq. (1).
-
mask_rain = true. This configuration uses the ancillary data of the flag_surface_rain variable from the input data set. Data points which are classified as precipitation are classified as virga if rain is not observed at the surface. This check is applied to the lowest present cloud layer at any given time.
-
mask_rain_ze = true. This is similar to mask_rain but instead of using flag_surface_rain from the input data set, the radar reflectivity at the lowest range gate is tested against the ze_thres threshold in order to distinguish between rain and virga.
-
mask_vel = true. The virga mask is refined by filtering data with mean Doppler velocity values larger than vel_thres threshold.
A2 Thresholds
Virga-detection-specific thresholds are as follows:
-
clutter_c = −8 m s−1. This is the intercept of the linear masking dependency (see Eq. 1).
-
clutter_m = 4 m s−1. This is the slope of the linear masking dependency (see Eq. 1).
-
cloud_max_gap = 150 m. This assigns the maximum allowed gap for cloud detection.
-
minimum_rangegate_number = 2. In the case of non-continuous radar signal in a profile, isolated continuous range gates with valid radar signal are used, only if the number of range gates is greater than this threshold.
-
precip_max_gap = 700 m. This assigns the maximum allowed gap for precipitation detection.
-
vel_thres = 0 m s−1. This is the threshold for the virga mask refinement based on mean Doppler velocity.
-
ze_thres = 0 dBz. If the value of radar reflectivity of the lowest range is larger than ze_thres, precipitation is assumed to reach the ground and not considered virga in the lowest cloud layer.
Cloud-base-preprocessing-specific thresholds are as follows:
-
cbh_clean_thres = 0.05. This is the threshold used for cleaning cloud base layers during the preprocessing.
-
cbh_fill_limit = 60 s. This defines the maximum gap within cloud layers to be filled by the cbh_fill_method interpolation method (see Sect. 3.1).
-
cbh_layer_thres = 500 m. This is the threshold used for splitting cloud base layers during the preprocessing.
-
cbh_smooth_window = 60 s. This is the window size for the median-filter smoothing of cloud base height and cloud top values.
-
lcl_smooth_window = 300 s. This is the window size for median-filter smoothing of the lifting condensation level data.
A3 Special configuration
Apart from thresholds, the cloud base preprocessing is controlled by specialized configuration:
-
cbh_fill_method = slinear. This defines the method of filling cloud base gaps smaller than cbh_fill_limit.
-
cbh_processing = [2, 1, 3, 1, 4, 2, 1, 3, 1, 4, 5]. This list defines the methods applied for preprocessing (see Fig. 2).
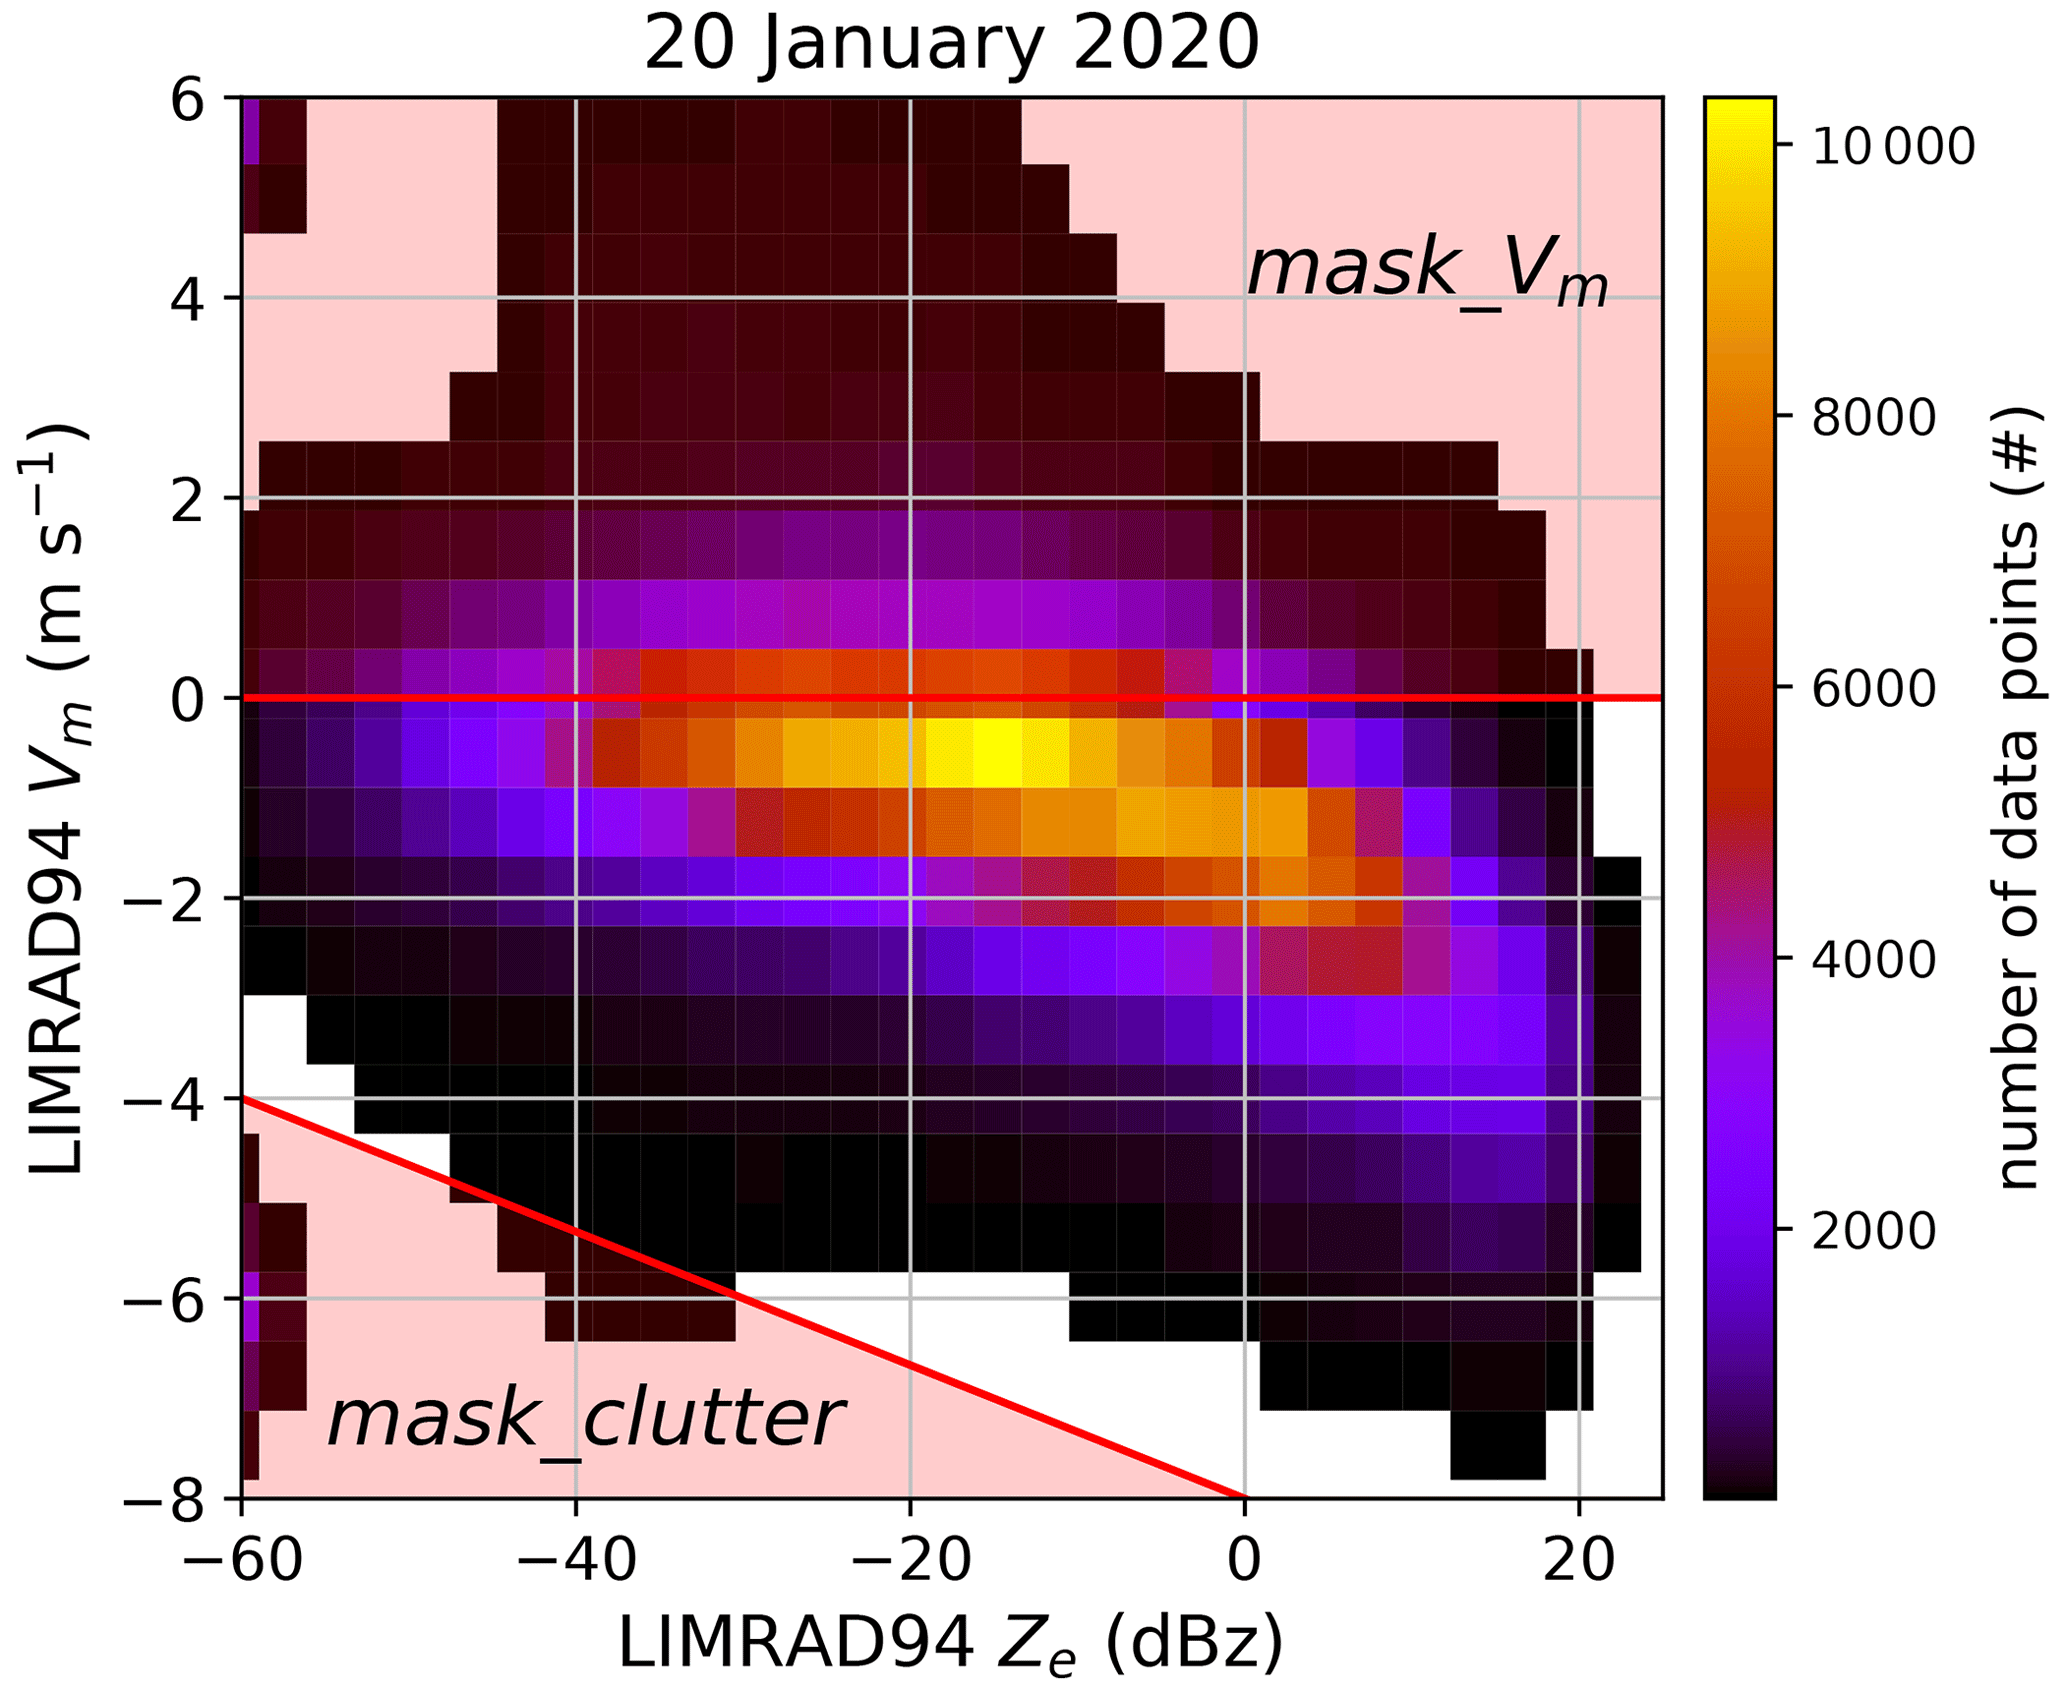
Figure A1Heat map of the mean Doppler velocity Vm and radar reflectivity Ze during EUREC4A from the RV Meteor on 20 January 2020. Demonstration of masking based on Vm data. Data points from red shaded regions are not considered to be virga. The velocity mask (mask_Vm) restricts virga events to falling hydrometeors. The clutter mask (mask_clutter) removes non-physical values of high negative Vm while low radar reflectivity factors are observed, which is probably clutter from the radar observation.
The sensitivity of the setting parameters of the Virga-Sniffer is evaluated using the EUREC4A data set. Tables B1 and B2 show the deviation of virga and cloud detection versus the proposed default settings. The deviation is thereby expressed in percentage change of the sum of data points of each column identified as virga or cloud or number of time steps when virga or clouds are detected in any range gate. This shows if changing a specific setting results in fewer or more total data points detected as virga/cloud (Δ data points) or in fewer or more virga/cloud events in time (Δ time steps).
Table B1Effects of different thresholds and settings related to the CBH of the Virga-Sniffer on the EUREC4A data set. The values shown refer to the deviation (%) of the total number of data points/time steps which are identified as virga/cloud to the total number of data points/time steps using the default setting. The total number of data points includes both changes in virga depth and time steps with virga. Defaults and respective test value of the setting or threshold are indicated in the first and second columns (true = T, false = F).
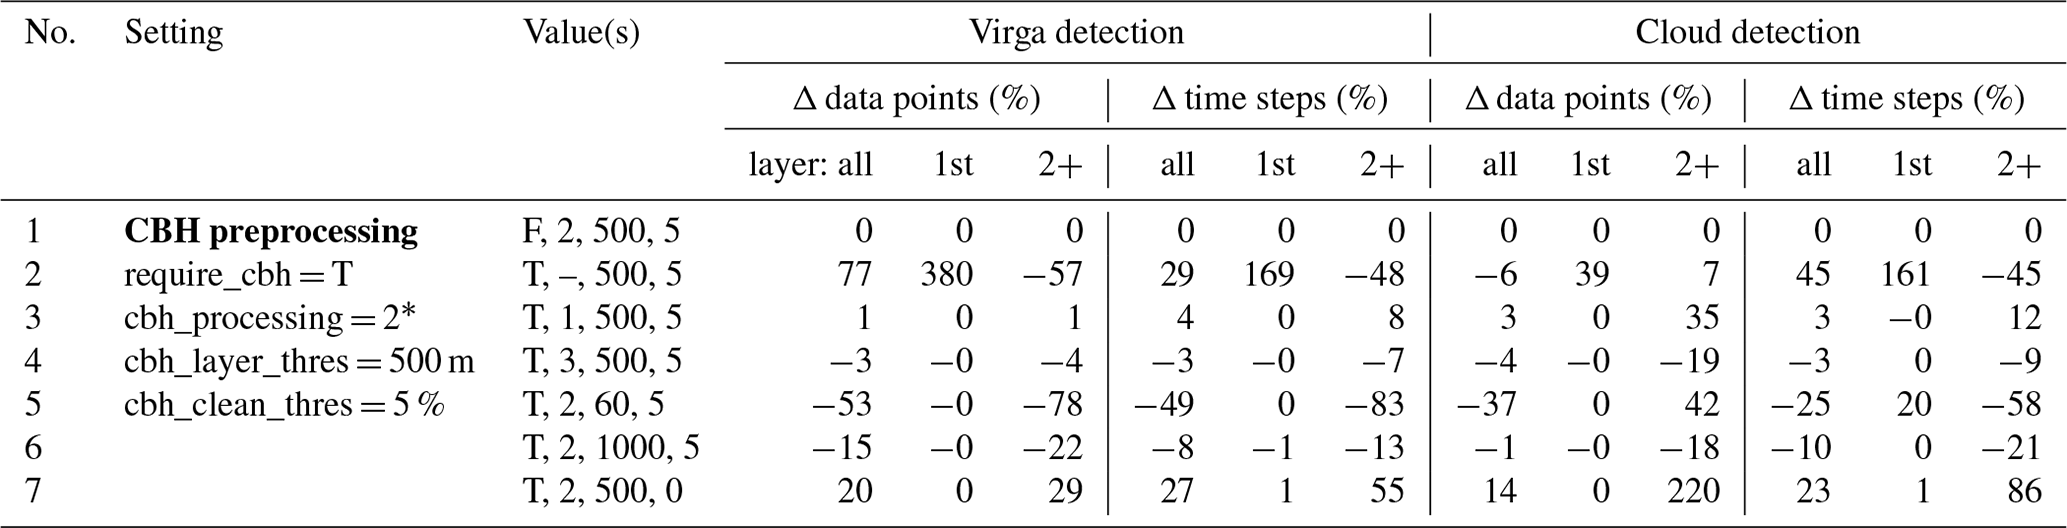
∗ Iterations of [2, 1, 3, 1, 4, 1] (see Sect. 3.1).
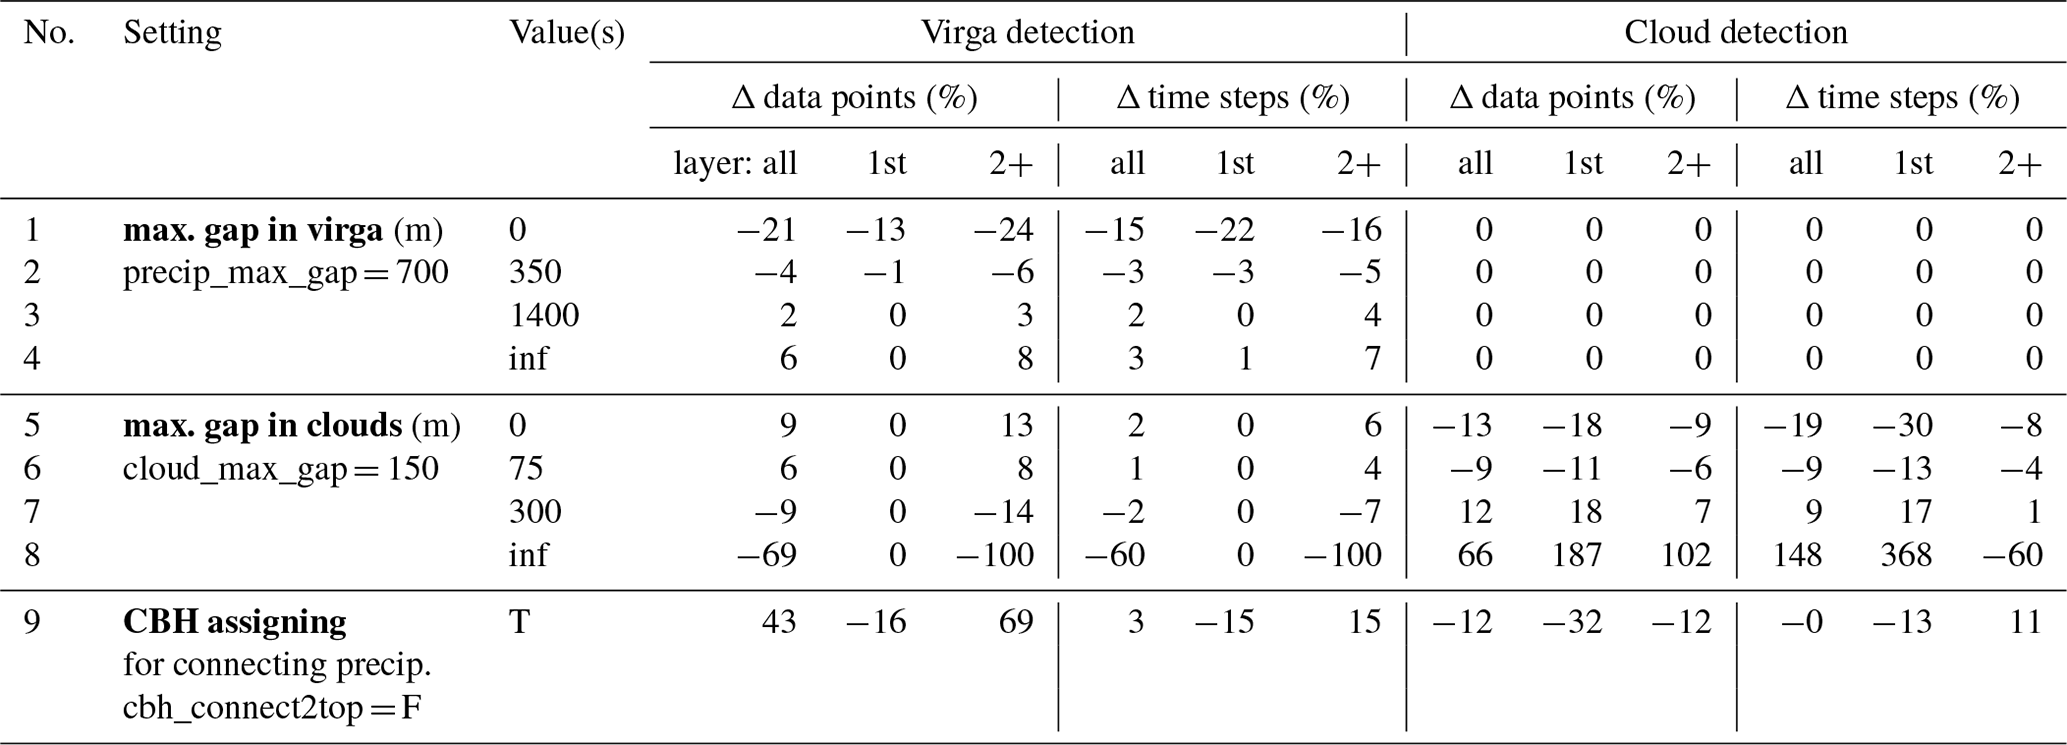
Table B2As Table B1 but for thresholds and settings for virga and cloud detection and virga mask refinement.
B1 Cloud base preprocessing
The virga and cloud detection is most sensitive to settings of the CBH preprocessing (Sect. 3.1). This is not surprising, as the identification of clouds and virga is initiated from the input (and then preprocessed) CBH data. The three main configuration settings affecting the CBH processing are require_cbh, cbh_processing, and cbh_layer_thres, whereas cbh_processing and cbh_layer_thres are strongly depended on the clean module (see Sect. 3.1) controlled by the threshold cbh_clean_thres.
First, if the configuration flag require_cbh is set to false, a value of CBH is not required to initiate cloud and virga detection; instead, virga detection is initiated from the surface or a lower cloud top upwards. This choice can be useful in single-layer cloud situations to capture vertically oriented fall streaks. In multilayer cloud situations this is prone to error, as upper-layer clouds, for which no ceilometer CBH is detected, might be falsely identified as virga. In the case of the EUREC4A data set used, virga events from higher cloud layers are identified and attributed also in the first layer within gaps in the trade wind cumuli. Thus, virga is identified in significantly more profiles and range gates in the first layer, but, in total, virga identification is not strongly affected as shown in Table B1, row 1.
Second, when switching off the CBH preprocessing (Table B1, row 2), most virga is connected to the first cloud layer, as cloud layers are no longer identified, split, and sorted by altitude. On the other hand, significantly more virga is detected in total (77 %), since cloud layers with fewer data are removed during processing (clean module). The total number of data points classified as virga reduces progressively when increasing the number of iterations of the standard CBH preprocessing procedure, since outliers are isolated and removed with each iteration (row 3 for one iteration and row 4 for three iterations); however the effect is minor. The reduction of data points classified as virga, when CBH preprocessing is applied, depends mainly on how aggressively the cleaning is done in between the processing steps (see Sect. 3.1). For the EUREC4A data set, cbh_clean_thres is rather aggressive, with a default value of 5 %.
Finally, setting cbh_layer_thres does not affect the amount of virga and clouds detected. However, if the threshold is decreased, more cloud layers will be detected per observation period, resulting in many of these layers containing few data points and therefore being removed by the clean module. Therefore, a decrease in cbh_layer_thres leads to a reduction in detected data points (Table B1, row 5). Note that doubling cbh_layer_thres also reduces the total number of data points classified as virga by 15 % (Table B1, row 6). This indicates that the combination of the default values of cbh_layer_thres and cbh_clean_thres is chosen in a way to remove outliers but does not affect the detection of clouds and virga on the EUREC4A data set. The effect of cbh_clean_thres is demonstrated again in Table B1, row 7, where standard CBH is performed, but cleanup is turned off by setting the threshold to zero. The total number of profiles containing virga is similar to the test in which the entire CBH processing is turned off (row 2).
B2 Precipitation and cloud detection
The initial precipitation and cloud detection is initialized for each cloud layer at all time steps (see Sect. 3.2). This detection is influenced by the settings of the maximum allowed vertical gaps in the radar reflectivity data. In Table B2, rows 1–8 show the impact of changing these settings by the thresholds precip_max_gap and cloud_max_gap.
The purpose of precip_max_gap is also to detect tilted fall streaks far below a cloud base (due to horizontal transport by wind shear) and at the same time prevent false detection of clouds as precipitation. The default setting of precip_max_gap is 700 m. Setting precip_max_gap to zero, which is the safest option to prevent false positive detection, results in about 21 % fewer data points for the EUREC4A data set (row 1). On the other hand, allowing for infinite large gaps (row 4) only adds about 6 % of data, as the detection always stops at the lowest range gate or the lower cloud top, which are detected first. It can be concluded that the choice of precip_max_gap does not impact depth and frequency of occurrence of detected precipitation strongly. It is however required to detect tilted fall streaks, which are not connected to the CBH of one profile.
Similarly, the sensitivity to the threshold cloud_max_gap for cloud detection is analyzed. The difference is that the cloud detection happens first and thus sets the lower limit for precipitation detection in each cloud layer, respectively. Thus, if this threshold is chosen to be too large, any precipitation above the first cloud layer will be identified as cloud (row 8). Note that a lower value or a value of zero for cloud_max_gap strongly influences the number of data points identified as cloud but does not strongly affect precipitation or virga detection (rows 5–6). For virga detection, setting cloud_max_gap larger than zero is useful to prevent false detection of virga at non-identified cloud tops.
In multilayer cloud situations, it may not be possible to separate individual cloud layers from the radar signal if it does not have gaps in the vertical. If this is the case, the Virga-Sniffer cannot distinguish between cloud and precipitation. Therefore, only the lower cloud layer is considered in these situations to minimize false detection of precipitation. This is controlled via the cbh_connect2top flag, which is set to false by default. If set to true (Table B2, row 9), considerably more data points (43 %) are classified as virga, and data points classified as clouds are reduced.
B3 Use of optional data
As summarized in Fig. 2, input data of the LCL, a surface rain flag, and the radar mean Doppler velocity are entirely optional. Here, we assess and discuss the effect of not using these optional data.
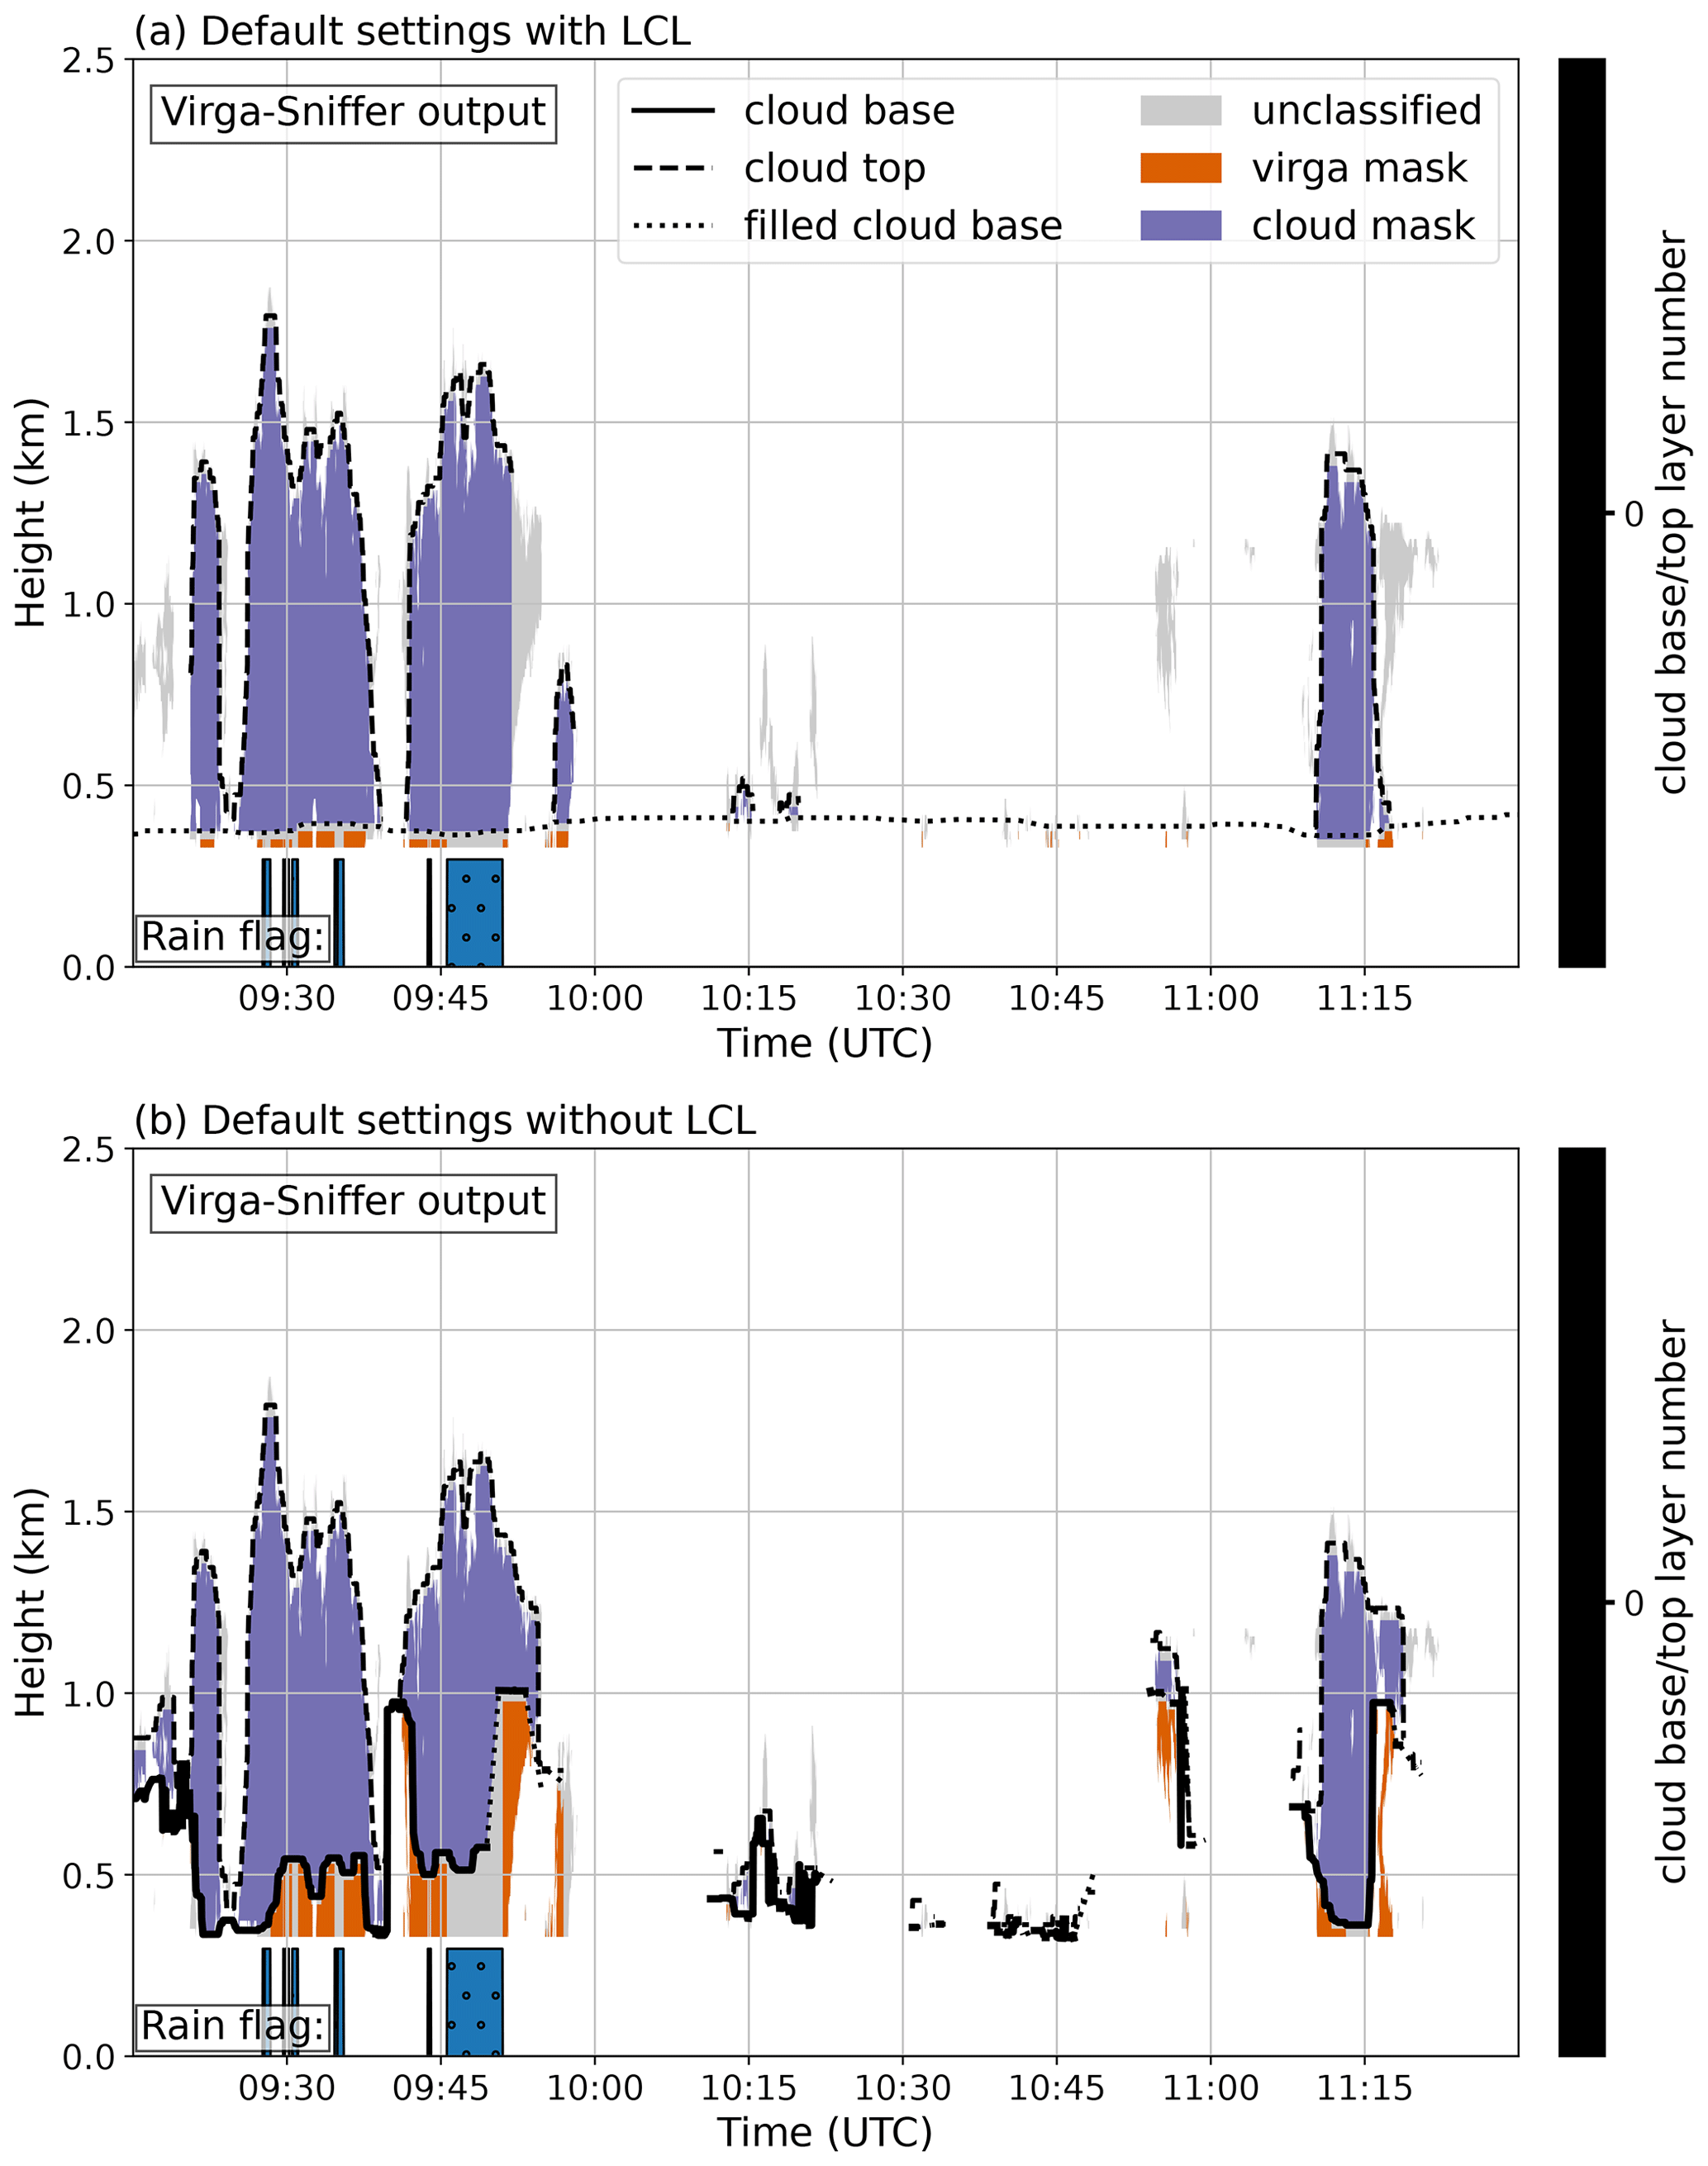
Figure B1Virga-Sniffer output from 28 February 2020 with (a) and without (b) optional LCL data.
Table B3As Table B1 but for thresholds and settings for virga detection and virga mask refinement.
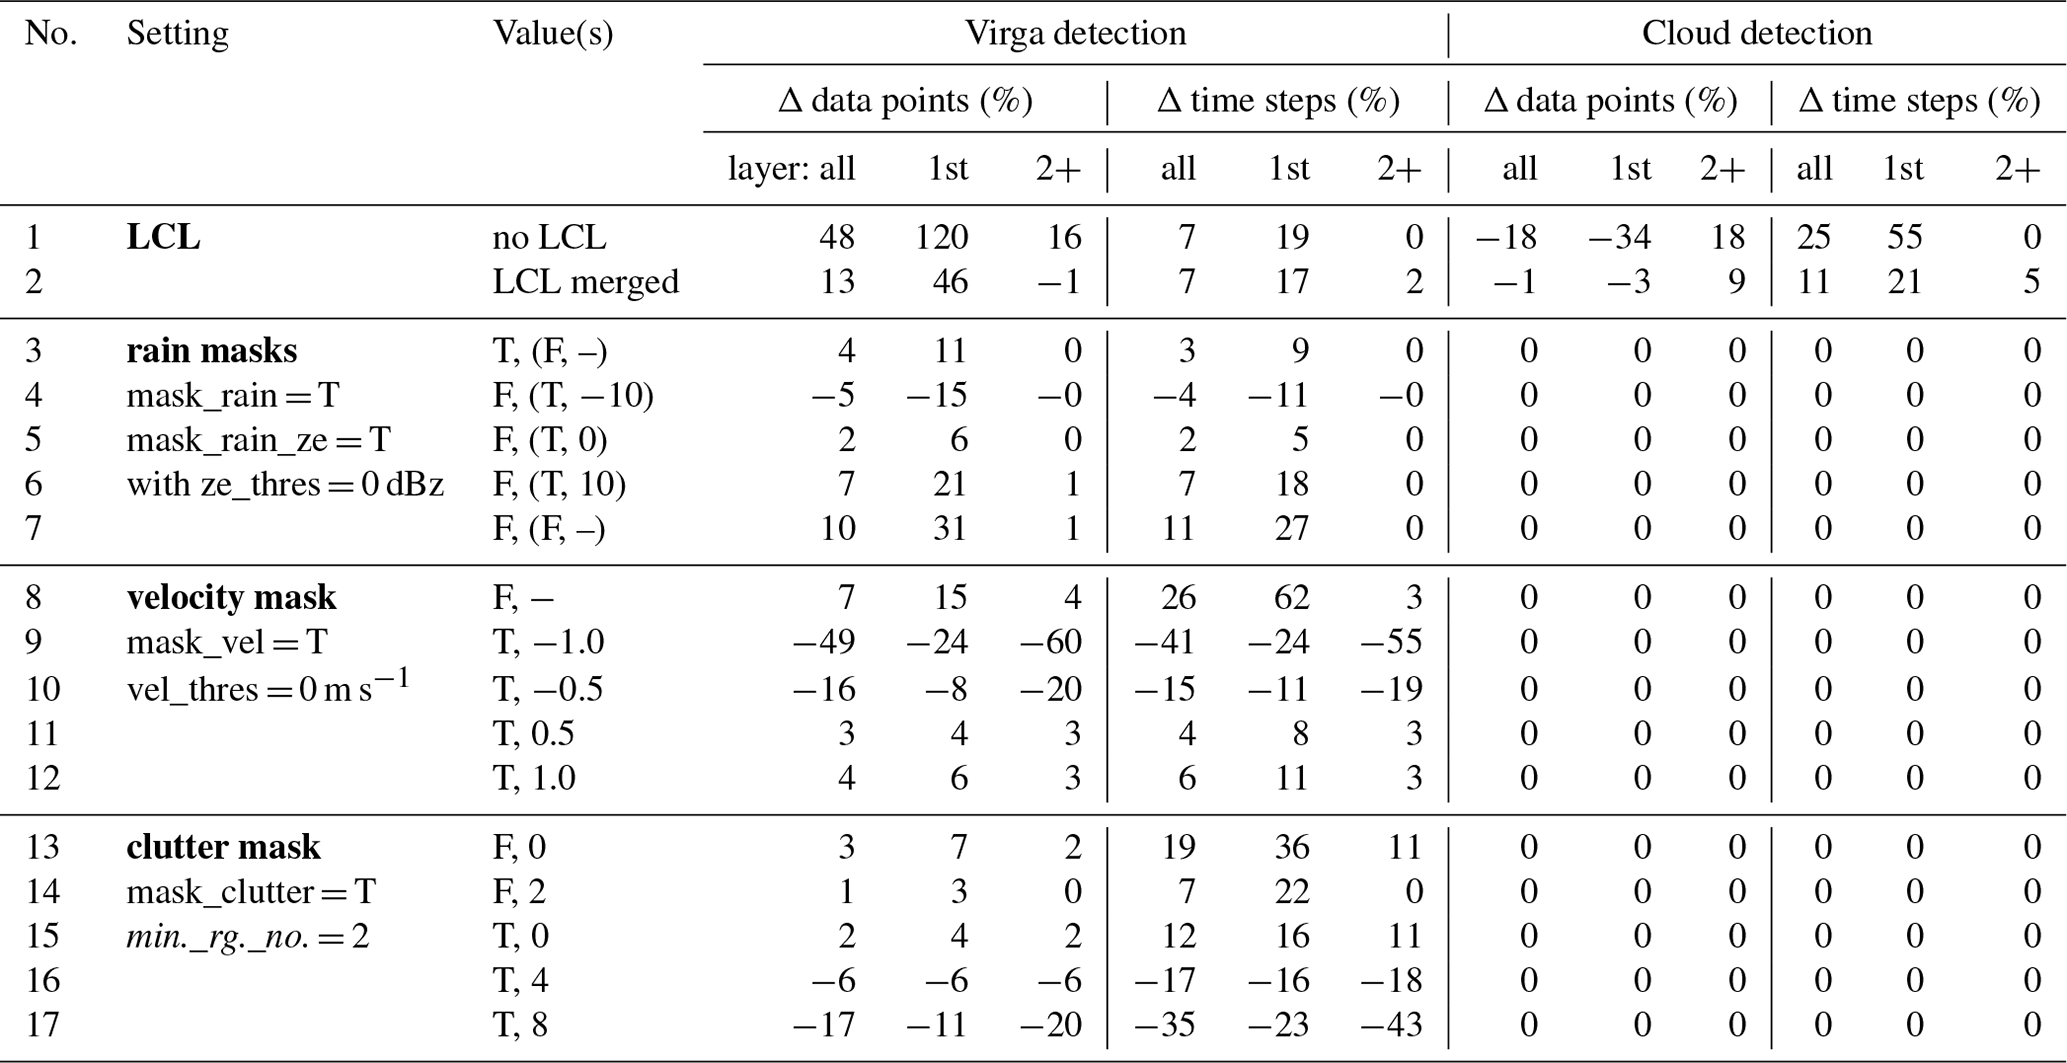
LCL data can be provided to supplement the CBH data during preprocessing. This supplementation is useful when clouds are generated by lifting (e.g., trade wind cumuli) to fill in gaps in the observed CBH. Since the CBH data in the Virga-Sniffer serve as a starting point for cloud and precipitation detection, this, in conjunction with the precip_max_gap threshold, enables the detection of tilted fall streaks. The total number of virga data points increases by about 48 % when the LCL is not used, as ceilometer CBHs, which are usually higher than the LCL, are now used to initiate the detection of precipitation, as shown in Fig. B1.
Using a rain flag based on surface observations can improve the separation of rain reaching the surface and virga events. This is optional, as this flag is in addition to a surface rain estimate based on the radar reflectivity of the lowest range gate (see Fig. 2). The impact of using both flags, only one flag, or none of the rain flags is demonstrated in Table B3 rows 3–7. As a default, both rain masks are used. Row 7 shows a 11 % increase of time steps with virga when not using any rain mask. The rain events, which make up these 11 %, are masked by the combination of both the rain mask from surface observation and the rain mask based on the radar reflectivity. If the surface observation is not available, the majority of rain events can be masked using the radar reflectivity data only, as time steps with virga increase by only 2 % compared to using both rain masks (Table B3, row 5). This shows, that adding surface observed rain masking to the Virga-Sniffer does not lead to significant improvements for this data set if the ze_thres threshold is chosen appropriately. The choice of the ze_thres threshold depends on the height of the lowest radar range gate of the measurement setup and the calibration of the radar reflectivity and is therefore strongly dependent on the measurement setup. In the case of LIMRAD94 at EUREC4A, the lowest range gate is at about 300 m altitude, and the calibration convention is that a cloud at 273 K containing 1 million 100 µm droplets per cubic meter will have a reflectivity of 0 dBz. Rows 4 and 6 of Table B3 show the impact of changing ze_thres by ±10 dBz for the EUREC4A setup. The impact of this ze_thres variation is in the order of −4 % to +7 % number of time steps, for which virga is detected.
The use of the radar mean Doppler velocity for Virga mask refinement, while optional, can lead to significant improvements. By default, data points with a mean Doppler velocity value greater than the threshold vel_thres of 0 m s−1 are not considered virga. If this refinement is not used, the total number of data points increases by 7 % (Table B3, row 8), with these additional data points originating primarily from updrafts below CBH of lower-layer cumuli, as evidenced by the substantial 62 % increase in virga time steps in the first cloud layer. These updrafts are generally stronger than 1 m s−1, as an increase from vel_thres to 1 m s−1 (row 12) increases the virga time steps by 11 % only. Further, the radar mean Doppler velocity can be used to mask clutter as shown in Fig. A1. Table B3, row 14, shows the impact of not using the clutter filter. The filter criteria apply to about 1 % of detected virga data points and can therefore be considered minor. If the threshold value minimum_rangegate_number is changed (Table B3, rows 14–17), this leads to proportionately more data points classified as virga if it is reduced and to fewer data points classified as virga if it is increased. This threshold is useful to prevent misclassification of individual outlier data points but should not be set too high; otherwise a non-negligible proportion of the data will not be considered.
The source code of the Virga-Sniffer is freely available and hosted on Zenodo (https://doi.org/10.5281/zenodo.7433405, Witthuhn et al., 2022). The data measured on board RV Meteor during EUREC4A are hosted by the AERIS Portal https://observations.ipsl.fr/aeris/eurec4a/ (last access: 12 August 2022). This includes data products from the onboard meteorological station operated by DWD, the ceilometer (https://doi.org/10.25326/53, Jansen, 2020) operated by MPI for Meteorology Hamburg, and the Doppler cloud radar LIMRAD94 (https://doi.org/10.25326/164, Kalesse-Los et al., 2021), and the microwave radiometer LIMHAT (https://doi.org/10.25326/77, Kalesse-Los et al., 2020) operated by Leipzig University. CloudNet processing was done using CloudnetPy (https://doi.org/10.5281/zenodo.4011843, Tukiainen et al., 2020b; version 1.33.0, Tukiainen et al., 2020a). A setup of pyLARDA (https://doi.org/10.5281/zenodo.4721311, Bühl et al., 2021) was used for data input and analysis.
HKL was in charge for the project administration, funding acquisition, shipping, installation, and operation of the instruments of Leipzig University on board RV Meteor during EUREC4A. JR assisted in installation and operation of the instruments and did the data processing. JW, JR, and HKL developed the Virga-Sniffer. JW performed the Virga-Sniffer processing of the EUREC4A data. AK used the Virga-Sniffer output for analysis of the RV Meteor EUREC4A data. TV performed the CloudnetPy processing. AF did the comparison to the CloudNet target classification. All authors contributed to the writing and editing of the manuscript.
The contact author has declared that none of the authors has any competing interests.
Publisher’s note: Copernicus Publications remains neutral with regard to jurisdictional claims in published maps and institutional affiliations.
The data used in this publication were gathered in the EUREC4A field campaign and are made available through the AERIS portal by data upload through Leipzig University, MPI for Meteorology Hamburg, and the German Weather Service (DWD). EUREC4A is funded with support of the European Research Council (ERC), the Max Planck Society (MPG), the German Research Foundation (DFG), the German Meteorological Service (DWD), and the German Aerospace Center (DLR). We acknowledge the pan-European Aerosol, Clouds and Trace Gases research Infrastructure (ACTRIS) for providing the CloudNet framework used in this study, which was developed by the Finnish Meteorological Institute (FMI) and is available for download from https://cloudnet.fmi.fi/ (last access: 21 December 2021). We also acknowledge ECMWF for providing Integrated Forecasting System (IFS) model data as input for CloudnetPy. Parts of the results in this work make use of the color maps in the CMasher package (van der Velden, 2020).
The authors would also like to acknowledge the ship crew and Michael Schäfer from Leipzig University for the excellent support offered in the installation of the equipment on board RV Meteor. Thanks are also expressed to Alexandros Emmanouilidis, who helped a lot in the logistical planning for shipment of the instruments from Leipzig University to Barbados. Additionally, the authors would like to thank Stefan Kinne and Friedhelm Jansen from MPI for Meteorology Hamburg for their support in ceilometer-related questions. Further thanks are given to Javier Pasarin Lopez, who characterized the cloud radar stabilization platform in his bachelor thesis. Thanks are expressed to Claudia Acquistapace for valuable feedback on the Virga-Sniffer usability. Finally, we would like to thank the three reviewers (Raphaela Vogel and two anonymous referees), whose comments helped to improve the manuscript.
This research has been supported by the Federal State of Saxony and the European Social Fund (ESF) in the framework of the program “Projects in the fields of higher education and research” (grant no. 100339509) and ESF-REACT (grant no. 100602743). Further financial support was provided by the German Science Foundation (DFG; grant no. FO 1285/2-1).
The paper was funded by the Open Access Publishing Fund of Leipzig University supported by the German Research Foundation within the program Open Access Publication Funding.
This paper was edited by Stefan Kneifel and reviewed by Raphaela Vogel and two anonymous referees.
Acquistapace, C., Coulter, R., Crewell, S., Garcia-Benadi, A., Gierens, R., Labbri, G., Myagkov, A., Risse, N., and Schween, J. H.: EUREC4A's Maria S. Merian ship-based cloud and micro rain radar observations of clouds and precipitation, Earth Syst. Sci. Data, 14, 33–55, https://doi.org/10.5194/essd-14-33-2022, 2022. a, b
Austin, P., Wang, Y., Kujala, V., and Pincus, R.: Precipitation in stratocumulus clouds: Observational and modeling results, J. Atmos. Sci., 52, 2329–2352, 1995. a
Bailey, A., Aemisegger, F., Villiger, L., Los, S. A., Reverdin, G., Quiñones Meléndez, E., Acquistapace, C., Baranowski, D. B., Böck, T., Bony, S., Bordsdorff, T., Coffman, D., de Szoeke, S. P., Diekmann, C. J., Dütsch, M., Ertl, B., Galewsky, J., Henze, D., Makuch, P., Noone, D., Quinn, P. K., Rösch, M., Schneider, A., Schneider, M., Speich, S., Stevens, B., and Thompson, E. J.: Isotopic measurements in water vapor, precipitation, and seawater during EUREC4A, Earth Syst. Sci. Data, 15, 465–495, https://doi.org/10.5194/essd-15-465-2023, 2023. a
Baker, M.: Trade cumulus observations, in: The Representation of Cumulus Convection in Numerical Models, Springer, 29–37, ISBN 978-1-935704-13-3, 1993. a
Bony, S., Stevens, B., Ament, F., Bigorre, S., Chazette, P., Crewell, S., Delanoë, J., Emanuel, K., Farrell, D., Flamant, C., Gross, S., Hirsch, L., Karstensen, J., Mayer, B., Nuijens, L., Ruppert, J. H., Sandu, I., Siebesma, P., Speich, S., Szczap, F., Totems, J., Vogel, R., Wendisch, M., and Wirth, M.: EUREC4A: A Field Campaign to Elucidate the Couplings Between Clouds, Convection and Circulation, Surv. Geophys., 38, 1529–1568, https://doi.org/10.1007/s10712-017-9428-0, 2017. a
Bühl, J., Radenz, M., Schimmel, W., Vogl, T., Röttenbacher, J., and Lochmann, M.: pyLARDA v3.2, Zenodo [code], https://doi.org/10.5281/zenodo.4721311, 2021. a, b
Dawson, D. T., Xue, M., Milbrandt, J. A., and Yau, M.: Comparison of evaporation and cold pool development between single-moment and multimoment bulk microphysics schemes in idealized simulations of tornadic thunderstorms, Mon. Weather Rev., 138, 1152–1171, 2010. a
Emanuel, K. A., David Neelin, J., and Bretherton, C. S.: On large-scale circulations in convecting atmospheres, Q. J. Roy. Meteor. Soc., 120, 1111–1143, 1994. a
Illingworth, A. J., Hogan, R. J., O'Connor, E., Bouniol, D., Brooks, M. E., Delanoé, J., Donovan, D. P., Eastment, J. D., Gaussiat, N., Goddard, J. W. F., Haeffelin, M., Baltink, H. K., Krasnov, O. A., Pelon, J., Piriou, J.-M., Protat, A., Russchenberg, H. W. J., Seifert, A., Tompkins, A. M., van Zadelhoff, G.-J., Vinit, F., Willén, U., Wilson, D. R., and Wrench, C. L.: Cloudnet: Continuous Evaluation of Cloud Profiles in Seven Operational Models Using Ground-Based Observations, B. Am. Meteorol. Soc., 88, 883–898, https://doi.org/10.1175/BAMS-88-6-883, 2007. a
Jansen, F.: Ceilometer Measurements RV Meteor, EUREC4A, medium: NetCDF, ASCII, AERIS Portal [data set], https://doi.org/10.25326/53, 2020. a
Kalesse-Los, H., Röttenbacher, J., Schäfer, M., and Emmanouilidis, A.: Microwave Radiometer Measurements RV Meteor, EUREC4A, medium: NetCDF, AERIS Portal [data set], https://doi.org/10.25326/77, 2020. a
Kalesse-Los, H., Röttenbacher, J., and Schäfer, M.: W-Band Radar Measurements RV Meteor, EUREC4A, medium: NetCDF, Version Number: 1.0, AERIS Portal [data set], https://doi.org/10.25326/164, 2021. a
Küchler, N., Kneifel, S., Löhnert, U., Kollias, P., Czekala, H., and Rose, T.: A W-Band Radar–Radiometer System for Accurate and Continuous Monitoring of Clouds and Precipitation, J. Atmos. Ocean. Tech., 34, 2375–2392, https://doi.org/10.1175/jtech-d-17-0019.1, 2017. a
Langhans, W. and Romps, D. M.: The origin of water vapor rings in tropical oceanic cold pools, Geophys. Res. Lett., 42, 7825–7834, 2015. a
Li, X. and Srivastava, R. C.: An analytical solution for raindrop evaporation and its application to radar rainfall measurements, J. Appl. Meteor., 40, 1607–1616, 2001. a
Löhnert, U. and Crewell, S.: Accuracy of Cloud Liquid Water Path from Ground-Based Microwave Radiometry 1. Dependency on Cloud Model Statistics, Radio Sci., 38, 8041, https://doi.org/10.1029/2002RS002654, 2003. a
Maahn, M., Burgand, C., Crewell, S., Gorodetskaya, I. V., Kneifel, S., Lhermitte, S., Tricht, K. V., and van Lipzig, N. P.: How does the spaceborne radar blind zone affect derived surface snowfall statistics in polar regions?, J. Geophys. Res., 119, 13604–13620, https://doi.org/10.1002/2014JD022079, 2014. a
Nuijens, L., Serikov, I., Hirsch, L., Lonitz, K., and Stevens, B.: The distribution and variability of low-level cloud in the North Atlantic trades, Q. J. Roy. Meteor. Soc., 140, 2364–2374, 2014. a
Nuijens, L., Medeiros, B., Sandu, I., and Ahlgrimm, M.: The behavior of trade-wind cloudiness in observations and models: The major cloud components and their variability, J. Adv. Model. Earth Sy., 7, 600–616, 2015. a
Reiche, C. H. and Lasher-Trapp, S.: The minor importance of giant aerosol to precipitation development within small trade wind cumuli observed during RICO, Atmos. Res., 95, 386–399, 2010. a
Romps, D. M.: Exact Expression for the Lifting Condensation Level, J. Atmos. Sci., 74, 3891–3900, https://doi.org/10.1175/JAS-D-17-0102.1, 2017. a
Rosenfeld, D. and Mintz, Y.: Evaporation of Rain Falling from Convective Clouds as Derived from Radar Measurements, J. Appl. Meteorol., 27, 209–215, https://doi.org/10.1175/1520-0450(1988)027<0209:eorffc>2.0.co;2, 1988. a
Schimmel, W., Kalesse-Los, H., Maahn, M., Vogl, T., Foth, A., Garfias, P. S., and Seifert, P.: Identifying cloud droplets beyond lidar attenuation from vertically pointing cloud radar observations using artificial neural networks, Atmos. Meas. Tech., 15, 5343–5366, https://doi.org/10.5194/amt-15-5343-2022, 2022. a
Schlemmer, L. and Hohenegger, C.: The formation of wider and deeper clouds as a result of cold-pool dynamics, J. Atmos. Sci., 71, 2842–2858, 2014. a
Snodgrass, E. R., Di Girolamo, L., and Rauber, R. M.: Precipitation characteristics of trade wind clouds during RICO derived from radar, satellite, and aircraft measurements, J. Appl. Meteorol. Clim., 48, 464–483, 2009. a
Stevens, B., Farrell, D., Hirsch, L., Jansen, F., Nuijens, L., Serikov, I., Brügmann, B., Forde, M., Linne, H., Lonitz, K., and Properso, J. M.: The Barbados Cloud Observatory: Anchoring investigations of clouds and circulation on the edge of the ITCZ, B. Am. Meteorol. Soc., 97, 787–801, 2016. a
Stevens, B., Bony, S., Brogniez, H., Hentgen, L., Hohenegger, C., Kiemle, C., L'Ecuyer, T. S., Naumann, A. K., Schulz, H., Siebesma, P. A., Vial, J., Winker, D. M., and Zuidema, P.: Sugar, gravel, fish and flowers: Mesoscale cloud patterns in the trade winds, Q. J. Roy. Meteor. Soc., 146, 141–152, https://doi.org/10.1002/qj.3662, 2019. a
Stevens, B., Bony, S., Farrell, D., Ament, F., Blyth, A., Fairall, C., Karstensen, J., Quinn, P. K., Speich, S., Acquistapace, C., Aemisegger, F., Albright, A. L., Bellenger, H., Bodenschatz, E., Caesar, K.-A., Chewitt-Lucas, R., de Boer, G., Delanoë, J., Denby, L., Ewald, F., Fildier, B., Forde, M., George, G., Gross, S., Hagen, M., Hausold, A., Heywood, K. J., Hirsch, L., Jacob, M., Jansen, F., Kinne, S., Klocke, D., Kölling, T., Konow, H., Lothon, M., Mohr, W., Naumann, A. K., Nuijens, L., Olivier, L., Pincus, R., Pöhlker, M., Reverdin, G., Roberts, G., Schnitt, S., Schulz, H., Siebesma, A. P., Stephan, C. C., Sullivan, P., Touzé-Peiffer, L., Vial, J., Vogel, R., Zuidema, P., Alexander, N., Alves, L., Arixi, S., Asmath, H., Bagheri, G., Baier, K., Bailey, A., Baranowski, D., Baron, A., Barrau, S., Barrett, P. A., Batier, F., Behrendt, A., Bendinger, A., Beucher, F., Bigorre, S., Blades, E., Blossey, P., Bock, O., Böing, S., Bosser, P., Bourras, D., Bouruet-Aubertot, P., Bower, K., Branellec, P., Branger, H., Brennek, M., Brewer, A., Brilouet , P.-E., Brügmann, B., Buehler, S. A., Burke, E., Burton, R., Calmer, R., Canonici, J.-C., Carton, X., Cato Jr., G., Charles, J. A., Chazette, P., Chen, Y., Chilinski, M. T., Choularton, T., Chuang, P., Clarke, S., Coe, H., Cornet, C., Coutris, P., Couvreux, F., Crewell, S., Cronin, T., Cui, Z., Cuypers, Y., Daley, A., Damerell, G. M., Dauhut, T., Deneke, H., Desbios, J.-P., Dörner, S., Donner, S., Douet, V., Drushka, K., Dütsch, M., Ehrlich, A., Emanuel, K., Emmanouilidis, A., Etienne, J.-C., Etienne-Leblanc, S., Faure, G., Feingold, G., Ferrero, L., Fix, A., Flamant, C., Flatau, P. J., Foltz, G. R., Forster, L., Furtuna, I., Gadian, A., Galewsky, J., Gallagher, M., Gallimore, P., Gaston, C., Gentemann, C., Geyskens, N., Giez, A., Gollop, J., Gouirand, I., Gourbeyre, C., de Graaf, D., de Groot, G. E., Grosz, R., Güttler, J., Gutleben, M., Hall, K., Harris, G., Helfer, K. C., Henze, D., Herbert, C., Holanda, B., Ibanez-Landeta, A., Intrieri, J., Iyer, S., Julien, F., Kalesse, H., Kazil, J., Kellman, A., Kidane, A. T., Kirchner, U., Klingebiel, M., Körner, M., Kremper, L. A., Kretzschmar, J., Krüger, O., Kumala, W., Kurz, A., L'Hégaret, P., Labaste, M., Lachlan-Cope, T., Laing, A., Landschützer, P., Lang, T., Lange, D., Lange, I., Laplace, C., Lavik, G., Laxenaire, R., Le Bihan, C., Leandro, M., Lefevre, N., Lena, M., Lenschow, D., Li, Q., Lloyd, G., Los, S., Losi, N., Lovell, O., Luneau, C., Makuch, P., Malinowski, S., Manta, G., Marinou, E., Marsden, N., Masson, S., Maury, N., Mayer, B., Mayers-Als, M., Mazel, C., McGeary, W., McWilliams, J. C., Mech, M., Mehlmann, M., Meroni, A. N., Mieslinger, T., Minikin, A., Minnett, P., Möller, G., Morfa Avalos, Y., Muller, C., Musat, I., Napoli, A., Neuberger, A., Noisel, C., Noone, D., Nordsiek, F., Nowak, J. L., Oswald, L., Parker, D. J., Peck, C., Person, R., Philippi, M., Plueddemann, A., Pöhlker, C., Pörtge, V., Pöschl, U., Pologne, L., Posyniak, M., Prange, M., Quiñones Meléndez, E., Radtke, J., Ramage, K., Reimann, J., Renault, L., Reus, K., Reyes, A., Ribbe, J., Ringel, M., Ritschel, M., Rocha, C. B., Rochetin, N., Röttenbacher, J., Rollo, C., Royer, H., Sadoulet, P., Saffin, L., Sandiford, S., Sandu, I., Schäfer, M., Schemann, V., Schirmacher, I., Schlenczek, O., Schmidt, J., Schröder, M., Schwarzenboeck, A., Sealy, A., Senff, C. J., Serikov, I., Shohan, S., Siddle, E., Smirnov, A., Späth, F., Spooner, B., Stolla, M. K., Szkółka, W., de Szoeke, S. P., Tarot, S., Tetoni, E., Thompson, E., Thomson, J., Tomassini, L., Totems, J., Ubele, A. A., Villiger, L., von Arx, J., Wagner, T., Walther, A., Webber, B., Wendisch, M., Whitehall, S., Wiltshire, A., Wing, A. A., Wirth, M., Wiskandt, J., Wolf, K., Worbes, L., Wright, E., Wulfmeyer, V., Young, S., Zhang, C., Zhang, D., Ziemen, F., Zinner, T., and Zöger, M.: EUREC4A, Earth Syst. Sci. Data, 13, 4067–4119, https://doi.org/10.5194/essd-13-4067-2021, 2021. a, b, c
Touzé-Peiffer, L., Vogel, R., and Rochetin, N.: Cold Pools Observed during EUREC4A: Detection and Characterization from Atmospheric Soundings, J. Appl. Meteorol. Clim., 61, 593–610, https://doi.org/10.1175/JAMC-D-21-0048.1, 2022. a
Tridon, F., Battaglia, A., and Watters, D.: Evaporation in action sensed by multiwavelength Doppler radars, J. Geophys. Res.-Atmos., 122, 9379–9390, 2017. a, b, c, d
Tukiainen, S., O'Connor, E., and Korpinen, A.: CloudnetPy: A Python package for processing cloud remote sensing data, J. Open Source Softw., 5, 2123, https://doi.org/10.21105/joss.02123, 2020a. a, b
Tukiainen, S., O'Connor, E., and Korpinen, A.: CloudnetPy: A Python package for processing cloud remote sensing data (v1.2.4), Zenodo [code], https://doi.org/10.5281/zenodo.4011843, 2020b. a
Valdivia, J. M., Gatlin, P. N., Kumar, S., Scipión, D., Silva, Y., and Petersen, W. A.: The GPM-DPR Blind Zone Effect on Satellite-Based Radar Estimation of Precipitation over the Andes from a Ground-Based Ka-band Profiler Perspective, J. Appl. Meteorol. Clim., 61, 441–456, https://doi.org/10.1175/jamc-d-20-0211.1, 2022. a, b
van der Velden, E.: CMasher: Scientific colormaps for making accessible, informative and “cmashing” plots, J. Open Source Softw., 5, 2004, https://doi.org/10.21105/joss.02004, 2020. a
Vial, J., Vogel, R., Bony, S., Stevens, B., Winker, D. M., Cai, X., Hohenegger, C., Naumann, A. K., and Brogniez, H.: A new look at the daily cycle of trade wind cumuli, J. Adv. Model. Earth Sy., 11, 3148–3166, 2019. a
Vogel, R., Konow, H., Schulz, H., and Zuidema, P.: A climatology of trade-wind cumulus cold pools and their link to mesoscale cloud organization, Atmos. Chem. Phys., 21, 16609–16630, https://doi.org/10.5194/acp-21-16609-2021, 2021. a
Vogl, T., Maahn, M., Kneifel, S., Schimmel, W., Moisseev, D., and Kalesse-Los, H.: Using artificial neural networks to predict riming from Doppler cloud radar observations, Atmos. Meas. Tech., 15, 365–381, https://doi.org/10.5194/amt-15-365-2022, 2022. a
Witthuhn, J., Röttenbacher, J., and Kalesse-Los, H.: Virga-Sniffer (v1.0.0), Zenodo [code], https://doi.org/10.5281/zenodo.7433405, 2022. a, b, c, d
Xie, X., Evaristo, R., Troemel, S., Saavedra, P., Simmer, C., and Ryzhkov, A.: Radar observation of evaporation and implications for quantitative precipitation and cooling rate estimation, J. Atmos. Ocean. Tech., 33, 1779–1792, 2016. a, b, c, d
- Abstract
- Introduction
- Data sets
- Methodology – description of the Virga-Sniffer
- Virga-Sniffer results from RV Meteor observations during EUREC4A
- Summary, conclusions, and outlook
- Appendix A: Virga-Sniffer recommended configuration
- Appendix B: Sensitivity of Virga-Sniffer
- Code and data availability
- Author contributions
- Competing interests
- Disclaimer
- Acknowledgements
- Financial support
- Review statement
- References