the Creative Commons Attribution 4.0 License.
the Creative Commons Attribution 4.0 License.
 | 17 Jan 2023
Development and validation of a new in situ technique to measure total gaseous chlorine in air
Teles C. Furlani
RenXi Ye
Jordan Stewart
Leigh R. Crilley
Peter M. Edwards
Tara F. Kahan
Total gaseous chlorine (TClg) measurements can improve our understanding of unknown sources of Cl in the atmosphere. Existing techniques for measuring TClg have been limited to offline analysis of extracted filters and do not provide suitable temporal information on fast atmospheric processes. We describe high-time-resolution in situ measurements of TClg by thermolyzing air over a heated platinum (Pt) substrate coupled to a cavity ring-down spectrometer (CRDS). The method relies on the complete decomposition of TClg to release Cl atoms that react to form HCl, for which detection by CRDS has previously been shown to be fast and reliable. The method was validated using custom organochlorine permeation devices (PDs) that generated gas-phase dichloromethane (DCM), 1-chlorobutane (CB), and 1,3-dichloropropene (DCP). The optimal conversion temperature and residence time through the high-temperature furnace was 825 ∘C and 1.5 s, respectively. Complete conversion was observed for six organochlorine compounds, including alkyl, allyl, and aryl C–Cl bonds, which are amongst the strongest Cl-containing bonds. The quantitative conversion of these strong C–Cl bonds suggests complete conversion of similar or weaker bonds that characterize all other TClg. We applied this technique to both outdoor and indoor environments and found reasonable agreements in ambient background mixing ratios with the sum of expected HCl from known long-lived Cl species. We measured the converted TClg in an indoor environment during cleaning activities and observed varying levels of TClg comparable to previous studies. The method validated here is capable of measuring in situ TClg and has a broad range of potential applications.
- Article
(1425 KB) - Full-text XML
-
Supplement
(1243 KB) - BibTeX
- EndNote


Chlorine (Cl)-containing compounds in the atmosphere can impact air quality, climate, and health (Saiz-Lopez and Von Glasow, 2012; Simpson et al., 2015; Massin et al., 1998; White and Martin, 2010). Gaseous chlorinated compounds are either organic (e.g., dichloromethane, chloroform, and carbon tetrachloride) or inorganic (e.g., Cl2, HCl, and ClNO2), with inorganic Cl being more reactive under most atmospheric conditions. In this work, total gaseous Cl (TClg) refers to all gas-phase Cl-containing species weighted according to their Cl content, including both inorganic and organic species. While groups of chlorinated species are often considered based on reactivity considerations (e.g., reactive chlorine, Cly), TClg includes all molecules that contain one or more Cl atoms:
Impacts on air quality and climate are due to the high reactivity of atomic Cl produced by common atmospheric reactions (e.g., photolysis and oxidation) of Cl-containing compounds (Riedel et al., 2014; Sherwen et al., 2016; Haskins et al., 2018). The Cl cycle is important to atmospheric composition in the stratosphere and troposphere, affecting species including methane, ozone, and particles (both formation and composition), which influence air quality and climate (Solomon, 1999; Riedel et al., 2014; Young et al., 2014; Sherwen et al., 2016). High levels of some TClg species (e.g., Cl2 and carbon tetrachloride) are known to be toxic (White and Martin, 2010; Unsal et al., 2021). The implications of many TClg species on human health are not well understood for low-level exposure for extended periods of time. Potential health impacts of organic chlorinated compounds include hepatotoxicity, nephrotoxicity, and genotoxicity (Unsal et al., 2021; Henschler, 1994). The impacts of inorganic chlorinated species include the chlorination of squalene, a major part of human skin oils, by HOCl (Schwartz-Narbonne et al., 2019); respiratory irritation and airway obstruction by Cl2 (White and Martin, 2010); and increased incidence of asthma and other chronic respiratory issues following exposure to chloramines (Massin et al., 1998).
Sources of Cl in the atmosphere are highly variable and depend on both direct emissions and indirect regional Cl activation chemistry (Finlayson-Pitts, 1993; Raff et al., 2009; Khalil et al., 1999). Direct emissions of TClg can come from numerous natural and anthropogenic activities such as, but not limited to, ocean and volcanic emissions, biomass burning, disinfection (i.e., household cleaning, pool emission), use of solvents and heat transfer coolants, and incineration of chlorinated wastes (Blankenship et al., 1994; Lobert et al., 1999; Keene et al., 1999; Butz et al., 2017; Wong et al., 2017; Fernando et al., 2014). Activation of Cl is another source, occurring when atmospheric processes transform relatively unreactive chloride (Cl−, such as sea salt, NaCl) into reactive gaseous chlorine (Cly), which will contribute to TClg. Understanding global levels of TClg is difficult due to complex emissions and chemistry. Our best estimates come from modelling studies combined with collaborative efforts to compose policy reports on halogenated substances, such as the World Meteorological Organization's (WMO's) Scientific Assessment of Stratospheric Ozone Depletion (WMO, 2018). Mixing ratio estimates of halogenated species from this report are summed from individual measurements (e.g., National Oceanic and Atmospheric Administration (NOAA) and Advanced Global Atmospheric Gases Experiment (AGAGE)). The WMO report includes flask (captured gas from clean air sectors) and in situ measurements from field campaigns and routine sampling sites (e.g., CONvective Transport of Active Species in the Tropics (CONTRAST)) (Prinn et al., 2018; Pan et al., 2017; Andrews et al., 2016; Montzka et al., 2021; Adcock et al., 2018). In the most recent WMO report (2018), a decrease of 12.7±0.9 pptv Cl yr−1 in total tropospheric Cl was determined for Montreal Protocol-controlled substances (e.g., chlorofluorocarbons (CFCs) and hydrochlorofluorocarbons (HCFCs)). The decrease in Montreal Protocol-controlled emissions has been slightly offset by an increase in relatively short-lived substances (e.g., dichloromethane) that are not controlled by the Montreal Protocol (WMO, 2018). Despite the emissions of these regulated chlorinated species being relatively well constrained, new sources for some of these compounds have appeared in the recent past. For example, unexpected increases observed in CFC-11 emissions suggested new unreported production (WMO, 2018). A new source of chloroform was also recently identified and attributed to halide-containing organic matter derived from penguin excrement in the Antarctic tundra (Zhang et al., 2021). Atmospheric levels of TClg will additionally be impacted by emission sources that are relatively poorly constrained, including combustion and disinfection. Increasing levels of chlorinated species from known and unknown pathways were observed in a recent ice core study, which estimated an increase of up to 170 % of Cly (= BrCl + HCl + Cl + ClO + HOCl + ClNO3 + ClNO2 + ClOO + OClO + 2 • Cl2 + 2 • Cl2O2 + ICl) from preindustrial times to the 1970s, which could be attributed to mostly anthropogenic sources (Zhai et al., 2021).
Understanding TClg source and sink chemistry is important not only for the ambient atmosphere but also for indoor environments. Uncertainty in sources and levels of chemicals, including Cl-containing compounds, indoors is related to heterogeneity in sources and individual indoor environments and the fact that relatively few studies have focused on indoor chemistry compared to outdoor chemistry. The role of chlorinated species on indoor air quality has been investigated in a few studies (Mattila et al., 2020; Wong et al., 2017; Dawe et al., 2019; Giardino and Andelman, 1996; Shepherd et al., 1996; Doucette et al., 2018; Nuckols et al., 2005). Most studies have focused on cleaning with Cl-based cleaners, in which HOCl and other inorganic compounds have been observed in the gas phase at high levels (Wong et al., 2017; Wang et al., 2019; Mattila et al., 2020). Some studies have reported the presence of organic chlorinated species such as chloroform and carbon tetrachloride above bleach cleaning solutions indoors (Odabasi, 2008; Odabasi et al., 2014), and chloroform has been observed during water-based cleaning activities, such as showering and clothing washing (Nuckols et al., 2005; Shepherd et al., 1996; Giardino and Andelman, 1996).
Constraining the Cl budget is critical to better understanding its contributions to climate, air quality, and human health. Robust total Cl measurements are useful because it is not always feasible to routinely deploy individual measurements of the large number of known Cl-containing compounds (Table S1 in the Supplement). As described above, estimates of TClg from models and summed measurements have demonstrated gaps in our knowledge. It is therefore essential to have a method capable of measuring true TClg to explain discrepancies between model and measured estimates due to unknown species. Measurements of total elemental composition in the condensed phase, including total Cl, have been used for monitoring and managing both known and unknown compounds (Miyake et al., 2007c, a; Yeung et al., 2008; Miyake et al., 2007b; Kannan et al., 1999; Xu et al., 2003; Kawano et al., 2007). However, TClg methods have been limited to offline analysis of scrubbed sample gas (e.g., flue); these methods rely on multiple extraction steps and the application of condensed-phase total Cl analyses, such as combustion ion chromatography (Miyake et al., 2007a; Kato et al., 2000) or neutron activation analysis (Berg et al., 1980; Xu et al., 2006, 2007). Because offline techniques suffer from extraction uncertainties and do not have the temporal resolution to effectively probe fast chemistry in the atmosphere, in situ measurements of total elemental gaseous composition have been developed for several elements (Hardy and Knarr, 1982; Veres et al., 2010; Roberts et al., 1998; Maris et al., 2003; Yang and Fleming, 2019). For example, total nitrogen has been measured using Pt-catalyzed thermolysis coupled to online chemiluminescence detection (Stockwell et al., 2018). Using a similar approach, we describe here a method for TClg, where catalyzed thermolysis is coupled to a high-time-resolution HCl cavity ring-down spectrometer (CRDS). This technique relies on the complete thermolysis of TClg, which yields chlorine atoms. These Cl atoms readily form HCl via hydrogen abstraction (Reaction R1), in this case from propane (or its thermolysis products) that is supplied in excess.
The objectives of this paper are as follows: (i) to develop and validate an instrument capable of in situ measurement of TClg through conversion to HCl and detection by CRDS; and (ii) to demonstrate application of the technique to outdoor and indoor TClg measurements.
2.1 Chemicals
Commercially available reagents were purchased from Sigma-Aldrich (Oakville, Ontario, Canada): dichloromethane (DCM, HPLC grade), 1-chlorobutane (CB, 99.5 %), cis-1,3-dichloropropene (DCP, 97 %), trichlorobenzene (TrCB, 99 %), tetrachlorobenzene (TeCB, 98 %), pentachlorobenzene (PeCB, 96 %), sodium chloride, and 52-mesh-sized platinum (99.9 %). Toluene (HPLC grade) was purchased from BDH VWR (Mississauga, Ontario, Canada). Nitrogen (grade 4.8), and propane (C3H8, 12.7 % in nitrogen, v/v) gas was purchased from Praxair (Toronto, Ontario, Canada). Experiments used deionized water generated by a Barnstead Infinity Ultrapure Water System (Thermo Fisher Scientific, Waltham, Massachusetts, USA; 18.2 MΩ cm−1). A permeation device (PD) described previously was used to generate gaseous HCl (Furlani et al., 2021). Chlorine-free zero air was generated by a custom-made zero-air generator.
2.2 HCl and total chlorine (HCl–TCl) instrument
The main components of the HCl–TCl (Fig. 1) are platinum catalyst mesh, a quartz glass flow tube, a split-tube furnace (Protégé Compact, 1100 ∘C max temperature, Thermcraft Incorporated, North Carolina, USA), and a CRDS HCl analyzer (Picarro G2108 Hydrogen Chloride Gas Analyzer). The platinum catalyst consisted of ∼ 2 g platinum mesh with a total combined surface area of 134 cm2. Sample gas was mixed with critical orifice-regulated (Lenox laser, Glen Arm, Maryland, USA, 30 psi; SS-4-VCR-2-50) propane gas (62±6 standard cubic centimetres per minute (sccm)), provided in excess prior to introduction to the furnace to promote Reaction (R1). The added propane does not fully thermolyze at temperatures < 650 ∘C, which can lead to spectral interferences in the CRDS analyzer (Fig. S1) and should only be added when temperatures exceed 650 ∘C (Furlani et al., 2021). All lines and fittings were made of perfluoroalkoxy (PFA) unless stated otherwise. The mixing line carrying clean air dilution flows was controlled by a 10 L min−1 mass flow controller (MFC, GM50A, MKS instruments, Andover, Massachusetts, USA). The length of the sample gas tubing to the furnace was 0.6 m, and the transfer line between the furnace and CRDS was 0.2 m. The furnace transfer line met an overflow tee when delivering flows greater than the CRDS flow rate of 2 L min−1. The coupled CRDS can capture transient fast HCl formation processes on the timescale of a few minutes, limited by the high adsorption activity of HCl on inlet surfaces (discussed further in Sect. 3.3). The CRDS collects data at 0.5 Hz. Limits of detection (LODs) for the CRDS were calculated as 3 times the Allan–Werle deviation in raw signal intensity when overflowing the inlet with zero air directed into the CRDS for ∼ 10 h. The 30 s LOD is 18 pptv and is well below the expected HCl from TClg conversion (Furlani et al., 2021).
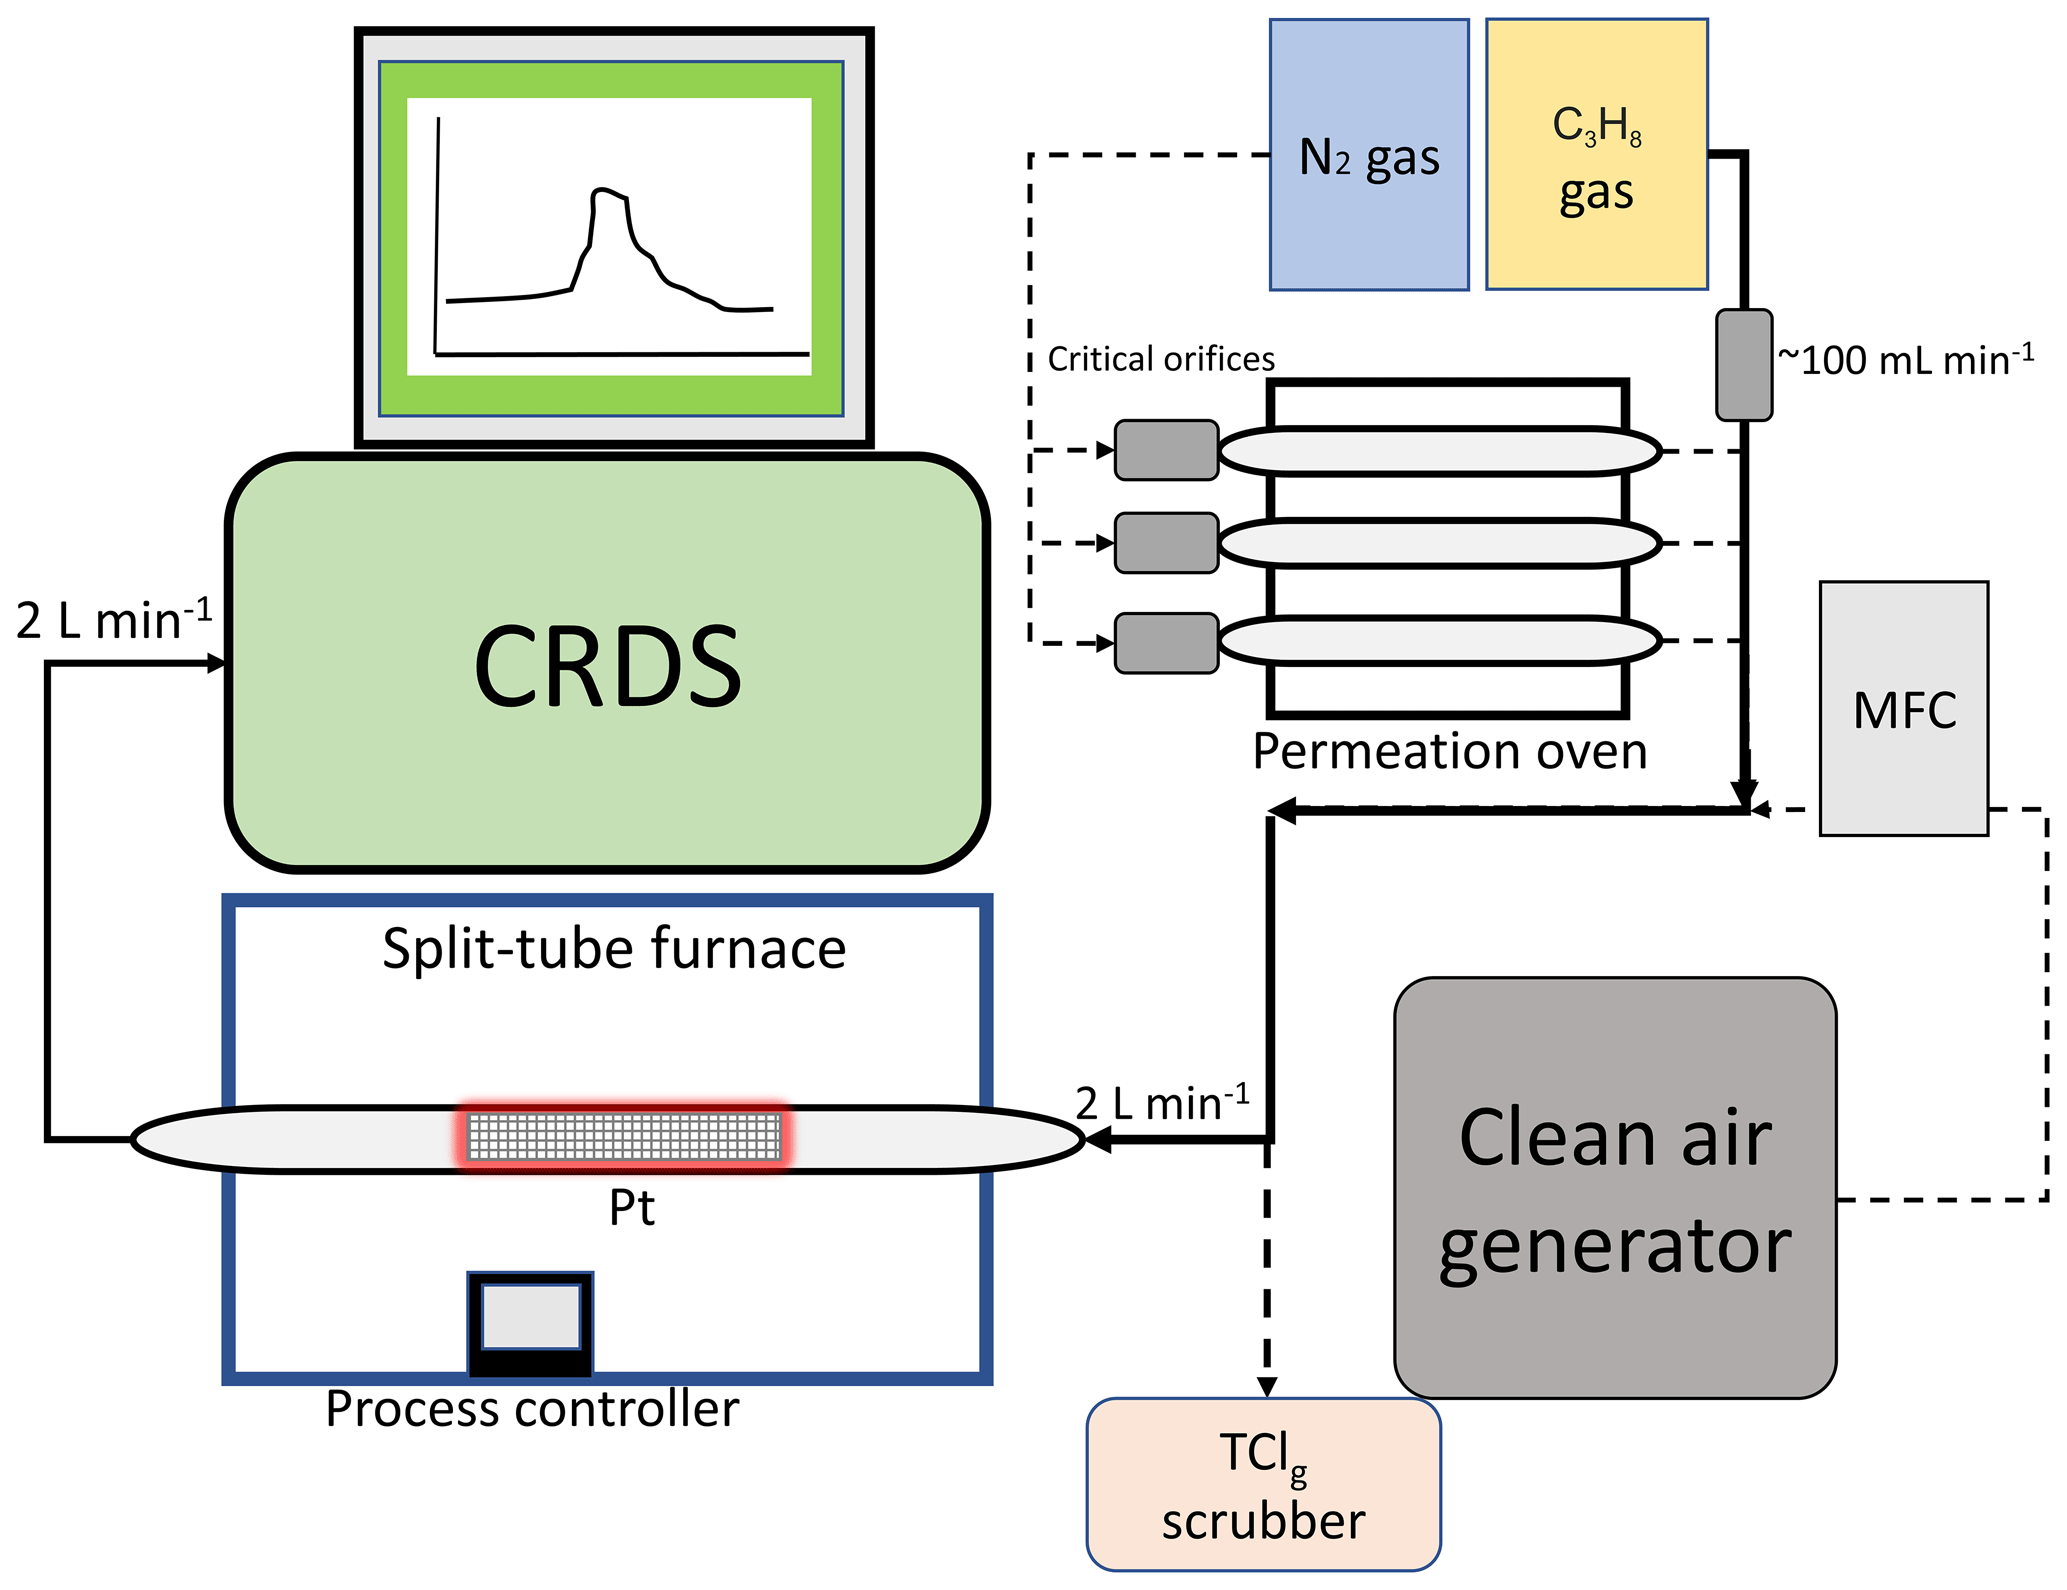
Figure 1Sampling schematic showing the key components of the HCl–TCl coupled to the CRDS analyzer. Dashed lines indicate parts of the apparatus used only during validation. Not to scale.
2.3 Preparation of organochlorine permeation devices (PDs)
Organochlorine PDs were prepared as follows: approximately 200 µL of DCM, CB, or DCP was pipetted into a 50 mm PFA tube (3 mm i.d. with 1 mm thickness), thermally sealed at one end and plugged at the other end with porous polytetrafluoroethylene (PTFE) (13 mm length by 3.17 mm o.d.). The polymers allow a consistent mass of standard gas to permeate at a given temperature and pressure. The method for temperature and flow control of the PDs is described in detail in Lao et al. (2020). Briefly, an aluminum block that was temperature controlled (Omega™; CN 7823, Saint-Eustache, QC, Canada) using a cartridge heater (Omega™; CIR-2081/120V, Saint-Eustache, QC, Canada) housed the PD and was regulated to 30.0±0.1 ∘C. Dry N2 gas flowed through a PFA housing tube (1.27 cm o.d.) in the block that contained the PD. Stable flows of carrier gases passed through the housing tube in the oven were achieved using a 50 µm diameter critical orifice (Lenox laser, Glen Arm, Maryland, USA, 30 psi; SS-4-VCR-2-50) and were 120±12, 99±9.9, and 120±12 sccm for DCM, CB, and DCP, respectively. Flows were measured using a DryCal Definer 220 (Mesa Labs, Lakewood, Colorado, USA). The mass emission rate of each organochlorine from the PDs was quantified gravimetrically over a period of approximately 4 weeks (mass accuracy ±0.001 g). Mass emission rates for each PD were determined as 640±10, 240±40, and ng min−1 (n=3, ±1σ) at 30 ∘C for DCM, CB, and DCP, respectively.
2.4 HCl–TCl optimization
Gas-phase standards of DCM, CB, and DCP were used to test the conversion efficiency of chlorinated compounds to form HCl. Bond dissociation energies for carbon–Cl bonds typically range between 310 and 410 kJ mol−1 (Tables S1, S2). The split-tube furnace has a process controller capable of increasing or decreasing temperature at a set ∘C min−1, which allowed us to identify the temperature at which enough energy was provided to break the bonds. By introducing a consistent amount of each of the organochlorines, separately, to the HCl–TCl set over a simple temperature-ramping program, we could monitor in real time the conditions necessary to break the bonds by measuring the formation of the resulting HCl. The operating temperature was determined when complete conversion of the measured TClg for the tested compounds was sustained at 100 % conversion based on PD emission rates.
To determine the optimal residence time in the quartz tube with the Pt catalyst, flows of 0.6–5.5 L min−1 containing DCM sample gas in clean air were tested, yielding a range of residence times between 0.5 and 4.5 s in the furnace. Temperature remained constant at 825 ∘C throughout the experiment, and a dilution flow of 4.0 L min−1 of clean air was added to the sample flow exiting the furnace before introduction to the CRDS.
We tested the HCl transmission of the HCl–TCl at two mixing ratios (18 and 10 ppbv) using a 12 M HCl PD with zero-air dilution flows of 3.5 or 5 L min−1 using a 5 L min−1 MFC (GM50A, MKS instruments, Andover, Massachusetts, USA). The HCl recovery through the furnace was tested by comparing measured HCl mixing ratios through HCl–TCl to those with the furnace flow tube replaced by a similar length of tubing. A heat gun (Master Varitemp®vt-750c) was used to heat the flow tube entrance to ∼ 80 ∘C to minimize HCl sorption. We tested the HCl–TCl conversion efficiency for five different mixing ratios of three organochlorine PD standards (DCM, CB, and DCP) under three conditions: (1) both Pt catalyst and added propane, (2) only Pt catalyst, and (3) only added propane. Each gas was tested individually under the same conditions; sample gas from PDs was mixed with propane and immediately diluted into clean air using a 10 L min−1 MFC. The dilution flows ranged from 2.2 to 9.0 L min−1. The sampling lines were the same lengths as stated previously. In this experiment, the CRDS flow rate of 2 L min−1 was sufficient to give an optimal residence time of 1.5 s through the HCl–TCl (see Sect. 3.1). In all experiments, the CRDS subsampled through the furnace from the main transfer line, and the excess gas was directed outdoors through a waste line containing a carbon trap (Purakol, Purafil, Inc, Doraville, Georgia, USA). We also tested the HCl–TCl conversion efficiency for two different quantities of three chlorobenzenes (TrCB, TeCB, and PeCB). Due to their high boiling points, PDs of these compounds could not be prepared. Instead, small volumes of approximately 1 mM solutions of these compounds dissolved in toluene were directly introduced to the HCl–TCl while it was sampling room air. Room air measurements of TClg were consistently >1 ppbv. These were measured before each experiment and did not affect the peak integration described below. With a short piece of tubing used as an inlet, 1 and 2 µL of each compound were injected onto the inner surface of the tubing, which was heated to ∼ 100 ∘C with a heat gun to facilitate volatilization. The resulting signals were integrated over a time period of 2.5 h to obtain the total quantity of HCl detected by the CRDS, which was used to calculate conversion efficiency. To account for uncertainties in peak integration, a high and low peak area boundary was determined, with the average peak area taken for each injection. Duplicates of each injected quantity were performed, except for 1 µL TrCB, which was performed in triplicate.
To determine if there was any positive bias in the TClg, measurement from the conversion of particulate chloride (pCl−), NaCl aerosols were generated by flowing 2 L min−1 of chlorine-free zero air through a nebulizer containing a solution of 2 % w/w NaCl in deionized water. The aerosol flow was then mixed with 1 L min−1 of chlorine-free dry zero air to achieve a total flow of 3 L min−1. The HCl–TCl (2 L min−1) then sampled off this main mixing line. Chloride was added after monitoring background zero-air levels. After ∼ 3 h of measuring the converted pCl−, a PTFE filter (2 µm pore size, 47 mm diameter, Tisch scientific, North Bend, Ohio, USA) was added inline onto the inlet of the HCl–TCl.
2.5 Outdoor air HCl–TCl measurements
Outdoor air sampling was performed between 00:00 on 7 July to 20:00 on 11 July 2022 (eastern daylight time, EDT). The sampling site was the air quality research station located on the roof of the Petrie Science and Engineering building at York University in Toronto, Ontario, Canada (43.7738∘ N, 79.5071∘ W, 220 m above sea level). The HCl–TCl was co-located with a Campbell Scientific weather station paired with a cr300 data logger. All inlet lines and fittings were made of PFA unless stated otherwise. All indoor inlet lines and fittings were kept at room temperature. A mass flow controller (GM50A, MKS instruments, Andover, Massachusetts, USA) regulated a sampling flow of 14.7 L min−1 using a diaphragm pump through a 2.4 m sampling inlet (I.D. of 0.375”) from outdoors. The outdoor air was pulled through a 2.5 µm particulate matter cut-off URG Teflon-coated aluminum cyclone (URG Corporation, Chapel Hill, North Carolina, USA) to remove larger particles and was then passed through a PTFE filter (2 µm pore size, 47 mm diameter, Tisch Scientific, North Bend, Ohio, USA). The CRDS subsampled 2 L min−1 through the furnace off the main inlet line, yielding a total inlet flow of 16.7 L min−1. The apparatus had zero air overflow the inlet 1 h prior to and after outdoor sampling. The CRDS sample flow passed first through a PTFE filter (2 µm pore size, 47 mm diameter) and then two high-efficiency particulate air (HEPA) filters contained within the CRDS outer-cavity metal compartment, heat regulated to 45 ∘C. Instances of flagged instrument errors in the CRDS data during ambient observations were removed, as per standard practice in quality control procedures. The dataset can be found in Furlani et al. (2022).
2.6 Indoor air HCl–TCl and HOCl analyzer measurements
To test indoor applications of the HCl–TCl, a 1 m2 area of laboratory floor was cleaned with a commercial spray bottle cleaner (1.84 % sodium hypochlorite w/w), and emissions were compared with an HOCl analyzer. The HOCl analyzer is a commercial instrument designed to quantify gaseous hydrogen peroxide (H2O2) using CRDS (Picarro PI2114 Hydrogen Peroxide Analyzer; Picarro Inc.). The instrument is also sensitive to HOCl due to the similar absorbance wavelengths of their first overtone stretches in the near IR. The wavelengths monitored have been altered to selectively detect HOCl. Details on instrument calibration and validation are provided in Stubbs et al. (2023).
The distance from the suspended 2 m inlet lines of both instruments to the floor was ∼ 1 m. The flow rate through the furnace and inlet was the 2 L min−1 CRDS flow rate. The flow rate for the HOCl analyzer was 1 L min−1. The sectioned-off area was cleaned 4 times, spraying 32 times for each application using the commercial cleaner. Three of these events were measured using the HCl–TCl and HOCl analyzer, while one event was measured using the HCl CRDS only. The dataset can be found in Furlani et al. (2022).
3.1 HCl–TCl temperature and residence time optimization
We validated this method by testing conversion efficiency of organochlorines under different operating parameters and conditions. Testing all TClg species is not feasible, but by testing compounds that contain strong Cl-containing bonds, we infer at least equal efficacy of the system in the breakage of relatively weaker Cl-containing bonds (Tables S1 and S2). We selected strong Cl-containing bonds (i.e., alkyl, allyl, and aryl chlorides) and used them as a proxy for compounds containing weaker Cl bonds; therefore, by demonstrating their complete conversion, we set the precedent for the conversion of all TClg. The temperature of the furnace is a key factor in accomplishing complete thermolysis, and the minimum temperature of the furnace containing the Pt catalyst to break the C–Cl bonds in DCM was determined. A simple temperature-ramping program was used to determine the breakthrough temperature. The temperature was increased at a rate of 2.7 ∘C min−1, starting at 300 ∘C and ending at 800 ∘C. The temperature breakthrough was observed when complete conversion of the expected HCl for the tested compounds (based on PD emission rate) was stable after reaching the optimal temperature. It was found to be ∼ 800 ∘C for the tested organochlorines (Fig. S2).
Determining the optimal residence time of sample gas in the HCl–TCl is also essential for an optimized TClg conversion method. Using a temperature slightly above the observed breakthrough temperature of 800 ∘C determined above (825 ∘C), six residence times were tested with DCM, ranging from 0.5 to 4.5 s in the HCl–TCl (Fig. 2). At each residence time, the conversion efficiency was determined, where conversion efficiency was calculated as follows:
The optimal residence time was ∼ 1.5 s, corresponding to a conversion efficiency of 100.1 %±0.1 %. The uncertainty in conversion efficiency measurements is the variability in the measured HCl signal for 30 min after a signal plateau was observed. The reported uncertainty does not include uncertainties in mixing nor turbulence-induced surface effects, which we cannot quantify. When residence times were lower (i.e., sample gas travelled more quickly through the system) than 1.5 s, the conversion efficiencies were lower by 2 %–10 %, the measured HCl signal was more erratic, and it took longer to stabilize. When residence times were higher (i.e., sample gas travelled more slowly through the system) than 1.5 s, the conversion efficiencies were comparable (± 2 %), but the measured HCl suffered from longer equilibration times (∼ 30 min, more than double the 1.5 residence time) and therefore a slower response time, likely due to increased surface effects of HCl after exiting the furnace. An optimal residence time of 1.5 s was selected for all HCl–TCl experiments for its good conversion efficiency and reasonable response time (see Table S3).
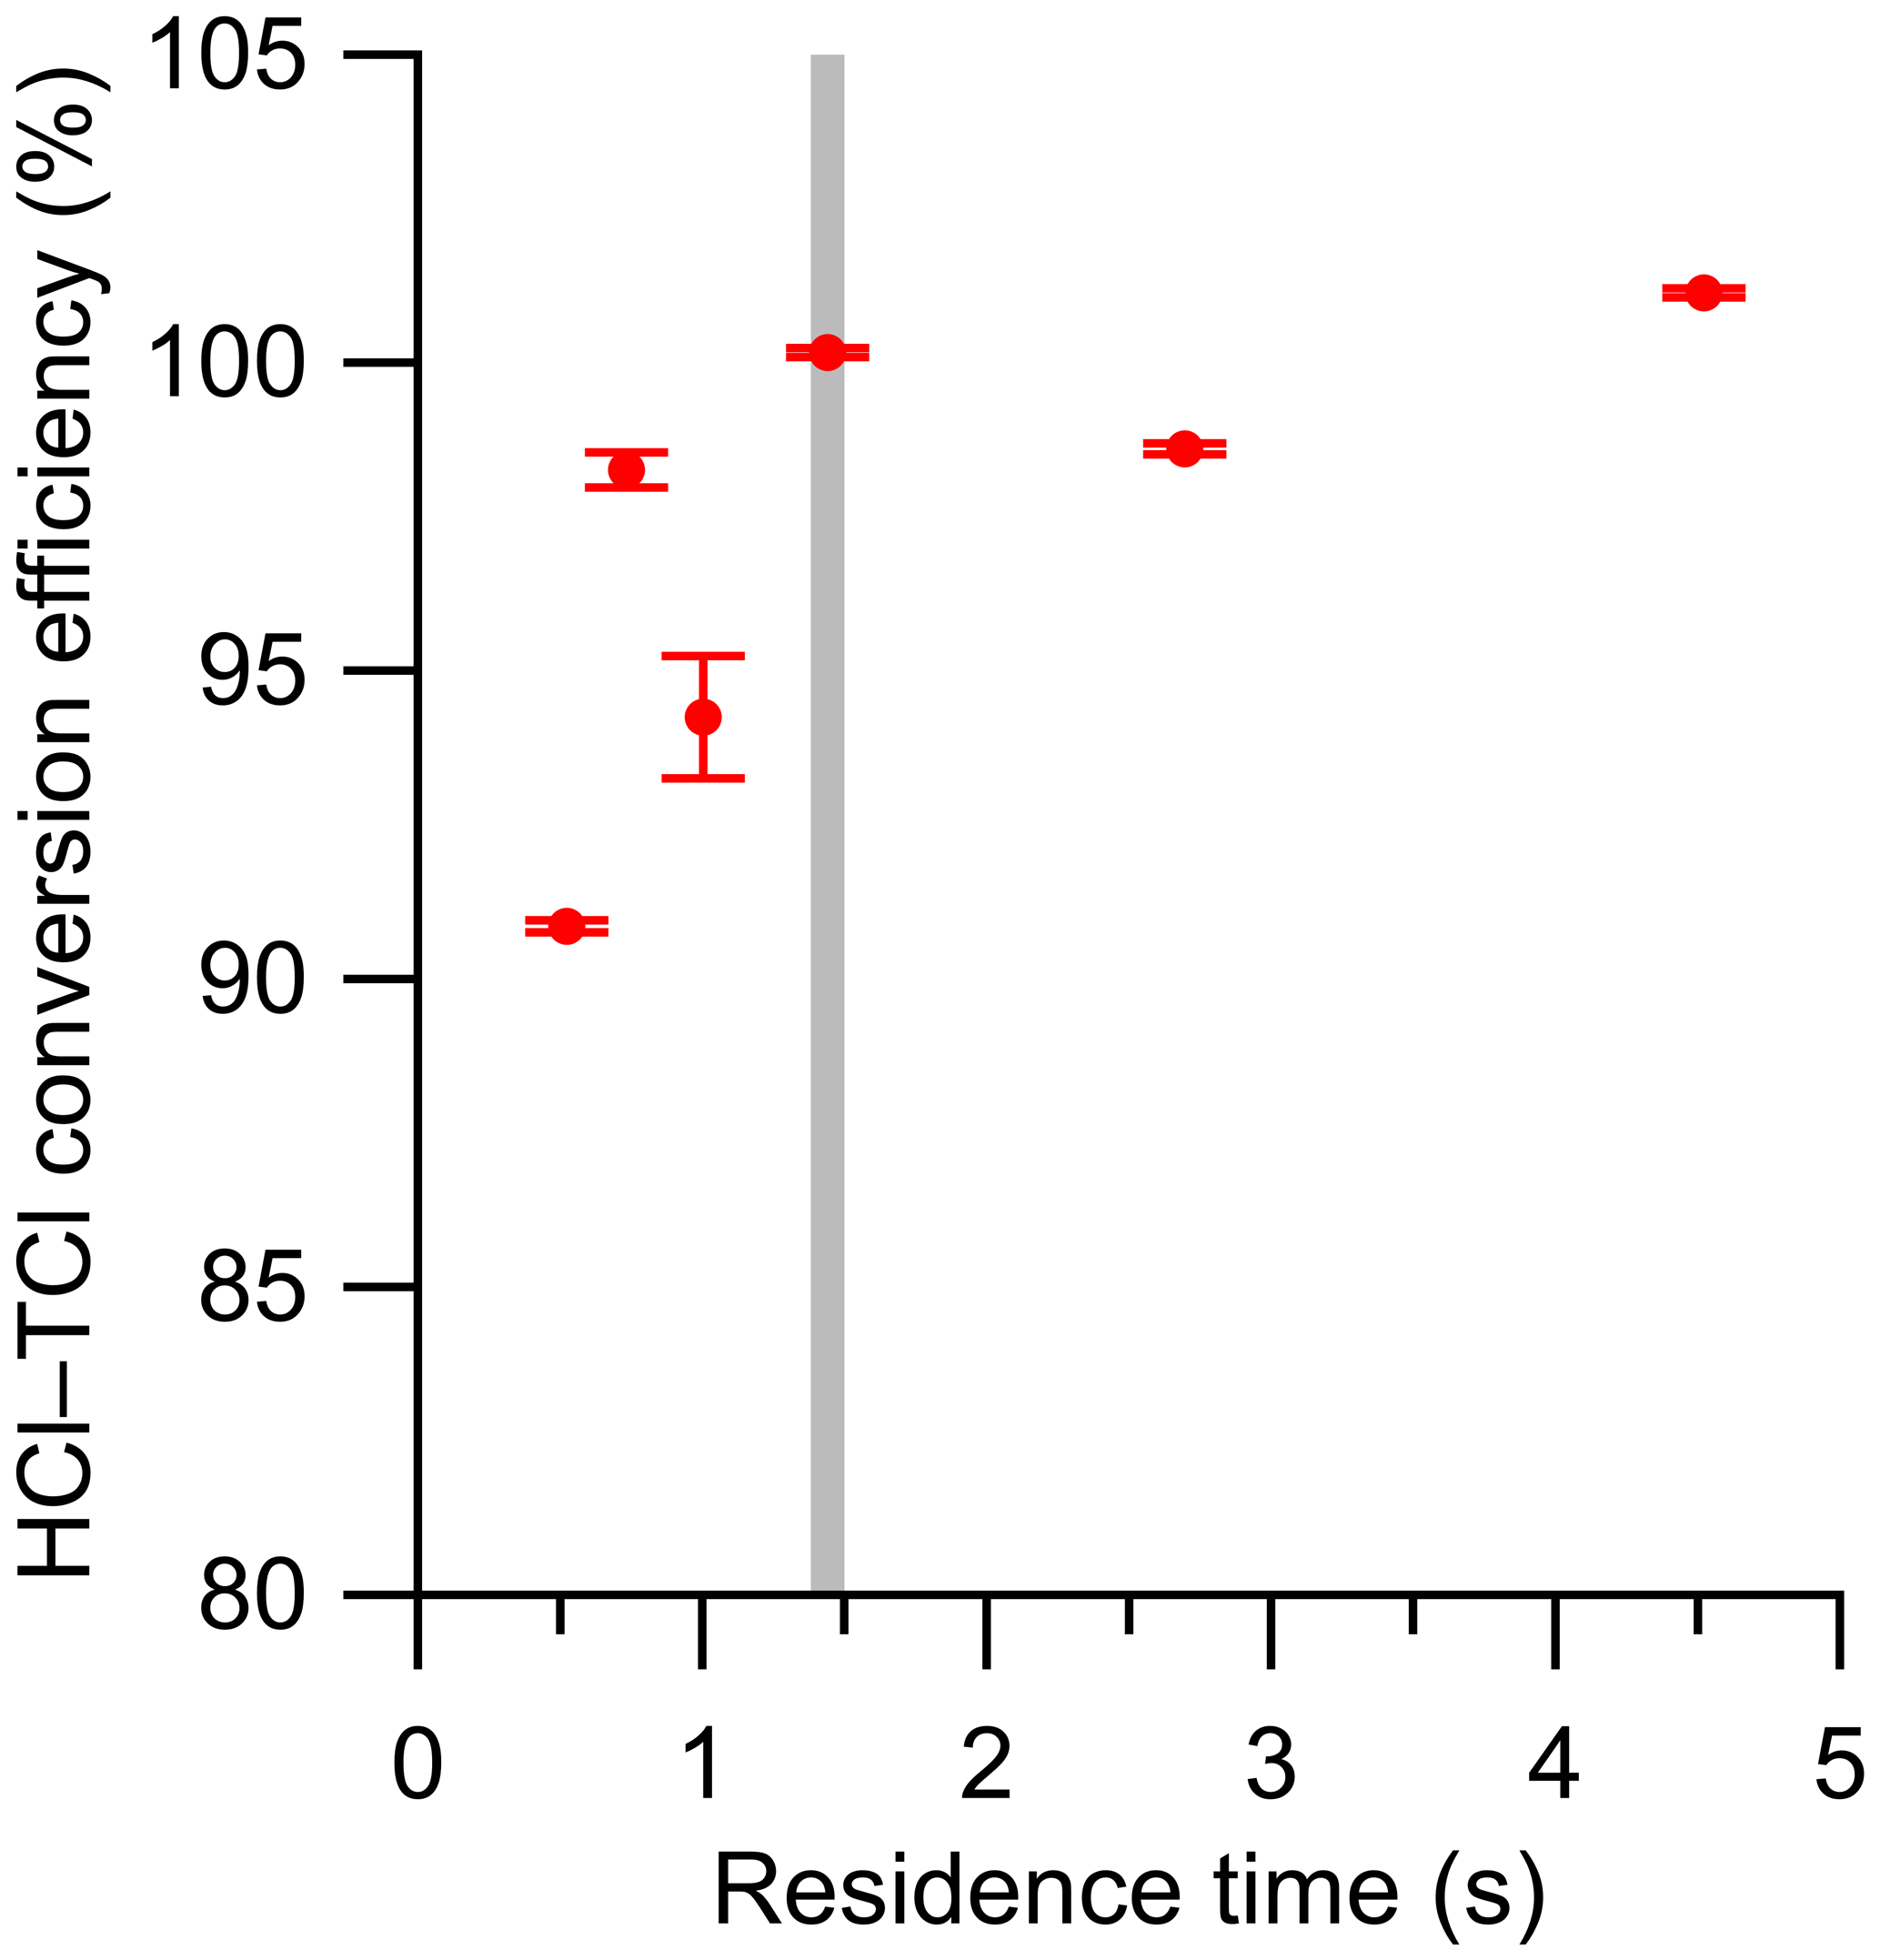
Figure 2Conversion efficiency of DCM plotted against residence time in the HCl–TCl at 825 ∘C. Error bars represent the percent relative standard deviation of the measured HCl by the CRDS over ∼ 30 min, after signal has plateaued. The grey vertical line denotes the selected residence time. Note that the error bars are represented by the precision of the instrument, and we expect that there would be greater experiment-to-experiment variability.
3.2 HCl–TCl conversion efficiency
The efficiency of HCl throughput in the HCl–TCl was tested. Initial tests resulted in transmission efficiencies of 81.2 %±1.4 % (n=3) and 88.1 % (n=1) for 18 ppbv and 10 ppbv HCl, respectively. At the inlet to the furnace, a small piece of the quartz tube was not heated. We hypothesized that complete transmission of HCl was hindered through sorption to that portion of quartz tube. Repeating the experiment with heat applied led to increased throughput efficiencies of 85.7 % (18 ppbv, n=1) and 93.9 % (10 ppbv, n=1). Therefore, good HCl throughput efficiency was demonstrated overall, with the cause of minor HCl losses identified to be sorption losses to room-temperature glass. Conversion of particulate chloride (pCl−) was observed to take place in the HCl–TCl (Fig. S3), but once a filter was introduced the signal returned to background levels. Thus, to capture only gaseous TClg from samples that may contain particulate chloride, a particulate filter should be used. Use of a filter could introduce blow-on (i.e., partitioning of semi-volatile species) and/or blow-off (i.e., processing of particulate chloride) artifacts. We have previously shown that HCl – likely to be the most surface-active component of TClg – is not greatly impacted by the presence of filters (Furlani et al., 2021), indicating that blow-on effects are likely minimal. However, the extent to which blow-on effects should be considered will depend on the composition of the TClg mixture and the temperature. Blow-off effects will depend on ambient particulate chloride levels and can be mitigated by regularly changing the filter to prevent significant particulate chloride accumulation.

Figure 3HCl measured by CRDS plotted against the expected HCl from HCl–TCl-converted DCM (red circle), 1-chlorobutane (blue diamond), and 1,3-dichloropropene (green square) under condition (1). All values are normalized to the highest expected HCl concentration to better illustrate deviations from unity (black line). Error bars on the y axis represent 1σ in the HCl signal over 10 min. Error bars on the x axis represent the uncertainty in the PD used to generate DCM.
The conversion efficiency of each of the two alkyl chlorine compounds and the one allyl chlorine compound using the HCl–TCl was tested at five different mixing ratios. See Table S4 for a summary of mixing ratios used; all lower mixing ratios were generated by diluting the highest mixing ratio of each compound by chlorine-free zero air. All three showed good linearity and near 1:1 correlation with the HCl expected to be formed from the PD under standard operating conditions (Fig. 3). Due to differences in PD emission rates, the values in Fig. 3 are normalized to the highest mixing ratio to visualize comparisons more easily. With both Pt and propane, the HCl–TCl conversion was 99.6 %±3.2 %, 104.8 %±5.6 %, and 102.7 %±7.8 % for DCM, CB, and DCP, respectively (Table 1), as the average conversion efficiency plus or minus relative standard deviation. From Fig. 3 the comparison between expected and measured TClg is illustrated by near unity in the orthogonal distance regression slope (±1σ, the error in the regression analysis) and was 0.996±0.012, 1.048±0.060, and 1.027±0.061 for DCM, CB, and DCP, respectively. With only the Pt catalyst, the HCl–TCl conversion was 80.7 %±0.4 %, 54.1 %±1.6 %, and 54.3 %±3.5 % for DCM, CB, and DCP, respectively (Fig. S4, Table 1). This result indicates that the added hydrogen source (propane) is needed to promote Reaction (R1). Although necessary in this laboratory scenario, some ambient conditions may be rich enough in hydrogen-containing molecules that excess propane is not needed. However, providing propane in excess ensures the presence of an abundance of hydrogen atoms that can be readily abstracted by Cl atoms via Reaction (R1). When the Pt catalyst was removed, the HCl–TCl conversion was 94.4 %±4.6 %, 44.2 %±0.9 %, and 41.7 %±3.4 % for DCM, CB, and DCP, respectively (Fig. S4, Table 1). The observed dependence of the Pt catalyst indicates that a reactive surface is important to achieve complete thermolysis at 825 ∘C. The relatively higher conversion for DCM in the absence of the Pt catalyst or hydrogen source may be attributed to its lower bond dissociation energy (310 kJ mol−1) compared to estimated bond dissociation energies for CB and DCP (CB inferred from Table S2 (∼ 410 kJ mol−1) and DCP from tetrachloroethylene (350 kJ mol−1 in Table S1)). It is possible that a higher temperature could lead to full conversion of TClg in the absence of the Pt catalyst; however, that was not explored in this study. To further validate the HCl–TCl, the conversion efficiency of three aryl chlorine compounds were tested under the final operating conditions (i.e., in the presence of both Pt and added propane). The TClg measured from the three aryl compounds was unity, within the uncertainty of the measurement (Table 1).
Table 1Conversion efficiency for tested Cl-containing compounds under different conditions (both Pt and propane; Pt only; propane only). Note that chlorobenzenes were only tested under Pt and propane conditions.
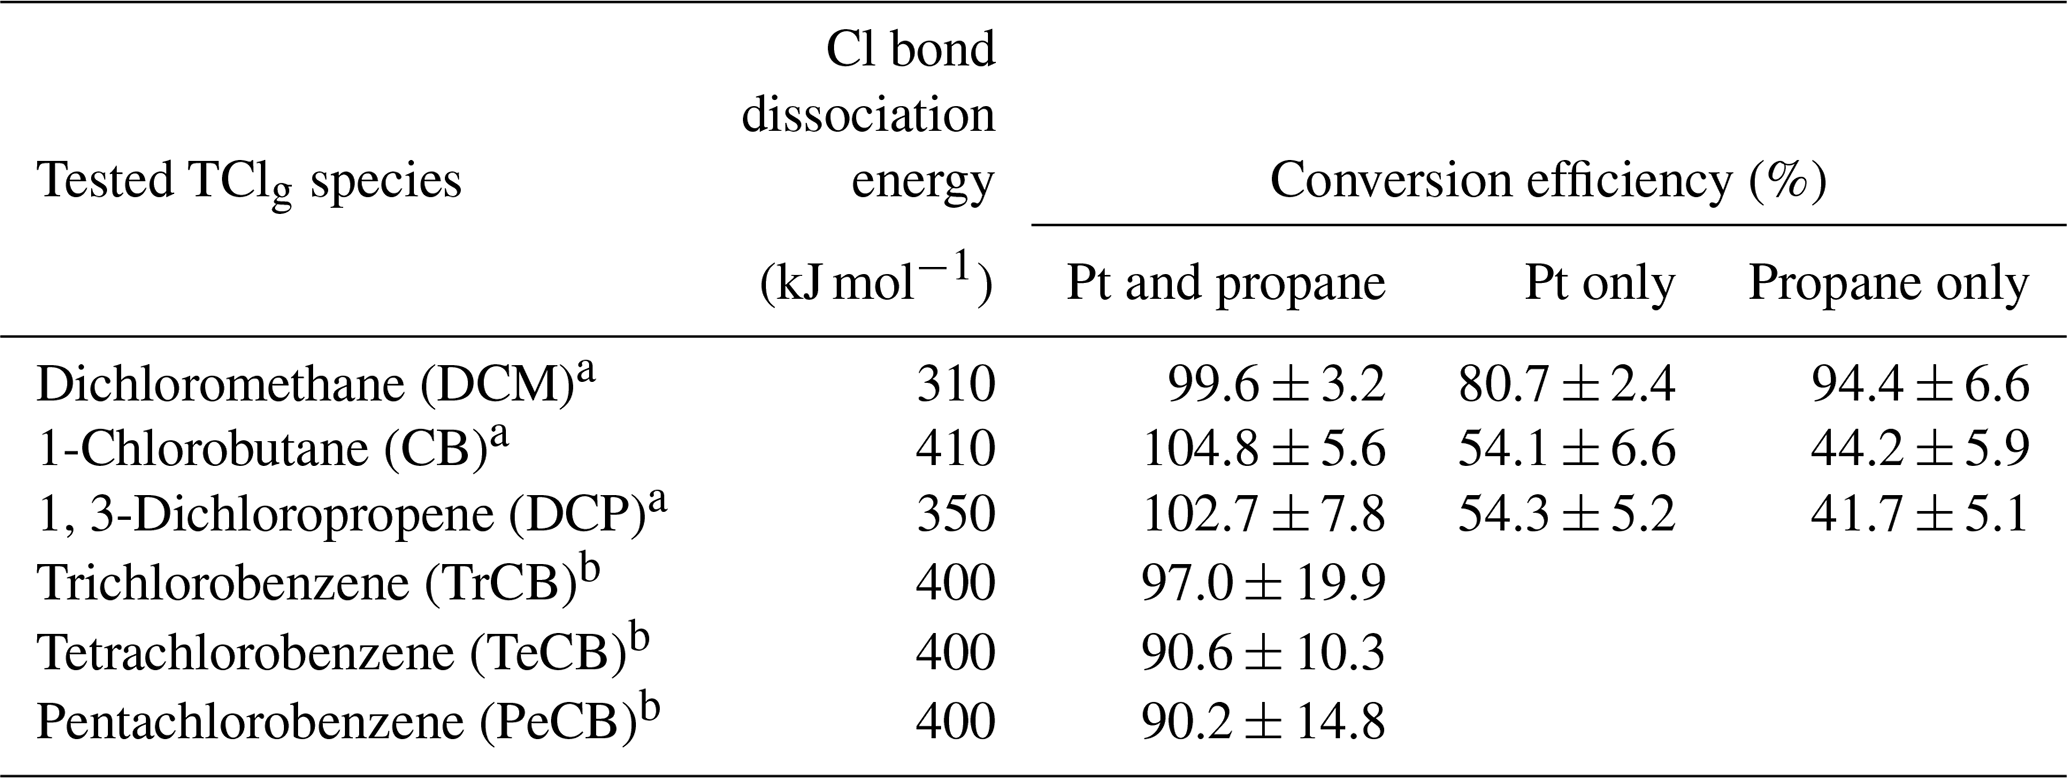
a Conversion efficiency was determined from the orthogonal distance regression slope and ± σ and propagated error from individual permeation devices. b Conversion efficiency was determined directly by the quantity (mol) of HCl measured from liquid injections of 1 mM standards. The error represents ± σ of measurements for n=5 (TrCB) or n=4 (TeCB, PeCB) injections.
The results for all six compounds show that the HCl–TCl is capable of complete conversion of mono- and polychlorinated species on sp3 and sp2 carbons using the determined temperature and flow conditions. The complete thermolysis of the strongest C–Cl bond on the primary alkyl chloride (CB) demonstrates the efficacy of the HCl–TCl. Breaking these relatively strong C–Cl bonds, with consistent conversion efficiency across alkyl, allyl, and aryl C–Cl bonds, is a good proof of concept for complete conversion of all bonds of similar or weaker bond energies that characterize all other TClg. To practically validate the HCl–TCl under real-world conditions with atmospherically relevant TClg mixtures and mixing ratios, we also deployed and configured the system to measure outdoor and indoor air.
3.3 Performance metrics of HCl–TCl
Using a flow of zero air through the HCl–TCl, method limits of detection (LODs) were calculated as 3 times the Allan–Werle deviation (Fig. 4) when overflowing a 20 cm inlet (3.17 mm i.d.) with zero air for 1 h. The LODs determined in the measurements for 2 s, 1 min, 5 min, and 1 h integration times were 73, 15, 10, and 8 pptv, respectively. The response time of the instrument was assessed during experiments with DCM, CB, and CP. The time for the signal to decay after removal of the PDs was determined as 37 % () and 90 % (t90) of the maximum signal. The maximum time to achieve was 23 s, while the maximum time to achieve t90 was 189 s (Table S3). These are comparable to the response times for the HCl CRDS instrument itself (Furlani et al., 2021), suggesting that the addition of the inlet furnace has a modest impact on the residence time. Given the high mixing ratios used to test the response times, we argue that, under most conditions relevant to indoor and outdoor atmospheric chemistry, a sample integration time of 1 min will minimize any time response effects. Data for outdoor and indoor sampling described in Sect. 3.4 and 3.5 were therefore averaged to 1 min. During all experiments with gaseous reagents, no evidence of catalyst performance degradation was observed.
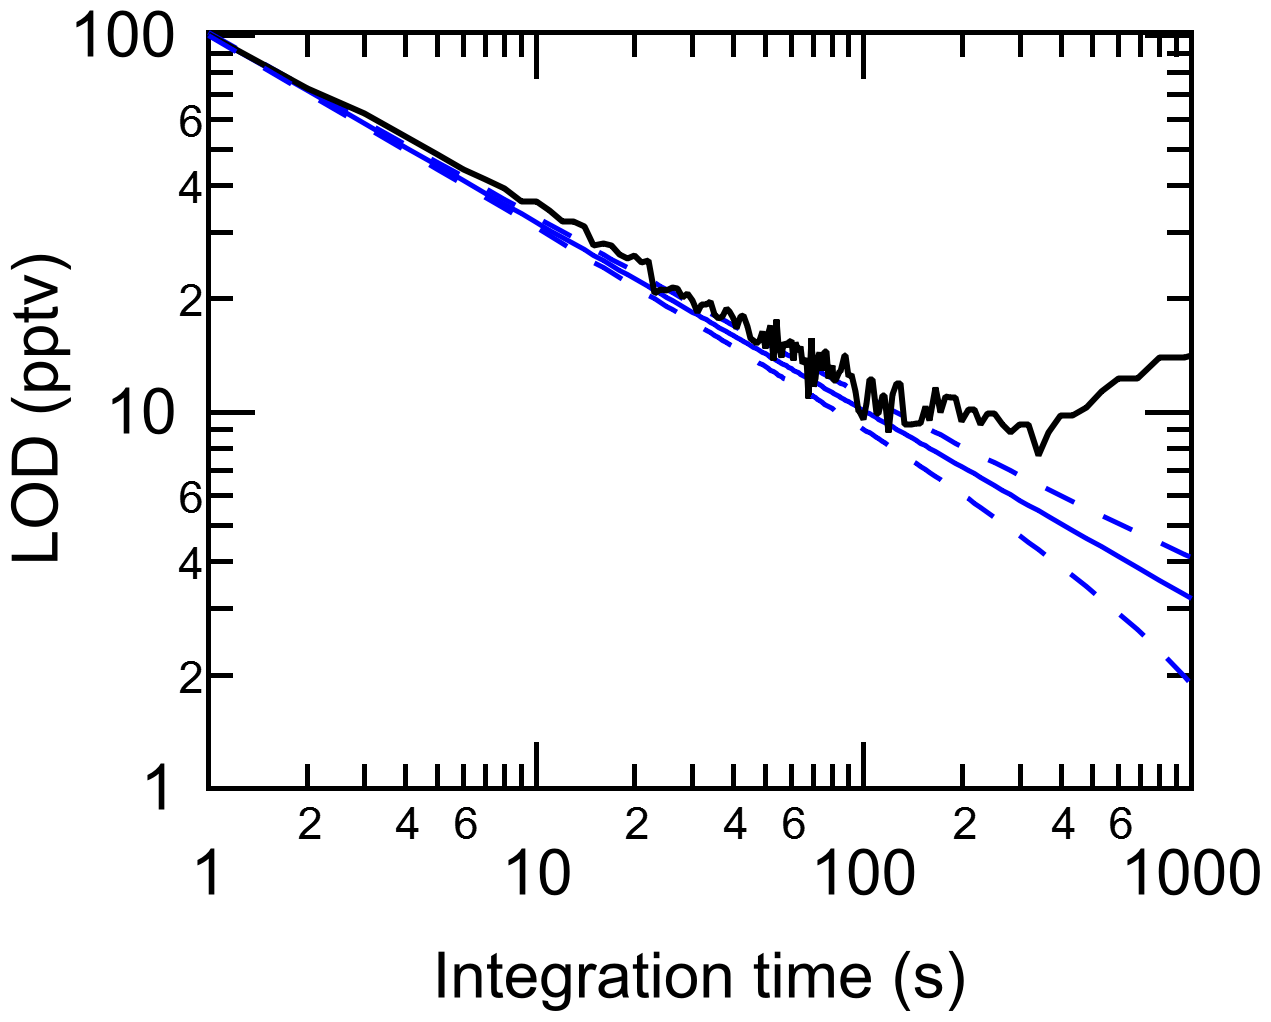
Figure 4Allan–Werle deviation (3σ) in the HCl–TCl purged with zero air (black line) shown with the ideal deviation (no drift, solid blue line) and associated error in the deviation (dashed blue line).
3.4 HCl–TCl applications to outdoor air
We deployed the system to measure ambient outdoor air, which we compare to the expected TClg range from complete thermolysis of previously measured Cl-containing compounds, estimated to be between 3.3 and 19 ppbv (Table S1). Global background levels of long-lived chlorine-containing species (LLClg) are well established (WMO, 2018) and were calculated by Eq. (3) using data from Table S1:
A global background for LLClg of approximately 2.6 ppbv is expected (WMO, 2018; Table S1). The maximum, minimum, and median of observed ambient TClg were 536.3, 2.0, and 3.1 ppbv, respectively (Fig. 5). Measurements of HCl alone were not made during these periods, but reported ranges of HCl mixing ratios for this sampling location from Furlani et al. (2021) and Angelucci et al. (2021) were typically below 110 pptv, with intermittent events up to 600 pptv. The filter present in the inlet was unlikely to have led to artifacts in this measurement. Particulate chloride is negligible in continental summertime environments (Kolesar et al., 2018), indicating that blow-off artifacts would be minimal. Most ambient TClg measurements were above the expected mixing ratio of LLClg. It is possible that semi-volatile chlorinated species could have partitioned to the filter, acting as a blow-on effect and leading to an underestimation of TClg. However, the warm temperatures during sampling (13 to 31 ∘C) and high observed TClg levels suggest this was not a large effect. There is clear evidence of TClg sources beyond LLClg at the sampling site, with several plumes of elevated TClg intercepted. For example, the maximum TClg measurement (536.3 ppbv) was made in a plume just after noon (EDT) on 7 July. Another plume was detected on 11 July, with a maximum TClg of 42.1 ppbv. Though the purpose of this study was not to determine sources of TClg, we observed that plumes containing elevated TClg arrived from the S–SW of the sampling site, where several facilities that had reported tens to thousands of kg of yearly emissions to the air of Cl-containing species are located (Fig. S5).
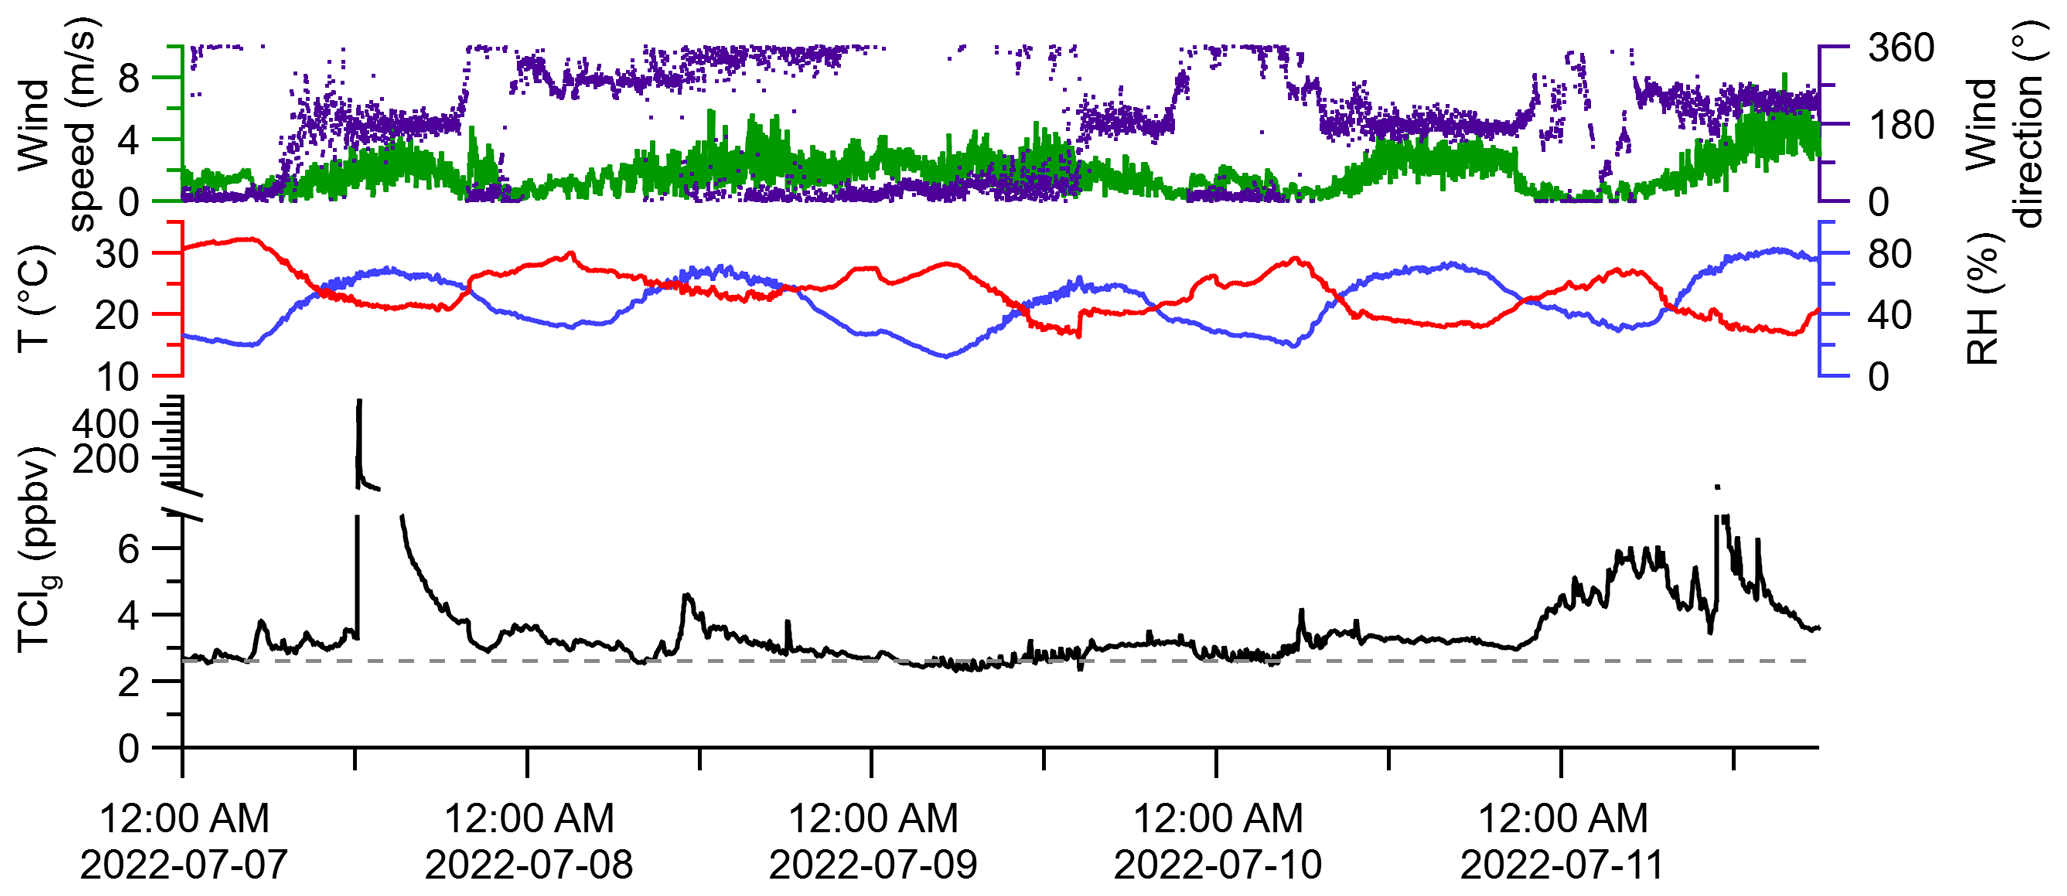
Figure 5Monitoring meteorological conditions and 1 min-averaged TClg in outdoor air through HCl–TCl from 7 to 11 July 2022. The grey dashed line represents the background mixing ratio for LLClg.
3.5 HCl–TCl application to indoor cleaning
We applied a chlorine-based cleaning product four times in a well-lit indoor room and measured TClg using the HCl–TCl and HOCl analyzer during three of the cleaning events (Fig. 6). One cleaning experiment was done without the HCl–TCl and had a maximum of 370 pptv HCl. These levels are comparable to peak HCl levels of ∼ 500 pptv observed from surface applications of bleach (Dawe et al., 2019). Consistent with previous speciated measurements (Mattila et al., 2020; Wong et al., 2017), HCl, HOCl, and TClg levels increased rapidly over ∼ 5 min after the application of the cleaning product. The maximum levels of TClg from HCl–TCl during applications 1, 2, and 3 were 49.2, 80.0, and 69.7 ppbv, respectively. The maximum levels of HOCl from applications 1, 2, and 3 were 19.6, 24.2, and 16.8 ppbv, respectively, corresponding to 24 % to 40 % of peak TClg and 14 % to 22 % of integrated TClg. These TClg levels were several times higher than most observed in outdoor air (Sect. 3.4) and were within the range expected from previous experiments (Table S1). The levels of chlorinated species observed during bleaching events are variable, between 15 to hundreds of ppbv (Mattila et al., 2020; Odabasi, 2008; Wang et al., 2019; Wong et al., 2017). By comparison, our highest observed mixing ratio was 80 ppbv. Because the multiphase chemical processes involved in bleach application are complex and poorly understood, it is difficult to compare levels between similar studies, given that the underlying ambient conditions can be very different. In addition, physical parameters, such as the volume of cleaning solution applied, room size, and ventilation, can all affect observed mixing ratios. For example, studies have observed that gaseous NH3 partitioning into aqueous bleach can produce large and variable amounts of chloramines, NH2Cl, NHCl2, and NCl3 (Mattila et al., 2020; Wong et al., 2017). In our experiments, there was, on average, 82 %±4 % of integrated TClg that could not be accounted for by the HOCl measurement. Additional chlorinated species that have previously been observed to be emitted from surface bleaching include ClNO2, NH2Cl, NHCl2, NCl3, and several chlorinated organics (Odabasi, 2008; Mattila et al., 2020; Wong et al., 2017), which likely also contributed to our measured TClg. We observed that TClg decayed ∼ 15 % faster than the air exchange rate (0.72 h−1), indicating additional chemical loss pathways or surface interactions (Fig. S6). We observed a shorter lifetime of HOCl relative to TClg, which is consistent with faster decay rates observed for HOCl and similar TClg species by Wong et al. (2017). The HOCl started decreasing after ∼ 300 s had elapsed, while the TClg levels were still increasing. This suggests that reactions involving HOCl may have led to additional TClg species, which has been observed in laboratory studies (Wang et al., 2019).
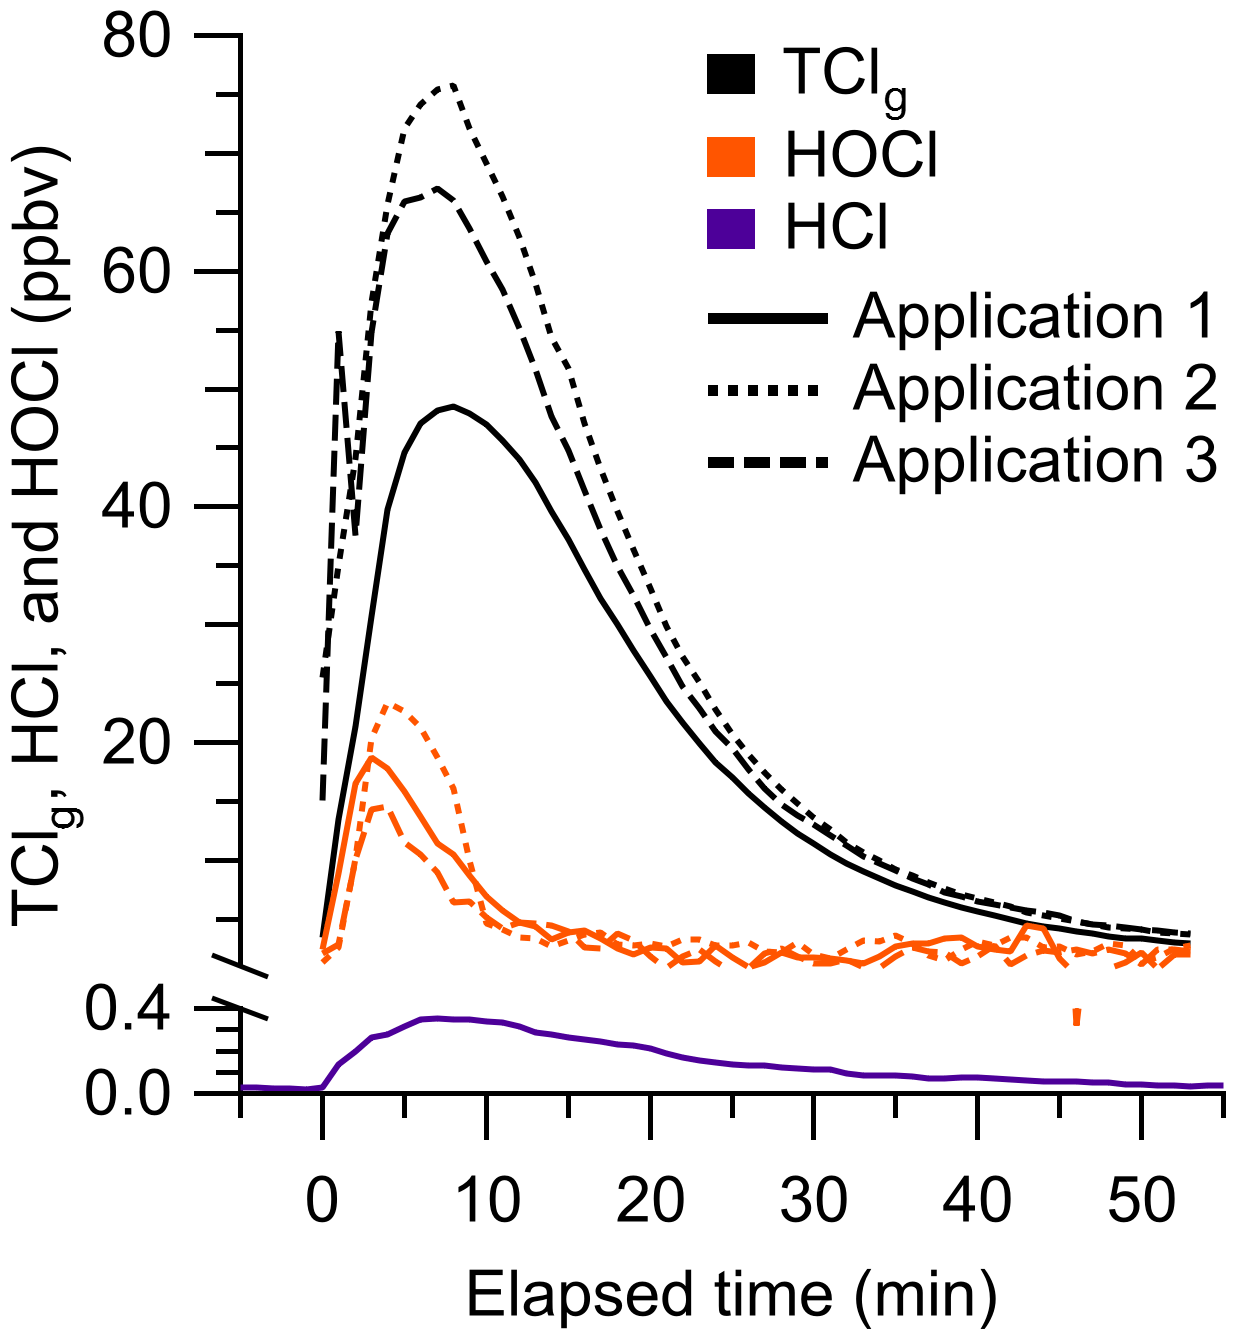
Figure 6One-minute-averaged HCl (purple), HOCl (orange), and TClg (black) observed during cleaning spray events. Mixing ratios were background corrected prior to each cleaning event.
In situ measurements of TClg could provide additional insight into sources of chlorinated species in indoor environments by creating a total inventory from which the contributions of individual measured species can be compared and used to elucidate unknown TClg levels and mechanisms in real time. Furthermore, several chlorinated species that have previously been observed to be emitted from surface bleaching, including Cl2, HOCl, ClNO2, NH2Cl, NHCl2, and NCl3 (Mattila et al., 2020; Wong et al., 2017), have been measured by chemical ionization mass spectrometry (CIMS). Quantifying chlorinated species using CIMS remains challenging due to the required calibrations and difficulty in generating pure gas-phase standards. It is therefore desirable to have a technique such as the one proposed in this study that does not require calibrations or knowledge of potential unknown TClg species. A combination of the two methods would help constrain the total levels while still observing speciation for key TClg species.
In this work, we developed, optimized, validated, and applied a method capable of converting TClg into gaseous HCl for detection by CRDS. Our TClg measurement technique, the HCl–TCl, is composed of a platinum catalyst mesh inside a quartz glass flow tube all contained within a split-tube furnace. The temperature and flow rate were optimized at 825 ∘C and 1.5 s, respectively, using DCM. These conditions were validated by the complete conversion of organochlorine compounds with strong C–Cl bonds. The HCl–TCl was used to measure TClg outdoors, observing a range of 2.0 to 536.3 ppbv. Levels mostly exceeded the expected background mixing ratio of LLClg. We also applied the HCl–TCl to an indoor environment during commercial bleach spray-cleaning events and observed varying increases in TClg (50–80 ppbv), which was in reasonable agreement with levels observed in previous speciated measurements. The agreement of HCl–TCl outdoor and indoor measurements with available bottom-up estimates indicates its efficacy in real-world scenarios. Rapid changes in TClg were observed in both outdoor and indoor environments, indicating the utility of an in situ technique to constrain the sources and chemistry of TClg, as well as its impact on air quality, climate, and health. We anticipate this approach could be used in several applications, including comparisons to speciated measurements of chlorinated compounds and to further explore Cl reactivity and cycling with respect to indoor and outdoor TClg.
Outdoor and indoor datasets can be found in https://doi.org/10.20383/103.0649 (Furlani et al., 2022).
The supplement related to this article is available online at: https://doi.org/10.5194/amt-16-181-2023-supplement.
TCF, RY, JS, and LRC collected and analyzed the data. TCF, RY, LRC, and CJY conceived of and designed the experiments with input from PME and TFK. Funding was obtained by TFK and CJY. The manuscript was written by TCF, RY, and CJY with input from all authors.
The contact author has declared that none of the authors has any competing interests.
Publisher’s note: Copernicus Publications remains neutral with regard to jurisdictional claims in published maps and institutional affiliations.
We acknowledge the Sloan Foundation and Natural Sciences Engineering and Research Council of Canada for funding. We thank Melodie Lao and Yashar Iranpour for collecting air exchange rate data, Andrea Angelucci for collecting meteorological data, Dirk Verdoold for the custom quartz tube, and Chris Caputo, John Liggio, Rob McLaren, and Trevor VandenBoer for the helpful discussions. Peter M. Edwards thanks the European Research Council. Tara F. Kahan is a Canada Research Chair in Environmental Analytical Chemistry. This work was undertaken, in part, thanks to funding from the Canada Research Chairs program.
This research has been supported by the Alfred P. Sloan Foundation (grant no. G-2018-11062), the Natural Sciences and Engineering Research Council of Canada (grant no. RGPIN-2018-05990), the European Research Council, H2020 European Research Council (Trop-ClOC grant (grant no. 802685)), and the Canada Research Chairs (grant no. Canada Research Chair in Environmental Analytical Chemistry).
This paper was edited by Bin Yuan and reviewed by two anonymous referees.
Adcock, K. E., Reeves, C. E., Gooch, L. J., Leedham Elvidge, E. C., Ashfold, M. J., Brenninkmeijer, C. A. M., Chou, C., Fraser, P. J., Langenfelds, R. L., Mohd Hanif, N., O'Doherty, S., Oram, D. E., Ou-Yang, C.-F., Phang, S. M., Samah, A. A., Röckmann, T., Sturges, W. T., and Laube, J. C.: Continued increase of CFC-113a (CCl3CF3) mixing ratios in the global atmosphere: emissions, occurrence and potential sources, Atmos. Chem. Phys., 18, 4737–4751, https://doi.org/10.5194/acp-18-4737-2018, 2018.
Andrews, S. J., Carpenter, L. J., Apel, E. C., Atlas, E., Donets, V., Hopkins, J. R., Hornbrook, R. S., Lewis, A. C., Lidster, R. T., Lueb, R., Minaeian, J., Navarro, M., Punjabi, S., Riemer, D., and Schauffler, S.: A comparison of very short lived halocarbon (VSLS) and DMS aircraft measurements in the tropical west Pacific from CAST, ATTREX and CONTRAST, Atmos. Meas. Tech., 9, 5213–5225, https://doi.org/10.5194/amt-9-5213-2016, 2016.
Angelucci, A. A., Furlani, T. C., Wang, X., Jacob, D. J., VandenBoer, T. C., and Young, C. J.: Understanding sources of atmospheric hydrogen chloride in coastal spring and continental winter, ACS Earth Space Chem., 5, 2507–2516, https://doi.org/10.1021/acsearthspacechem.1c00193, 2021.
Berg, W. W., Crutzen, P. J., Grahek, F. E., Gitlin, S. N., and Sedlacek, W. A.: First measurements of total chlorine and bromine in the lower stratosphere, Geophys. Res. Lett., 7, 937–940, https://doi.org/10.1029/GL007i011p00937, 1980.
Blankenship, A., Chang, D. P. Y., Jones, A. D., Kelly, P. B., Kennedy, I. M., Matsumura, F., Pasek, R., and Yang, G.: Toxic combustion by-products from the incineration of chlorinated hydrocarbons and plastics, Chemosphere, 28, 183–196, https://doi.org/10.1016/0045-6535(94)90212-7, 1994.
Butz, A., Dinger, A. S., Bobrowski, N., Kostinek, J., Fieber, L., Fischerkeller, C., Giuffrida, G. B., Hase, F., Klappenbach, F., Kuhn, J., Lübcke, P., Tirpitz, L., and Tu, Q.: Remote sensing of volcanic CO2, HF, HCl, SO2, and BrO in the downwind plume of Mt. Etna, Atmos. Meas. Tech., 10, 1–14, https://doi.org/10.5194/amt-10-1-2017, 2017.
Dawe, K. E. R., Furlani, T. C., Kowal, S. F., Kahan, T. F., Vandenboer, T. C., and Young, C. J.: Formation and emission of hydrogen chloride in indoor air, Indoor Air, 70–78, https://doi.org/10.1111/ina.12509, 2019.
Doucette, W. J., Wetzel, T. A., Dettenmaier, E., and Gorder, K.: Emission rates of chlorinated volatile organics from new and used consumer products found during vapor intrusion investigations: Impact on indoor air concentrations, Environ. Foren., 19, 185–190, https://doi.org/10.1080/15275922.2018.1475433, 2018.
Fernando, S., Jobst, K. J., Taguchi, V. Y., Helm, P. A., Reiner, E. J., and McCarry, B. E.: Identification of the halogenated compounds resulting from the 1997 Plastimet Inc. fire in Hamilton, Ontario, using comprehensive two-dimensional gas chromatography and (ultra)high resolution mass spectrometry, Environ. Sci. Technol., 48, 10656–10663, https://doi.org/10.1021/es503428j, 2014.
Finlayson-Pitts, B. J.: Chlorine atoms as a potential tropospheric oxidant in the marine boundary layer, Res. Chem. Intermed., 19, 235–249, https://doi.org/10.1163/156856793X00091, 1993.
Furlani, T. C., Veres, P. R., Dawe, K. E. R., Neuman, J. A., Brown, S. S., VandenBoer, T. C., and Young, C. J.: Validation of a new cavity ring-down spectrometer for measuring tropospheric gaseous hydrogen chloride, Atmos. Meas. Tech., 14, 5859–5871, https://doi.org/10.5194/amt-14-5859-2021, 2021.
Furlani, T., Ye, R., Stewart, J., Crilley, L., Edwards, P., Kahan, T., and Young, C.: Outdoor and indoor gaseous total chlorine measurement in Toronto Canada, Fed. Res. Data Rep. [data set], https://doi.org/10.20383/103.0649, 2022.
Giardino, N. J. and Andelman, J. B.: Characterization of the emissions of trichloroethylene, chloroform, and 1,2-dibromo-3-chloropropane in a full-size, experimental shower, J. Expo. Anal. Environ. Epidemiol., 6, 413–423, 1996.
Hardy, J. E. and Knarr, J. J.: Technique for measuring the total concentration of gaseous fixed nitrogen species, J. Air Pollut. Control. Assoc., 32, 376–379, https://doi.org/10.1080/00022470.1982.10465412, 1982.
Haskins, J. D., Jaeglé, L., Shah, V., Lee, B. H., Lopez-Hilfiker, F. D., Campuzano-Jost, P., Schroder, J. C., Day, D. A., Guo, H., Sullivan, A. P., Weber, R., Dibb, J., Campos, T., Jimenez, J. L., Brown, S. S., and Thornton, J. A.: Wintertime gas-particle partitioning and speciation of inorganic chlorine in the lower troposphere over the northeast United States and coastal ocean, J. Geophys. Res.-Atmos., 123, 12897–12916, https://doi.org/10.1029/2018JD028786, 2018.
Henschler, D.: Toxicity of Chlorinated Organic Compounds: Effects of the introduction of chlorine in organic Molecules, Angew. Chem. Int. Ed. Eng., 33, 1920–1935, https://doi.org/10.1002/anie.199419201, 1994.
Kannan, K., Kawano, M., Kashima, Y., Matsui, M., and Giesy, J. P.: Extractable organohalogens (EOX) in sediment and biota collected at an estuarine marsh near a former chloralkali facility, Environ. Sci. Technol., 33, 1004–1008, https://doi.org/10.1021/es9811142, 1999.
Kato, M., Urano, K., and Tasaki, T.: Development of semi- and nonvolatile organic halogen as a new hazardous index of flue gas, Environ. Sci. Technol., 34, 4071–4075, https://doi.org/10.1021/es000881+, 2000.
Kawano, M., Falandysz, J., and Wakimoto, T.: Instrumental neutron activation analysis of extractable organohalogens in the Antarctic Weddell seal (Leptonychotes weddelli), J Radioanal. Nucl. Chem., 272, 501–504, https://doi.org/10.1007/s10967-007-0611-5, 2007.
Keene, William. C., Khalil, M. A. K., Erickson, David. J., McCulloch, A., Graedel, T. E., Lobert, J. M., Aucott, M. L., Gong, S. L., Harper, D. B., Kleiman, G., Midgley, P., Moore, R. M., Seuzaret, C., Sturges, W. T., Benkovitz, C. M., Koropalov, V., Barrie, L. A., and Li, Y. F.: Composite global emissions of reactive chlorine from anthropogenic and natural sources: Reactive Chlorine Emissions Inventory, J. Geophys. Res.-Atmos., 104, 8429–8440, https://doi.org/10.1029/1998JD100084, 1999.
Khalil, M. A. K., Moore, R. M., Harper, D. B., Lobert, J. M., Erickson, D. J., Koropalov, V., Sturges, W. T., and Keene, W. C.: Natural emissions of chlorine-containing gases: Reactive Chlorine Emissions Inventory, J. Geophys. Res.-Atmos., 104, 8333–8346, https://doi.org/10.1029/1998JD100079, 1999.
Kolesar, K. R., Mattson, C. N., Peterson, P. K., May, N. W., Prendergast, R. K., and Pratt, K. A.: Increases in wintertime PM2.5 sodium and chloride linked to snowfall and road salt application, Atmos. Environ., 177, 195–202, https://doi.org/10.1016/j.atmosenv.2018.01.008, 2018.
Lao, M., Crilley, L. R., Salehpoor, L., Furlani, T. C., Bourgeois, I., Neuman, J. A., Rollins, A. W., Veres, P. R., Washenfelder, R. A., Womack, C. C., Young, C. J., and VandenBoer, T. C.: A portable, robust, stable, and tunable calibration source for gas-phase nitrous acid (HONO), Atmos. Meas. Tech., 13, 5873–5890, https://doi.org/10.5194/amt-13-5873-2020, 2020.
Lobert, J. M., Keene, W. C., Logan, J. A., and Yevich, R.: Global chlorine emissions from biomass burning: Reactive Chlorine Emissions Inventory, J. Geophys. Res.-Atmos., 104, 8373–8389, https://doi.org/10.1029/1998JD100077, 1999.
Maris, C., Chung, M. Y., Lueb, R., Krischke, U., Meller, R., Fox, M. J., and Paulson, S. E.: Development of instrumentation for simultaneous analysis of total non-methane organic carbon and volatile organic compounds in ambient air, Atmos. Environ., 37, 149–158, https://doi.org/10.1016/S1352-2310(03)00387-X, 2003.
Massin, N., Bohadana, A. B., Wild, P., Héry, M., Toamain, J. P., and Hubert, G.: Respiratory symptoms and bronchial responsiveness in lifeguards exposed to nitrogen trichloride in indoor swimming pools, Occup. Environ. Med., 55, 258 LP–263, https://doi.org/10.1136/oem.55.4.258, 1998.
Mattila, J. M., Lakey, P. S. J., Shiraiwa, M., Wang, C., Abbatt, J. P. D., Arata, C., Goldstein, A. H., Ampollini, L., Katz, E. F., DeCarlo, P. F., Zhou, S., Kahan, T. F., Cardoso-Saldaña, F. J., Ruiz, L. H., Abeleira, A., Boedicker, E. K., Vance, M. E., and Farmer, D. K.: Multiphase chemistry controls inorganic chlorinated and nitrogenated compounds in indoor air during bleach cleaning, Environ. Sci. Technol., 54, 1730–1739, https://doi.org/10.1021/acs.est.9b05767, 2020.
Miyake, Y., Kato, M., and Urano, K.: A method for measuring semi- and non-volatile organic halogens by combustion ion chromatography, J. Chromatogr. A, 1139, 63–69, https://doi.org/10.1016/j.chroma.2006.10.078, 2007a.
Miyake, Y., Yamashita, N., Rostkowski, P., So, M. K., Taniyasu, S., Lam, P. K. S., and Kannan, K.: Determination of trace levels of total fluorine in water using combustion ion chromatography for fluorine: A mass balance approach to determine individual perfluorinated chemicals in water, J. Chromatogr. A, 1143, 98–104, https://doi.org/10.1016/j.chroma.2006.12.071, 2007b.
Miyake, Y., Yamashita, N., So, M. K., Rostkowski, P., Taniyasu, S., Lam, P. K. S., and Kannan, K.: Trace analysis of total fluorine in human blood using combustion ion chromatography for fluorine: A mass balance approach for the determination of known and unknown organofluorine compounds, J. Chromatogr. A, 1154, 214–221, https://doi.org/10.1016/j.chroma.2007.03.084, 2007c.
Montzka, S. A., Dutton, G. S., Portmann, R. W., Chipperfield, M. P., Davis, S., Feng, W., Manning, A. J., Ray, E., Rigby, M., Hall, B. D., Siso, C., Nance, J. D., Krummel, P. B., Mühle, J., Young, D., O'Doherty, S., Salameh, P. K., Harth, C. M., Prinn, R. G., Weiss, R. F., Elkins, J. W., Walter-Terrinoni, H., and Theodoridi, C.: A decline in global CFC-11 emissions during 2018–2019, Nature, 590, 428–432, https://doi.org/10.1038/s41586-021-03260-5, 2021.
Nuckols, J. R., Ashley, D. L., Lyu, C., Gordon, S. M., Hinckley, A. F., and Singer, P.: Influence of tap water quality and household water use activities on indoor air and internal dose levels of trihalomethanes, Environ. Health Perspect., 113, 863–870, https://doi.org/10.1289/ehp.7141, 2005.
Odabasi, M.: Halogenated volatile organic compounds from the use of chlorine-bleach-containing household products, Environ. Sci. Technol., 42, 1445–1451, https://doi.org/10.1021/es702355u, 2008.
Odabasi, M., Elbir, T., Dumanoglu, Y., and Sofuoglu, S.: Halogenated volatile organic compounds in chlorine-bleach-containing household products and implications for their use, Atmos. Environ., 92, 376–383, https://doi.org/10.1016/j.atmosenv.2014.04.049, 2014.
Pan, L. L., Atlas, E. L., Salawitch, R. J., Honomichl, S. B., Bresch, J. F., Randel, W. J., Apel, E. C., Hornbrook, R. S., Weinheimer, A. J., Anderson, D. C., Andrews, S. J., Baidar, S., Beaton, S. P., Campos, T. L., Carpenter, L. J., Chen, D., Dix, B., Donets, V., Hall, S. R., Hanisco, T. F., Homeyer, C. R., Huey, L. G., Jensen, J. B., Kaser, L., Kinnison, D. E., Koenig, T. K., Lamarque, J.-F., Liu, C., Luo, J., Luo, Z. J., Montzka, D. D., Nicely, J. M., Pierce, R. B., Riemer, D. D., Robinson, T., Romashkin, P., Saiz-Lopez, A., Schauffler, S., Shieh, O., Stell, M. H., Ullmann, K., Vaughan, G., Volkamer, R., and Wolfe, G.: The Convective Transport of Active Species in the Tropics (CONTRAST) experiment, B. Am. Meteorol. Soc., 98, 106–128, https://doi.org/10.1175/BAMS-D-14-00272.1, 2017.
Prinn, R. G., Weiss, R. F., Arduini, J., Arnold, T., DeWitt, H. L., Fraser, P. J., Ganesan, A. L., Gasore, J., Harth, C. M., Hermansen, O., Kim, J., Krummel, P. B., Li, S., Loh, Z. M., Lunder, C. R., Maione, M., Manning, A. J., Miller, B. R., Mitrevski, B., Mühle, J., O'Doherty, S., Park, S., Reimann, S., Rigby, M., Saito, T., Salameh, P. K., Schmidt, R., Simmonds, P. G., Steele, L. P., Vollmer, M. K., Wang, R. H., Yao, B., Yokouchi, Y., Young, D., and Zhou, L.: History of chemically and radiatively important atmospheric gases from the Advanced Global Atmospheric Gases Experiment (AGAGE), Earth Syst. Sci. Data, 10, 985–1018, https://doi.org/10.5194/essd-10-985-2018, 2018.
Raff, J. D., Njegic, B., Chang, W. L., Gordon, M. S., Dabdub, D., Gerber, R. B., and Finlayson-Pitts, B. J.: Chlorine activation indoors and outdoors via surface-mediated reactions of nitrogen oxides with hydrogen chloride, P. Natl. Acad. Sci. USA, 106, 13647 LP–13654, https://doi.org/10.1073/pnas.0904195106, 2009.
Riedel, T. P., Wolfe, G. M., Danas, K. T., Gilman, J. B., Kuster, W. C., Bon, D. M., Vlasenko, A., Li, S.-M., Williams, E. J., Lerner, B. M., Veres, P. R., Roberts, J. M., Holloway, J. S., Lefer, B., Brown, S. S., and Thornton, J. A.: An MCM modeling study of nitryl chloride (ClNO2) impacts on oxidation, ozone production and nitrogen oxide partitioning in polluted continental outflow, Atmos. Chem. Phys., 14, 3789–3800, https://doi.org/10.5194/acp-14-3789-2014, 2014.
Roberts, J. M., Bertman, S. B., Jobson, T., Niki, H., and Tanner, R.: Measurement of total nonmethane organic carbon (Cy): Development and application at Chebogue Point, Nova Scotia, during the 1993 North Atlantic Regional Experiment campaign, J. Geophys. Res.-Atmos., 103, 13581–13592, https://doi.org/10.1029/97JD02240, 1998.
Saiz-Lopez, A. and Von Glasow, R.: Reactive halogen chemistry in the troposphere, Chem. Soc. Rev., 41, 6448–6472, https://doi.org/10.1039/c2cs35208g, 2012.
Schwartz-Narbonne, H., Wang, C., Zhou, S., Abbatt, J. P. D., and Faust, J.: Heterogeneous chlorination of squalene and oleic acid, Environ. Sci. Technol., 53, 1217–1224, https://doi.org/10.1021/acs.est.8b04248, 2019.
Shepherd, J. L., Corsi, R. L., and Kemp, J.: Chloroform in indoor air and wastewater: The role of residential washing machines., J. Air Waste Manag. Assoc., 46, 631–642, https://doi.org/10.1080/10473289.1996.10467497, 1996.
Sherwen, T., Schmidt, J. A., Evans, M. J., Carpenter, L. J., Großmann, K., Eastham, S. D., Jacob, D. J., Dix, B., Koenig, T. K., Sinreich, R., Ortega, I., Volkamer, R., Saiz-Lopez, A., Prados-Roman, C., Mahajan, A. S., and Ordóñez, C.: Global impacts of tropospheric halogens (Cl, Br, I) on oxidants and composition in GEOS-Chem, Atmos. Chem. Phys., 16, 12239–12271, https://doi.org/10.5194/acp-16-12239-2016, 2016.
Simpson, W. R., Brown, S. S., Saiz-Lopez, A., Thornton, J. A., and Von Glasow, R.: Tropospheric halogen chemistry: Sources, cycling, and impacts, Chem. Rev., 115, 4035–4062, https://doi.org/10.1021/cr5006638, 2015.
Solomon, S.: Stratospheric ozone depletion: A review of concepts and history, Rev. Geophys., 37, 275–316, https://doi.org/10.1029/1999RG900008, 1999.
Stockwell, C. E., Kupc, A., Witkowski, B., Talukdar, R. K., Liu, Y., Selimovic, V., Zarzana, K. J., Sekimoto, K., Warneke, C., Washenfelder, R. A., Yokelson, R. J., Middlebrook, A. M., and Roberts, J. M.: Characterization of a catalyst-based conversion technique to measure total particulate nitrogen and organic carbon and comparison to a particle mass measurement instrument, Atmos. Meas. Tech., 11, 2749–2768, https://doi.org/10.5194/amt-11-2749-2018, 2018.
Stubbs, A. D., Lao, M., Wang, C., Abbatt, J. P. D., Hoffnagle, J., VandenBoer, T. C., and Kahan, T. F.: Near-source hypochlorous acid emissions from indoor bleach cleaning, Environ. Sci.: Processes Impacts, https://doi.org/10.1039/D2EM00405D, in press, 2023.
Unsal, V., Cicek, M., and Sabancilar, İ.: Toxicity of carbon tetrachloride, free radicals and role of antioxidants, Rev. Environ. Health, 36, 279–295, https://doi.org/10.1515/reveh-2020-0048, 2021.
Veres, P., Gilman, J. B., Roberts, J. M., Kuster, W. C., Warneke, C., Burling, I. R., and de Gouw, J.: Development and validation of a portable gas phase standard generation and calibration system for volatile organic compounds, Atmos. Meas. Tech., 3, 683–691, https://doi.org/10.5194/amt-3-683-2010, 2010.
Wang, C., Collins, D. B., and Abbatt, J. P. D.: Indoor illumination of terpenes and bleach emissions leads to particle formation and growth, Environ. Sci. Technol., 53, 11792–11800, https://doi.org/10.1021/acs.est.9b04261, 2019.
White, C. W. and Martin, J. G.: Chlorine gas inhalation, Proc. Am. Thorac. Soc., 7, 257–263, https://doi.org/10.1513/pats.201001-008SM, 2010.
WMO (World Meteorological Organization): Scientific Assessment of Ozone Depletion: 2018, Report No. 58, Global Ozone Research and Monitoring Project, Geneva, Switzerland, 588 pp., ISBN 978-1-7329317-1-8, 2018.
Wong, J. P. S., Carslaw, N., Zhao, R., Zhou, S., and Abbatt, J. P. D.: Observations and impacts of bleach washing on indoor chlorine chemistry, Indoor Air, 27, 1082–1090, https://doi.org/10.1111/ina.12402, 2017.
Xu, D., Zhong, W., Deng, L., Chai, Z., and Mao, X.: Levels of extractable organohalogens in pine needles in China, Environ. Sci. Technol., 37, 1–6, https://doi.org/10.1021/es025799o, 2003.
Xu, D., Tian, Q., and Chai, Z.: Determination of extractable organohalogens in the atmosphere by instrumental neutron activation analysis, J. Radioanal. Nucl. Chem., 270, 5–8, https://doi.org/10.1007/s10967-006-0302-7, 2006.
Xu, D., Dan, M., Song, Y., Chai, Z., and Zhuang, G.: Instrumental neutron activation analysis of extractable organohalogens in PM2.5 and PM10 in Beijing, China, J. Radioanal. Nucl. Chem., 271, 115–118, https://doi.org/10.1007/s10967-007-0115-3, 2007.
Yang, M. and Fleming, Z. L.: Estimation of atmospheric total organic carbon (TOC) – paving the path towards carbon budget closure, Atmos. Chem. Phys., 19, 459–471, https://doi.org/10.5194/acp-19-459-2019, 2019.
Yeung, L. W. Y., Miyake, Y., Taniyasu, S., Wang, Y., Yu, H., So, M. K., Jiang, G., Wu, Y., Li, J., Giesy, J. P., Yamashita, N., and Lam, P. K. S.: Perfluorinated compounds and total and extractable organic fluorine in human blood samples from China, Environ. Sci. Technol., 42, 8140–8145, https://doi.org/10.1021/es800631n, 2008.
Young, C. J., Washenfelder, R. A., Edwards, P. M., Parrish, D. D., Gilman, J. B., Kuster, W. C., Mielke, L. H., Osthoff, H. D., Tsai, C., Pikelnaya, O., Stutz, J., Veres, P. R., Roberts, J. M., Griffith, S., Dusanter, S., Stevens, P. S., Flynn, J., Grossberg, N., Lefer, B., Holloway, J. S., Peischl, J., Ryerson, T. B., Atlas, E. L., Blake, D. R., and Brown, S. S.: Chlorine as a primary radical: evaluation of methods to understand its role in initiation of oxidative cycles, Atmos. Chem. Phys., 14, 3427–3440, https://doi.org/10.5194/acp-14-3427-2014, 2014.
Zhai, S., Wang, X., McConnell, J. R., Geng, L., Cole-Dai, J., Sigl, M., Chellman, N., Sherwen, T., Pound, R., Fujita, K., Hattori, S., Moch, J. M., Zhu, L., Evans, M., Legrand, M., Liu, P., Pasteris, D., Chan, Y.-C., Murray, L. T., and Alexander, B.: Anthropogenic impacts on tropospheric reactive chlorine since the preindustrial, Geophys. Res. Lett., 48, e2021GL093808, https://doi.org/10.1029/2021GL093808, 2021.
Zhang, W., Jiao, Y., Zhu, R., Rhew, R. C., Sun, B., and Dai, H.: Chloroform (CHCl3) emissions from coastal Antarctic tundra, Geophys. Res. Lett., 48, e2021GL093811, https://doi.org/10.1029/2021GL093811, 2021.