the Creative Commons Attribution 4.0 License.
the Creative Commons Attribution 4.0 License.
 | 13 Apr 2023
Ethylene oxide monitor with part-per-trillion precision for in situ measurements
Tara I. Yacovitch
Christoph Dyroff
Joseph R. Roscioli
Conner Daube
J. Barry McManus
Scott C. Herndon
An Aerodyne tunable infrared laser direct absorption spectrometer with a multipass cell with a 413 m pathlength for the detection of ethylene oxide (EtO) is presented (TILDAS-FD-EtO). This monitor achieves precisions of <75 ppt or <0.075 ppb s−1 and <20 ppt in 100 s (1σ). We demonstrate precisions averaging down to 4 ppt h−1 (1σ precision) when operated with frequent humidity-matched zeroes. A months-long record of 2022 ambient concentrations at a site in the eastern United States is presented. Average ambient EtO concentration is on the order of 18 ppt (22 ppt standard deviation, SD). Enhancement events of EtO lasting a few hours are observed, with peaks as high as 600 ppt. Back-trajectory simulations suggest an EtO source nearly 35 km away. This source along with another are confirmed as emitters through mobile near-source measurements, with downwind concentrations in the 0.5 to 700 ppb range depending on source identity and distance downwind.
- Article
(1668 KB) - Full-text XML
-
Supplement
(6762 KB) - BibTeX
- EndNote


Ethylene oxide (EtO, also known as EO or oxirane) is a reactive compound with a strained three-member ether ring (C2H4O, CAS no. 75-21-8, MW=44.05 g mol−1). It is commonly used in chemical manufacturing of polymers and glycols. It is also used to sterilize medical equipment (e.g., pacemakers, surgical kits) that cannot be exposed to heat or humidity. Due to its reactivity, ethylene oxide is a carcinogen. The United States Environmental Protection Agency (EPA), through its Integrated Risk Information System (IRIS; US EPA, 2017), has set an inhalation unit risk (IUR) for EtO at µg m−3 ( ppb−1) for adult increased cancer risk based on human data (US EPA, 2016). The IUR is an upper-bound estimate of excess cancer risk from continuous exposure to a compound at 1 µg m−3 in air (US EPA, 2022b). An IUR for EtO of µg m−3 implies that three excess cancer cases are expected to develop in 1000 people if exposed to 1 µg m−3 (0.55 ppb) of EtO over a lifetime. Other risk estimates for different populations are included in the EPA source material (US EPA, 2016). Workplace limits for 8 h and acute 5 min exposures are several orders of magnitude higher, on the order of 1–5 ppm (OSHA, 2002). The toxicity of this chemical makes accurate, high-precision measurements of ambient and near-source concentrations imperative; this advance is described herein.
Background levels of EtO are challenging to measure via extractive methods such as canister sampling. EtO can be formed during storage in the canisters used (Hoisington and Herrington, 2021; US EPA, 2019; Hasegawa, 2001). The levels of reported EtO formation are on the order of hundreds of parts per trillion. Hoisington and Herrington (2021) note EtO formation in blanks filled with humidified air but not dry air or inert gas and thus hypothesize the reaction to be between larger hydrocarbons and oxygen, catalyzed by the presence of water and metal surfaces. Both canister type/coating (US EPA, 2019) and canister cleanliness/cleaning protocol (Hoisington and Herrington, 2021) are thought to impact EtO formation.
Reported background concentrations of EtO at select US National Air Toxics Trends Station (NATTS) monitoring sites for the October 2018–March 2019 period average 0.297 µg m−3 and range between 0.185 and 0.397 µg m−3 (103 to 220 ppt) (US EPA, 2019). More recent EPA data from 2022 at Massachusetts measurement sites show 24 h concentrations between 0 and 0.270 µg m−3 (0–150 ppt) (US EPA, 2022c). Olaguer et al. (2020) report near-source 24 h average concentrations in the 0.42–76.0 µg m−3 range (233 ppt–42.2 ppb), the lower value representative of ambient background and the higher value sampled near a vent at a sterilization facility. These measurements all rely on canister sampling methods. To date, this study is the first in situ measurement of real EtO sources in the published literature.
Several additional in situ instruments for the detection of EtO have been developed recently. Gupta et al. (2022) describe a cavity-enhanced absorption spectrometry method with precision <1 ppb (1σ, 60 s) and 0.5 ppb (1σ, 15 min). Picarro, Inc. (2021) has publicized cavity ring-down spectroscopy (CRDS) instruments with detection limits of 0.1–0.25 ppb (3σ, 300 s) depending on the instrument model. Entanglement Technologies (2022) lists a CRDS instrument with EtO detection at the part-per-billion level in 5 s with other volatile organic compounds (VOCs) detected and at the part-per-trillion-level in 15 min in “lab-scan” mode. Aeris Technologies (2022) describes a laser-based EtO with 0.5 ppb sensitivity (1σ, 1 s). Here, we describe a commercially available Aerodyne EtO monitor (Aerodyne Research Inc., 2022b) based on direct-absorption spectroscopy that is capable of <0.075 ppb precision at 1 s (1σ) and 0.020 ppb precision at 100 s (1σ). With frequent zeroing and data averaging we demonstrate a precision of <4 ppt (1σ, 1 h). Instrument performance and calibration are described. A months-long ambient EtO record at a site in Billerica, Massachusetts, United States, is described, and enhancements are traced back to a potential inventory EtO source. This source and another are confirmed via near-field mobile measurements.
2.1 Instrument description
The basis of our EtO monitor is our commercially available dual-laser tunable infrared laser direct absorption spectrometer (TILDAS-FD) platform (Aerodyne Research Inc., 2022a), which in this case is equipped with a single mid-infrared interband cascade laser (nanoplus GmbH). For the system described herein, we use a multipass cell with a 413 m optical pathlength and an active volume of 1.8 L for continuous flow applications. The sample pressure was maintained between 20 Torr (26 mbar) and 30 Torr (40 mbar) throughout the experiments described in this paper. Details of the optical setup and flow system are described in the Supplement.
We measure EtO in a narrow wavelength window near 3065 cm−1 (3.26 µm); see Fig. 1. This figure fits an ambient spectrum divided by a scrubber-zeroed spectrum, such that all species except EtO are near zero (see Sect. 2.2). In total, more than 250 individual absorption lines from 6 molecular absorbers are included in the spectroscopic fit: EtO (114 lines), water (H2O, 18 lines), formaldehyde (HCHO, 23 lines), ethane (C2H6, 28 lines), methane (CH4, 12 lines), and ethylene (C2H4, 56 lines). Methanol can optionally be included in the fit (32 lines). Center wavelengths, line strengths, and broadening coefficients of all molecules except EtO, ethane, and methanol are from the HITRAN database (Gordon et al., 2017). Ethane and methanol lines are based on experiments by Harrison et al. (2012). The high-resolution line parameters for EtO at 3065 cm−1 were derived at Aerodyne. Initial knowledge of absorption at this wavelength was gained from high-resolution Fourier transform spectra by Lafferty et al. (2013).
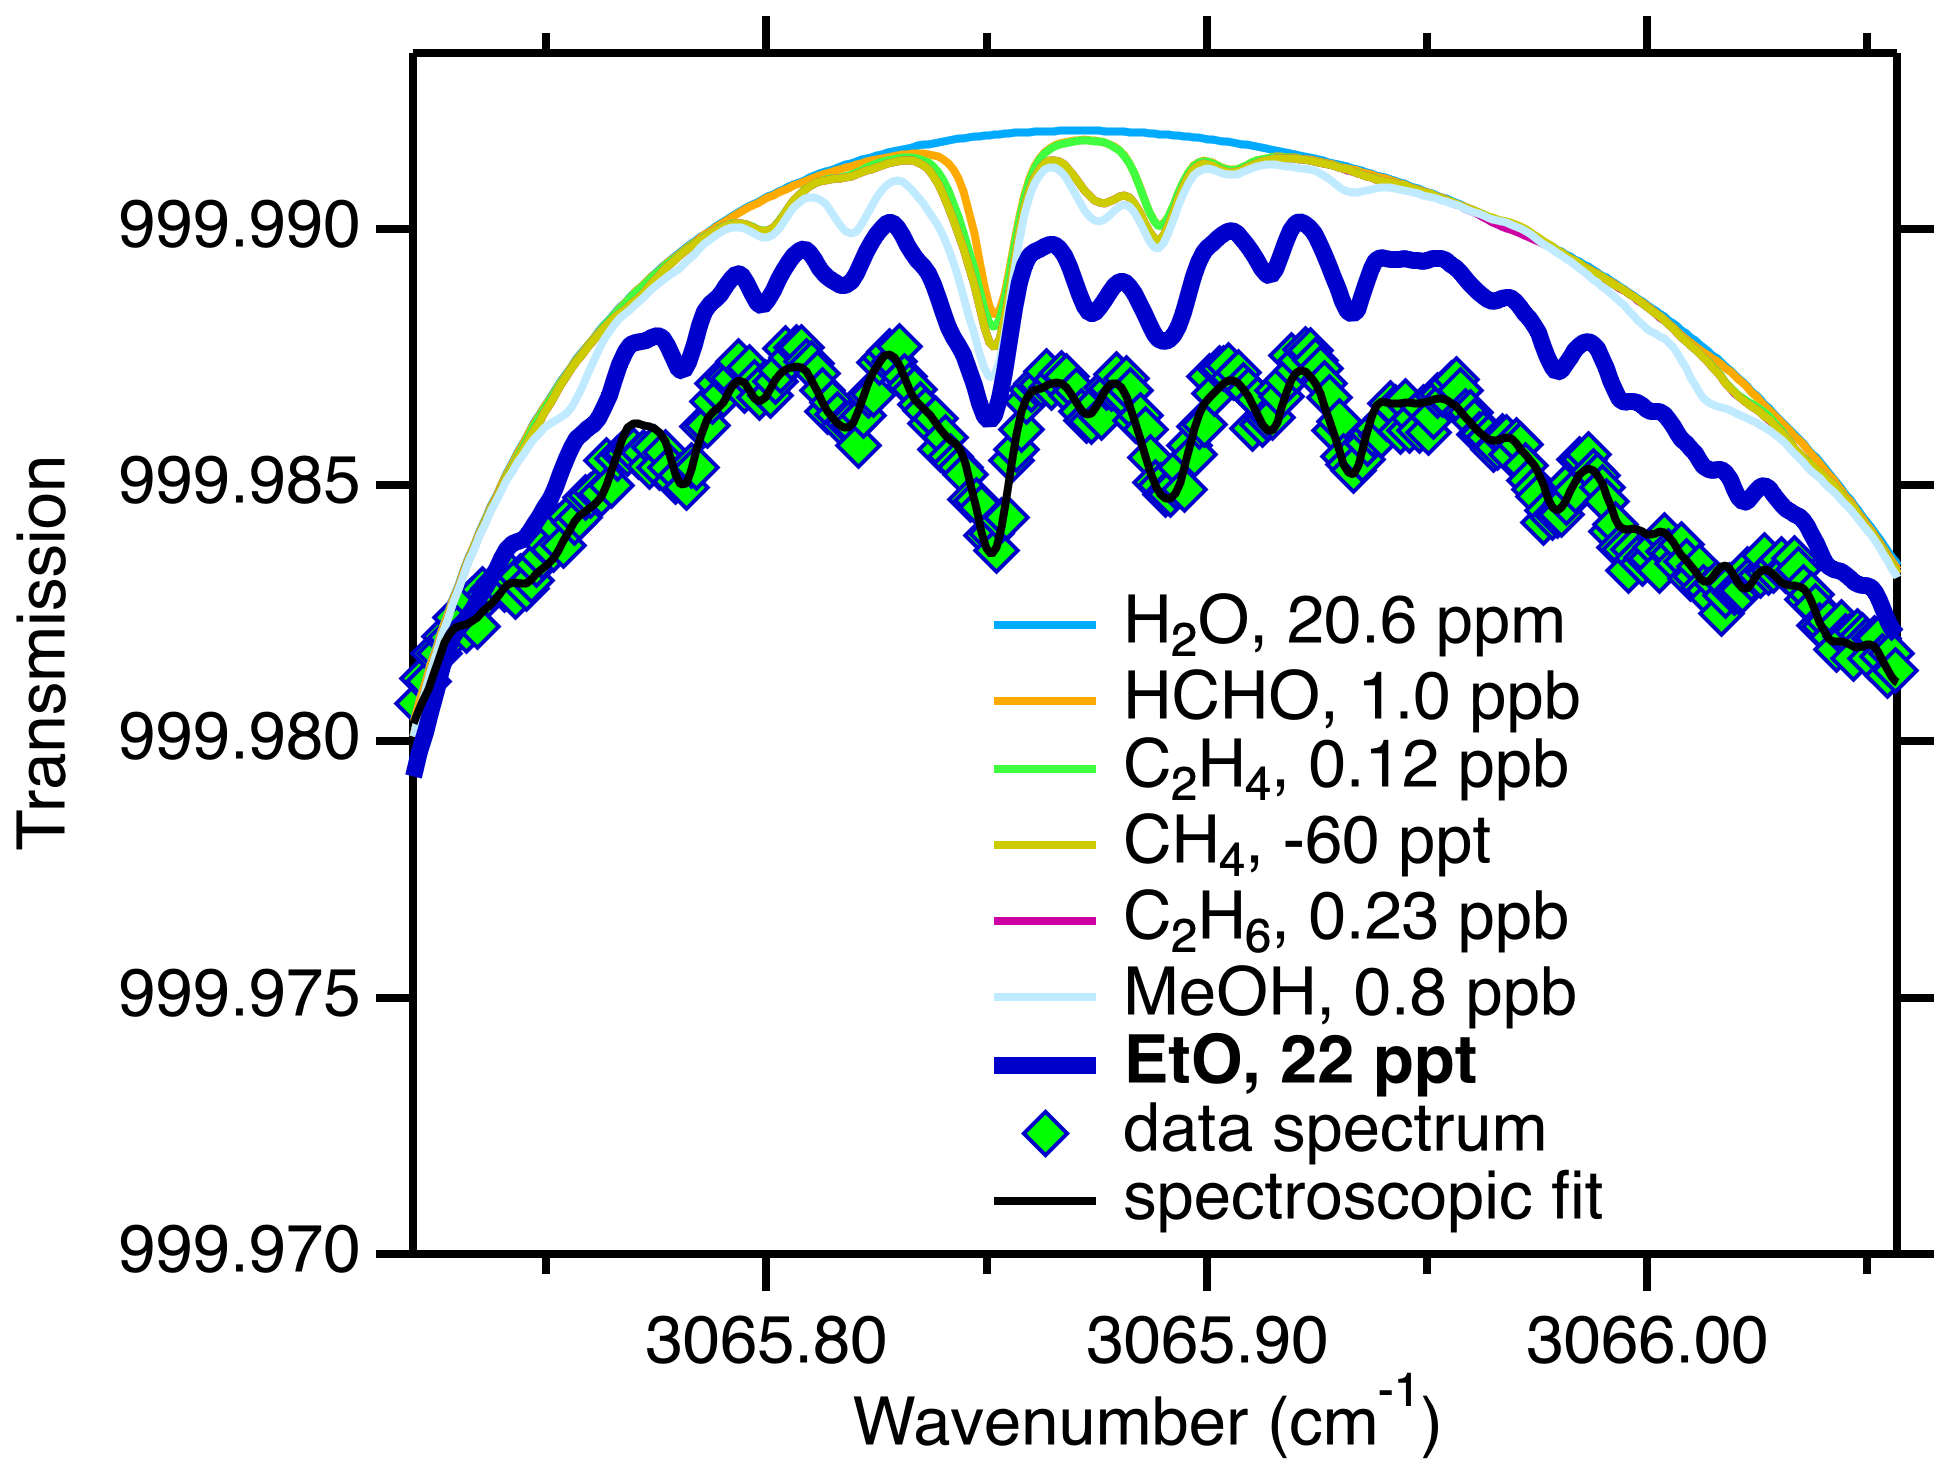
Figure 1Spectrum of EtO and other gaseous absorbers in the spectral window that is included in the spectroscopic fit. A measured spectrum (green diamonds, 24 h average ambient spectrum, humidity-matched scrubber zeroes) is shown overlaid with the final fit (black trace). Individual fit components include water (H2O), formaldehyde (HCHO), ethylene (C2H4), methane (CH4), ethane (C2H6), and methanol (MeOH). This figure fits an ambient spectrum divided by a scrubber-zeroed spectrum, such that all species except for EtO are near zero (see Sect. 2.2).
2.2 Calibration and zeroing
The EtO measurement is based on a set of experimentally acquired absorption lines. These experiments were done on a prototype TILDAS instrument with a 76 m pathlength absorption cell, operating at 30 Torr (40 mbar). The absorption line strengths were calibrated in February 2020 using a certified EtO standard (Apel Riemer, certified value 0.1023 ppm, August 2019) determined by P. Kariher at the US EPA to show good relative agreement (within 7 %) among 18 tanks from 5 vendors (Kariher, 2022). Pressure-dependent EtO line broadening and other changes in instrument setup such as the inlet may lead to additional uncertainty or bias when operating the 413 m instrument at 20 Torr (26 mbar), and so additional calibrations are done regularly for this instrument.
Calibrations are performed by quantitative dilution of high-concentration EtO standards to achieve a multi-point calibration curve (see Fig. S1 in the Supplement). We find dry calibrations prone to long time constants, which we tentatively attribute to surface effects. Humid standard additions are preferred, as they most closely resemble sampling conditions.
We use a 2021 Airgas calibration standard, containing EtO (1.092 ppm ± 5 %) and ethane (1.075 ppm ± 5 %) in a balance of nitrogen (see Fig. S2). The inclusion of ethane in the calibration tank provides a secondary known species measurable by the instrument and not prone to reactivity or inlet effects. The average calibration factor for a set of standard addition calibrations performed over a representative week-long period is m=0.981 ± 0.045 (95 % error bars). This calibration factor implies 1 ppb of measured EtO would be corrected to 1.02 ppb EtO. However, we do not apply this small 2 % correction to the data, given a certified tank uncertainty of 5 % and the 4.6 % error bars on the average calibration factor.
Uncertainties in the certified values of commercially available calibration tanks are of concern for accurate calibration of this and other EtO methods. A total of four commercially available standards have been measured by the TILDAS-FD-EtO monitor described here, varying in vendors, and at nominal concentrations of 1 ppm except where noted. Their retrieved concentrations deviated from their certified values by −2 % (the above EtO and ethane standard), +9 %, −417 % (standard at 0.5 ppm), and +18 %.
Spectral backgrounding (or autobackgrounding) is done by intermittently and regularly measuring air free of EtO. Each acquired background spectrum is used to divide sample spectra for the subsequent period, reducing the impact of drift due to instrumental effects like optical fringes and spectral baseline effects. The use of scrubbed air provides a near-humidity match between sample and background spectra, effectively flattening out the curvature of the baseline present under the EtO lines due to strong neighboring water absorptions. We have not extensively tested whether the scrubber decreases the other species measured in the fit (HCHO, C2H6, C2H4, CH4, etc.), but they appear in the divided ambient spectra with near-zero concentrations (Fig. 1). For species with significant ambient backgrounds like CH4, this indicates that the scrubber is non-destructive to CH4. Laboratory experiments suggest scrubber EtO breakthrough on the scale of 3 % is possible (3–5 slpm flow rates) at high mixing ratios (hundreds of parts per billion). Indeed, mobile near-source measurements have shown such an EtO breakthrough when an autobackground occurs within a high-concentration plume. Correction of this data is possible after the fact by manually offsetting baselines or performing a spectral refit of the data.
The frequency of autobackgrounds is chosen to match the sampling strategy. Mobile measurements aimed at capturing plumes (enhancements over the background lasting typically 1–3 min) use a 5 to 15 min autobackground cycle. This is a practical decision that reduces the chance of a zero interfering with a plume during a downwind transect of a facility and is defensible, as we typically are less concerned with time averaging and part-per-trillion-level baseline drift during near-source measurements. Stationary sampling of background concentrations, on the other hand, yields the best long-term averaging with a 2 min cycle.
3.1 Instrument performance
Precision for the TILDAS-FD-EtO monitor at 1 s is <70 ppt (1σ), regardless of stationary or mobile measurements.
Figure 2 compares stationary and mobile ambient measurement Allan–Werle variance plots (Werle, 2011). Blue traces show stationary performance, with best precisions achieved when stationary by altering humidity-matched zeroes with ambient measurements every 2 min for a 50 % duty cycle. The precision improves with averaging time from a base precision of 44 ppt (1σ at 2 s), reaching 13 ppt at 2 min, 6.0 ppt at 15 min, and 4.1 ppt at 1 h (all precisions at 1σ).
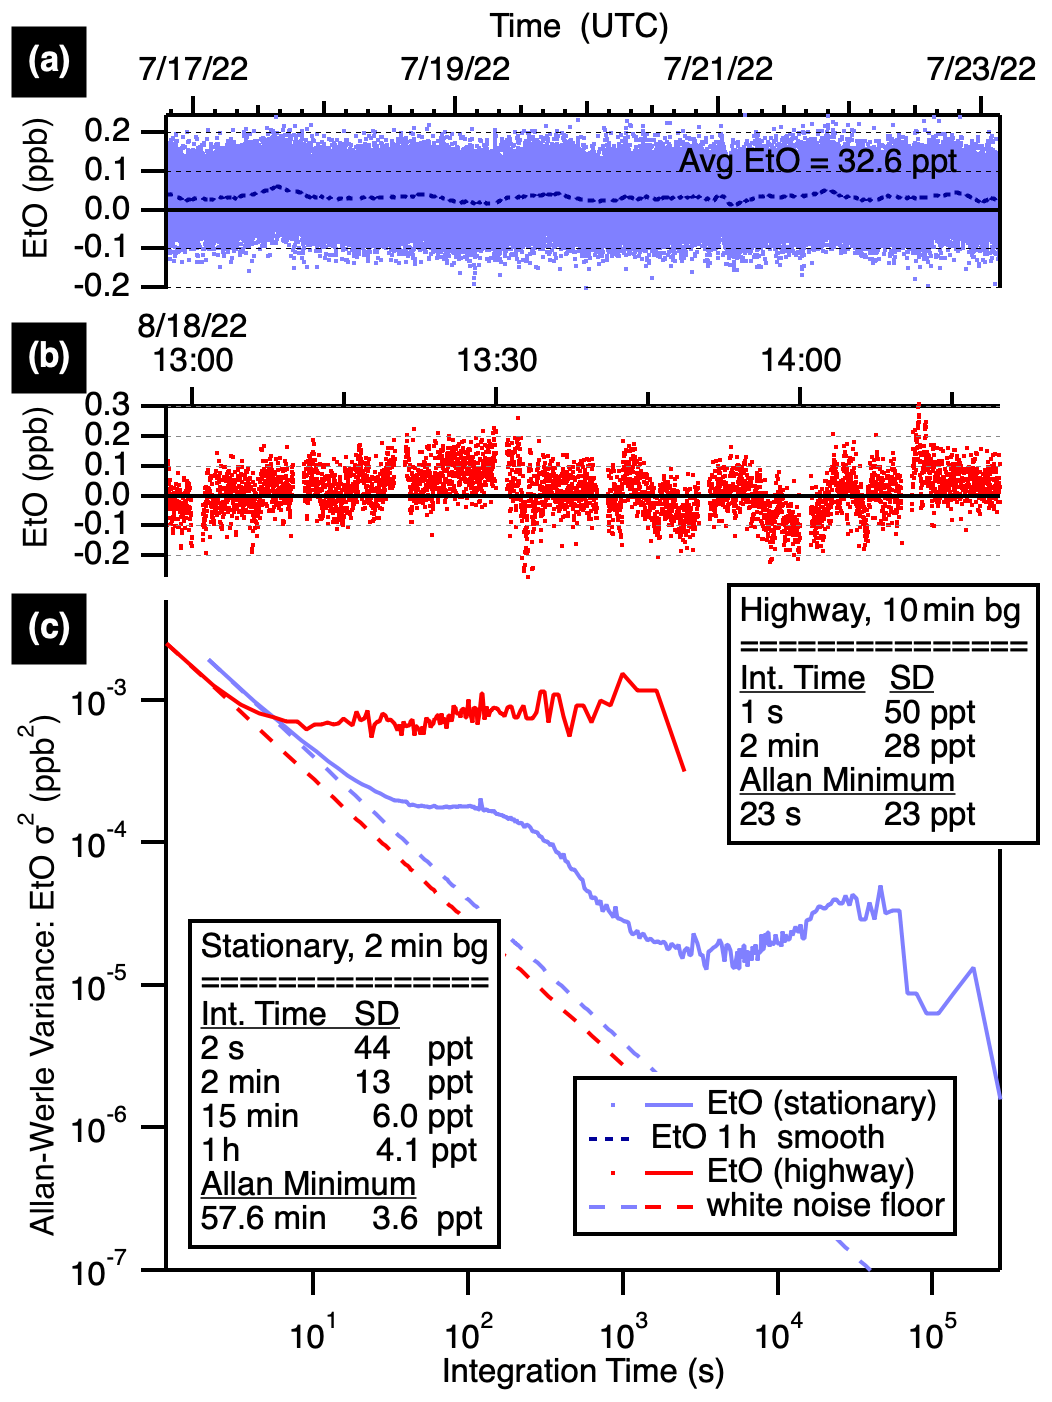
Figure 2Time series (a, b) and Allan–Werle variance plots (c) showing EtO precisions at various averaging times while stationary with 2 min autobackgrounds (blue) and while mobile on the highway with 10 min backgrounds (red). The stationary data (a) average to 32.6 ppt EtO with a 1 h smooth (dotted line) shown.
The TILDAS-FD-EtO monitor has also been used for near-source mobile monitoring, with less frequent autobackgrounds (5 to 10 min frequencies). The instrument shows sensitivity to truck motion, particularly quick turns or stops, which manifest as negative deviations in the mixing ratio on the order of 0.5 ppb. Optimizing optical alignment minimizes but does not eliminate these effects, which are largely attributed to strain on the laser-focusing objective. Continuous vibrations do not manifest as negative deviations, instead impacting the overall noise. Performance while in motion on the highway is shown in Fig. 2 (red traces). For these measurements, the instrument was mounted in the Aerodyne Mobile Laboratory in a vibration-isolated rack and operated with a 10 min humidity-matched zeroing cycle. The 1 s precision of 50 ppt averages to 28 ppt in 2 min.
3.2 Ambient measurements
A months-long record of ambient EtO in Billerica, Massachusetts, United States, was acquired (Fig. 3), spanning the winter, spring, and summer of 2022. Averaging the hourly data for the entire period (with standard deviation in parentheses) yields Avg (SD)=18 (22) ppt. The standard deviations given reflect the combination of instrument noise as described above and the variability of EtO in ambient air. Histograms comparing winter and summer concentrations are shown in Fig. S3. Hourly averages for summertime data are less noisy than wintertime data due to the more aggressive zeroing cycle (2 min vs. 30 min). Summertime concentrations (1 July–4 August) of 33 (13) ppt appear slightly elevated compared to winter averages (9 February–30 April) 12 (23) ppt measurements. We exclude the intermediate spring data (May) from these averages. The averages are different at the 95 % confidence level using Gaussian statistics and standard error of the mean (see Table S3 in the Supplement). These data are consistent with recent data reported by the EPA for four Massachusetts sites (US EPA, 2022c): 2022 observations accessed on 20 August 2022 range between 0 and 0.270 µg m−3 (0–150 ppt) with a median of 0.090 µg m−3 (50 ppt); they are below 2019 levels shown for EPA NAATS sites in New York and Pennsylvania (US EPA, 2019) of 0.298–0.361 µg m−3 (165–201 ppt), though the EPA has since noted that true background concentrations are unknown due to the influence of canister artifacts (US EPA, 2021).
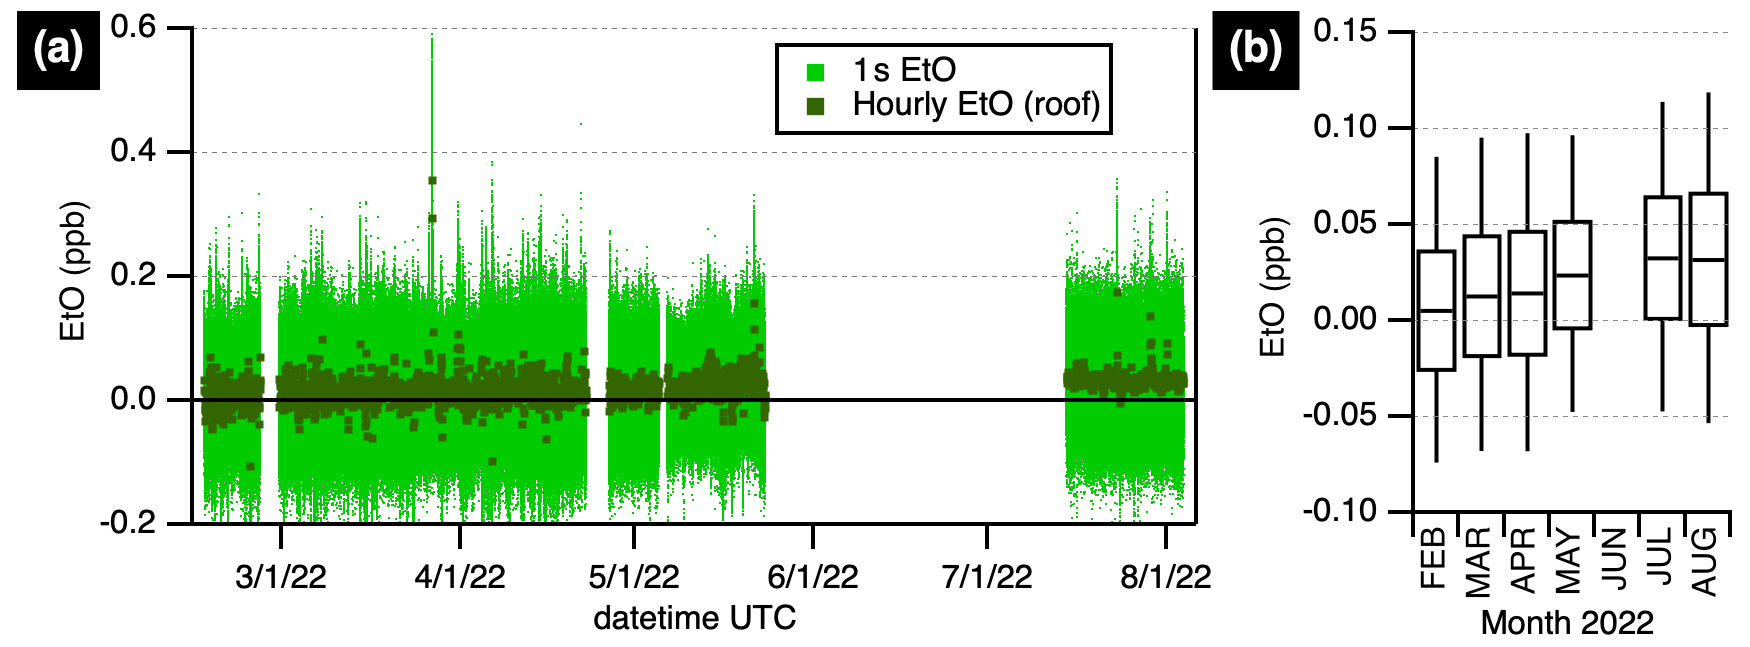
Figure 3Ambient ethylene oxide at a site in Billerica, Massachusetts, United States. (a) Data at 1 s (pale green) are shown alongside hourly averages (dark green squares). (b) Monthly boxplot showing the median and 25th and 75th quartiles, with whiskers extending to the 5th and 95th percentiles. Data prior to June 2022 were acquired from a rooftop inlet with humidity-matched autobackgrounds every 30 min; data after July 2022 were acquired from a 3 m inlet with humidity-matched autobackgrounds every 2 min. Gaps in the time series are due to laboratory or field experiments.
Several distinct EtO enhancement events are evident in the ambient record. One such event on 27 March 2022 is shown in Fig. 4. This figure shows two plumes, the larger of the two reaching concentrations of 500 ppt and lasting 3–4 h near midnight local time. No EtO activity (e.g., calibrations) was occurring in the lab during this week. During these winter and spring rooftop measurements, the EtO monitor briefly switches to laboratory air prior to humidity-matched autobackgrounds, providing several seconds of indoor air sampling. The laboratory air shows an “echo” of the outdoor EtO event ∼3 h delayed, and slightly broadened, with a maximum concentration of 168 ppt, which we attribute to the building's ventilation system gradually mixing with outdoor air. This observation highlights the fact that indoor air quality is directly impacted by outdoor EtO concentrations.
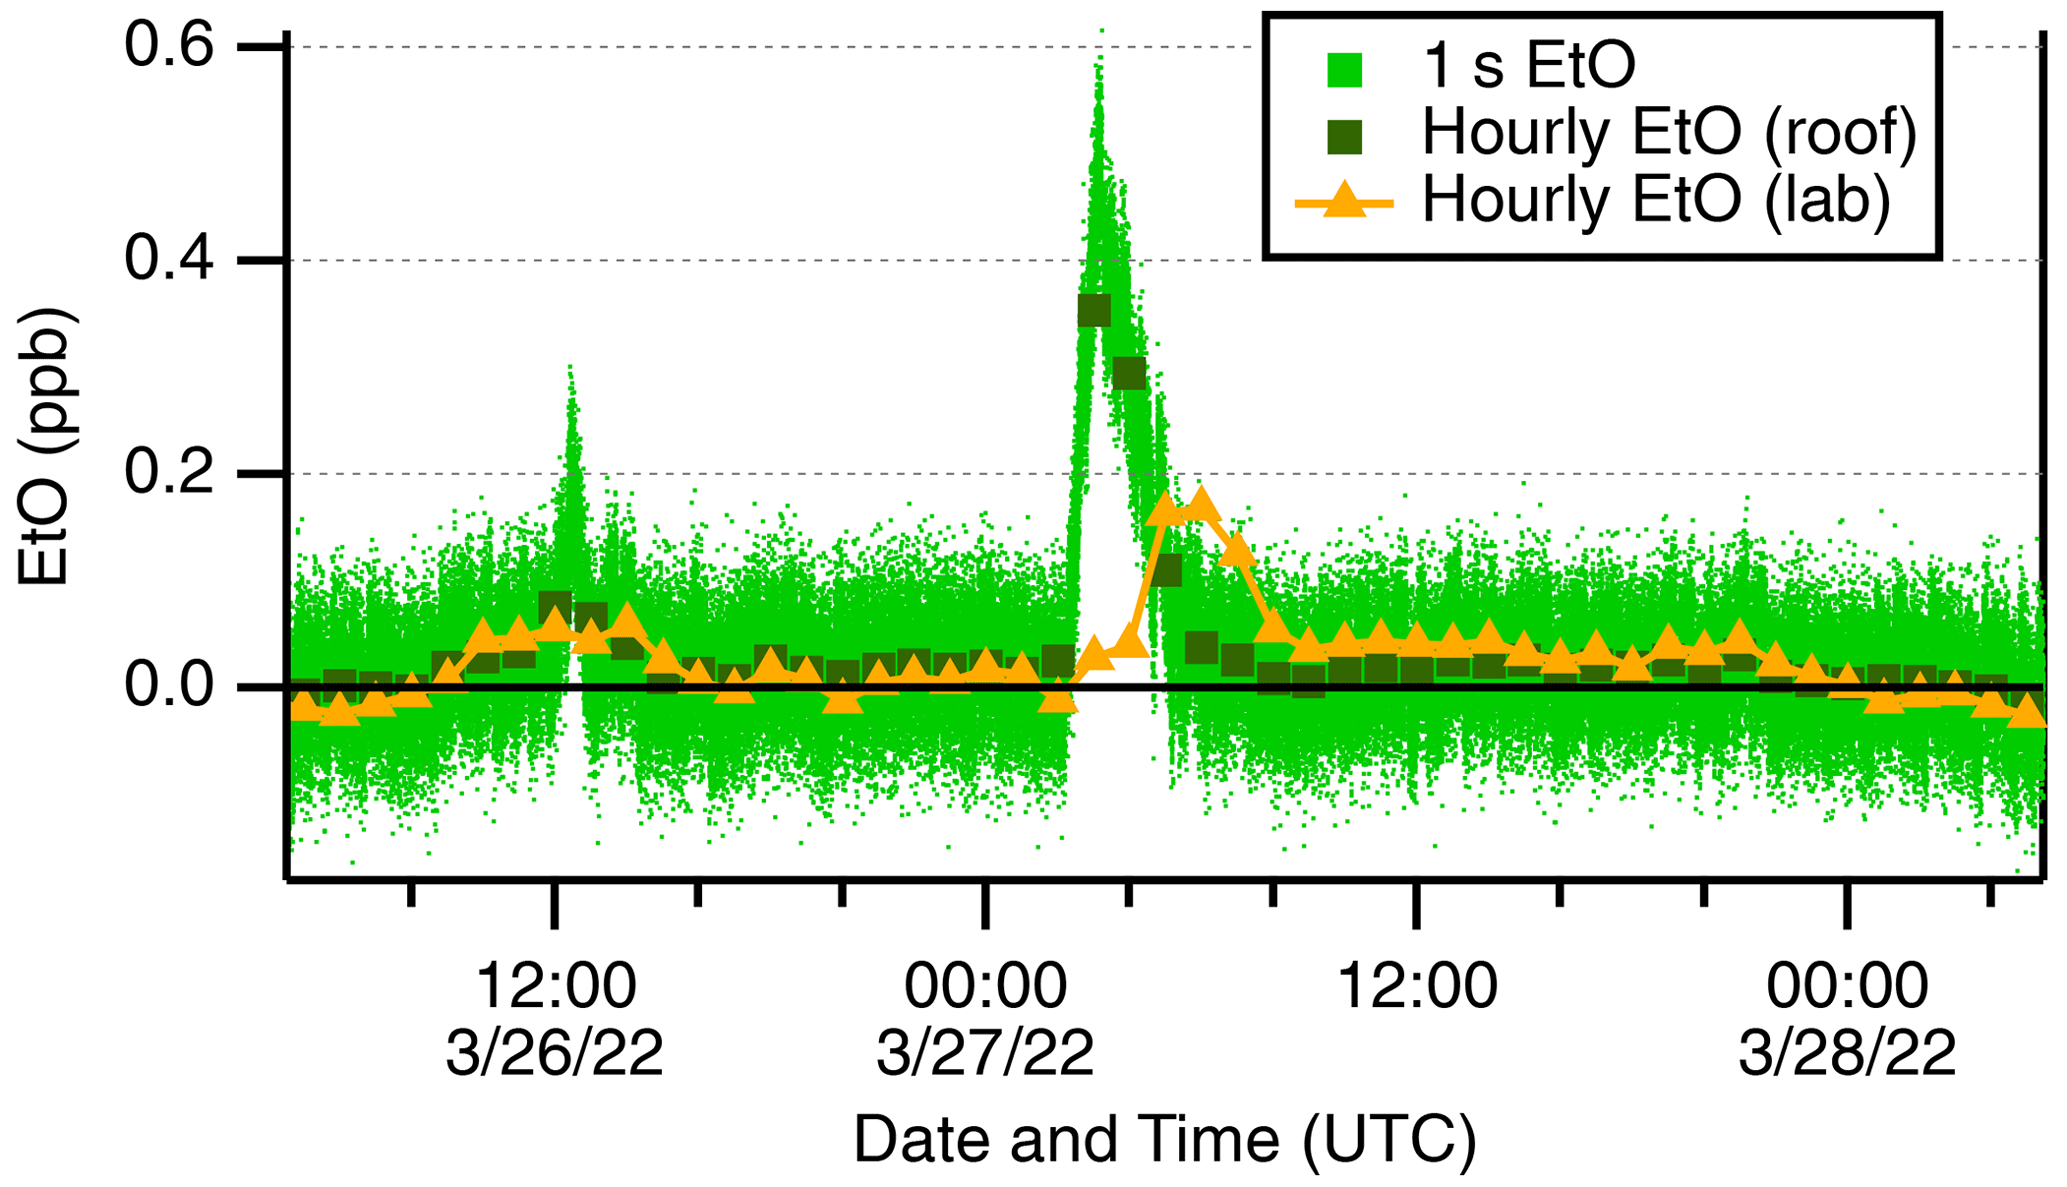
Figure 4Ethylene oxide events measured on the rooftop inlet. Outdoor data at 1 s (pale green) are shown alongside hourly averages (dark green squares). Laboratory air sampled prior to autobackgrounds (orange triangles) is shown.
Back-trajectory simulations for this event were performed using NOAA's HYSPLIT model (Rolph et al., 2017; Stein et al., 2015) (see Figs. S4 and S5). These simulations suggest that regional transport was from the southwest during this time. This trajectory passes over a commercial sterilization facility approximately 35 km away that is known by the EPA to use EtO (US EPA, 2022a). In the following section, we describe near-field mobile measurements of this source, showing clear EtO enhancements downwind. These ambient measurements highlight the benefits of the high-precision TILDAS-FD-EtO sensor over alternative methods like canister sampling, which typically have long integration times (24 h) that would wash out brief events and are prone to sampling artifacts at hundreds of part-per-trillion levels (US EPA, 2021; Hoisington and Herrington, 2021).
3.3 Near-field mobile measurements
Motivated by the sporadic enhancement events in the ambient measurement record, mobile measurements of two commercial sterilization facilities in Massachusetts (US EPA, 2022a) were conducted in August 2022. The first source visited, “Facility A”, was the facility identified through HYSPLIT-trajectory explorations of the 27 March 2022 event. Facility A was visited over the course of ∼4 h, split between morning and afternoon. Average downwind concentrations are summarized in Fig. 5, showing clear enhancements above the background downwind of the facility. Concentration enhancements ∼600 m from the source were around 5 ppb, with enhancements as high as 300 ppb measured 35 m from the facility. Additional transects, time series, and spatial averages are shown in the Supplement.
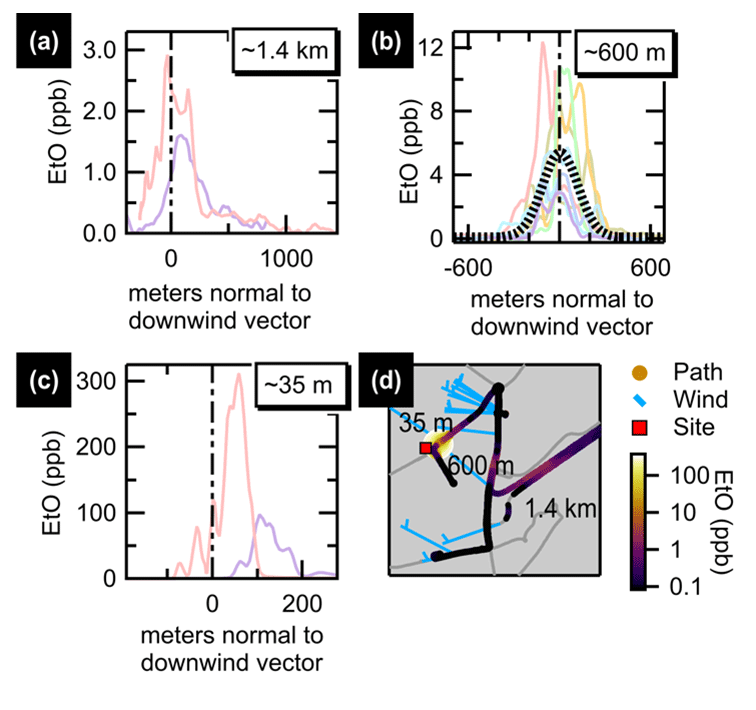
Figure 5Summary of transects downwind of Facility A. Transects are plotted normal to the wind vector for paths driven along three roads approximately 1.4 km (a), 600 m (b), and 35 m (c) downwind of Facility A. The average of 600 m transects (dotted black line) is shown for panel (b). A map (d) shows the facility location (red square) with the three main transect roads labeled by distance downwind. The driven path is colored and sized by EtO concentration. Wind barbs (blue) are tethered to the truck path, with the feather end of the staff pointing into the wind.
The second source measured, “Facility B”, is also a commercial sterilization facility (US EPA, 2022a) and is located 15 km south of the Billerica, MA, stationary measurement site. The EPA has conducted a risk assessment of this facility and found enhanced cancer risk (US EPA, 2022a). Facility B also showed enhancements above the background on this measurement day (maximum of 7.5 ppb 60 m downwind), though at far lesser concentrations than Facility A. Further details are presented in the Supplement.
The TILDAS-FD-EtO monitor achieves precisions of <75 ppt or <0.075 ppb in 1 s and <20 ppt in 100 s (1σ precisions), with averaging down to 4 ppt in an hour (1σ) when operated with frequent humidity-matched zeroes. Ambient measurements at a Massachusetts site reveal EtO concentrations on the order of 18 ppt (22 ppt SD). Distinct EtO events lasting a few hours are observed in the ambient record, with back-trajectory simulations suggesting an EtO source nearly 35 km away. Mobile measurements directly downwind of this medical sterilization facility, as well as another sterilization facility in the state, confirm the presence of EtO emissions at both sites, with downwind concentrations in the 0.5 to 700 ppb range depending on source identity and distance downwind. These measurements highlight how continuous in situ EtO monitoring with a high-precision sensor can provide information leading directly to EtO point source identification.
Ambient ethylene oxide dry-air mixing ratios, hourly averages, and mobile measurement data are publicly and freely available at https://doi.org/10.17605/OSF.IO/JEYWD (Yacovitch et al., 2022).
The supplement related to this article is available online at: https://doi.org/10.5194/amt-16-1915-2023-supplement.
TIY wrote over 50 % of the manuscript and performed the laboratory calibrations. ChD wrote over 25 % of the manuscript and led the phase 1 instrument development program. JRR identified the optimal spectral window, measured the spectroscopic line parameters, and developed the zeroing scheme. CoD led the field deployments of the instrument and optimized the zeroing scheme. JBM designed the optical system for the EtO instrument, including the 400 m path length optical cell. He was deeply involved with the tests and qualification of the instrument, including during hardware changes and spectral analysis. SCH performed time series analysis, wrote 25 % of the manuscript, and led the phase 2 instrument development program.
The contact author has declared that none of the authors has any competing interests.
The US Environmental Protection Agency funded this instrument development,
but no formal review of these results has been conducted. This work has not
been reviewed by the US EPA. The views and conclusions expressed are strictly
based on the evaluation of Aerodyne Research, Inc. scientists only.
Publisher's note: Copernicus Publications remains neutral with regard to jurisdictional claims in published maps and institutional affiliations.
The development of the TILDAS-FD-EtO instrument with a 413 m cell was funded by the US Environmental Protection Agency under SBIR (grant no. 68HERC21C0047). The authors thank Jean-Marie Flaud and colleagues (Lafferty et al., 2013) for insights into high-resolution Fourier transform infrared spectra for EtO.
This research has been supported by the US Environmental Protection Agency (SBIR, grant no. 68HERC21C0047).
This paper was edited by Eric C. Apel and reviewed by Alan Fried and one anonymous referee.
Aeris Technologies: MIRA Pico EtO – ultrasensitive ethylene oxide analyzer, https://aerissensors.com/wp-content/uploads/2019/12/MIRA-Pico_EtO_191208_FINAL_quartz.pdf, last access: 28 September 2022.
Aerodyne Research Inc.: Laser trace gas and isotope analyzers, https://www.aerodyne.com/product/laser-trace-gas-and-isotope- analyzers/, last access: 28 September 2022a.
Aerodyne Research Inc.: TILDAS compact single laser ethylene oxide analyzer, https://www.aerodyne.com/wp-content/uploads/2022/01/EthyleneOxide.pdf, last access: 28 September 2022b.
Entanglement Technologies: AROMA-ETO precision chemical vapor analyzer, https://entanglementtech.com/wp-content/uploads/2021/10/AROMA-ETO-Specifications.pdf, last access: 6 October 2022.
Gordon, I. E., Rothman, L. S., Hill, C., Kochanov, R. V., Tan, Y., Bernath, P. F., Birk, M., Boudon, V., Campargue, A., Chance, K. V., Drouin, B. J., Flaud, J. M., Gamache, R. R., Hodges, J. T., Jacquemart, D., Perevalov, V. I., Perrin, A., Shine, K. P., Smith, M. A. H., Tennyson, J., Toon, G. C., Tran, H., Tyuterev, V. G., Barbe, A., Császár, A. G., Devi, V. M., Furtenbacher, T., Harrison, J. J., Hartmann, J. M., Jolly, A., Johnson, T. J., Karman, T., Kleiner, I., Kyuberis, A. A., Loos, J., Lyulin, O. M., Massie, S. T., Mikhailenko, S. N., Moazzen-Ahmadi, N., Müller, H. S. P., Naumenko, O. V., Nikitin, A. V., Polyansky, O. L., Rey, M., Rotger, M., Sharpe, S. W., Sung, K., Starikova, E., Tashkun, S. A., Auwera, J. V., Wagner, G., Wilzewski, J., Wcisło, P., Yu, S., and Zak, E. J.: The hitran2016 molecular spectroscopic database, J. Quant. Spectrosc. Ra., 203, 3–69, https://doi.org/10.1016/j.jqsrt.2017.06.038, 2017.
Gupta, M., Chan, A. P., Sullivan, M. N., and Gupta, R. M.: Trace measurements of ethylene oxide using cavity-enhanced absorption spectrometry near 3066 cm−1, Aerosol Air Qual. Res., 22, 220046, https://doi.org/10.4209/aaqr.220046, 2022.
Harrison, J. J., Allen, N. D. C., and Bernath, P. F.: Infrared absorption cross sections for methanol, J. Quant. Spectrosc. Ra., 113, 2189–2196, https://doi.org/10.1016/j.jqsrt.2012.07.021, 2012.
Hasegawa, A.: Measurement of ethylene oxide in the atmosphere, J. Environ. Chem., 11, 11–15, 2001.
Hoisington, J. and Herrington, J. S.: Rapid determination of ethylene oxide and 75 VOCs in ambient air with canister sampling and associated growth issues, Separations, 8, 35, https://doi.org/10.3390/separations8030035, 2021.
Kariher, P.: Status of EtO source measurements, 2022 National Ambient Air Monitoring Conference, Pittsburgh, PA, USA, 22–25 August 2022, https://www.epa.gov/system/files/documents/2022-10/Kariher_Peter_Thurs_0900.pdf (last access: 24 March 2023), 2022.
Lafferty, W. J., Flaud, J. M., Kwabia Tchana, F., and Fernandez, J. M.: Raman and infrared spectra of the ν1 band of oxirane, Mol. Phys., 111, 1983–1986, https://doi.org/10.1080/00268976.2013.775516, 2013.
Olaguer, E. P., Robinson, A., Kilmer, S., Haywood, J., and Lehner, D.: Ethylene oxide exposure attribution and emissions quantification based on ambient air measurements near a sterilization facility, Int. J. Env. Res. Pub. He., 17, 42, https://doi.org/10.3390/ijerph17010042, 2020.
OSHA: Ethylene oxide fact sheet, https://www.osha.gov/sites/default/files/publications/ethylene-oxide-factsheet.pdf (last access: 28 September 2021), 2002.
Picarro Inc.: Ambient air monitoring system for ethylene oxide, https://www.picarro.com/products/ambient_air_monitoring_system_for_ethylene_oxide, last access: 28 September 2021.
Rolph, G., Stein, A., and Stunder, B.: Real-time environmental applications and display system: Ready, Environ. Modell. Softw., 95, 210–228, https://doi.org/10.1016/j.envsoft.2017.06.025, 2017.
Stein, A. F., Draxler, R. R., Rolph, G. D., Stunder, B. J. B., Cohen, M. D., and Ngan, F.: NOAA's HYSPLIT atmospheric transport and dispersion modeling system, B. Am. Meteorol. Soc., 96, 2059–2077, https://doi.org/10.1175/bams-d-14-00110.1, 2015.
US EPA: Evaluation of the inhalation carcinogenicity of ethylene oxide, National Center for Environmental Assessment Office of Research and Development, U. S. Environmental Protection Agency, Washington DC, Report EPA/635/R-16/350Fc, https://iris.epa.gov/static/pdfs/1025_summary.pdf (last access: 28 September 2022), 2016.
US EPA: IRIS assessments: Ethylene oxide, https://cfpub.epa.gov/ncea/iris2/chemicalLanding.cfm?substance_nmbr=1025 (last access: 28 September 2022), 2017.
US EPA: Ethylene oxide data summary from national air toxics trends stations and urban air toxics monitoring program sites, https://www.epa.gov/hazardous-air-pollutants-ethylene-oxide/ethylene-oxide-data-summary-national-air-toxics-trends (last access: 29 August 2022), 2019.
US EPA: EPA's work to understand background levels of ethylene oxide, https://www.epa.gov/hazardous-air-pollutants-ethylene- oxide/epas-work-understand-background-levels-ethylene-oxide (last access: 30 August 2022), 2021.
US EPA: Ethylene oxide commercial sterilization facilities, https://www.epa.gov/hazardous-air-pollutants-ethylene-oxide/ethylene-oxide-commercial-sterilization-facilities, last access: 30 August 2022a.
US EPA: Integrated risk information system (IRIS) glossary, https://iaspub.epa.gov/sor_internet/registry/termreg/searchandretrieve/glossariesandkeywordlists/search.do?details=&vocabName=IRIS%20Glossary (last access: 24 March 2023), 2022b.
US EPA: Monitor values report – hazardous air pollutants, https://www.epa.gov/outdoor-air-quality-data/monitor-values- report-hazardous-air-pollutants, last access: 30 August 2022c.
Werle, P.: Accuracy and precision of laser spectrometers for trace gas sensing in the presence of optical fringes and atmospheric turbulence, Appl. Phys. B, 102, 313–329, https://doi.org/10.1007/s00340-010-4165-9, 2011.
Yacovitch, T. I., Dyroff, C., Roscioli, J. R., Daube, C., McManus, J. B., and Herndon, S. C.: Dataset accompanying mansucript “Ethylene Oxide Monitor with Part-per-Trillion Precision for In-Situ Measurements”, OSF [data set], https://doi.org/10.17605/OSF.IO/JEYWD, 2022.