the Creative Commons Attribution 4.0 License.
the Creative Commons Attribution 4.0 License.
 | 13 Apr 2023
POLIPHON conversion factors for retrieving dust-related cloud condensation nuclei and ice-nucleating particle concentration profiles at oceanic sites
Albert Ansmann
Fuchao Liu
Longlong Wang
Dongzhe Jing
Huijia Shen
Aerosol–cloud interactions (ACIs) are the largest contributor to the uncertainty in the global radiation budget. To improve the current consideration of ACIs in global circulation models, it is necessary to characterize the 3-D distribution of dust-related cloud condensation nuclei concentration (CCNC) and ice-nucleating particle concentration (INPC) globally. This can potentially be realized using the POlarization LIdar PHOtometer Networking (POLIPHON) method together with spaceborne lidar observations. However, dust-related conversion factors that convert bulk aerosol optical properties from lidar measurements to aerosol microphysical properties are still less constrained in many regions, which limits the applications of the POLIPHON method. Here we retrieve the essential dust-related conversion factors at remote oceanic and coastal sites using the historical AErosol RObotic NETwork (AERONET) database. Depolarization-ratio-based dust ratios Rd at 1020 nm are applied to identify the dust-occurring cases, thus enabling us to contain fine-mode dust-dominated cases (after the preferential removal of large-sized dust particles during transport), study the evolution of dust microphysical properties along the transoceanic pathway, and mitigate occasional interference of large-sized marine aerosols. The newly proposed scheme is proven to be valid and feasible by intercomparisons with previous studies at nine sites in/near deserts. The dust-related conversion factors are calculated at 20 oceanic and coastal sites using both pure dust (PD) and PD plus dust-dominated mixture (PD+DDM) datasets. At nearly half of the sites, the conversion factors are solely calculated using the PD datasets, while at the remaining sites, the participation of DDM datasets is required to ensure a sufficient number of data for the calculation. Evident variation trends in conversion factors are found for cv,d (extinction-to-volume concentration, gradually decreasing), c250,d (extinction-to-particle (with a radius > 250 nm) number concentration, gradually increasing), and cs,d (extinction-to-surface-area concentration, gradually decreasing) along both the transpacific and transatlantic dust transport pathways. The retrieved dust-related conversion factors are anticipated to inverse 3-D dust-related CCNC and INPC distributions globally, thereby improving the understanding of ACIs in atmospheric circulation models.
- Article
(4980 KB) - Full-text XML
- Companion paper
- BibTeX
- EndNote


Clouds are widely present in the Earth's atmosphere, as they cover approximately two-thirds of the Earth's surface. They play an essential role in weather, hydrology, climate, air chemistry, and several practical applications (Spänkuch et al., 2022). Clouds modify the radiation budget of the Earth by regulating the incoming solar radiation and outgoing longwave radiation, thus significantly affecting the global climate. The level of induced net radiation is strongly associated with the microphysical characteristics of cloud particles (either cloud droplets or ice crystals), i.e., size, concentration, phase, and shape. These characteristics are greatly influenced by aerosol–cloud interactions (ACIs), also known as “aerosol indirect effects”, thus resulting in the largest uncertainties in the global effective radiative forcing (IPCC, 2021; Rosenfeld et al., 2014).
For liquid water clouds, aerosols serve as cloud condensation nuclei (CCN) to alter the droplet size and albedo (Twomey, 1974), as well as to postpone the initiation of rainfall and to increase the lifetime and coverage of clouds (Albrecht, 1989). For mixed-phase and ice clouds, heterogeneous nucleation is another crucial effect in which proper aerosol particles may act as an ice-nucleating particle (INP) to trigger in-cloud ice formation (from either vapor or liquid water) (Ansmann et al., 2019a, b, 2021; Murray et al., 2012; Cziczo et al., 2013; Yin et al., 2021). In the study of ACIs, it is of great importance to quantify the concentration of CCN and INP. In recent years, aerosol optical depth (AOD) and aerosol index (AI) have been found to be inaccurate proxies for CCN (Shinozuka et al., 2015; Stier, 2016), thus motivating the scientific community to estimate the CCN concentration (CCNC) (Mamouri and Ansmann, 2016; Georgoulias et al., 2020; Choudhury and Tesche, 2022a, b; Patel et al., 2022; Lenhardt et al., 2022). Phillips et al. (2013) stated that the reliable quantification of the linkage between aerosol conditions and ice crystal numbers should be the first step in quantifying cold-cloud indirect effects. Thus, INP concentration (INPC) is estimated in many studies to predict the initial in-cloud ice crystal number concentration (ICNC) via primary heterogeneous nucleation (Ansmann et al., 2019a; He et al., 2022a; Kanji et al., 2017). Moreover, discrepancies between INPC and ICNC are found to establish the role of secondary ice nucleation (DeMott et al., 2011). Therefore, the constraint of ambient INPC can lead to an accurate representation of cloud microphysical processes and reduce the uncertainties in estimating the climate feedback associated with ice and mixed-phase clouds in climate models (Li et al., 2022).
To estimate the CCNC and INPC, the POlarization LIdar PHOtometer Networking (POLIPHON) method was developed by Ansmann et al. (2012) and has been improved for years in several field campaigns (Mamouri and Ansmann, 2014, 2015, 2016, 2017). As a remote sensing approach, it has been well verified through comparisons with simultaneous in situ measurements (Marinou et al., 2019; Wieder et al., 2022); hence, it is applicable for the analysis of long-term observations. The POLIPHON method has been proven to be useful for examining the profiles of CCNC, INPC, and aerosol number concentration retrieved from spaceborne lidar measurements with other algorithms (Choudhury and Tesche, 2022a, b; Choudhury et al., 2022). In the POLIPHON method, the lidar-derived aerosol extinction coefficient profiles are first divided into the respective contributions from different aerosol types (Tesche et al., 2009; Mamouri and Ansmann, 2016, 2017) as well as from fine- and coarse-mode components (Mamouri and Ansmann, 2014). Then, these aerosol-type-dependent extinction coefficient profiles are converted into CCNC and INPC profiles by employing the photometer-data-derived conversion factors and different CCN and INP parameterizations. Conversion factors connect the lidar-retrieved aerosol optical properties and aerosol microphysical properties and thus can be used to estimate CCNC and INPC straightforwardly.
Dust aerosols are the most abundant aerosol type by mass in the atmosphere (Kok et al., 2021a) and are considered both effective CCN and INP (Mamouri and Ansmann, 2016; He et al., 2021a, b, 2022a, b; Murray et al., 2012; Kanji et al., 2017). Therefore, dust-related CCNC and INPC estimations should receive special attention. Numerous field campaigns have been conducted to study regional CCNC and INPC profiles (Haarig et al., 2019; Hofer et al., 2020; Engelmann et al., 2021; He et al., 2021b). Using spaceborne lidar, e.g., Cloud-Aerosol Lidar with Orthogonal Polarization (CALIOP) launched in April 2006 (Winker et al., 2007) and the currently ongoing EarthCARE mission (Illingworth et al., 2015), we can characterize the 3-D distribution of dust-related CCNC and INPC at a global scale. Therefore, the number concentration of cloud droplets and ice crystals can be well quantified (Ramanathan et al., 2001), thus improving the current consideration of ACIs in global circulation models (Mamouri and Ansmann, 2015; Froyd et al., 2022).
To do this, the first challenge is to retrieve the global dust-related conversion factors. However, they are generally regionally variable and dependent on the microphysical properties of dust particles. Mamouri and Ansmann (2015) first calculated the dust-related conversion factors based on sun–sky photometer data during several field campaigns, including the Saharan Mineral Dust Experiment 1 and 2 (SAMUM-1, SAMUM-2), the Saharan Aerosol Long-range Transport and Aerosol–Cloud Interaction Experiment (SALTRACE), and long-term observations in Limassol. Subsequently, Ansmann et al. (2019b) obtained dust-related conversion factors using AErosol Robotic NETwork (AERONET) data at typical sites near the main deserts. They assumed the predominant contribution of dust in the atmospheric column and systematically applied the column-integrated Ångström exponent (AE, for 440–870 nm) < 0.3 and AOD at 532 nm > 0.1 as the criteria in selecting dust-presence cases. Dust particles are frequently elevated from the surface of desert regions by wind or thermal convection and can sometimes undergo advective transport over a long range. The dust-related conversion factors can be very different for the downstream areas far from the dust sources due to the possible aging and mixing of dust with other aerosol types during long-range transport (Kim and Park, 2012; Goel et al., 2020). However, for these downstream areas, dust-related conversion factors are still lacking owing to insufficient data points fulfilling the criteria. In addition, the Ångström-exponent-based dust selection scheme may exclude some fine-mode dust particles, resulting in a potential deviation in the conversion factors. The two major gaps are the remote oceans and polluted city regions (He et al., 2021b; Zhang et al., 2022). Ocean areas are less affected by complicated anthropogenic aerosols and may always be intruded upon by long-range transoceanic dust plumes (Yu et al., 2021; Dai et al., 2022), which are thus preferentially focused on in this study.
To calculate the dust-related conversion factors at the oceanic and coastal sites, we use a different scheme to identify the presence of dust in AERONET measurements. The new scheme is based on the particle linear depolarization ratio (PLDR) in the AERONET Version 3 aerosol inversion product, which is considered a good indicator for nonspherical dust particles (Shin et al., 2018, 2019). It should be noted that the particle linear depolarization ratio values in AERONET retrieval are calculated from the combination of the particle size distribution and complex refractive index based on a spheroid light-scattering model (Dubovik et al., 2006). Based on a modeling study, Gasteiger et al. (2011) found that the lidar-measured particle linear depolarization ratio values for pure mineral dust can be better reproduced by using an irregular particle-shape assumption compared with using the spheroid-shape assumption. Nevertheless, we consider it adequate to adopt AERONET-derived particle linear depolarization ratio values to qualitatively identify the presence of dust in the atmospheric column (Noh et al., 2017). Three factors motivate us to do so rather than to use the method raised by Ansmann et al. (2019b). First, applying AE < 0.3 to select the dust-occurring data may exclude some data points representative of fine-mode dust particles that are proven to be present and cannot be ignored (Mamouri and Ansmann, 2014; Shin et al., 2019). Second, tracing the variations in dust-related conversion factors at different oceanic and coastal sites may provide us with more information on the evolution of dust microphysical properties along with transoceanic transport routes (Rittmeister et al., 2017). In addition, marine aerosols that mainly consist of sea spray aerosols may occasionally show small AEs, which may confuse dust identification by using AE < 0.3 as a criterion (Smirnov et al., 2011; Yin et al., 2019).
In this study, we estimate the dust-related POLIPHON conversion factors at remote oceanic and coastal sites using AERONET databases, which is considered an important step toward to the study of dust INPC and CCNC at a global scale and subsequent dust-induced ACIs. The paper is organized as follows. We first briefly introduce the POLIPHON method and dust-related conversion factors as well as the AERONET data and dust data identification scheme. In Sect. 3, we compare the dust-related conversion factor at the sites near deserts with the results from Ansmann et al. (2019b), represent the dust-related conversion factors at the ocean and coast sites, and discuss the possible reason behind the variation in conversion factors along the transoceanic transport. In the last section, summaries and conclusions are provided.
2.1 POLIPHON method and conversion factors
The POLIPHON method can be used to obtain particle microphysical property profiles (i.e., particle number, surface area, and volume concentration) and then particle mass, CCN, and INP concentration profiles for several aerosol types using a combination of polarization lidar and sun photometer (Mamouri and Ansmann, 2014, 2015, 2016; Marinou et al., 2019). This method has been widely used in the estimations of CCN- and INP-relevant aerosol parameters for multiple aerosol types including dust (Ansmann et al., 2019a; Hofer et al., 2020; He et al., 2021b, 2022a, b), marine aerosol (Mamouri and Ansmann, 2016, 2017; Haarig et al., 2019), continental aerosol (Mamouri and Ansmann, 2016, 2017), and smoke (Ansmann et al., 2021; Haarig et al., 2019). In this study, we focus on the dust-related CCN and INP properties.
Table 1Dust-related parameters of optical properties, cloud condensation nuclei, and ice-nucleating particles calculated by the POLIPHON method (Tesche et al., 2009; Marinou et al., 2019; Ansmann et al., 2019b). D10, D15, U17, N12, and S15 refer to the respective INP parameterizations in DeMott et al. (2010), DeMott et al. (2015), Ullrich et al. (2017), Niemand et al. (2012), and Steinke et al. (2015). The subscript “ss” denotes the water supersaturation. The uncertainties are provided based on using the CALIOP level-2 aerosol profile product for INPC and CCNC calculation.
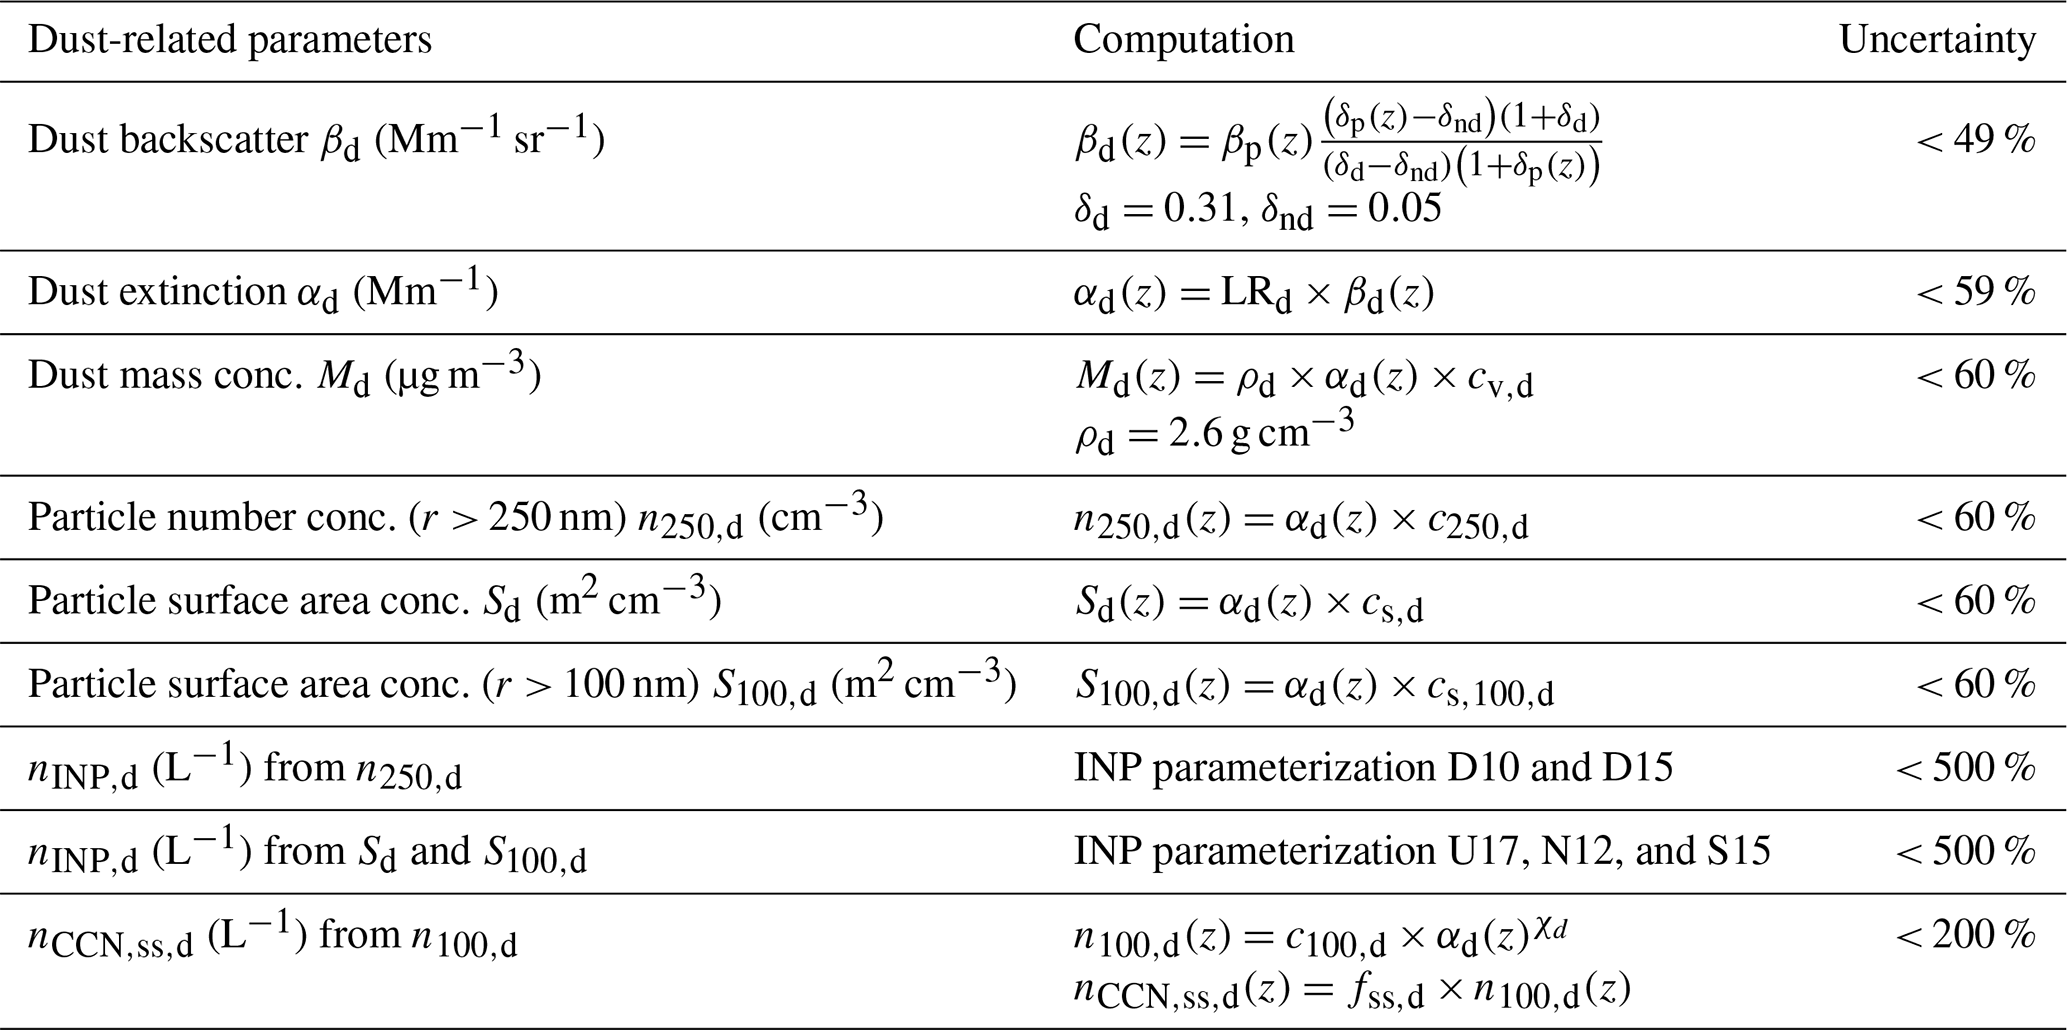
The calculation is given in Table 1. First, the dust backscatter coefficient βd and extinction coefficient αd can be derived by polarization lidar observations based on the inversion method from Fernald (1984) and the dust-component separation method from Tesche et al. (2009), as shown by the following equation:
where δd=0.31 and δnd=0.05 are dust (subscript “d”) and non-dust (subscript “nd”) particle depolarization ratios (Burton et al., 2013), respectively, and δp and βp are the lidar-derived particle depolarization ratio and backscatter coefficient, respectively. The lidar ratio (LR) for dust usually ranges from 30 to 60 sr depending on the different dust sources (Müller et al., 2007; Mamouri et al., 2013; Hu et al., 2020; Peng et al., 2021). Then, the dust extinction coefficient can be converted into particle mass concentration Md, particle number concentration n250,d (r > 250 nm), and particle surface area concentration sd and s100,d (r > 100 nm) by multiplying their corresponding conversion factors, i.e., cv,d, c250,d, cs,d, and . Finally, the dust-related INP concentration nINP,d can be retrieved by inputting n250,d and sd into different INP parameterization schemes (DeMott et al., 2010, 2015; Niemand et al., 2012; Steinke et al., 2015; Ullrich et al., 2017). In addition, particle number concentration n100,d (r > 100 nm) is considered a good proxy for dust-related CCN concentration as discussed by Mamouri and Ansmann (2016). Here, the subscript ss denotes the water supersaturation. Thus, can be obtained by multiplying n100,d by a water-supersaturation-dependent factor fss,d, which is 1.0 for a typical liquid water supersaturation value of 0.2 %.
In the POLIPHON method, as introduced above, a series of conversion factors are essential to the conversion from the dust extinction coefficient to dust microphysical parameters regarding CCN and INP concentrations. The conversion factors are pre-calculated from the historical database of sun photometer observations (denoted as j for each data point, counting from 1 to Jd). The calculation processes are shown below (Ansmann et al., 2019b):
where D is an introduced thickness for a given aerosol layer, and τ is the AOD at 532 nm calculated from the sun-photometer-measured AOD at 500 nm together with the Ångström exponent (for 440–870 nm). Vd and N250,d are the column particle volume concentration and column large particle (radius > 250 nm) number concentration, respectively; Sd and S100,d (radius > 100 nm) are the column particle surface area concentrations. Vd, N250,d, Sd, and S100,d are derived from the particle size distribution data in AERONET aerosol inversion products, which are introduced in detail in Sect. 2.2. αd is the layer-mean aerosol extinction coefficient at 532 nm; vd and n250,d are the layer-mean volume concentration and large particle (radius > 250 nm) number concentration, respectively; and sd and s100,d (radius > 100 nm) are the layer-mean particle surface area concentrations. The subscript “d” denotes “dust”, which is considered the major contribution in column aerosol loading for the selected sun photometer data.
In addition, it is challenging to estimate the CCN concentration because the ability of aerosol particles to serve as CCN has a complex relationship with the particle hygroscopicity (associated with particle size and chemical composition) and water supersaturation level (Wang et al., 2010; Moore et al., 2012). As suggested by Shinozuka et al. (2015), a log–log regression analysis was performed to retrieve the CCN-relevant conversion factor c100,d and regression coefficient χd with the following equation:
In general, dust-related conversion factors have a regional-dependent characteristic associated with the origin of dust regions as well as the specific local anthropogenic dust emissions (Philip et al., 2017). To extend the POLIPHON method toward global dust applications, Ansmann et al. (2019b) provided dust-related conversion factors at 20 AERONET sites in/near the typical desert regions, where other types of aerosols have less or even negligible contributions to the aerosol properties of the atmospheric column. Therefore, the obtained conversion factors can be considered the representatives of pure or quasi-pure dust situations. To select the dust-occurring datasets for calculation, they adopted the constraints of the column-integrated Ångström exponent (for 440–870 nm) < 0.3 and aerosol optical depth (at 532 nm) > 0.1. Due to the influence of anthropogenic aerosols, the available dust-occurring data points are insufficient for calculating the conversion factors. To solve this issue, He et al. (2021b) applied simultaneous polarization lidar observations to assist in the filtration of dust-occurring datasets in Wuhan (30.5∘ N, 114.4∘ E), a central Chinese megacity impacted by both local anthropogenic aerosol emissions and long-range-transported dust (He and Yi, 2015; He et al., 2022c; Liu et al., 2022).
Dust plumes can also realize transoceanic transport in the Northern Hemisphere; there are two well-known pathways, i.e., the transatlantic route from the Saharan desert to America (Yu et al., 2021; Dai et al., 2022) and the transpacific route from Asian dust sources (Taklimakan and Gobi deserts) to America (Guo et al., 2017; Hu et al., 2019). However, dust-related conversion factors over the ocean are rarely reported. Sea spray aerosols usually have a large size, presenting a similarly small Ångström exponent as dust particles (Haarig et al., 2017). To avoid the interference of sea spray aerosols, we use another scheme to identify the dust-occurring datasets, taking advantage of the particle linear depolarization ratio (PLDR) in AERONET aerosol inversion products (Shin et al., 2019). Therefore, sufficient available dust data points can be selected even at remote oceanic sites.
2.2 AERONET data and depolarization-ratio-based dust data point selection
AERONET is a global ground-based aerosol monitoring network and has provided more than 25 years of aerosol column property observations. CE318 sun–sky photometers are used to measure direct solar irradiance (generally at 340, 380, 440, 500, 675, 870, 1020, and 1640 nm) and directional sky radiance to retrieve the spectral-resolved AODs and, in turn, the additional aerosol inversion products. Moreover, the latest-applied CE318-T can also perform nighttime measurements of the spectral lunar irradiance. In this study, the AERONET database (Holben et al., 1998; Dubovik et al., 2000; Dubovik and King, 2000) was employed to retrieve the dust-related conversion factors at 9 sites near/in deserts (to compare with the values given in Ansmann et al., 2019b, as a validation of the newly proposed dust selection scheme) and at 20 oceanic and coastal sites influenced by long-range-transported dust (see Fig. 1). The oceanic and coastal sites can be classified into five regional clusters, i.e., the Pacific, Pacific coast, Atlantic, Indian Ocean, and Arctic Ocean, representing dust characteristics in different regions.
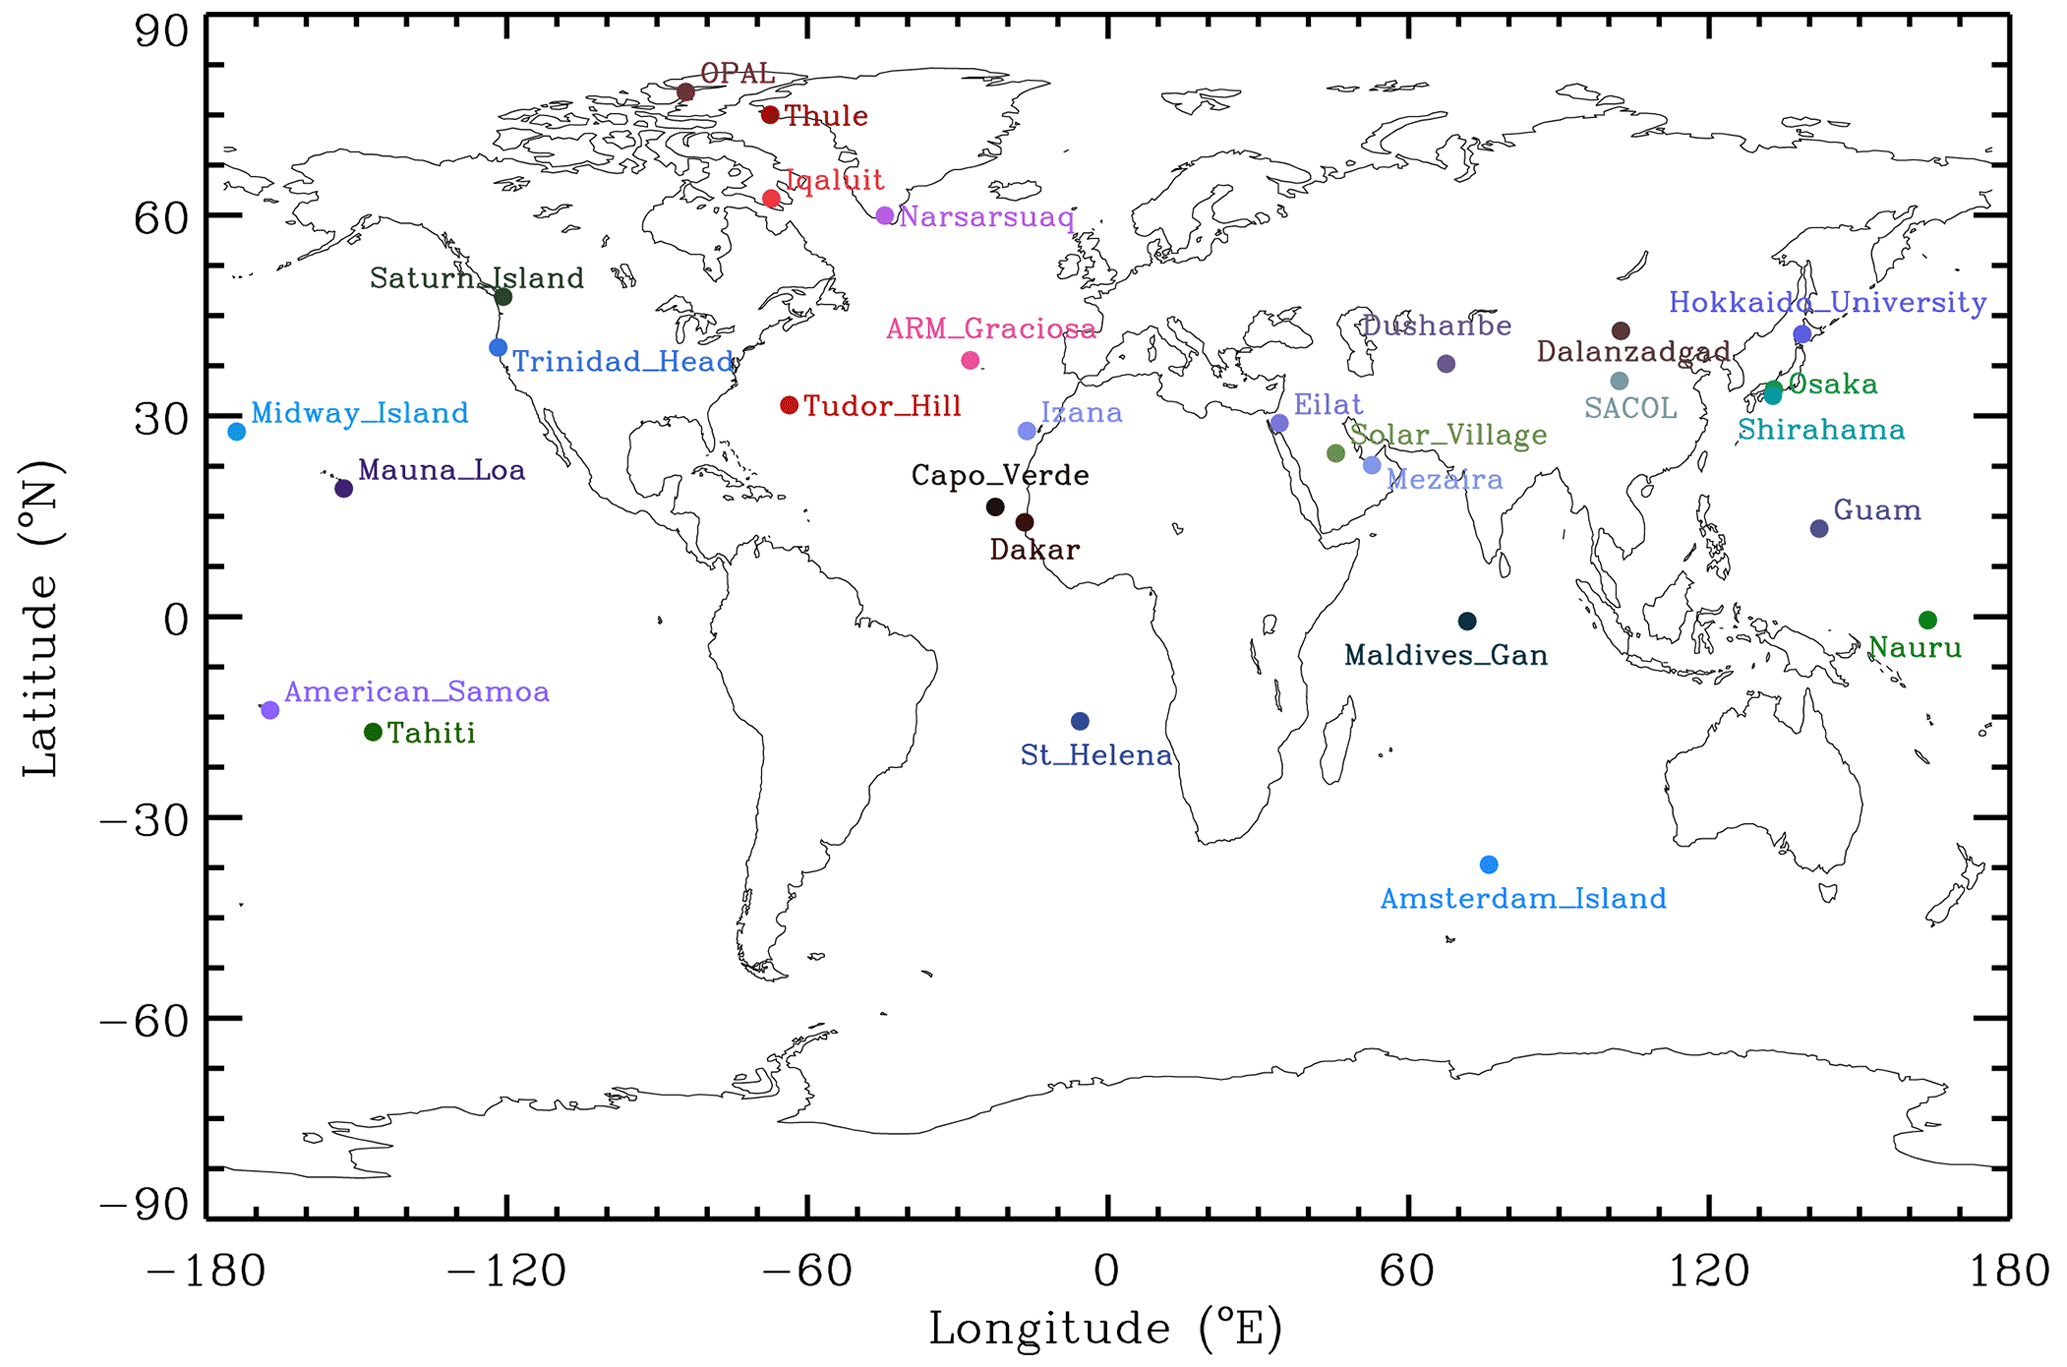
Figure 1Overview of the oceanic and coastal (20 sites) and near-desert (9 sites selected from Ansmann et al., 2019b) AERONET sites used in this study. Labels for each site are taken from the AERONET site list.
Table 2Basic information of the AERONET sites selected for dust-related POLIPHON conversion factor calculation near the deserts (from North Africa, the Middle East, and Asia) and over the ocean and coast (from the Pacific, Pacific coast, Atlantic, Indian Ocean, and Arctic Ocean) regions, including the site name and abbreviation, period, and location. The available number of data points for total, dust-dominated mixture (DDM), and pure dust (PD) observations in AERONET Version 3 aerosol inversion products (level 2.0 for near-desert cluster and level 1.5 for oceanic and coastal cluster) are also given, respectively. Average AODs at 532 nm (AOD) and Ångström exponents between 440 and 870 nm (AE) at each site are provided.
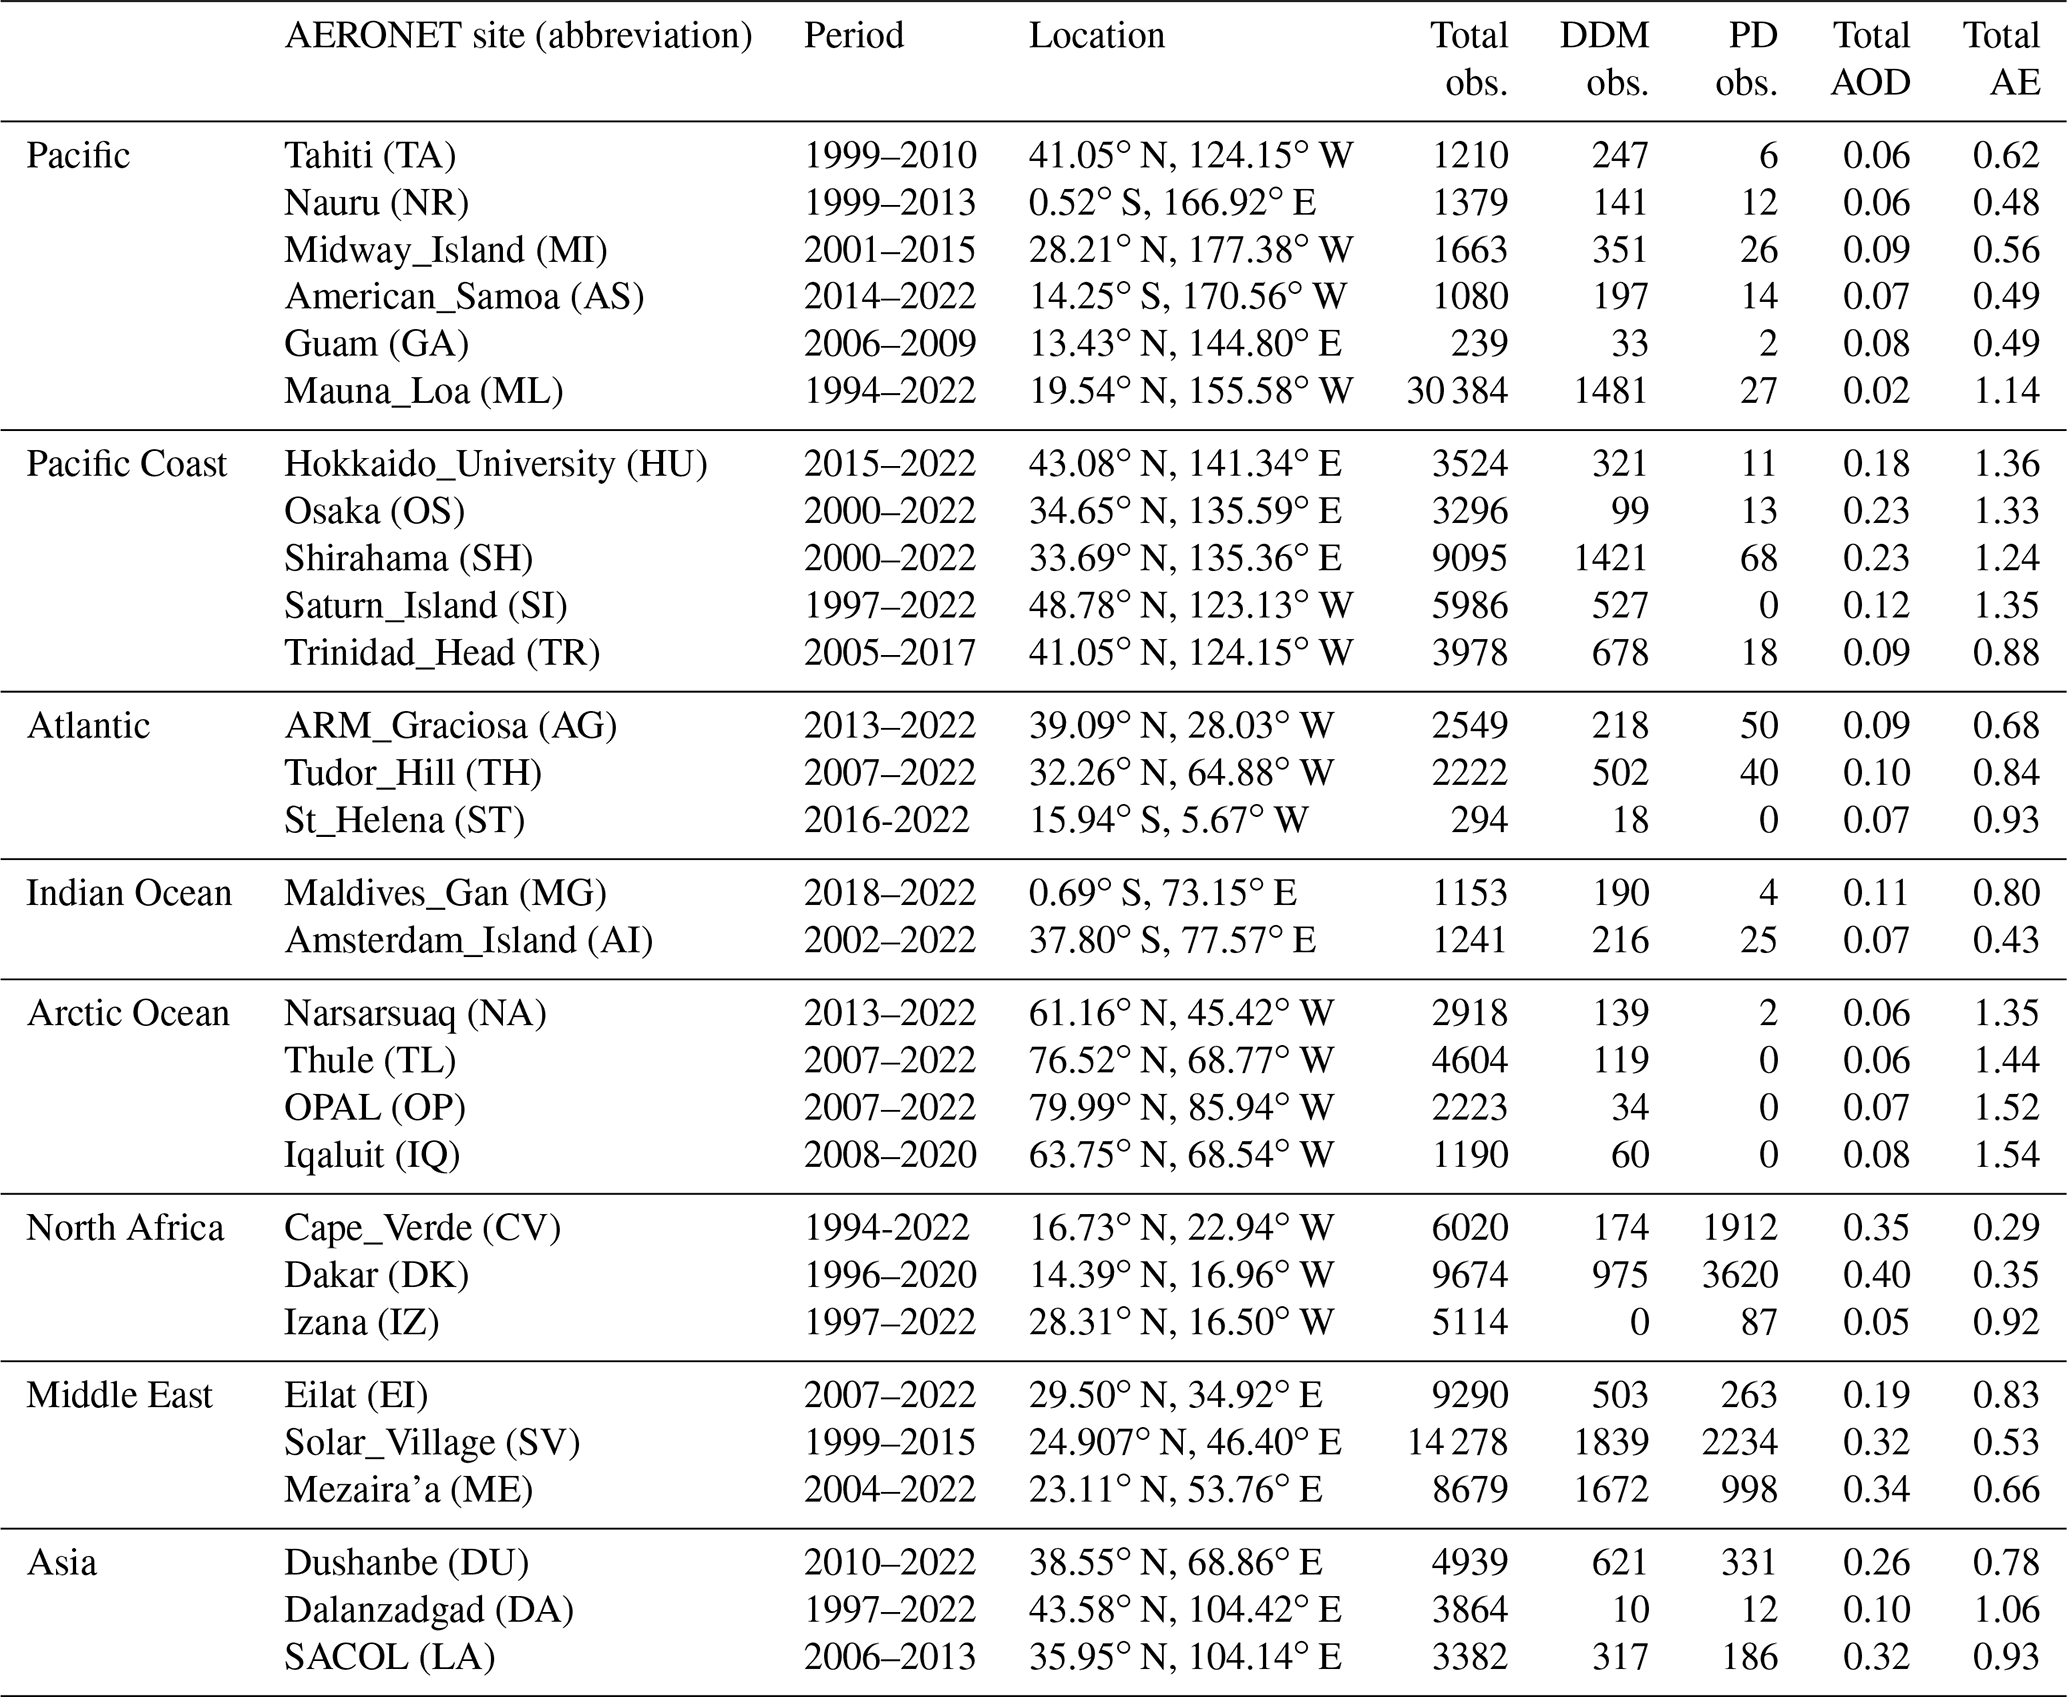
We used the quality-assured level-2.0 AOD in AERONET Version 3 aerosol optical depth solar products (Giles et al., 2019). Moreover, the particle volume size distribution with 22 size bins (radius) ranging from 50 nm to 15 µm and PLDR in AERONET Version 3 aerosol inversion products are also used for calculating Vd, N250,d, Sd, and S100,d as described in Sect. 2.1 (Sinyuk et al., 2020). The specific calculation processes can be found in Mamouri and Ansmann (2014, 2015) and Ansmann et al. (2019b). For the near-/in-desert sites, level-2.0 (quality-assured) aerosol inversion products are applied, while for the oceanic and coastal sites, level-1.5 (cloud-screened and quality-controlled) aerosol inversion products are applied, since the level-2.0 PLDR data are unavailable. The basic information of the selected sites is shown in Table 2, including period, longitude, latitude, and the number of data points for total, dust-dominated mixture, and pure dust (PD) observations.
In AERONET retrieval, based on the aerosol spheroid model, the combination of the particle size distribution and complex refractive index can be used to further compute the two elements of the Müller scattering matrix, i.e., F11(λ) and F22(λ) (Bohren and Huffman, 1983; Dubovik et al., 2006; Shin et al., 2018), which can then be used to derive the backscattering PLDR with the following formula:
AERONET PLDR data are a good indicator of dust occurrence and have been verified to be well correlated with lidar-derived values (Noh et al., 2017). Shin et al. (2018) found that PLDR values at 870 and 1020 nm are more reliable according to the comparison with those from lidar observations for pure dust particles. Therefore, we use PLDR at 1020 nm (only denoted as PLDR hereafter) to select the dust-occurring data points for the POLIPHON conversion factor calculation (Shin et al., 2019). Note that the overestimation of near-infrared PLDR is reported by comparison with concurrent polarization lidar observations (Toledano et al., 2019; Haarig et al., 2022), possibly due to the assumption of the spheroid particle in AERONET inversion. Nevertheless, values are only used to qualitatively identify the dust presence with the presupposed threshold values. Its validity will be verified by comparing the derived conversion factors with those from Ansmann et al. (2019b) in Sect. 3.1.
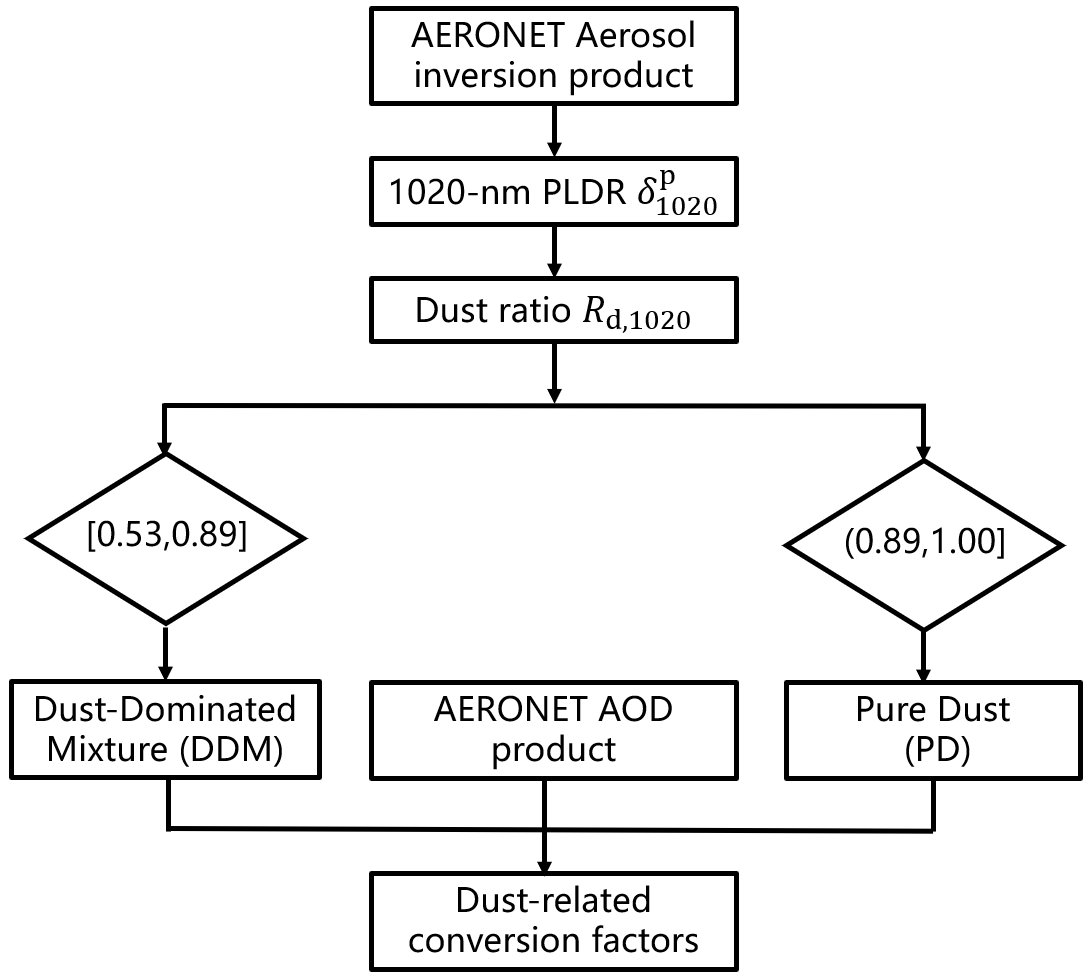
The column-integrated dust ratio (Rd,1020), representing the contribution proportion of dust backscatter to the total particle backscatter in the atmospheric column, is defined as follows:
It should be noted that the dust () and non-dust () particle depolarization ratios are set to 0.30 and 0.02, respectively, to be consistent with the value proposed by Shin et al. (2019). These two values are slightly different from those used in the POLIPHON method in Eq. (1). According to the scheme from Shin et al. (2019), we classify data points with Rd,1020 values of > 0.89 as pure dust (PD) and 0.53–0.89 as dust-dominated mixture (DDM, which can also be considered “mixed dust”, as in He et al., 2021b). Note that in this study, the DDM includes the combination of sectors B (fine-mode fraction (FMF) = 0–0.4), C (FMF = 0.4–0.6), and E (FMF = 0.6–1.0) in Shin et al. (2019). A flow chart for dust-occurring data point selection and dust-related conversion factor retrieval is shown in Fig. 2. For the near-/in-desert sites, we presented the results from the PD cluster, which is adequate for calculating the conversion factors. For the oceanic and coastal sites, the results from both the PD and PD+DDM clusters are provided for comparison.
In this section, we mainly focus on the calculation of the dust-related conversion factors in the POLIPHON method with the new dust identification scheme, which is based on the particle linear depolarization ratio in the AERONET data product. To verify the performance of the proposed dust identification scheme, the dust-related conversion factors near deserts are first calculated at nine AERONET sites and compared with those obtained by Ansmann et al. (2019b). Then, the dust-related conversion factors cv,d, c250,d, cs,d, , c100,d, and χd at 20 oceanic and coastal AERONET sites are derived with the proposed method. Finally, the variations in the dust-related conversion factors along the two transoceanic (i.e., transatlantic and transpacific) pathways are analyzed.
3.1 Intercomparison of dust-related conversion factors near deserts with retrievals in Ansmann et al. (2019b)
To validate the performance of the newly proposed dust dataset selection scheme, we chose 9 out of 20 AERONET sites used in Ansmann et al. (2019b) to compare the obtained conversion factors. They are mainly from three typical regions, including North Africa, the Middle East, and Asia (see Fig. 1). It should be mentioned that c100,d values tend to be divergent when the aerosol extinction coefficient is larger than 600 Mm−1. Hence, the validations were only performed for cv,d, c250,d, cs,d, and . Figure 3 shows the scatters regarding the relationships between 532 nm aerosol extinction and n250,d, vd, sd, and s100,d for pure data situations at Cape Verde, Dushanbe, and Mezaira'a. The conversion factor values are also given accordingly. Here, level-2.0 AOD and aerosol inversion product data were employed. PD datasets selected with the method from Shin et al. (2019) perform well, as a highly linear correlation can be found, with linear Pearson correlation coefficients exceeding 0.9.
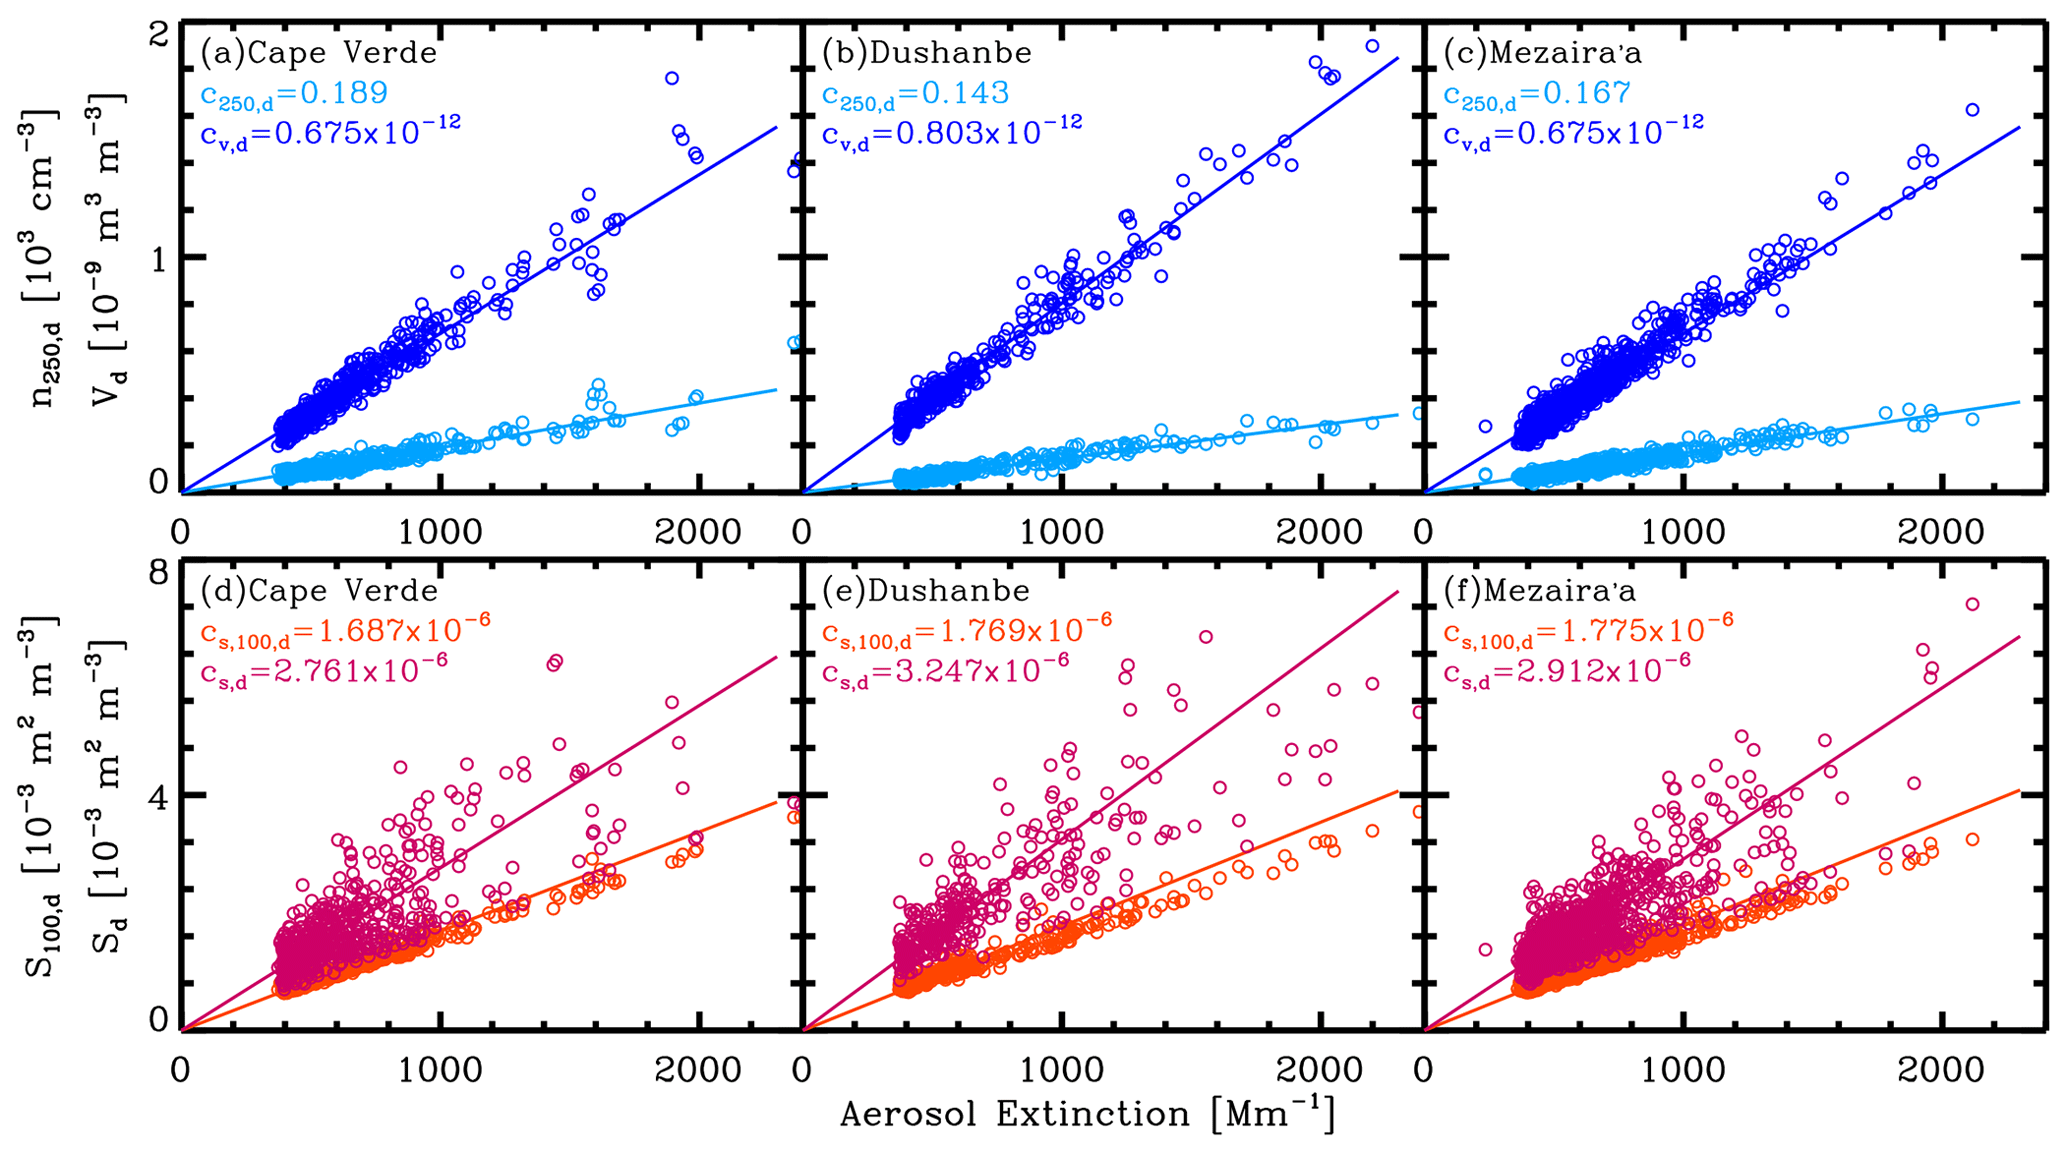
Figure 3Relationship between aerosol extinction coefficient at 532 nm and large particle (with a radius > 250 nm) number concentration n250,d and volume concentration vd and surface area concentration sd and s100,d (only considering particles with a radius > 100 nm) for pure dust at three typical sites, i.e., (a, d) for Cape Verde, (b, e) Dushanbe, and (c, f) Mezaira'a. The pure dust data points are selected from the AERONET V3 database (level-2.0 AOD products and level-2.0 aerosol inversions) using the threshold of particle linear depolarization ratio derived with the method given by Shin et al. (2019). The corresponding dust-related conversion factors cv,d, c250,d, cs,d, and are also given, respectively.
Table 3POLIPHON dust-related conversion factors cv,d (10−12 Mm), c250,d (Mm cm−3), cs,d (10−12 Mm m2 cm−3), and (10−12 Mm m2 cm−3) for DDM+PD and only PD, respectively. The respective standard deviations are also provided. The sites are classified into three regional clusters, including North Africa, the Middle East, and Asia.
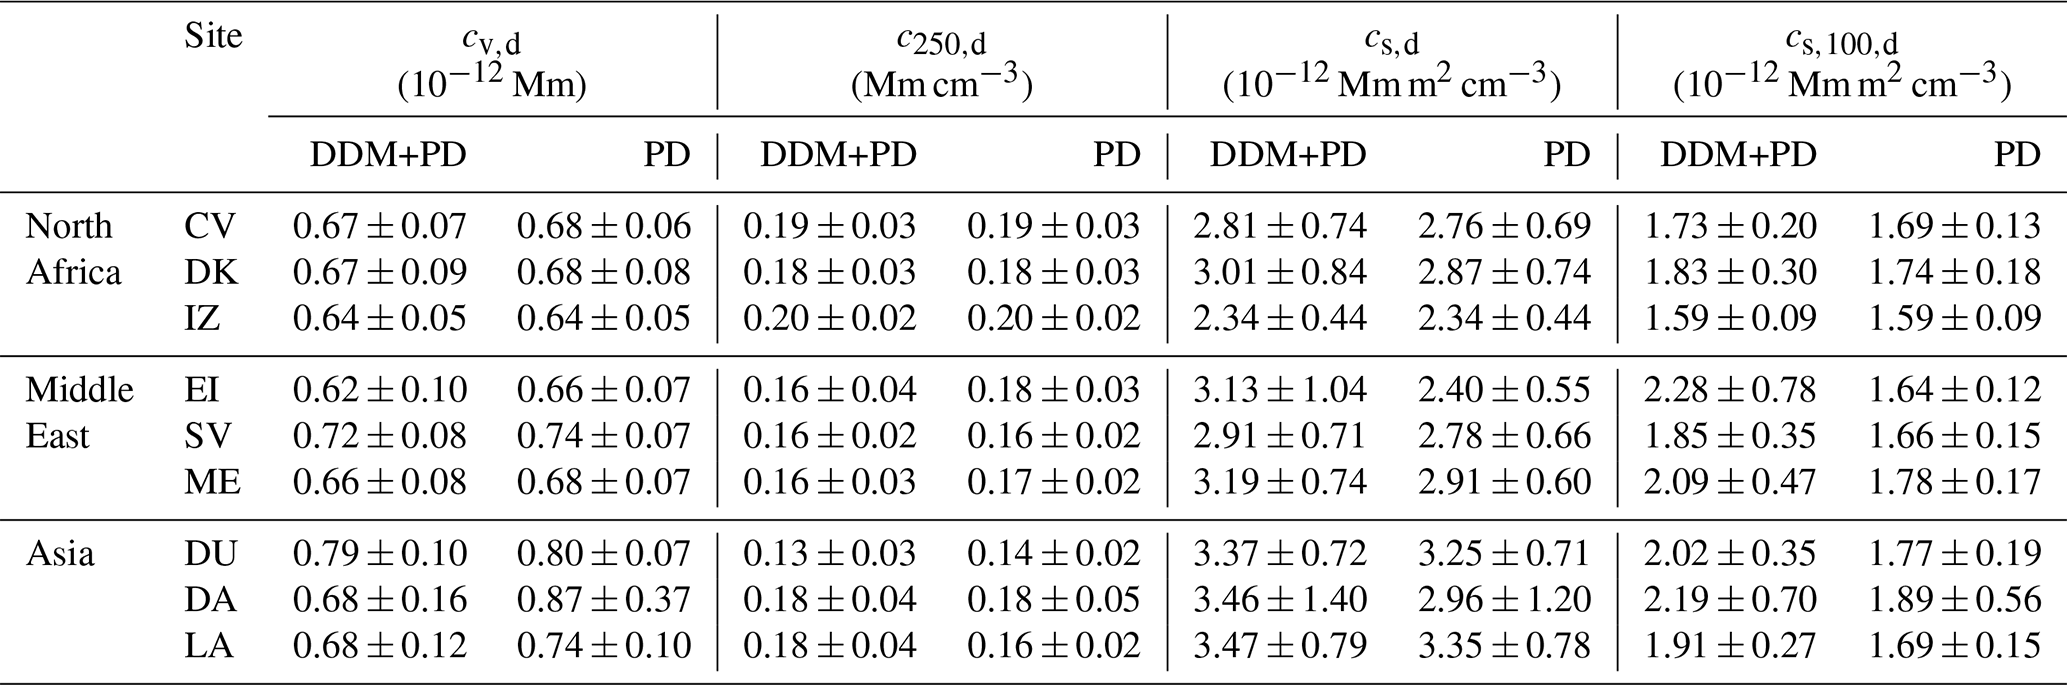
In addition to the three sites in Fig. 3, the conversion factors for the remaining six sites are shown in Table 3 as well. The results for both PD and PD+DDM clusters are provided here. Generally, regional differences in dust characteristics can be found in different dust sources. cv,d, c250,d, and cs,d calculated from the PD and PD+DDM datasets are almost consistent with each other, suggesting the absolute dominance of dust particles at these near-/in-desert sites. Interestingly, there are larger differences in cs,d and between the PD and DDM clusters at two Middle East sites, i.e., Eilat and Mezaira'a. After a careful check, it is noted that the DDM datasets have aerosol extinction coefficient values of 300–600 Mm−1 and show significantly larger sd and s100,d than those for PD datasets (see Fig. A1). The special pattern reflects the involvement of a specific type of local aerosol in the dust-dominated mixture. Moreover, the PD–DDM differences are even larger for at both sites, indicating that the additional involved aerosols may play a vital role in the particle size spectral of > 100 nm. According to further examination, this special pattern can generally be found at partial sites from the Middle East, Africa, and polluted European cities, which, however, are rarely present at sites from east Asia, Australia, South America, and North America. Thus, it should be noted that more care should be taken when employing DDM data to retrieve dust-related conversion factors at terrestrial sites in the Middle East, Africa, and polluted European cities in future work.
For comparison, we also plot the conversion factors in Fig. 4 together with those given by Ansmann et al. (2019b) (hereafter denoted as “A-19”). cv,d and c250,d calculated from three dust datasets (PD, DDM+PD, and A-19) coincide with each other very well. The relative differences between either A-19 and PD or A-19 and DDM+PD are generally as small as < 8.5 % for c250,d (except for 19.2 % at the DA site) and < 12.5 % for cv,d (except for 20.0 % at the DA site). Compared with A-19, cs,d values calculated from PD datasets generally show relative differences of < 16.5 % (except for 23.2 % at the CV site); in contrast, cs,d differences between DDM+PD datasets and A-19 are much larger (up to < 36.2 %). For , compared with the results from A-19, values calculated from PD datasets show relative differences as high as < 36.2 %, while values from PD+DDM datasets show relatively larger relative differences up to < 42.5 %. Using either the FMF (Lee et al., 2010) or Ångström exponent (Ansmann et al., 2019b) in the AERONET data as the dust criterion implies an assumption that dust is constrained to the coarse mode. However, the proportion between fine- and coarse-mode dust may be altered during transport due to the quicker removal of dust particles with larger sizes (Yu et al., 2021); hence, the dust criterion AE < 0.3 may exclude a portion of fine-mode dust-dominated (with a radius < 100 nm) cases, resulting in a general underestimation of cs,d. Furthermore, region-featured emissions of non-dust small particles are also possibly responsible for this discrepancy.
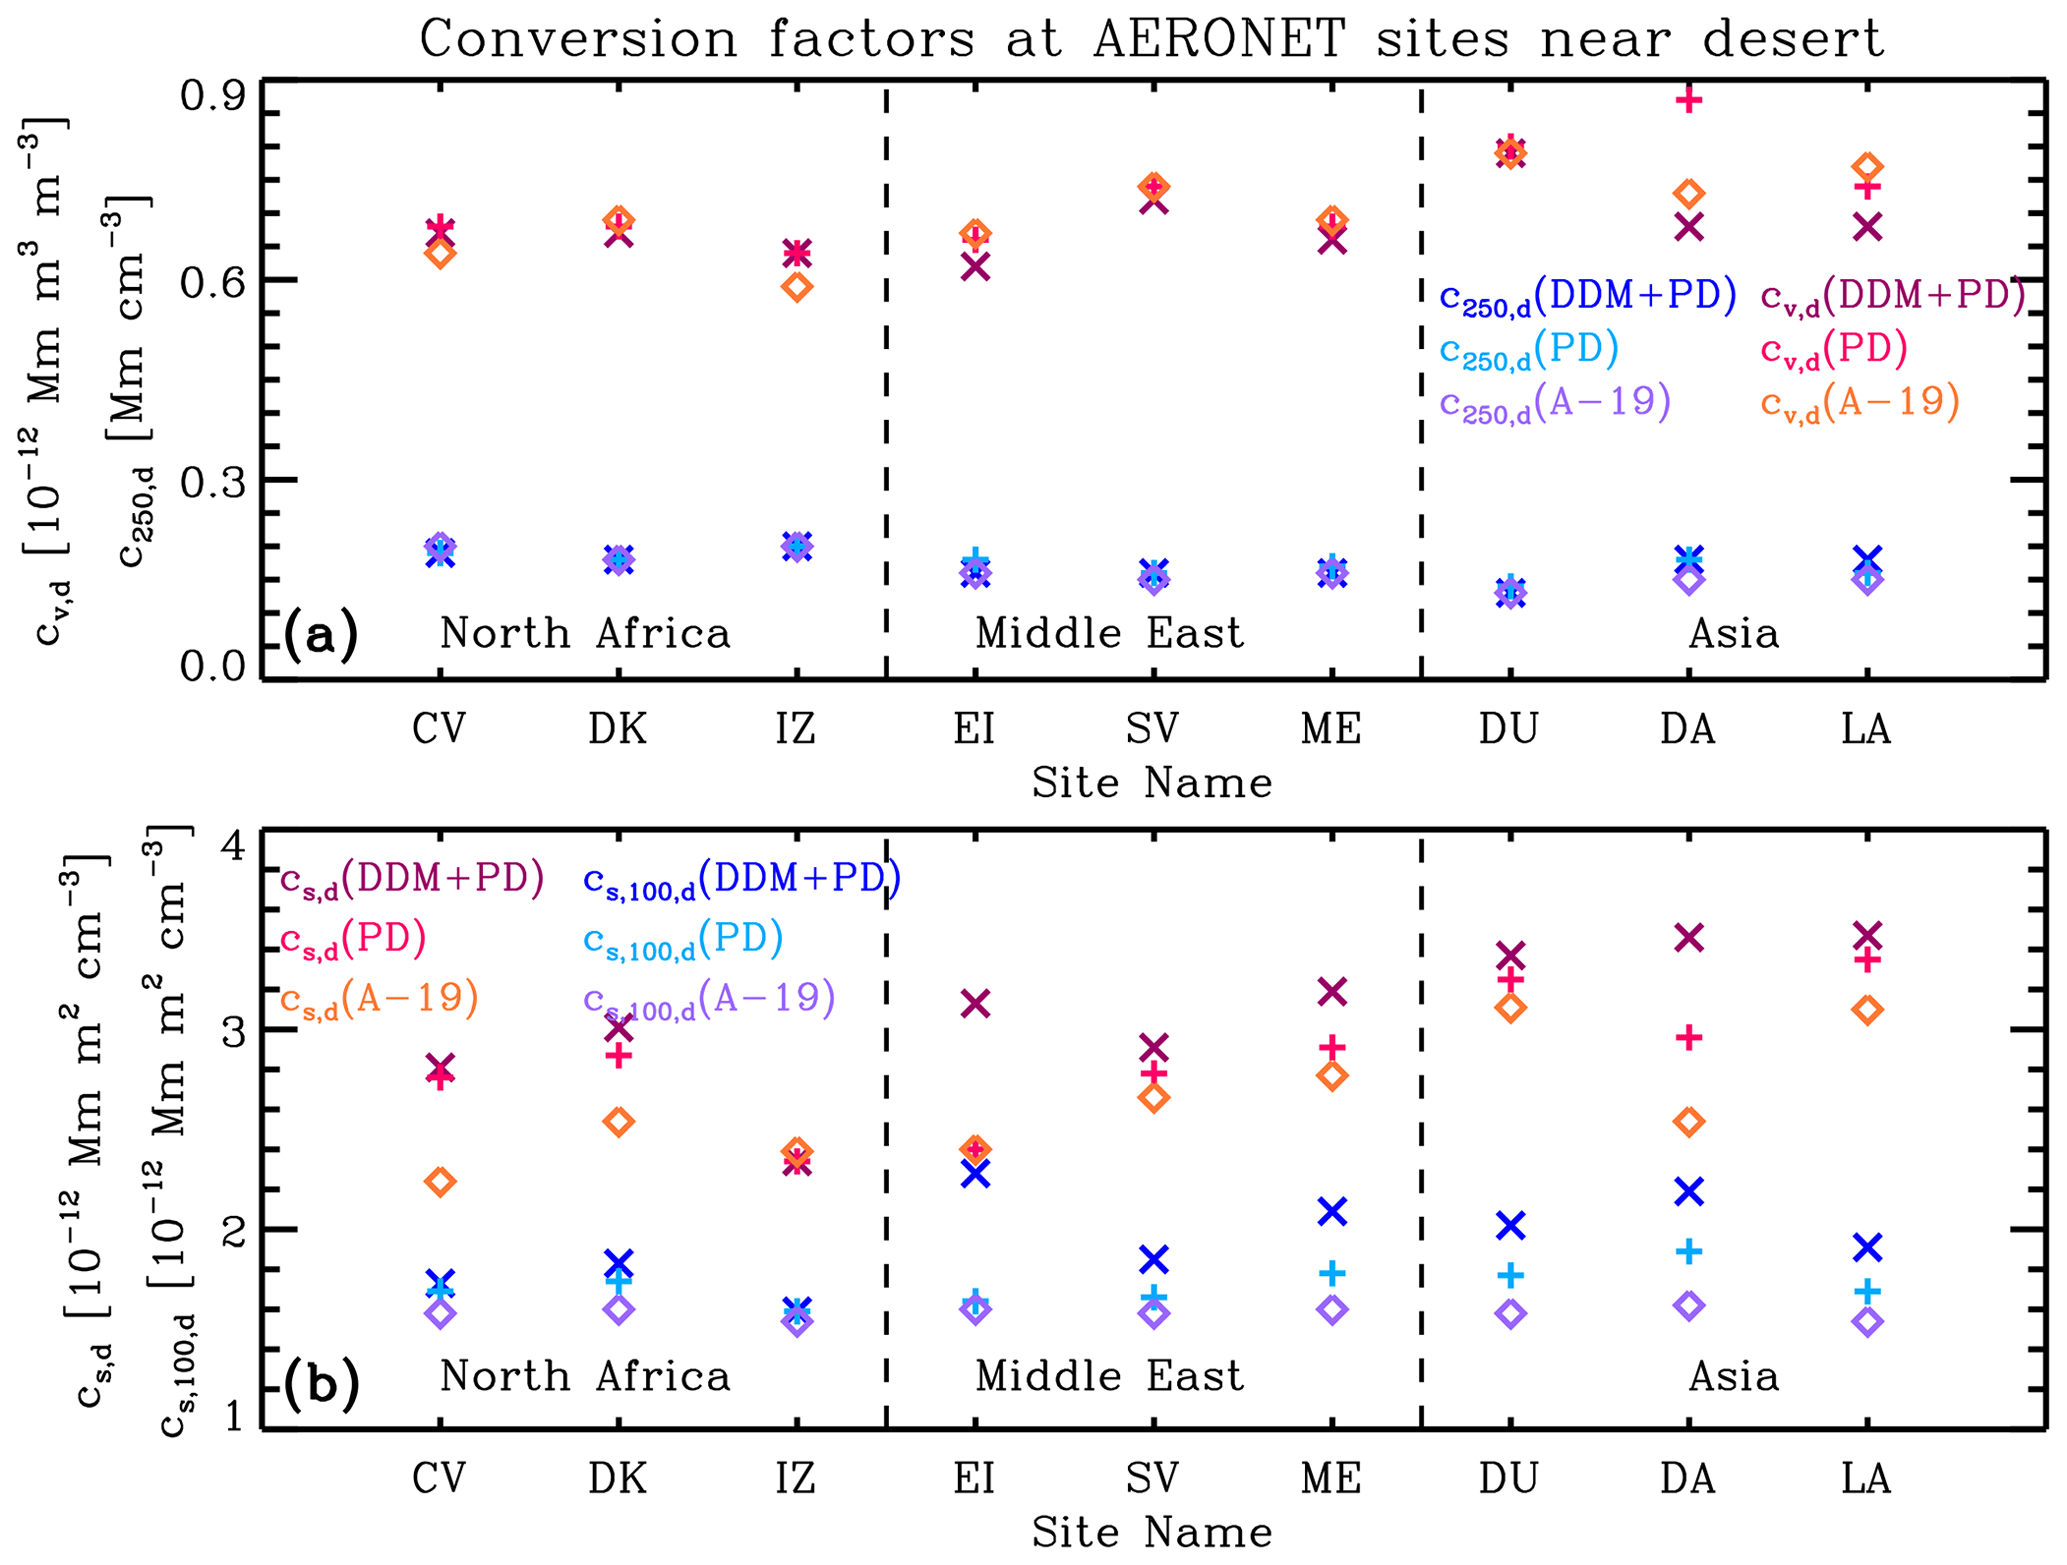
Figure 4Intercomparison of dust-related conversion factors at nine sites (as shown in Table 2) near the deserts; (a) cv,d and c250,d as well as (b) cs,d and are calculated with the dust (both PD+DDM and PD) data selection scheme (based on the particle linear depolarization ratio) in this study with those derived with the constraints of the Ångström exponent for the 440–870 nm wavelength range AE440–870 < 0.3 and aerosol optical depth at 532 nm AOD532 > 0.1 given by Ansmann et al. (2019b) (denoted as A-19).
3.2 Dust-related conversion factors cv,d, c250,d, cs,d, and at the ocean and coast sites
In this study, we chose 20 ocean and coast AERONET sites, which were classified into five region categories including the Pacific, Pacific coast (both east and west coasts), Atlantic, Indian Ocean, and Arctic Ocean (Huang et al., 2015; Zhao et al., 2022). Figure 5 shows the relationships between 532 nm aerosol extinction and n250,d, vd, sd, and s100,d for both the PD and PD+DDM cases at Mauna Loa (middle Pacific), Shirahama (west Pacific coast), Tudor Hill (west Atlantic), and Amsterdam Island (south Indian Ocean). The conversion factor values are also given accordingly. To eliminate abnormal values and retain the available dust data as much as possible, the data points with an aerosol extinction of > 20 Mm−1 are considered in the calculation. PD data points generally show a good linear correlation. For the PD+DDM cluster, three island sites show a similar good correlation except for Shirahama, which is due to the small contribution of marine aerosols to total column aerosol loading (usually with a global mean AOD of ∼ 0.05, Smirnov et al., 2009). At the Shirahama site, it is conjectured that anthropogenic aerosols considerably contribute to the column aerosol loading and lead to the spread of scatters, which reflect variations in the characteristics (size distribution, complex refractive index, and so on) of other aerosol components in the dust-dominated mixture.
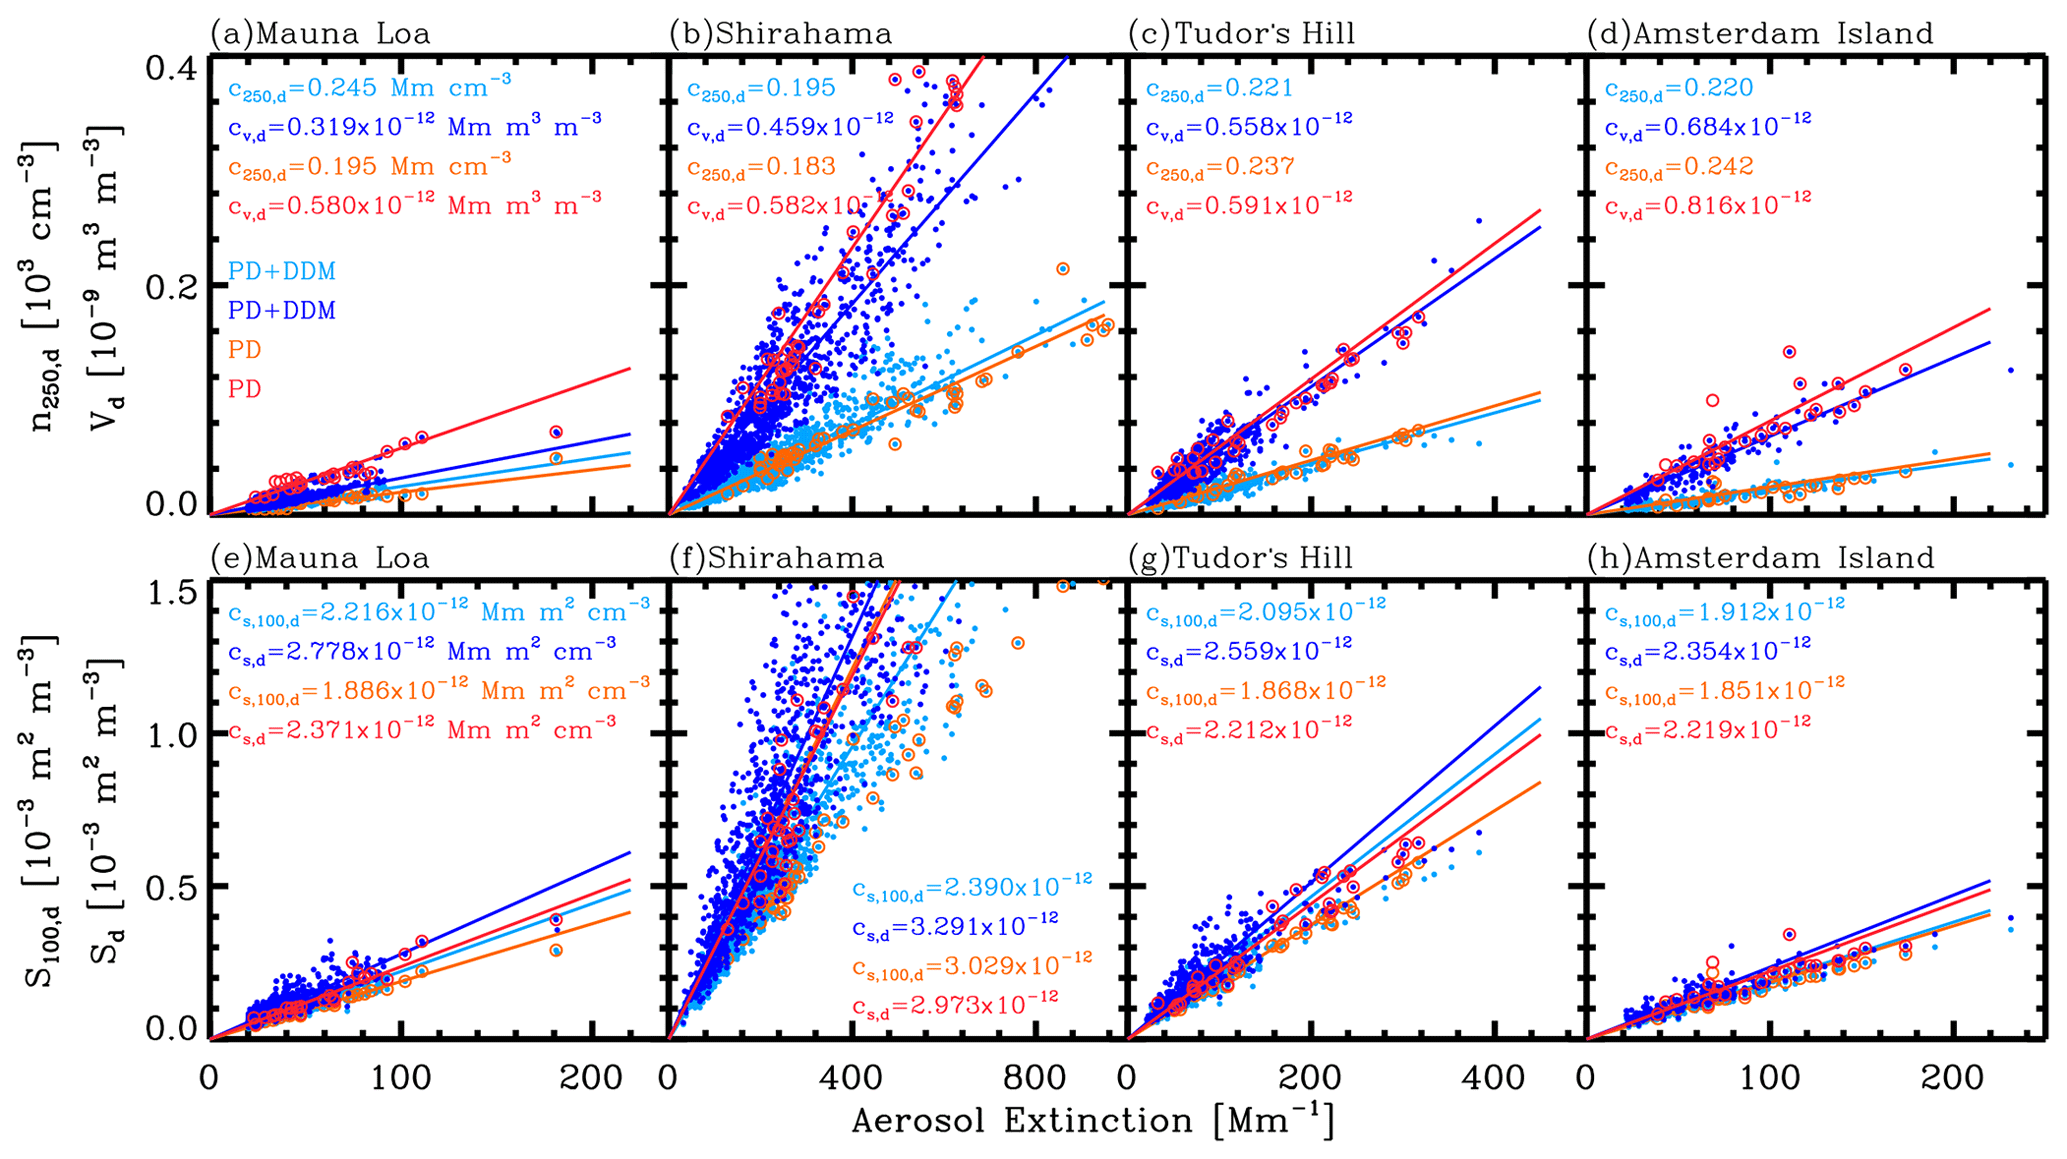
Figure 5Relationship between the aerosol extinction coefficient at 532 nm and large particle (radius > 250 nm) number concentration n250,d and volume concentration vd, as well as surface area concentration sd and s100,d (radius > 100 nm) for DDM+PD (in light blue and blue) and PD (in orange and red) at four typical ocean and coast sites, i.e., (a, d) for Mauna Loa, (b, f) Shirahama, (c, g) Tudor Hill, and (d, h) Amsterdam Island. The PD and DDM data points are selected from the AERONET Version 3 database (level-2.0 AOD products and level-1.5 aerosol inversion products) using the dust ratio threshold derived with the method given by Shin et al. (2019). The corresponding values of dust-related conversion factors cv,d, c250,d, cs,d, and are also given, respectively.
Table 4POLIPHON dust-related conversion factors cv,d (in 10−12 Mm), c250,d (in Mm cm−3), cs,d (in 10−12 Mm m2 cm−3), and (in 10−12 Mm m2 cm−3) for the dust-dominated mixture (DDM) plus pure dust (PD) and only PD based on the AERONET data analysis. The respective standard deviations are also provided. The sites are classified into five regional clusters, including the Pacific, Pacific coast, Atlantic, Indian Ocean, and Arctic Ocean.
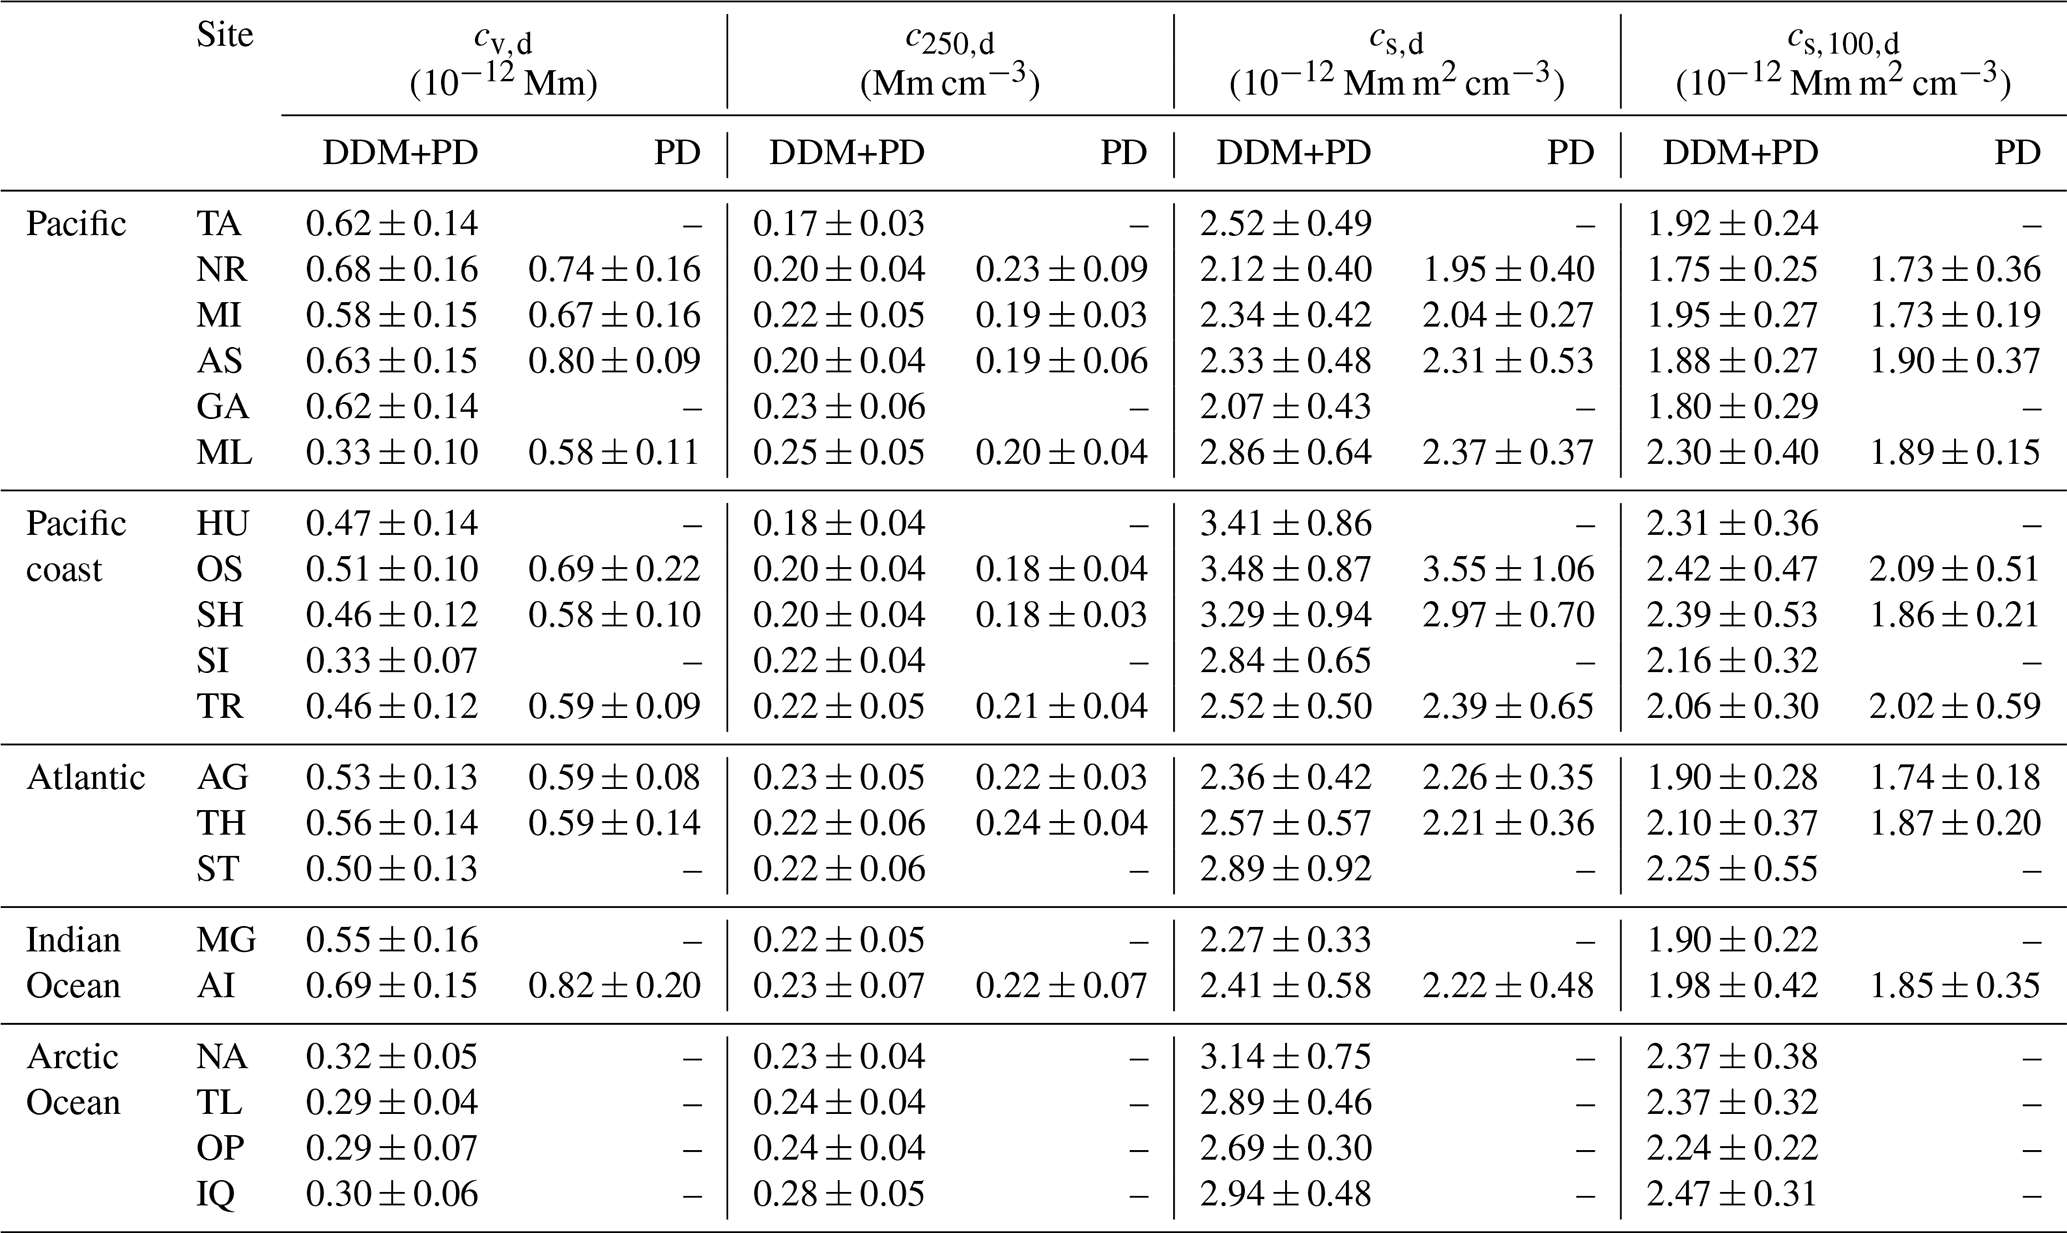
The conversion factors cv,d, c250,d, cs,d, and at the other oceanic and coastal sites are also provided in Table 4. The results for only the PD cluster and combined PD and DDM clusters are listed. We consider the conversion factors with ≥ 12 available PD data points valid (provided in Table 4). Moreover, to guarantee robustness, only the retrieved conversion factors with the linear Pearson correlation coefficient R exceeding 0.70 are considered valid, except for PD-derived c250,d values at NR (R = 0.32) and AS (R = 0.50), which should especially be handled with care in scientific applications. We also plot these dust-related conversion factors in Fig. 6 for comparison. According to the estimation in Sect. 3.1, it is suggested to preferentially use the PD datasets in the calculation to avoid the potential contribution of specific local aerosols, e.g., the special pattern in cs,d and at Eilat and Mezaira'a (see Sect. 3.1). Nevertheless, PD+DDM datasets may take part in the calculation as a suboptimal option if the sole use of PD datasets cannot guarantee the validity of conversion factors (10 out of 20 sites).
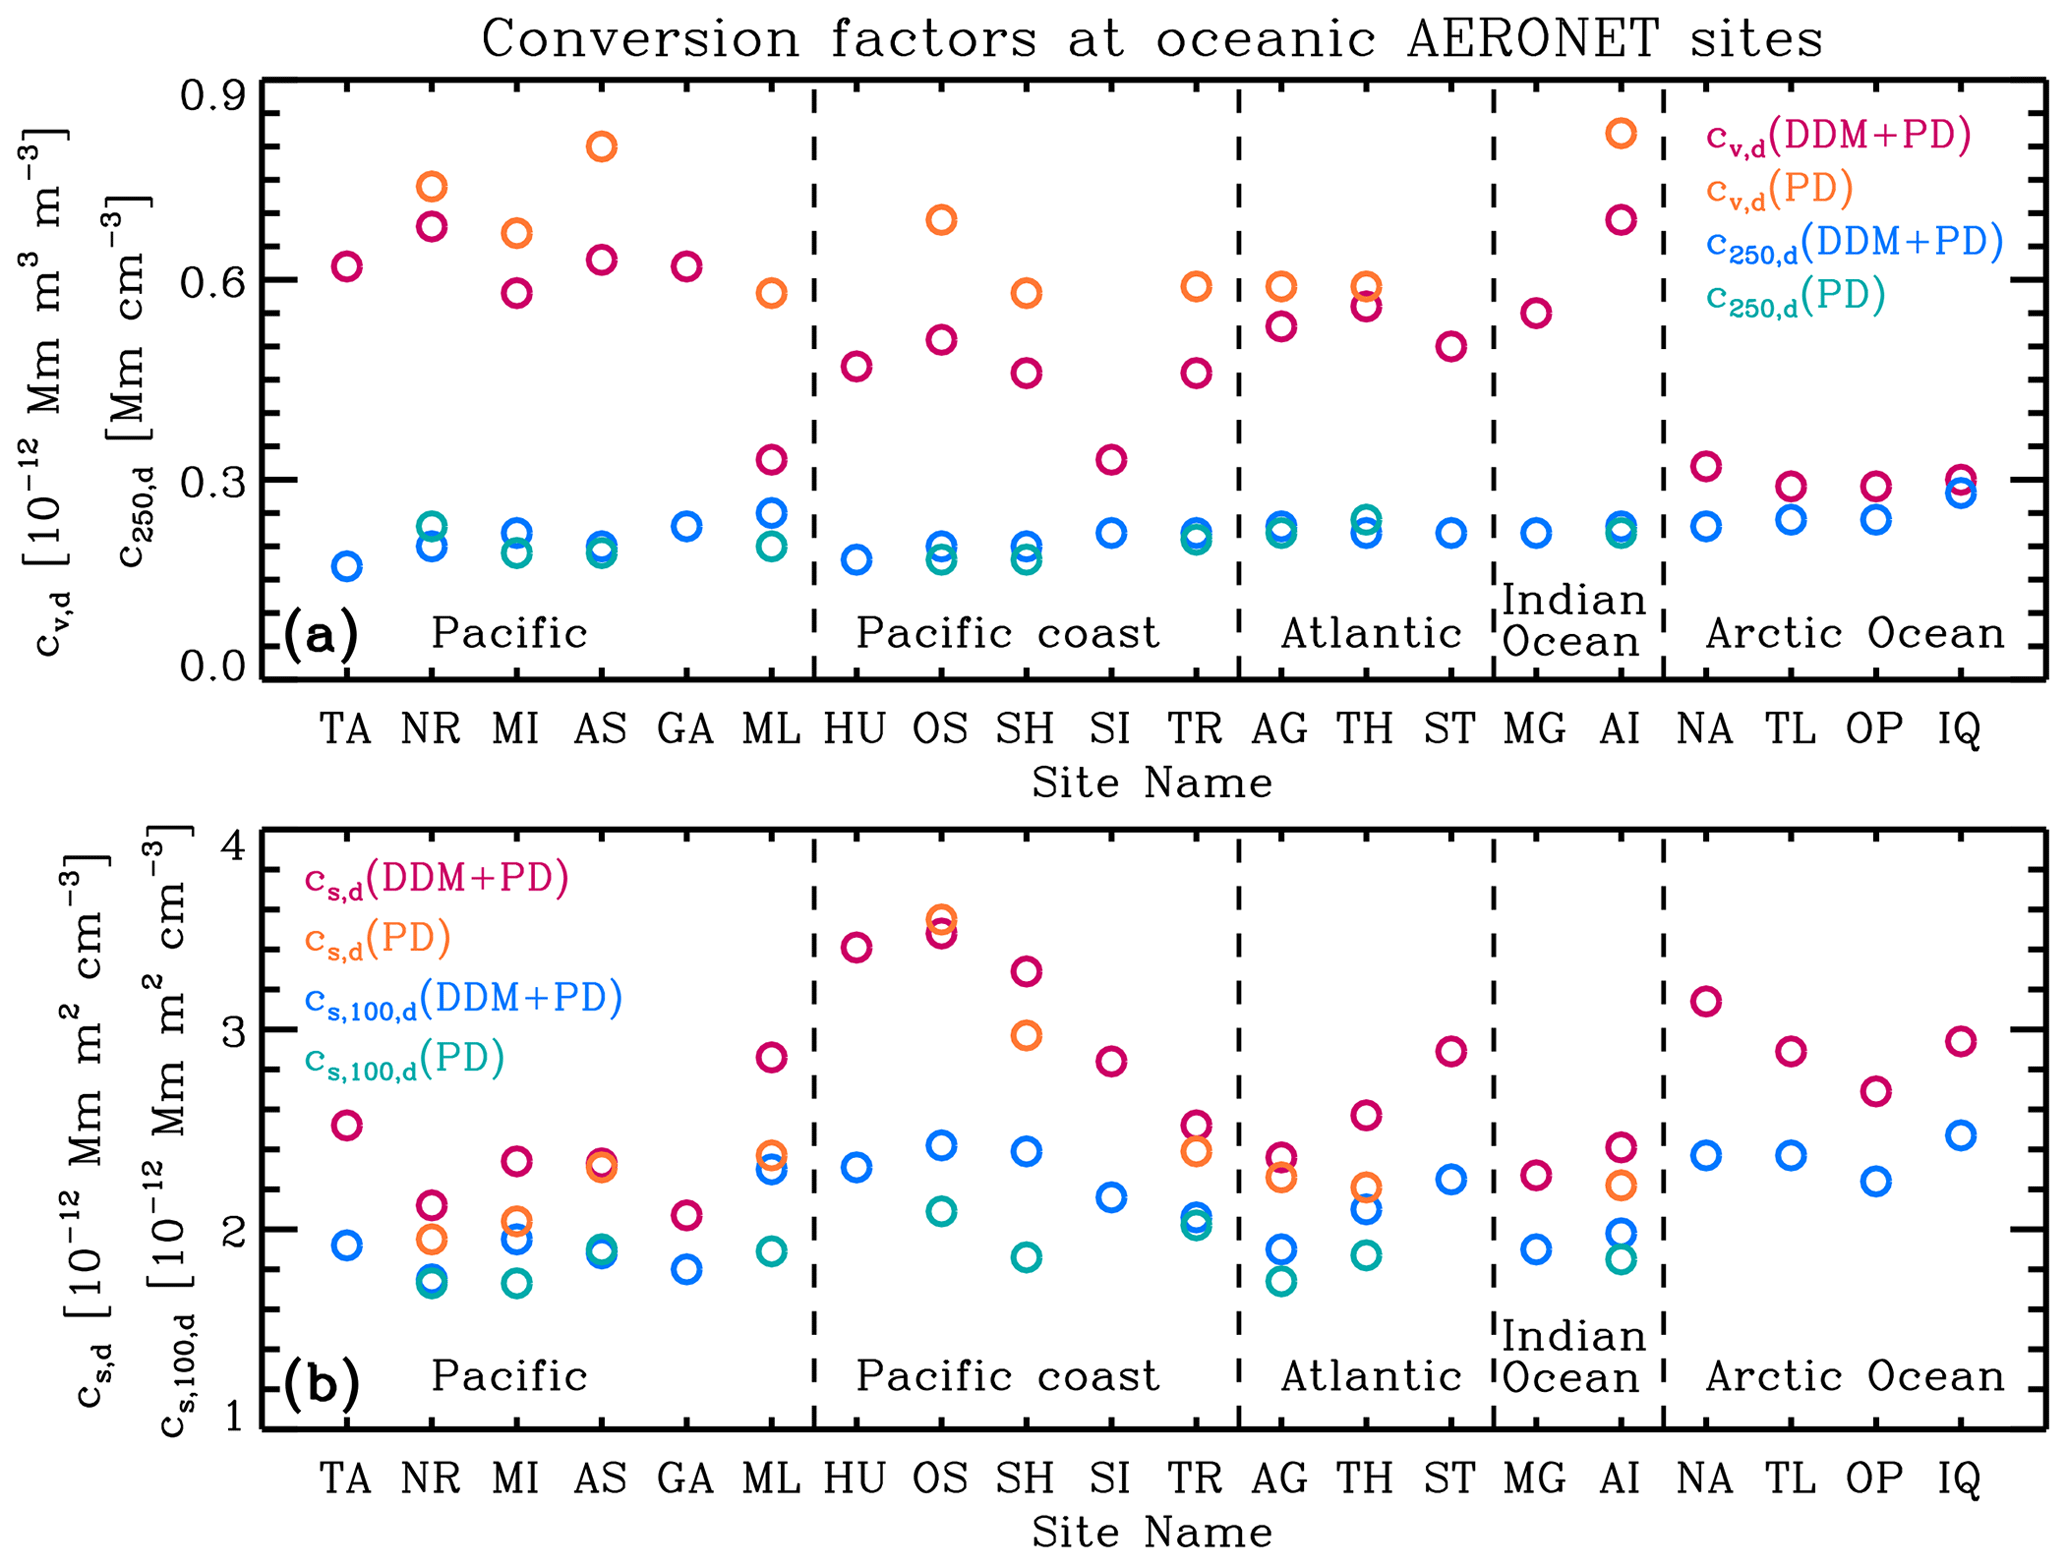
Figure 6Dust-related conversion factors at 20 oceanic and coastal sites. (a) cv,d and c250,d, as well as (b) cs,d and , calculated by considering PD and DDM+PD datasets, respectively.
As seen in Fig. 6, c250,d mainly ranges from 0.17 to 0.28 Mm cm−3; the c250,d values calculated from the PD and PD+DDM datasets agree with each other very well, except for the Midway Island and Nauru sites, indicating that few non-dust aerosols contribute to the particle size spectra of > 250 nm and that c250,d is a relatively stable factor from region to region. For cs,d and , their values from the DDM+PD datasets mainly have a systematically positive deviation (< 25 %) compared with those from the PD datasets, which may be affected by marine aerosols. In addition, cs,d and values at coastal sites (especially at Shirahama, Osaka, and Hokkaido University) are considerably larger than those at remote ocean sites, revealing their higher sensitivity (compared with c250,d) to the involvement of other aerosols. However, large differences in cv,d values are found not only between the PD and PD+DDM datasets but also from region to region. He et al. (2021b) also reported that mixed dust in Wuhan has a smaller cv,d than pure dust near the source region of Asian dust. Another interesting finding for cv,d is that the values in the Arctic are only half of those in other regions. PD data points are rarely identified in the Arctic, and conversion factors are all calculated from the DDM datasets here; abundant other aerosol types in the Arctic, e.g., smoke, anthropogenic aerosol, and marine aerosol (Engelmann et al., 2021; Zhao et al., 2022), may account for the low cv,d values. Nevertheless, cv,d can be beneficial to the validation of the mass extinction efficiency, a variable combining cv,d and dust density, in the 3-D global dust model (Adebiyi et al., 2020; Kok et al., 2021b; Wang et al., 2021, 2022).
The region-to-region variations in the conversion factors (i.e., cv,d, cs,d, and ) can be clearly found, as shown in Fig. 6. Although it is difficult to quantitatively study the reasons behind this region-dependent feature, one can first attribute this to the diverse contributions from different dust sources. Excluding some occasional extreme events (Uno et al., 2009), a given oceanic region is generally influenced by specific dust sources via typical dust transport pathways. In the middle- and low-latitude Atlantic, the primary dust transport pathway is from the Saharan desert in North Africa to the eastern coastal regions of North America (Rittmeister et al., 2017; Yu et al., 2021). In the North Atlantic, Baddock et al. (2017) reported that dust aerosols are mainly from Iceland. Dust aerosols in the Arctic are more complicated, coming from high-latitude dust sources in the Northern Hemisphere (e.g., Alaska, Canada, northern Europe, and Russia) (Bullard et al., 2016; Meinander et al., 2022), local Arctic sources (Shi et al., 2022), Asia (Zhao et al., 2022), and North Africa (Shi et al., 2022). For the Pacific, dust aerosols mainly originate from the central and east Asian dust sources and transport to North America (Guo et al., 2017; Hu et al., 2019). At the remaining oceanic sites in the Southern Hemisphere, dust aerosols can be related to Australia, New Zealand, Patagonia, and southern Africa (Bullard et al., 2016; Struve et al., 2020; Kok et al., 2021a; Meinander et al., 2022). In addition, at the downstream areas, the possible aging and mixing of dust with other aerosol types during long-range transport may also be responsible for the region-to-region variations in conversion factors (Kim and Park, 2012; Goel et al., 2020).
3.3 Dust-related conversion factors c100,d and χd at the ocean and coast sites
In addition to the INP-relevant conversion factors, the relationship between 532 nm aerosol extinction and CCN-relevant parameters n100,d is also studied in this section. The analysis is based on the relationship between log (n100,d) and log (αd) as reported by Shinozuka et al. (2015). Figure 7 shows the relationship between the aerosol extinction coefficient at 532 nm and particle number concentration (radius > 100 nm) n100,d at nine oceanic and coastal sites. The data points representing PD (in blue) and DDM+PD (in orange) are both plotted. Ansmann et al. (2019b) found that log (n100,d) and log (αd) are strongly correlated when taking data points with αd in the range of 100–600 Mm−1 into consideration, while the correlation strength significantly decreases and the data points tend to be dispersive once αd values exceed 600 Mm−1. The AERONET sites selected here generally show a clear atmospheric environment with limited pollution aerosols and can generally fulfill the constraint of αd<600 Mm−1, except for these coast sites, e.g., Shirahama and Osaka. To retain sufficient data points, we adopted data points with αd values ranging from 20 to 600 Mm−1 in our calculation.
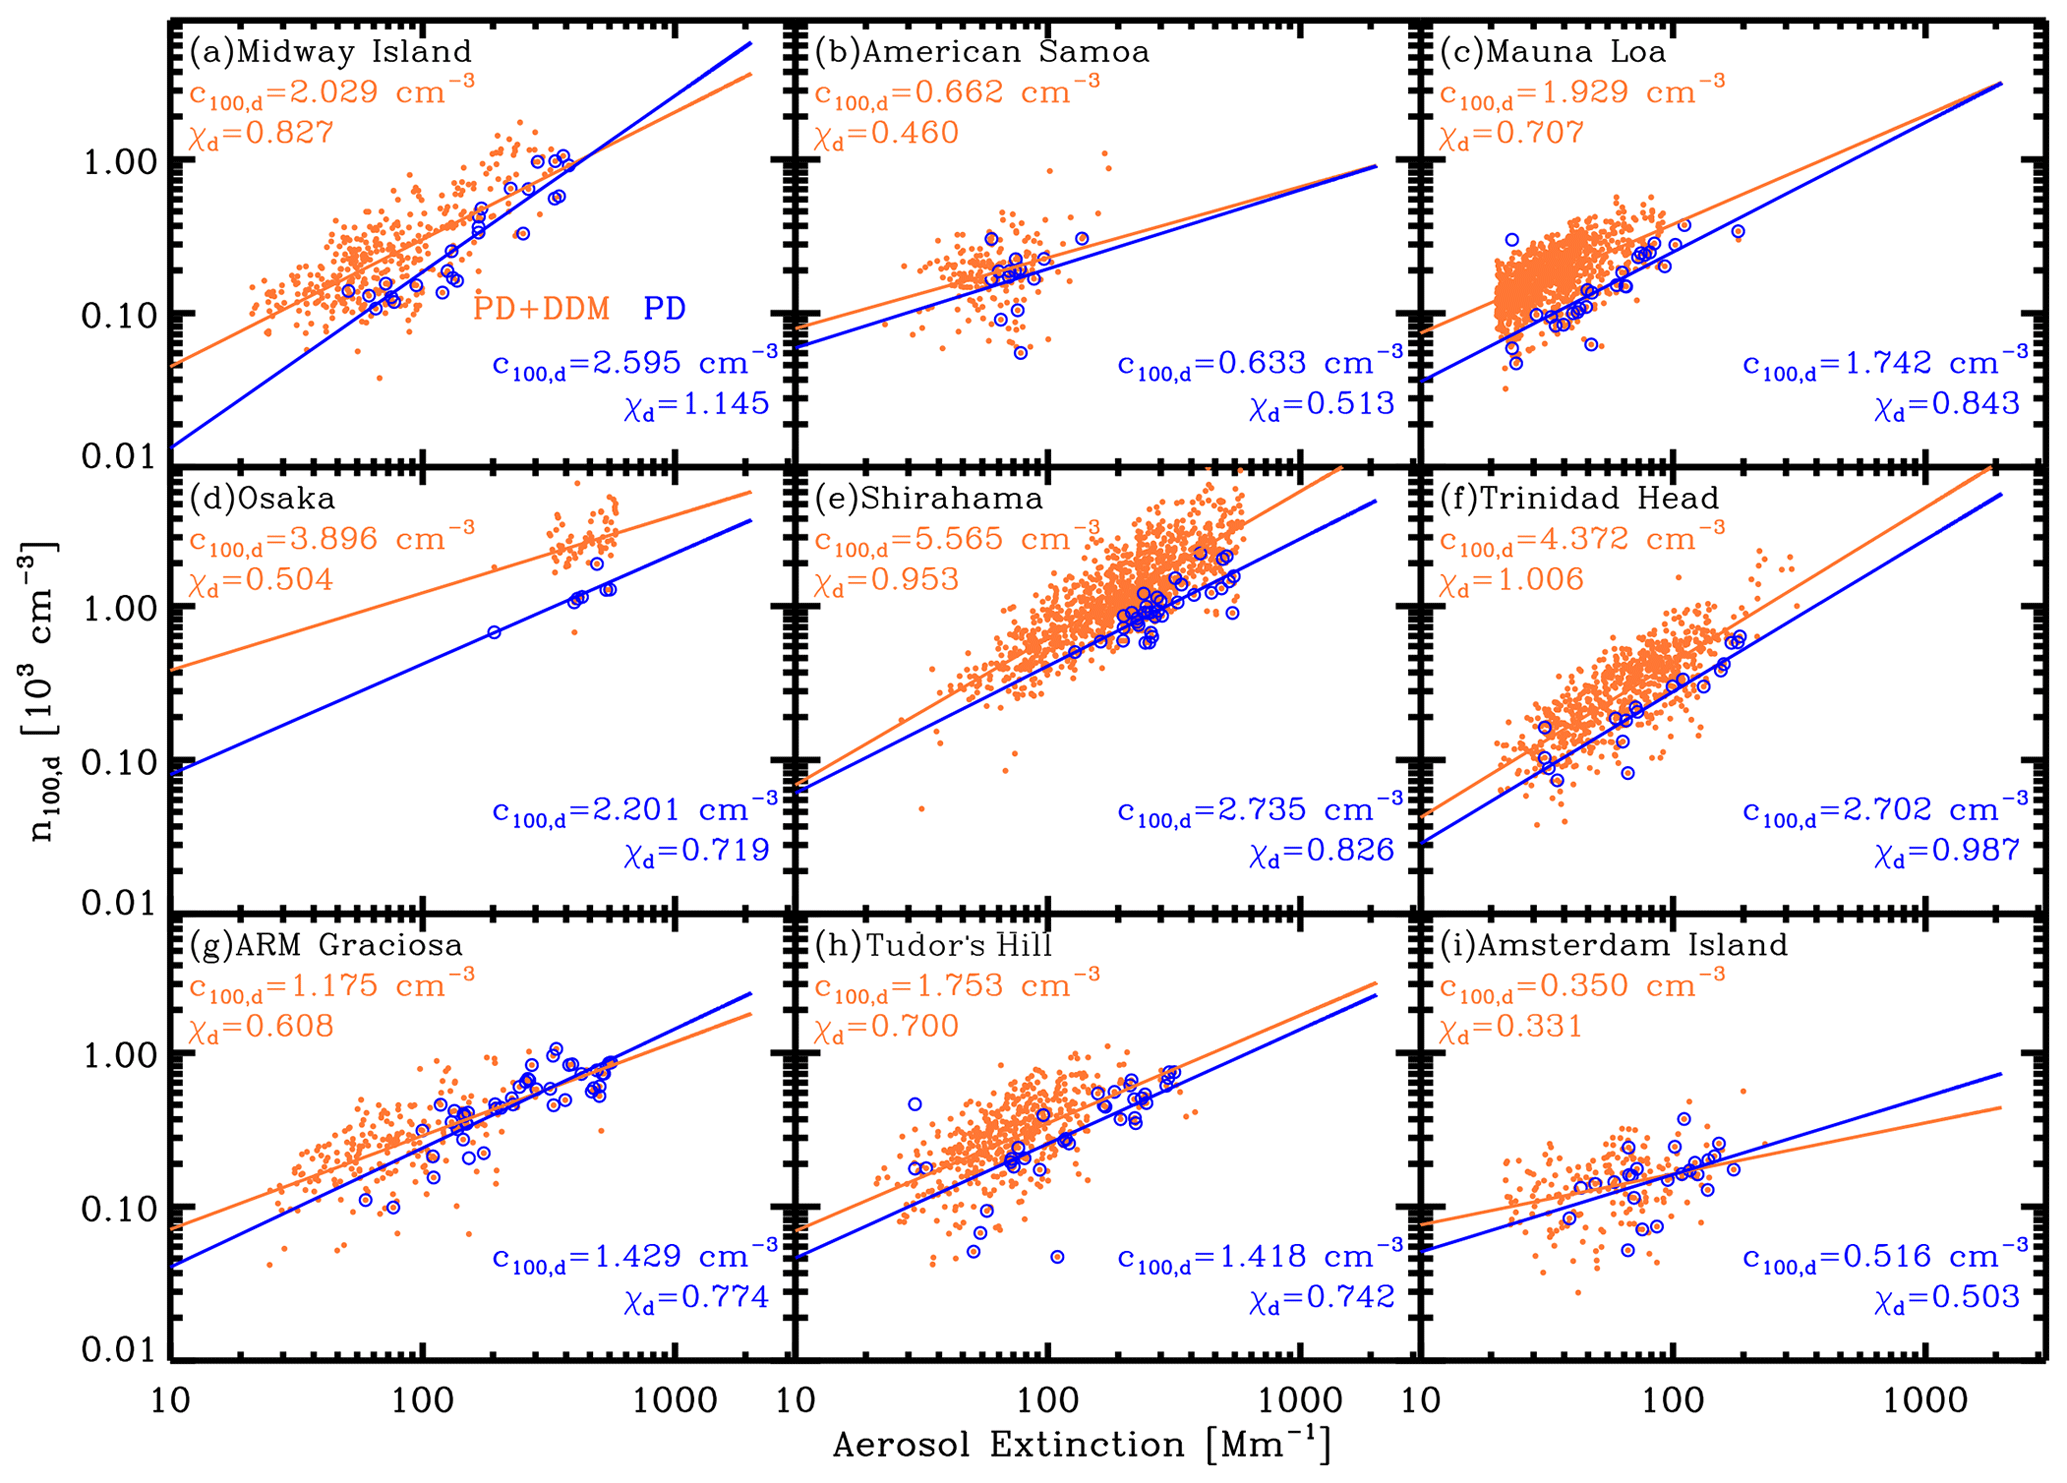
Figure 7Relationship between aerosol extinction coefficient at 532 nm and aerosol particle number concentration n100,d (radius > 100 nm) for DDM+PD (in orange) and PD (in blue) at nine ocean and coast sites, i.e., (a) Midway Island, (b) American Samoa, (c) Mauna Loa, (d) Osaka, (e) Shirahama, (f) Trinidad Head, (g) ARM Graciosa, (h) Tudor Hill, and (i) Amsterdam Island. The PD and DDM data points are selected from the AERONET Version 3 database (level-2.0 AOD products and level-1.5 aerosol inversion products) using the dust ratio threshold derived with the method given by Shin et al. (2019). The corresponding dust-related conversion factors c100,d and χd are also provided.
Table 5POLIPHON dust-related conversion factors c100,d (in cm−3 for αd = 1 Mm−1) and χd for the dust-dominated mixture (DDM) plus pure dust (PD) and only PD based on the AERONET data analysis. The sites are classified into five clusters, including the Pacific, Pacific coast, Atlantic, Indian Ocean, and Arctic Ocean.
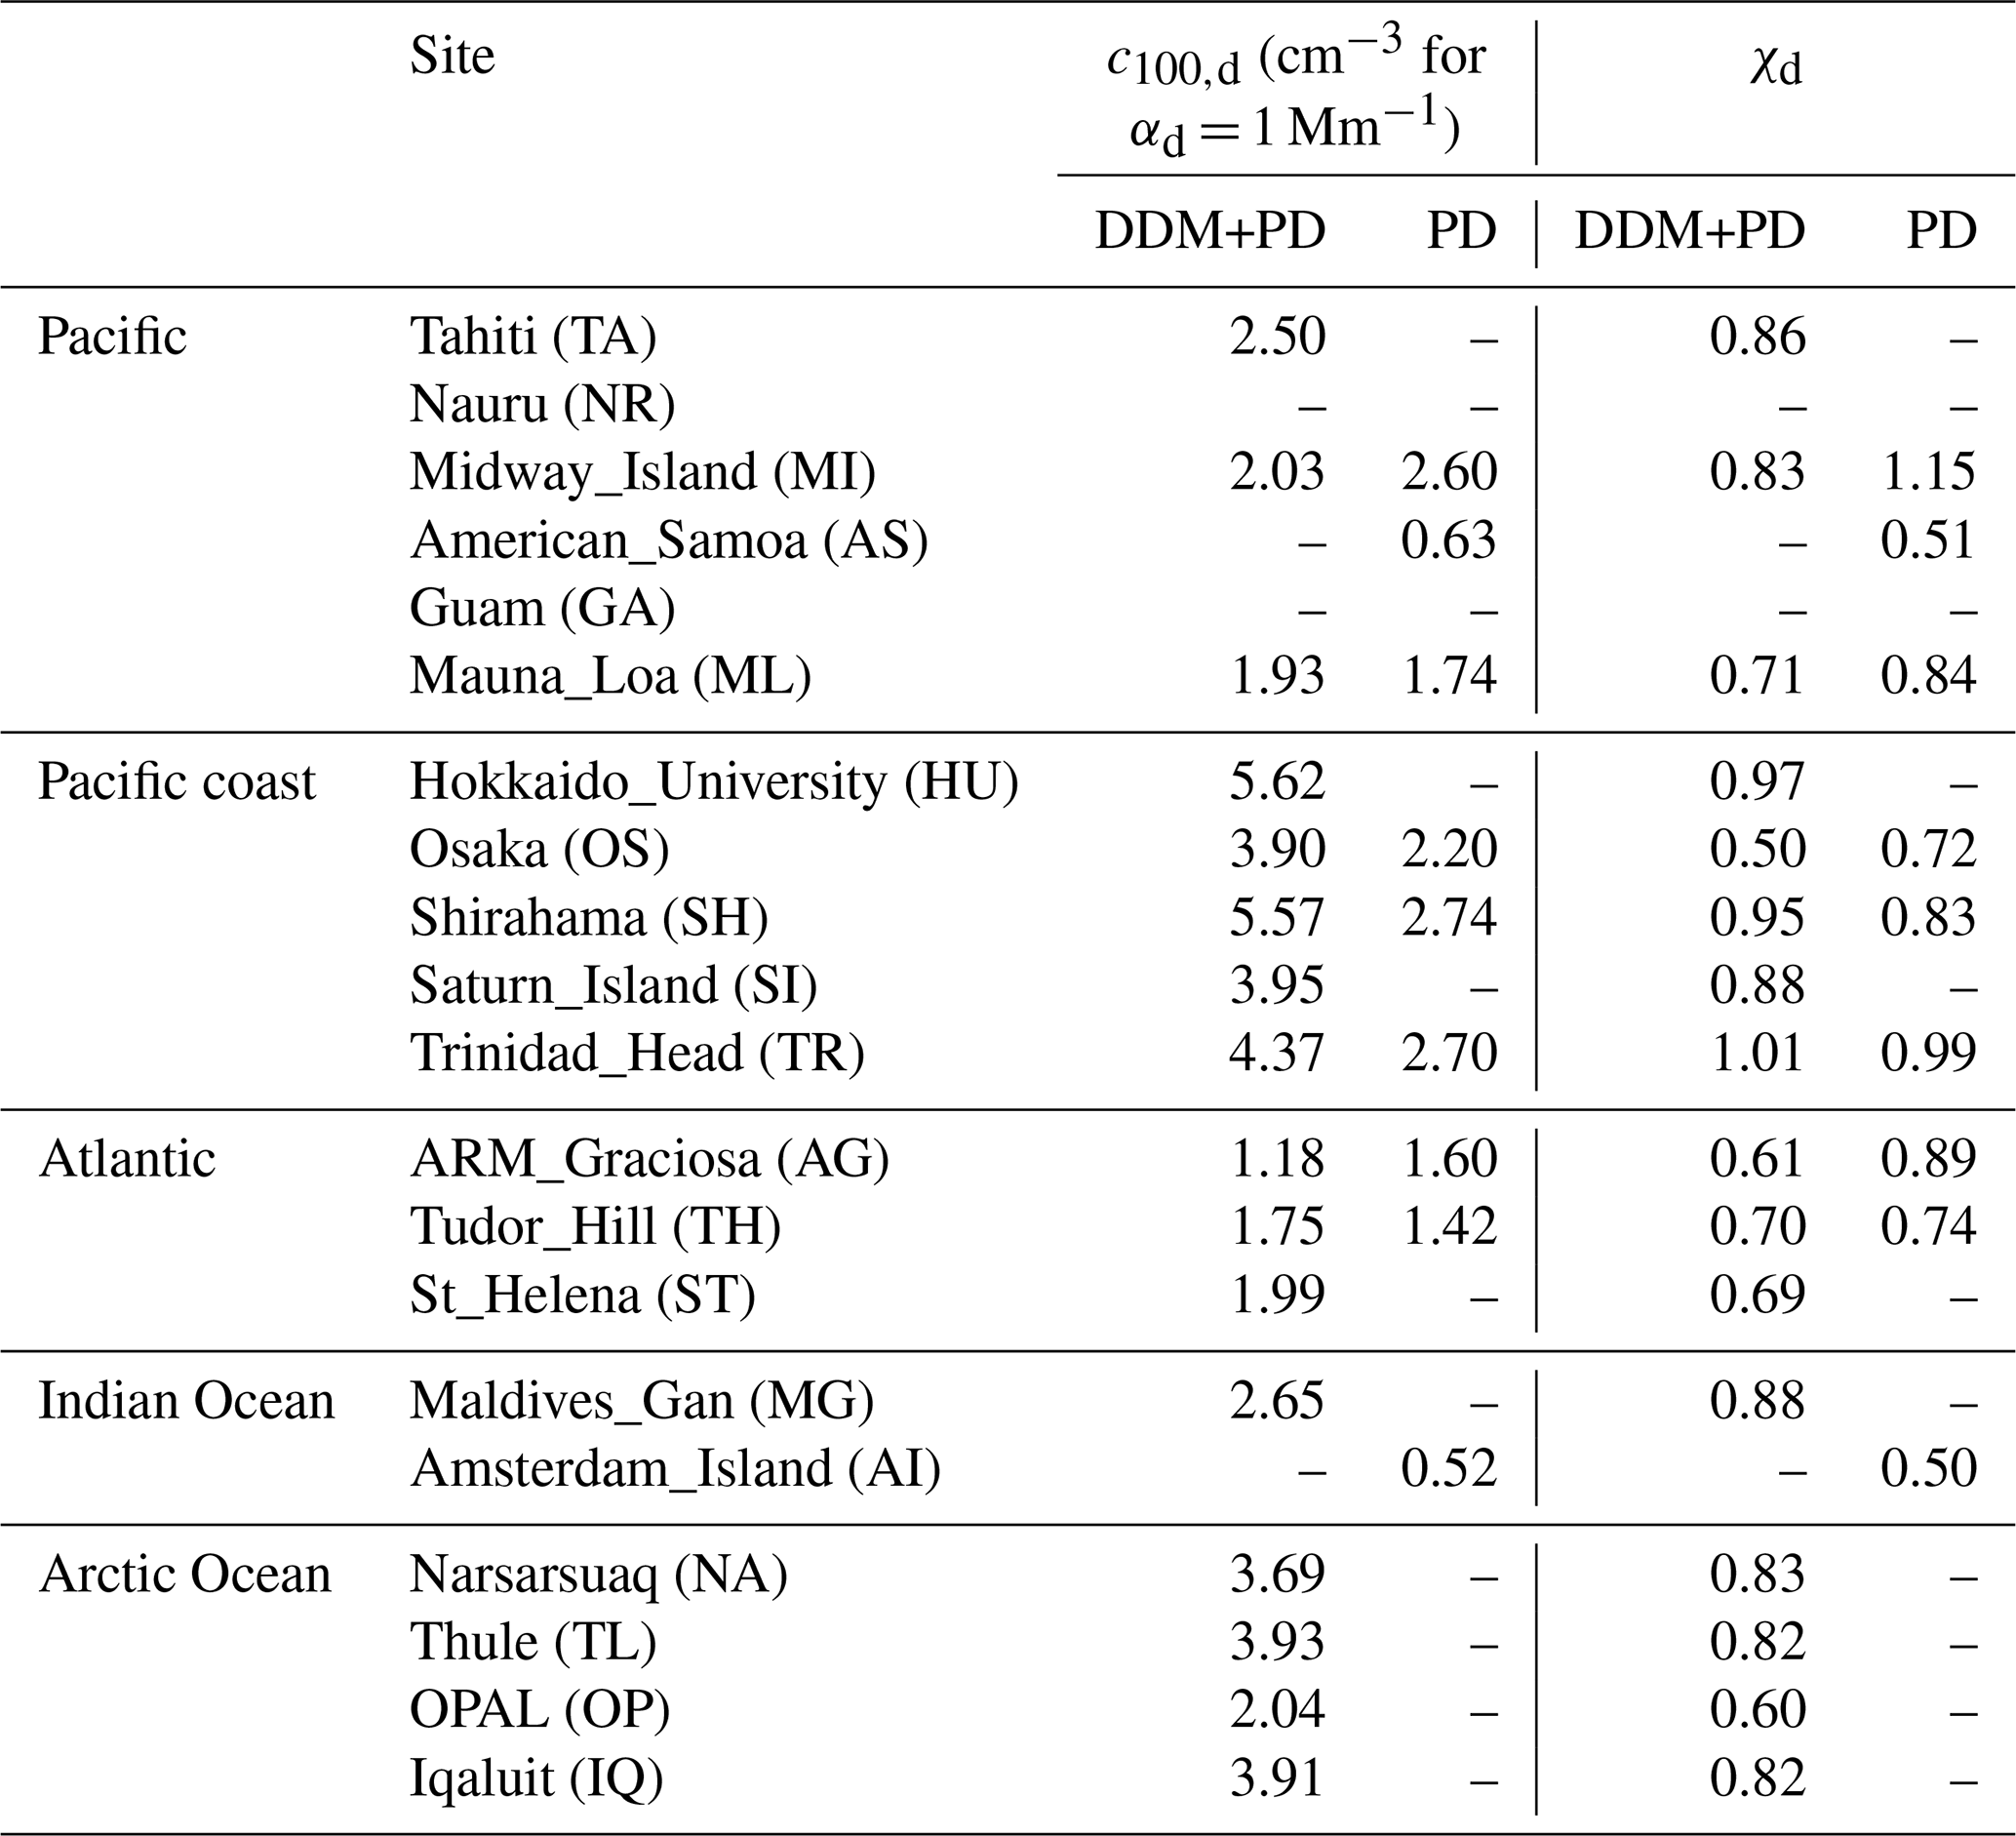
Table 5 lists the values of c100,d and χd for both the PD and DDM+PD datasets. Considering the regression coefficient χd>0.50 as valid analysis, attention should be given when using the results at the coast sites Osaka, American Samoa, and Amsterdam Island. The PD and DDM+PD datasets generally show a similar slope (corresponding to χd) in regression analysis, except for the Osaka site, for which an evident intersection between two fitted lines appears, attributed to the sparse PD data points available for fitting. Moreover, it should be mentioned that using the newly proposed dust dataset selection scheme to retrieve the CCN-relevant conversion factors seems not to be robust on the continent. Thus, more care should be taken when retrieving c100,d and χd for those polluted city regions in future work.
3.4 Variations in conversion factors along dust transport paths
The dust-related conversion factors may significantly vary along the way of dust transport due to the potential modifications of dust microphysical properties caused by particle sedimentation, aging processes, external mixing with other aerosols, and so on. There are two main transoceanic paths of dust transport, i.e., the transatlantic path from the Saharan desert to America (Rittmeister et al., 2017; Yu et al., 2021; Dai et al., 2022) and the transpacific path from Asian dust sources (Taklimakan and Gobi deserts) to America (Guo et al., 2017; Hu et al., 2019). Here we selected several sites along these two paths to evaluate the variations in conversion factors. For the transpacific transport, six sites from Asian dust sources to America were selected, including Dushanbe, SACOL in Lanzhou, Shirahama, Midway Island, Mauna Loa, and Trinidad Head. For the transatlantic transport, four sites from North Africa to America were selected, including Dakar, Cape Verde, ARM Graciosa, and Tudor Hill.
Figure 8 shows the conversion factors cv,d, c250,d, cs,d, and at the selected sites along the two dust transport paths. These conversion factors are calculated from the PD+DDM cluster. It is noted that the microphysical properties of dust particles originating from the Saharan desert and Asian dust sources are very different. Moreover, with the increase in transport distances, an evident variation tendency is observed for all the conversion factors at both transoceanic paths. cv,d values show a significant decline along with transport, indicating that the proportion of dust particles in the atmospheric column tends to be smaller due to sedimentation. He et al. (2021b) also observed a relatively smaller cv,d of 0.52 × 10⁻¹² Mm m3 m−3 in the downstream area in central China compared with the value obtained near the sources of Asian dust. c250,d values show a gradual increase trend along with transport, suggesting the increased contribution of large-sized sea spray aerosols in the atmospheric column. For cs,d, a general decline is observed between the values before and after transoceanic transport. A plunge of cs,d is prominent for the transpacific path. In contrast, values only show an apparent enhancement for the transatlantic path, while the variation trend for the transpacific path is generally inapparent. This suggests that particles with radii < 100 nm should be responsible for the decrease in cs,d after transoceanic transport.
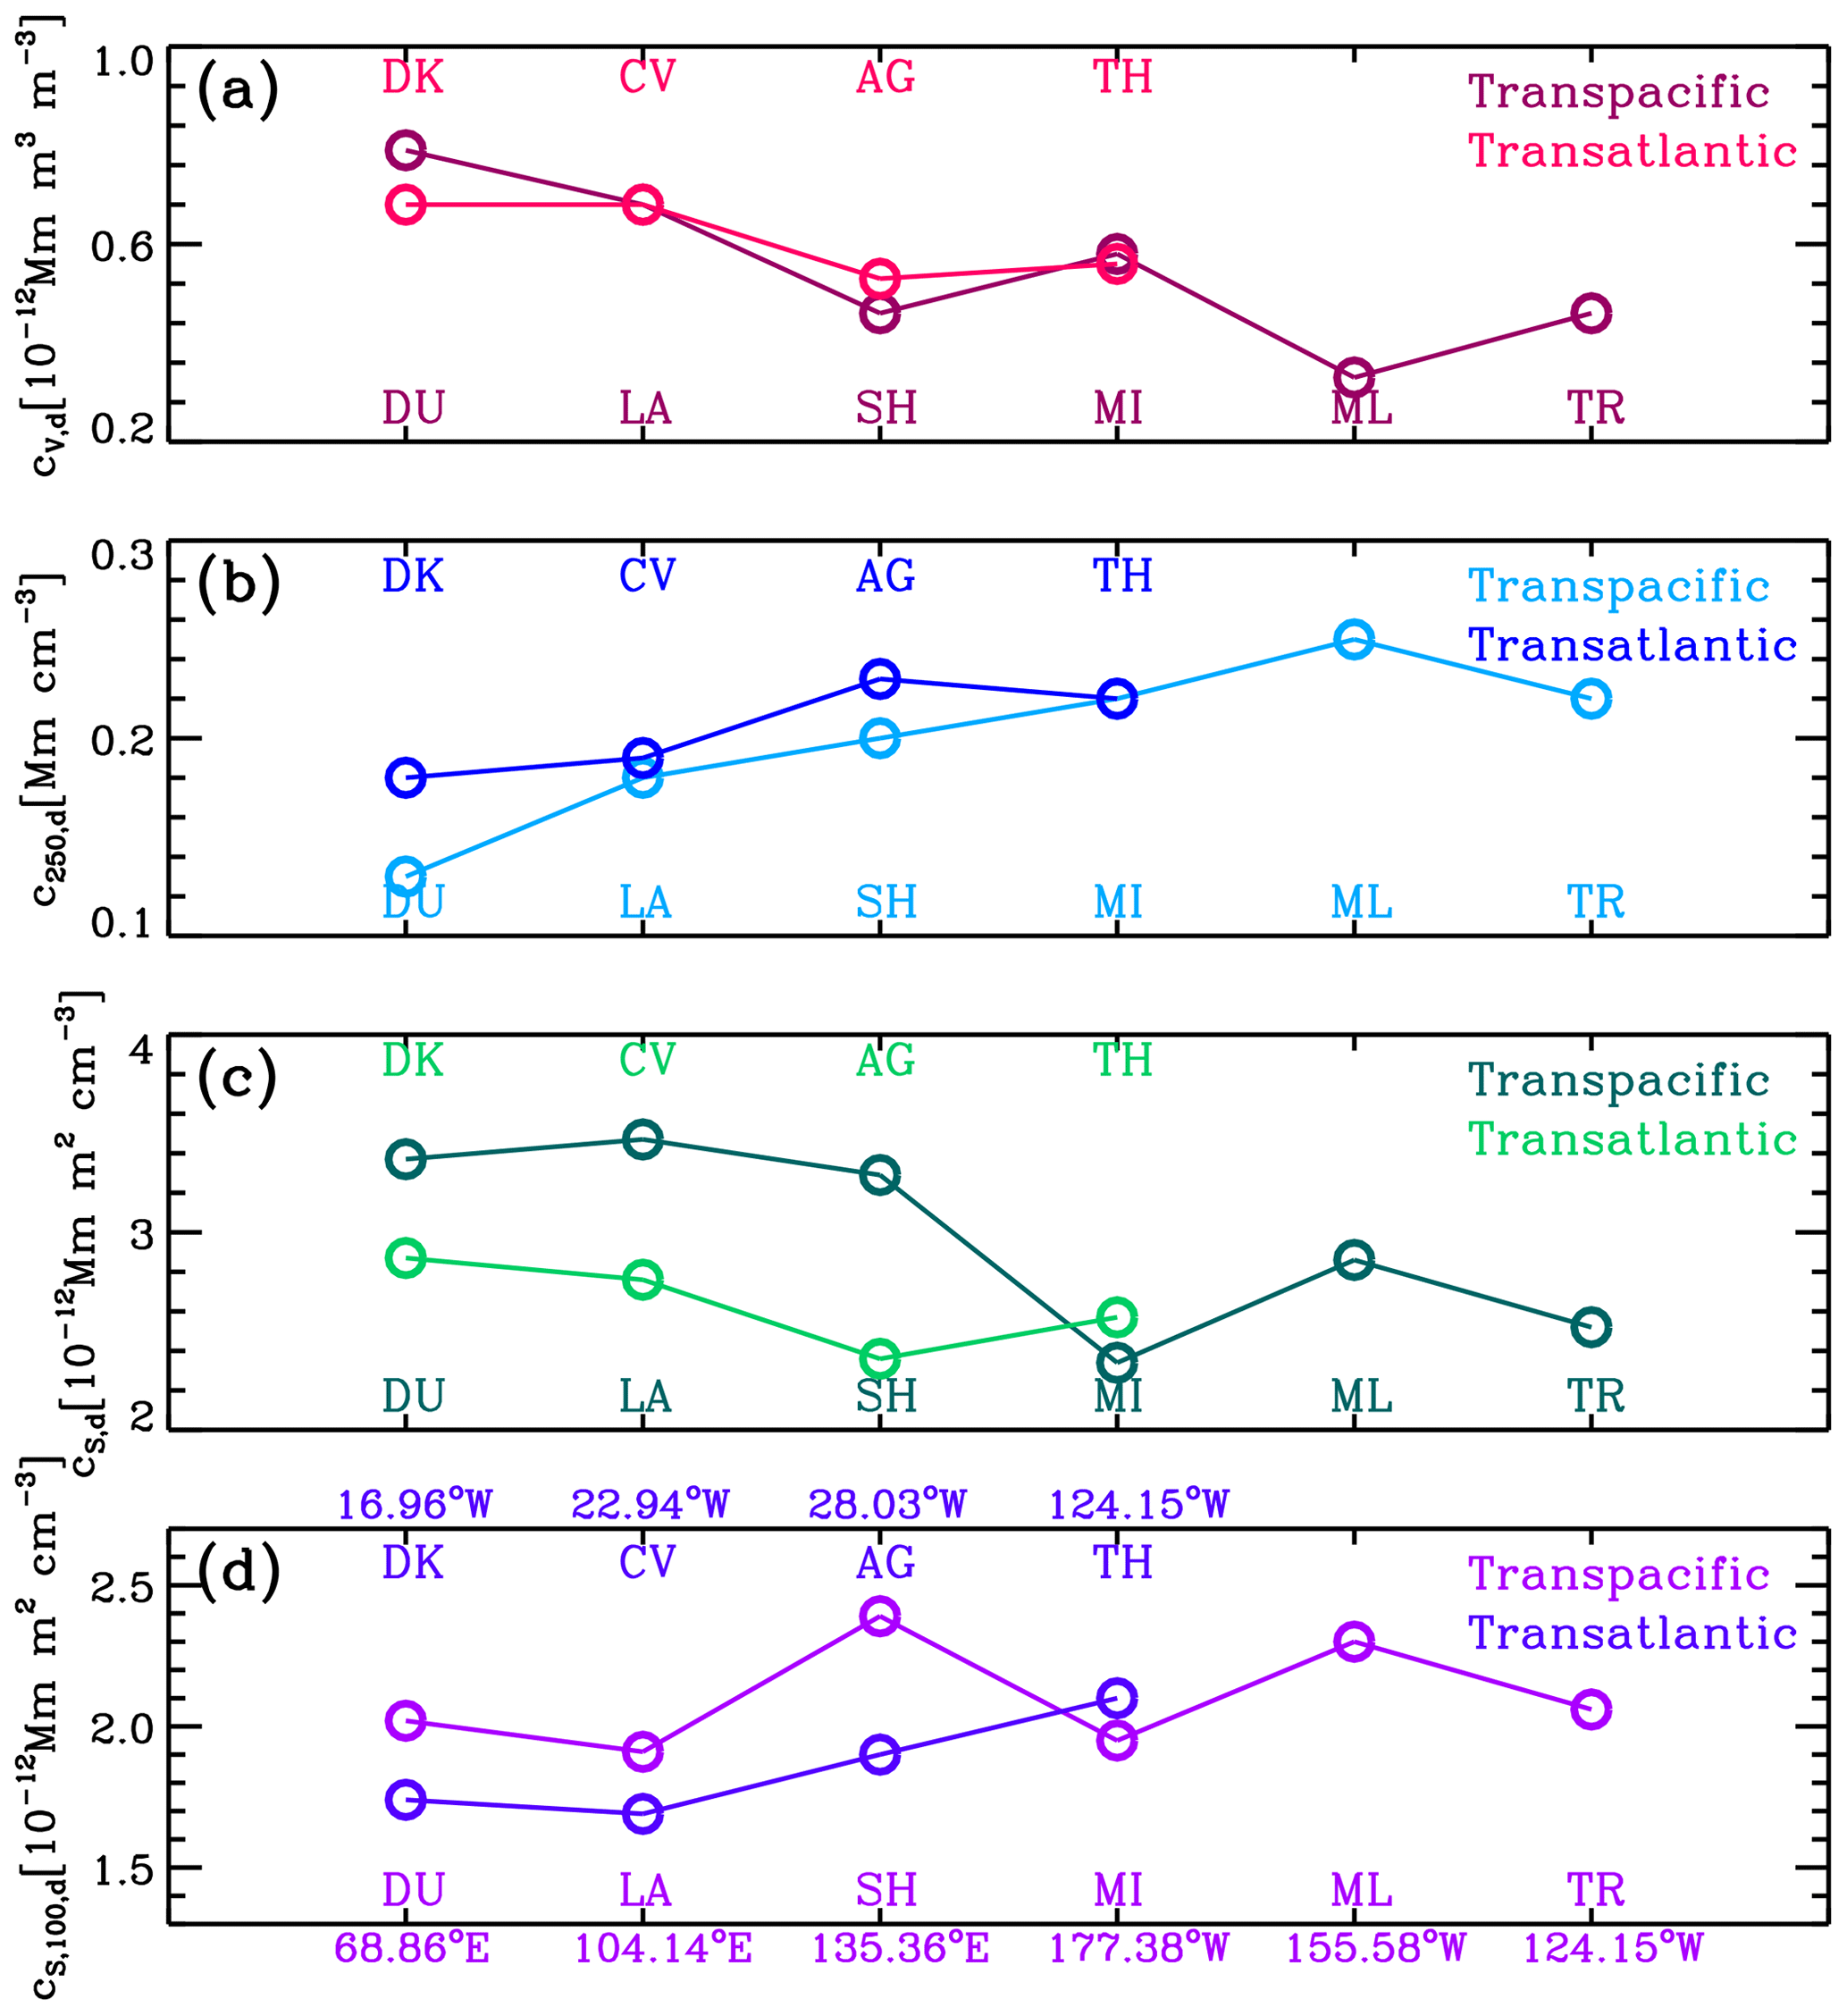
Figure 8Variations in conversion factors (a) cv,d, (b) c250,d, (c) cs,d, and (d) along transoceanic dust transport paths, including a transpacific path from Asian dust sources to the west coast of North America and a transatlantic path from the Saharan desert (North Africa) to the east coast of North America. The DDM and PD datasets are considered together for calculating the conversion factors. The longitudes of the sites are also shown.
To improve the current consideration of ACIs in atmospheric circulation models, it is necessary to characterize the 3-D distribution of dust-related CCNC and INPC at a global scale. The combination of CALIOP spaceborne lidar observations and the POLIPHON method has the potential to realize this purpose. In this study, as the first step, we retrieved the essential dust-related conversion factors at remote ocean sites where these parameters are less constrained. Historical AERONET databases were employed to calculate the conversion factors. Depolarization ratios at 1020 nm from the AERONET Version 3 aerosol inversion product were used to calculate the column-integrated dust ratios Rd,1020, which were further applied to identify the dust presence within the atmospheric column (Shin et al., 2018, 2019). Compared with the use of the Ångström exponent (Ansmann et al., 2019b), this treatment is beneficial for containing fine-mode dust-dominated cases (after the preferential removal of large-sized dust particles during transport), mitigating the occasional interference of large-sized marine aerosols, and studying the evolution of dust microphysical properties along the transoceanic transport path.
It is found that cv,d, c250,d, and are generally consistent with those provided by Ansmann et al. (2019b) at nine sites near deserts. However, the cs,d values obtained in this study are systematically larger than those given by Ansmann et al. (2019b), which is attributed to the possible miss of fine-mode dust particles with radii < 100 nm. For all the dust-related conversion factors, the PD and PD+DDM datasets give similar results except for two Middle East sites, i.e., Eilat and Mezaira'a. Then, we calculated all the dust-related conversion factors at 20 oceanic and coastal sites using both the PD and PD+DDM datasets. Only 10 sites have adequate PD data points to retrieve cv,d, c250,d, cs,d, and . Among them, cv,d values are more sensitive to the influence of other aerosols involved in the atmospheric column and show large differences between the PD and PD+DDM clusters as well as from region to region. In addition, only nine sites successfully obtained the CCN-relevant factors c100,d and χd in the regression analysis. In addition, cv,d values gradually decrease along with transoceanic transport; in contrast, c250,d values show an increasing trend. A general decline in cs,d can be found after transoceanic transport; however, this decrease is not observed for , suggesting that the discrepancy may be due to the influence of the particle size spectral of < 100 nm (radius).
For ocean sites, the depolarization-ratio-based method for selecting dust-occurring data is proven to be valid and feasible. The PD datasets are suggested to be the preferential option to calculate the dust-related conversion factors. If the available PD data points are insufficient, the PD+DDM cluster would be a suboptimal option allowing us to obtain the conversion factors with certain accuracy and robustness. In future work, we will conduct case studies on dust–cloud interactions over the ocean with CALIOP spaceborne lidar observations and the dust-related conversion factors used in this study. In addition, the dust-related conversion factors at polluted city sites will be examined with the same method; in this situation, the application of PD or PD+DDM datasets needs to be further discussed in depth. Once those conversion factors at polluted city sites are retrieved, a global dust-related conversion factor grid dataset will possibly be obtained by geographical interpolation. After that, the 3-D view of global CCNC and INPC can be anticipated to improve our current consideration of ACIs in atmospheric circulation models.
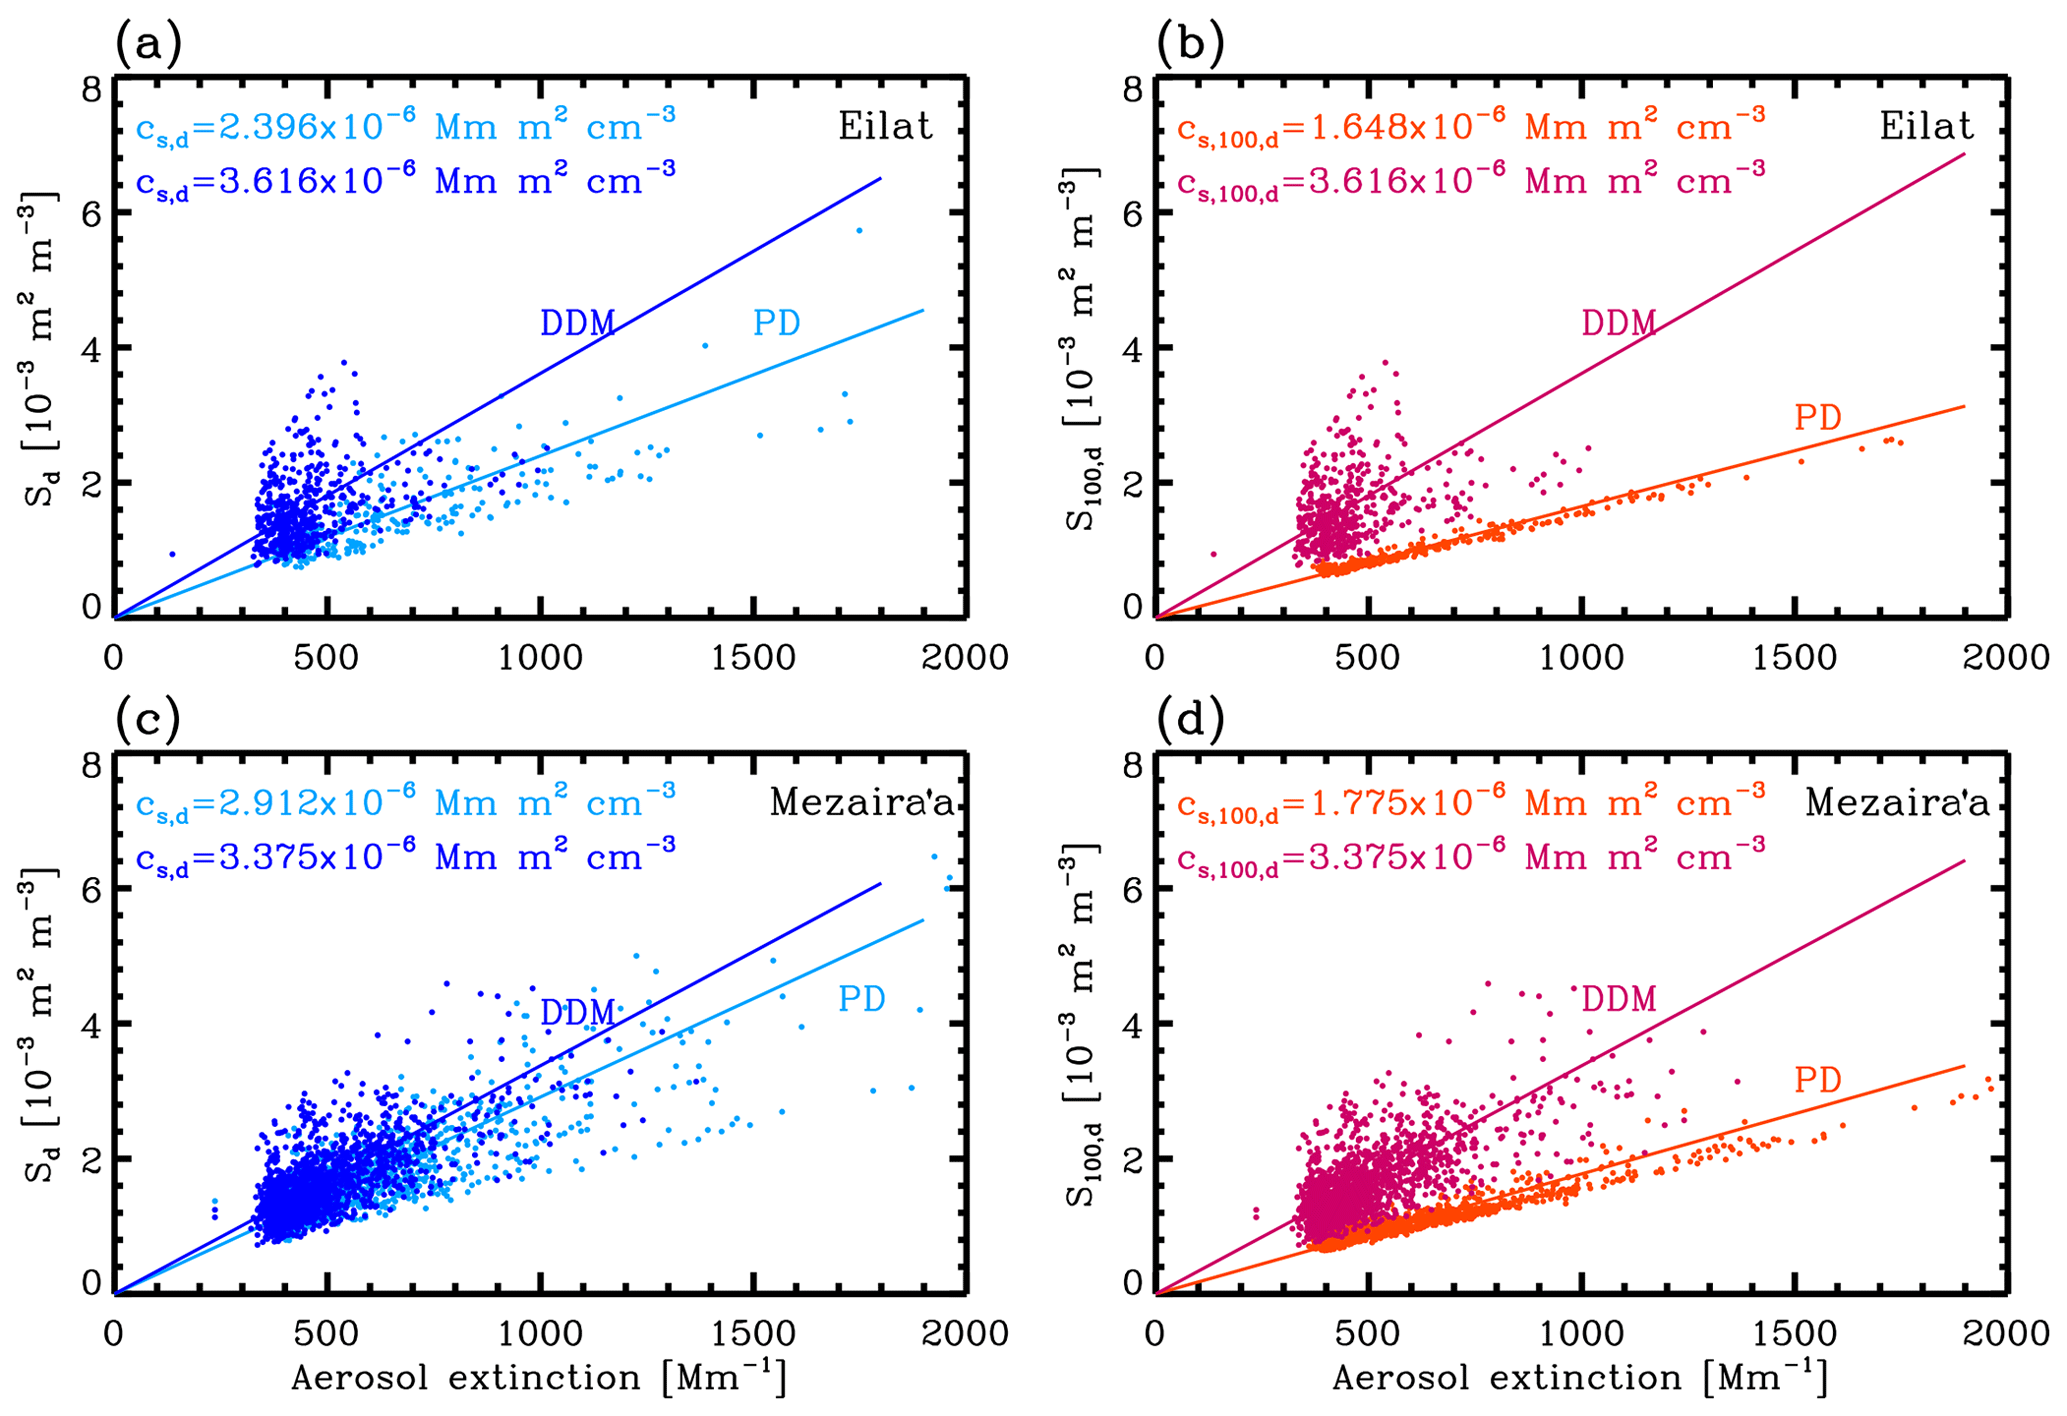
Figure A1Relationship between aerosol extinction coefficient at 532 nm and surface area concentration sd and s100,d (only considering particles with a radius > 100 nm) for pure dust (PD) and dust-dominated mixture (DDM) at two Middle East sites, i.e., (a, b) for Eilat and (c, d) Mezaira'a. The PD and DDM data points are determined by the AERONET V3 database (level-2.0 AOD products and level-2.0 aerosol inversions) according to the method from Shin et al. (2019). The corresponding dust-related conversion factors cs,d and are also given, respectively.
AERONET AOD data can be downloaded at https://aeronet.gsfc.nasa.gov/new_web/download_all_v3_aod.html (AERONET, 2023a). AERONET aerosol inversion data can be downloaded at https://aeronet.gsfc.nasa.gov/new_web/download_all_v3_inversions.html (AERONET, 2023b).
YH conceived the research, analyzed the data, acquired the research funding, and wrote the manuscript. ZY conceived the research, participated in scientific discussions, and reviewed and proofread the manuscript. AA reviewed the manuscript and participated in scientific discussions. FL and LW reviewed and proofread the manuscript. DJ and HS participated in the data processing.
The contact author has declared that none of the authors has any competing interests.
Publisher’s note: Copernicus Publications remains neutral with regard to jurisdictional claims in published maps and institutional affiliations.
The authors thank all PIs of the AERONET sites used in this study for maintaining their instruments and providing their data to the community.
This research has been supported by the National Natural Science Foundation of China (grant nos. 42005101, 41927804, and 42205130), the Fundamental Research Funds for the Central Universities (grant no. 2042021kf1066), the Natural Science Foundation of Hubei Province (grant no. 2021CFB406), the Innovation and Development Project of China Meteorological Administration (grant no. CXFZ2022J060), the Chinese Scholarship Council (CSC) (grant no. 202206275006), and the Meridian Space Weather Monitoring Project (China).
This paper was edited by Vassilis Amiridis and reviewed by three anonymous referees.
Adebiyi, A. A., Kok, J. F., Wang, Y., Ito, A., Ridley, D. A., Nabat, P., and Zhao, C.: Dust Constraints from joint Observational-Modelling-experiMental analysis (DustCOMM): comparison with measurements and model simulations, Atmos. Chem. Phys., 20, 829–863, https://doi.org/10.5194/acp-20-829-2020, 2020.
AERONET: AERONET Aerosol Optical Depth (V3) – Solar data base, Aerosol Robotic Network [data set], https://aeronet.gsfc.nasa.gov/new_web/download_all_v3_aod.html, last access: 12 April 2023a.
AERONET: AERONET Aerosol Inversion (V3) data base, Aerosol Robotic Network [data set], https://aeronet.gsfc.nasa.gov/new_web/download_all_v3_inversions.html, last access: 12 April 2023b.
Albrecht, B. A.: Aerosols, cloud microphysics, and fractional cloudiness, Science, 245, 1227–1230, https://doi.org/10.1126/science.245.4923.1227, 1989.
Ansmann, A., Seifert, P., Tesche, M., and Wandinger, U.: Profiling of fine and coarse particle mass: case studies of Saharan dust and Eyjafjallajökull/Grimsvötn volcanic plumes, Atmos. Chem. Phys., 12, 9399–9415, https://doi.org/10.5194/acp-12-9399-2012, 2012.
Ansmann, A., Mamouri, R.-E., Bühl, J., Seifert, P., Engelmann, R., Hofer, J., Nisantzi, A., Atkinson, J. D., Kanji, Z. A., Sierau, B., Vrekoussis, M., and Sciare, J.: Ice-nucleating particle versus ice crystal number concentrationin altocumulus and cirrus layers embedded in Saharan dust:a closure study, Atmos. Chem. Phys., 19, 15087–15115, https://doi.org/10.5194/acp-19-15087-2019, 2019a.
Ansmann, A., Mamouri, R.-E., Hofer, J., Baars, H., Althausen, D., and Abdullaev, S. F.: Dust mass, cloud condensation nuclei, and ice-nucleating particle profiling with polarization lidar: updated POLIPHON conversion factors from global AERONET analysis, Atmos. Meas. Tech., 12, 4849–4865, https://doi.org/10.5194/amt-12-4849-2019, 2019b.
Ansmann, A., Ohneiser, K., Mamouri, R.-E., Knopf, D. A., Veselovskii, I., Baars, H., Engelmann, R., Foth, A., Jimenez, C., Seifert, P., and Barja, B.: Tropospheric and stratospheric wildfire smoke profiling with lidar: mass, surface area, CCN, and INP retrieval, Atmos. Chem. Phys., 21, 9779–9807, https://doi.org/10.5194/acp-21-9779-2021, 2021.
Baddock, M., Mockford, T., Bullard, J., and Thorsteinsson, T.: Pathways of high-latitude dust in the North Atlantic, Earth Planet Sc. Lett., 459, 170–182, https://doi.org/10.1016/j.epsl.2016.11.034, 2017.
Bohren, C. and Huffman, D.: Absorbing and scattering of light by small particles, Wiley, https://doi.org/10.1002/9783527618156, 1983.
Bullard, J. E., Baddock, M., Bradwell, T., Crusius, J., Darlington, E., Gaiero, D., Gassó, S., Gisladottir, G., Hodgkins, R., McCulloch, R., McKenna-Neuman, C., Mockford, T., Stewart, H., and Thorsteinsson, T.: High-latitude dust in the Earth system, Rev. Geophys., 54, 447–485, https://doi.org/10.1002/2016RG000518, 2016.
Burton, S. P., Ferrare, R. A., Vaughan, M. A., Omar, A. H., Rogers, R. R., Hostetler, C. A., and Hair, J. W.: Aerosol classification from airborne HSRL and comparisons with the CALIPSO vertical feature mask, Atmos. Meas. Tech., 6, 1397–1412, https://doi.org/10.5194/amt-6-1397-2013, 2013.
Choudhury, G. and Tesche, M.: Estimating cloud condensation nuclei concentrations from CALIPSO lidar measurements, Atmos. Meas. Tech., 15, 639–654, https://doi.org/10.5194/amt-15-639-2022, 2022a.
Choudhury, G. and Tesche, M.: Assessment of CALIOP-derived CCN concentrations by in situ surface measurements, Remote Sens., 14, 3342, https://doi.org/10.3390/rs14143342, 2022b.
Choudhury, G., Ansmann, A., and Tesche, M.: Evaluation of aerosol number concentrations from CALIPSO with ATom airborne in situ measurements, Atmos. Chem. Phys., 22, 7143–7161, https://doi.org/10.5194/acp-22-7143-2022, 2022.
Cziczo, D., Froyd, K., Hoose, C., Jensen, E., Diao, M., Zondlo, M., Smith, J., Twohy, C., and Murphy, D.: Clarifying the dominant sources and mechanisms of cirrus cloud formation, Science, 340, 1320–1324, https://doi.org/10.1126/science.1234145, 2013.
Dai, G., Sun, K., Wang, X., Wu, S., E, X., Liu, Q., and Liu, B.: Dust transport and advection measurement with spaceborne lidars ALADIN and CALIOP and model reanalysis data, Atmos. Chem. Phys., 22, 7975–7993, https://doi.org/10.5194/acp-22-7975-2022, 2022.
DeMott, P., Prenni, A., Liu, X., Kreidenweis, S., Petters, M., Twohy, C., Richardson, M., Eidhammer, T., and Rogers, D.: Predicting global atmospheric ice nuclei distributions and their impacts on climate, P. Natl. Acad. Sci. USA, 107, 11217–11222, https://doi.org/10.1073/pnas.0910818107, 2010.
DeMott, P. J., Möhler, O., Stetzer, O., Vali, G., Levin, Z., Petters, M. D., Murakami, M., Leisner, T., Bundke, U., Klein, H., Kanji, Z. A., Cotton, R., Jones, H., Benz, S., Birkmann, M., Rzesanke, D., Saathoff, H., Nicolet, M., Saito, A., Nillius, B., Bingemer, H., Abbatt, J., Ardon, K., Ganor, E., Georgakopoulos, D. G., and Saunders, C.: Resurgence in Ice Nuclei Measurement Research, B. Am. Meteorol. Soc., 92, 1623–1635, https://doi.org/10.1175/2011BAMS3119.1, 2011.
DeMott, P. J., Prenni, A. J., McMeeking, G. R., Sullivan, R. C., Petters, M. D., Tobo, Y., Niemand, M., Möhler, O., Snider, J. R., Wang, Z., and Kreidenweis, S. M.: Integrating laboratory and field data to quantify the immersion freezing ice nucleation activity of mineral dust particles, Atmos. Chem. Phys., 15, 393–409, https://doi.org/10.5194/acp-15-393-2015, 2015.
Dubovik, O. and King, M.: A flexible inversion algorithm for retrieval of aerosol optical properties from sun and sky radiance measurements, J. Geophys. Res., 105, 20673–20696, https://doi.org/10.1029/2000JD900282, 2000.
Dubovik, O., Smirnov, A., Holben, B., King, M., Kaufman, Y., Eck, T., and Slutsker, I.: Accuracy assessments of aerosol optical properties retrieved from Aerosol Robotic Network (AERONET) sun and sky radiance measurements, J. Geophys. Res., 105, 9791–9806, https://doi.org/10.1029/2000JD900040, 2000.
Dubovik, O., Sinyuk, A., Lapyonok, T., Holben, B. N., Mishchenko, M., Yang, P., Eck, T. F., Volten, H., Muñoz, O., and Veihelmann, B.: Application of spheroid models to account for aerosol particle nonsphericity in remote sensing of desert dust, J. Geophys. Res., 111, D11208, https://doi.org/10.1029/2005JD006619, 2006.
Engelmann, R., Ansmann, A., Ohneiser, K., Griesche, H., Radenz, M., Hofer, J., Althausen, D., Dahlke, S., Maturilli, M., Veselovskii, I., Jimenez, C., Wiesen, R., Baars, H., Bühl, J., Gebauer, H., Haarig, M., Seifert, P., Wandinger, U., and Macke, A.: Wildfire smoke, Arctic haze, and aerosol effects on mixed-phase and cirrus clouds over the North Pole region during MOSAiC: an introduction, Atmos. Chem. Phys., 21, 13397–13423, https://doi.org/10.5194/acp-21-13397-2021, 2021.
Fernald, F. G.: Analysis of atmospheric lidar observations: some comments, Appl. Optics, 23, 652–653, https://doi.org/10.1364/AO.23.000652, 1984.
Froyd, K. D., Yu, P., Schill, G. P. Brock, C. A., Kupc, A., Williamson, C. J., Jensen, E. J., Ray, E., Rosenlof, K. H., Bian, H., Darmenov, A. S., Colarco, P. R., Diskin, G. S., Bui, T., and Murphy, D. M.: Dominant role of mineral dust in cirrus cloud formation revealed by global-scale measurements, Nat. Geosci., 15, 177–183, https://doi.org/10.1038/s41561-022-00901-w, 2022.
Gasteiger, J., Wiegner, M., Groß, S., Freudenthaler, V., Toledano, C., Tesche, M., and Kandler, K.: Modeling lidar-relevant optical properties of complex mineral dust aerosols, Tellus B, 63, 725–741, https://doi.org/10.1111/j.1600-0889.2011.00559.x, 2011.
Georgoulias, A. K., Marinou, E., Tsekeri, A., Proestakis, E., Akritidis, D., Alexandri, G., Zanis, P., Balis, D., Marenco, F., Tesche, M., and Amiridis, V.: A first case study of CCN concentrations from spaceborne lidar observations, Remote Sens., 12, 1557, https://doi.org/10.3390/rs12101557, 2020.
Giles, D. M., Sinyuk, A., Sorokin, M. G., Schafer, J. S., Smirnov, A., Slutsker, I., Eck, T. F., Holben, B. N., Lewis, J. R., Campbell, J. R., Welton, E. J., Korkin, S. V., and Lyapustin, A. I.: Advancements in the Aerosol Robotic Network (AERONET) Version 3 database – automated near-real-time quality control algorithm with improved cloud screening for Sun photometer aerosol optical depth (AOD) measurements, Atmos. Meas. Tech., 12, 169–209, https://doi.org/10.5194/amt-12-169-2019, 2019.
Goel, V., Mishra, S. K., Pal, P., Ahlawat, A., Vijayan, N., Jain, S., and Sharma, C.: Influence of chemical aging on physico-chemical properties of mineral dust particles: a case study of 2016 dust storms over Delhi, Environ. Pollut., 267, 115338, https://doi.org/10.1016/j.envpol.2020.115338, 2020.
Guo, J., Lou, M., Miao, Y., Wang, Y., Zeng, Z., Liu, H., He, J., Xu, H., Wang, F., Min, M., and Zhai, P.: Trans-Pacific transport of dust aerosol originated from East Asia: Insights gained from multiple observations and modeling, Environ. Pollut., 230, 1030–1039, https://doi.org/10.1016/j.envpol.2017.07.062, 2017.
Haarig, M., Ansmann, A., Gasteiger, J., Kandler, K., Althausen, D., Baars, H., Radenz, M., and Farrell, D. A.: Dry versus wet marine particle optical properties: RH dependence of depolarization ratio, backscatter, and extinction from multiwavelength lidar measurements during SALTRACE, Atmos. Chem. Phys., 17, 14199–14217, https://doi.org/10.5194/acp-17-14199-2017, 2017.
Haarig, M., Walser, A., Ansmann, A., Dollner, M., Althausen, D., Sauer, D., Farrell, D., and Weinzierl, B.: Profiles of cloud condensation nuclei, dust mass concentration, and ice-nucleating-particle-relevant aerosol properties in the Saharan Air Layer over Barbados from polarization lidar and airborne in situ measurements, Atmos. Chem. Phys., 19, 13773–13788, https://doi.org/10.5194/acp-19-13773-2019, 2019.
Haarig, M., Ansmann, A., Engelmann, R., Baars, H., Toledano, C., Torres, B., Althausen, D., Radenz, M., and Wandinger, U.: First triple-wavelength lidar observations of depolarization and extinction-to-backscatter ratios of Saharan dust, Atmos. Chem. Phys., 22, 355–369, https://doi.org/10.5194/acp-22-355-2022, 2022.
He, Y. and Yi, F.: Dust aerosols detected using a ground-based polarization lidar and CALIPSO over Wuhan (30.5N, 114.4E), China, Adv. Meteorol., 2015, 536762, https://doi.org/10.1155/2015/536762, 2015.
He, Y., Yi, F., Yi, Y., Liu, F., and Zhang, Y.: Heterogeneous nucleation of midlevel cloud layer influenced by transported Asian dust over Wuhan (30.5N, 114.4E), China, J. Geophys. Res.-Atmos., 126, e2020JD033394, https://doi.org/10.1029/2020JD033394, 2021a.
He, Y., Zhang, Y., Liu, F., Yin, Z., Yi, Y., Zhan, Y., and Yi, F.: Retrievals of dust-related particle mass and ice-nucleating particle concentration profiles with ground-based polarization lidar and sun photometer over a megacity in central China, Atmos. Meas. Tech., 14, 5939–5954, https://doi.org/10.5194/amt-14-5939-2021, 2021b.
He, Y., Yin, Z., Liu, F., and Yi, F.: Technical note: Identification of two ice-nucleating regimes for dust-related cirrus clouds based on the relationship between number concentrations of ice-nucleating particles and ice crystals, Atmos. Chem. Phys., 22, 13067–13085, https://doi.org/10.5194/acp-22-13067-2022, 2022a.
He, Y., Yi, F., Liu, F., Yin, Z., and Zhou, J.: Ice nucleation of cirrus clouds related to the transported dust layer observed by ground-based lidars over Wuhan, China, Adv. Atmos. Sci., 39, 2071–2086, https://doi.org/10.1007/s00376-021-1192-x, 2022b.
He, Y., Yi, F., Yin, Z., Liu, F., Yi, Y., and Zhou, J.: Mega Asian dust event over China on 27–31 March 2021 observed with space-borne instruments and ground-based polarization lidar, Atmos. Environ., 285, 119238, https://doi.org/10.1016/j.atmosenv.2022.119238, 2022c.
Hofer, J., Ansmann, A., Althausen, D., Engelmann, R., Baars, H., Abdullaev, S. F., and Makhmudov, A. N.: Long-term profiling of aerosol light extinction, particle mass, cloud condensation nuclei, and ice-nucleating particle concentration over Dushanbe, Tajikistan, in Central Asia, Atmos. Chem. Phys., 20, 4695–4711, https://doi.org/10.5194/acp-20-4695-2020, 2020.
Holben, B., Eck, T., Slutsker, I., Tanré, D., Buis, J., Setzer, A., Vermote, E., Reagan, J., Kaufman, Y., Nakajima, T., Lavenu, F., Jankowiak, I., and Smirnov, A.: AERONET – A federated instrument network and data archive for aerosol characterization, Remote Sens. Environ., 66, 1–16, https://doi.org/10.1016/s0034-4257(98)00031-5, 1998.
Hu, Q., Wang, H., Goloub, P., Li, Z., Veselovskii, I., Podvin, T., Li, K., and Korenskiy, M.: The characterization of Taklamakan dust properties using a multiwavelength Raman polarization lidar in Kashi, China, Atmos. Chem. Phys., 20, 13817–13834, https://doi.org/10.5194/acp-20-13817-2020, 2020.
Hu, Z., Huang, J., Zhao, C., Ma, Y., Jin, Q., Qian, Y., Leung, L. R., Bi, J., and Ma, J.: Trans-Pacific transport and evolution of aerosols: spatiotemporal characteristics and source contributions, Atmos. Chem. Phys., 19, 12709–12730, https://doi.org/10.5194/acp-19-12709-2019, 2019.
Huang, Z., Huang, J., Hayasaka, T., Wang, S., Zhou, T., and Jin, H.: Short-cut transport path for Asian dust directly to the Arctic: a case study, Environ. Res. Lett., 10, 114018, https://doi.org/10.1088/1748-9326/10/11/114018, 2015.
Illingworth, A. J., Barker, H. W., Beljaars, A., Ceccaldi, M., Chepfer, H., Clerbaux, N., Cole, J., Delanoë, J., Domenech, C., Donovan, D. P., Fukuda, S., Hirakata, M., Hogan, R. J., Huenerbein, A., Kollias, P., Kubota, T., Nakajima, T., Nakajima, T. Y., Nishizawa, T., Ohno, Y., Okamoto, H., Oki, R., Sato, K., Satoh, M., Shephard, M., Velázquez-Blázquez, A., Wandinger, U.,Wehr, T., and van Zadelhoff, G.-J.: The EarthCARE Satellite: The next step forward in global measurements of clouds, aerosols, precipitation and radiation, B. Am. Meteorol. Soc., 96, 1311–1332, https://doi.org/10.1175/BAMS-D-12-00227.1, 2015.
IPCC: Climate Change 2021: The Physical Science Basis. Contribution of Working Group I to the Sixth Assessment Report of the Intergovernmental Panel on Climate Change, edited by: Masson-Delmotte, V., Zhai, P., Pirani, A., Connors, S. L., Péan, C., Berger, S., Caud, N., Chen, Y., Goldfarb, L., Gomis, M. I., Huang, M., Leitzell, K., Lonnoy, E., Matthews, J. B. R., Maycock, T. K., Waterfield, T., Yelekçi, O., Yu, R., and Zhou, B., Cambridge University Press, Cambridge, United Kingdom and New York, NY, USA, 2021.
Kanji, Z. A., Ladino, L. A., Wex, H., Boose, Y., Burkert-Kohn, M., Cziczo, D. J., and Krämer, M.: Overview of ice nucleating particles, Meteor. Mon., 58, 1.1–1.33, https://doi.org/10.1175/AMSMONOGRAPHS-D-16-0006.1, 2017.
Kim, J. S. and Park, K.: Atmospheric aging of Asian dust particles during long range transport, Aerosol Sci. Tech., 46, 913–924, https://doi.org/10.1080/02786826.2012.680984, 2012.
Kok, J. F., Adebiyi, A. A., Albani, S., Balkanski, Y., Checa-Garcia, R., Chin, M., Colarco, P. R., Hamilton, D. S., Huang, Y., Ito, A., Klose, M., Li, L., Mahowald, N. M., Miller, R. L., Obiso, V., Pérez García-Pando, C., Rocha-Lima, A., and Wan, J. S.: Contribution of the world's main dust source regions to the global cycle of desert dust, Atmos. Chem. Phys., 21, 8169–8193, https://doi.org/10.5194/acp-21-8169-2021, 2021a.
Kok, J. F., Adebiyi, A. A., Albani, S., Balkanski, Y., Checa-Garcia, R., Chin, M., Colarco, P. R., Hamilton, D. S., Huang, Y., Ito, A., Klose, M., Leung, D. M., Li, L., Mahowald, N. M., Miller, R. L., Obiso, V., Pérez García-Pando, C., Rocha-Lima, A., Wan, J. S., and Whicker, C. A.: Improved representation of the global dust cycle using observational constraints on dust properties and abundance, Atmos. Chem. Phys., 21, 8127–8167, https://doi.org/10.5194/acp-21-8127-2021, 2021b.
Lee, J., Kim, J., Song, C., Kim, S., Chun, Y., Sohn, B., and Holben, B.: Characteristics of aerosol types from AERONET sun-photometer measurements, Atmos. Environ., 44, 3110–3117, https://doi.org/10.1016/j.atmosenv.2010.05.035, 2010.
Lenhardt, E. D., Gao, L., Redemann, J., Xu, F., Burton, S. P., Cairns, B., Chang, I., Ferrare, R. A., Hostetler, C. A., Saide, P. E., Howes, C., Shinozuka, Y., Stamnes, S., Kacarab, M., Dobracki, A., Wong, J., Freitag, S., and Nenes, A.: Use of Lidar Aerosol Extinction and Backscatter Coefficients to Estimate Cloud Condensation Nuclei (CCN) Concentrations in the Southeast Atlantic, Atmos. Meas. Tech. Discuss. [preprint], https://doi.org/10.5194/amt-2022-262, in review, 2022.
Li, G., Wieder, J., Pasquier, J. T., Henneberger, J., and Kanji, Z. A.: Predicting atmospheric background number concentration of ice-nucleating particles in the Arctic, Atmos. Chem. Phys., 22, 14441–14454, https://doi.org/10.5194/acp-22-14441-2022, 2022.
Liu, C., Yin, Z., He, Y., and Wang, L.: Climatology of dust aerosols over the Jianghan Plain revealed with space-borne instruments and MERRA-2 reanalysis data during 2006–2021, Remote Sens., 14, 4414, https://doi.org/10.3390/rs14174414, 2022.
Mamouri, R. E. and Ansmann, A.: Fine and coarse dust separation with polarization lidar, Atmos. Meas. Tech., 7, 3717–3735, https://doi.org/10.5194/amt-7-3717-2014, 2014.
Mamouri, R. E. and Ansmann, A.: Estimated desert-dust ice nuclei profiles from polarization lidar: methodology and case studies, Atmos. Chem. Phys., 15, 3463–3477, https://doi.org/10.5194/acp-15-3463-2015, 2015.
Mamouri, R.-E. and Ansmann, A.: Potential of polarization lidar to provide profiles of CCN- and INP-relevant aerosol parameters, Atmos. Chem. Phys., 16, 5905–5931, https://doi.org/10.5194/acp-16-5905-2016, 2016.
Mamouri, R.-E. and Ansmann, A.: Potential of polarization/Raman lidar to separate fine dust, coarse dust, maritime, and anthropogenic aerosol profiles, Atmos. Meas. Tech., 10, 3403–3427, https://doi.org/10.5194/amt-10-3403-2017, 2017.
Mamouri, R. E., Ansmann, A., Nisantzi, A., Kokkalis, P., Schwarz, A., and Hadjimitsis, D.: Low Arabian extinction-to-backscatter ratio, Geophys. Res. Lett., 40, 4762–4766, https://doi.org/10.1002/grl.50898, 2013.
Marinou, E., Tesche, M., Nenes, A., Ansmann, A., Schrod, J., Mamali, D., Tsekeri, A., Pikridas, M., Baars, H., Engelmann, R., Voudouri, K.-A., Solomos, S., Sciare, J., Groß, S., Ewald, F., and Amiridis, V.: Retrieval of ice-nucleating particle concentrations from lidar observations and comparison with UAV in situ measurements, Atmos. Chem. Phys., 19, 11315–11342, https://doi.org/10.5194/acp-19-11315-2019, 2019.
Meinander, O., Dagsson-Waldhauserova, P., Amosov, P., Aseyeva, E., Atkins, C., Baklanov, A., Baldo, C., Barr, S. L., Barzycka, B., Benning, L. G., Cvetkovic, B., Enchilik, P., Frolov, D., Gassó, S., Kandler, K., Kasimov, N., Kavan, J., King, J., Koroleva, T., Krupskaya, V., Kulmala, M., Kusiak, M., Lappalainen, H. K., Laska, M., Lasne, J., Lewandowski, M., Luks, B., McQuaid, J. B., Moroni, B., Murray, B., Möhler, O., Nawrot, A., Nickovic, S., O’Neill, N. T., Pejanovic, G., Popovicheva, O., Ranjbar, K., Romanias, M., Samonova, O., Sanchez-Marroquin, A., Schepanski, K., Semenkov, I., Sharapova, A., Shevnina, E., Shi, Z., Sofiev, M., Thevenet, F., Thorsteinsson, T., Timofeev, M., Umo, N. S., Uppstu, A., Urupina, D., Varga, G., Werner, T., Arnalds, O., and Vukovic Vimic, A.: Newly identified climatically and environmentally significant high-latitude dust sources, Atmos. Chem. Phys., 22, 11889–11930, https://doi.org/10.5194/acp-22-11889-2022, 2022.
Moore, R. H., Cerully, K., Bahreini, R., Brock, C. A., Middlebrook, A. M., and Nenes, A.: Hygroscopicity and composition of California CCN during summer 2010, J. Geophys. Res.-Atmos., 117, D00V12, https://doi.org/10.1029/2011JD017352, 2012.
Müller, D., Ansmann, A., Mattis, I., Tesche, M., Wandinger, U., Althausen, D., and Pisani, G.: Aerosol-type-dependent lidar ratios observed with Raman lidar, J. Geophys. Res., 112, D16202, https://doi.org/10.1029/2006JD008292, 2007.
Murray, B. J., O'Sullivan, D., Atkinson, J. D., and Webb, M. E.: Ice nucleation by particles immersed in supercooled cloud droplet, Chem. Soc. Rev., 41, 6519–6554, https://doi.org/10.1039/c2cs35200a, 2012.
Niemand, M., Möhler, O., Vogel, B., Vogel, H., Hoose, C., Connolly, P., Klein, H., Bingemer, H., DeMott, P., Skrotzki, J., and Leisner, T.: Parameterisation of immersion freezing on mineral dust particles: an application in a regional scale model, J. Atmos. Sci., 69, 3077–3092, https://doi.org/10.1175/JAS-D-11-0249.1, 2012.
Noh, Y., Müller, D., Lee, K., Kim, K., Lee, K., Shimizu, A., Sano, I., and Park, C. B.: Depolarization ratios retrieved by AERONET sun–sky radiometer data and comparison to depolarization ratios measured with lidar, Atmos. Chem. Phys., 17, 6271–6290, https://doi.org/10.5194/acp-17-6271-2017, 2017.
Patel, P., Jiang, J., Gautam, R., Gadhavi, H., Kalashnikova, O., Garay, M., Gao, L., Xu, F., and Omar, A.: Resolving Vertical Profile of Cloud Condensation Nuclei Concentrations from Spaceborne Lidar Measurements, Atmos. Chem. Phys. Discuss. [preprint], https://doi.org/10.5194/acp-2022-547, in review, 2022.
Peng, L., Yi, F., Liu, F., Yin, Z., and He, Y.: Optical properties of aerosol and cloud particles measured by a single-line-extracted pure rotational Raman lidar, Opt. Express, 29, 21947–21964, https://doi.org/10.1364/OE.427864, 2021.
Philip, S., Martin, R. V., Snider, G., Weagle, C. L., van Donkelaar, A., Brauer, M., Henze, D. K., Klimont, Z., Venkataraman, C., Guttikunda, S. K., and Zhang, Q.: Anthropogenic fugitive, combustion and industrial dust is a significant, underrepresented fine particulate matter source in global atmospheric models, Environ. Res. Lett., 12, 044018, https://doi.org/10.1088/1748-9326/aa65a4, 2017.
Phillips, V., DeMott, P., Andronache, C., Pratt, K., Prather, K., Subramanian, R., and Twohy, C.: Improvements to an empirical parameterization of heterogeneous ice nucleation and its comparison with observations, J. Atmos. Sci., 70, 378–409, https://doi.org/10.1175/JAS-D-12-080.1, 2013.
Ramanathan, V., Crutzen, P. J., Kiehl, J. T., and Rosenfeld, D.: Aerosols, climate, and the hydrological cycle, Science, 294, 2119–2124, https://doi.org/10.1126/science.1064034, 2001.
Rittmeister, F., Ansmann, A., Engelmann, R., Skupin, A., Baars, H., Kanitz, T., and Kinne, S.: Profiling of Saharan dust from the Caribbean to western Africa – Part 1: Layering structures and optical properties from shipborne polarization/Raman lidar observations, Atmos. Chem. Phys., 17, 12963–12983, https://doi.org/10.5194/acp-17-12963-2017, 2017.
Rosenfeld, D., Andreae, M. O., Asmi, A., Chin, M., Leeuw, G., Donovan, D. P., Kahn, R., Kinne, S., Kivekäs, N., Kulmala, M., Lau, W., Schmidt, K. S., Suni, T., Wagner, T., Wild, M., and Quaas, J.: Global observations of aerosol-cloud-precipitation-climate interactions, Rev. Geophys., 52, 750–808, https://doi.org/10.1002/2013RG000441, 2014.
Shi, Y., Liu, X., Wu, M., Zhao, X., Ke, Z., and Brown, H.: Relative importance of high-latitude local and long-range-transported dust for Arctic ice-nucleating particles and impacts on Arctic mixed-phase clouds, Atmos. Chem. Phys., 22, 2909–2935, https://doi.org/10.5194/acp-22-2909-2022, 2022.
Shin, S.-K., Tesche, M., Kim, K., Kezoudi, M., Tatarov, B., Müller, D., and Noh, Y.: On the spectral depolarisation and lidar ratio of mineral dust provided in the AERONET version 3 inversion product, Atmos. Chem. Phys., 18, 12735–12746, https://doi.org/10.5194/acp-18-12735-2018, 2018.
Shin, S.-K., Tesche, M., Noh, Y., and Müller, D.: Aerosol-type classification based on AERONET version 3 inversion products, Atmos. Meas. Tech., 12, 3789–3803, https://doi.org/10.5194/amt-12-3789-2019, 2019.
Shinozuka, Y., Clarke, A. D., Nenes, A., Jefferson, A., Wood, R., McNaughton, C. S., Ström, J., Tunved, P., Redemann, J., Thornhill, K. L., Moore, R. H., Lathem, T. L., Lin, J. J., and Yoon, Y. J.: The relationship between cloud condensation nuclei (CCN) concentration and light extinction of dried particles: indications of underlying aerosol processes and implications for satellite-based CCN estimates, Atmos. Chem. Phys., 15, 7585–7604, https://doi.org/10.5194/acp-15-7585-2015, 2015.
Sinyuk, A., Holben, B. N., Eck, T. F., Giles, D. M., Slutsker, I., Korkin, S., Schafer, J. S., Smirnov, A., Sorokin, M., and Lyapustin, A.: The AERONET Version 3 aerosol retrieval algorithm, associated uncertainties and comparisons to Version 2, Atmos. Meas. Tech., 13, 3375–3411, https://doi.org/10.5194/amt-13-3375-2020, 2020.
Smirnov, A., Holben, B. N., Slutsker, I., Giles, D. M., McClain, C. R., Eck, T. F., S. Sakerin, M., Macke, A., Croot, P., Zibordi, G., Quinn, P. K., Sciare, J., Kinne, S., Harvey, M., Smyth, T. J., Piketh, S., Zielinski, T., Proshutinsky, A., Goes, J. I., Nelson, N. B., Larouche, P., Radionov, V. F., Goloub, P., Krishna Moorthy, K., Matarrese, R., Robertson, E. J., and Jourdin, F.: Maritime Aerosol Network as a component of Aerosol Robotic Network, J. Geophys. Res., 114, D06204, https://doi.org/10.1029/2008JD011257, 2009.
Smirnov, A., Holben, B. N., Giles, D. M., Slutsker, I., O'Neill, N. T., Eck, T. F., Macke, A., Croot, P., Courcoux, Y., Sakerin, S. M., Smyth, T. J., Zielinski, T., Zibordi, G., Goes, J. I., Harvey, M. J., Quinn, P. K., Nelson, N. B., Radionov, V. F., Duarte, C. M., Losno, R., Sciare, J., Voss, K. J., Kinne, S., Nalli, N. R., Joseph, E., Krishna Moorthy, K., Covert, D. S., Gulev, S. K., Milinevsky, G., Larouche, P., Belanger, S., Horne, E., Chin, M., Remer, L. A., Kahn, R. A., Reid, J. S., Schulz, M., Heald, C. L., Zhang, J., Lapina, K., Kleidman, R. G., Griesfeller, J., Gaitley, B. J., Tan, Q., and Diehl, T. L.: Maritime aerosol network as a component of AERONET – first results and comparison with global aerosol models and satellite retrievals, Atmos. Meas. Tech., 4, 583–597, https://doi.org/10.5194/amt-4-583-2011, 2011.
Spänkuch, D., Hellmuth, O., and Görsdorf, U.: What is a cloud? Toward a more precise definition, B. Am. Meteorol. Soc., 103, E1894–E1929, https://doi.org/10.1175/BAMS-D-21-0032.1, 2022.
Steinke, I., Hoose, C., Möhler, O., Connolly, P., and Leisner, T.: A new temperature- and humidity-dependent surface site density approach for deposition ice nucleation, Atmos. Chem. Phys., 15, 3703–3717, https://doi.org/10.5194/acp-15-3703-2015, 2015.
Stier, P.: Limitations of passive remote sensing to constrain global cloud condensation nuclei, Atmos. Chem. Phys., 16, 6595–6607, https://doi.org/10.5194/acp-16-6595-2016, 2016.
Struve, T., Pahnke, K., Lamy, F., Wengler, M., Böning, P., and Winckler, G.: A circumpolar dust conveyor in the glacial Southern Ocean, Nat. Commun., 11, 5655, https://doi.org/10.1038/s41467-020-18858-y, 2020.
Tesche, M., Ansmann, A., Müller, D., Althausen, D., Engelmann, R., Freudenthaler, V., and Groß, S.: Vertically resolved separation of dust and smoke over Cape Verde using multiwavelength Raman and polarization lidars during Saharan Mineral Dust Experiment 2008, J. Geophys. Res., 114, D13202, https://doi.org/10.1029/2009JD011862, 2009.
Toledano, C., Torres, B., Velasco-Merino, C., Althausen, D., Groß, S., Wiegner, M., Weinzierl, B., Gasteiger, J., Ansmann, A., González, R., Mateos, D., Farrel, D., Müller, T., Haarig, M., and Cachorro, V. E.: Sun photometer retrievals of Saharan dust properties over Barbados during SALTRACE, Atmos. Chem. Phys., 19, 14571–14583, https://doi.org/10.5194/acp-19-14571-2019, 2019.
Twomey, S.: Pollution and the planetary albedo, Atmos. Environ., 8, 1251–1256, https://doi.org/10.1016/0004-6981(74)90004-3, 1974.
Ullrich, R., Hoose, C., Möhler, O., Niemand, M., Wagner, R., Höhler, K., Hiranuma, N., Saathoff, H., and Leisner, T.: A new ice nucleation active site parameterization for desert dust and soot, J. Atmos. Sci., 74, 699–717, https://doi.org/10.1175/JAS-D-16-0074.1, 2017.
Uno, I., Eguchi, K., Yumimoto, K., Takemura, T., Shimizu, A., Uematsu, M., Liu, Z., Wang, Z., Hara, Y., and Sugimoto, N.: Asian dust transported one full circuit around the globe, Nat. Geosci., 2, 557–560, https://doi.org/10.1038/ngeo583, 2009.
Wang, L., Mačak, M., Stanič, S., Bergant, K., Gregorič, A., Drinovec, L., Močnik, G., Yin, Z., Yi, Y., Müller, D., and Wang, X.: Investigation of aerosol types and vertical distributions using polarization Raman lidar over Vipava valley, Remote Sens., 14, 3482, https://doi.org/10.3390/rs14143482, 2022.
Wang, J., Cubison, M. J., Aiken, A. C., Jimenez, J. L., and Collins, D. R.: The importance of aerosol mixing state and size-resolved composition on CCN concentration and the variation of the importance with atmospheric aging of aerosols, Atmos. Chem. Phys., 10, 7267–7283, https://doi.org/10.5194/acp-10-7267-2010, 2010.
Wang, T., Han, Y., Hua, W., Tang, J., Huang, J., Zhou, T., Huang, Z., Bi, J., and Xie, H.: Profiling dust mass concentration in Northwest China using a joint lidar and sun-photometer setting, Remote Sens., 13, 1099, https://doi.org/10.3390/rs13061099, 2021.
Wieder, J., Ihn, N., Mignani, C., Haarig, M., Bühl, J., Seifert, P., Engelmann, R., Ramelli, F., Kanji, Z. A., Lohmann, U., and Henneberger, J.: Retrieving ice-nucleating particle concentration and ice multiplication factors using active remote sensing validated by in situ observations, Atmos. Chem. Phys., 22, 9767–9797, https://doi.org/10.5194/acp-22-9767-2022, 2022.
Winker, D., Hunt, W., and McGill, M.: Initial performance assessment of CALIOP, Geophys. Res. Lett., 34, L19803, https://doi.org/10.1029/2007GL030135, 2007.
Yin, Z., Ansmann, A., Baars, H., Seifert, P., Engelmann, R., Radenz, M., Jimenez, C., Herzog, A., Ohneiser, K., Hanbuch, K., Blarel, L., Goloub, P., Dubois, G., Victori, S., and Maupin, F.: Aerosol measurements with a shipborne Sun–sky–lunar photometer and collocated multiwavelength Raman polarization lidar over the Atlantic Ocean, Atmos. Meas. Tech., 12, 5685–5698, https://doi.org/10.5194/amt-12-5685-2019, 2019.
Yin, Z., Yi, F., He, Y., Liu, D., Yu, C., and Zhang, Y.: Asian dust impacts on heterogeneous ice formation at Wuhan based on polarization lidar measurements, Atmos. Environ., 246, 118166, https://doi.org/10.1016/j.atmosenv.2020.118166, 2021.
Yu, H., Tan, Q., Zhou, L., Zhou, Y., Bian, H., Chin, M., Ryder, C. L., Levy, R. C., Pradhan, Y., Shi, Y., Song, Q., Zhang, Z., Colarco, P. R., Kim, D., Remer, L. A., Yuan, T., Mayol-Bracero, O., and Holben, B. N.: Observation and modeling of the historic “Godzilla” African dust intrusion into the Caribbean Basin and the southern US in June 2020, Atmos. Chem. Phys., 21, 12359–12383, https://doi.org/10.5194/acp-21-12359-2021, 2021.
Zhang, C., Wu, Z., Chen, J., Chen, J., Tang, L., Zhu, W., Pei, X., Chen, S., Tian, P., Guo, S., Zeng, L., Hu, M., and Kanji, Z. A.: Ice-nucleating particles from multiple aerosol sources in the urban environment of Beijing under mixed-phase cloud conditions, Atmos. Chem. Phys., 22, 7539–7556, https://doi.org/10.5194/acp-22-7539-2022, 2022.
Zhao, X., Huang, K., Fu, J. S., and Abdullaev, S. F.: Long-range transport of Asian dust to the Arctic: identification of transport pathways, evolution of aerosol optical properties, and impact assessment on surface albedo changes, Atmos. Chem. Phys., 22, 10389–10407, https://doi.org/10.5194/acp-22-10389-2022, 2022.