the Creative Commons Attribution 4.0 License.
the Creative Commons Attribution 4.0 License.
 | 21 Apr 2023
Near-real-time detection of unexpected atmospheric events using principal component analysis on the Infrared Atmospheric Sounding Interferometer (IASI) radiances
Adrien Vu Van
Anne Boynard
Pascal Prunet
Dominique Jolivet
Olivier Lezeaux
Patrice Henry
Claude Camy-Peyret
Lieven Clarisse
Bruno Franco
Pierre-François Coheur
Cathy Clerbaux
The three Infrared Atmospheric Sounding Interferometer (IASI) instruments on board the Metop family of satellites have been sounding the atmospheric composition since 2006. More than 30 atmospheric gases can be measured from the IASI radiance spectra, allowing the improvement of weather forecasting and the monitoring of atmospheric chemistry and climate variables.
The early detection of extreme events such as fires, pollution episodes, volcanic eruptions, or industrial releases is key to take safety measures to protect the inhabitants and the environment in the impacted areas. With its near-real-time observations and good horizontal coverage, IASI can contribute to the series of monitoring systems for the systematic and continuous detection of exceptional atmospheric events in order to support operational decisions.
In this paper, we describe a new approach to the near-real-time detection and characterization of unexpected events, which relies on the principal component analysis (PCA) of IASI radiance spectra. By analyzing both the IASI raw and compressed spectra, we applied a PCA-granule-based method on various past, well-documented extreme events such as volcanic eruptions, fires, anthropogenic pollution, and industrial accidents. We demonstrate that the method is well suited to the detection of spectral signatures for reactive and weakly absorbing gases, even for sporadic events. Consistent long-term records are also generated for fire and volcanic events from the available IASI/Metop-B data record.
The method is running continuously, delivering email alerts on a routine basis, using the near-real-time IASI L1C radiance data. It is planned to be used as an online tool for the early and automatic detection of extreme events, which was not done before.
- Article
(13157 KB) - Full-text XML
- BibTeX
- EndNote


Atmospheric composition is changing fast locally and globally, under combined natural and anthropogenic influences. Fire activity and local urban pollution are likely to increase in a warming climate (Hart et al., 2022). With their potential consequences on society and health, monitoring the events that impact atmospheric composition becomes increasingly important.
Since the end of 2006, the Infrared Atmospheric Sounding Interferometer (IASI) mission has been probing the troposphere from satellites to monitor the atmospheric composition globally on board three successive Metop satellites (Clerbaux et al., 2009). Observation records and trends are available for several infrared absorbing species, such as methane (CH4; García et al., 2018), carbon monoxide (CO; George et al., 2009), ammonia (NH3; Van Damme et al., 2021), ozone (O3; Dufour et al., 2018; Wespes et al., 2019), and dust (Capelle et al., 2014; Clarisse et al., 2019). As the first goal of this mission is to feed meteorological forecasts using data assimilation, radiance level 1C (L1C) data are received in near-real time, around 2–3 h after the overpass of the satellite. This makes the detection of exceptional events possible, potentially right after they occur, such as large biomass burning fires (Turquety et al., 2009; R'Honi et al., 2013), anthropogenic pollution episodes (Boynard et al., 2014), or volcanic eruptions (Wright et al., 2022). With more than 1.2 × 10⁶ radiance spectra per instrument per day, the search for local extreme events in near-real time is not straightforward. A limitation is also associated with the lack of data when clouds are present in the field of view, as the usual retrieval algorithms fail to properly derive atmospheric concentrations for trace gases. Cloudy data are hence filtered.
Soon after the launch of the first IASI instrument, it was suggested to use the principal component analysis (PCA) method to reduce data volumes by reconstructing the radiances using only the leading eigenvectors (Matricardi, 2010). This compression not only allows us to heavily decrease the data volume but also to ease the data dissemination. Now available through the EUMETSAT (EUropean organisation for the exploitation of METeorological SATellites) Advanced Retransmission Service (EARS-IASI), the PCA method allows meteorological centers to directly assimilate the principal components (Collard et al., 2010; Matricardi and McNally, 2014; Guedj et al., 2015). It was also demonstrated that using reconstructed IASI radiance results in a substantial reduction in the random instrument noise for the analysis of trace gases such as sulfur dioxide (SO2) or NH3 (Atkinson et al., 2010). However, it was decided to continue the distribution of the entire radiance spectra (8461 spectral channels), as one of the concerns in the use of the PCA method for atmospheric chemistry studies was the detection of spectral features associated with minor trace gases linked with rare events in the reconstructed spectra. Examples are volcanic eruptions, which all differ in terms of gas and type of ash emitted, and hence not enough representative cases were available in the training set. The same holds for biomass burning fires releasing different amounts of specific species, depending on the type of vegetation burned. With the advent of the second and third IASI instrument, together with the improvement of retrieval algorithms over time, a number of short- and long-lived trace gases were identified in the IASI spectra up- or downwind of strong emission sources (Clarisse et al., 2011; De Longueville et al., 2021).
This paper describes the potential of the PCA applied on the IASI L1C (apodized radiance) data for the automatic, near-real-time detection and characterization of exceptional events. The paper is organized as follows: Sect. 2 describes the IASI instrument and the dataset used in this study. Section 3 describes the PCA method. In Sect. 4, an innovative approach based on the PCA method and IASI data granules is presented, which allows the spectral characterization of species in near-real time. In Sect. 5, different case studies of exceptional past events are discussed, such as volcanic, fire, and anthropogenic pollution episodes, along with industrial accidents, detected by IASI/Metop-A and Metop-B. Finally, conclusions are given in Sect. 6.
IASI is a Fourier transform infrared spectrometer, which records the thermal infrared (TIR) radiation emitted by the Earth and the atmosphere, between 645 and 2760 cm−1, with 8461 channels sampled every 0.25 cm−1 and a spectral resolution of 0.5 cm−1. An example of IASI spectrum along with the absorption band of several species is illustrated in Fig. 1.
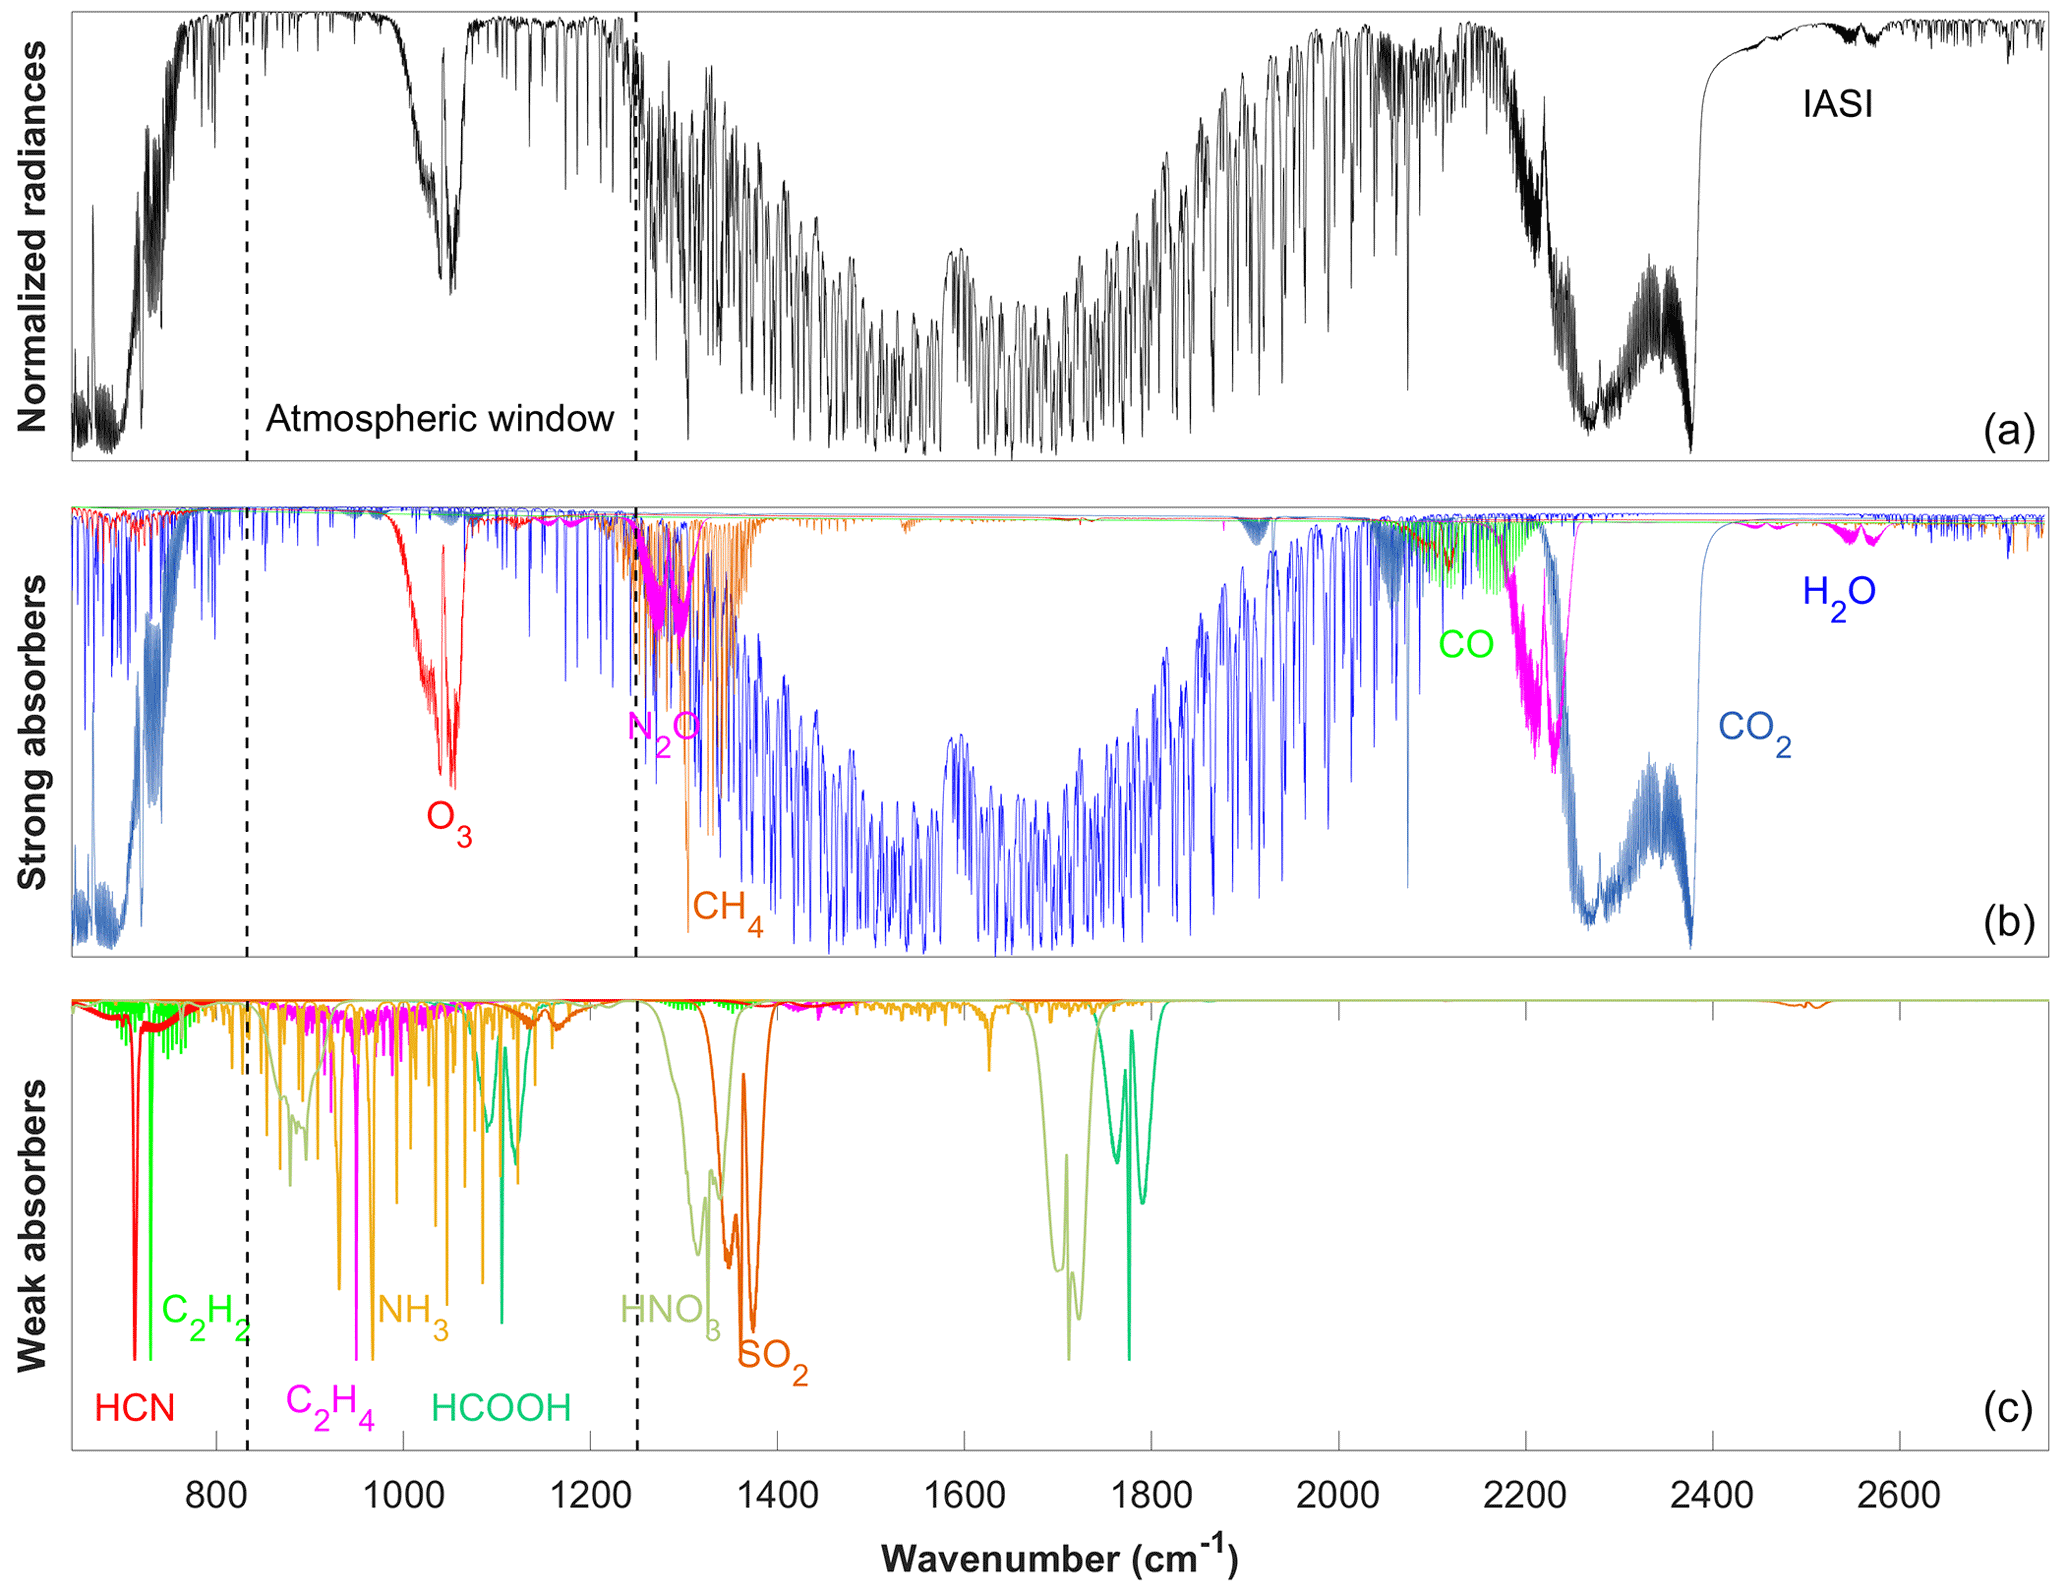
Figure 1(a) Example of IASI spectrum. (b, c) Radiative transfer simulations for the main and weaker infrared absorbers, respectively.
In this work, IASI-A and IASI-B are used as a combined dataset. The IASI-A dataset is used for the study of events before the launch of IASI-B and for creating the PCA training database (described hereafter), and the IASI-B complete dataset is used for data after 2013 to the present. The two datasets have been shown to be highly consistent, with no significant drifts over time (García et al., 2016).
Each IASI instrument provides more than 1.2 ×10⁶ spectra per day. IASI L1C data are disseminated by EUMETSAT in 3 min files (hereafter called a granule) less than 3 h after each overpass. Each granule contains 22 or 23 IASI scan lines, with 120 pixels per line. With a wide swath width of ∼ 2200 km, global observations are provided twice a day, at 09:30 and 21:30 LT. IASI has an instantaneous field of view (FOV) at nadir, with a spatial resolution of 50 km × 50 km, composed of 2 × 2 circular pixels (IFOV), each corresponding to a 12 km diameter footprint on the ground at nadir (Clerbaux et al., 2009).
The atmospheric concentrations of some species are routinely retrieved from the spectral signatures (George et al., 2009; Clarisse et al., 2011; Van Damme et al., 2014) and distributed through the AERIS database (http://iasi.aeris-data.fr, last access: 19 April 2023). Some exceptional events have been studied in detail, such as the 2010 Russian fires (R'honi et al., 2013), pollution in the North China Plain (Boynard et al., 2014), and SO2 anthropogenic pollution (Bauduin et al., 2014, 2016).
3.1 Basic concepts
The PCA method for high spectral resolution sounders, such as IASI, is described in Atkinson et al. (2008). This method is well suited to efficiently represent the amount of information contained in the 8641 IASI channels. It relies on the use of a dataset of thousands of spectra representing the full range of atmospheric conditions from which the principal components are calculated – the so-called training database.
One considers an ensemble of n IASI radiance spectra y of dimension m (where m is the number of channels, and n is the number of observations). Let us denote as the mean and Sϵ(m×m) as the covariance of the normalized ensemble of spectra. N is the noise normalization matrix and is defined as the square root of Sy(m×m), which is the instrument noise covariance matrix associated with the IASI spectra.
The PCA is based on the eigenvalue decomposition of the matrix Sϵ, as follows:
where E is the matrix m × m of eigenvectors and Λ the diagonal matrix of their associated eigenvalues.
The representation of a measured spectrum y in the eigenspace E is obtained by the following:
p (dimension m) is the vector of the principal component scores.
The analysis consists of representing the multidimensional IASI spectra in a lower-dimensional space, which accounts for most of the variance seen in the data. This space is spanned by a truncated set of the eigenvectors of the data covariance matrix. By noise-normalizing the spectra prior to the application of the PCA, the ability to fit the data is enhanced by avoiding giving too much weight to variance caused by noise. Giving m∗ the number of the most significant eigenvectors of Sϵ, one can represent the spectrum in the eigenspace with a truncated vector of principal component scores, p∗, with the rank m∗ (). p∗ is thus a compressed representation of y. The reconstructed spectrum, (dimension m), is given by the following:
where E∗ is the matrix of the m∗ first eigenvectors or principal components. We define the noise-normalized residual vector r (dimension m) of the reconstruction with the following:
By definition, if m∗ is taken equal to m, then , and the residual is the null vector. In nominal cases, if the truncation rank is carefully chosen, then r essentially contains noise. Several techniques exist to estimate m∗ in order to keep the essential part of the atmospheric signal and to remove the eigenvectors containing mainly the measurement noise (e.g., Antonelli et al., 2004; Atkinson et al., 2010). The individual components of vector r are used later to define the reconstruction score, and they are denoted ri.
In the following, the noise-normalized residual, which is calculated for each IASI IFOV, is called the IFOV-residual.
3.2 Construction of the training database
The training set includes spectra observed over different types of atmospheric/surface conditions at different scan angles and for different pixel numbers to ensure that a truncated set of eigenvectors can be adequately used to represent any observed spectrum. Additionally, if the training set is too small, then the specific outcome of the random noise will not be sufficiently uncorrelated and uniform and will therefore have an influence on the computed eigenvectors and eigenvalues. Extensive experience with IASI spectra from EUMETSAT (Hultberg, 2009; https://www.eumetsat.int/media/8306, last access: 19 April 2023) and additional experiments with different dataset sizes show that a number of about 70 000 spectra is a reasonable lower limit. For this study, around 120 000 IASI/Metop-A L1C spectra were selected during a full year (which was chosen as a nominal year to avoid the excessive occurrence of extreme events such fires and volcanoes) on the global scale. The database contains spectra associated with a good quality flag in order to keep only reliable data, acquired indifferently during the day and the night, over land and sea, regardless of the cloud cover. For each month of the year 2013, spectra were selected every 5 d (1, 6, 11, 16, 21, and 26 d of each month). To avoid over-representing high latitudes because of the large swath of IASI (∼ 2200 km) and frequent overpasses over this area with the polar orbiting satellites, the following method was applied:
-
between 90 and 75∘ only one spectrum is selected,
-
between 75 and 60∘, two spectra are selected,
-
between 60 and 45∘, three spectra are selected,
-
between 45 and 30∘, four spectra are selected,
-
between 30 and 15∘, five spectra are selected, and
-
between 15 and 0∘ six spectra are selected.
To reach a sufficient but reasonable number of IASI spectra/IFOVs (1.3 × 10⁶ spectra per day; 4.7 × 10⁸ per year), 120 000 IFOVs for year 2013 were randomly chosen to represent all atmospheric/surface situations (air masses, land/sea, day/night, and clear/cloudy) and acquisition conditions (IASI scan mirror position and pixel number).
3.3 Number of eigenvectors
Several techniques exist to estimate m∗ in order to keep the essential part of the atmospheric signal and to remove the eigenvectors containing mainly the measurement noise. Antonelli et al. (2004) define a criterion based on the spectral root mean square (rms) reconstruction residuals, finding the optimal truncation rank when this value approaches the spectral rms of the instrument noise. Other methods directly test the behavior of the reconstruction score as a function of the truncation rank by looking at the second derivative of the reconstruction score as a function of the truncation rank (e.g., Hultberg, 2009) or by plotting the principal component score (p) spatial correlation as a function of the eigenvector rank (Atkinson et al., 2009). In this study, the estimation of m∗ is based on the analysis of the eigenvalues. The eigenvalues (sorted in descending order) quantify the variability explained by the corresponding eigenvectors, and the optimal number of eigenvectors needed to reproduce the signal in the raw radiances can be determined by analyzing their magnitude and behavior. In the present implementation of the PCA method, we process the full IASI spectrum and use a simple method for selecting the truncation rank. The plot of the eigenvalues was examined, and principal components (PCs) were selected up to the point where the slope of the curve stabilized. This leads to choosing the first 150 eigenvectors, as done in Atkinson et al. (2010). Sensitivity tests have been performed to test the impact of using different values (from 120 to 250) on the reconstructed scores obtained from several atmospheric events (fires and volcano cases are discussed in the next sections) and confirm this value.
4.1 Granule maxima and minima
The near-real-time detection of exceptional events is performed on the IASI granule. The choice of applying the method to the granule is convenient for the near-real-time aspect, as it represents 3 min of IASI data, which are received every 1–2 h by the antenna.
Each granule contains ∼ 2700 radiance spectra from which the corresponding IFOV-residuals are computed, based on the IASI-PCA method. For each granule, the largest positive and negative residual value for each spectral channel is recorded in two arrays, which are hereafter called granule maxima (GMA) and granule minima (GMI). GMI and GMA are defined as the pseudo-residuals of dimension 8461 (the number of radiance channels) and represent the spectral envelope of the statistics of residuals over the granule. Physically, the GMI (GMA) pseudo-residual is associated with reconstruction errors in spectral absorption (emission) lines. Since the method is based on the granule extrema (GMI and GMA), the method is therefore called IASI-PCA-GE, where GE stands for granule extrema. It is important to note that these pseudo-residuals associated with a granule are different from the individual IFOV-residual associated with each IFOV.
Figure 2 illustrates an example of GMA and GMI pseudo-residuals for an intense fire event that occurred in Australia on 1 January 2020. The GMI pseudo-residual (bottom panel) is characterized by detectable spectral features associated with a poor reconstruction around 700, 950, 1100, or 2100 cm−1. Using a spectroscopic database allows us to associate some of these strong peaks with the contributions of different atmospheric components (see Sect. 5 for the identification of the molecules). Similar spectral features can be seen in the GMA pseudo-residual (top panel), albeit in the emissions and less intense.
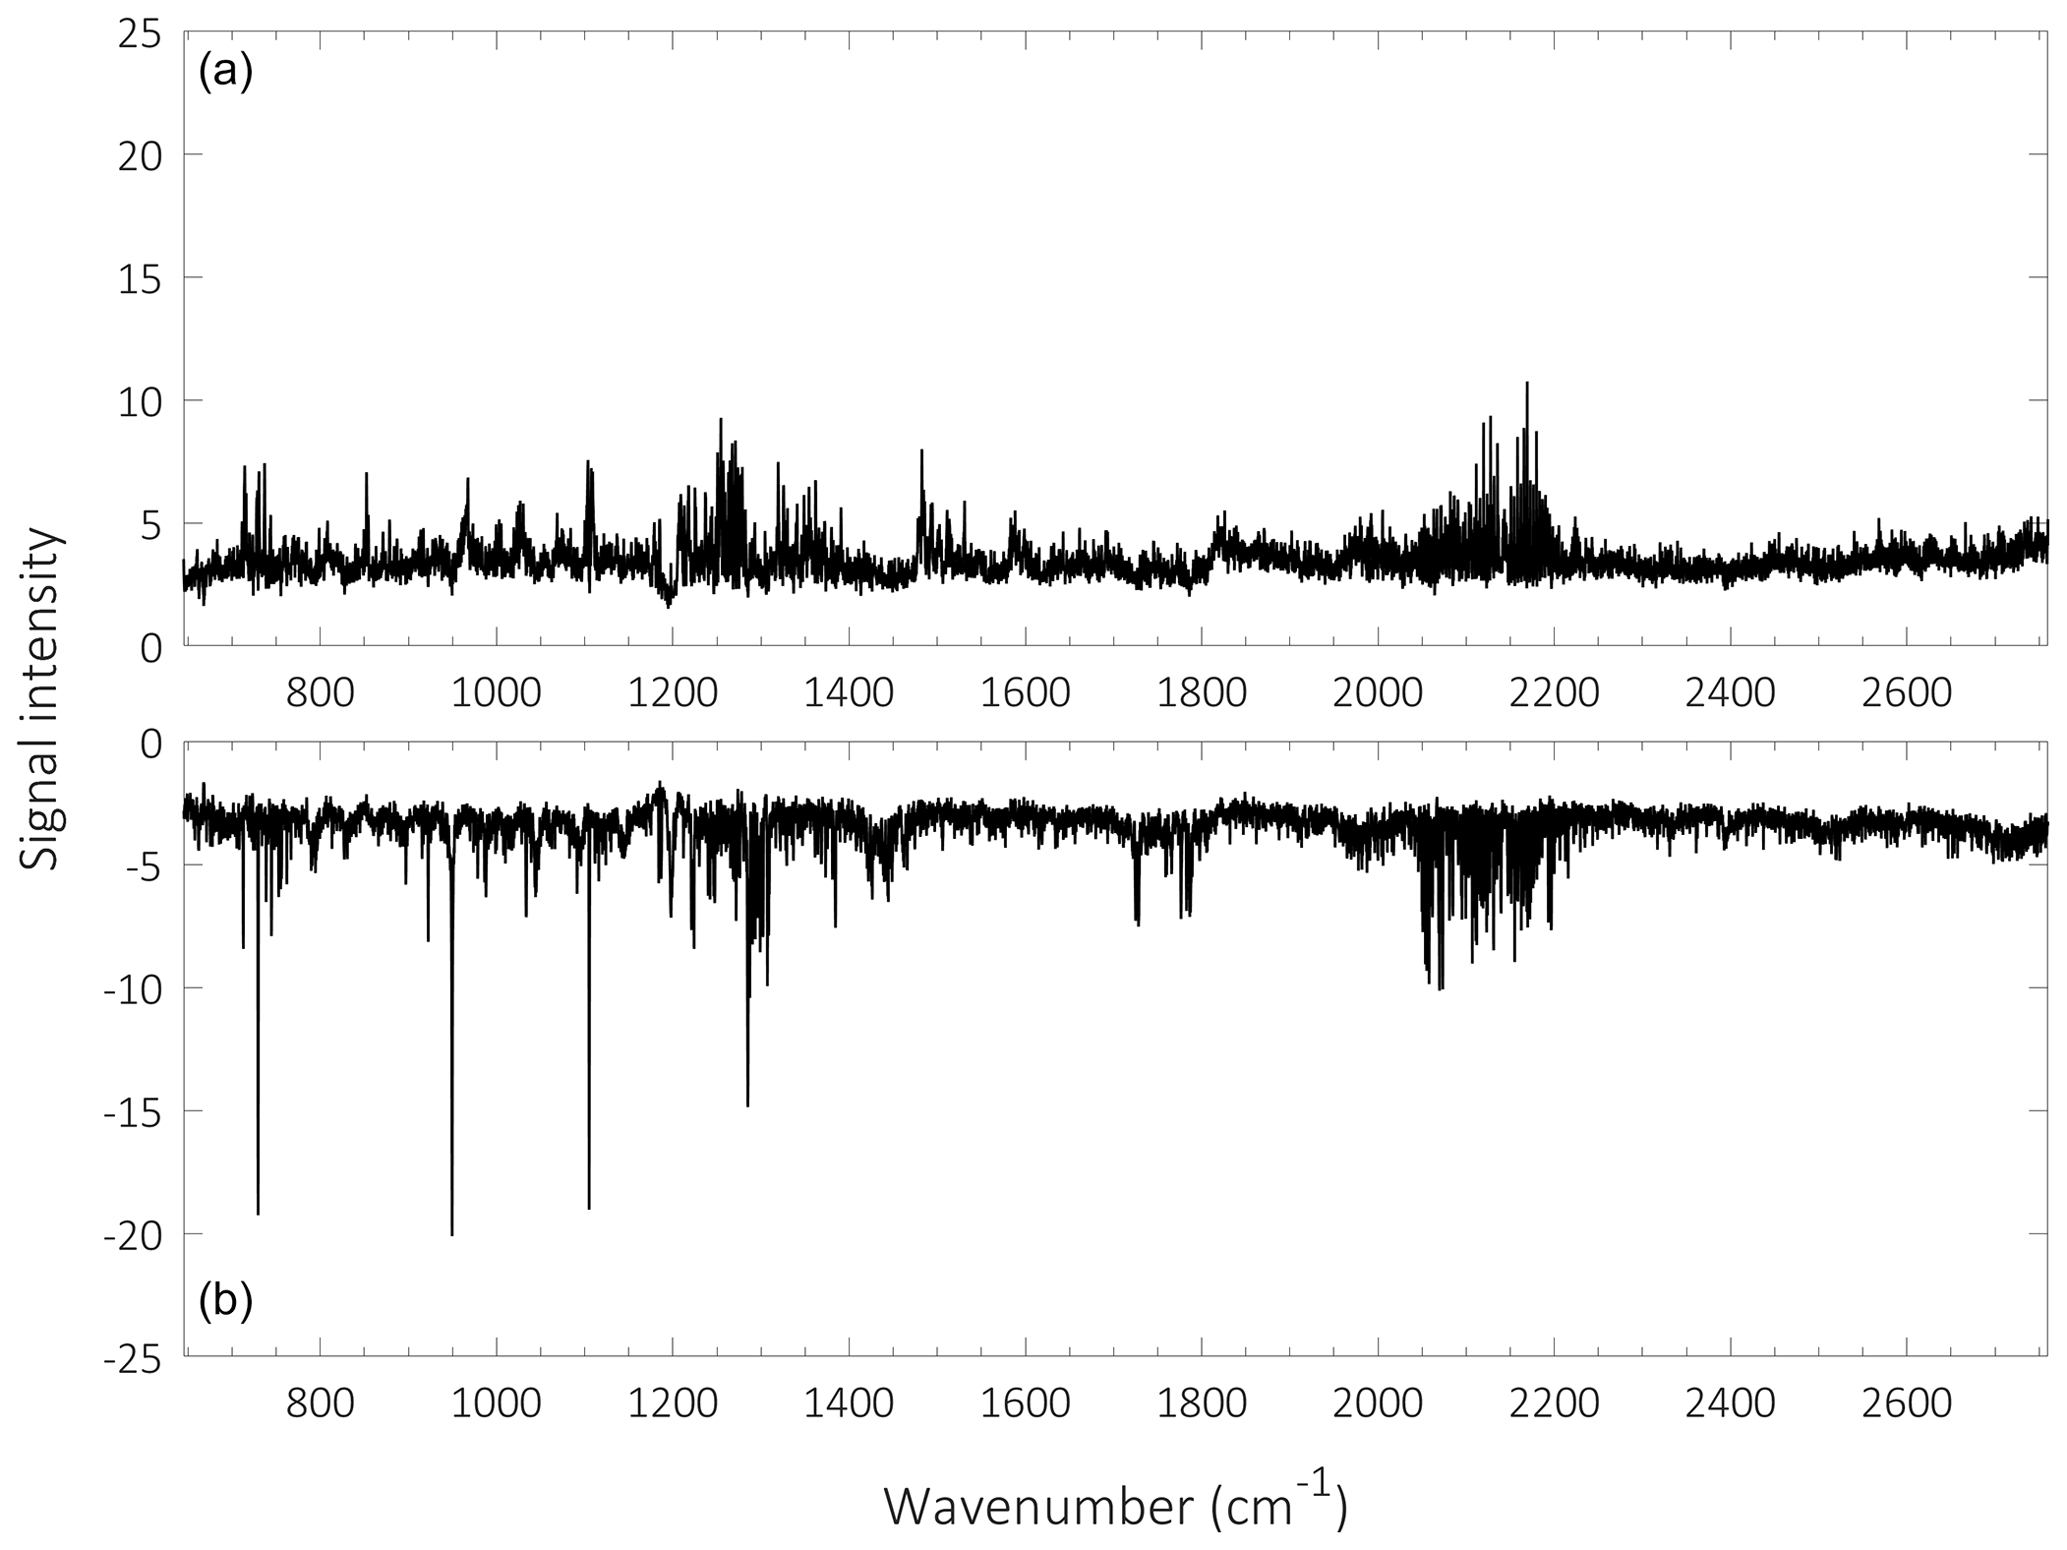
Figure 2Granule maxima (GMA) (a) and granule minima (GMI) (b) pseudo-residuals obtained from a granule of IASI/Metop-B L1C data on 1 January 2020 over Australia.
4.2 Detection thresholds
Two detection thresholds are defined in order to select (1) the granules associated with outliers only (which allows us to gain computation time) and (2) the IFOV-residuals associated with reconstruction errors. For the definition of the detection thresholds, a dataset of 43 000 IASI/Metop-B granules (21 500 granules for daytime and 21 500 for nighttime) containing outlier and regular spectra and chosen randomly on the first of each month between April 2013 and April 2021 is used. Note that this dataset differs from that generated for the principal component calculation, as the detection method is applied on a granule basis. From this dataset, 21 500 GMI and 21 500 GMA pseudo-residuals are calculated for both day- and nighttime conditions.
Figure 3 shows the statistical distribution of the largest minimum and maximum values for each of the 43 000 GMI/GMA pseudo-residuals for all channels. The lower and upper limit of the blue box represents the 25th and the 75th percentiles in the data, respectively. The red line represents the median. The black lines represent upper adjacent value (UAV) and lower adjacent value (LAV), and the red crosses have been considered to be outliers in a first analysis of the dataset. Using the UAV and LAV as thresholds was observed to be too restrictive. After several tests, a decision was made to use the 25th percentile of the data to keep the granules associated with potential outliers (F1 threshold). All granules associated with GMA or GMI minimum and maximum values (in absolute values) larger than the 25th percentile of the datasets are then selected, thus avoiding the need to process granules without interesting anomalies.
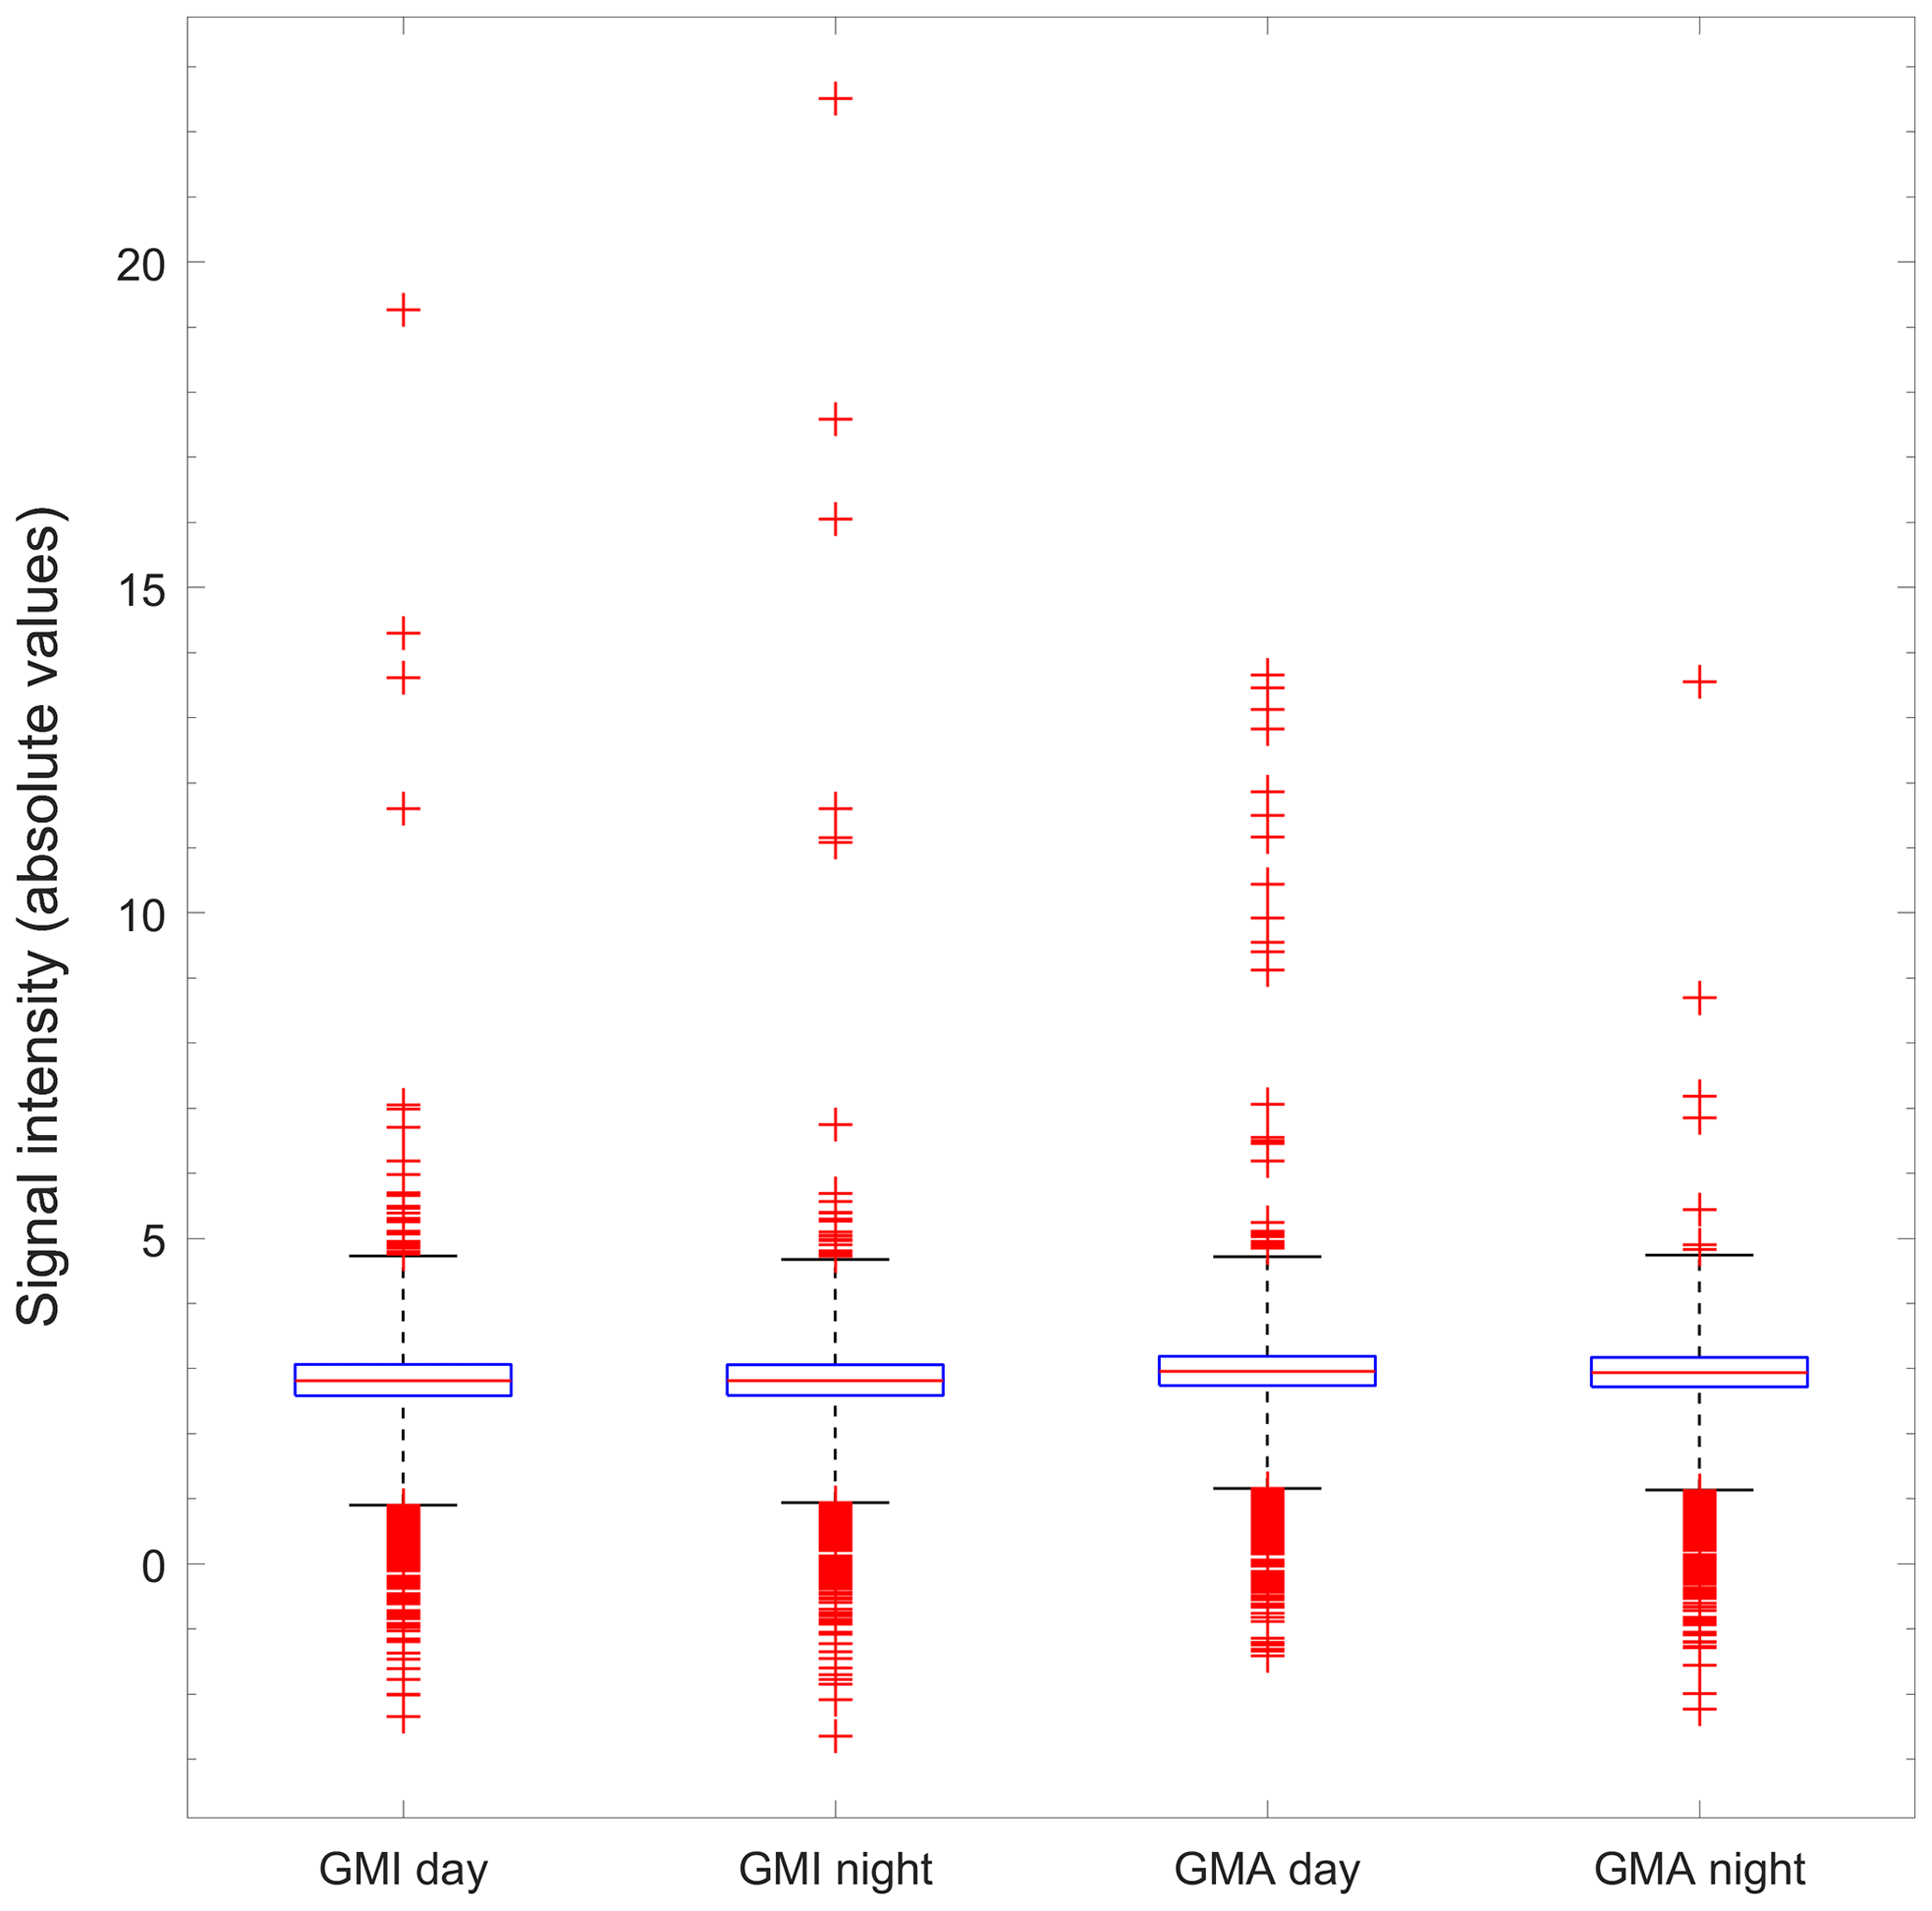
Figure 3Distribution of normalized GMI and GMA extrema in absolute values calculated from 43 000 granules (21 500 for daytime conditions and 21 500 for nighttime conditions). The lower and upper limit of the blue box represents the 25th percentile and the 75th percentile in the data. The red line represents the median. The black lines represent the upper adjacent value (UAV) and lower adjacent value (LAV), and the red crosses are considered to be outliers in the dataset. The dashed magenta line represents the F1 threshold.
Table 1Signal intensity thresholds (F2) for several species for day- and nighttime conditions obtained from the 99th percentile of the GMA or GMI pseudo-residuals. The thresholds are defined based on the more intense peaks associated with each molecule. Since IASI-PCA sensitivity is generally lower during nighttime than during daytime, which is mainly due to thermal contrast, different thresholds for day- and nighttime conditions were defined.
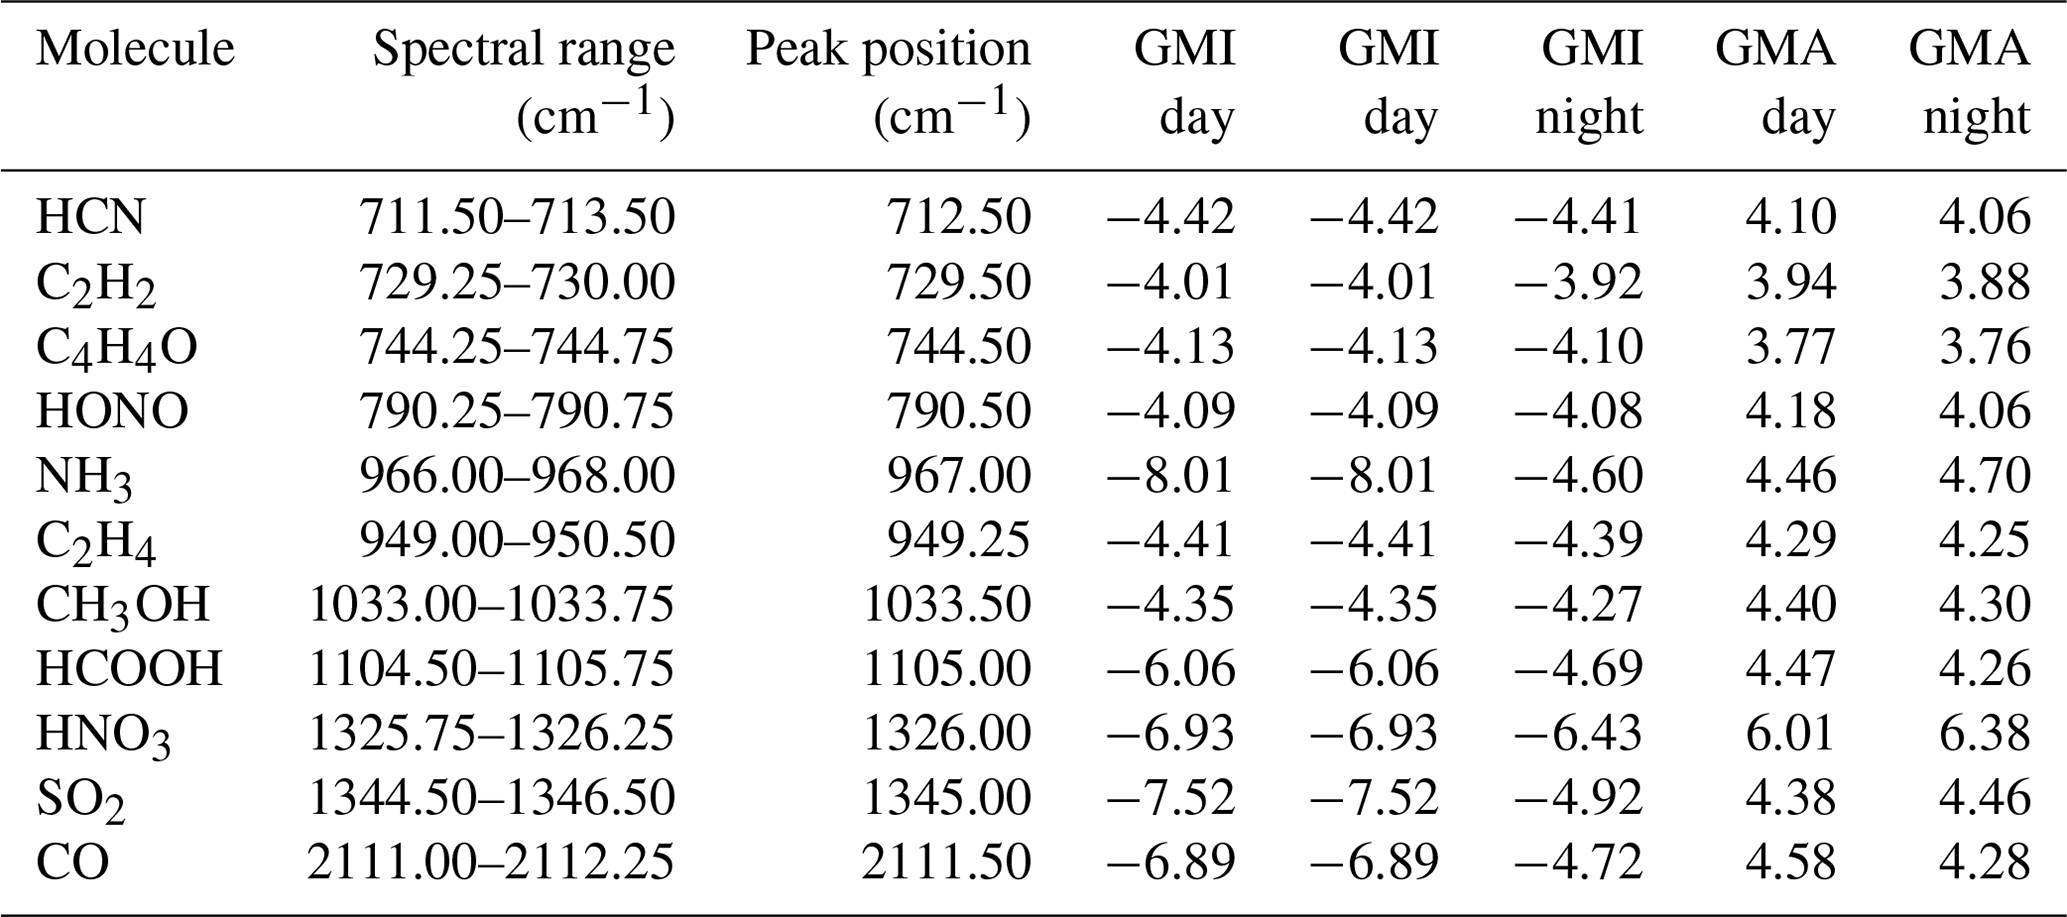
A second threshold (F2 threshold) was defined for each spectral channel, based on the 99th percentile value of the GMI and GMA pseudo-residuals calculated from the 43 000 granules (21 500 for daytime conditions and 21 500 for nighttime conditions). This F2 threshold is used in the processing of each granule selected after applying the F1 threshold. It is applied only on channels of interest that are associated with a strong absorption of a molecule, which are identified in Table 1. For those channels, all IFOV-residuals associated with values larger than the F2 threshold values are selected. The choice of the 99th percentile as the threshold value is the result of extensive tests performed on both the ensemble of statistically representative scenes (the 43 000 granules) and on specific atmospheric situations of fires and volcanoes. It corresponds to the empirical compromise allowing (1) a reasonable rate of detection of extreme events (below 4 %) for the processed scenes, (2) the minimization of false positive detections in the statistically representative scenes (false positive detections are empirically identified as spatially noisy i.e., isolated IFOVs), and (3) the unambiguous detection of well-identified fire and volcanic events. Values of the F2 thresholds used for the channels of interest are provided in Table 1. In the detection processing for each selected IFOV-residual, the spectral channel associated with the detection (and thus the corresponding spectral interval and associated molecule as defined in Table 1) is recorded, along with the corresponding IFOV-residual value, the latitude, and the longitude. This step allows us to localize (IFOV latitude and longitude) and characterize (spectral position and corresponding IFOV-residual value) the outliers.
4.3 Towards a detection of extreme events in near-real time
Right after the reception of each IASI 3 min granule, the two GMA/GMI pseudo-residuals, in addition to other statistics of the residual over the granule, are calculated. Then the two different thresholds defined in Sect. 4.2 are applied to the GMA/GMI pseudo-residuals in order to localize the pixels potentially associated with an event and the associated channels. In the case of anomalies (i.e., threshold overrun) in the GMA/GMI pseudo-residuals, an alert is set up along with the targeted channels identified. The corresponding absorbing species with their spectral range are identified in the following, together with the associated peak position of the associated channel, and the spatial distribution map of the detected pixels in the 3 min granule is produced. This allows us to visualize and further study exceptional events. The IASI-PCA-GE method was validated for past and documented events, four of which are described hereafter. It is now running continuously, delivering email alerts on a routine basis, using the near-real-time IASI L1C radiance data. Most of these alerts are associated with fires and volcanic eruptions.
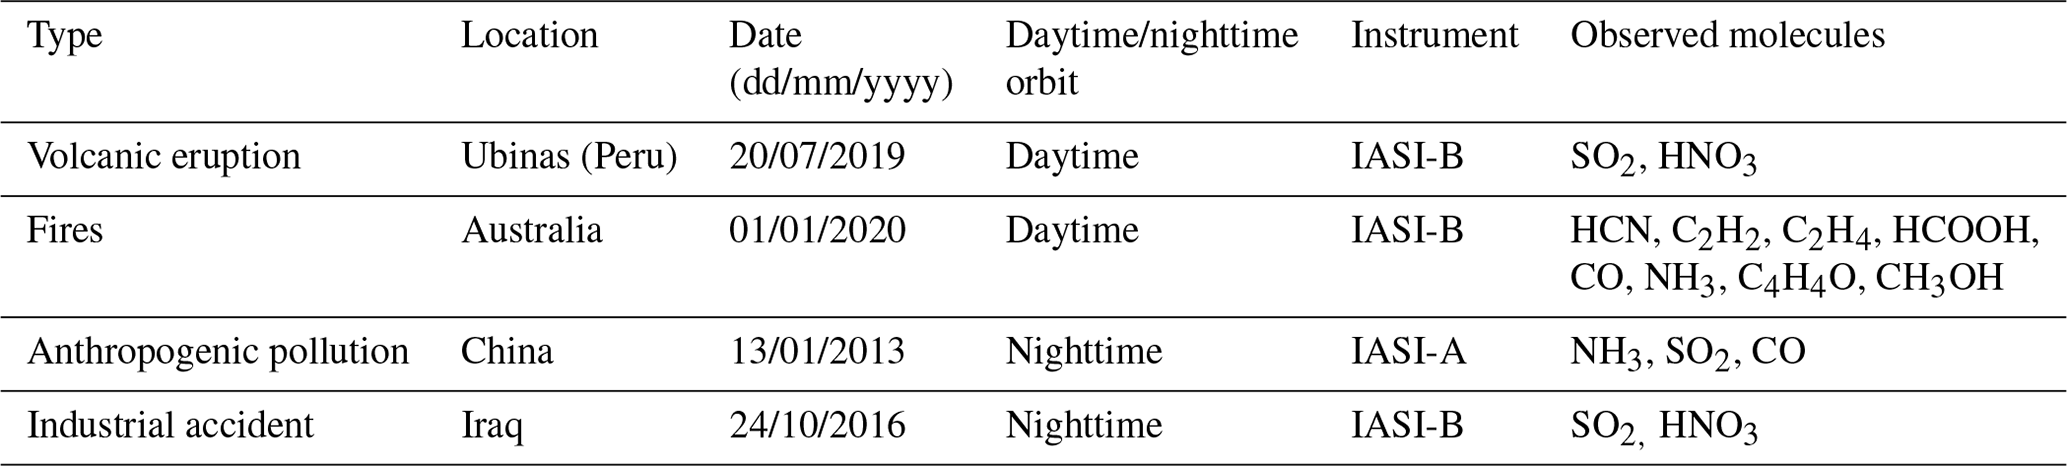
This section presents a demonstration of the IASI-PCA-GE method for several past extreme events. The method is applied to IASI/Metop-A and the IASI/Metop-B L1C radiance data. Table 2 gives a brief description of the case studies presented hereafter.
Table 2Brief description of the four case studies analyzed in this section.
For each event, we identify the molecules in the outliers, through an analysis of the residual statistic, in order to assign the spectroscopic feature characteristic of the corresponding species over a granule and applying the IASI-PCA-GE method. We also provide distribution maps to illustrate the spatial distribution of the target event. When available, the maps are compared to the existing retrieved IASI products (CO in Hurtmans et al., 2012; NH3 in Van Damme et al., 2021; CH3OH and HCOOH in Franco et al., 2018; C2H4 in Franco et al., 2022; C2H2 is as yet unpublished; HCN in Rosanka et al., 2021; SO2 in Clarisse et al., 2012).
5.1 Volcanic eruption events
Volcanic eruptions have a major impact on the atmospheric composition. SO2, which has several strong absorption bands in the TIR spectral range, is the most common molecule observed in the volcanic plume (Clarisse et al., 2012). Several other species were previously observed by satellites in volcanic eruptions, such as hydrochloric acid (HCl; Clarisse et al., 2020), hydrogen sulfide (H2S; Clarisse et al., 2011), and sulfuric acid (H2SO4; Ackerman et al., 1994; Karagulian et al., 2010), which can be injected into the stratosphere in the case of a high-altitude eruption (Rose et al., 2006; Millard et al., 2006).
5.1.1 The Ubinas (Peru) case study
The IASI-PCA-GE method was applied to several volcanic eruptions. Here, we illustrate the findings for the eruption in Ubinas, Peru, on 20 July 2019 (Venzke, 2019). The Instituto Geofísico del Perú (IGP; Geophysics Institute of Peru) mentioned that seismic activity suddenly increased during June 2019 and remained high during July 2019, with important ash emissions causing the evacuation of the population in some areas affected by ashfall. Figure 4 illustrates the normalized GMI pseudo-residual obtained during this volcanic eruption, which corresponds to a granule taken in the area of the plume during daytime. A large difference between the reconstructed spectra and raw spectra is seen in the SO2 ν3 band around ∼ 1371 cm−1 and ∼ 1377 cm−1, which is in agreement with results of Clarisse et al. (2008, 2012) showing the sensitivity of the ν3 band. Indeed, the peak found at 1371.50 cm−1 is associated with the presence of the SO2 plume in the upper troposphere/lower stratosphere (∼ 14 km; 150 hPa) between 0.5 and 200 DU (saturation; Clarisse et al., 2011). Such detection is expected in this case due to the high quantity of SO2 emitted. It is worth noting that other peaks in the GMI pseudo-residual also show strong absorptions, which were initially associated with HNO3. Even if this constituent has previously been reported in volcanic plumes in some active degassing volcanoes (Mather et al., 2004), peaking in the GMI at ∼ 763, ∼ 879 and ∼ 897, and ∼ 1326 cm−1 associated with ν8, ν5, 2ν9, ν3, and ν2 nitric acid absorption bands, respectively, it has never been observed by remote sensing before. As the analysis of the IASI HNO3 L2 products shows no HNO3 enhancement, further investigations were performed to identify where the signature comes from.
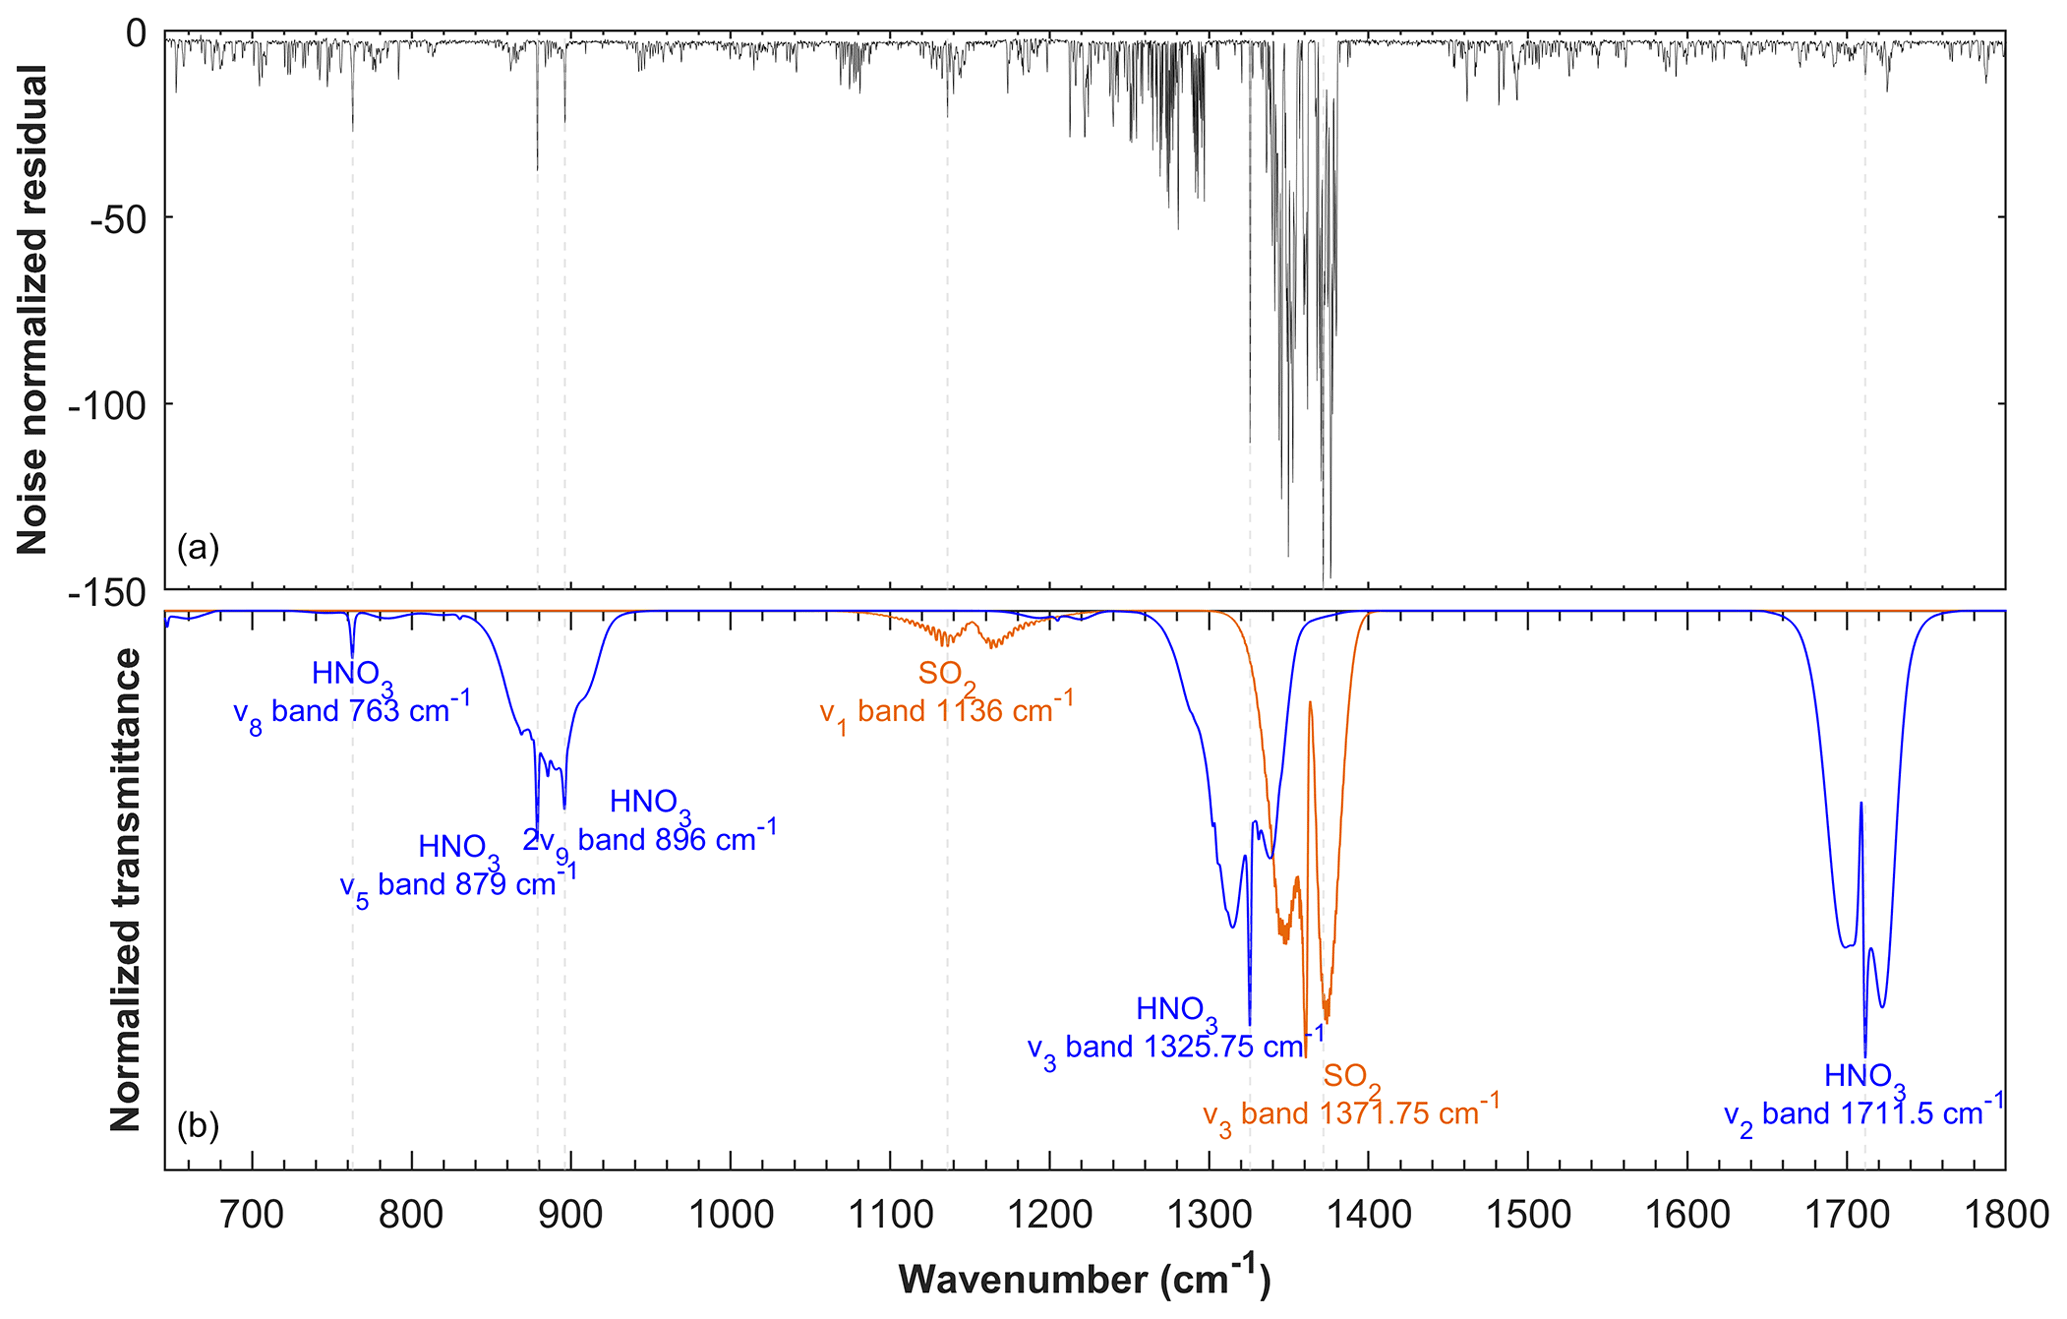
Figure 4(a) Example of GMI pseudo-residual calculated from IASI/Metop-B L1C data during a volcanic eruption in Ubinas, Peru, on 20 July 2019 in the morning (daytime or AM orbit). (b) The HITRAN spectroscopic parameters associated with the absorption of HNO3 and SO2 (Gordon et al., 2017, 2022) are shown in blue and in orange, respectively.
The HNO3 detection by the IASI-PCA-GE method was further investigated by applying the whitening method proposed by De Longueville et al. (2021). The use of a covariance matrix, calculated from a set of IASI spectra, shows similar results to those found with the IASI-PCA-GE method. However, using a covariance matrix excluding the SO2 absorption band, no HNO3 spectral feature was found. This suggests that no nitric acid is present in the plume. The features found in the HNO3 absorption band by the IASI-PCA-GE method is likely related to SO2 features, given that the SO2 ν3 absorption band superimposes with the HNO3 ν3 band.
Furthermore, other spectral signatures remain difficult to characterize in the 1200–1300 cm−1 spectral domain. This spectral range corresponds to the absorption of different volcanic compounds such as ash, aerosols, and other possible volcanic molecules such as H2S or H2SO4 (Karagulian et al., 2010) but is also sensitive to strong H2O absorptions.

Figure 5(a) Spatial distribution of the residual values associated with SO2 IASI-PCA-GE detections, using IASI/Metop-B radiance data recorded on 20 July 2019 in the morning (daytime or AM orbit). (b) SO2 total column retrievals in Dobson units.
After applying the threshold filters defined in Sect. 4.2 to the GMI pseudo-residual, the spatial distribution of the pixels associated with outliers can be mapped. Figure 5 shows a plume of SO2 (left) in southeastern South America, with large signal intensity values reaching around −150 in the center of the plume. The spatial distribution of the retrieved IASI SO2 L2 operational products (right) also shows the plume located in southeastern South America and is in excellent agreement with the SO2 plume detected from the IASI-PCA-GE method.
5.1.2 Volcanic eruption archive for IASI/Metop-B
The time series of the SO2 detections derived from the IASI-PCA-GE method is applied to the IASI/Metop-B global dataset over the 2013–2022 period. Figure 6 shows the comparison of the SO2 IASI-PCA-GE signal intensity with the SO2 hyperspectral range indexes (HRIs) product at 5 km (Bauduin et al., 2016). HRIs at 5 km are chosen because of a good sensitivity around this altitude (Clarisse et al., 2014), compared to the L2 SO2 concentration data that show concentrations above 5 km (likely high-intensity volcanism). Only daily SO2 extrema of both the IASI-PCA-GE method and HRI product are compared. They are spatially co-located and associated with documented volcanic events from the Global Volcanism Program, Smithsonian Institution (https://volcano.si.edu/, last access: 19 April 2023). It is observed that both methods are able to detect not only intense eruptions but also moderate or degassing volcanic events. The largest volcanic eruptions detected during this period for both methods are Calbuco on 22 April 2015, Raikoke on 22 June 2019, and Ubinas on 19 July 2019 (Sennert, 2015, 2019a, b). Furthermore, for all major events (corresponding to 2810 d over 3373 d in total), an excellent correlation between HRIs and IASI-PCA-GE signal intensity (R2 = 0.96) is found between the two datasets.
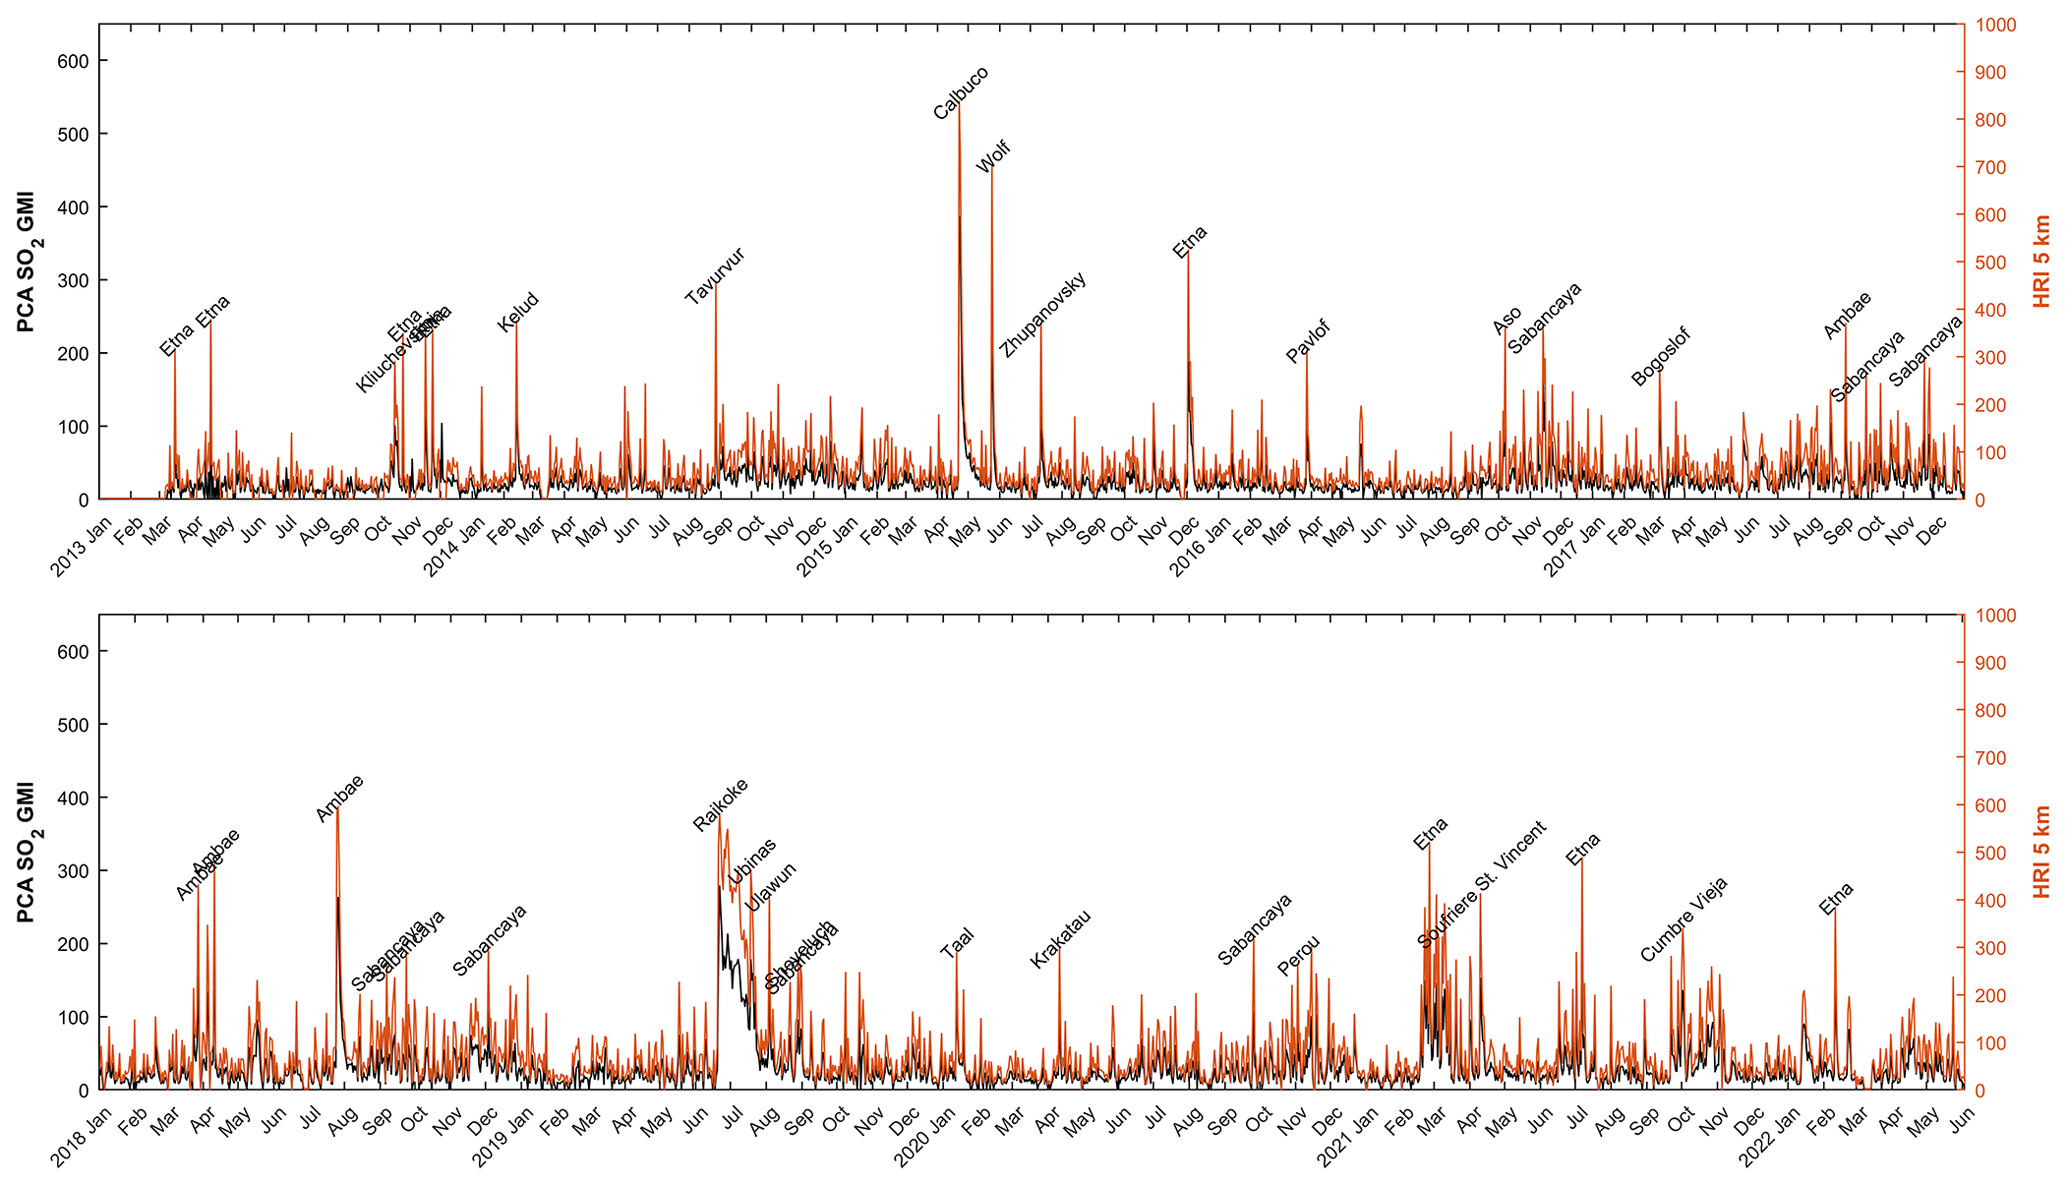
Figure 6Time series of SO2 detections from IASI-PCA-GE method (gray) and the SO2 HRIs at 5 km (orange), based on the IASI/Metop-B L1C data for the 2013–2022 period. Only the daily extrema are shown in the time series.
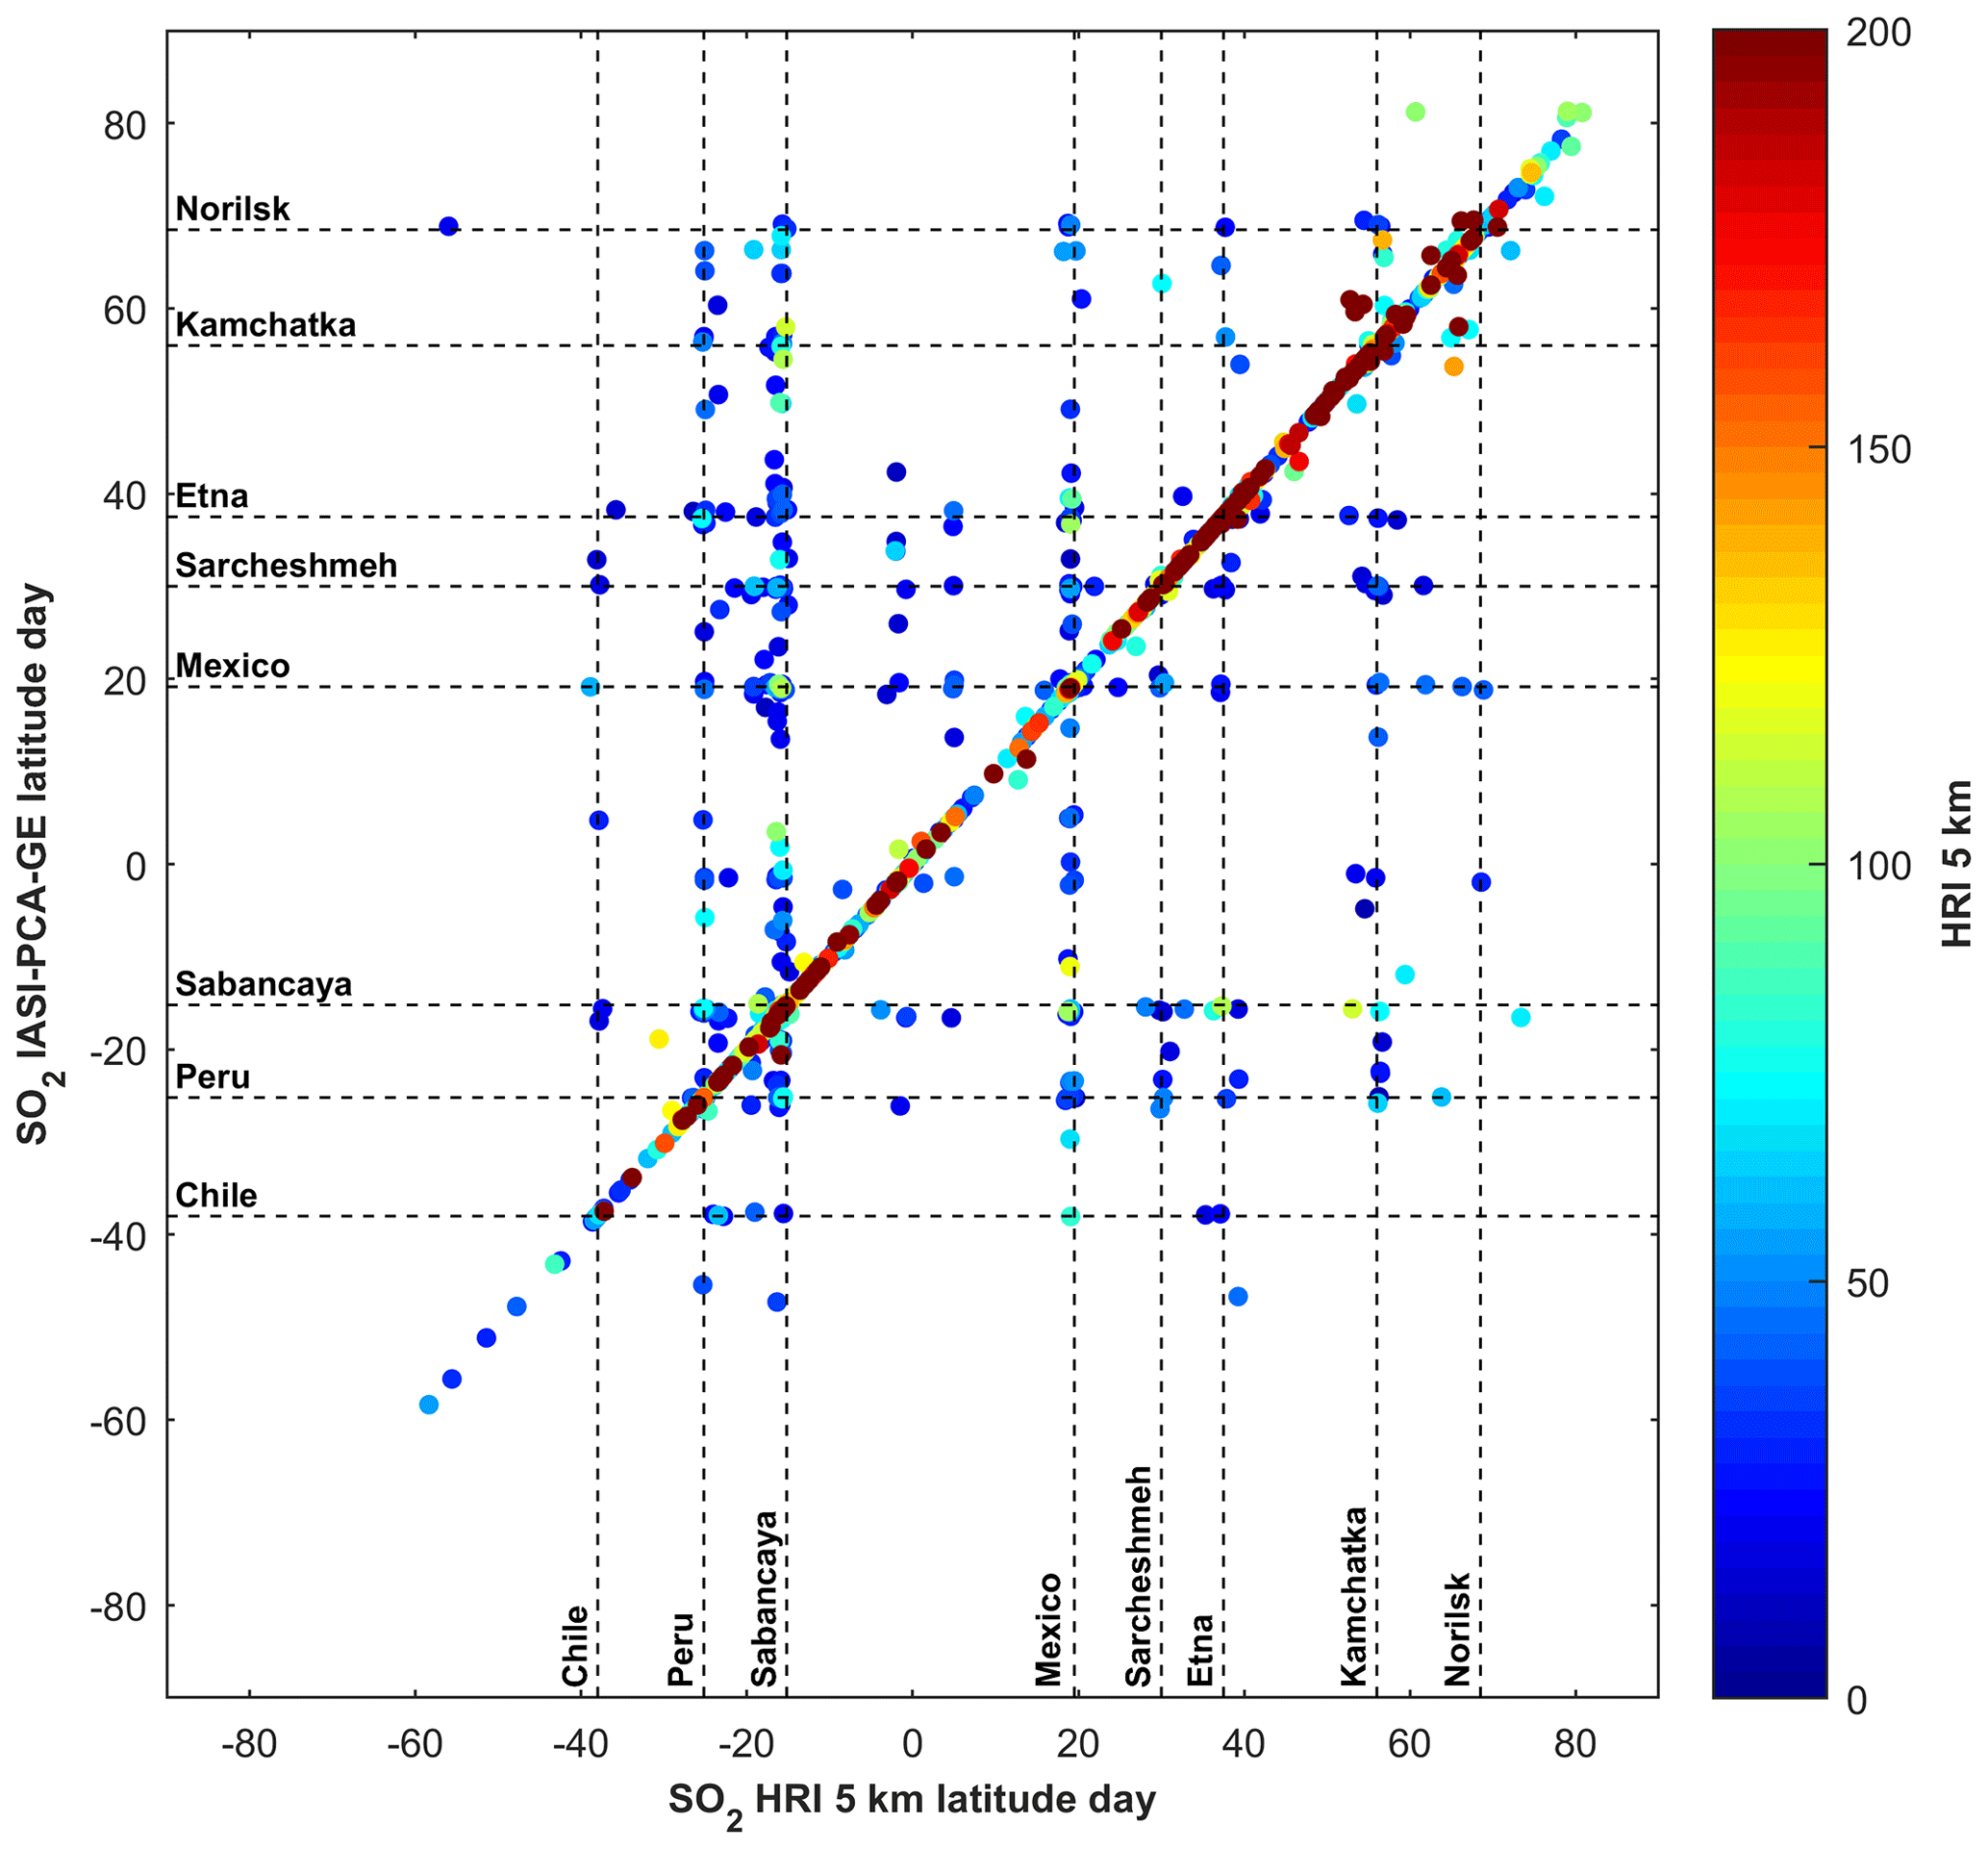
Figure 7Comparison of latitudes corresponding to the daily maxima detected for both the IASI-PCA-GE SO2 signal intensity and HRI product between 2013 and 2022 with IASI-B L1C data during the day. The dashed lines show location discrepancies.
In order to analyze and understand the differences between the two records, the correlation between the latitudes of both datasets shown in Fig. 6 are plotted (see Fig. 7). An excellent location correlation between both HRI and IASI-PCA-GE methods is observed for high-intensity detections. However, some discrepancies are found in the case of low-intensity events, corresponding to commonly active degassing volcanoes.
Some specific latitudes associated with degassing volcanoes, such as Sabancaya (Moussallam et al., 2017), the Vanuatu island arc with Ambae (Bani et al., 2012), Colima and Popocatepetl in Mexico (Varley and Taran, 2003), and the long eruptive Kīlauea volcano (Garcia et al., 2021), respectively, at 15.8∘ S, 15.4∘ S, 19.5∘ N, 19.0∘ N, and 19.4∘ N are illustrated by the horizontal and vertical dashed black lines in Fig. 7. Furthermore, some daily maxima are located around 38∘ S, 37.5∘ N, and 25.2∘ N and are, respectively, related to emissions from Copahue (Reath et al., 2019), Etna (Tamburello et al., 2013; Ganci et al., 2012), and several Chilean volcanoes.
The daily maxima located around 56∘ N have been investigated and found to be associated with Kamchatka degassing volcanoes. Disperse latitudes of IASI-PCA-GE daily maxima are not consistent with the co-registered HRI maxima. These differences between the IASI-PCA-GE and HRI methods can also be explained by the relation between the plume altitude/temperature not being represented in the principal components that will also affect the spectral reconstruction. As a result, the location of daily maxima can be different in the case of low-intensity detections because of the PCA overestimation (or underestimation) of atmospheric anomalies. This also results from the nonlinear relationship between retrieved concentrations and PCA intensities.
It is interesting to note that both IASI-PCA-GE and HRI detections observed at around 30 and 65∘ N are associated with anthropogenic emissions in the region of the Sarcheshmeh Copper Complex, one of the largest industrial mining complexes for copper that is emitting about 789.9 t of SO2 per day (Amirtaimoori et al., 2014), and over the Norilsk city, which is also well known for its mining and smelting industries (Bauduin et al., 2016). That finding illustrates the capacity of both methods to detect industrial emissions.
It is found that the relation between the concentration and signal intensity is not linear, and the PCA-based results cannot be used for an accurate quantification of SO2 concentrations. Indeed, IASI-PCA-GE signals will not only be dependent on the molecule concentration but also on thermal contrast and other surface parameters and atmospheric conditions. This is why discrepancies are found at high latitudes between the location of IASI-PCA-GE and HRI maxima, which are associated with eruptions in the Kamchatka region.
5.2 Fire events
Fires can be a significant source of trace gases and aerosols in the atmosphere, and several species were specifically looked for in fire events, namely CO, NH3, formic acid (HCOOH), acetylene (C2H2), ethylene (C2H4), nitrous acid (HONO), ethane (C2H6), acetonitrile (CH3CN), methanol (CH3OH), peroxyacetyl nitrate (CH3CO(OONO2)), hydrogen cyanide (HCN), formaldehyde (HCHO), glyoxal (CHOCHO), and CH4 (Li et al., 2000; Goode et al., 2000; Sharpe et al., 2004; Coheur et al., 2009; Duflot et al., 2013; R'Honi et al., 2013; Zarzana et al., 2018; De Longueville et al., 2021). The IASI-PCA-GE method was applied to several case studies, but only one is presented here, which was selected during the fire season occurring in Australia in 2019–2020.
5.2.1 The Australia case study
In Australia, fire events known as bushfires occur every year. Coupled with global warming and the lack of rainfall in 2019–2020, the fires were particularly intense, with burned areas covering more than 186 000 km2. It was shown that pyroconvection allowed the plume to reach the lower stratosphere at around 15–16 km (Khaykin et al., 2020). Many species were observed by the Atmospheric Chemistry Experiment Fourier Transform Spectrometer (ACE-FTS) during that episode (e.g., Boone et al., 2020), including CO, C2H6, C2H2, HCN, HCOOH, CH3OH, PAN, acetone (CH3COCH3), and CH3CN.

Figure 8(a) Example of GMI pseudo-residual calculated from IASI/Metop-B L1C data during the intense fire event in Australia on 1 January 2020 in the morning (daytime or AM orbit). (b) The HITRAN spectroscopic parameters associated with the absorption (Gordon et al., 2017, 2022) of different species are shown with colors.
The IASI-PCA-GE method was applied to the IASI/Metop-B L1C data on 1 January 2020. Figure 8 illustrates an example of a normalized GMI pseudo-residual obtained during the Australia fire event. As expected, peaks relative to the CO absorption lines are found in the 2050–2200 cm−1 spectral domain. Other peaks associated with the absorption of molecules are also visible, including HCN, with a peak at 712.50 cm−1, furan (C4H4O) at 744.50 cm−1, C2H2 at 729.50 cm−1, C2H4 at 949.25 cm−1, HCOOH at 1105.00 and 1777.00 cm−1, CH3OH at 1033.50 cm−1, and peaks associated with NH3 at 931.00 and 967.00 cm−1.
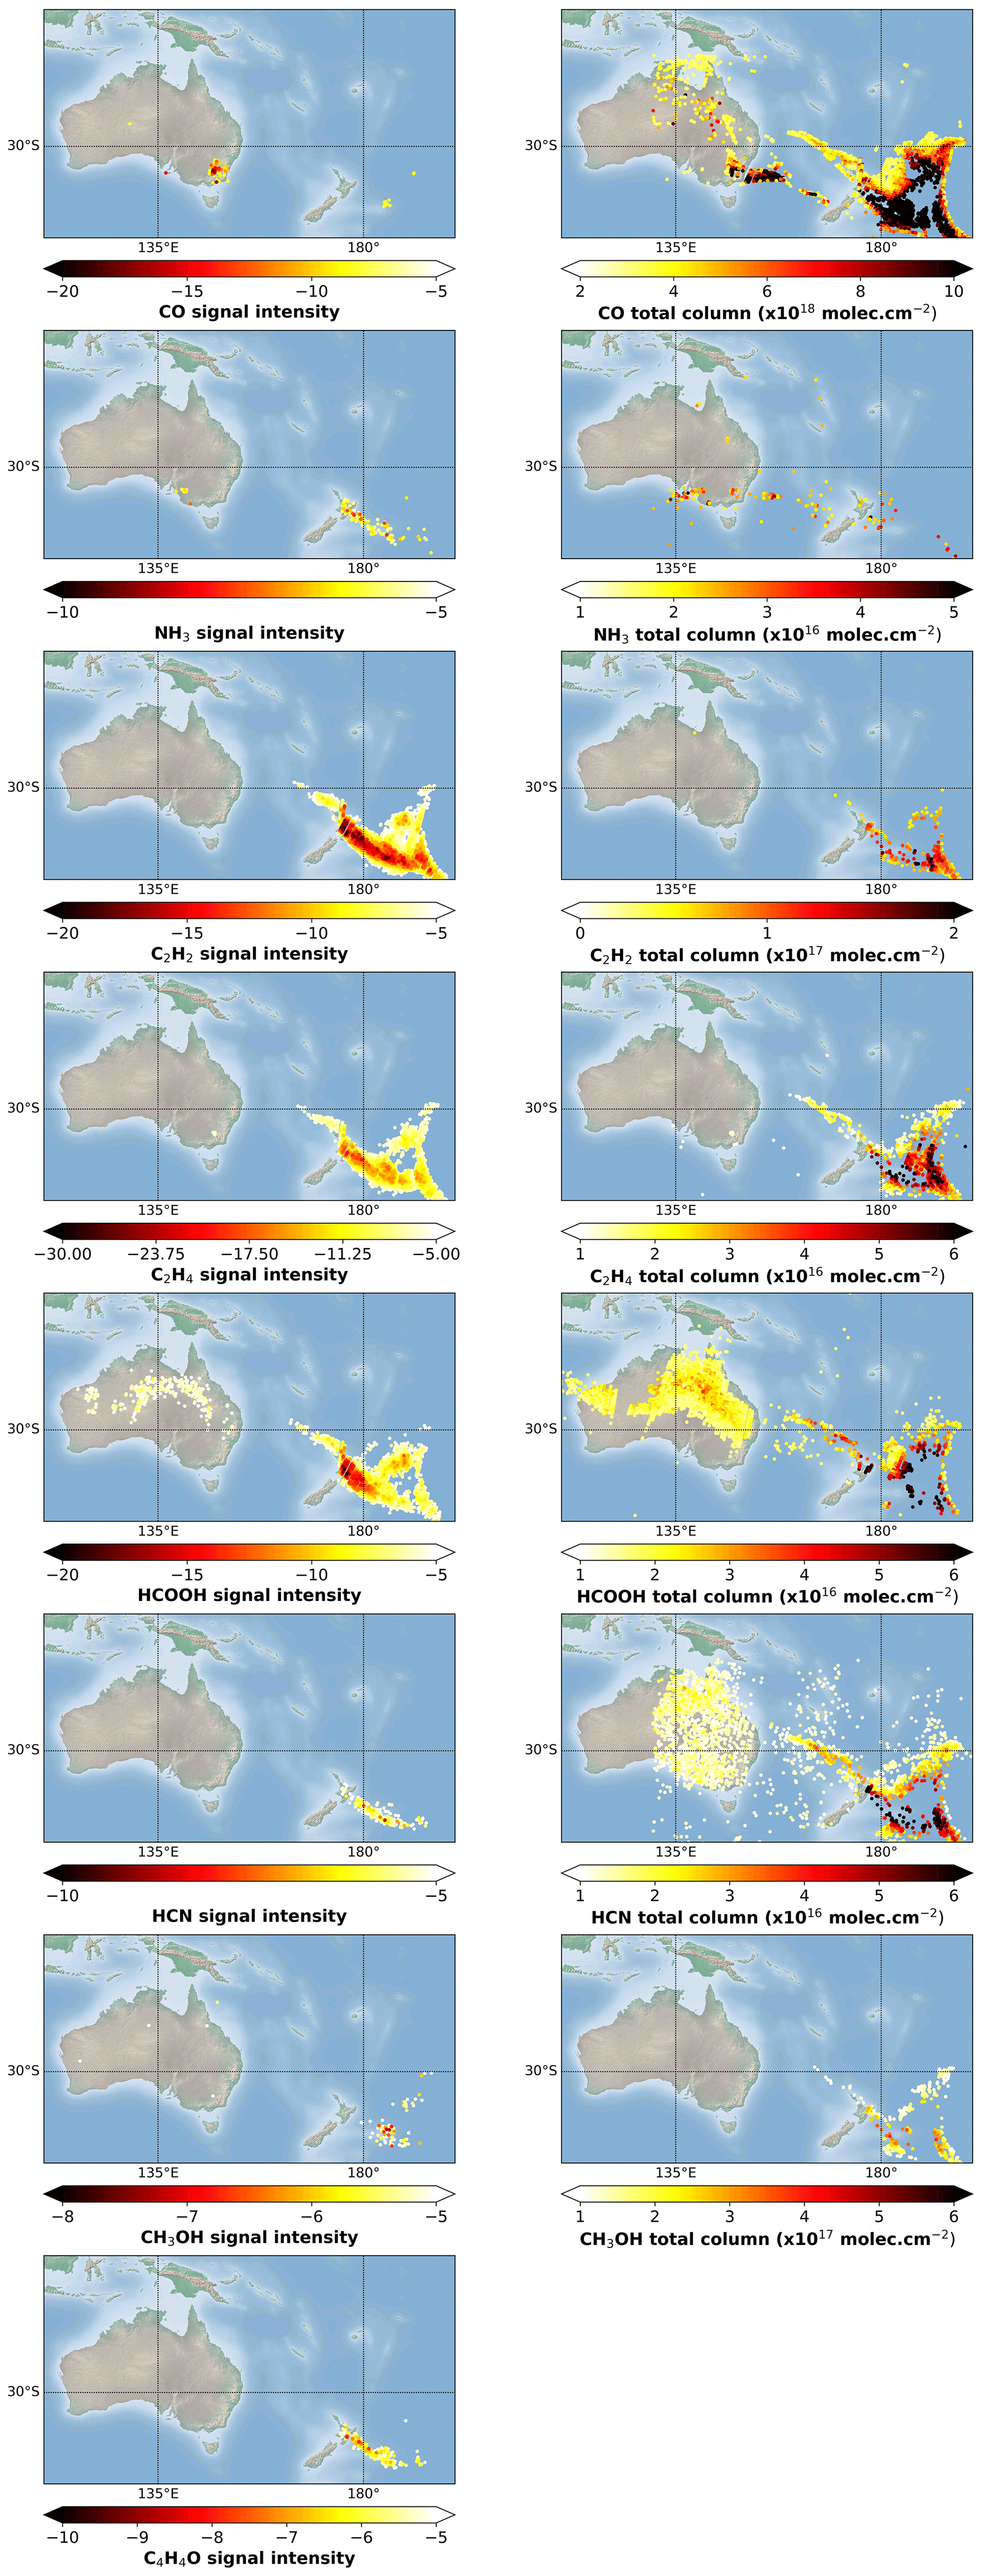
Figure 9The left column shows the spatial distribution of the residual values associated with CO, NH3, HCN, C2H2, C2H4, CH3OH, HCOOH, and C4H4O detections from IASI/Metop-B L1C data during the intense fire event in Australia on 1 January 2020 in the morning (daytime or AM orbit). The right column shows the same as the left column for the total column L2 data. There is no map of C4H4O total column L2 data because there is no retrieval information available.
Figure 9 (left column) shows the spatial distribution of the residual values associated with the detected species in the GMI pseudo-residual. Despite their different lifetimes, the plumes for the different species are located in the same region (around 180∘ E in the Pacific Ocean).
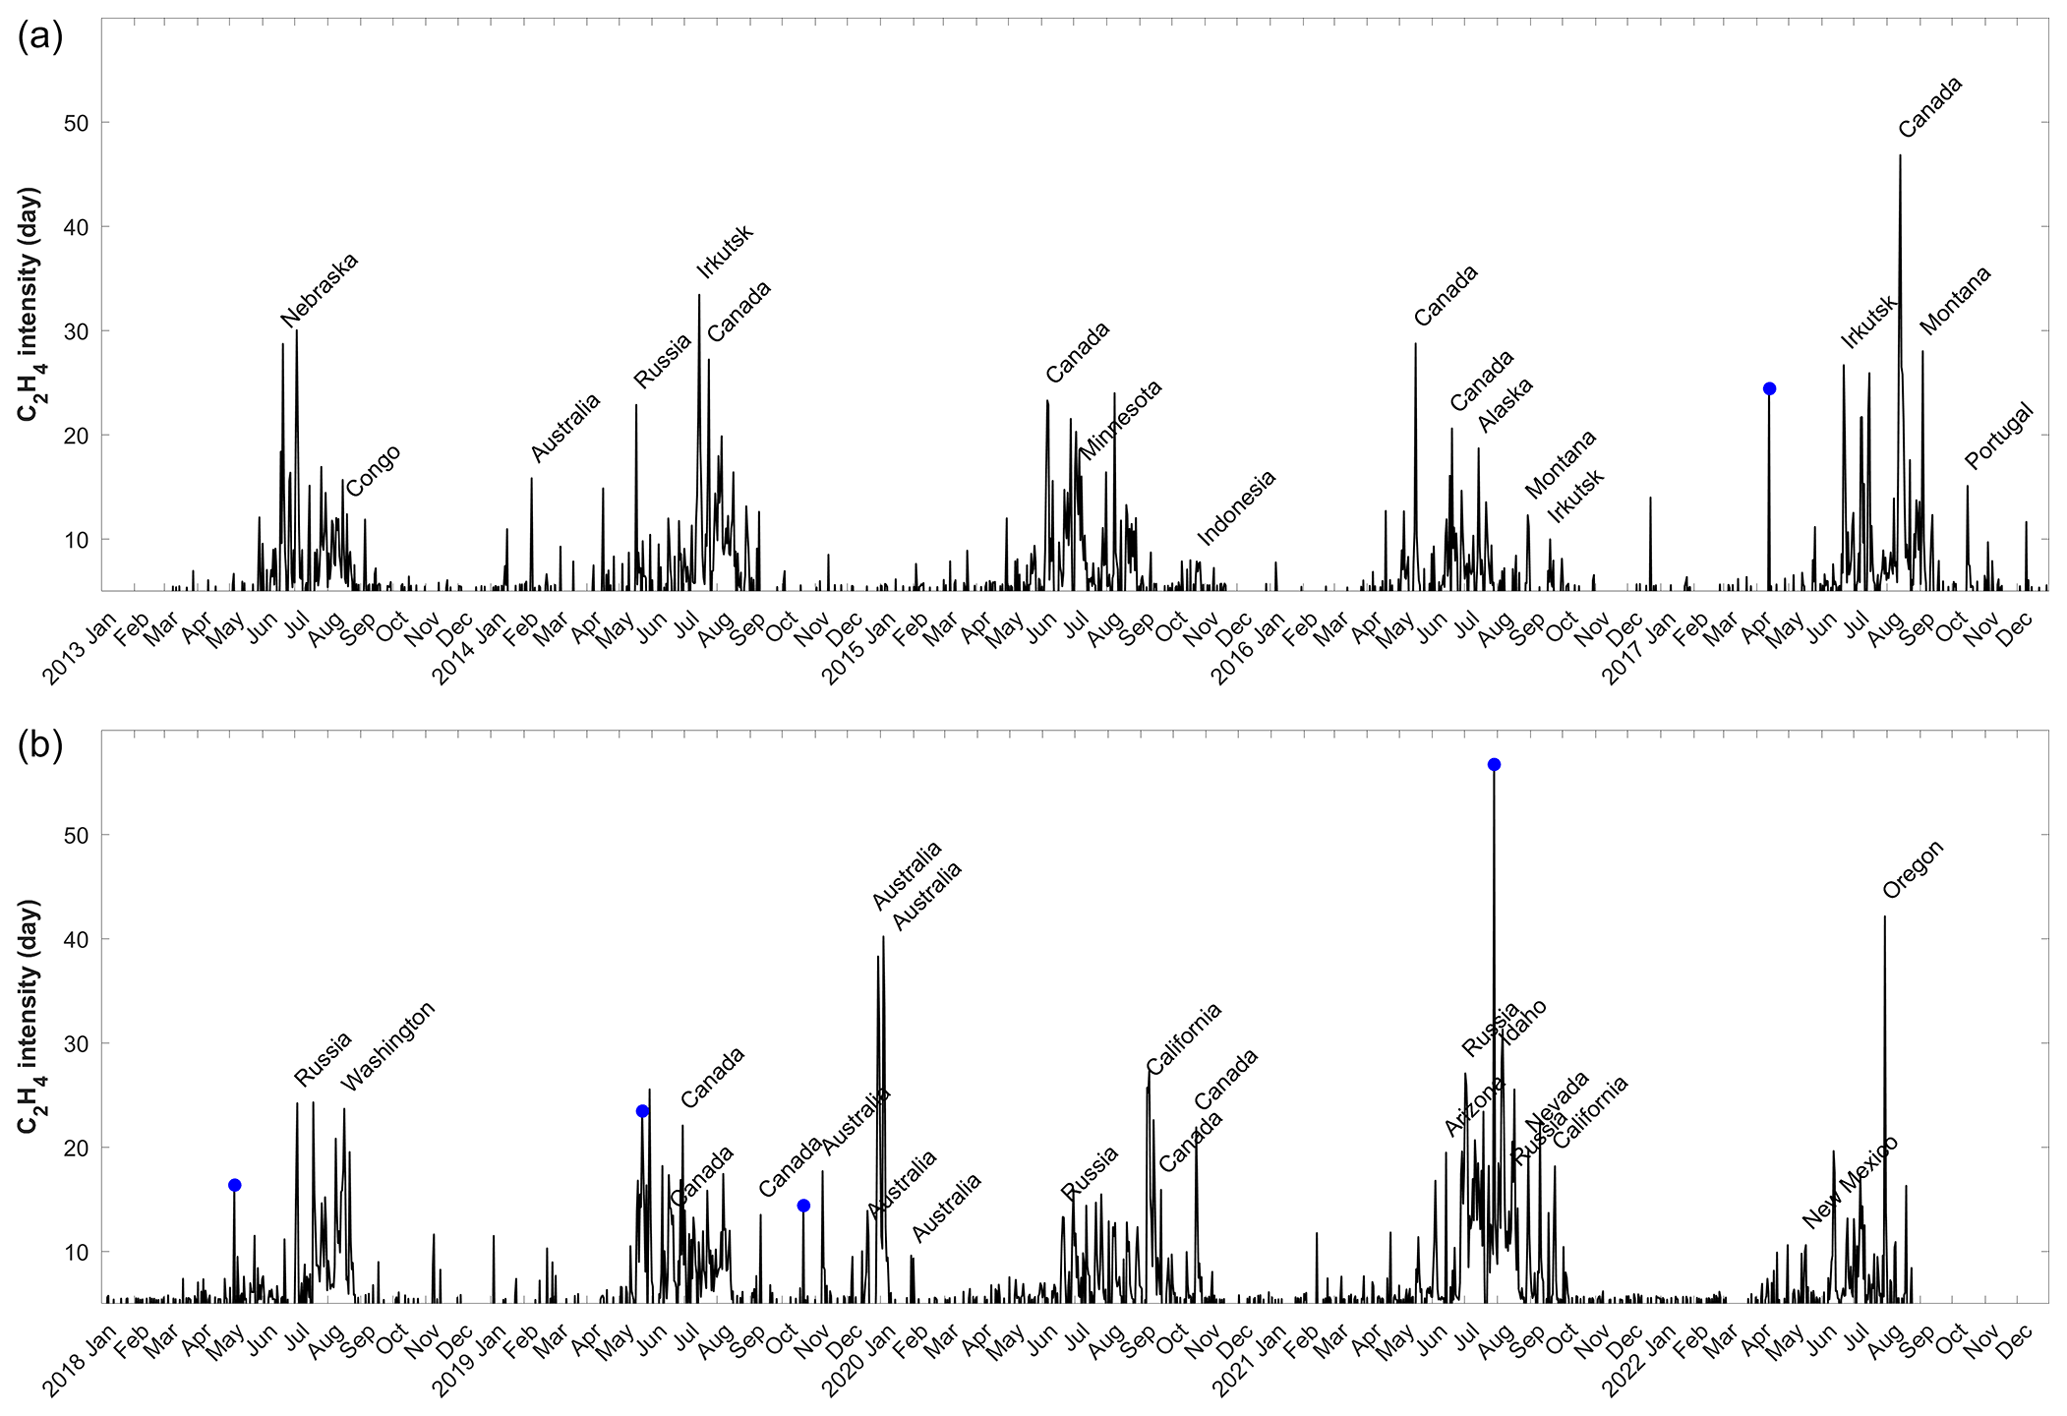
Figure 10Time series of C2H4 detections from the IASI-PCA-GE method based on the IASI/Metop-B L1C data for the 2013–2022 period. Only the daily extrema are shown in the time series. For clarity, the time series are separated into two periods, namely 2013–2017 (a) and 2018–2022 (b). Some events (blue dots) are associated with sporadic industrial releases.
Carbon monoxide is retrieved in near-real time (George et al., 2009) from IASI L1C and is used for monitoring fires (Turquety et al., 2009). In Fig. 9, CO is observed with both the IASI-PCA-GE and the L2 retrieval methods. However, some discrepancies are found in terms of location and intensity. A few pixels are detected by the IASI-PCA-GE method in the southeast of Australia, which is in agreement with the CO operational L2 product. However, the retrieval method is able to detect a larger plume over Australia compared to the IASI-PCA-GE method. Furthermore, a large plume is also detected over the Pacific Ocean but is missed by the IASI-PCA-GE method. Note that the high-intensity CO peaks are clearly detected in the residuals (see Fig. 10). However, most of the missing pixels in the PCA detection results are located above the sea. That could be due to the combination of the database chosen in the PCA method and the high variability in this spectral domain. Indeed, a higher thermal contrast variability is observed above land (Clerbaux et al., 2009), but the database contains spectra representing the natural variability without differentiating between sea and land pixels. As a result, the spectral reconstruction above the sea with the PCA method will be less sensitive to spectral variations, causing a reduced sensitivity above the sea. Furthermore, the spectral region between 2050 and 2200 cm−1 has shown a large statistical distribution of extrema signals within the 21 500 granules used for threshold calculation in Sect. 4.2, allowing us to set a restrictive threshold for the outlier detection for CO. That restriction will also impact the number of detected pixels. The sensitivity of PCA reconstruction outliers to strong CO concentrations in fires should be more deeply investigated in further studies.
NH3 is also retrieved in near-real time (Van Damme et al., 2017) and observed with a low concentration and occurrence above Australia on 1 January 2020 in the L2 retrievals and with a low signal and occurrence in the IASI-PCA-GE method. Some pixels are detected by the IASI-PCA-GE method but are not spatially correlated with the NH3 total column L2 data. A less frequent detection of NH3 is expected since only low-intensity peaks of NH3 are found in the GMI pseudo-residual, but two plumes are observed above both land and sea, while L2 retrievals only show many isolated pixels.
However, for other indicators, the size of the plume differs; large plumes are found for C2H2, C2H4, and HCOOH, while smaller plumes are found for HCN, C4H4O, and CH3OH. Those differences can be explained by the difference between both methods. Indeed, the column maps include the effects of radiative transfer (thermal contrast in particular), and the presence of clouds can also induce differences between both products, as the retrievals are highly sensitive to clouds. For the IASI-PCA-GE method, the sensitivity to molecule detection highly depends on the selection of spectra to construct the database and the thresholds chosen for the detection.
5.2.2 Fire archive for IASI/Metop-B
Figure 10 illustrates the time series of the ethylene detections from the IASI-PCA-GE method, based on the IASI/Metop-B L1C data for the 2013–2022 period. C2H4 is a weak absorber often detected at 949.25 cm−1 in the case of high-intensity fires and is able to show many high-intensity peaks attributed to fire events. In the figure, the most intense fires are characterized by their location (names indicated in black in Fig. 10). The presence of fires was validated by comparing C2H4 detection to the IASI L2 CO that is shown to be a good fire tracker (Logan et al., 1981). The seasonality of fires clearly appears during summer in the Northern Hemisphere and is mainly related to fires in Canada and Russia and during summer in the Southern Hemisphere with annual Australian and Indonesian fires. One of the largest detections of the 2013–2022 period is associated with the 2019–2020 Australian bushfires discussed in Sect. 5.2.1. Note that the highest C2H4 intensity, observed on 29 July 2021 with a signal of 56, could not be associated with biomass burning, as no other indicators are present in the PCA residuals. The source of this C2H4 enhancement is likely linked to anthropogenic activities, in addition to some other maxima, which are all located in Iran near the Iraqi border. This will be further discussed in Sect. 5.3.3.
5.3 Anthropogenic pollution events
5.3.1 High pollution in China
Boynard et al. (2014) investigated a severe pollution episode that occurred in the North China Plain in January 2013. The episode was caused by the presence of anthropogenic emissions combined with low wind speed and low-altitude boundary layer, leading to the weak mixing and dispersion of pollutants. The ability of IASI to detect high concentrations of trace gases such as CO, SO2, NH3, and ammonium sulfate aerosol ((NH4)2SO4) during the nighttime was demonstrated in the case of large negative thermal contrasts related to the winter season and coal burning in China for domestic heating. The IASI-PCA-GE method was applied on 13 January 2013 during the nighttime. The normalized GMA pseudo-residual obtained during China's anthropogenic pollution is illustrated in Fig. 11. In order to optimize the sensitivity of the method for a low-intensity event, the F2 thresholds were defined as F2=5 for both day- and nighttime conditions for the three species of interest (CO, NH3, and SO2). We clearly see a signal associated with CO, NH3, and SO2 spectral emissions, with the largest signal for SO2 (value reaching ∼ 18). The detection of SO2 around ∼ 1345 cm−1 is less frequent compared to a similar detection of SO2 during volcanic eruptions. This result suggests that the SO2 absorption features around ∼ 1345 cm−1 also allows the detection of SO2 during anthropogenic pollution episodes, which is in agreement with the finding of Bauduin et al. (2014, 2016). Finally, the spectral features around 1180–1200 cm−1 showing a low signal intensity are likely due to the IASI detector band 1–band 2 inter-band domain that is well captured in the IASI-PCA-GE method and should not be associated with an anomalous atmospheric constituent.
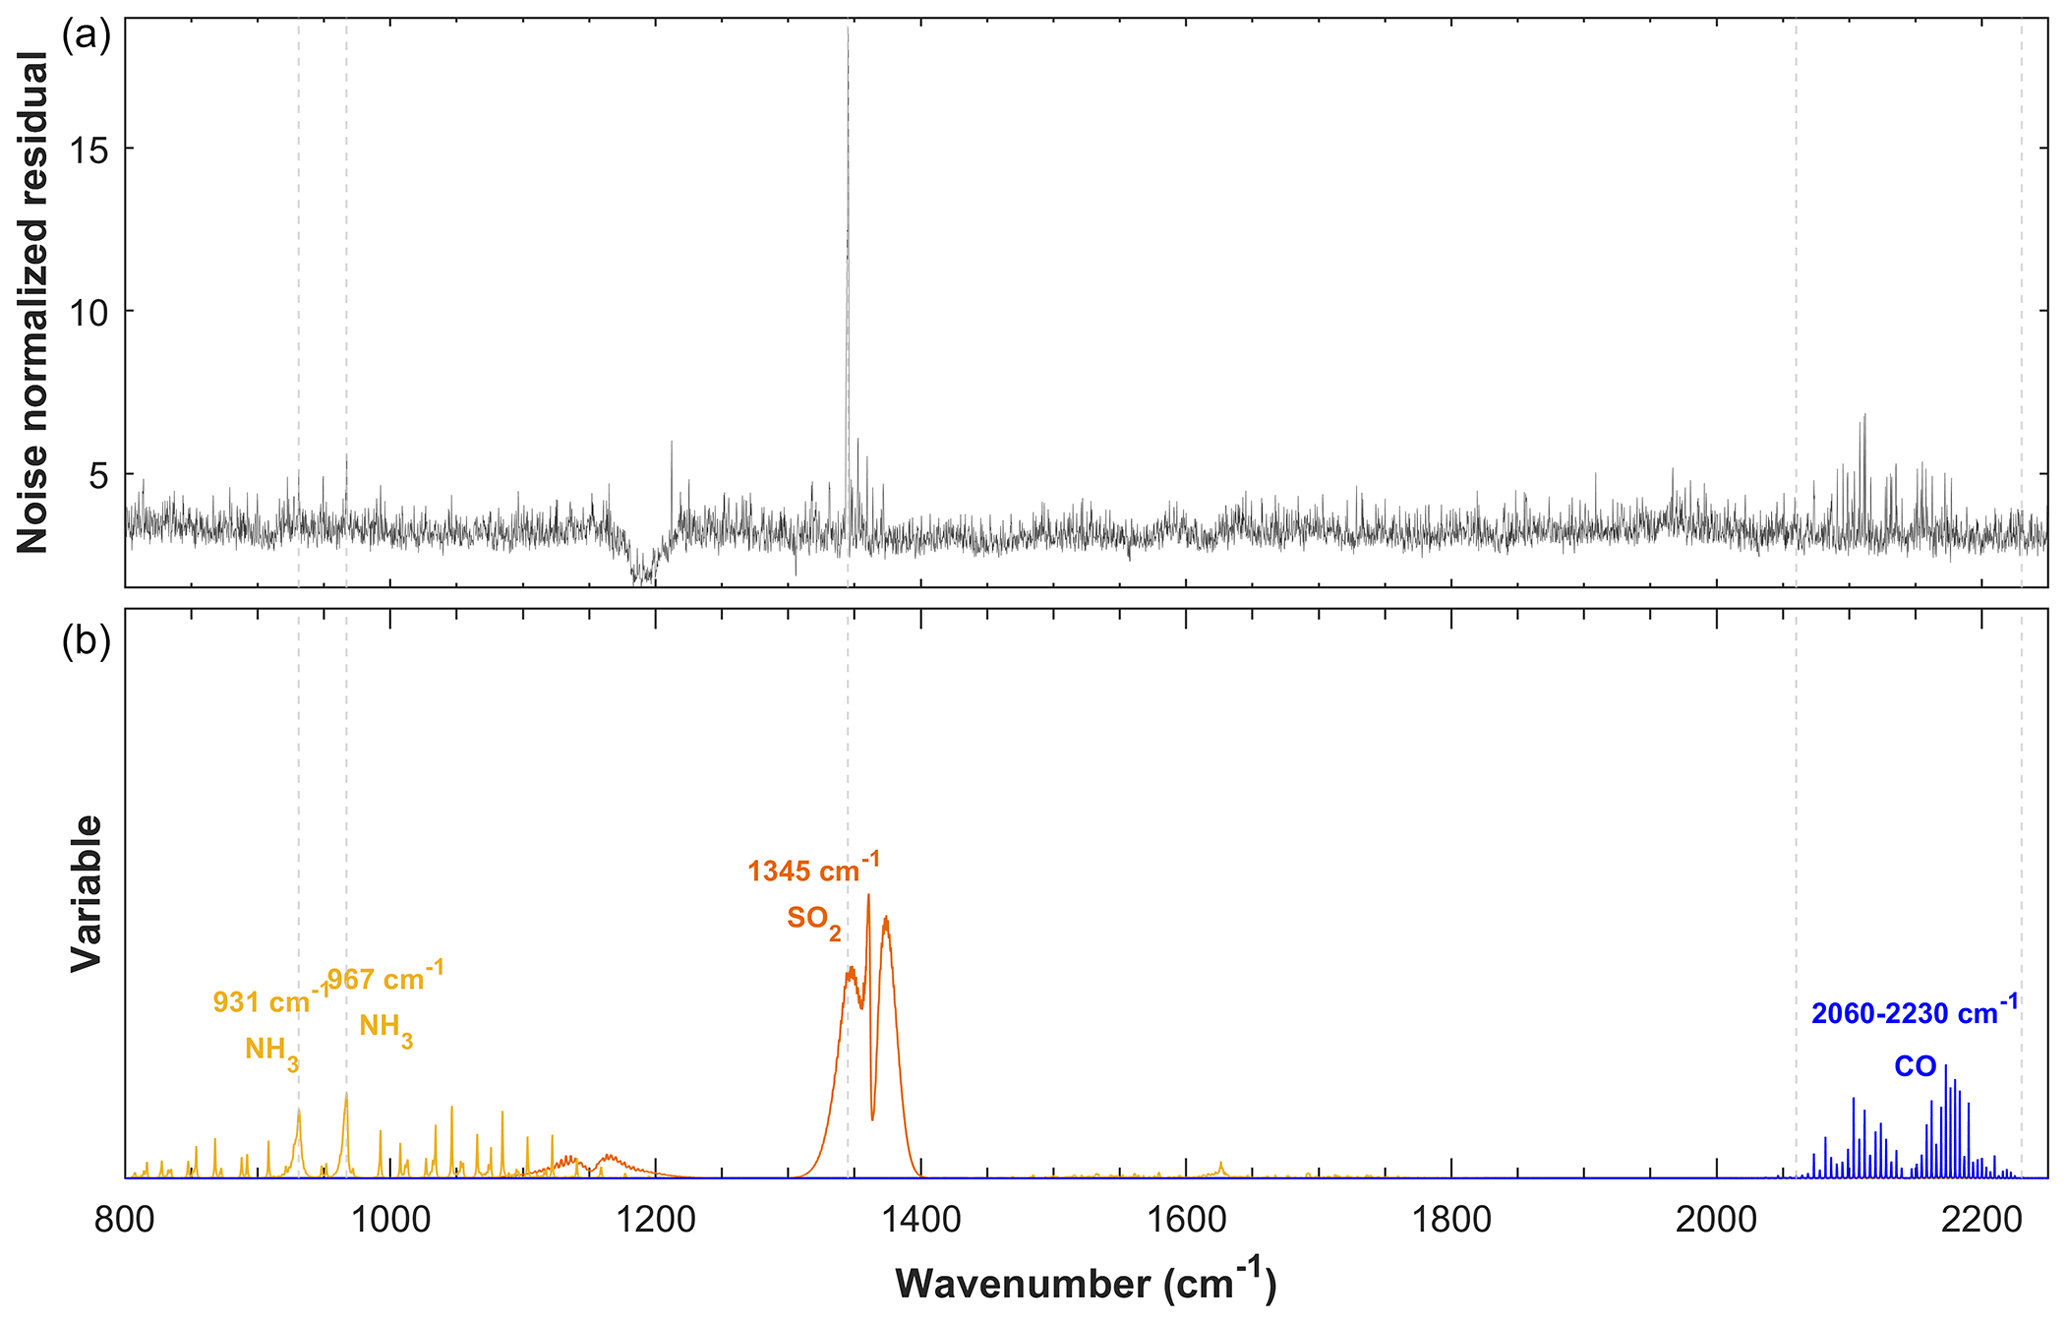
Figure 11(a) Example of GMA pseudo-residual calculated from IASI/Metop-A L1C data during an anthropogenic pollution event occurring in China on 13 January 2013 in the evening (PM orbit). (b) The HITRAN spectroscopic parameters associated with the absorption of different species (Gordon et al., 2017, 2022) are shown with colors.
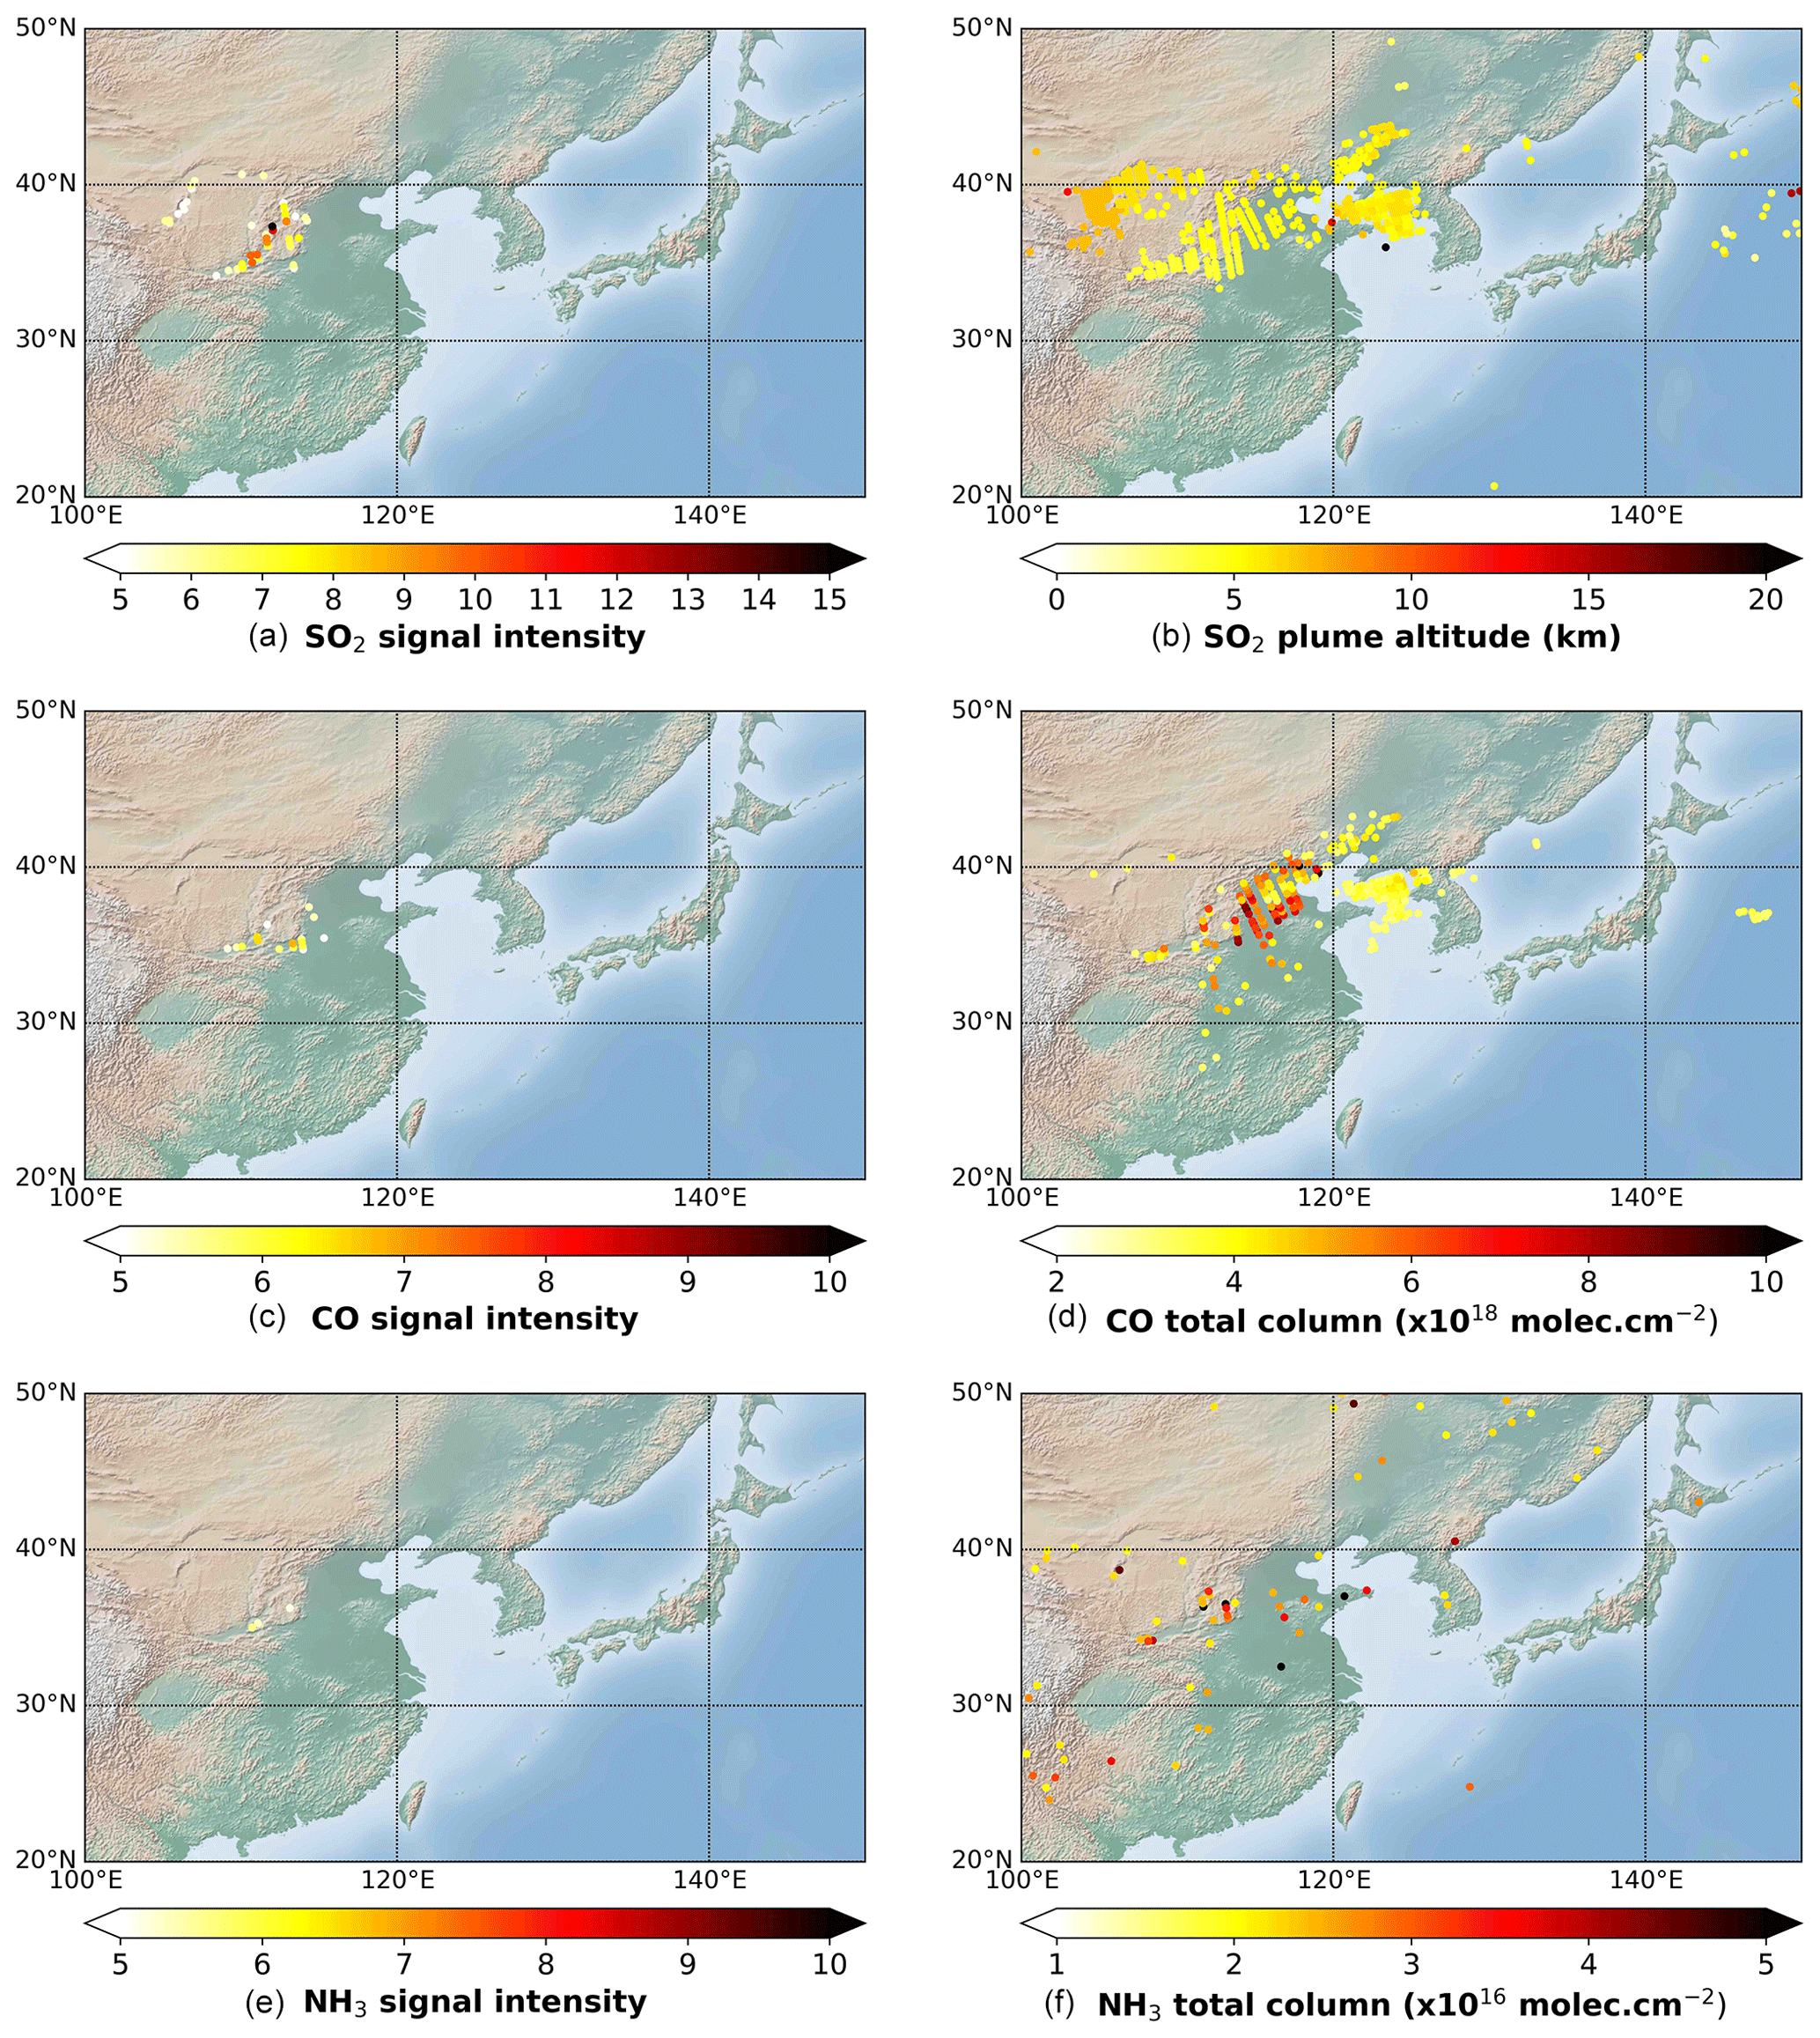
Figure 12Analysis of an intense fire event in China on 13 January 2013 in the evening (nighttime or PM orbit) based on IASI/Metop-A L1C data. (a, c, e) Spatial distribution of residual values associated with SO2, CO, and NH3. (b, d, f) SO2 plume altitude retrievals (km) and CO and NH3 total column retrievals (molec. cm−2).
The spatial distribution of the residual values associated with the detected species in the GMA pseudo-residual (see Fig. 11) is presented in Fig. 12 (left). The IASI-PCA-GE method allows the spectral detection of NH3, SO2, and CO. However only a few pixels are detected for NH3, which is due to the very low (< 5) signal intensity found for that species. We see the same behavior for CO. However, a clear SO2 plume characterized by a signal reaching ∼ 18 (at 1345.00 cm−1; see Fig. 11) is found by the IASI-PCA-GE method.
Figure 12 (right) illustrates the spatial distribution of NH3 and CO total column and SO2 plume altitude L2 data retrieved from the IASI/Metop-A L1C data (Clarisse et al., 2012). The retrieval and IASI-PCA-GE methods shows different patterns. We clearly see two plumes for SO2 plume altitude and CO concentrations, but only a few pixels of detection are found for NH3.
5.3.2 SO2 released by a sulfur plant
During the period extending from 20 to 27 October 2016, a sulfur mine burned in Al-Mishraq near Mosul, Iraq. This fire on the sulfur plant, which was set by members of the Islamic State in Iraq and the Levant (ISIL), caused a large emission of SO2 and other sulfured species in the atmosphere, which was observed from several satellite instruments (Björnham et al., 2017). Similar plant fires occurred in June 2003 during 4 weeks, with approximately 600 kt of SO2 emitted (Carn et al., 2004). This was a major health hazard (Baird et al., 2012). Nearly 1000 people were intoxicated due to toxic fire plumes, and two Iraqis died.
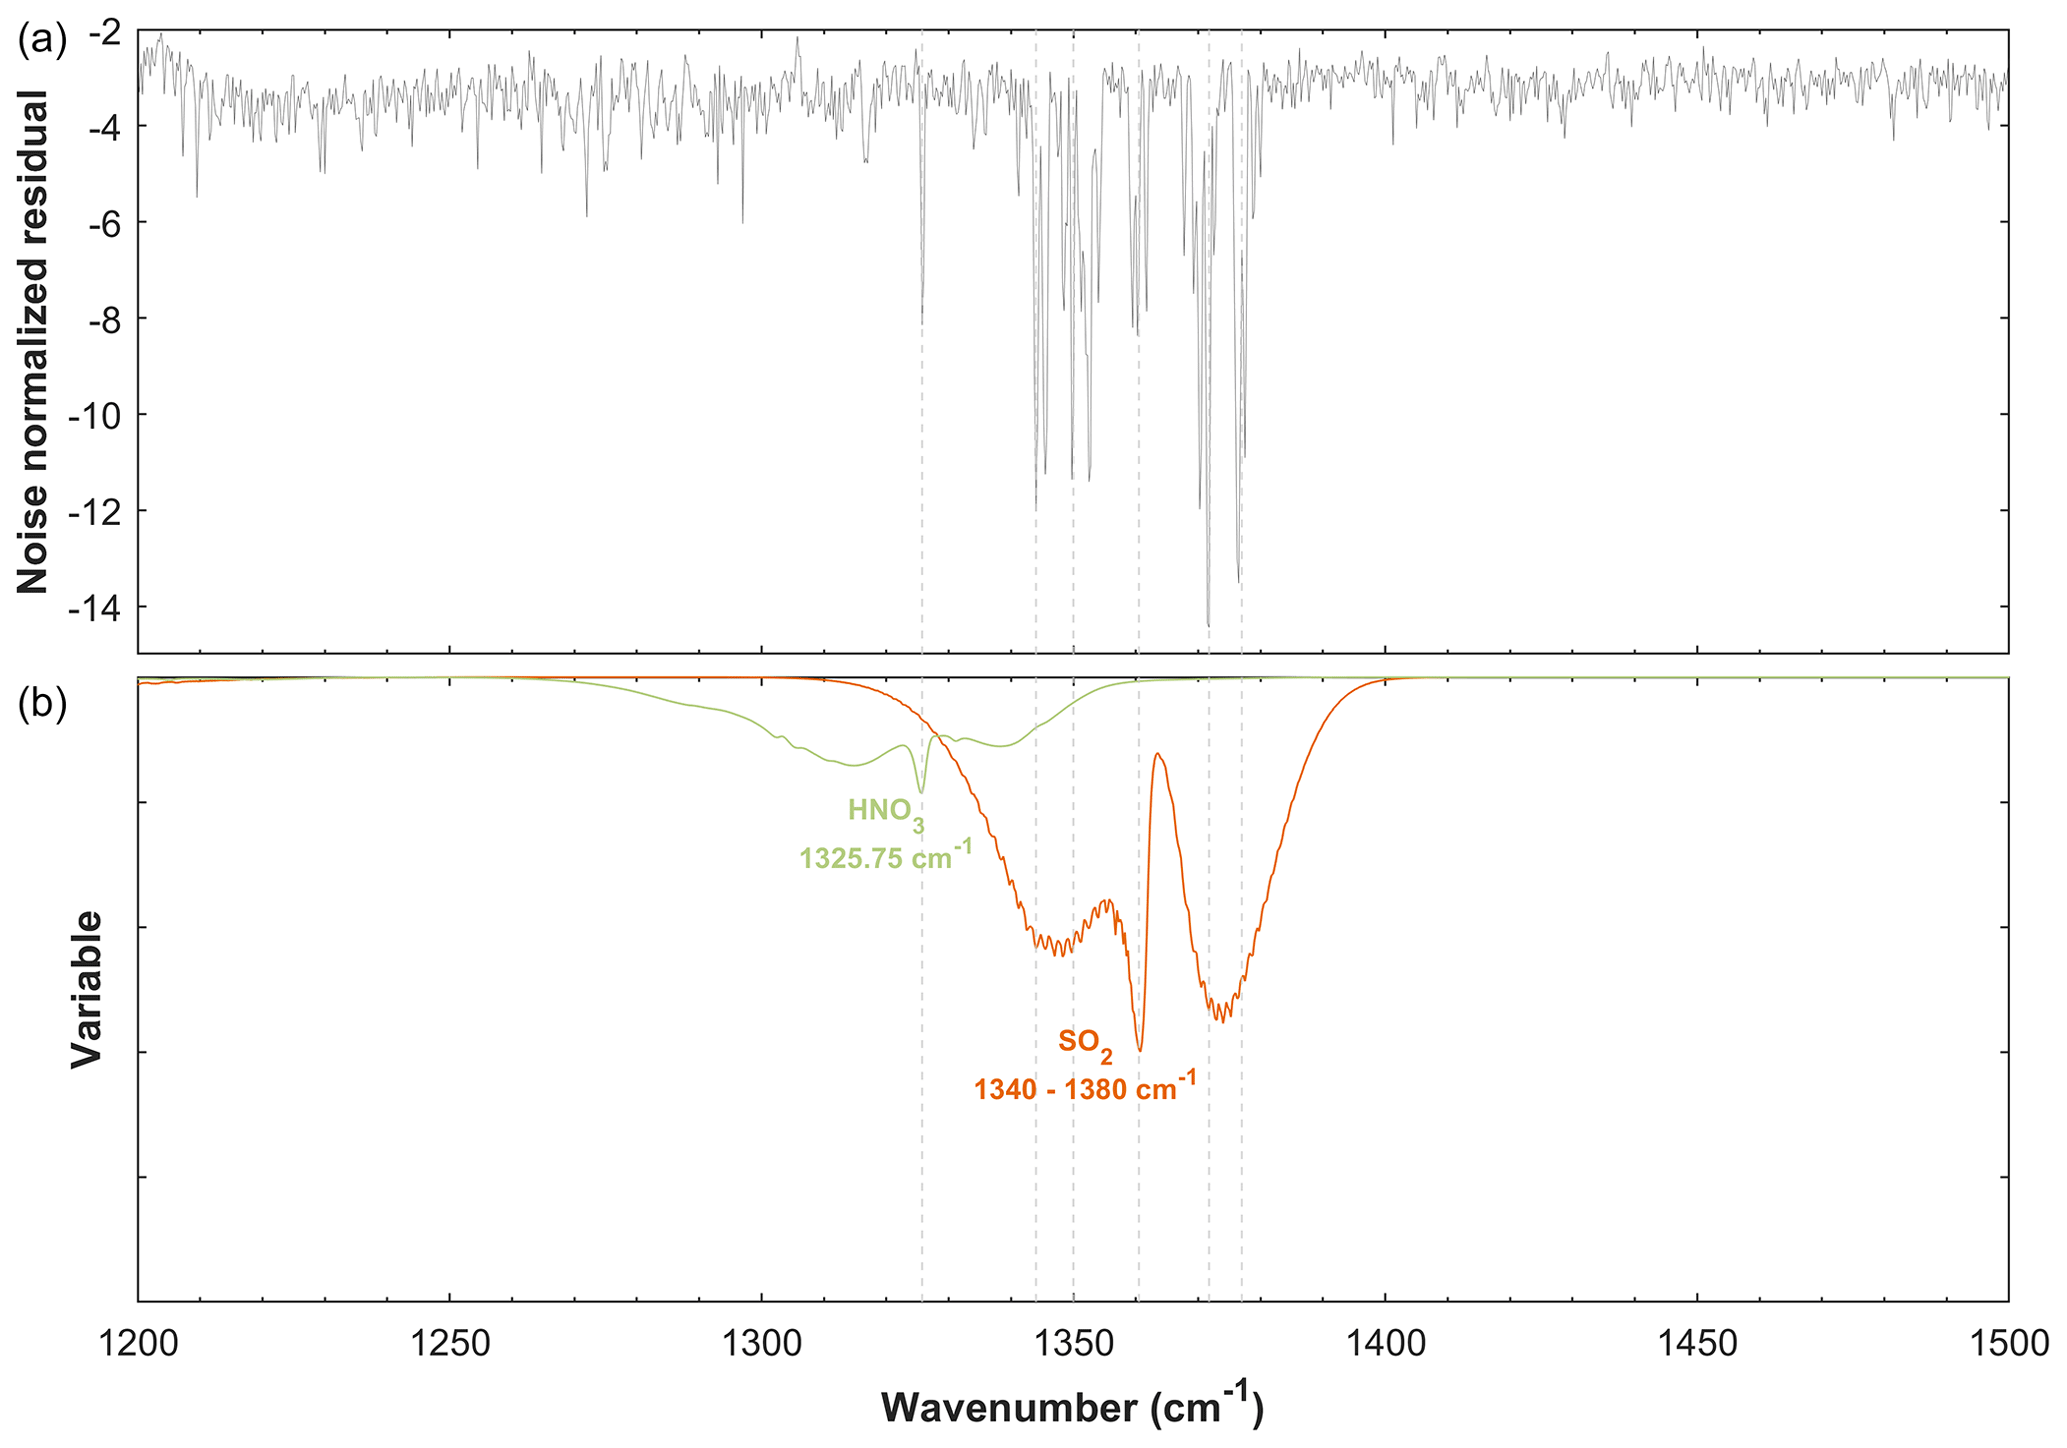
Figure 13(a) Example of GMI pseudo-residual calculated from IASI/Metop-B L1C data during a sulfur plant fire event occurring in Iraq on 24 October 2016 in the evening (nighttime or PM orbit). (b) The HITRAN spectroscopic parameters associated with the absorption of different species (Gordon et al., 2017, 2022) are shown in colors.
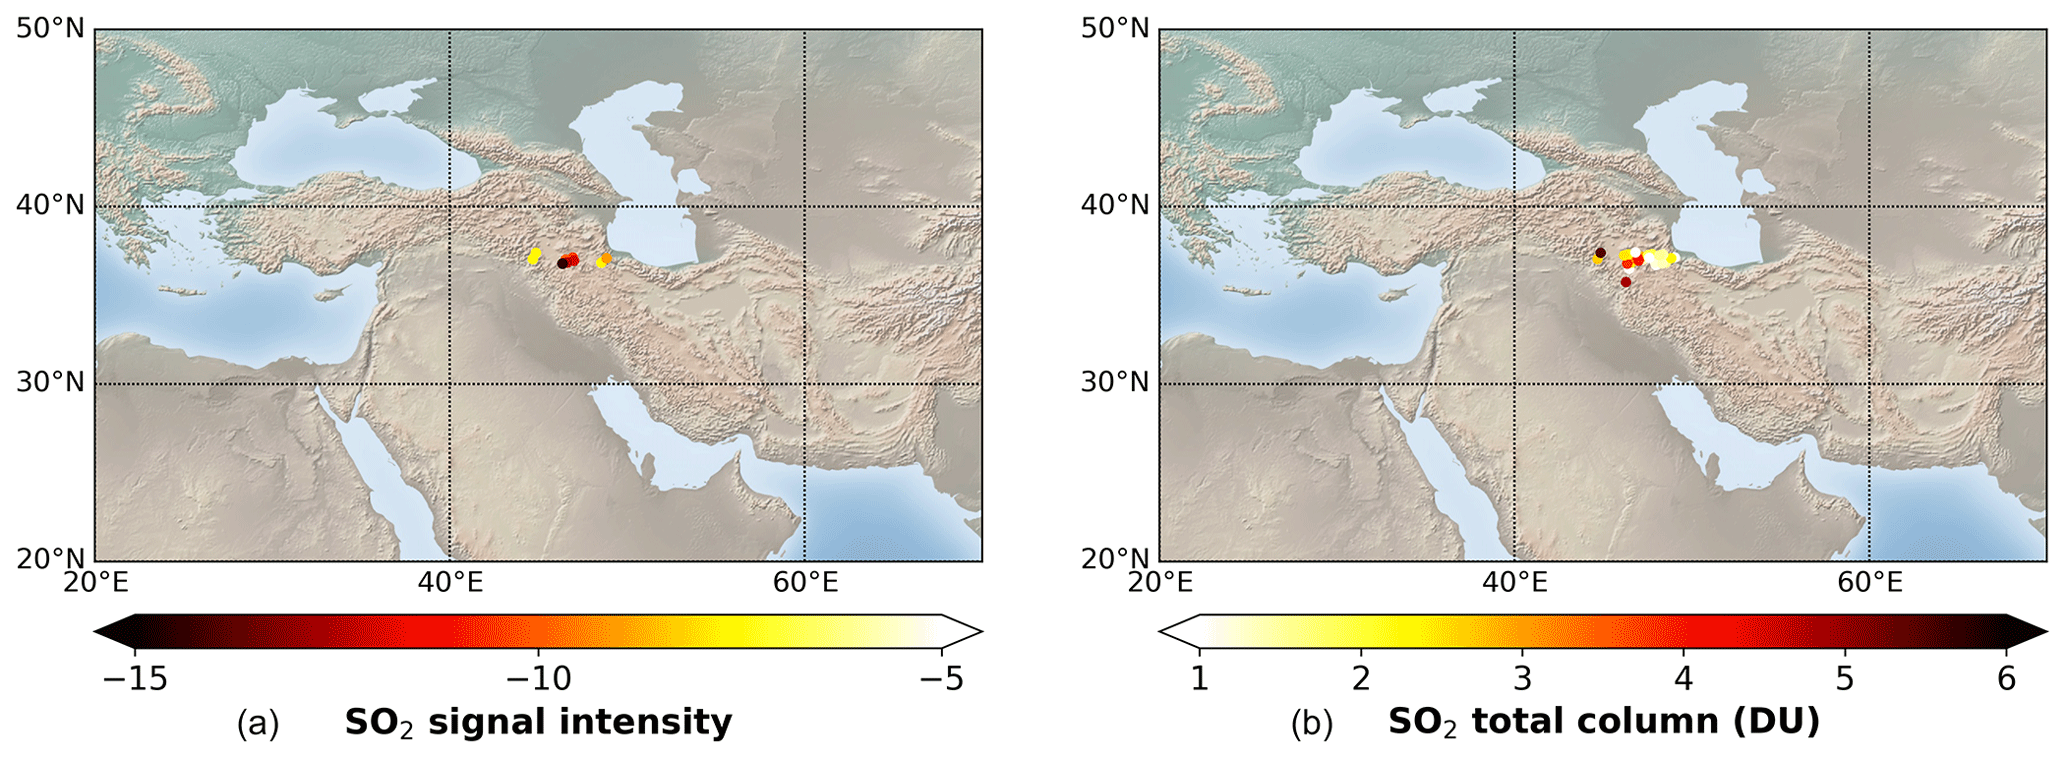
Figure 14Analysis of sulfur plant fire event in Iraq on 24 October 2016 in the evening (nighttime or PM orbit) based on IASI/Metop-A L1C data. (a) Spatial distribution of residual values associated with SO2. (b) SO2 total column in Dobson units.
Figure 13 illustrates the normalized GMI pseudo-residual obtained during the Iraqi industrial disaster on 24 October 2016 PM. The GMI pseudo-residual is characterized by an absorption peak at ∼ 1326.00 cm−1 that could be assigned to HNO3 and two absorption peaks associated with SO2 at 1345.00 and 1371.00 cm−1. The signal intensity is about −14 for SO2, which suggests that the event is of low to medium intensity. However, the SO2 peaks found around ∼ 1371 and ∼ 1377 cm−1 are mostly seen in the case of intense volcanic eruptions, suggesting that the SO2 concentrations are larger than the concentrations found above most of degassing volcanoes. This suggestion for an industrial origin is well supported by Fig. 14, showing SO2 total columns up to 5 DU.
The detection at ∼ 1326 cm−1 is not associated with HNO3 and is due to the contribution of SO2 and aerosols, as already discussed in the case of the Ubinas eruption (see Sect. 5.1.1).
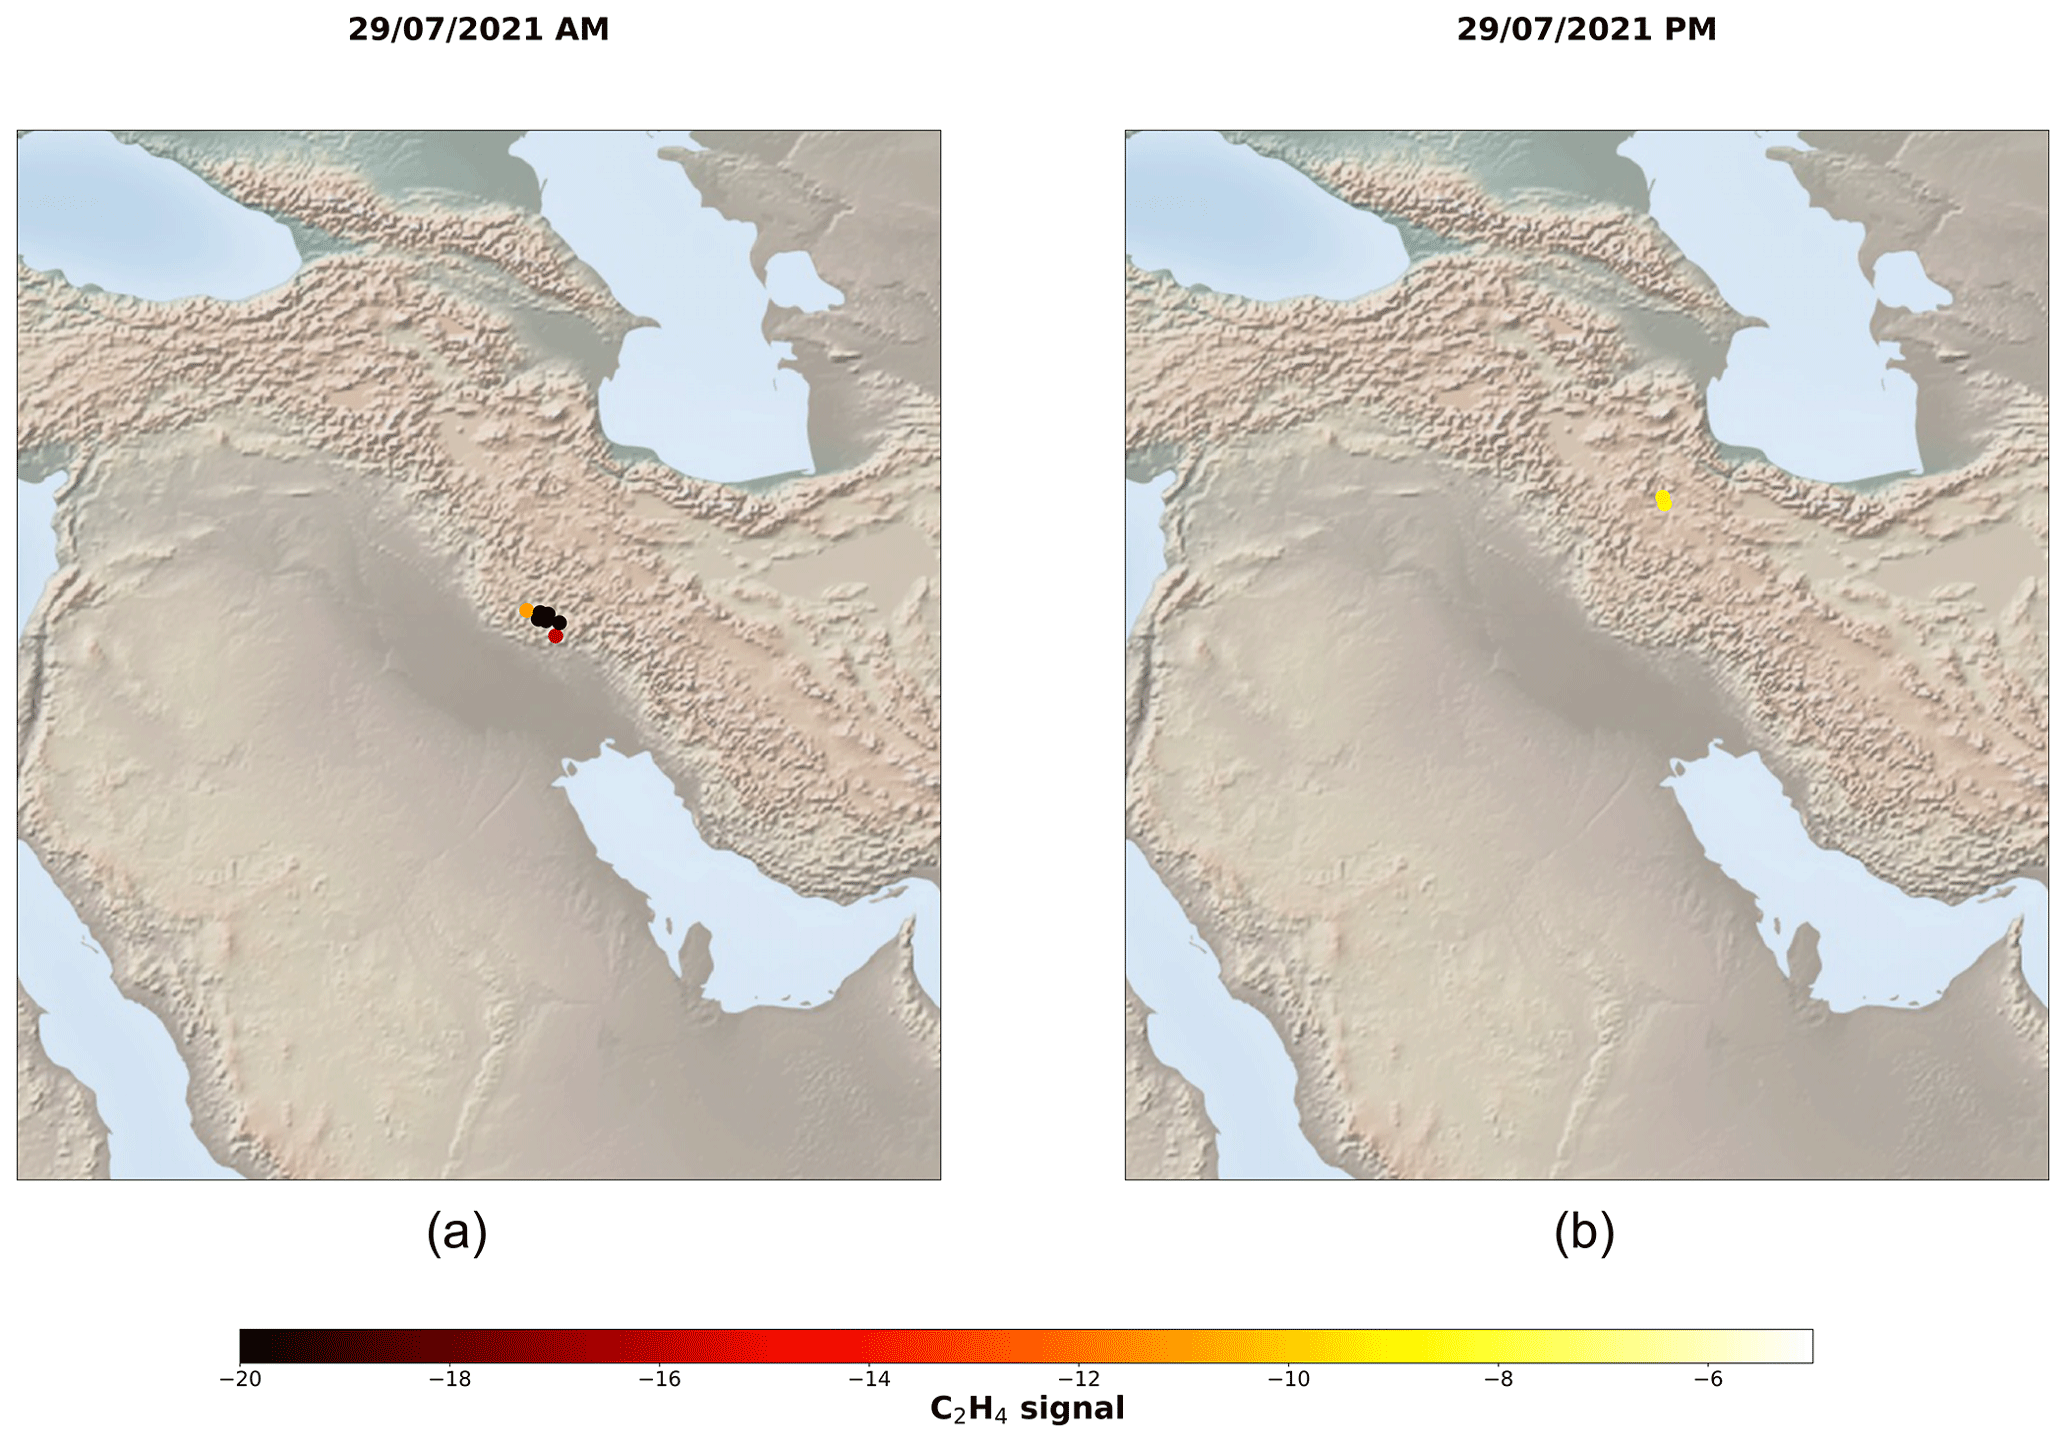
Figure 15Analysis of the acetylene sporadic emission event in Iraq on 29 July 2021 based on IASI/Metop-A L1C data. (a) Spatial distribution of residual values associated with C2H4 during the morning orbit. (b) Spatial distribution of residual values associated with C2H4 during the evening orbit.
The spatial distribution of the residual values associated with SO2 detections is illustrated in Fig. 15. The IASI-PCA-GE method allows the spectral detection of this molecule in the region of interest 4 d after the fire started, thus showing the transport of the plume in the eastern part of the country. Fewer pixels are detected by the IASI-PCA-GE method than by the L2 retrieval method. This can be explained by the fact that SO2 thresholds associated with the IASI-PCA-GE method were empirically chosen to minimize false positive detections, and thus, the detections of low-intensity residuals can be missed.
5.3.3 C2H4 sporadic emission at the border of Iran/Iraq
In Sect. 5.2.2, we reported that the IASI-PCA-GE method is well suited to the detection of biomass burning by using the C2H4 indicator found in conjunction with other signatures of molecules usually associated with fire activity. Among the events that we detected, on a few occasions, we found intense signatures in the Iran/Iraq region with no absorption other than C2H4, which suggests that sources other than biomass burning – likely due to anthropogenic activities – are at play. The main event occurred in July 2021, and some other weaker ones are also identified in Fig. 10. By averaging IASI data over time and using a super-sampling technique, Franco et al. (2022) uncovered and identified over 300 worldwide emitters of C2H4 emanating from petrochemical clusters, steel plants, coal-related industries, and megacities. However, no C2H4 point source was formally identified in this Iran/Iraq region. But the method described in this paper is also well suited to the detection of sporadic events, which contrasts with the continuous emissions identified by Franco et al. (2022). Indeed, oversampling methods are well suited for the detection of regular, even weak, anthropogenic sources but typically miss transient sources lasting less than 24 h. A new analysis was therefore performed on the events spotted by the IASI-PCA-GE method, which led to the identification of plumes lasting for only a few hours (see Fig. 15) and for specific days, as identified in Fig. 10. Although visible satellite imagery and independent online information indicate the presence of oil and gas activities in that area, no firm identification was possible, and further investigation is needed to identify the potential sources of these sporadic emissions.
This paper presents an innovative approach, based on a PCA method applied on the IASI radiance spectra, that allows the detection and characterization of exceptional events in near-real time. This new method, the IASI-PCA granule extrema (GE) method, consists of focusing on extrema calculated within a given geographical region. A statistical selection is made by focusing on the anomalous variability in IASI channels (detection of outliers) in order to identify the contribution of specific molecules from different types of events. The method is applied to the standard 3 min granules of IASI observations, thus allowing the near-real-time detection of a series of short-lived trace gases.
Using a dataset representing the full range of atmospheric conditions, we show that the PCA method is well suited to detecting outliers efficiently. The analysis of the outliers allows the identification of spectral features exceeding the natural variability in several absorbing species, especially for weak absorbers, emitted during fires, volcanic eruptions, anthropogenic pollution, or industrial disasters. The method is more robust than previous retrieval methods when the spectra are contaminated by clouds.
The analysis of several case studies shows a good sensitivity of the IASI-PCA-GE method, which is able to detect weak absorbers such as SO2, HCN, C2H2, C2H4, CH3OH, C4H4O, and NH3. We also showed that the method is well suited to the detection of transient events that last only a few hours or days.
Our work shows that, within a granule, the negative part the of residuals (GMI) contains more information than the positive part represented by the GMA. However, the latter contains relevant information in the case of negative thermal contrasts, thus allowing the detection of specific events such as the recurrent anthropogenic pollution events occurring in China in winter.
The IASI-PCA-GE method is better suited to the detection of spuriously emitted species. In this study, only species associated with narrow (as Q branches of C2H2 and C2H4) spectral features have been considered. Species such as PAN, CH3COOH, and CH3COCH3, characterized by broadband absorption features, are more difficult to detect with the IASI-PCA-GE method. Also, inconclusive results were obtained for CO because its variability is already well captured by a truncated reconstruction, due to the high variability in this species, from background conditions (50 ppb) to highly polluted areas (4000 ppb). Finally, as explained above, concerning SO2 and HNO3, the spectral coincidence of some of the intense spectral features of these two species can affect the reconstruction of one when the other one is highly present. In the frame of this study, this is the only identified example of confounding situations (i.e., an unusual perturbation in a limited number of channels impacts the reconstruction residual in other channels), leading to false detection. Considering the high numbers and diversity of detections and extreme situations analyzed in this work, such confounding situations are rare, and PCA-based detection of atmospheric events can be effectively and efficiently exploited.
Overall, this paper shows the capacity of PCA detection for identifying different species from one event to another, especially in case of fire events, which suggests the possibility of categorizing fire events based on judicious combinations of species. The method also proves useful for deriving consistent, long-term records of fire and volcanic events, and the data will continue to accumulate over time, as the method is now routinely implemented. Further work is still needed to avoid false detections, such as those associated with HNO3, which are due to the correlation between different absorption bands for the same molecule, and one of them is likely interfering with the SO2 present in the volcanic or industrial plumes.
A first version of this method is currently running continuously, delivering email alerts on a routine basis, using the near-real-time IASI L1C radiance data. Although the method is still being tested, it is planned to be used as an online tool for the early and systematic detection of extreme events.
IASI L2 SO2, NH3, and CO data are available at https://doi.org/10.25326/42 (Clarisse, 2019), https://doi.org/10.25326/11 (Clarisse et al., 2018), and https://doi.org/10.25326/64 (Clerbaux et al., 2020), respectively. The volatile organic carbon (VOC) retrievals are processed by Franco Bruno (bruno.franco@ulb.be) and Lieven Clarisse (lieven.clarisse@ulb.be) at ULB and are available upon request.
AB and CC defined and proposed the study as part of AVV's doctoral research. AVV performed the data analysis, with guidance from AB, CC, PP, and CCP, and generated the figures. AVV, AB, and CC wrote the draft. PP, CCP, BF, PFC, and LC reviewed and edited the paper. PP, CCP, OL, and DJ designed and developed the IASI PCA code. BF, PFC, and LC performed the VOC retrievals. All co-authors discussed the results and contributed to the final version of the paper.
The contact author has declared that none of the authors has any competing interests.
Publisher’s note: Copernicus Publications remains neutral with regard to jurisdictional claims in published maps and institutional affiliations.
Adrien Vu Van acknowledges funding from SPACIA SA through an ANRT CIFRE doctoral grant. IASI is a joint mission of EUMETSAT and the Centre National d'Etudes Spatiales (CNES, France). The IASI Level 1C data are distributed in near-real time by EUMETSAT through the EUMETCast system distribution. The authors acknowledge the AERIS data infrastructure (https://www.aeris-data.fr, last access: 19 April 2023), for providing access to the IASI Level 1 radiance and Level 2 concentration data used in this study.
This research has been supported by the French Association Nationale de la Recherche et de la Technologie (grant no. 2019/0196).
This paper was edited by Diego Loyola and reviewed by Santtu Mikkonen and one anonymous referee.
Ackerman, S. A. and Strabala, K. I.: Satellite remote-sensing of H2SO4 aerosol using the 8 to 12 µm window region: Application to Mount Pinatubo, J. Geophys. Res., 99, 18639–18649, https://doi.org/10.1029/94JD01331, 1994.
Amirtaimoori, S., Khalilian, S., Amirnejad, H., and Mohebbi, A.: Estimation of cost curve to control sulfur dioxide gas (SO2) emissions from Sarcheshmeh copper complex, Journal of Environmental Studies, 40, 431–438, 2014.
Antonelli, P., Revercomb, H. E., Sromovsky, L. A., Smith, W. L., Knuteson, R. O. Tobin, D. C., Garcia, R. K., Howell, H. B., Huang, H.-L., and Best, F. A.: A principal component noise filter for high spectral resolution infrared measurements, J. Geophys. Res., 109, D23102, https://doi.org/10.1029/2004JD004862, 2004.
Atkinson, N. C., Brunel, P., Marguinaud, P., and Labrot, T.: AAPP developments and experiences with processing METOP data, Tech. Proc. 16th Int. TOVS Study Conf., Angra dos Reis, Brazil, 6–13 May 2008, https://cimss.ssec.wisc.edu/itwg/itsc/itsc16/ (last access: 19 April 2023), 2008.
Atkinson, N. C., Ponsard, C., and Hultberg, T.: AAPP enhancements for the EARS-IASI service, Proc. EUMETSAT Meteorological Satellite Conf., Bath, UK, 21–25 September 2009, https://www-cdn-int.eumetsat.int/files/2020-04/pdf_conf_p55_s8_39_atkinson_p.pdf (last access: 19 April 2023), 2009.
Atkinson, N. C., Hilton, F. I., Illingworth, S. M., Eyre, J. R., and Hultberg, T.: Potential for the use of reconstructed IASI radiances in the detection of atmospheric trace gases, Atmos. Meas. Tech., 3, 991–1003, https://doi.org/10.5194/amt-3-991-2010, 2010.
Baird, C. P., Debakey, S., Reid, L., Hauschild, V. D., Petruccelli, B., and Abraham, J. H.: Respiratory health status of US army personnel potentially exposed to smoke from 2003 Al-Mishraq sulfur plant fire, J. Occup. Environ. Med., 54, 717–723, 2012.
Bani, P., Oppenheimer, C., Allard, P., Shinohara, H., Tsanev, V., Carn, S., Lardy, M., and Garaebiti, E.: First estimate of volcanic SO2 budget for Vanuatu island arc, J. Volcanol. Geoth. Res., 211–212, 36–46, https://doi.org/10.1016/j.jvolgeores.2011.10.005, 2012.
Bauduin, S., Clarisse, L., Clerbaux, C., Hurtmans, D., and Coheur, P.-F.: IASI observations of sulfur dioxide (SO2) in the boundary layer of Norilsk, J. Geophys. Res.-Atmos., 119, 4253–4263, https://doi.org/10.1002/2013JD021405, 2014.
Bauduin, S., Clarisse, L., Hadji-Lazaro, J., Theys, N., Clerbaux, C., and Coheur, P.-F.: Retrieval of near-surface sulfur dioxide (SO2) concentrations at a global scale using IASI satellite observations, Atmos. Meas. Tech., 9, 721–740, https://doi.org/10.5194/amt-9-721-2016, 2016.
Björnham, O., Grahn, H., Von Schoenberg, P., Liljedahl, B., Waleij, A., and Brännström, N.: The 2016 Al-Mishraq sulphur plant fire: Source and health risk area estimation, Atmos. Environ., 169, 287–296, https://doi.org/10.1016/j.atmosenv.2017.09.025, 2017.
Boone, C. D., Bernath, P. F., and Fromm, M. D.: Pyrocumulonimbus stratospheric plume injections measured by the ACE-FTS, Geophys. Res. Lett., 47, e2020GL088442, https://doi.org/10.1029/2020GL088442, 2020.
Boynard, A., Clerbaux, C., Clarisse, L., Safieddine, S., Pommier, M., Van Damme, M. M., Bauduin, S., Oudot, C., Hadji-Lazaro, J., Hurtmans, D., and Coheur, P.-F.: First simultaneous space measurements of atmospheric pollutants in the boundary layer from IASI: a case study in the North China Plain, Geophys. Res. Lett., 41, 645–651, 2014.
Capelle, V., Chédin, A., Siméon, M., Tsamalis, C., Pierangelo, C., Pondrom, M., Crevoisier, C., Crepeau, L., and Scott, N. A.: Evaluation of IASI-derived dust aerosol characteristics over the tropical belt, Atmos. Chem. Phys., 14, 9343–9362, https://doi.org/10.5194/acp-14-9343-2014, 2014.
Carn, S. A., Krueger, A. J., Krotkov, N. A., and Gray, M. A.: Fire at Iraqi sulfur plant emits SO2 clouds detected by Earth Probe TOMS, Geophys. Res. Lett., 31, L19105, https://doi.org/10.1029/2004GL020719, 2004.
Clarisse, L: Daily IASI/Metop-B ULB-LATMOS sulphur dioxide (SO2) L2 product (columns and altitude), AERIS [data set], https://doi.org/10.25326/42, 2019.
Clarisse, L., Coheur, P. F., Prata, A. J., Hurtmans, D., Razavi, A., Phulpin, T., Hadji-Lazaro, J., and Clerbaux, C.: Tracking and quantifying volcanic SO2 with IASI, the September 2007 eruption at Jebel at Tair, Atmos. Chem. Phys., 8, 7723–7734, https://doi.org/10.5194/acp-8-7723-2008, 2008.
Clarisse, L., Coheur, P.-F., Chefdeville, S., Lacour, J.-L., Hurtmans, D., and Clerbaux, C.: Infrared satellite observations of hydrogen sulfide in the volcanic plume of the August 2008 Kasatochi eruption, Geophys. Res. Lett., 38, L10804, https://doi.org/10.1029/2011GL047402, 2011.
Clarisse, L., Hurtmans, D., Clerbaux, C., Hadji-Lazaro, J., Ngadi, Y., and Coheur, P.-F.: Retrieval of sulphur dioxide from the infrared atmospheric sounding interferometer (IASI), Atmos. Meas. Tech., 5, 581–594, https://doi.org/10.5194/amt-5-581-2012, 2012.
Clarisse, L., Coheur, P.-F., Theys, N., Hurtmans, D., and Clerbaux, C.: The 2011 Nabro eruption, a SO2 plume height analysis using IASI measurements, Atmos. Chem. Phys., 14, 3095–3111, https://doi.org/10.5194/acp-14-3095-2014, 2014.
Clarisse, L., Van Damme, M., and Coheur, P.-F.: Standard daily IASI/Metop-B ULB-LATMOS ammonia (NH3) L2 product (total column), AERIS [data set], https://doi.org/10.25326/11, 2018.
Clarisse, L., Clerbaux, C., Franco, B., Hadji-Lazaro, J., Whitburn, S., Kopp, A. K., Hurtmans, D., and Coheur, P.-F.: A decadal data set of global atmospheric dust retrieved from IASI satellite measurements, J. Geophys. Res.-Atmos., 124, 1618–1647, https://doi.org/10.1029/2018JD029701, 2019.
Clarisse, L., Deguine, A., Hultberg, T., Theys, N., Carn, S., Fontijn, K., Decoster, L., Hadji-Lazaro, J., Hurtmans, D., Camy-Peyret, C., Clerbaux, C., and Coheur, P.-F.: Measurements of HCl in the volcanic plumes of Calbuco (2015) and Raikoke (2019), EGU General Assembly 2020, Online, 4–8 May 2020, EGU2020-10651, https://doi.org/10.5194/egusphere-egu2020-10651, 2020.
Clerbaux, C., Boynard, A., Clarisse, L., George, M., Hadji-Lazaro, J., Herbin, H., Hurtmans, D., Pommier, M., Razavi, A., Turquety, S., Wespes, C., and Coheur, P.-F.: Monitoring of atmospheric composition using the thermal infrared IASI/MetOp sounder, Atmos. Chem. Phys., 9, 6041–6054, https://doi.org/10.5194/acp-9-6041-2009, 2009.
Clerbaux, C., Coheur, P.-F., and Hurtmans, D.: Daily IASI/Metop-B ULB-LATMOS carbon monoxide (CO) L2 product (vertical profile and total column – EUMETSAT processing), AERIS [data set], https://doi.org/10.25326/64, 2020.
Coheur, P.-F., Clarisse, L., Turquety, S., Hurtmans, D., and Clerbaux, C.: IASI measurements of reactive trace species in biomass burning plumes, Atmos. Chem. Phys., 9, 5655–5667, https://doi.org/10.5194/acp-9-5655-2009, 2009.
Collard, A. D., McNally, A. P., Hilton, F. I., Healy, S. B., and Atkinson, N. C.: The use of principal component analysis for the assimilation of high-resolution infrared sounder observations for numerical weather prediction, Q. J. Roy. Meteor. Soc., 136, 2038–2050, https://doi.org/10.1002/qj.701, 2010.
De Longueville, H., Clarisse, L., Whitburn, S., Franco, B., Bauduin, S., Clerbaux, C., Camy-Peyret, C., and Coheur, P.-F.: Identification of Short and Long-Lived Atmospheric Trace Gases from IASI Space Observations, Geophys. Res. Lett., 48, e2020GL091742, https://doi.org/10.1029/2020GL091742, 2021.
Duflot, V., Hurtmans, D., Clarisse, L., R'honi, Y., Vigouroux, C., De Mazière, M., Mahieu, E., Servais, C., Clerbaux, C., and Coheur, P.-F.: Measurements of hydrogen cyanide (HCN) and acetylene (C2H2) from the Infrared Atmospheric Sounding Interferometer (IASI), Atmos. Meas. Tech., 6, 917–925, https://doi.org/10.5194/amt-6-917-2013, 2013.
Dufour, G., Eremenko, M., Beekmann, M., Cuesta, J., Foret, G., Fortems-Cheiney, A., Lachâtre, M., Lin, W., Liu, Y., Xu, X., and Zhang, Y.: Lower tropospheric ozone over the North China Plain: variability and trends revealed by IASI satellite observations for 2008–2016, Atmos. Chem. Phys., 18, 16439–16459, https://doi.org/10.5194/acp-18-16439-2018, 2018.
Franco, B., Clarisse, L., Stavrakou, T., Müller, J.-F., Van Damme, M., Whitburn, S., Hadji-Lazaro, J., Hurtmans, D., Taraborrelli, D., Clerbaux, C., and Coheur, P.-F.: A general framework for global retrievals of trace gases from IASI: Application to methanol, formic acid, and PAN, J. Geophys. Res.-Atmos., 123, 13963–13984, https://doi.org/10.1029/2018JD029633, 2018.
Franco, B., Clarisse, L., van Damme, M., Hadji-Lazaro, J., Clerbaux, C., and Coheur, P.-F.: Ethylene industrial emitters seen from space, Nat. Commun., 13, 6452, https://doi.org/10.1038/s41467-022-34098-8, 2022.
Ganci, G., Harris, A. J. L., Del Negro, C., Guehenneux, Y., Cappello, A., Labazuy, P., Calvari, S., and Gouhier, M.: A year of lava fountaining at Etna: Volumes from SEVIRI, Geophys. Res. Lett., 39, L06305, https://doi.org/10.1029/2012GL051026, 2012.
Garcia, M. O., Pietruszka, A. J., Norman, M. D., and Rhodes, J. M.: Kīlauea's Pu`u `Ō`ō Eruption (1983–2018): A synthesis of magmatic processes during a prolonged basaltic event, Chem. Geol., 581, 120391, https://doi.org/10.1016/j.chemgeo.2021.120391, 2021.
García, O. E., Sepúlveda, E., Schneider, M., Hase, F., August, T., Blumenstock, T., Kühl, S., Munro, R., Gómez-Peláez, Á. J., Hultberg, T., Redondas, A., Barthlott, S., Wiegele, A., González, Y., and Sanromá, E.: Consistency and quality assessment of the Metop-A/IASI and Metop-B/IASI operational trace gas products (O3, CO, N2O, CH4, and CO2) in the subtropical North Atlantic, Atmos. Meas. Tech., 9, 2315–2333, https://doi.org/10.5194/amt-9-2315-2016, 2016.
García, O. E., Schneider, M., Ertl, B., Sepúlveda, E., Borger, C., Diekmann, C., Wiegele, A., Hase, F., Barthlott, S., Blumenstock, T., Raffalski, U., Gómez-Peláez, A., Steinbacher, M., Ries, L., and de Frutos, A. M.: The MUSICA IASI CH4 and N2O products and their comparison to HIPPO, GAW and NDACC FTIR references, Atmos. Meas. Tech., 11, 4171–4215, https://doi.org/10.5194/amt-11-4171-2018, 2018.
George, M., Clerbaux, C., Hurtmans, D., Turquety, S., Coheur, P.-F., Pommier, M., Hadji-Lazaro, J., Edwards, D. P., Worden, H., Luo, M., Rinsland, C., and McMillan, W.: Carbon monoxide distributions from the IASI/METOP mission: evaluation with other space-borne remote sensors, Atmos. Chem. Phys., 9, 8317–8330, https://doi.org/10.5194/acp-9-8317-2009, 2009.
Goode, J. G., Yokelson, R. J., Ward, D. E., Susott, R. A., Babbitt, R. E., Davies, M. A., and Hao, W. M.: Measurements of excess O3, CO2, CO, CH4, C2H4, C2H2, HCN, NO, NH3, HCOOH, CH3COOH, HCHO, and CH3OH in 1997 Alaskan biomass burning plumes by airborne Fourier transform infrared spectroscopy (AFTIR), J. Geophys. Res., 105, 22147–22166, https://doi.org/10.1029/2000JD900287, 2000.
Gordon, I. E., Rothman, L. S., Hargreaves, R. J., Hashemi, R., Karlovets, E. V., Skinner, F. M., Conway, E. K., Hill, C., Kochanov, R. V., Tan, Y., Wcisło, P., Finenko, A. A., Nelson, K., Bernath, P. F., Birk, M., Boudon, V., Campargue, A., Chance, K. V., Coustenis, A., Drouin, B. J., Flaud, J.-M., Gamache, R. R., Hodges, J. T., Jacquemart, D., Mlawer, E. J., Nikitin, A. V., Perevalov, V. I., Rotger, M., Tennyson, J., Toon, G. C., Tran, H., Tyuterev, V. G., Adkins, E. M., Baker, A., Barbe, A., Canè, E., Császár, A. G., Dudaryonok, A., Egorov, O., Fleisher, A. J., Fleurbaey, H., Foltynowicz, A., Furtenbacher, T., Harrison, J. J., Hartmann, J.-M., Horneman, V.-M., Huang, X., Karman, T., Karns, J., Kassi, S., Kleiner, I., Kofman, V., Kwabia-Tchana, F., Lavrentieva, N. N., Lee, T. J., Long, D. A., Lukashevskaya, A. A., Lyulin, O. M., Makhnev, V. Y., Matt, W., Massie, S. T., Melosso, M., Mikhailenko, S. N., Mondelain, D., Müller, H. S. P., Naumenko, O. V., Perrin, A., Polyansky, O. L., Raddaoui, E., Raston, P. L., Reed, Z. D., Rey, M., Richard, C., Tóbiás, R., Sadiek, I., Schwenke, D. W., Starikova, E., Sung, K., Tamassia, F., Tashkun, S. A., Vander Auwera, J., Vasilenko, I. A., Vigasin, A. A., Villanueva, G. L., Vispoel, B., Wagner, G., Yachmenev, A., and Yurchenko, S. N.: The HITRAN2020 molecular spectroscopic database, J. Quant. Spectrosc. Ra. 277, 107949, https://doi.org/10.1016/j.jqsrt.2021.107949, 2022.
Gordon, L. S., Rothman, I. E., Hill, C., Kochanov, R. V., Tan, Y., Bernath, P. F., Birk, M., Boudon, V., Campargue, A., Chance, K. V., Drouin, B. J., Flaud, J.-M., Gamache, R. R., Hodges, J. T., Jacquemart, D., Perevalov, V. I., Perrin, A., Shine, K. P., Smith, M.-A. H., Tennyson, J., Toon, G. C., Tran, H., Tyuterev, V. G., Barbe, A., Császár, A. G., Devi, V. M., Furtenbacher, T., Harrison, J. J., Hartmann, J.-M., Jolly, A., Johnson, T. J., Karman, T., Kleiner, I., Kyuberis, A. A., Loos, J., Lyulin, O. M., Massie, S. T., Mikhailenko, S. N., Moazzen-Ahmadi, N., Müller, H. S. P., Naumenko, O. V., Nikitin, A. V., Polyansky, O. L., Rey, M., Rotger, M., Sharpe, S. W., Sung, K., Starikova, E., Tashkun, S. A., Vander Auwera, J., Wagner, G., Wilzewski, J., Wcisło, P., Yu, S., and Zak, E. J.: The HITRAN2016 molecular spectroscopic database, J. Quant. Spectrosc. Ra., 203, 3–69, https://doi.org/10.1016/j.jqsrt.2017.06.038, 2017.
Guedj, S., Guidard, V., and Mahfouf, J. F.: Preliminary studies towards the use of IASI PC products in the Météo-France global data assimilation system, https://nwp-saf.eumetsat.int/publications/vs_reports/nwpsaf-mf-vs-005.pdf (lass access: 19 April 2023), 2015.
Hart, M. A., Cooper, N., Green, D., and Lipson, M.: Urban Climate Science for Planning Healthy Cities, The Synergistic Impacts of Urban Air Pollution Compounding Our Climate Emergency, ISBN 978-3-03-087597-8, https://doi.org/10.1007/978-3-030-87598-5_16, 2022.
Hultberg, T.: IASI Principal Component Compression (IASI PCC) FAQ, March 2009, EUMETSAT technical note, https://www.eumetsat.int/media/8306 (last access: 19 April 2023), 2009.
Hurtmans, D., Coheur, P.-F., Wespes, C., Clarisse, L., Scharfa, O., Clerbaux, C., Hadji-Lazaro, J., Geroge, M., and Turquety, S.: FORLI radiative transfer and retrieval code for IASI, J. Quant. Spectrosc. Ra., 113, 1391–1408, 2012.
Karagulian, F., Clarisse, L., Clerbaux, C., Prata, A. J., Hurtmans, D., and Coheur, P.-F.: Detection of volcanic SO2, ash, and H2SO4 using the Infrared Atmospheric Sounding Interferometer (IASI), J. Geophys. Res., 115, D00L02, https://doi.org/10.1029/2009JD012786, 2010.
Khaykin, S., Legras, B., Bucci, S., Sellitto, P., Isaksen, L., Tencé, F., Bekki, S., Bourassa, A., Rieger, L., Zawada, D., Jumelet, J., and Godin-Beekmann, S.: The 2019/20 Australian wildfires generated a persistent smoke-charged vortex rising up to 35 km altitude, Commun. Earth Environ., 1, 2662–4435, https://doi.org/10.1038/s43247-020-00022-5, 2020.
Li, Q. L., Jacob, D. J., Bey, I., Yantosca, R. M., Zhao, Y., Kondo, Y., and Notholt, J.: Atmospheric hydrogen cyanide (HCN): Biomass burning source, ocean sink?, Geophys. Res. Lett., 27, 357–360, https://doi.org/10.1029/1999gl010935, 2000.
Logan, J. A., Prather, M. J., Wofsy, S. C., and McElroy, M. B.: Tropospheric, chemistry: A global perspective, J. Geophys. Res., 86, 7210–7254, 1981.
Mather, T. A., Allen, A. G., Davison, B., Pyle, D., Oppenheimer, C., and McGonigle, A. J. S.: Nitric acid from volcanoes, Earth Planet. Sci. Lett., 218, 17–30, https://doi.org/10.1016/S0012-821X(03)00640-X, 2004.
Matricardi, M.: A principal component based version of the RTTOV fast radiative transfer model, Q. J. Roy. Meteor. Soc., 136, 1823–1835, https://doi.org/10.1002/qj.680, 2010.
Matricardi, M. and McNally, A. P.: The direct assimilation of principal components of IASI spectra in the ECMWF 4D-Var, Q. J. Roy. Meteor. Soc., 140, 573–582, https://doi.org/10.1002/qj.2156, 2014.
Millard, G. A., Mather, T. A., Pyle, D. M., Rose, W. I., and Thornton, B.: Halogen emissions from a small volcanic eruption: Modeling the peak concentrations, dispersion, and volcanically induced ozone loss in the stratosphere, Geophys. Res. Lett., 33, L19815, https://doi.org/10.1029/2006GL026959, 2006.
Moussallam, Y., Tamburello, G., Peters, N., Apaza, F., Schipper, C. I., Curtis, A., Aiuppa, A., Masias, P., Boichu, M., Bauduin, S., Barnie, T., Bani, P., Giudice, G., and Moussallam, M.: Volcanic gas emissions and degassing dynamics at Ubinas and Sabancaya volcanoes: implications for the volatile budget of the central volcanic zone, J. Volcanol. Geoth. Res., 343, 181–191, 2017.
Reath, K., Pritchard, M., Poland, M., Delgado, F., Carn, S., Coppola, D., Andrews, B., Ebmeier, S. K., Rumpf, E., Henderson, S., Baker, S., Lundgren, P., Wright, R., Biggs, J., Lopez, T., Wauthier, C., Moruzzi, S., Alcott, A., Wessels, R., Griswold, J. Ogburn, S., Loughlin, S., Meyer, F., Vaughan, G., and Bagnardi, M.: Thermal, deformation, and degassing remote sensing time series (CE 2000–2017) at the 47 most active volcanoes in Latin America: Implications for volcanic systems, J. Geophys. Res.-Sol. Ea., 124, 195–218, https://doi.org/10.1029/2018JB016199, 2019.
R'Honi, Y., Clarisse, L., Clerbaux, C., Hurtmans, D., Duflot, V., Turquety, S., Ngadi, Y., and Coheur, P.-F.: Exceptional emissions of NH3 and HCOOH in the 2010 Russian wildfires, Atmos. Chem. Phys., 13, 4171–4181, https://doi.org/10.5194/acp-13-4171-2013, 2013.
Rosanka, S., Franco, B., Clarisse, L., Coheur, P.-F., Pozzer, A., Wahner, A., and Taraborrelli, D.: The impact of organic pollutants from Indonesian peatland fires on the tropospheric and lower stratospheric composition, Atmos. Chem. Phys., 21, 11257–11288, https://doi.org/10.5194/acp-21-11257-2021, 2021.
Rose, W. I., Millard, G. A., Mather, T. A., Hunton, D. E., Anderson, B., Oppenheimer, C., Thornton, B. F., Gerlach, T. M., Viggiano, A. A., Kondo, Y., Miller, T. M., and Ballenthin, J. O.: Atmospheric chemistry of a 33–34 hour old volcanic cloud from Hekla Volcano (Iceland): Insights from direct sampling and the application of chemical box modeling, J. Geophys. Res., 111, D20206, https://doi.org/10.1029/2005JD006872, 2006.
Sennert, S. K. (Ed.): Global Volcanism Program, 2015. Report on Calbuco (Chile), Weekly Volcanic Activity Report, 19 August–25 August 2015, Smithsonian Institution and US Geological Survey, https://volcano.si.edu/showreport.cfm?doi=GVP.WVAR20150819-311360 (last access: 18 April 2023), 2015.
Sennert, S. K. (Ed.): Global Volcanism Program, 2019. Report on Raikoke (Russia), Weekly Volcanic Activity Report, 19 June–25 June 2019, Smithsonian Institution and US Geological Survey, https://volcano.si.edu/showreport.cfm?doi=GVP.WVAR20190619-290250 (last access: 18 April 2023), 2019a.
Sennert, S. K. (Ed.): Global Volcanism Program, 2019. Report on Ubinas (Peru), Weekly Volcanic Activity Report, 17 July–23 July 2019, Smithsonian Institution and US Geological Survey, https://volcano.si.edu/showreport.cfm?wvar=GVP.WVAR20190619-354020 (last access: 18 April 2023), 2019b.
Sharpe, S. W., Johnson, T. J., Sams, R. L., Chu, P. M., Rhoderick, G. C., and Johnson, P. A.: Gas-phase databases for quantitative infrared spectroscopy, Appl. Spectrosc., 58, 1452–1461, 2004.
Tamburello, G., Aiuppa, A., McGonigle, A. J. S., Allard, P., Cannata, A., Giudice, G., Kantzas, E. P., and Pering, T. D.: Periodic volcanic degassing behavior: The Mount Etna example, Geophys. Res. Lett., 40, 4818–4822, https://doi.org/10.1002/grl.50924, 2013.
Turquety, S., Hurtmans, D., Hadji-Lazaro, J., Coheur, P.-F., Clerbaux, C., Josset, D., and Tsamalis, C.: Tracking the emission and transport of pollution from wildfires using the IASI CO retrievals: analysis of the summer 2007 Greek fires, Atmos. Chem. Phys., 9, 4897–4913, https://doi.org/10.5194/acp-9-4897-2009, 2009.
Van Damme, M., Clarisse, L., Heald, C. L., Hurtmans, D., Ngadi, Y., Clerbaux, C., Dolman, A. J., Erisman, J. W., and Coheur, P. F.: Global distributions, time series and error characterization of atmospheric ammonia (NH3) from IASI satellite observations, Atmos. Chem. Phys., 14, 2905–2922, https://doi.org/10.5194/acp-14-2905-2014, 2014.
Van Damme, M., Whitburn, S., Clarisse, L., Clerbaux, C., Hurtmans, D., and Coheur, P.-F.: Version 2 of the IASI NH3 neural network retrieval algorithm: near-real-time and reanalysed datasets, Atmos. Meas. Tech., 10, 4905–4914, https://doi.org/10.5194/amt-10-4905-2017, 2017.
Van Damme, M., Clarisse, L., Franco, F., Sutton, M., Willem Erisman, J., Wichink Kruit, R., van Zanten, M., Whitburn, S., Hadji-Lazaro, J., Hurtmans, D., Clerbaux, C., and Coheur, P.-F.: Global, regional and national trends of atmospheric ammonia derived from a decadal (2008–2018) satellite record, Environ. Res. Lett., 16, 055017, https://doi.org/10.1088/1748-9326/abd5e0, 2021.
Varley, N. and Taran, Y.: Degassing processes of Popocatépetl and Volcán de Colima, Mexico, Geol. Soc., 213, 263–280, https://doi.org/10.1144/GSL.SP.2003.213.01.16, 2003.
Venzke, E. (Ed.): Report on Ubinas (Peru), Bulletin of the Global Volcanism Network, Global Volcanism Program, 44, 9, Smithsonian Institution, https://doi.org/10.5479/si.GVP.BGVN201909-354020, 2019.
Wespes, C., Hurtmans, D., Chabrillat, S., Ronsmans, G., Clerbaux, C., and Coheur, P.-F.: Is the recovery of stratospheric O3 speeding up in the Southern Hemisphere? An evaluation from the first IASI decadal record (2008–2017), Atmos. Chem. Phys., 19, 14031–14056, https://doi.org/10.5194/acp-19-14031-2019, 2019.
Wright, C. J., Hindley, N. P., Alexander, M. J., Barlow, M., Hoffmann, L., Mitchell, C. N., Prata, F., Bouillon, M., Carstens, J., Clerbaux, C., Osprey, S. M., Powell, N., Randall, C. E., and Yue, J.: Surface-to-space atmospheric waves from Hunga Tonga-Hunga Ha'apai eruption, Nature, 609, 741–746, https://doi.org/10.1038/s41586-022-05012-5, 2022.
Zarzana, K. J., Selimovic, V., Koss, A. R., Sekimoto, K., Coggon, M. M., Yuan, B., Dubé, W. P., Yokelson, R. J., Warneke, C., de Gouw, J. A., Roberts, J. M., and Brown, S. S.: Primary emissions of glyoxal and methylglyoxal from laboratory measurements of open biomass burning, Atmos. Chem. Phys., 18, 15451–15470, https://doi.org/10.5194/acp-18-15451-2018, 2018.
- Abstract
- Introduction
- The IASI radiance data
- The principal component analysis method
- The IASI-PCA granule-extrema-based method
- Case studies
- Conclusions and perspectives
- Data availability
- Author contributions
- Competing interests
- Disclaimer
- Acknowledgements
- Financial support
- Review statement
- References