the Creative Commons Attribution 4.0 License.
the Creative Commons Attribution 4.0 License.
 | 16 May 2023
Satellite remote-sensing capability to assess tropospheric-column ratios of formaldehyde and nitrogen dioxide: case study during the Long Island Sound Tropospheric Ozone Study 2018 (LISTOS 2018) field campaign
Matthew S. Johnson
Amir H. Souri
Sajeev Philip
Rajesh Kumar
Aaron Naeger
Jeffrey Geddes
Laura Judd
Scott Janz
Heesung Chong
John Sullivan
Satellite retrievals of tropospheric-column formaldehyde (HCHO) and nitrogen dioxide (NO2) are frequently used to investigate the sensitivity of ozone (O3) production to emissions of nitrogen oxides and volatile organic carbon compounds. This study inter-compared the systematic biases and uncertainties in retrievals of NO2 and HCHO, as well as resulting HCHO–NO2 ratios (FNRs), from two commonly applied satellite sensors to investigate O3 production sensitivities (Ozone Monitoring Instrument, OMI, and TROPOspheric Monitoring Instrument, TROPOMI) using airborne remote-sensing data taken during the Long Island Sound Tropospheric Ozone Study 2018 between 25 June and 6 September 2018. Compared to aircraft-based HCHO and NO2 observations, the accuracy of OMI and TROPOMI were magnitude-dependent with high biases in clean environments and a tendency towards more accurate comparisons to even low biases in moderately polluted to polluted regions. OMI and TROPOMI NO2 systematic biases were similar in magnitude (normalized median bias, NMB = 5 %–6 %; linear regression slope ≈ 0.5–0.6), with OMI having a high median bias and TROPOMI resulting in small low biases. Campaign-averaged uncertainties in the three satellite retrievals (NASA OMI; Quality Assurance for Essential Climate Variables, QA4ECV OMI; and TROPOMI) of NO2 were generally similar, with TROPOMI retrievals having slightly less spread in the data compared to OMI. The three satellite products differed more when evaluating HCHO retrievals. Campaign-averaged tropospheric HCHO retrievals all had linear regression slopes ∼0.5 and NMBs of 39 %, 17 %, 13 %, and 23 % for NASA OMI, QA4ECV OMI, and TROPOMI at finer () and coarser () spatial resolution, respectively. Campaign-averaged uncertainty values (root mean square error, RMSE) in NASA and QA4ECV OMI HCHO retrievals were molecules cm−2 (∼ 50 %–55 % of mean column abundance), and the higher-spatial-resolution retrievals from TROPOMI resulted in RMSE values ∼30 % lower. Spatially averaging TROPOMI tropospheric-column HCHO, along with NO2 and FNRs, to resolutions similar to the OMI reduced the uncertainty in these retrievals. Systematic biases in OMI and TROPOMI NO2 and HCHO retrievals tended to cancel out, resulting in all three satellite products comparing well to observed FNRs. However, while satellite-derived FNRs had minimal campaign-averaged median biases, unresolved errors in the indicator species did not cancel out in FNR calculations, resulting in large RMSE values compared to observations. Uncertainties in HCHO retrievals were determined to drive the unresolved biases in FNR retrievals.
- Article
(3666 KB) - Full-text XML
-
Supplement
(2195 KB) - BibTeX
- EndNote


Tropospheric ozone (O3) is a harmful pollutant, and near-surface concentrations of this species have detrimental impacts on human and environmental health (Kampa and Castanas, 2008; Van Dingenen et al., 2009). The production and destruction rates of tropospheric O3 are controlled by complex chemical reactions involving the primary precursor species of nitrogen oxides (NOx: nitric oxide and nitrogen dioxide (NO+NO2)) and volatile organic compounds (VOCs) (Sillman, 1999; Lelieveld and Dentener, 2000). It is critical to understand precursor species emissions and subsequent atmospheric chemistry controlling surface-level O3 production rates since the United States (US) Environmental Protection Agency (EPA) enforces concentration limits of criteria pollutants (e.g., O3, NO2, carbon monoxide, particulate matter, and sulfur dioxide) under the National Ambient Air Quality Standards (NAAQS) (US EPA, 2015). To reduce and maintain surface-level O3 concentrations below NAAQS thresholds, many regions have implemented emission control strategies for precursor species. To design effective emission reduction strategies, knowledge about the non-linear sensitivity of O3 formation to NOx and VOCs is critical (Crutzen, 1973; Sillman, 1999). Based on the relative concentrations of NOx and VOCs, O3 formation is sensitive to perturbations of either NOx (NOx-limited regimes) or VOC emissions (NOx-saturated or VOC- or radical-limited regimes). These O3 sensitivity regimes are separated by a transitional regime where O3 formation is sensitive to both NOx and VOC emissions.
To understand the non-linear relationship of O3 formation to NOx and VOC emissions in complex chemical environments (e.g., polluted regions and areas of heterogeneous emissions of NOx and VOCs), spatiotemporally dense in situ measurements or airborne remote-sensing observations of precursor species are desired (e.g., Souri et al., 2020). Since these measurements are often spatiotemporally sparse, satellite retrievals of chemical proxies for NOx (i.e., NO2) and VOCs (i.e., formaldehyde, HCHO) have been demonstrated to provide insight into the O3–NOx–VOC relationship (Tonnesen and Dennis, 2000; Martin et al., 2004; Duncan et al., 2010; Souri et al., 2017; Jin et al., 2017, 2020). The HCHO–NO2 concentration ratio (hereinafter FNR) has been shown to provide information to monitor the local sensitivity of O3 production from the chemical loss of HO2+RO2 and chemical loss of NOx controlling O3–NOx–VOC chemistry (Tonnesen and Dennis, 2000; Kleinman et al., 2001).
Multiple past and current space-based spectrometers have the capability to retrieve simultaneous NO2 and HCHO tropospheric columns to calculate FNRs including the Global Ozone Monitoring Experiment (GOME; Martin et al., 2004), GOME-2 (Choi et al., 2012), Ozone Monitoring Instrument (OMI; Duncan et al., 2010), SCanning Imaging Absorption spectroMeter for Atmospheric CHartographY (SCIAMACHY; Jin et al., 2020), and TROPOspheric Monitoring Instrument (TROPOMI; Chan et al., 2020; Souri et al., 2021). In addition to these low Earth orbiting (LEO) satellites, Tropospheric Emissions: Monitoring of Pollution (TEMPO) is a upcoming National Aeronautics and Space Administration (NASA) geostationary satellite mission which will retrieve hourly NO2 and HCHO tropospheric columns over North America (Zoogman et al., 2017; Chance et al., 2019). This geostationary sensor is part of a constellation of air quality spaceborne sensors including the Geostationary Environment Monitoring Spectrometer (GEMS) instrument onboard the Korea Aerospace Research Institute GEO-KOMPSAT-2B satellite (Kim et al., 2020) and the European Space Agency (ESA) Sentinel-4 mission (ESA, 2017). Satellite retrievals of NO2 and HCHO have been applied to determine the sensitivity of O3 formation to NOx and VOC emissions at coarse spatial and temporal scales (e.g., Martin et al., 2004; Duncan et al., 2010) to finer spatiotemporal scales and focusing on long-term trends (e.g., Choi et al., 2012; Jin and Holloway, 2015; Choi and Souri, 2015; Schroeder et al., 2017; Souri et al., 2017; Jin et al., 2017, 2020). However, uncertainties remain in how accurately satellites can retrieve information needed to study planetary boundary layer (PBL) O3–NOx–VOC relationships. These uncertainties stem from (a) the exact thresholds of FNRs that separate NOx-limited, transition, and VOC-limited regimes; (b) the ability of tropospheric-column retrievals to represent PBL chemical composition due to variability in the vertical structure of NO2 and HCHO concentrations and satellite sensitivity throughout the entire troposphere; (c) whether HCHO is an effective proxy for total VOC reactivity; (d) satellite spatial representation errors; and (e) the accuracy and uncertainty in satellite retrievals of tropospheric-column HCHO and NO2. Of all these sources of uncertainty, systematic and random biases due to noise in satellite retrievals may be the largest source of error for retrieving FNRs (Souri et al., 2023).
This study is designed to demonstrate the effectiveness of two frequently applied satellites for evaluating O3–NOx–VOC relationships (i.e., OMI and TROPOMI) to accurately retrieve tropospheric HCHO and NO2 columns and FNRs. OMI and TROPOMI retrievals have been evaluated in numerous studies (e.g., Judd et al., 2020; Vigouroux et al., 2020; Zhu et al., 2020; Lamsal et al., 2021), typically focusing on a specific sensor and species (e.g., evaluating OMI or TROPOMI and NO2 or HCHO separately), however, not for the accuracy to retrieve tropospheric-column FNRs. Here we validate OMI and TROPOMI retrievals of HCHO and NO2, as well as subsequent FNRs, with airborne spectrometer data obtained during the Long Island Sound Tropospheric Ozone Study 2018 (LISTOS 2018) field campaign conducted during the summer of 2018 in the northeastern region of the US. Furthermore, this work investigates the capability of OMI and TROPOMI to capture the spatiotemporal variability in observed FNRs and discusses the possible causes of systematic error and uncertainties in these retrievals.
This study focuses on the spatial domain and time period (25 June to 6 September 2018) of the LISTOS 2018 field campaign (https://www.nescaum.org/documents/listos, last access: 8 May 2023). This campaign was chosen due to the overlap of the TROPOMI and OMI missions; the availability of airborne spectrometer retrievals (i.e., Geostationary Trace gas and Aerosol Sensor Optimization, GeoTASO, and GEOstationary Coastal and Air Pollution Events (GEO-CAPE) Airborne Simulator, GCAS) of tropospheric-column HCHO and NO2, which are effective satellite validation data (e.g., Judd et al., 2020); and the large spatiotemporal coverage of the airborne spectrometer data. Studies have applied stationary sources of ground-based remote-sensing data to validate OMI and TROPOMI (e.g., multi-axis differential optical absorption spectroscopy, MAX-DOAS; Fourier-transform infrared, FTIR; and Pandora); however, using the airborne data allows for the evaluation of satellite retrievals in variable environments (i.e., clean to heterogeneous and polluted regions).
2.1 OMI remote-sensing products
The nadir-viewing OMI sensor, on the polar-orbiting NASA Aura satellite launched in 2004, is an ultraviolet–visible (UV–Vis) spectrometer (Levelt et al., 2006). Retrievals are made from three wavelength channels between 260 and 510 nm (UV-1: 264 to 311 nm, UV-2: 307 to 383 nm, Vis: 349 to 504 nm). Aura OMI has a local equatorial overpass time of ∼ 13:45 LT (local time) with nearly complete daily global surface coverage due to the large ∼2600 km swath width. Level-2 (L2) tropospheric vertical column density (VCD) OMI NO2 retrievals from the NASA version 4 standard product (OMNO2; Lamsal et al., 2021) and the NASA operational OMI HCHO version 3 product using the Smithsonian Astrophysical Observatory (SAO) retrieval algorithm (OMHCHO; González Abad et al., 2015, 2016) were applied in this study. To investigate the impact of different retrieval algorithms, we also apply tropospheric-column OMI NO2 and HCHO data derived in the Quality Assurance for Essential Climate Variables (QA4ECV) project.
Starting in 2007, OMI experienced a field-of-view blockage known as the “row anomaly”, which affects the data quality at all retrieval wavelengths for some rows (Dobber et al., 2008; Schenkeveld et al., 2017). The row anomaly in NO2 and HCHO retrievals was avoided using data quality flags to filter out pixels flagged by the row anomaly detection algorithm. OMI also has systematically biased retrievals in a striped pattern running in 60 cross-track fields of view. A “destriping” correction is applied to NO2 data (Boersma et al., 2011), and the reference sector method corrects this artifact in HCHO data (De Smedt et al., 2015; González Abad et al., 2015; Zara et al., 2018).
2.1.1 OMI – NASA OMNO2 and OMHCHO
The primary OMI data used in this study are the L2 tropospheric VCD OMNO2 and OMHCHO retrievals provided at ∼13 km×24 km near the nadir to ∼24 km × 160 km towards the edge of the swath. Lamsal et al. (2021) describe the OMNO2 retrieval algorithm (referred to as NASA OMI NO2) in detail, and it is explained here briefly. The NASA OMI NO2 retrieval uses a differential optical absorption spectroscopy (DOAS) approach, with a fitting window between 405 and 465 nm, to derive slant column densities (SCDs). Tropospheric NO2 columns are separated from the entire atmospheric column using an observation-based stratosphere–troposphere separation scheme (Bucsela et al., 2013). Tropospheric SCDs are converted to tropospheric VCDs using an air mass factor (AMF) calculated with a radiative transfer model and simulated atmospheres from a chemical transport model (CTM). Specifics for the data used in AMF calculations for NASA OMI NO2 are presented in Table S1 in the Supplement. Tropospheric AMFs are calculated in NASA OMI NO2 retrievals using monthly averaged a priori profiles from the NASA Global Modeling Initiative (GMI) model at spatial resolution, clouds from the OMI O2–O2 algorithm (Acarreta et al., 2004; Veefkind et al., 2016; Vasilkov et al., 2018), and surface albedo from geometry-dependent surface Lambertian-equivalent reflectivity (GLER) data (Vasilkov et al., 2017; Qin et al., 2019; Fasnacht et al., 2019). The uncertainty in the NASA OMI NO2 product has been shown to vary with cloudiness and pollution levels and is in the range of ∼20 % to ∼60 % (Bucsela et al., 2013), with contributions from errors in spectral fitting, stratospheric correction, and AMF calculations.
González Abad et al. (2015, 2016) describe the OMHCHO retrieval algorithm in detail (referred to here as NASA OMI HCHO). Retrievals of HCHO SCDs are obtained by spectrally fitting OMI radiances using the basic optical absorption spectroscopy (BOAS) method (Chance, 1998) with a fitting window between 328.5 and 356.5 nm. HCHO SCDs are converted to VCDs, applying AMFs using GEOS-Chem (Goddard Earth Observing System) a priori profiles at spatial resolution, cloud information (Martin et al., 2002; Acarreta et al., 2004), and surface albedo data (Kleipool et al., 2008). Information about the input data for NASA OMI HCHO AMF calculations is presented in Table S1. Finally, postprocessing across-track bias corrections are applied by comparing daily HCHO VCDs with VCDs simulated with the GEOS-Chem CTM over a clean region (known as the reference sector). NASA OMI HCHO uncertainties have been shown to vary with pollution levels ranging from ∼45 % to ∼105 %, with the largest contributions from the spectral fitting and AMF calculations (González Abad et al., 2015, 2016).
2.1.2 OMI – QA4ECV NO2 and HCHO
We also evaluated OMI NO2 and HCHO retrievals from the QA4ECV project (https://knmi.sitearchief.nl/?subsite=qa4ecv#archive, last access: 8 May 2023). Retrievals from the QA4ECV NO2 version 1.1 and QA4ECV HCHO version 1.2 data products are provided daily at the same spatial resolution as the NASA OMI products. Zara et al. (2018) describe the QA4ECV OMI NO2 and HCHO slant column retrievals, and Boersma et al. (2018) and De Smedt et al. (2018) describe the entire QA4ECV OMI NO2 and HCHO retrieval algorithms, respectively, in detail. They are summarized here briefly.
QA4ECV retrievals of NO2 SCDs are obtained by linear fits of optical depths to the observed optical depth using the DOAS technique with a fitting window between 405 and 465 nm (Boersma et al., 2018). The QA4ECV NO2 retrieval differs from the NASA OMI NO2 retrieval in some of the retrieval steps (Compernolle et al., 2020). To calculate tropospheric AMFs, the QA4ECV NO2 retrieval algorithm uses the surface albedo (Kleipool et al., 2008) and cloud products (Veefkind et al., 2016) from the previous NASA OMI NO2 version 3 product (see Lamsal et al., 2021), however, using a priori profiles from the Tracer Model version 5 (TM5) CTM at . Tropospheric VCDs are separated from the entire column using the global TM5 assimilation model. For detailed information on the differences in spectral fitting between the NASA OMI NO2 and QA4ECV NO2 retrieval algorithms, we refer you to Zara et al. (2018). For details about differences between AMF calculations in the NASA and QA4ECV OMI algorithms, see Lorente et al. (2017). QA4ECV NO2 data have been shown to perform relatively well in clean to moderately polluted regions and have a low bias in highly polluted regions (Compernolle et al., 2020). Retrievals of QA4ECV HCHO SCDs are conducted in a manner similar to QA4ECV NO2 using the DOAS technique and optical depths with a fitting window between 328.5 and 359.0 nm (Zara et al., 2018; De Smedt et al., 2018). For information about the inputs used in AMF calculations for QA4ECV OMI NO2 and HCHO retrievals, see Table S1. QA4ECV HCHO retrievals show minimal bias in clean to moderately polluted regions and low biases in polluted locations (e.g., De Smedt et al., 2021).
2.2 TROPOMI remote-sensing products
The TROPOMI hyperspectral spectrometer (including eight bands in the UV, VIS, near-infrared, and shortwave infrared wavelengths) is on the Sentinel-5 Precursor (S5P) satellite which was launched in October 2017. TROPOMI is in orbit with a local equatorial overpass time (∼ 13:30 local time) similar to OMI. TROPOMI has a swath width of ∼2600 km and a ground pixel size of 3.5 km × 7.0 km at nadir during LISTOS 2018 (since 6 August 2019 TROPOMI data have been available at 3.5 km × 5.5 km), which is >12 times finer than OMI. TROPOMI retrievals have been used in numerous recent studies investigating processes controlling NO2 concentrations and trends (e.g., Goldberg et al., 2021) and FNRs (Wu et al., 2022), taking advantage of the high spatial resolution of the sensor, along with being validated thoroughly (e.g., Judd et al., 2020; De Smedt et al., 2021). The high-spatial-resolution information provided by TROPOMI, compared to past UV–Vis spaceborne sensors, reduces the representation error in each retrieved NO2 and HCHO pixel (Souri et al., 2022). In this study, we apply daily TROPOMI tropospheric-column NO2 v2.3.1 (van Geffen et al., 2022) and HCHO v1.1.5 retrievals (De Smedt et al., 2018). For TROPOMI NO2 data we used the product provided by the Product Algorithm Laboratory (PAL). The retrievals of both species use QA4ECV methods described above with spectral fitting windows between 405.0 and 465.0 nm for NO2 (Boersma et al., 2018) and 328.5 and 359.0 nm for HCHO (De Smedt et al., 2018). TROPOMI retrievals are similar to those from the QA4ECV OMI product as it applies the same a priori profiles, albedo data, and cloud fraction information. TROPOMI NO2 v2.3.1 retrievals do differ from QA4ECV OMI NO2 products as it uses cloud pressure input from the O2–A band following the FRESCO+ (Fast Retrieval Scheme for Clouds from the Oxygen A band) wide approach (van Geffen et al., 2022). TROPOMI HCHO v1.1.5 retrievals differ from the QA4ECV OMI HCHO data by applying the S5P ROCINN (Retrieval of Cloud Information using Neural Networks) algorithm which uses the O2–A for cloud pressures (Loyola et al., 2018). For more information about the input data used in AMF calculations for TROPOMI NO2 and HCHO retrievals, see Table S1.
2.3 Airborne spectrometers
The primary evaluation data set used in this study is from the UV–Vis airborne remote-sensing data product from GeoTASO and GCAS. Since no bias-corrected tropospheric-column HCHO data are available during LISTOS 2018 from the Pandora network, this ground-based remote-sensing network is not applied here. Both the GeoTASO and GCAS instruments and retrievals are very similar and together provide a consistent evaluation data set (see details on the instruments and NO2 and HCHO retrievals in Kowalewski and Janz, 2014; Leitch et al., 2014; Nowlan et al., 2016, 2018; and Judd et al., 2020). GeoTASO and GCAS data were obtained from a nominal flight altitude of 9 km above ground level (a.g.l.) covering the majority of the troposphere. Airborne data from 13 flight days during LISTOS 2018 (see Table 1) are provided with a native spatial resolution of 250 m ×250 m. To reduce noise in the raw GeoTASO and GCAS retrievals, the data were averaged to a 1 km × 1 km spatial resolution. In total, measurements from 8 and 12 flight days were spatiotemporally co-located with OMI and TROPOMI overpasses, respectively.
Table 1Airborne (GeoTASO and GCAS) flight information (date, flight times, number of co-located satellite and airborne FNR grids) used in this study.
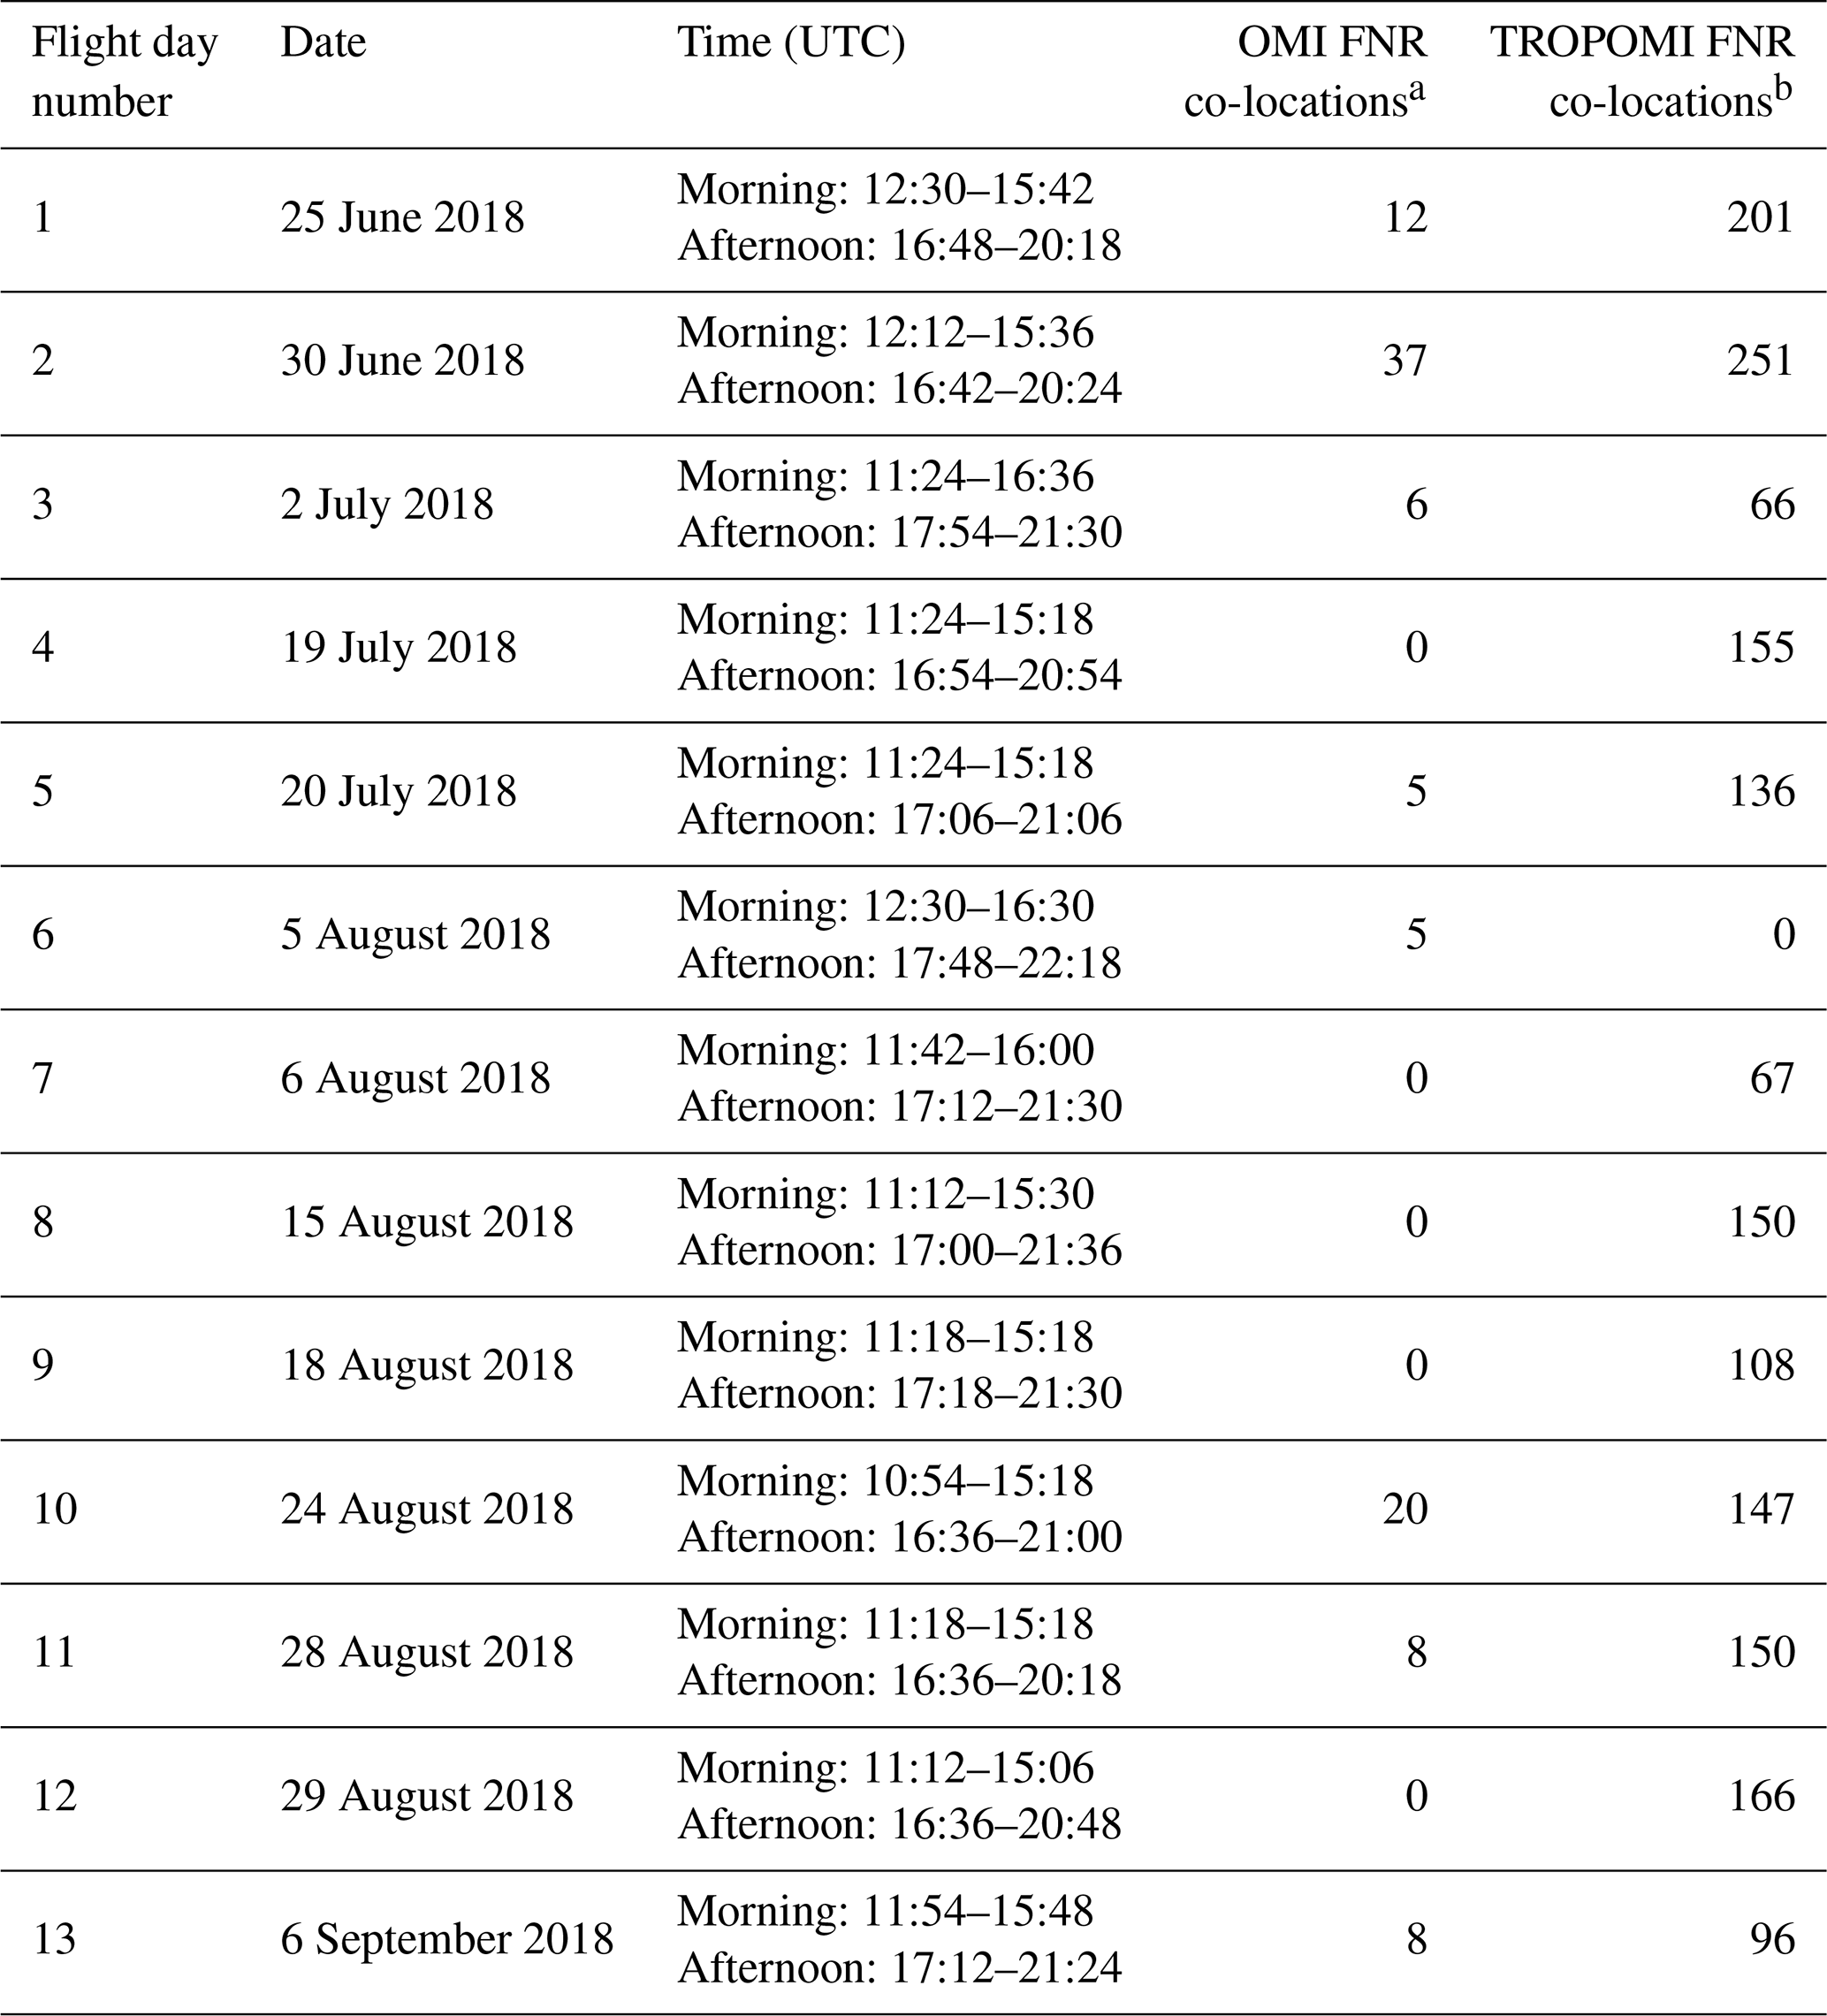
a OMI FNR co-locations at spatial resolution. b TROPOMI FNR co-locations at spatial resolution.
The airborne GeoTASO and GCAS retrievals used as the reference data set for validating all satellite data are not without error. A nearly identical airborne NO2 data set used here was applied in Judd et al. (2020) and was evaluated with Pandora systems. Judd et al. (2020) demonstrated that the airborne NO2 retrievals had a median bias of ∼1 %, with no magnitude-dependent biases, and uncertainty within ±25 %. Due to limited availability of Pandora HCHO data, airborne GeoTASO and GCAS retrievals of this species have had minimal evaluation. Nowlan et al. (2018) did evaluate GCAS tropospheric HCHO retrievals using airborne in situ measurements and determined GCAS had generally good performance with a <10 % bias (minimal magnitude dependence in bias) and high correlation with observations. Overall, the satisfactory comparison of airborne GeoTASO and GCAS tropospheric-column NO2 and HCHO with independent observations provides confidence that this data can be applied as a reference data set to validate OMI and TROPOMI. However, it should be kept in mind that there is some level of error associated with the GeoTASO and GCAS data (e.g., Nowlan et al., 2016, 2018; Judd et al., 2020).
The GeoTASO and GCAS data taken during LISTOS 2018 provided a novel opportunity to use airborne observations to validate both OMI and TROPOMI coincidently. This airborne data differ from many of the recent satellite validation studies which use longer-term information from networks of point-source measurements (e.g., Pandora, MAX-DOAS) (e.g., Compernolle et al., 2020; Vigouroux et al., 2020; Verhoelst et al., 2021; Lamsal et al., 2021; Souri et al., 2023). The airborne sensors allowed for evaluation of OMI and TROPOMI over large areas which equates to having tens to hundreds of clustered ground-based systems on each flight day. Having long-term observations for robust temporal validation of satellite sensors is ideal; however, this case study is unique in that it provides information about the performance of coincident retrievals from OMI and TROPOMI over variable emission source regions (urban to rural areas) and scenes with differing geophysical characteristics (e.g., surface albedo, tropospheric compositions, clouds, aerosol amounts) during a single flight, which is another novel aspect. Even though there are limited observations available from the flights in LISTOS 2018 (Table 1), all correlation statistics presented in this study (Tables 2 and 3) are significant to a 95 % confidence interval (p value <0.05).
Table 2Statistical evaluation of NASA OMI, QA4ECV OMI, and TROPOMI retrievals of tropospheric-column NO2 and HCHO and resulting FNRs. Statistics presented are the number of co-located grids (N), mean concentration ± standard deviation from satellite (sat. conc.) and airborne (air. conc.) retrievals, median bias ± bias standard deviation, NMB (%), RMSE, coefficient of determination (R2 a), and linear regression slope.
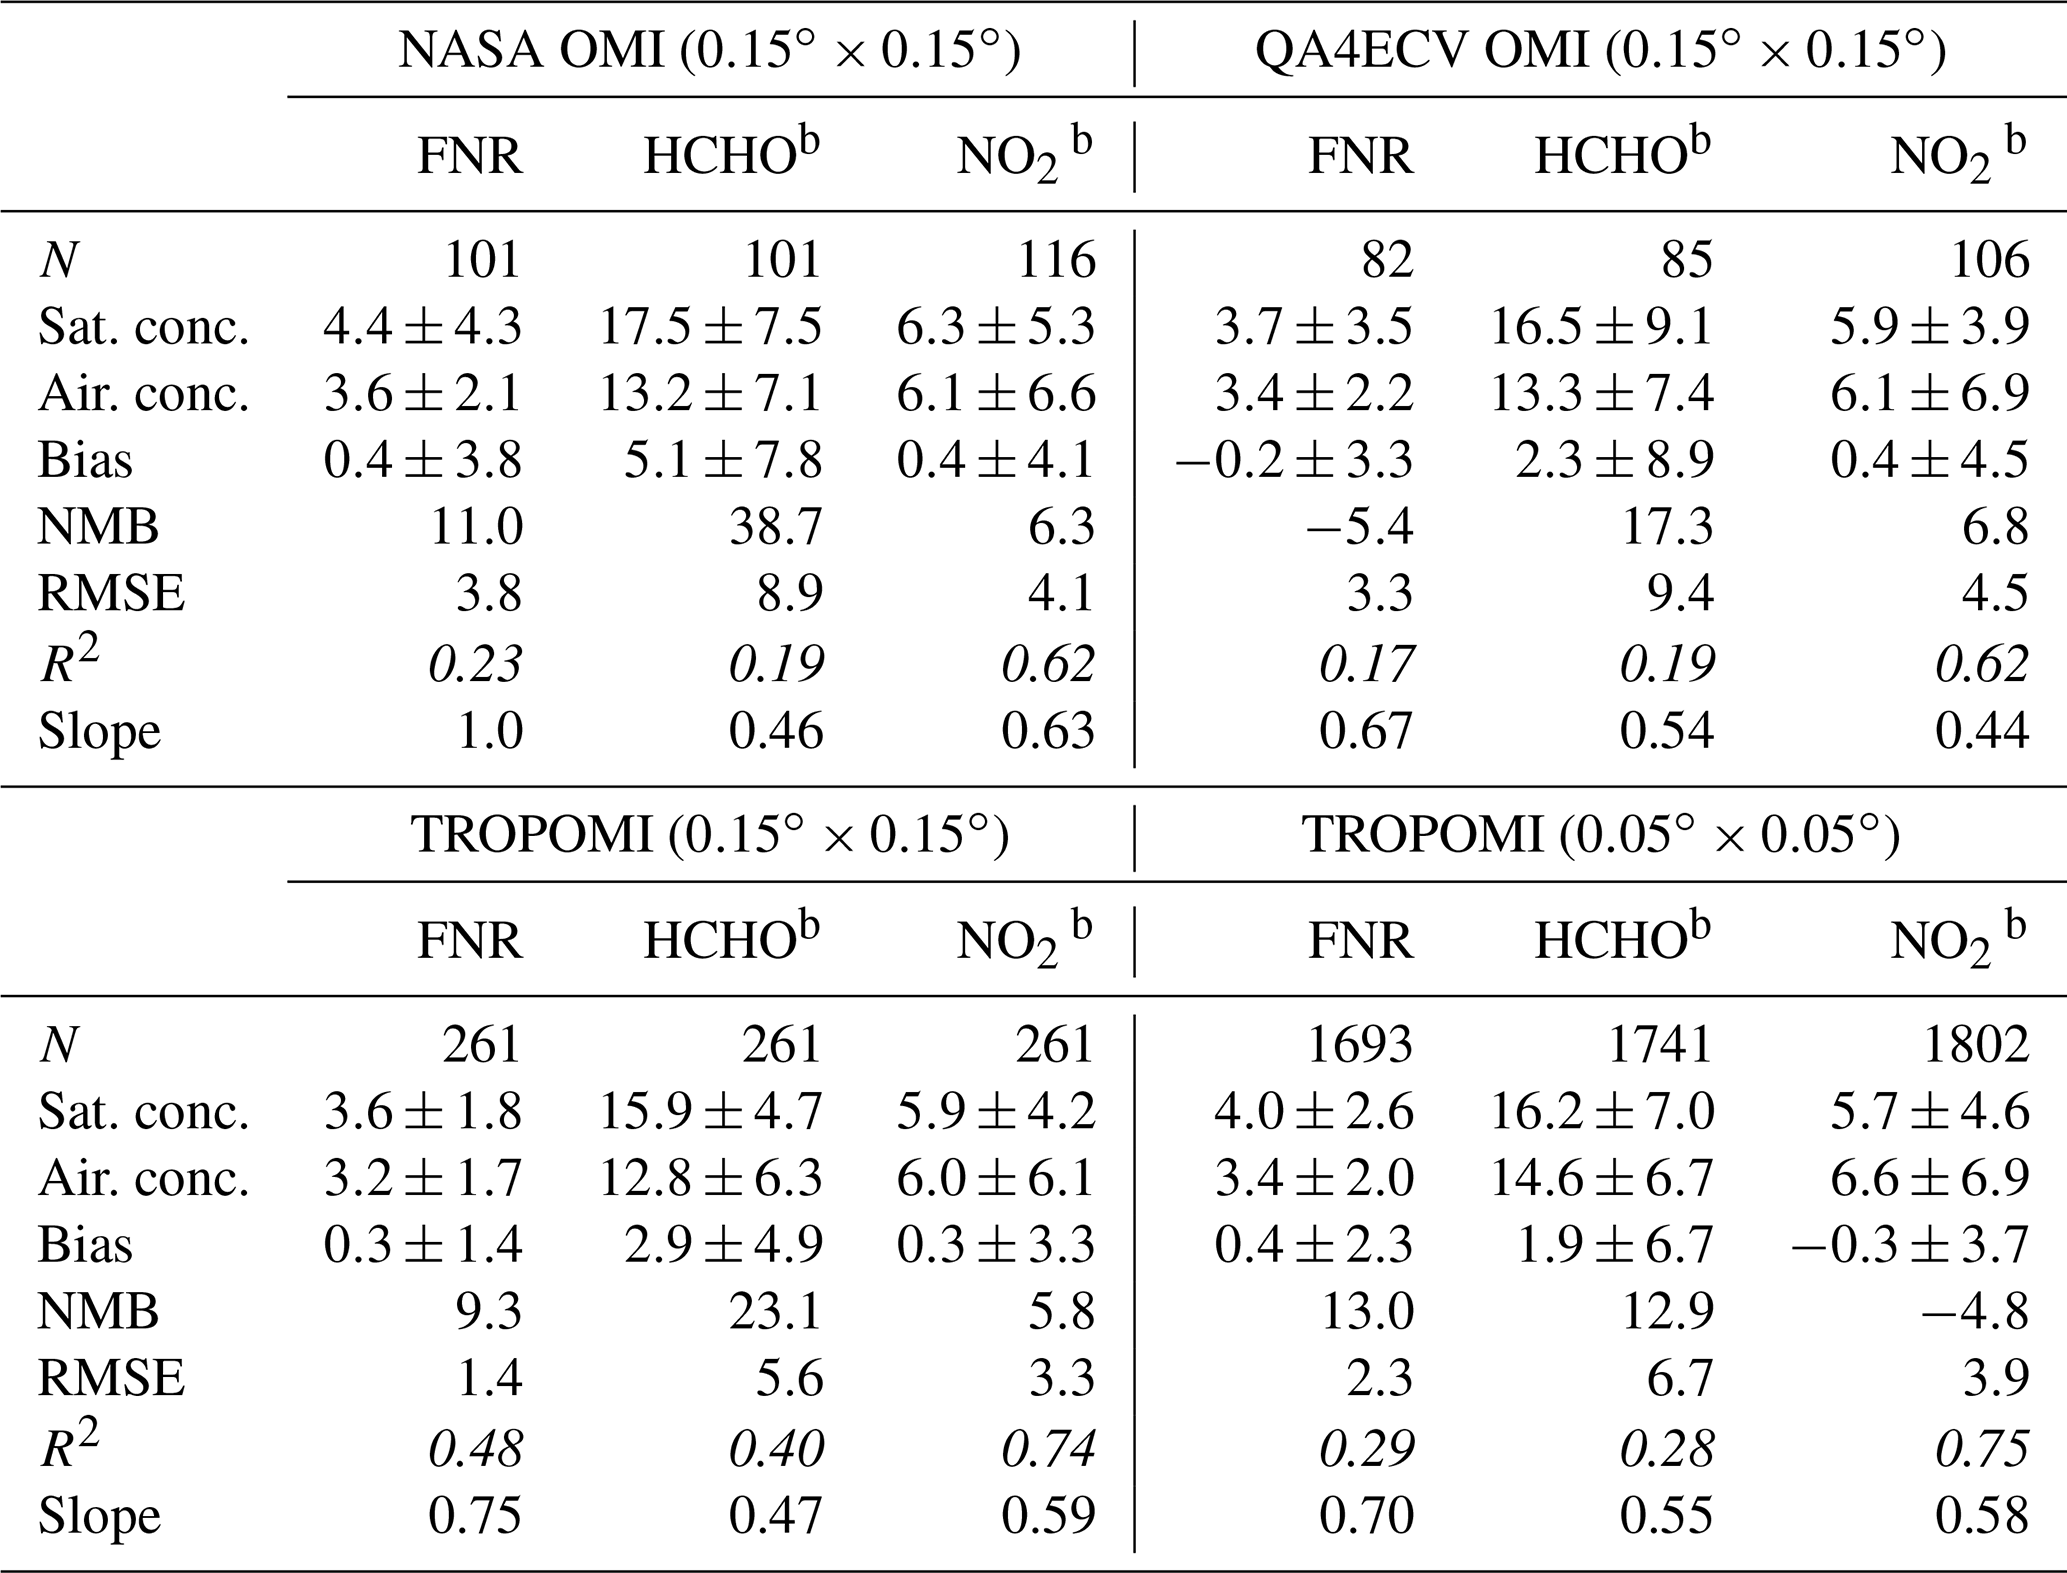
a Correlation values which are presented in italics are statistically significant to a 95 % confidence interval. b Concentration, bias, and RMSE units are ×1015 molecules cm−2.
Table 3Statistical evaluation of NASA OMI and TROPOMI retrievals of tropospheric-column NO2 and HCHO and resulting FNRs when reprocessed with high-spatial-resolution WRF-CMAQ a priori information. Statistics presented are the number of co-located grids (N), mean concentration ± standard deviation from satellite (sat. conc.), median bias ± bias standard deviation, NMB (%), RMSE, coefficient of determination (R2), and linear regression slope.

a Reprocessed with “scaled” CMAQ a priori profiles. b Concentration, bias, and RMSE units are ×1015 molecules cm−2.
2.4 Community Multiscale Air Quality Model (CMAQ) model simulation
Prior vertical profiles play a major role in satellite retrievals of tropospheric chemistry (e.g., Palmer et al., 2001; Boersma et al., 2007; Johnson et al., 2018). Past research has demonstrated that using a well-constrained, high-spatial-resolution air quality model as the a priori profile source for satellite retrievals can improve VCD results (e.g., Laughner et al., 2019). To compare NASA OMI and TROPOMI tropospheric NO2, HCHO, and FNR retrievals using a common a priori profile data set, we conduct sensitivity tests using high-spatial-resolution (4 km × 4 km) model-simulated vertical profiles of NO2 and HCHO from the Community Multiscale Air Quality Model (CMAQ) (version 5.3) to reprocess these satellite retrievals.
CMAQ simulations were driven offline using the meteorological fields simulated by the Weather Research and Forecasting (WRF) model (version 4.1). The WRF-CMAQ spatial domain setup is shown in Fig. S1. The outer WRF domain covers the contiguous United States (CONUS) at a horizontal grid spacing of 12 km × 12 km, and the inner domain, encompassing the entire LISTOS 2018 domain, has a horizontal grid spacing of 4 km × 4 km. Both the outer and inner model domains use 35 vertical levels between the surface and 50 hPa. The WRF configuration follows Appel et al. (2017) and employs four-dimensional data assimilation every 6 h to limit the growth of meteorological errors (WRF configuration details in Table S2). A 15 d spinup period was used for the WRF-CMAQ simulations. Anthropogenic emissions of trace gases and aerosols are based on the National Emissions Inventory (NEI) representative of 2014, as this was the latest available inventory at the time of emission preparation. NEI 2014 emissions were processed using the Sparse Matrix Operator Kernel Emissions (SMOKE) model. WRF simulations were used to drive SMOKE for generating meteorology-dependent anthropogenic emissions. Biogenic emissions of trace gases are calculated online using the Biogenic Emission Inventory System (BEIS). Gas-phase chemistry is represented using Carbon Bond 6 (CB06) version r3. Chemical lateral boundary conditions for the outer domain used the idealized profiles available in CMAQ but are dynamically provided to the inner domain every hour based on the outer-domain simulations.
2.5 Evaluation techniques
To perform a systematic, direct comparison of daily satellite products to airborne retrievals, OMI, GeoTASO, and GCAS data were spatially averaged to (∼15 km × 15 km, similar to OMI nadir spatial resolution) for evaluating OMI. TROPOMI and airborne observations were spatially averaged at (∼5 km × 5 km, similar to the TROPOMI nadir spatial resolution) for evaluating TROPOMI. To investigate the impact of the higher spatial resolution of TROPOMI, NO2, HCHO, and FNR retrievals from this sensor were also averaged to for inter-comparison with OMI. To smooth and reduce the noise of satellite data, as well as reduce spatial representation errors of the satellite compared to GeoTASO and GCAS, we apply a point oversampling technique (e.g., McLinden et al., 2012) when spatially averaging the retrievals. This method uses a larger grid box radius, compared to the averaging resolution, to bin individual retrievals. When averaging satellite data to the spatial resolution (standard radius of 0.075∘), we employed a radius twice the standard size equal to 0.15∘. Similarly, when averaging satellite data to the spatial resolution (standard radius of 0.025∘), we applied a radius of 0.05∘.
Given that the nominal flight altitude during LISTOS 2018 was 9 km a.g.l., in order to directly compare to satellite tropospheric-column retrievals, we scaled airborne tropospheric-column NO2 values by multiplying the observed values by the ratio of the total tropospheric NO2 column abundance over the tropospheric-column NO2 abundance below 9 km a.g.l. (i.e., ). This scaling factor for NO2, which showed that typically 60 % to 99 % of tropospheric NO2 is below 9 km a.g.l., was derived for each co-located GeoTASO and GCAS retrieval, using WRF-CMAQ simulations. Airborne tropospheric-column HCHO data were not scaled since typically >95 % of HCHO was determined to be below the nominal aircraft flight altitude.
GeoTASO and GCAS data were co-located to OMI and TROPOMI using a temporal threshold of ±60 min. GeoTASO and GCAS HCHO and NO2 data were first filtered to remove airborne retrievals where the radiance flag was >0.5 as they are considered to be influenced by clouds or glint. We initially applied a temporal threshold of ±30 min; however, this resulted in <50 total co-locations with OMI retrievals. Therefore, the longer-temporal-threshold criterion was necessary to achieve enough co-locations for statistical evaluation. The longer temporal threshold of ±60 min resulted in only slightly larger median biases compared to when applying the ±30 min threshold. Similar bias statistics using temporal offsets of 30 and 60 min agree with other studies which show minimal dependence on temporal offsets between 0 and 60 min (e.g., Tack et al., 2021). It should be noted that the temporal threshold of ±60 min, as well as spatial averaging methods applied in this study, resulted in a slightly larger spread in TROPOMI NO2 data when evaluated with GeoTASO and GCAS data compared to the results in Judd et al. (2020) which used a 30 min threshold.
Satellite retrievals with high quality were isolated for use by using individual OMI retrievals that had quality flags of qa =0 for HCHO and NO2. This qa value is suggested in OMI data user manuals for the application of the highest-quality data and for the removal of OMI pixels impacted by the row anomaly. For TROPOMI, individual NO2 and HCHO retrievals that had qa >0.75 and qa >0.5 were used, respectively, as recommended by the TROPOMI data user manuals. To avoid anomalous OMI and TROPOMI retrieval values of HCHO, we remove VCDs with lower and upper bounds of and 7.6×10¹⁶ molecules cm−2, respectively. These bounds were determined from typical HCHO VCD values and a threshold of 3 times the fitting uncertainty in OMI retrievals presented by Zhu et al. (2020). Similarly, to avoid anomalous OMI and TROPOMI retrieval values of NO2, we remove VCDs with lower and upper bounds of and 8.07×10¹⁶ molecules cm−2, respectively (OMI NO2 algorithm team, personal communication, 2021). Both OMI and TROPOMI retrievals with solar zenith angles >70∘ and effective cloud fractions >30 % and >50 %, respectively, were also removed. These additional thresholds were chosen based on guidance from the OMI and TROPOMI data user manuals. Finally, only co-located spatially averaged grids that had 75 % spatial coverage by GeoTASO and GCAS and airborne remote-sensing NO2 VCDs molecules cm−2 were used.
The statistical evaluation of OMI and TROPOMI retrievals with co-located GeoTASO and GCAS data was primarily done using the bias (median); variability in bias represented by the standard deviation of bias (referred to as bias standard deviation); normalized median bias (NMB), normalized to the magnitude of observed data; root mean square error (RMSE); and simple linear regression statistics (slope; y intercept; and coefficient of determination, R2) based on ordinary least squares.
3.1 Campaign-averaged tropospheric FNRs
Airborne observations during the summer of 2018 suggest that during the midday hours large areas of FNRs ≤1.0 occurred over the urban regions surrounding the city of New York (NYC). The term “urban” here is used qualitatively as the region close in proximity to the center of NYC, where elevated tropospheric-column NO2 values were frequently observed. The opposite is true for the usage of “rural”. Figure 1 shows the campaign-averaged FNRs from OMI (NASA and QA4ECV) and TROPOMI, averaged to and spatial resolution, compared to co-located airborne remote-sensing products. These regions of FNRs ≤1.0 likely have O3 production which is limited by VOC emissions. Outside of the VOC-limited region, airborne observations show a clear transition zone of FNRs between 1.0 and 2.0 and NOx-limited regimes (FNR >2.0) in the rural regions of the northeastern US. It should be noted these FNR thresholds follow the assumptions of Duncan et al. (2010); however, there are uncertainties in the exact thresholds separating O3 sensitivity production regimes, and they can be spatiotemporally variable (e.g., Lu and Chang, 1998; Schroeder et al., 2017; Souri et al., 2020; Jin et al., 2020; Ren et al., 2022). For simplicity, we use the constant FNR ratio thresholds defined by Duncan et al. (2010) for discussion.
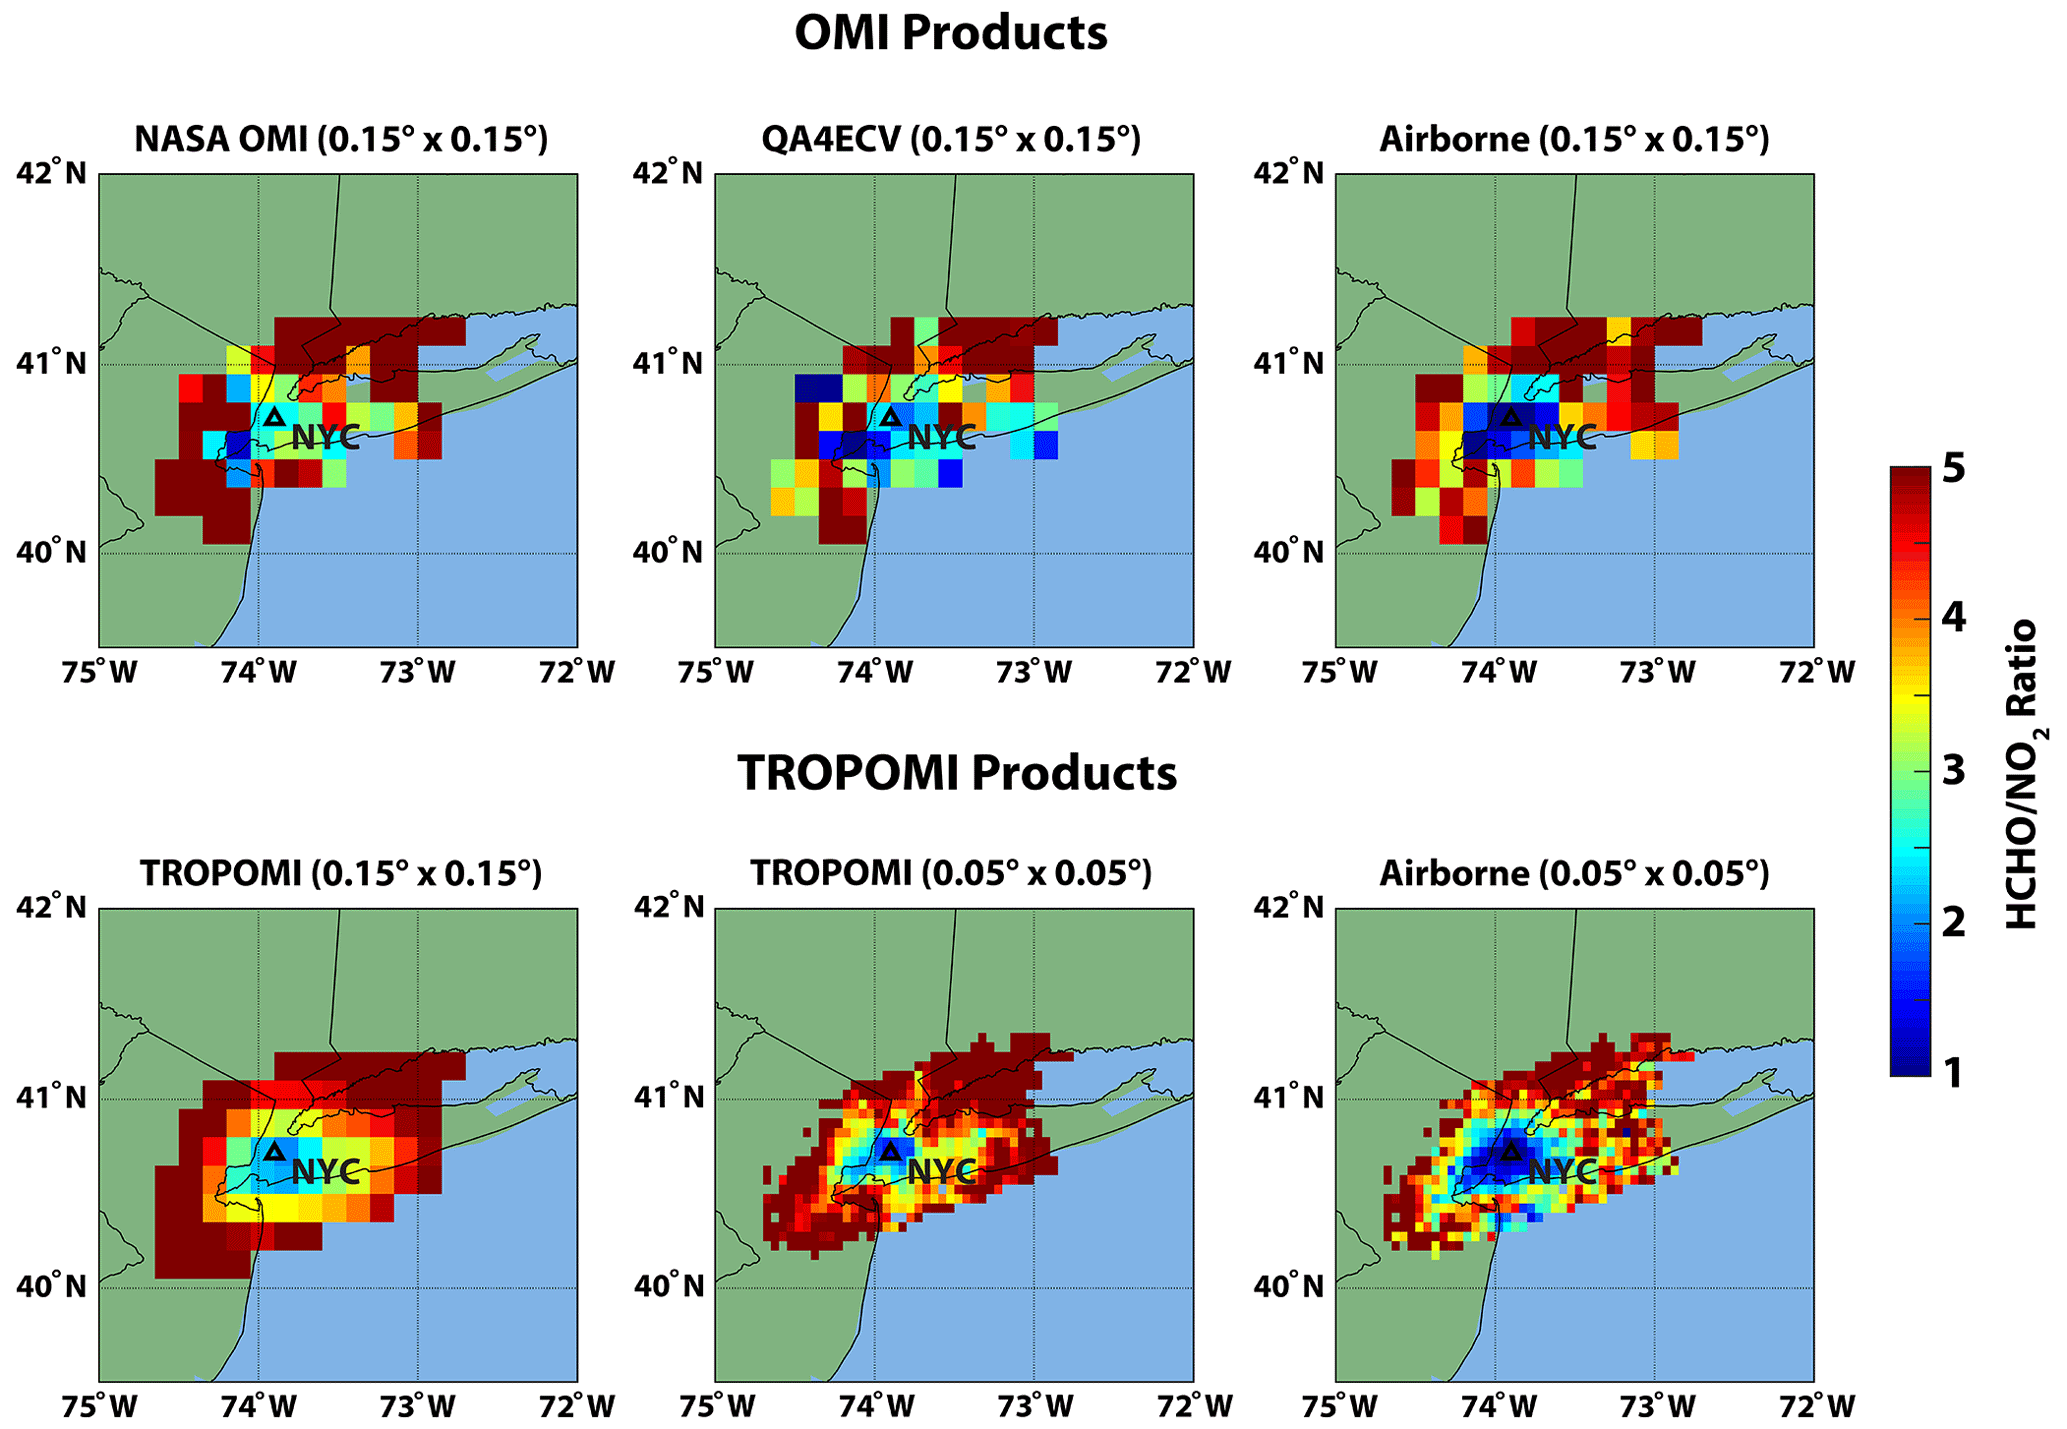
Figure 1NASA OMI, QA4ECV OMI, TROPOMI, and airborne tropospheric-column FNR retrievals averaged for all flights conducted during the LISTOS 2018 field campaign. All co-located OMI and airborne remote-sensing tropospheric-column FNR values are averaged at , and TROPOMI co-locations are averaged at and spatial resolution. The black triangle indicates the location of NYC.
Satellite retrievals also displayed the same general regional patterns of FNRs in the northeastern US that were observed by airborne remote sensing (see Fig. 1). However, all satellite products show higher FNRs (between 1.0 and 3.0) in the areas where airborne observations observed NOx-saturated regimes. In general, TROPOMI FNRs at the spatial resolution have the lowest values over NYC in better agreement with airborne observations. TROPOMI retrieval data also better capture the spatial pattern and urban–rural interface of observed O3 sensitivity production regimes compared to OMI data. TROPOMI FNR retrievals and airborne observations display a clear urban–rural interface; however, OMI products result in noisier spatial patterns. When averaged to a resolution similar to the native resolution of OMI (), TROPOMI data suggest higher FNRs ≥2.0 in the vicinity of NYC, in line with OMI retrieval products. It should be noted that satellite- and airborne-retrieved FNRs are dependent on both tropospheric NO2 and HCHO data. Median and unresolved biases in FNRs can then be driven by errors in retrievals of NO2 and/or HCHO. Therefore, the following sections of this work investigate the statistical evaluation of NASA OMI, QA4ECV OMI, and TROPOMI tropospheric NO2, HCHO, and resulting FNRs.
3.2 Statistical evaluation of OMI and TROPOMI
3.2.1 Tropospheric-column NO2 systematic bias and uncertainty
The spatial pattern of campaign-averaged tropospheric-column NO2 retrieved by the satellites and airborne sensors highlight the large pollution region around the urban areas of NYC (see Fig. S2). Tropospheric NO2 columns over NYC from both satellite and airborne observations frequently exceed 1.0×10¹⁶ molecules cm−2. However, while airborne NO2 values in the rural regions surrounding NYC were frequently molecules cm−2, satellite retrievals had larger NO2 columns between 2.0×10¹⁵ and molecules cm−2. This suggests OMI and TROPOMI retrievals have a high bias in clean-region tropospheric NO2 columns (spatial distribution of satellite NO2 bias shown in Fig. S4). This high bias in satellite tropospheric-column NO2 values in clean regions can possibly be linked to an underestimated abundance of free-tropospheric NO2 in CTMs used as a priori profile data sets for OMI and TROPOMI retrievals resulting in AMFs which are too low (e.g., Silvern et al., 2019). Studies have shown that the coarse spatial resolution of the CTMs used to derive a priori NO2 profiles for OMI and TROPOMI cannot resolve the sharp gradients of NO2 at the urban–rural interface and lead to the overestimation of satellite retrievals in low-pollution regions (Lamsal et al., 2014; Tack et al., 2021). Finally, other aspects of the satellite retrievals such as biases in stratospheric NO2 concentrations and separation from the troposphere, aerosol interference, and surface albedo could contribute to these overestimations in clean regions (e.g., Lamsal et al., 2021).
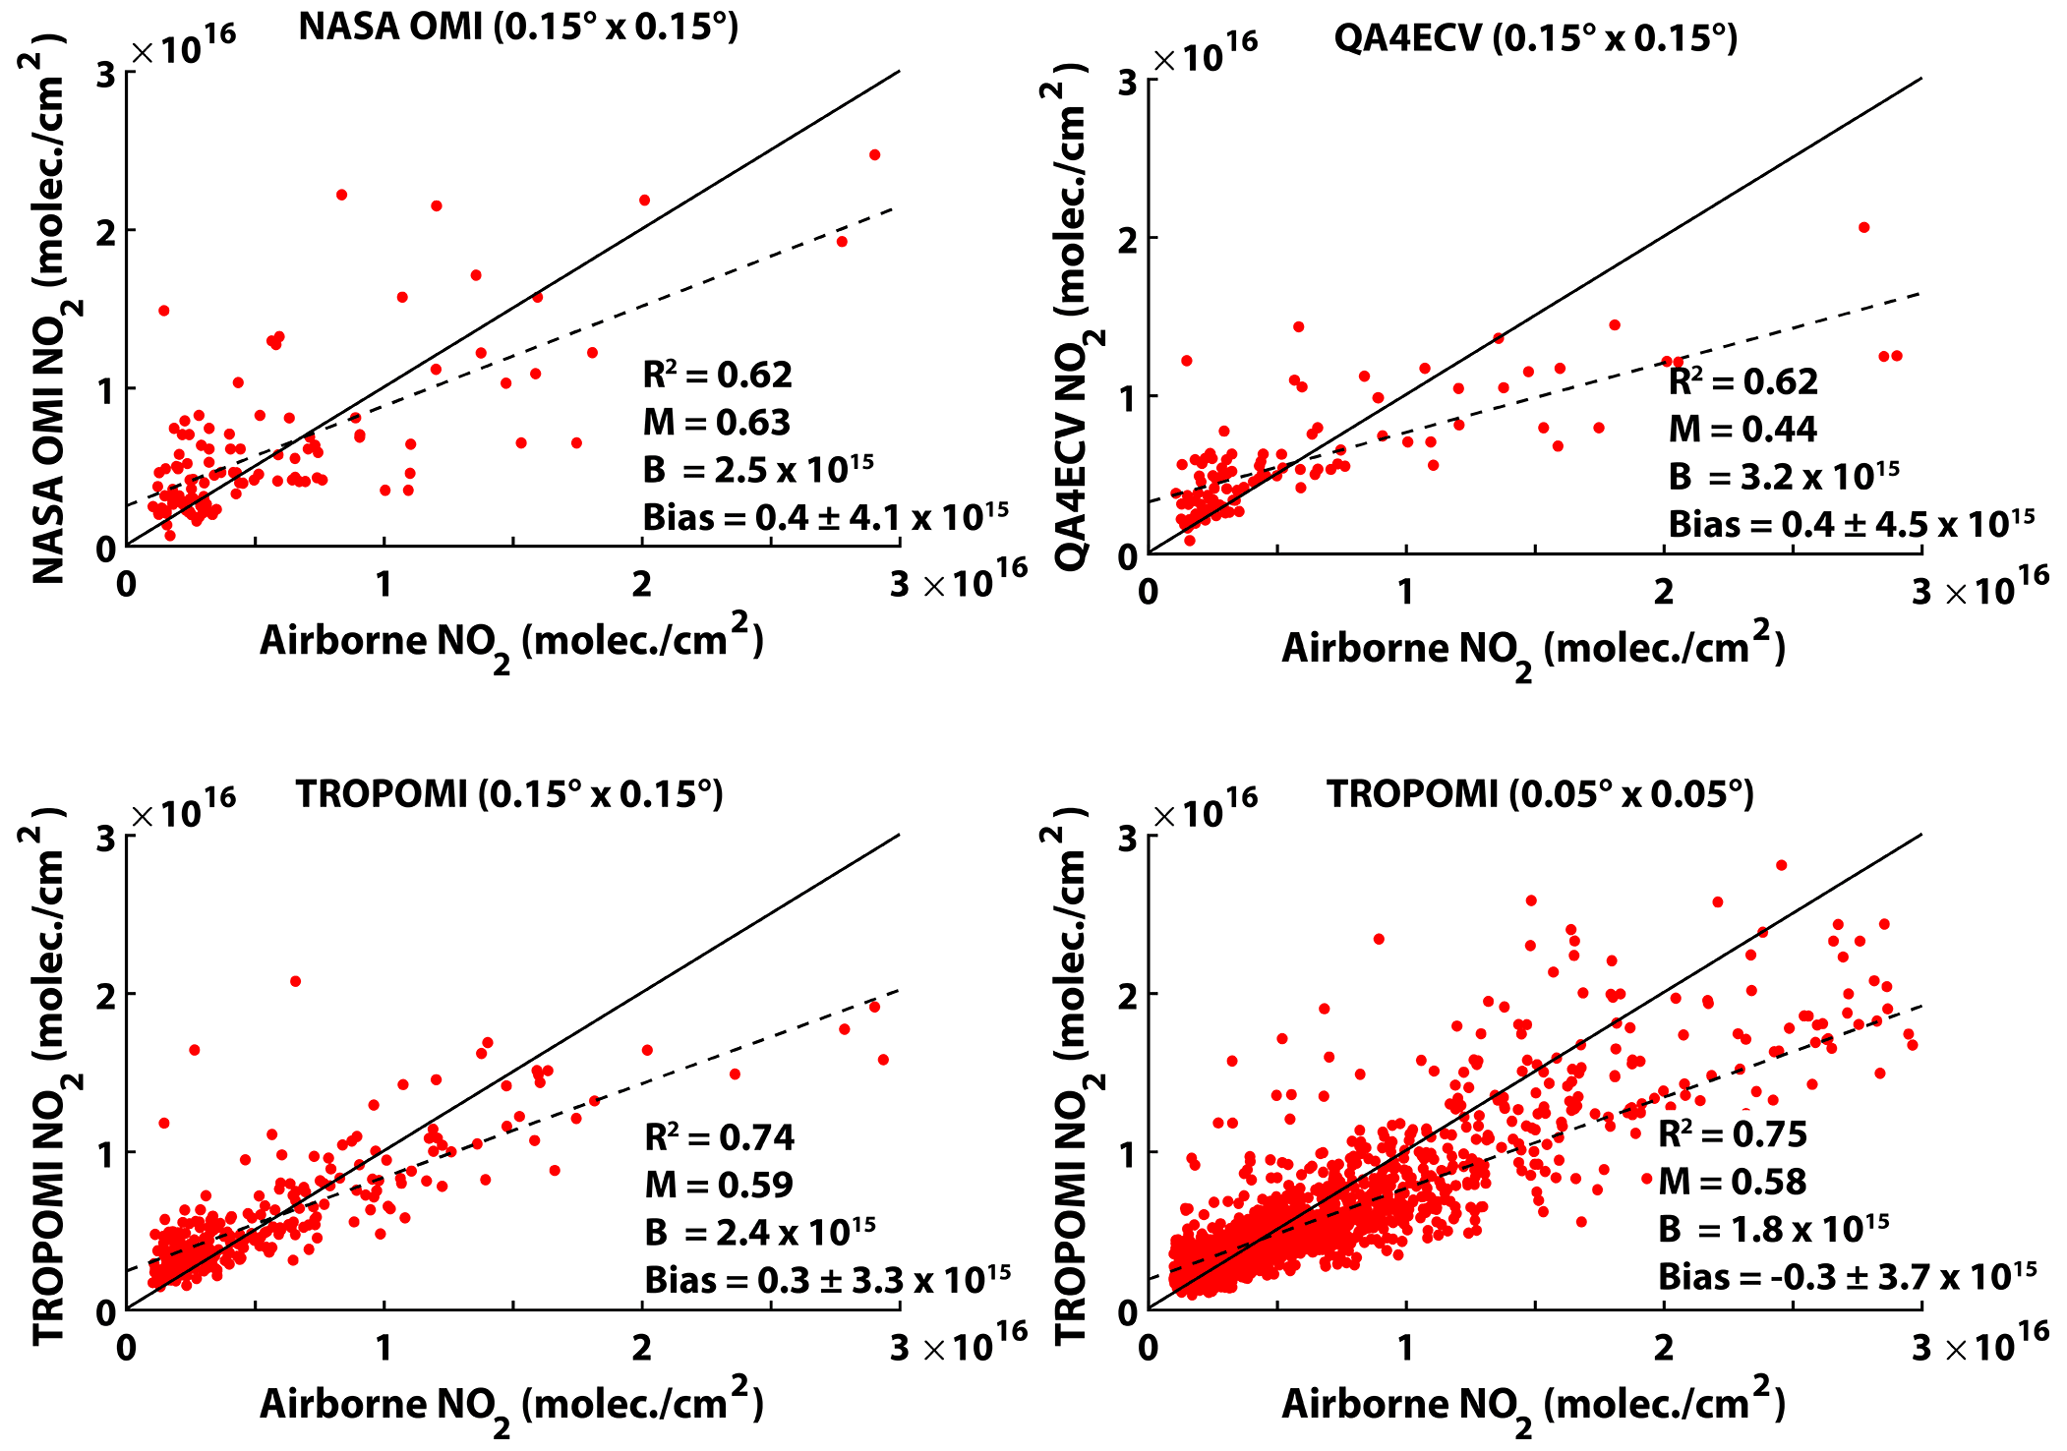
Figure 2Comparison of satellite- (NASA OMI, QA4ECV OMI, and TROPOMI) and airborne-retrieved tropospheric NO2 (molecule cm−2) for each co-located measurement taken during the field campaign. All co-located OMI and airborne remote-sensing tropospheric-column NO2 values are averaged at resolution, and TROPOMI co-located data are averaged at and spatial resolution. The solid black line shows the 1:1 comparison, and the dashed line shows the linear regression fit. The figure inset shows the main statistics (coefficient of determination (R2), slope (M), y intercept (B), and median bias and bias standard deviation) of the comparison.
Figure 2 shows the comparison of co-located NASA OMI, QA4ECV OMI, and TROPOMI retrievals of tropospheric NO2 columns with observed data from all flights (statistical evaluation in Table 2). The high bias of tropospheric NO2 columns in clean regions retrieved by the satellite sensors outside the urban regions of NYC resulted in linear regression slopes <0.65 and positive y intercepts. Some of this high bias in clean regions is offset in the campaign-averaged median biases by the fact that the satellite retrievals have a low bias compared to NO2 values observed over polluted regions ( molecules cm−2). The magnitude dependence of satellite-retrieved NO2 bias agrees with past validation studies (e.g., Zhao et al., 2020; Lamsal et al., 2021; Verhoelst et al., 2021). This magnitude dependence has been shown to be driven by uncertainties in AMF values used in the retrievals (Martin et al., 2002; Boersma et al., 2004). TROPOMI at its near-native spatial resolution has the least high bias of clean-region tropospheric NO2 demonstrated by the lower y-axis intercept compared to all OMI and TROPOMI data products at the coarser spatial resolution. Overall, NASA OMI and QA4ECV displayed small campaign-averaged median biases (NMB %) of molecules cm−2 (∼6.5 %). TROPOMI retrievals had a campaign-averaged median bias of −0.3 molecules cm−2 (−4.8 %) and 0.3×10¹⁵ molecules cm−2 (5.8 %) when averaged at and spatial resolution, respectively. It should be noted that the TROPOMI low bias in tropospheric-column NO2 is improved with the newer retrieval algorithm used in this study compared to early versions of the data product (e.g., v1.2.2 had a campaign-averaged median low bias of molecules cm−2) primarily due to better cloud pressure input data (FRESCO+ wide) now used in TROPOMI retrievals (Riess et al., 2022).
Noise in the satellite retrievals resulting in unresolved errors (RMSE) is important for accurate retrievals of the spatially resolved daily tropospheric-column NO2, HCHO, and FNRs. At the near-native spatial resolution of the three satellite NO2 retrievals, RMSE values were similar (∼ 3.5–4.5 ×10¹⁵ molecules cm−2) with QA4ECV OMI data having the largest bias standard deviation and RMSE values and TROPOMI having the least noise in the data (see Table 2). To determine if the higher spatial resolution and less noise of TROPOMI retrievals resulted in more favorable comparisons to observations, we further compared TROPOMI tropospheric-column NO2 values to OMI results. TROPOMI data averaged to match OMI spatial resolution displayed the lowest RMSE values. At both spatial resolutions, TROPOMI tropospheric NO2 data have less spread in the data compared to OMI products. The larger noise in OMI tropospheric NO2 SCDs compared to TROPOMI NO2 SCDs has been shown in recent studies (van Geffen et al., 2020, 2022) and has been attributed to its higher spatial resolution (better by a factor of >12) and similar, to even better, signal-to-noise ratios. Furthermore, TROPOMI NO2 at better reproduces the spatial patterns of observed tropospheric-column NO2. This is emphasized by the higher correlation and lower RMSE values when evaluating TROPOMI tropospheric NO2 columns with observations in comparison to the other satellite products and visually more clearly separating the urban–rural interface seen in tropospheric NO2 (see Fig. S2). Finally, TROPOMI NO2 data averaged to the coarser spatial resolution of OMI have a similarly high median bias as both OMI retrieval algorithms; however, displayed RMSE values are nearly twice as small as NASA and QA4ECV OMI, further emphasizing the importance of spatial resolution for retrieving tropospheric NO2 columns.
3.2.2 Tropospheric-column HCHO systematic bias and uncertainty
The spatial pattern of campaign-averaged tropospheric-column HCHO retrieved by the satellites and airborne sensors demonstrate the large HCHO concentrations in both urban and rural regions during the summer of 2018 (see Fig. S3). Airborne observations of tropospheric-column HCHO concentrations show that over NYC the concentrations are on average molecules cm−2 and can exceed 2.5×10¹⁶ molecules cm−2 during the afternoon hours (see Fig. S3). Both OMI and TROPOMI retrieval products have smaller gradients between HCHO concentrations in the urban and rural regions in comparison to airborne observations.
Figure 3 shows the scatterplot comparison of co-located NASA OMI, QA4ECV OMI, and TROPOMI retrievals of tropospheric HCHO columns compared to observed data (statistical evaluation in Table 2). This figure and Table 2 illustrate the high bias of clean-region tropospheric HCHO columns retrieved by satellites (spatial distribution of HCHO bias in OMI and TROPOMI shown in Fig. S5). All satellite products have a high bias for tropospheric-column HCHO values of molecules cm−2, linear regression slopes of <0.60, and positive y intercepts. Both OMI retrieval products and TROPOMI data better replicate the larger HCHO concentrations (between 1.5×10¹⁶ and 3.0×10¹⁶ molecules cm−2) with some small low bias in more polluted regions ( molecules cm−2). On average, NASA OMI had the largest campaign-averaged median high bias of 5.1×10¹⁵ molecules cm−2 (38.7 %). QA4ECV OMI data result in a lower campaign-averaged median high bias of 2.3×10¹⁵ molecules cm−2 (17.3 %). Finally, TROPOMI retrievals had the lowest campaign-averaged median high bias of 1.9×10¹⁵ molecules cm−2 (12.9 %) at spatial resolution and 2.9×10¹⁵ molecules cm−2 (23.1 %) when averaged at .
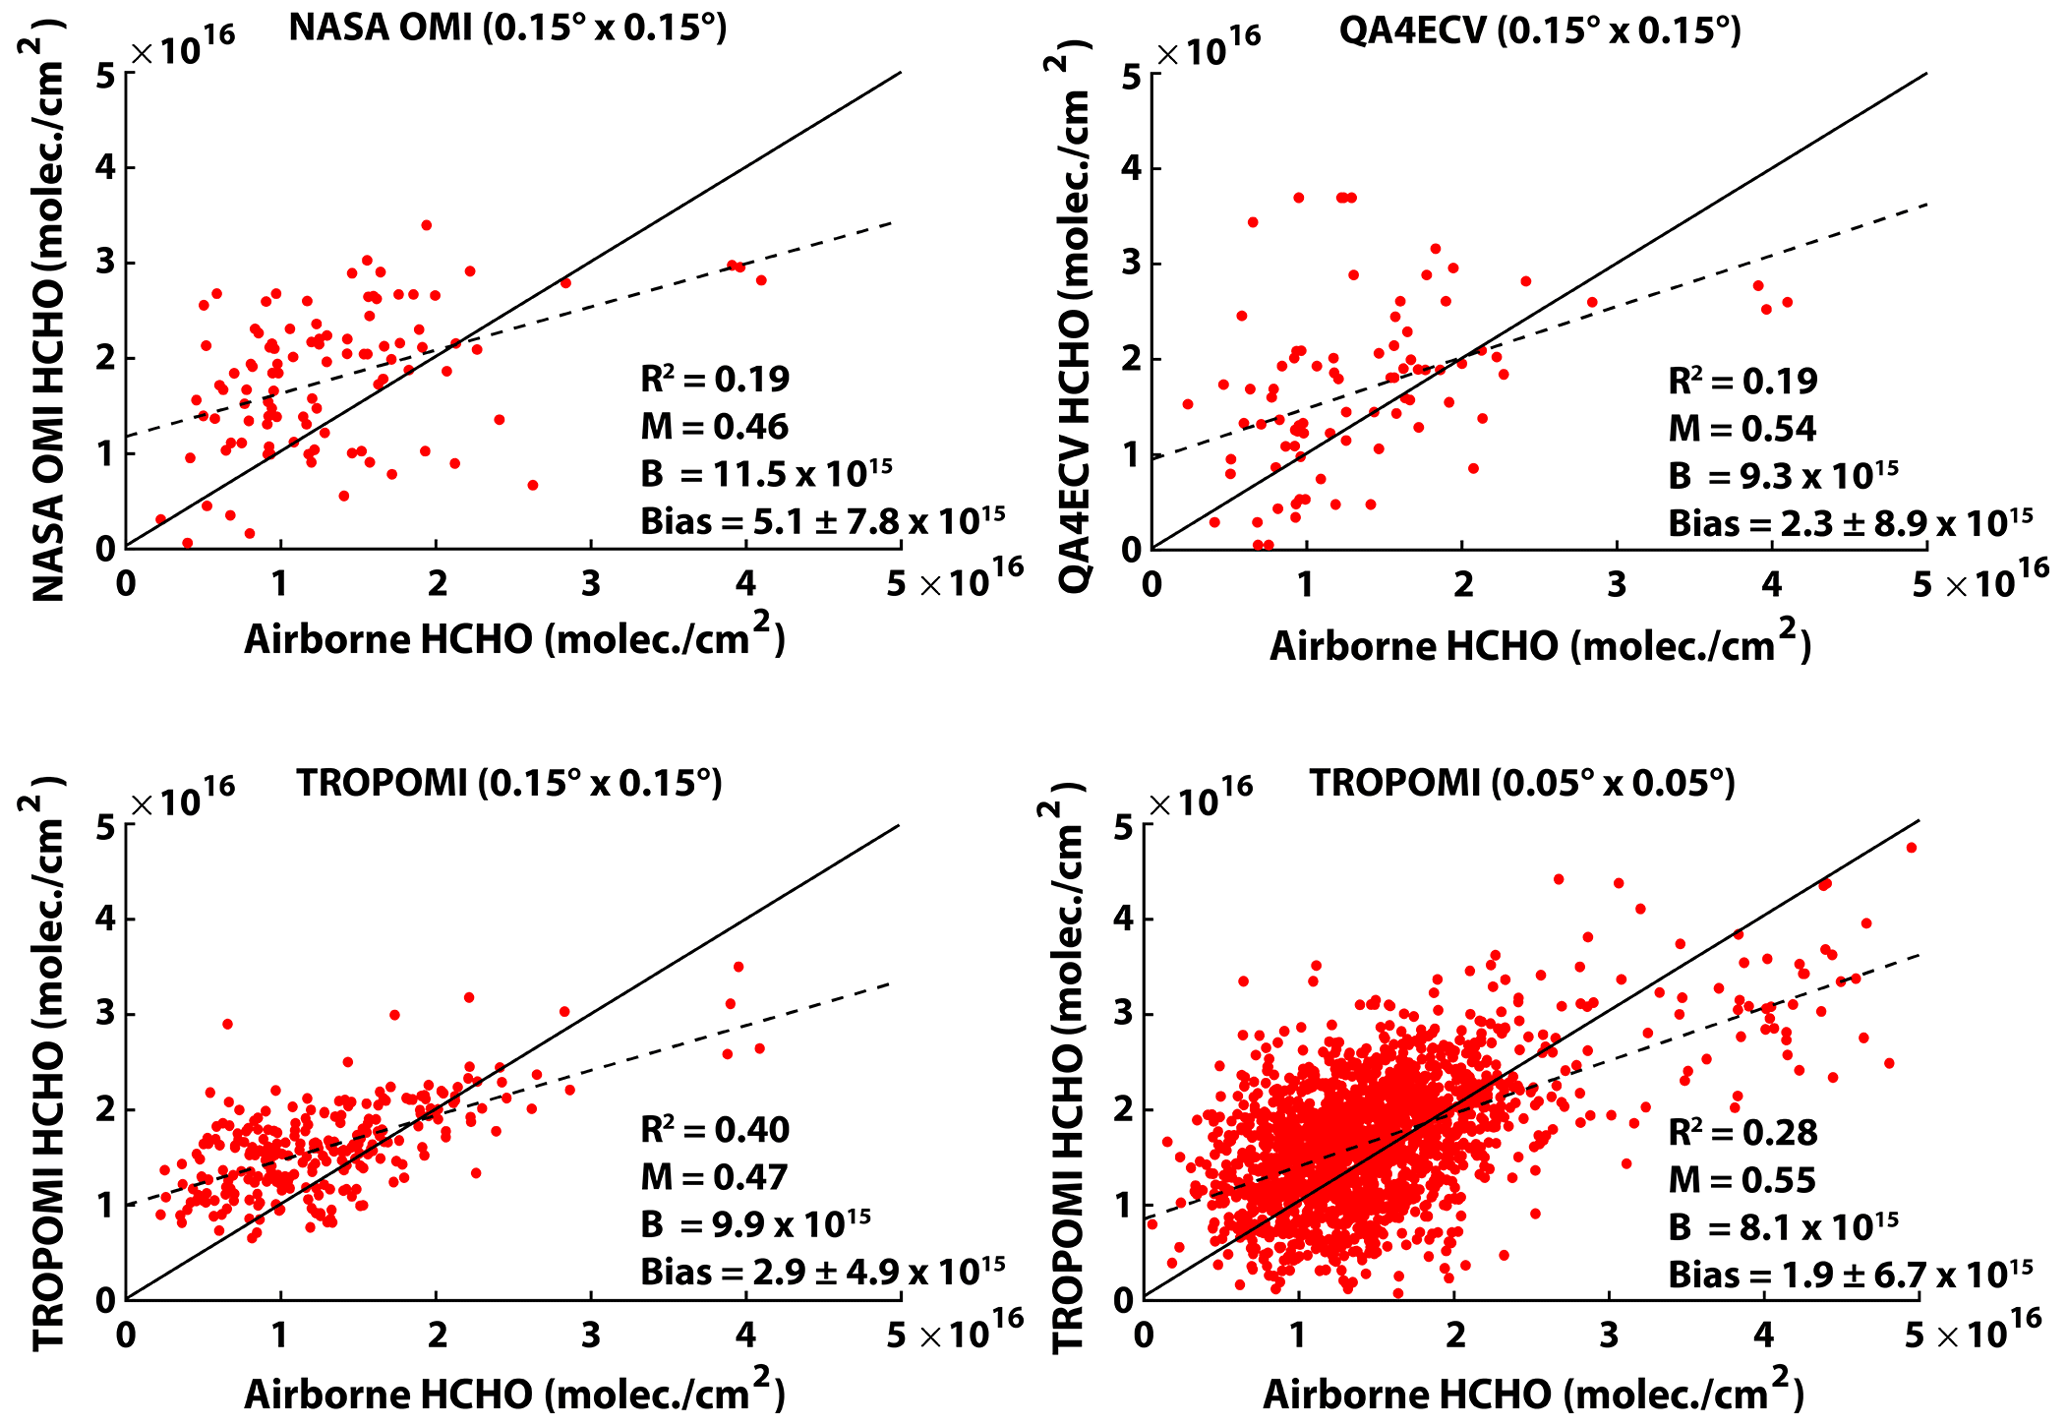
Figure 3Comparison of satellite- (NASA OMI, QA4ECV OMI, and TROPOMI) and airborne-retrieved tropospheric HCHO (molecule cm−2) for each co-located measurement taken during the field campaign. All co-located OMI and airborne remote-sensing tropospheric-column HCHO values are averaged at resolution, and TROPOMI co-located data are averaged at and spatial resolution. The solid black line shows the 1:1 comparison, and the dashed line shows the linear regression fit. The figure inset shows the main statistics (coefficient of determination (R2), slope (M), y intercept (B), and median bias and bias standard deviation) of the comparison.
The results of the validation shown in Fig. 3 and Table 2 are consistent with recent validation studies such as the work of Vigouroux et al. (2020) and De Smedt et al. (2021) which also show OMI and TROPOMI retrievals are biased high in clean conditions and in regions of high tropospheric HCHO columns are generally consistent with some moderate low bias. In order to provide more of a quantitative comparison with recent validation studies of OMI and TROPOMI HCHO (Vigouroux et al., 2020; De Smedt et al., 2021), we separated our co-located satellite–airborne data points into clean ( molecules cm−2) and polluted ( molecules cm−2) scenes. We chose a slightly higher threshold for separating clean HCHO columns to optimize the number of co-locations for statistics. We also added a highly polluted threshold ( molecules cm−2) to further emphasize our results (see Table S3). While the positive tropospheric HCHO column biases derived in our study are higher compared to Vigouroux et al. (2020) and De Smedt et al. (2021), the magnitude dependence is similar. We show that clean-region satellite HCHO columns are larger than observations for all satellite products and transition to a low bias in highly polluted regions.
The NASA and QA4ECV OMI HCHO retrievals had RMSE values molecules cm−2 with QA4ECV data having a slightly larger data spread. The higher spatial resolution and sufficient signal-to-noise ratio of TROPOMI resulted in HCHO RMSE values ∼ 25 %–30 % lower compared to OMI. Spatially averaging TROPOMI tropospheric-column HCHO to coarser grids to increase the signal-to-noise ratio aided in further reducing RMSE values (see Table 2). While both TROPOMI and OMI tropospheric HCHO retrievals display large noise, TROPOMI has correlation values better compared to OMI, with R2 values being higher by a factor of 2 at the same spatial resolution. Vigouroux et al. (2020) and De Smedt et al. (2021) agree with our analysis that TROPOMI HCHO has lower RMSE values and higher correlations with observations, compared to OMI products. The larger spread in tropospheric HCHO from OMI compared to TROPOMI is likely due to the weaker signal-to-noise ratio in OMI and potentially the fewer co-located data points for statistical analysis.
All three satellite HCHO products have larger RMSE values and low correlations when compared to the statistical evaluation of satellite NO2 retrievals. TROPOMI SCD retrievals of HCHO have been shown in recent work (e.g., De Smedt et al., 2021) to have less noise compared to OMI due to the higher spatial resolution and at least the same signal-to-noise ratio. Furthermore, UV–Vis retrievals at shorter wavelengths (∼340 nm) have much smaller sensitivity to HCHO compared to longer wavelengths (∼440 nm) employed for NO2 retrievals (Lorente et al., 2017). The sensitivity of UV–Vis retrievals to HCHO is lower throughout the middle and lower troposphere compared to NO2, due to stronger Rayleigh scattering at shorter wavelengths, approaching twice as low near the surface (Lorente et al., 2017). The higher sensitivity of NO2 retrievals in the lower troposphere, compared to HCHO, is important as the largest spatiotemporal variability in both NO2 and HCHO concentrations occur lower in the troposphere leading to the higher correlation and lower RMSE values in the tropospheric-column NO2 statistical evaluation.
3.2.3 Tropospheric-column FNR systematic bias and uncertainty
The comparison of satellite- and airborne-retrieved FNRs is shown in Fig. 4 and Table 2. NASA OMI and TROPOMI (at and ) display campaign-averaged median biases of 0.3–0.4, and QA4ECV OMI data resulted in a campaign-averaged median bias of −0.2. Regardless of how tropospheric-column NO2 and HCHO compared to observations, all satellite products evaluated here resulted in campaign-averaged FNR median biases ≤0.4, suggesting that the systematic biases in the individual proxy species for OMI and TROPOMI offset to result in accurate median campaign-averaged FNR values. Visual inspection of TROPOMI and QA4ECV OMI retrievals suggests that these two products have the best ability to replicate the lowest observed FNRs over NYC during the field campaign (see Fig. 1). However, besides NASA OMI retrievals, the satellite products have linear regression slopes <1.0, indicating a high bias for lower FNR values and some small low bias for higher observed FNRs.
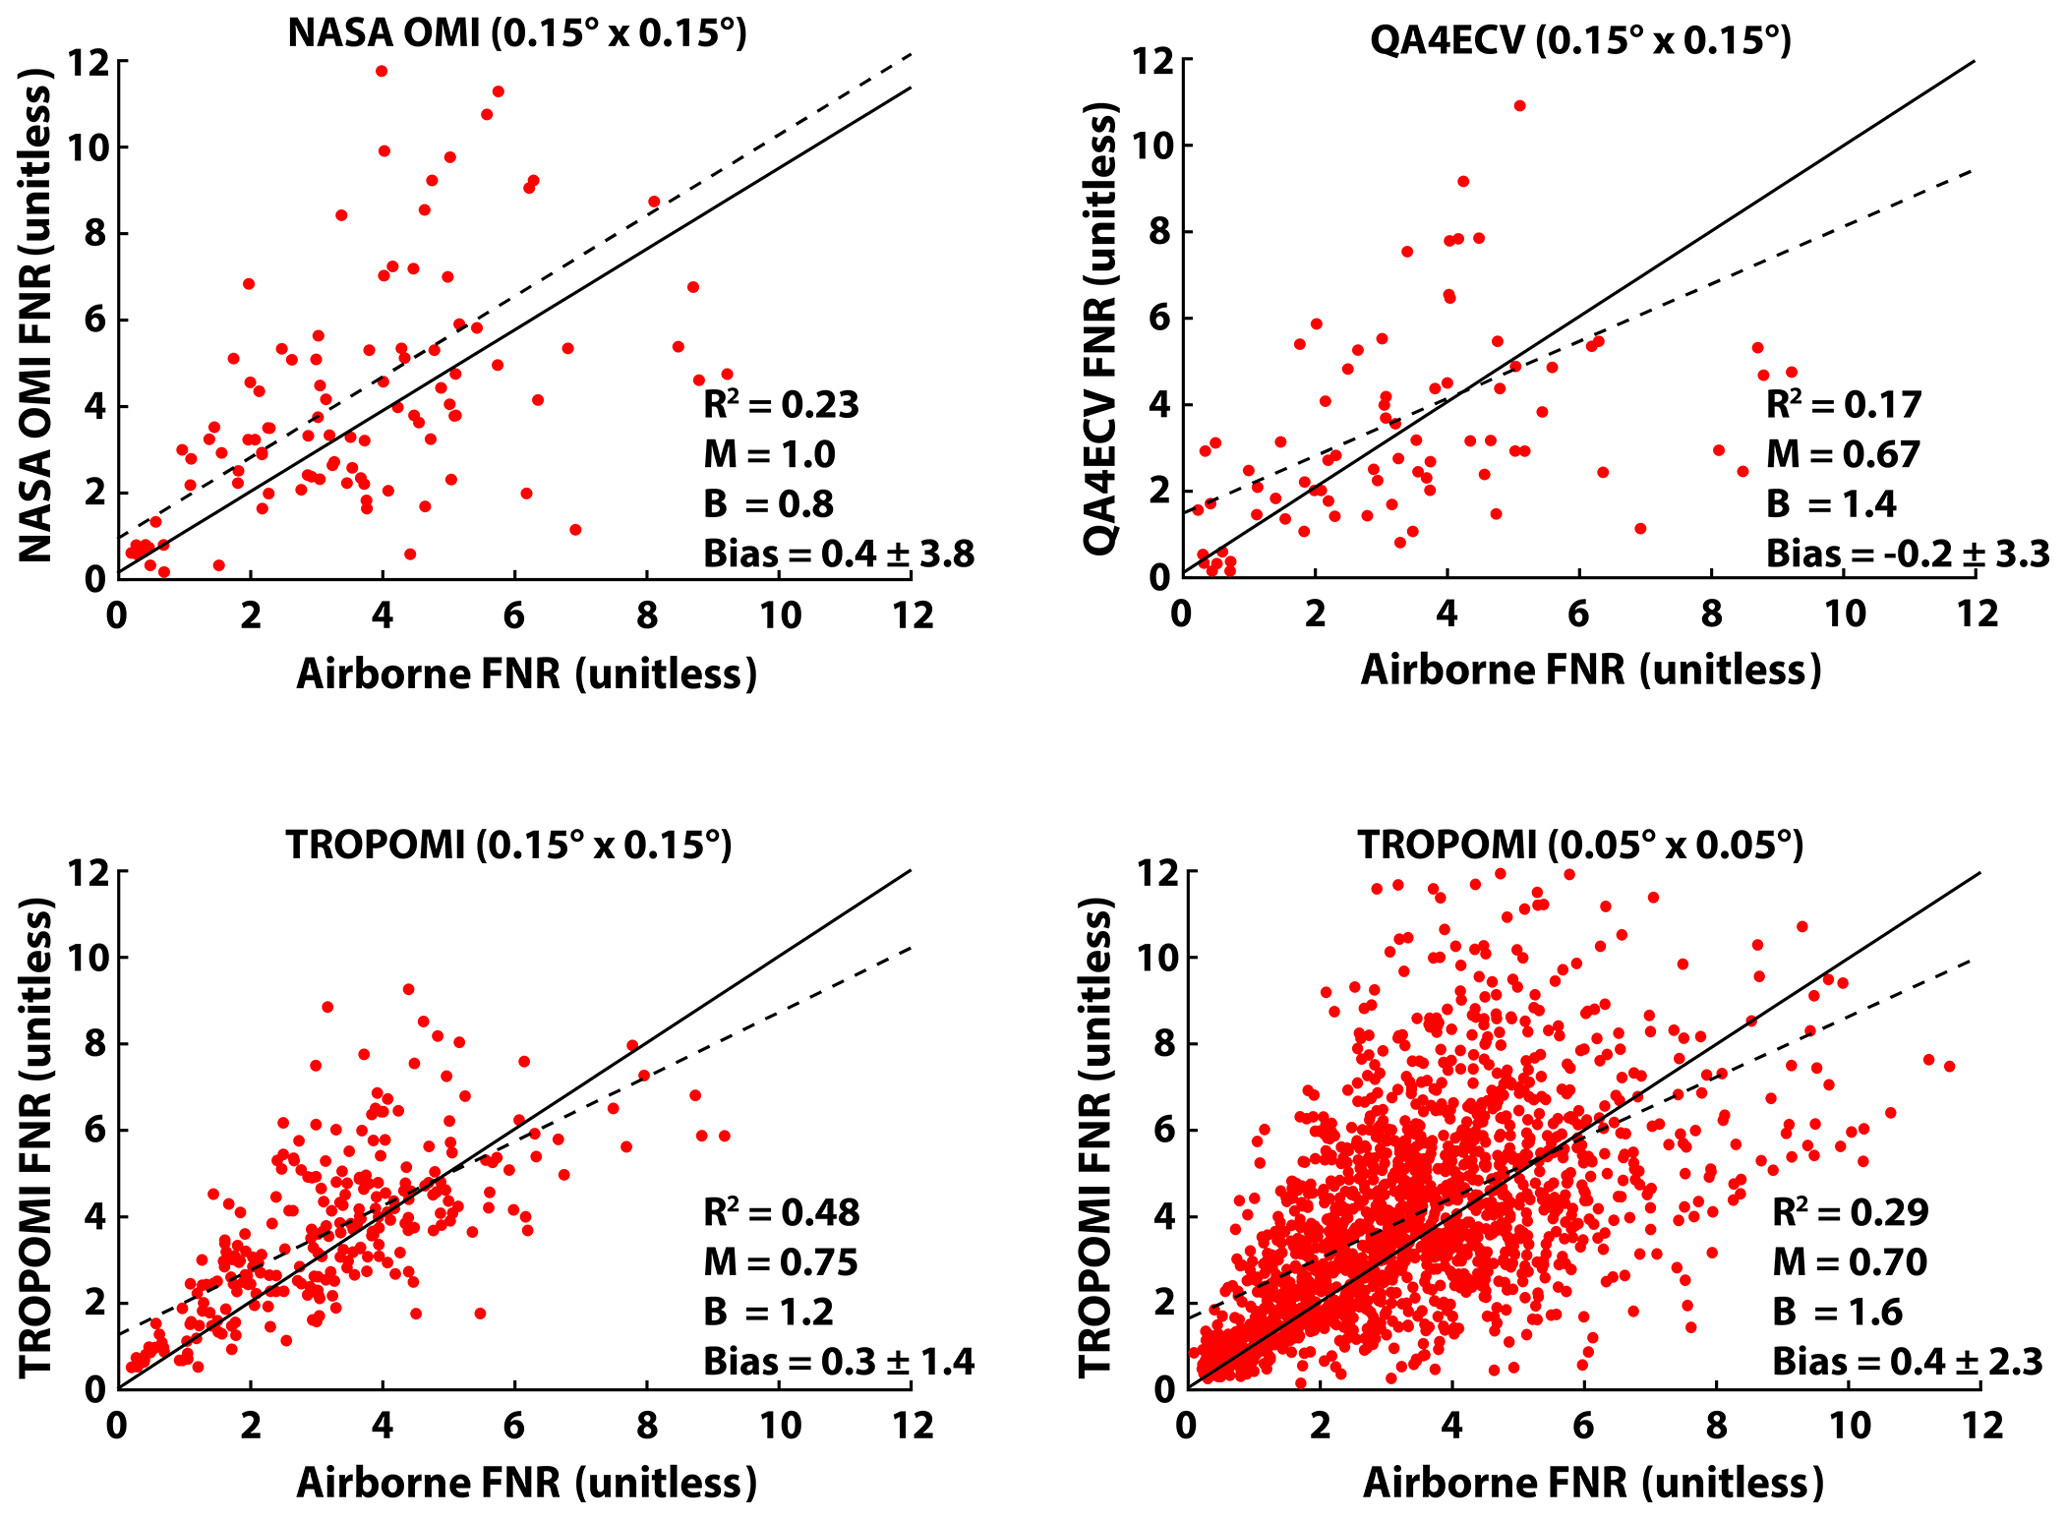
Figure 4Comparison of satellite- (NASA OMI, QA4ECV OMI, and TROPOMI) and airborne-retrieved tropospheric FNR (unitless) for each co-located measurement taken during the field campaign. All co-located OMI and airborne remote-sensing tropospheric-column FNR values are averaged at resolution, and TROPOMI co-located data are averaged at and spatial resolution. The solid black line shows the 1:1 comparison, and the dashed line shows the linear regression slope. The figure inset shows the main statistics (coefficient of determination (R2), slope (M), y intercept (B), and median bias and bias standard deviation) of the comparison.
All three satellite products displayed high correlation with tropospheric-column NO2 observations, suggesting these spaceborne sensors can accurately assess the spatial and temporal patterns of this species. However, all the satellite products had very low correlation and high RMSE values when compared with observations of HCHO. In fact, the rank in correlation levels of all four FNR satellite products evaluated here directly matches the rank in correlation levels of tropospheric HCHO. This leads to the conclusion that given bias variability and RMSE in satellite tropospheric HCHO are large, and they directly drive the uncertainty in FNR retrievals; satellite HCHO observations are the limiting factor of using spaceborne retrievals to accurately assess daily FNRs.
An interesting finding of this study is that the median bias of OMI and TROPOMI HCHO and NO2 tropospheric columns tend to cancel out, resulting in low median biases for FNRs; however, the unresolved biases in HCHO and NO2 retrievals do not cancel out. This is clear as the RMSE values for FNRs are still large. Furthermore, biases for HCHO and NO2 retrievals from OMI and TROPOMI are not correlated with R2 values <0.05 for all three satellite products. The uncertainty in HCHO and NO2 retrievals resulted in FNR RMSE values for NASA OMI, QA4ECV OMI, and TROPOMI (at near-native spatial resolutions) of 3.8, 3.3, and 2.3, respectively. Spatially averaging TROPOMI tropospheric-column HCHO data was shown to reduce the noise in the data, resulting in FNR RMSE values for TROPOMI at the coarser spatial resolution lower by nearly a factor of 2 compared to OMI. Overall, the large noise and unresolved error in tropospheric HCHO retrievals directly result in the uncertainty in FNR retrievals. It should be noted that the HCHO validation data from GeoTASO and GCAS are also hindered by weak absorption signatures in the shorter UV–Vis wavelengths and could add to the bias variability and RMSE values derived in this study. However, the level of uncertainty in tropospheric-column HCHO data from OMI and TROPOMI derived in this study is generally consistent with other recent studies (e.g., Vigouroux et al., 2020; De Smedt et al., 2021); therefore, we feel the conclusions drawn here are robust.
There are two main reasons HCHO retrievals are nosier compared to NO2: (a) optical depths for HCHO peak in the UV range (<380 nm) at the same wavelengths coinciding with large Rayleigh scattering and optical depths of O3, leading to a weak and noisy signal, and (b) the stronger NO2 optical depths in the visible wavelength range (400–500 nm), where there are higher signal-to-noise ratios, permit retrievals with less noise. To further evaluate the comparison of uncertainty in the remote sensing of NO2 and HCHO, we compared GCAS and GeoTASO precision levels for the two species. Nowlan et al. (2018) derived the precision of the airborne remote-sensing systems used for NO2 and HCHO retrievals in this study. Nowlan et al. (2018) quantified precisions of 1.0×10¹⁵ molecules cm−2 and 1.9×10¹⁶ molecules cm−2 at a fine spatial resolution of 250 m × 500 m for NO2 and HCHO, respectively. Averaging the data to the spatial resolution of improves these precision levels to 6.4×10¹³ and 1.2×10¹⁵ molecules cm−2 for NO2 and HCHO, respectively. The campaign-averaged tropospheric-column NO2 and HCHO abundances from GCAS and GeoTASO at were 6.6×10¹⁵ and 1.5×10¹⁶ molecules cm−2, respectively. Comparing the precision values of Nowlan et al. (2018) to the mean abundances during LISTOS at the same spatial resolution results in mean precision levels of 1 % and 8 % for NO2 and HCHO, respectively. Overall, from this analysis it is expected that the HCHO retrievals should have more noise by a factor of 5–10 compared to NO2.
3.3 Common a priori sensitivity test
This section analyzes the impact of using common, high-spatial-resolution (4 km × 4 km), WRF-CMAQ-predicted NO2 and HCHO vertical profiles as a priori information in NASA OMI and TROPOMI retrievals. GeoTASO and GCAS retrievals were not reprocessed in order to have a consistent reference data set for the evaluation of the standard and reprocessed satellite retrievals. While reprocessing the airborne data with the higher-spatial-resolution model output would in itself be interesting (as done in Judd et al., 2020), the direct evaluation of the improvements in the reprocessed satellite data compared to the standard retrieval would not be possible. Figure 5 shows the campaign-averaged FNRs from NASA OMI and TROPOMI retrievals, when reprocessed with WRF-CMAQ NO2 and HCHO a priori vertical profiles, compared to co-located airborne remote-sensing products (scatterplot comparison displayed in Fig. S6; statistical evaluation shown in Table 3). Comparing NASA OMI FNRs from this figure to Fig. 1, it is evident that using high-spatial-resolution WRF-CMAQ-predicted vertical profiles as a priori information resulted in FNR retrievals that are better able to capture the low FNR values (FNR ≤1.0). Reprocessed TROPOMI FNRs also have lower values around NYC; however, they were reduced less compared to OMI retrievals.

Figure 5NASA OMI and TROPOMI reprocessed tropospheric-column FNR retrievals compared to airborne FNR observations averaged for all flights. All co-located OMI and airborne remote-sensing tropospheric-column FNR values are averaged at , and TROPOMI co-locations are averaged at both and spatial resolution. The OMI FNR retrievals calculated with the scaled WRF-CMAQ profiles are identified as “scaled” in the figure panel titles. The black triangle indicates the location of NYC.
Comparing standard retrieval products from NASA OMI (see Fig. S2 for NO2 and Fig. S3 for HCHO) to reprocessed retrievals (see Fig. S7 for NO2 and Fig. S8 for HCHO), it is clear that in general the higher-spatial-resolution model data resulted in larger tropospheric-column NO2 and slightly larger tropospheric-column HCHO values. For TROPOMI, reprocessing the retrievals with WRF-CMAQ a priori information caused increases in tropospheric-column NO2 over polluted regions but small decreases over rural areas. Tropospheric-column HCHO data for the reprocessed TROPOMI data were slightly lower in more polluted urban regions near NYC and much lower in the rural areas dominated by low concentrations compared to standard retrievals.
The increases in NASA OMI tropospheric NO2 columns resulted in a small negative bias in FNR retrievals (−0.3), compared to a small positive bias in the standard products (0.4). When compared to airborne observations, the reprocessed NASA OMI NO2 data display a large positive median bias which was not evident in the standard retrieval products. Similarly, reprocessed NASA OMI tropospheric-column HCHO data had a higher positive bias compared to standard retrievals. It should be noted, as previously discussed, that median biases in both reprocessed NASA OMI NO2 and HCHO retrievals offset, resulting in median FNR values that compared relatively well to observations. However, the uncertainty in reprocessed satellite HCHO and NO2 retrievals did not cancel out, resulting in FNR RMSE values which were still large for NASA OMI (3.9) and TROPOMI (3.5).
The larger tropospheric NO2 columns in reprocessed NASA OMI data using high-spatial-resolution model data as a priori information were also shown in past studies (e.g., Souri et al., 2016; Goldberg et al., 2017). Both our study and the work by Goldberg et al. (2017) show that high-spatial-resolution CMAQ-predicted NO2 a priori profiles result in OMI tropospheric NO2 columns that are as high as larger by a factor of 2 than the standard retrievals. This high bias is caused by smaller AMFs calculated due to the shape factor of high-spatial-resolution CMAQ-predicted NO2 concentrations having a too steep NO2 gradient. The change in HCHO shape factors when using WRF-CMAQ a priori profiles resulted in slightly higher tropospheric HCHO columns when compared to standard products for the same reason as tropospheric-column NO2. Similar to Goldberg et al. (2017), we used airborne in situ observations of NO2 and HCHO from LISTOS 2018 and the Ozone Water–Land Environmental Transition Study 2 (OWLETS-2, https://www-air.larc.nasa.gov/missions/owlets/, last access: 8 May 2023) field campaigns to correct the model-predicted a priori profiles for use in NASA OMI retrievals and is discussed later in this section.
Tropospheric NO2 columns in reprocessed TROPOMI retrievals resulted in slightly lower median biases ( molecules cm−2) compared to the standard products ( molecules cm−2) with slightly larger RMSE values in the reprocessed NO2 retrievals. Reprocessing TROPOMI retrievals of tropospheric-column HCHO resulted in smaller concentrations and improved median biases ( molecules cm−2) and RMSE values (6.3×10¹⁵ molecules cm−2) compared to the median bias (1.9×10¹⁵ molecules cm−2) and RMSE (6.7×10¹⁵ molecules cm−2) in the standard products. The good performance of both reprocessed TROPOMI NO2 and HCHO resulted in FNR values with a smaller median bias (0.2) compared to standard products (0.4) and slightly lower RMSE values.
Following methods similar to Goldberg et al. (2017) we used the University of Maryland Cessna 402B airborne observations to apply in situ data observational constraints on the NO2 and HCHO a priori profiles applied in NASA OMI retrievals. The evaluation of WRF-CMAQ-predicted NO2 (14 flights during LISTOS 2018 and OWLETS-2) and HCHO (7 flights during LISTOS 2018) vertical profiles using airborne data is displayed in Fig. S9. Compared to measured NO2 values, the model displays a high bias below 1 km a.g.l. of ∼0.4 ppb which was often >50 % larger than observations. This is in stark contrast to the model performance above 2 km a.g.l., where the model has a low bias of −0.2 to −0.4 ppb often approaching 100 % lower than observations. For the WRF-CMAQ comparison to airborne in situ HCHO data, the model has a low bias throughout the lower troposphere, with larger low biases near the surface (−3.0 ppb between 0 and 1 km a.g.l.) and smaller low biases in the free troposphere ( ppb above 2 km a.g.l.). These low biases range between −50 % to −100 % compared to measured values. In addition to physiochemical parameterizations applied in CTMs, meteorological predictions by WRF, such as wind speed and direction, must have limited errors in order to accurately predict the horizontal and vertical distribution of NO2 and HCHO concentration (e.g., Laughner et al., 2016; X. Liu et al., 2021). Compared to the airborne in situ observations, WRF wind speed and direction predictions during this study performed relatively well with median correlation (R) and bias values of 0.70 and 0.63 and ≤1.0 m s−1 in the u and v wind components, respectively.
We applied approximated scaling factors to the a priori profiles to reprocess NASA OMI data (hereinafter referred to as scaled). Separate scaling factors were applied above and below the PBL, approximated to be at 1.5 km a.g.l., where noticeable differences in model performance were evident. For NO2, we apply a scaling factor of 0.5 to WRF-CMAQ a priori NO2 profiles in the PBL and 5.0 above the PBL. For HCHO, we applied a scaling factor of 2.0 to WRF-CMAQ a priori profiles in the PBL and 5.0 above the PBL. These scaling factors are approximations of the model performance and are simply applied to determine the impact of “raw” and “scaled” WRF-CMAQ-simulated a priori profiles in NASA OMI NO2 and HCHO retrievals.
The spatial distribution of FNRs derived from the scaled NASA OMI reprocessed NO2 and HCHO retrievals is shown in Fig. 5 (scatterplot comparison displayed in Fig. S6; statistical evaluation in Table 3). From Table 3 and Fig. 5 it can be seen that the scaled WRF-CMAQ a priori profiles result in higher FNR values and improved tropospheric-column NASA OMI NO2 and HCHO retrievals compared to reprocessed products using the raw model output (see Figs. S7 and S8). Scaled NASA OMI tropospheric-column NO2 and HCHO retrievals had smaller median biases of and 4.4×10¹⁵ molecules cm−2 and much lower RMSE values of 3.9×10¹⁵ and 7.8×10¹⁵ molecules cm−2, respectively, compared to the retrievals with raw WRF-CMAQ predictions. Finally, the improved accuracy of tropospheric-column NO2 and HCHO retrievals using scaled WRF-CMAQ predictions resulted in a slightly higher magnitude of FNR median bias (0.5), however, with lower RMSE values, compared to reprocessed data using raw CMAQ predictions. Compared to standard NASA OMI products, the reprocessed satellite data using scaled WRF-CMAQ data had similar median biases in FNR values and lower median biases for HCHO (4.4×10¹⁵ molecules cm−2) and NO2 ( molecules cm−2). All reprocessed data variables using scaled model-simulated shape factors, due to the reduction in uncertainty in retrieving HCHO and NO2 data, had lower RMSE values, higher correlation (except for FNR), and similar or better linear regression slopes compared to standard satellite retrievals.
3.4 Discussion of satellite sensor errors and capabilities
3.4.1 Relative error in FNR retrievals
A recent study by Souri et al. (2023) showed that satellite retrievals errors, in particular the unresolved error in HCHO products, are the largest source of uncertainty in using satellite FNRs to investigate O3 sensitivity. Here we propagate the uncertainty (RMSE) calculated from NASA OMI, QA4ECV OMI, and TROPOMI to FNR calculations using Eq. (15) from Souri et al. (2023) and created maps of the relative error (see Fig. 6). From this figure it can be seen that satellite retrieval errors in HCHO and NO2 contribute significantly to satellite-derived FNR relative errors. In the largest NOx emission source regions of NYC, where combined column abundances of HCHO and NO2 are largest, the lowest relative errors in FNRs occur. For TROPOMI, which has the smallest values of uncertainty, relative errors are as low as ∼40 %. Away from the emission region of NYC these relative error values reach as high as ∼80 %. Similar patterns of relative error in FNRs from NASA and QA4ECV OMI retrievals are derived; however, the lowest relative error values over NYC are ∼50 % and reach values up to 100 %. The largest relative errors are seen outside the source region of NYC in QA4ECV OMI retrievals due to having the largest uncertainty in HCHO and lower column abundances of this species in the rural regions of the domain. In addition to the fact that the less noisy retrievals from TROPOMI result in lower relative errors in FNR data, Fig. 6 further demonstrates the larger uncertainty in OMI as the relative error patterns are more heterogeneous. The spatial averaging of TROPOMI data results in the lowest relative errors in all four satellite products, as TROPOMI at the coarser () spatial resolution had relative errors as low as 35 %, only increasing to ∼60 % outside of the source location of NYC.
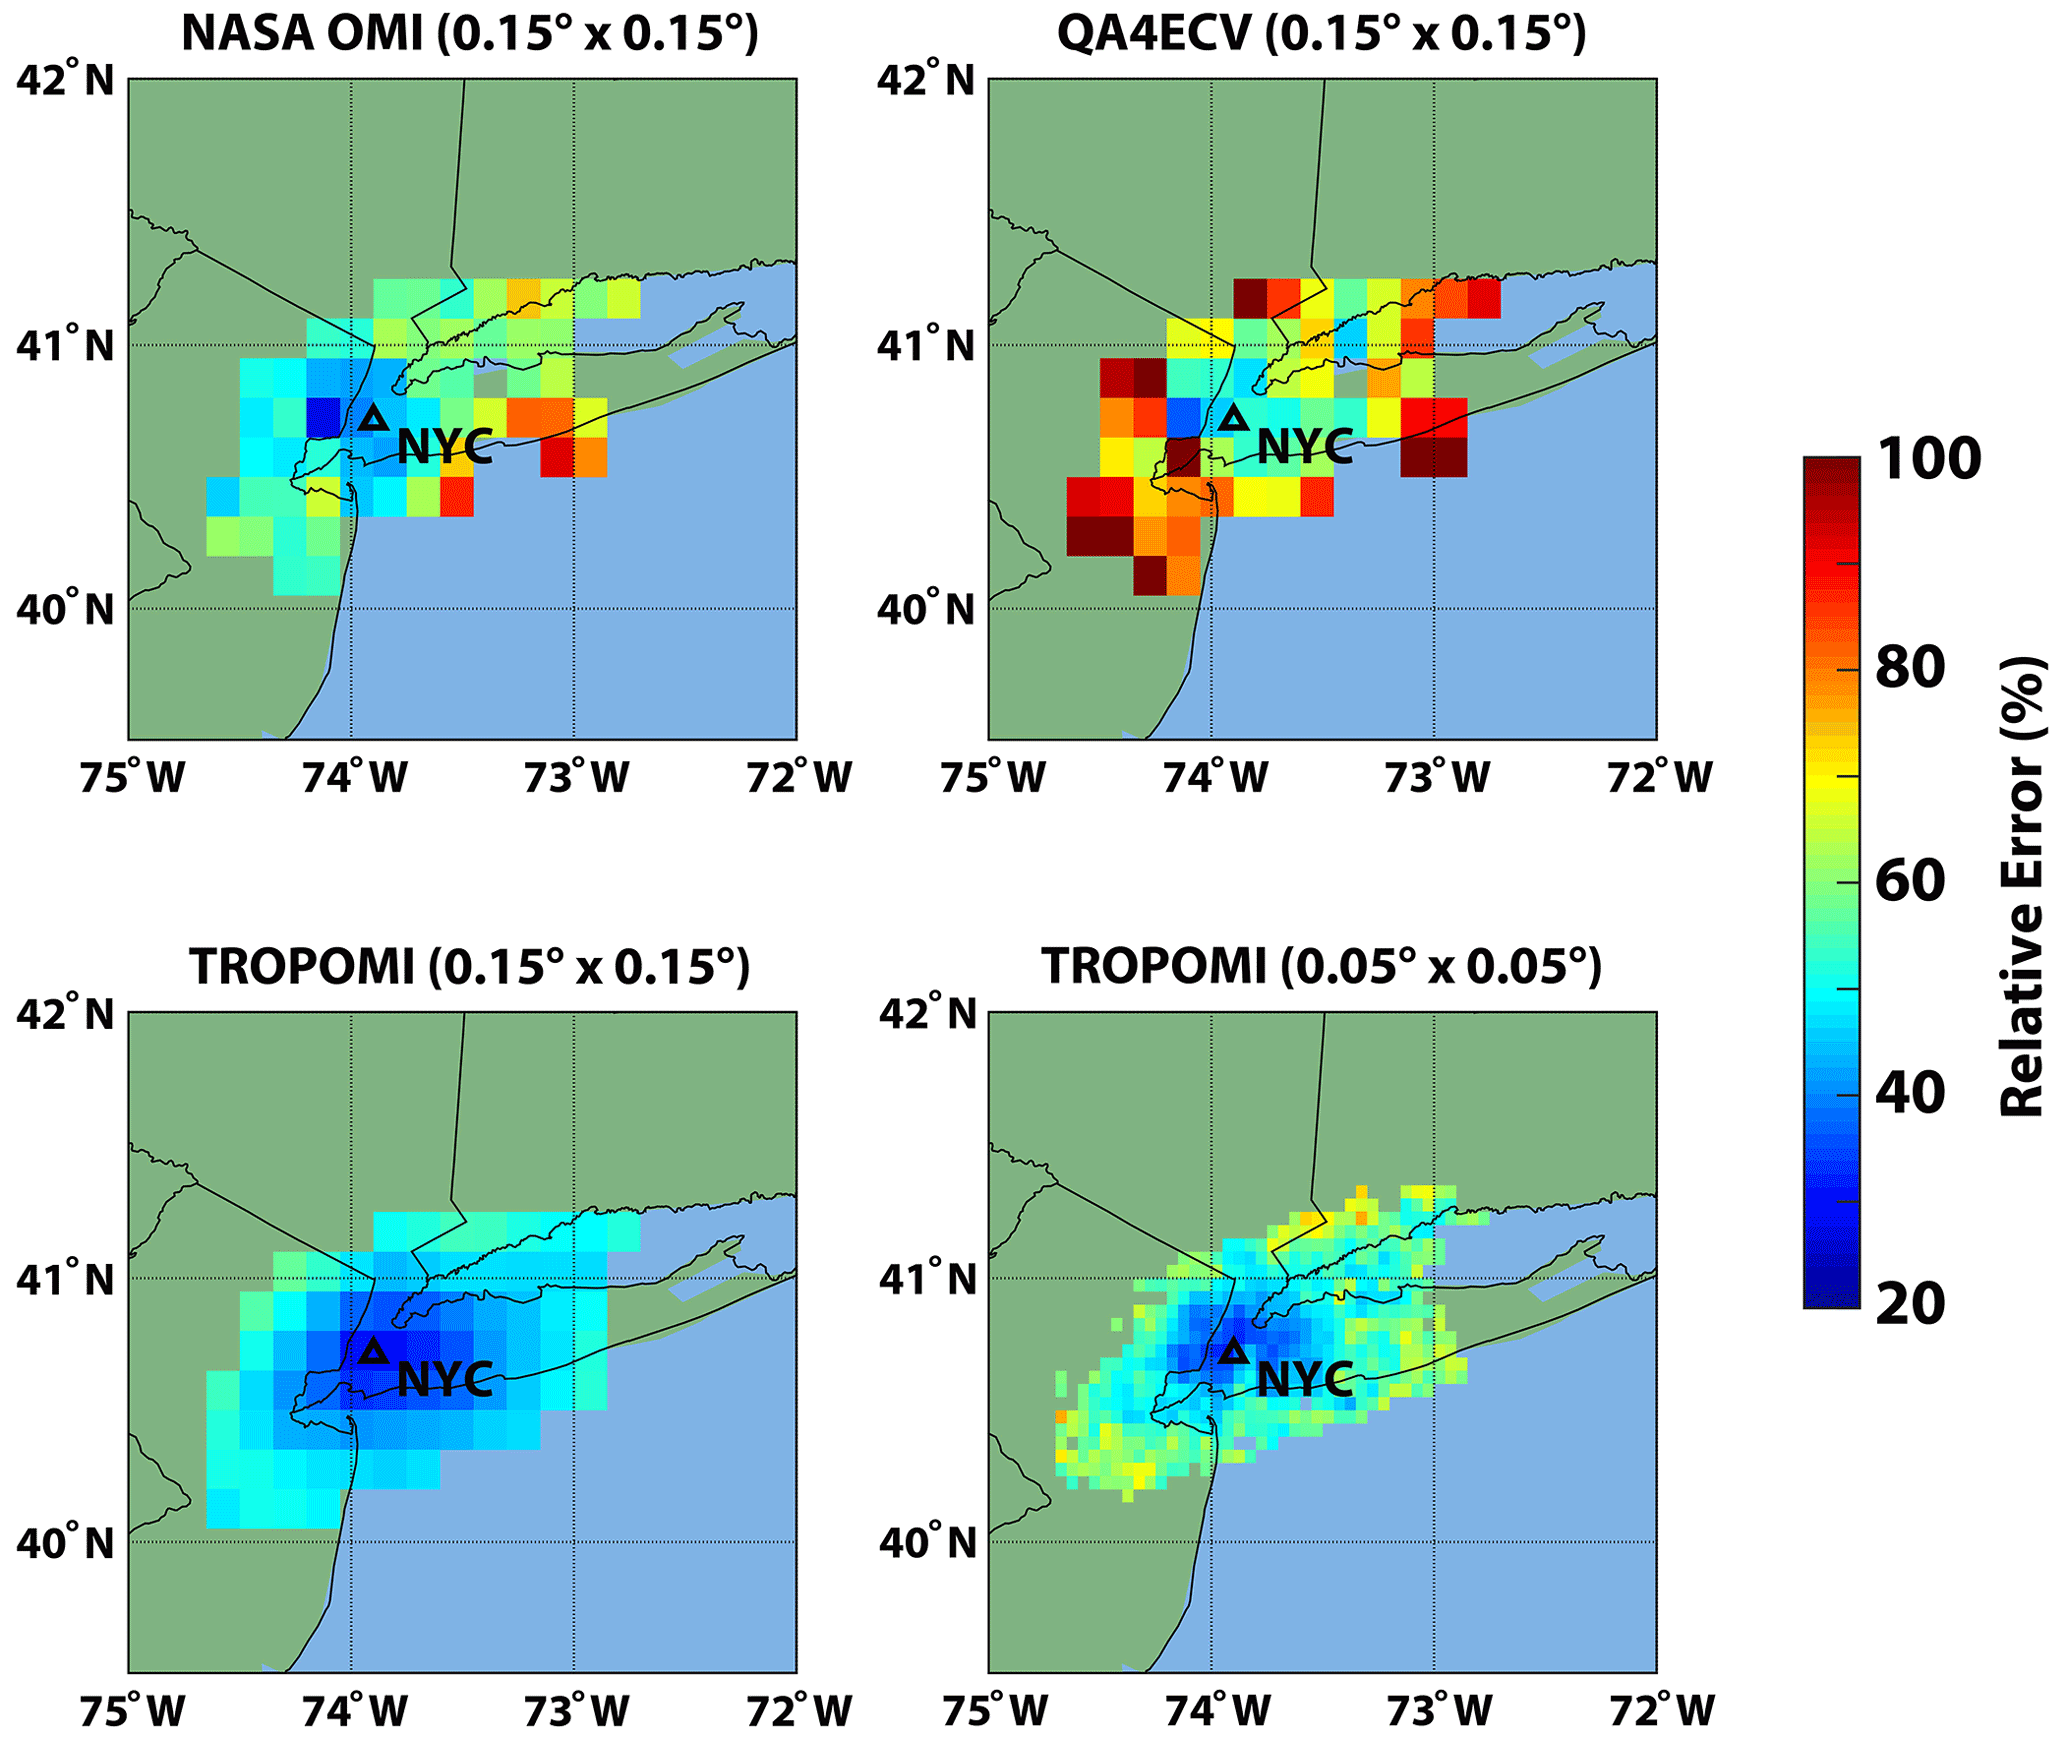
Figure 6Campaign-averaged relative error in FNR products from standard NASA OMI, QA4ECV OMI, and TROPOMI retrievals due to uncertainty in HCHO and NO2 retrievals. All co-located OMI and airborne remote-sensing tropospheric-column FNR values are averaged at , and TROPOMI co-locations are averaged at and spatial resolution. The black triangle indicates the location of NYC.
3.4.2 Spatial and temporal capabilities of satellite FNR retrievals
Given the limited spatiotemporal data coverage provided by the LISTOS campaign, a robust understanding of the temporal capabilities of OMI and TROPOMI to retrieve FNRs is not possible. LEO satellites obtain, at best, a single snapshot of both HCHO and NO2 each day, so one could only hope to obtain daily variability in FNRs from these spaceborne systems. To determine whether OMI and TROPOMI capture the variability in the daily mean tropospheric-column quantities of NO2, HCHO, and FNRs over the entire LISTOS domain from airborne data, we compared these daily mean values from the satellite products to the airborne observations. For NASA OMI, daily correlation (R2) values were 0.85 (p=0.001), 0.58 (p=0.03), and 0.26 (p=0.20) for NO2, HCHO, and FNRs, respectively. For QA4ECV OMI, daily correlation values were 0.85 (p=0.001), 0.80 (p=0.002), and 0.47 (p=0.06) for NO2, HCHO, and FNRs, respectively. For TROPOMI, daily correlation values were 0.92 (p≤0.001), 0.85 (p≤0.001), and 0.41 (p=0.03) for NO2, HCHO, and FNRs, respectively. All daily correlation statistics for HCHO and NO2 were significant to a 95 % confidence interval and suggest that both OMI and TROPOMI can capture the overall inter-daily magnitudes of FNR indicator species. However, only TROPOMI could observe the daily variability in domain-wide FNRs within a 95 % confidence interval. This suggests that unresolved errors in either HCHO or NO2 retrievals from OMI, using both the NASA and QA4ECV algorithms, are too large to confidently capture the inter-daily variability in FNRs.
The same analysis was conducted for NASA and QA4ECV OMI except just for retrievals near the large anthropogenic source regions in NYC (within 0.35∘ of the city center) where relative errors due to satellite retrievals for FNR calculations were the lowest (see Fig. 6). Daily correlation values for FNR retrievals near the source region of NYC for NASA OMI (0.13; p value =0.39) were reduced compared to domain-wide means, and QA4ECV OMI (0.66; p value =0.01) correlations were improved near the source region of NYC. Indicator species correlation values from NASA OMI were degraded compared to the domain-wide analysis, suggesting that this satellite product may not be able to capture inter-daily variability in FNRs even in large source regions. However, this analysis suggests that QA4ECV OMI data have the capability to retrieve daily variability in FNRs in large emission regions such as NYC to a statistically significant level. Overall, TROPOMI retrievals at both fine and coarse spatial resolutions evaluated in this study are able to capture daily variability in tropospheric FNRs over the entire domain and emission source regions better compared to OMI products.
Recent studies have shown that averaging OMI data (especially HCHO retrievals) for longer temporal periods can reduce the noise and uncertainty in this data product. For example, in the recent paper by Souri et al. (2023), it was shown that unresolved errors in OMI HCHO can be reduced in monthly averages compared to daily retrievals by ∼33 %, while there was little improvement in uncertainty statistics of NO2 retrievals from OMI. However, recent studies (e.g., Schroeder et al., 2017) have also shown that for trend studies, monthly averaging column FNR data can mask FNR temporal gradients that exist within that period. This could hinder the results of trend studies of pollution on O3 exceedance days and days of lower pollution.
To understand the extent to which OMI and TROPOMI retrievals lose spatial information (variance) compared to airborne data, we applied the algorithm named SpaTial Representation Error EstimaTor (STREET) (Souri, 2022). This method creates semivariograms determining the changes in spatial variability with distance for a defined variable (we used HCHO and NO2). The maximum variance at which the modeled semivariogram levels off is defined as a sill, and data sets with larger sill values possess richer spatial information. Figure S10 shows semivariograms, as well as the fitted stable Gaussian function, applied to TROPOMI and NASA OMI compared to airborne NO2 columns. Concerning the comparison of TROPOMI and airborne data at resolution, we observe airborne semivariograms as high as 20×1015 molecules cm−2, larger by a factor of 2 than what OMI achieves. At a ∼20 km length scale, TROPOMI can only observe ∼40 % of the airborne spatial variance, indicating that the spatial representation error in TROPOMI is ∼60 % at this scale. NASA OMI fails to recreate >50 % of the maximum variance observed in airborne data at resolution. At ∼20 km length scale, the spatial loss of OMI is >70 %.
Figure S10 depicts the semivariograms and fitted exponential curves applied to TROPOMI and airborne HCHO. Immediately evident is that both semivariograms level off at longer distances compared to the analysis of NO2. This stems from the fact that HCHO columns tend to be spatially more homogeneous in the region of the LISTOS domain. For most length scales, TROPOMI can replicate the spatial variance observed in airborne data (∼70 %). We do not present the semivariogram for NASA OMI HCHO columns as the underlying unresolved biases in OMI are very large, introducing artifacts that cannot be solely attributable to unresolved spatial scales. Since TROPOMI is able to capture the observed HCHO variability to a sufficient degree and can sufficiently retrieve NO2 spatial variability, this suggests that TROPOMI has better capability to retrieve FNR spatial variability compared to OMI.
3.4.3 Reasons for systematic bias and uncertainty in FNRs
As demonstrated in this study, median biases of OMI and TROPOMI HCHO and NO2 retrievals tend to cancel out when calculating tropospheric-column FNRs. Figures S4 and S5 show that the median bias spatial distribution of all satellite HCHO and NO2 retrievals are similar, with a small low median bias in column abundances near the source region of NYC and high biases in clean regions. Table S1 shows that AMF calculations from NASA OMI, QA4ECV OMI, and TROPOMI use many of the same input data sets for geophysical variables (e.g., surface albedo, cloud fraction, cloud radiance), resulting in campaign-averaged AMFs of HCHO, NO2, and the ratios of these products (AMF FNRs) which are relatively similar across the LISTOS domain (see Fig. S11). For all satellite products, HCHO and NO2 AMFs have much less variability compared to AMFs derived for airborne data which along with SCD biases may contribute to the median high biases in clean HCHO and NO2 retrievals. A primary reason for the inability of satellites to capture AMF variability over the LISTOS domain is likely the shape factors being used for these calculations having spatial resolutions from to even coarser grids. Furthermore, while TROPOMI and QA4ECV OMI retrievals used daily model data, NASA OMI uses monthly products which make it challenging to capture the large spatiotemporal variability in tropospheric HCHO and NO2 vertical profiles. Finally, coarse geophysical input data sets used in satellite AMF calculations will not capture the spatial distribution of these variables as well as the high-spatial-resolution geophysical data sets used in airborne AMF calculations.
The more interesting aspect found in this study is that unresolved errors in HCHO and NO2 retrievals do not cancel out in FNR calculations. While there are some reasons why uncertainty in HCHO and NO2 retrievals could stem from opposite impacts of geophysical parameters in AMF calculations, such as AMF uncertainties in HCHO and NO2 having opposite trends with increasing surface reflectance (comparing Fig. 10 from De Smedt et al., 2018, and Fig. 20 from S. Liu et al., 2021), these differences are minor and AMF calculations for both species in NASA OMI, QA4ECV OMI, and TROPOMI have similar input data sets. A portion of the uncertainty in HCHO and NO2 retrievals not canceling out stems from the AMF calculations shown in Fig. S11. In order for HCHO and NO2 AMFs to have no impact on VCD uncertainty cancelations, AMF FNRs would need to be a constant or similar value at all locations. However, from Fig. S11 it is shown that AMF FNRs, while having smooth spatial variability, are not a constant value. Therefore, some of the unresolved error residual in the FNR calculations will be due to differences in HCHO and NO2 AMF calculations. This is emphasized in NASA OMI AMF FNR plots in Fig. S11, where different CTMs, at different spatial resolutions (see Table S1), are used to derive HCHO and NO2 shape factors leading to noticeable differences in the respective AMF calculations. This likely is one of the reasons that NASA OMI FNRs have the largest uncertainty (highest bias standard deviation and RMSE values) compared to airborne data (see Table 2).
The rest of the remaining unresolved error in FNR calculations is likely due to the SCD retrievals from OMI and TROPOMI sensors. SCD retrievals of HCHO from TROPOMI have been shown to have less noise compared to OMI (De Smedt et al., 2021). The larger uncertainty in OMI retrievals of HCHO compared to TROPOMI directly leads to the higher bias standard deviation and RMSE values for derived FNRs in OMI compared to TROPOMI (see Table 2). This is further emphasized in the spatially averaged TROPOMI data (at to match OMI data), where HCHO and FNR retrievals have an RMSE lower by a factor of 2–3 compared to OMI products. TROPOMI NO2 SCDs have also been shown to have less noise compared to OMI retrievals (van Geffen et al., 2020, 2022). This is also shown in Table 2 when averaging TROPOMI data to match the OMI spatial resolution. Overall, HCHO and NO2 SCD noise contributes to uncertainty in OMI, and TROPOMI VCDs and are not canceled out in FNR calculations; however, the reduced noise in TROPOMI SCD retrievals leads to improved VCDs of HCHO and NO2 abundances.
This study presents a statistical evaluation and inter-comparison of tropospheric FNR retrievals from two commonly applied LEO sensors for investigating O3 production sensitivity regimes (i.e., OMI and TROPOMI). The evaluation of NASA OMI, QA4ECV OMI, and TROPOMI retrievals of tropospheric NO2 and HCHO, as well as resulting FNRs, was conducted with airborne remote-sensing observations (GeoTASO and GCAS) during LISTOS 2018. Past studies have focused on the evaluation of satellite retrievals of tropospheric-column NO2 and HCHO, individually; however, this is the first study to validate the ability of multiple satellite platforms and retrieval algorithms to retrieve tropospheric FNRs. The quantification of satellite-retrieved tropospheric FNRs errors is currently an important, but relatively unknown, uncertainty when applying spaceborne remote-sensing products to investigate O3 production regimes.
The statistical evaluation of NASA OMI, QA4ECV OMI, and TROPOMI illustrated that all three retrievals have a high bias of clean-region tropospheric-column NO2 and HCHO concentrations. The satellite retrievals compare more accurately to larger tropospheric-column NO2 and HCHO values observed in more polluted areas. The magnitude-dependent biases for OMI and TROPOMI NO2 and HCHO derived in this study agree with other recent validation projects (e.g., Judd et al., 2020; Vigouroux et al., 2020; Zhao et al., 2020; Compernolle et al., 2020; Lamsal et al., 2021; De Smedt et al., 2021; Verhoelst et al., 2021). Both OMI and TROPOMI retrievals compared well to observed NO2 throughout the campaign; however, the statistical comparison with observed HCHO data resulted in larger and more variable biases. Overall, daily averaged and campaign-averaged comparisons of the satellite HCHO data to observations displayed large RMSE values, emphasizing the large noise in these retrieval products which hinders the accuracy of FNRs from spaceborne sensors. While all three satellite products at near-native spatial resolutions had low systematic campaign-averaged FNR median biases, suggesting median biases in HCHO and NO2 data cancel out, the RMSE values for FNRs remained large, primarily due to uncertainty in HCHO and NO2 retrievals not offsetting. Given the limited measurement sensitivity of shorter UV–Vis wavelengths to HCHO in the middle to lower troposphere, improved information (in situ, remote sensing, or models) of the vertical profiles of HCHO to be used as a priori information would benefit satellite remote-sensing capabilities for observing HCHO and FNRs.
The higher spatial resolution of TROPOMI, along with a good signal-to-noise ratio, allows for this sensor to better capture the spatiotemporal variability and urban–rural interface of tropospheric-column NO2 and HCHO values and resulting FNRs. This satellite data had the highest correlations with observed NO2, HCHO, and FNRs throughout the campaign, along with the lowest RMSEs of all three satellite products. The added benefit of TROPOMI spatial resolution is important as this sensor has now been operational for 5+ years and can be applied in trend analysis along with case studies. Future studies of FNR trends should include both OMI and TROPOMI retrievals and determine best practices to fuse the two data sets.
Applying multiple retrieval algorithms to the radiances of a single satellite sensor is of interest in order to determine how input variables (e.g., information on a priori vertical profiles, clouds, surface albedo) impact the retrieval performance. This study evaluated results of OMI retrievals, applying two well-known retrieval algorithms (i.e., the NASA version 4 product and output from the QA4ECV project). Results from the two retrievals were similar for NO2 but differed primarily in tropospheric-column HCHO, where NASA OMI data had a median bias larger by a factor of 2 compared to QA4ECV. Both retrieval algorithms resulted in large RMSE values indicative of the noise in tropospheric HCHO retrievals. While NASA OMI data displayed less accurate retrievals in HCHO, as well as similar performance for NO2, NASA OMI data resulted in FNR values with similar biases and uncertainties. Given that both the NASA and QA4ECV retrievals of tropospheric HCHO resulted in noisy data products, this emphasizes the need for an improved signal-to-noise ratio and calibration and improved a priori vertical profile information of HCHO to negate the low measurement sensitivity of HCHO in the middle to lower troposphere for future satellite sensors.
Our study investigated the impact of high-spatial-resolution WRF-CMAQ-predicted NO2 and HCHO a priori profiles on OMI and TROPOMI retrievals of FNRs. TROPOMI reprocessed data had improved performance when using the higher-spatial-resolution WRF-CMAQ data as the a priori product compared to standard retrievals which apply coarser-resolution TM5 output. In comparison to standard OMI products the reprocessed satellite data using optimized WRF-CMAQ a priori information had similar median biases in FNR values and lower median biases in both indicator species. All reprocessed OMI data variables using optimized simulated shape factors, due to the reduction in unresolved error in retrieved HCHO and NO2 data, had lower RMSE, higher correlation (except for FNR), and similar or better linear regression slopes compared to observations. These results emphasize the importance of accurate a priori information. Future studies should investigate the impact of a priori profile data sets of various spatial resolutions, ranging from the GMI and TM5 model data used for OMI and TROPOMI, respectively, to much higher-resolution air quality model simulations, on the results of reprocessed satellite NO2 and HCHO retrievals.
Overall, the systematic biases and uncertainties presented in this study can be used in future studies when interpreting the accuracy of OMI and TROPOMI retrievals of FNRs, as well as the two indicator species used for investigating O3 sensitivity regimes. A main take away from this study is that it is necessary to statistically evaluate both the tropospheric FNRs and the NO2 and HCHO products individually, as large median biases in both NO2 and HCHO satellite products can offset, resulting in accurate median FNR values. However, this study emphasizes that uncertainty in NO2 and HCHO satellite retrievals do not offset in OMI or TROPOMI products, greatly hindering the accuracy of daily scenes of FNRs from these sensors. The large unresolved biases in tropospheric-column HCHO retrievals appear to be the controlling and limiting factor of daily FNR accuracy. While both TROPOMI and OMI captured some of the spatiotemporal variability in observed NO2 within the LISTOS domain, only TROPOMI is able to capture spatiotemporal HCHO variability with uncertainty low enough for potentially capturing daily FNR variability. The unresolved error in HCHO retrievals from OMI is too large and likely limits the application of these data on a daily basis near the native spatial resolution of the sensor. Overall, the individual satellite products display varying degrees of capability to retrieve tropospheric FNRs, and it is necessary to further validate OMI and TROPOMI retrievals using other field campaign or stationary network data in different regions of the world to identify the primary controlling factors of systematic biases and uncertainty.
The primary data sources were the NASA OMI NO2 (https://doi.org/10.5067/Aura/OMI/DATA2017, Krotkov et al., 2019) and SAO HCHO (https://doi.org/10.5067/Aura/OMI/DATA2015, Chance, 2007), QA4ECV OMI NO2 (https://doi.org/10.21944/qa4ecv-no2-omi-v1.1, Boersma et al., 2017) and HCHO (https://doi.org/10.18758/71021031, De Smedt et al., 2017; https://doi.org/10.5194/amt-11-2395-2018, De Smedt et al., 2018), and TROPOMI PAL NO2 (https://data-portal.s5p-pal.com/, last access: 20 December 2020; Jos van Geffen et al., 2021) and operational HCHO (https://doi.org/10.5270/S5P-tjlxfd2, ESA Copernicus Sentinel-5P, 2019) satellite data. For evaluating these satellite products we use airborne remote-sensing data from GeoTASO and GCAS which were downloaded from the LISTOS 2018 campaign data repository (https://www-air.larc.nasa.gov/missions/listos/index.html, Janz, 2020).
The supplement related to this article is available online at: https://doi.org/10.5194/amt-16-2431-2023-supplement.
MSJ and SP were responsible for acquiring the funds for the project. MSJ, AHS, and SP designed the technical methods and experiments of the study. MSJ, AHS, RK, JG, and HC were responsible for carrying them out. LJ, SJ, AN, JS, and JG were instrumental in providing satellite and airborne data applied in the study. MSJ prepared the manuscript with contributions from all co-authors.
At least one of the (co-)authors is a member of the editorial board of Atmospheric Measurement Techniques. The peer-review process was guided by an independent editor, and the authors also have no other competing interests to declare.
The views, opinions, and findings contained in this report are those of the authors and should not be construed as an official NASA or United States Government position, policy, or decision.
Publisher's note: Copernicus Publications remains neutral with regard to jurisdictional claims in published maps and institutional affiliations.
Matthew S. Johnson, Sajeev Philip, Rajesh Kumar, Amir H. Souri, and Jeffrey Geddes acknowledge the financial support from the NASA Aura Science Team (grant no. NNH19ZDA001N-AURAST). Laura Judd and Scott Janz are collaborators on the project, and their contribution was through in-kind efforts. Sajeev Philip acknowledges support from NASA Academic Mission Services by the Universities Space Research Association at NASA Ames Research Center during the initial stages of this study. Finally, the work by Aaron Naeger was through in-kind efforts. The authors perceive no financial or other affiliations which are conflicts of interest. Resources supporting this work were provided by the NASA High-End Computing (HEC) Program through the NASA Advanced Supercomputing (NAS) Division at NASA Ames Research Center. The National Center for Atmospheric Research is sponsored by the National Science Foundation.
Matthew S. Johnson and Sajeev Philip (grant no. 80NSSC20K1182), Rajesh Kumar (grant no. 80NSSC20K1234), Amir H. Souri (grant no. 80NSSC21K1333), and Jeffrey Geddes (grant no. 80NSSC20K1033) were funded for this work through the NASA Aura Science Team (grant no. NNH19ZDA001N-AURAST).
This paper was edited by Folkert Boersma and reviewed by three anonymous referees.
Acarreta, J. R., De Haan, J. F., and Stammes, P.: Cloud pressure retrieval using the O2–O2 absorption band at 477 nm, J. Geophys. Res.-Atmos., 109, D05204, https://doi.org/10.1029/2003JD003915, 2004.
Appel, K. W., Napelenok, S. L., Foley, K. M., Pye, H. O. T., Hogrefe, C., Luecken, D. J., Bash, J. O., Roselle, S. J., Pleim, J. E., Foroutan, H., Hutzell, W. T., Pouliot, G. A., Sarwar, G., Fahey, K. M., Gantt, B., Gilliam, R. C., Heath, N. K., Kang, D., Mathur, R., Schwede, D. B., Spero, T. L., Wong, D. C., and Young, J. O.: Description and evaluation of the Community Multiscale Air Quality (CMAQ) modeling system version 5.1, Geosci. Model Dev., 10, 1703–1732, https://doi.org/10.5194/gmd-10-1703-2017, 2017.
Boersma, K. F., Eskes, H. J., and Brinksma, E. J.: Error analysis for tropospheric NO2 retrieval from space, J. Geophys. Res., 109, D04311, https://doi.org/10.1029/2003JD003962, 2004.
Boersma, K. F., Eskes, H. J., Veefkind, J. P., Brinksma, E. J., van der A, R. J., Sneep, M., van den Oord, G. H. J., Levelt, P. F., Stammes, P., Gleason, J. F., and Bucsela, E. J.: Near-real time retrieval of tropospheric NO2 from OMI, Atmos. Chem. Phys., 7, 2103–2118, https://doi.org/10.5194/acp-7-2103-2007, 2007.
Boersma, K. F., Eskes, H. J., Dirksen, R. J., van der A, R. J., Veefkind, J. P., Stammes, P., Huijnen, V., Kleipool, Q. L., Sneep, M., Claas, J., Leitão, J., Richter, A., Zhou, Y., and Brunner, D.: An improved tropospheric NO2 column retrieval algorithm for the Ozone Monitoring Instrument, Atmos. Meas. Tech., 4, 1905–1928, https://doi.org/10.5194/amt-4-1905-2011, 2011.
Boersma, K. F., Eskes, H., Richter, A., De Smedt, I., Lorente, A., Beirle, S., Van Geffen, J., Peters, E., Van Roozendael, M., and Wagner, T.: QA4ECV NO2 tropospheric and stratospheric vertical column data from OMI, Version 1.1, Royal Netherlands Meteorological Institute (KNMI) [data set], https://doi.org/10.21944/qa4ecv-no2-omi-v1.1, 2017.
Boersma, K. F., Eskes, H. J., Richter, A., De Smedt, I., Lorente, A., Beirle, S., van Geffen, J. H. G. M., Zara, M., Peters, E., Van Roozendael, M., Wagner, T., Maasakkers, J. D., van der A, R. J., Nightingale, J., De Rudder, A., Irie, H., Pinardi, G., Lambert, J.-C., and Compernolle, S. C.: Improving algorithms and uncertainty estimates for satellite NO2 retrievals: results from the quality assurance for the essential climate variables (QA4ECV) project, Atmos. Meas. Tech., 11, 6651–6678, https://doi.org/10.5194/amt-11-6651-2018, 2018.
Bucsela, E. J., Krotkov, N. A., Celarier, E. A., Lamsal, L. N., Swartz, W. H., Bhartia, P. K., Boersma, K. F., Veefkind, J. P., Gleason, J. F., and Pickering, K. E.: A new stratospheric and tropospheric NO2 retrieval algorithm for nadir-viewing satellite instruments: applications to OMI, Atmos. Meas. Tech., 6, 2607–2626, https://doi.org/10.5194/amt-6-2607-2013, 2013.
Chan, K. L., Wiegner, M., van Geffen, J., De Smedt, I., Alberti, C., Cheng, Z., Ye, S., and Wenig, M.: MAX-DOAS measurements of tropospheric NO2 and HCHO in Munich and the comparison to OMI and TROPOMI satellite observations, Atmos. Meas. Tech., 13, 4499–4520, https://doi.org/10.5194/amt-13-4499-2020, 2020.
Chance, K.: Analysis of BrO measurements from the Global Ozone Monitoring Experiment, Geophys. Res. Lett., 25, 3335–3338, https://doi.org/10.1029/98GL52359, 1998.
Chance, K.: OMI/Aura Formaldehyde (HCHO) Total Column 1-orbit L2 Swath 13x24 km V003, Goddard Earth Sciences Data and Information Services Center (GES DISC) [data set], Greenbelt, MD, USA, https://doi.org/10.5067/Aura/OMI/DATA2015, 2007.
Chance, K., Liu, X., Miller, C. C., González Abad, G., Huang, G., Nowlan, C., Souri, A., Suleiman, R., Sun, K., Wang, H., Zhu, L., Zoogman, P., Al-Saadi, J., Antuña-Marrero, J. C., Carr, J., Chatfield, R., Chin, M., Cohen, R., Edwards, D., Fishman, J., Flittner, D., Geddes, J., Grutter, M., Herman, J. R., Jacob, D. J., Janz, S., Joiner, J., Kim, J., Krotkov, N. A., Lefer, B., Martin, R. V., Mayol-Bracero, O. L., Naeger, A., Newchurch, M., Pfister, G. G., Pickering, K., Pierce, R. B., Rivera Cárdenas, C., Saiz-Lopez, A., Simpson, W., Spinei, E., Spurr, R. J. D., Szykman, J. J., Torres, O., and Wang, J.: TEMPO Green Paper: Chemistry, Physics, and Meteorology Experiments with the Tropospheric Emissions: Monitoring of Pollution Instrument, in: Sensors, Systems, and Next-Generation Satellites XXIII, Strasbourg, France, 9-12 September 2019, edited by: Neeck, S. P., Kimura, T., and Martimort, P., Proc. SPIE, 11151, p. 10, https://doi.org/10.1117/12.2534883, 2019.
Choi, Y. and Souri, A.: Chemical condition and surface ozone in large cities of Texas during the last decade: observational evidence from OMI, CAMS, and Model Analysis, Remote Sens. Environ., 168, 90–101, https://doi.org/10.1016/j.rse.2015.06.026, 2015.
Choi, Y., Kim, H., Tong, D., and Lee, P.: Summertime weekly cycles of observed and modeled NOx and O3 concentrations as a function of satellite-derived ozone production sensitivity and land use types over the Continental United States, Atmos. Chem. Phys., 12, 6291–6307, https://doi.org/10.5194/acp-12-6291-2012, 2012.
Compernolle, S., Verhoelst, T., Pinardi, G., Granville, J., Hubert, D., Keppens, A., Niemeijer, S., Rino, B., Bais, A., Beirle, S., Boersma, F., Burrows, J. P., De Smedt, I., Eskes, H., Goutail, F., Hendrick, F., Lorente, A., Pazmino, A., Piters, A., Peters, E., Pommereau, J.-P., Remmers, J., Richter, A., van Geffen, J., Van Roozendael, M., Wagner, T., and Lambert, J.-C.: Validation of Aura-OMI QA4ECV NO2 climate data records with ground-based DOAS networks: the role of measurement and comparison uncertainties, Atmos. Chem. Phys., 20, 8017–8045, https://doi.org/10.5194/acp-20-8017-2020, 2020.
Crutzen, P. J.: Gas-phase nitrogen and methane chemistry in the atmosphere. In Physics and Chemistry of the Upper Atmosphere, in: Proceedings of a Symposium Organized by the Summer Advanced Study Institute, edited by: McCormac, B. M., D. Reidel Publishing Co., Dordrecht, Holland, 110–124, https://doi.org/10.1007/978-94-010-2542-3_12, 1973.
De Smedt, I., Stavrakou, T., Hendrick, F., Danckaert, T., Vlemmix, T., Pinardi, G., Theys, N., Lerot, C., Gielen, C., Vigouroux, C., Hermans, C., Fayt, C., Veefkind, P., Müller, J.-F., and Van Roozendael, M.: Diurnal, seasonal and long-term variations of global formaldehyde columns inferred from combined OMI and GOME-2 observations, Atmos. Chem. Phys., 15, 12519–12545, https://doi.org/10.5194/acp-15-12519-2015, 2015.
De Smedt, I., Yu, H., Richter, A., Beirle, S., Eskes, H., Boersma, K. F., Van Roozendael, M., Van Geffen, J., Lorente, A., and Peters, E.: QA4ECV HCHO tropospheric column data from OMI, Version 1.1, Royal Belgian Institute for Space Aeronomy [data set], https://doi.org/10.18758/71021031, 2017.
De Smedt, I., Theys, N., Yu, H., Danckaert, T., Lerot, C., Compernolle, S., Van Roozendael, M., Richter, A., Hilboll, A., Peters, E., Pedergnana, M., Loyola, D., Beirle, S., Wagner, T., Eskes, H., van Geffen, J., Boersma, K. F., and Veefkind, P.: Algorithm theoretical baseline for formaldehyde retrievals from S5P TROPOMI and from the QA4ECV project, Atmos. Meas. Tech., 11, 2395–2426, https://doi.org/10.5194/amt-11-2395-2018, 2018.
De Smedt, I., Pinardi, G., Vigouroux, C., Compernolle, S., Bais, A., Benavent, N., Boersma, F., Chan, K.-L., Donner, S., Eichmann, K.-U., Hedelt, P., Hendrick, F., Irie, H., Kumar, V., Lambert, J.-C., Langerock, B., Lerot, C., Liu, C., Loyola, D., Piters, A., Richter, A., Rivera Cárdenas, C., Romahn, F., Ryan, R. G., Sinha, V., Theys, N., Vlietinck, J., Wagner, T., Wang, T., Yu, H., and Van Roozendael, M.: Comparative assessment of TROPOMI and OMI formaldehyde observations and validation against MAX-DOAS network column measurements, Atmos. Chem. Phys., 21, 12561–12593, https://doi.org/10.5194/acp-21-12561-2021, 2021.
Duncan, B. N., Yoshida, Y., Olson, J. R., Sillman, S., Martin, R. V., Lamsal, L., Hu, Y., Pickering, K. E., Retscher, C., Allen, D. J., and Crawford, J. H.: Application of OMI observations to a space-based indicator of NOx and VOC controls on surface ozone formation, Atmos. Environ., 44, 2213–2223, https://doi.org/10.1016/j.atmosenv.2010.03.010, 2010.
Dobber, M., Kleipool, Q., Dirksen, R., Levelt, P., Jaross, G., Taylor, S., Kelly, T., Flynn, L., Leppelmeier, G., and Rozemeijer, N.: Validation of Ozone Monitoring Instrument level 1b data products, J. Geophys. Res., 113, D15S06, https://doi.org/10.1029/2007JD008665, 2008.
ESA (European Space Agency): Sentinel-4: ESA's geostationary atmospheric mission for Copernicus operational services, ESA Rep. SP-1334, 92 pp., http://esamultimedia.esa.int/multimedia/publications/SP-1334/SP-1334.pdf (last access: 8 May 2023), 2017.
ESA Copernicus Sentinel-5P: Sentinel-5P TROPOMI Tropospheric Formaldehyde HCHO 1-Orbit L2 7km x 3.5km (S5P_L2__HCHO__), Version 1, Goddard Earth Sciences Data and Information Services Center (GES DISC) [data set], Greenbelt, MD, USA, https://doi.org/10.5270/S5P-tjlxfd2, 2019.
Fasnacht, Z., Vasilkov, A., Haffner, D., Qin, W., Joiner, J., Krotkov, N., Sayer, A. M., and Spurr, R.: A geometry-dependent surface Lambertian-equivalent reflectivity product for UV–Vis retrievals – Part 2: Evaluation over open ocean, Atmos. Meas. Tech., 12, 6749–6769, https://doi.org/10.5194/amt-12-6749-2019, 2019.
Goldberg, D. L., Lamsal, L. N., Loughner, C. P., Swartz, W. H., Lu, Z., and Streets, D. G.: A high-resolution and observationally constrained OMI NO2 satellite retrieval, Atmos. Chem. Phys., 17, 11403–11421, https://doi.org/10.5194/acp-17-11403-2017, 2017.
Goldberg, D. L., Anenberg, S., Mohegh, A., Lu, Z., and Streets, D. G.: TROPOMI NO2 in the United States: A detailed look at the annual averages, weekly cycles, effects of temperature, and correlation with surface NO2 concentrations, Earth's Future, 9, e2020EF001665, https://doi.org/10.1029/2020EF001665, 2021.
González Abad, G., Liu, X., Chance, K., Wang, H., Kurosu, T. P., and Suleiman, R.: Updated Smithsonian Astrophysical Observatory Ozone Monitoring Instrument (SAO OMI) formaldehyde retrieval, Atmos. Meas. Tech., 8, 19–32, https://doi.org/10.5194/amt-8-19-2015, 2015.
González Abad, G., Vasilkov, A., Seftor, C., Liu, X., and Chance, K.: Smithsonian Astrophysical Observatory Ozone Mapping and Profiler Suite (SAO OMPS) formaldehyde retrieval, Atmos. Meas. Tech., 9, 2797–2812, https://doi.org/10.5194/amt-9-2797-2016, 2016.
Janz, S.: GCAS and GeoTASO measurements of NO2 and CH2O, NASA Langley Research Center [data set], https://www-air.larc.nasa.gov/cgi-bin/ArcView/listos?NASA-AIRCRAFT=1, last access: 21 April 2020.
Jin, X. and Holloway, T.: Spatial and temporal variability of ozone sensitivity over China observed from the Ozone Monitoring Instrument, J. Geophys. Res., 120, 7229–7246, https://doi.org/10.1002/2015JD023250, 2015.
Jin, X., Fiore, A. M., Murray, L. T., Valin, L. C., Lamsal, L. N., Duncan, B., Folkert, B., De, S., Abad, G. G., Chance, K., and Tonnesen, G. S.: Evaluating a Space-Based Indicator of Surface Ozone-NOx-VOC Sensitivity Over Midlatitude Source Regions and Application to Decadal Trends, J. Geophys. Res.-Atmos., 122, 10439–10461, https://doi.org/10.1002/2017JD026720, 2017.
Jin, X., Fiore, A., Boersma, K. F., De Smedt, I., and Valin, L.: Inferring Changes in Summertime Surface Ozone–NOx–VOC Chemistry over U.S. Urban Areas from Two Decades of Satellite and Ground-Based Observations, Environ. Sci. Technol., 54, 6518–6529, https://doi.org/10.1021/acs.est.9b07785, 2020.
Johnson, M. S., Liu, X., Zoogman, P., Sullivan, J., Newchurch, M. J., Kuang, S., Leblanc, T., and McGee, T.: Evaluation of potential sources of a priori ozone profiles for TEMPO tropospheric ozone retrievals, Atmos. Meas. Tech., 11, 3457–3477, https://doi.org/10.5194/amt-11-3457-2018, 2018.
Jos van Geffen, H. E., Sneep, M., Veefkind, P., Niemeijer, S., and Zehner, C.: Sentinel-5P NO2 products reprocessed with the NL-L2 processor v2.3.1, Version: 1.0, S5P-PAL Data Portal [data set], https://data-portal.s5p-pal.com/ (last access: 20 December 2020), 2021.
Judd, L. M., Al-Saadi, J. A., Szykman, J. J., Valin, L. C., Janz, S. J., Kowalewski, M. G., Eskes, H. J., Veefkind, J. P., Cede, A., Mueller, M., Gebetsberger, M., Swap, R., Pierce, R. B., Nowlan, C. R., Abad, G. G., Nehrir, A., and Williams, D.: Evaluating Sentinel-5P TROPOMI tropospheric NO2 column densities with airborne and Pandora spectrometers near New York City and Long Island Sound, Atmos. Meas. Tech., 13, 6113–6140, https://doi.org/10.5194/amt-13-6113-2020, 2020.
Kampa, M. and Castanas, E.: Human health effects of air pollution, Environ. Pollut., 151, 362–367, https://doi.org/10.1016/j.envpol.2007.06.012, 2008.
Kim, J., Jeong, U., Ahn, M.-H., Kim, J. H., Park, R. J., Lee, H., Song, C. H., Choi, Y.-S., Lee, K.-H., Yoo, J.-M., Jeong, M.-J., Park, S. K., Lee, K.-M., Song, C.-K., Kim, S.-W., Kim, Y. J., Kim, S.-W., Kim, M., Go, S., Liu, X., Chance, K., Chan Miller, C., Al-Saadi, J., Veihelmann, B., Bhartia, P. K., Torres, O., Abad, G. G., Haffner, D. P., Ko, D. H., Lee, S. H., Woo, J.-H., Chong, H., Park, S. S., Nicks, D., Choi, W. J., Moon, K.-J., Cho, A., Yoon, J., Kim, S.-k., Hong, H., Lee, K., Lee, H., Lee, S., Choi, M., Veefkind, P., Levelt, P. F., Edwards, D. P., Kang, M., Eo, M., Bak, J., Baek, K., Kwon, H.-A., Yang, J., Park, J., Han, K. M., Kim, B.-R., Shin, H.-W., Choi, H., Lee, E., Chong, J., Cha, Y., Koo, J.-H., Irie, H., Hayashida, S., Kasai, Y., Kanaya, Y., Liu, C., Lin, J., Crawford, J. H., Carmichael, G. R., Newchurch, M. J., Lefer, B. L., Herman, J. R., Swap, R. J., Lau, A. K. H., Kurosu, T. P., Jaross, G., Ahlers, B., Dobber, M., McElroy, C. T., and Choi, Y.: New Era of Air Quality Monitoring from Space: Geostationary Environment Monitoring Spectrometer (GEMS), B. Am. Meteorol. Soc., 101, E1–E22, https://doi.org/10.1175/bams-d-18-0013.1, 2020.
Kleipool, Q. L., Dobber, M. R., de Haan, J. F., and Levelt, P. F.: Earth surface reflectance climatology from 3 years of OMI data, J. Geophys. Res., 113, D18308, https://doi.org/10.1029/2008JD010290, 2008.
Kleinman, L. I., Daum, P. H., Lee, Y.-N., Nunnermacker, L. J., Springston, S. R., Weinstein-Lloyd, J., and Rudolph, J.: Sensitivity of ozone production rate to ozone precursors, Geophys. Res. Lett., 28, 2903–2906, https://doi.org/10.1029/2000GL012597, 2001.
Kowalewski, M. G. and Janz, S. J.: Remote sensing capabilities of the GEO-CAPE airborne simulator, SPIE Conference Proceedings, San Diego, California, United States, 17–21 August 2014, Proc. SPIE, 92181I, https://doi.org/10.1117/12.2062058, 2014.
Krotkov, N. A., Lamsal, L. N., Marchenko, S. V.,Bucsela, E. J., Swartz, W. H., Joiner, J., and the OMI core team: OMI/Aura Nitrogen Dioxide (NO2) Total and Tropospheric Column 1-orbit L2 Swath 13x24 km V003, Goddard Earth Sciences Data and Information Services Center (GES DISC) [data set], Greenbelt, MD, USA, https://doi.org/10.5067/Aura/OMI/DATA2017, 2019.
Lamsal, L. N., Krotkov, N. A., Celarier, E. A., Swartz, W. H., Pickering, K. E., Bucsela, E. J., Gleason, J. F., Martin, R. V., Philip, S., Irie, H., Cede, A., Herman, J., Weinheimer, A., Szykman, J. J., and Knepp, T. N.: Evaluation of OMI operational standard NO2 column retrievals using in situ and surface-based NO2 observations, Atmos. Chem. Phys., 14, 11587–11609, https://doi.org/10.5194/acp-14-11587-2014, 2014.
Lamsal, L. N., Krotkov, N. A., Vasilkov, A., Marchenko, S., Qin, W., Yang, E.-S., Fasnacht, Z., Joiner, J., Choi, S., Haffner, D., Swartz, W. H., Fisher, B., and Bucsela, E.: Ozone Monitoring Instrument (OMI) Aura nitrogen dioxide standard product version 4.0 with improved surface and cloud treatments, Atmos. Meas. Tech., 14, 455–479, https://doi.org/10.5194/amt-14-455-2021, 2021.
Laughner, J. L., Zare, A., and Cohen, R. C.: Effects of daily meteorology on the interpretation of space-based remote sensing of NO2, Atmos. Chem. Phys., 16, 15247–15264, https://doi.org/10.5194/acp-16-15247-2016, 2016.
Laughner, J. L., Zhu, Q., and Cohen, R. C.: Evaluation of version 3.0B of the BEHR OMI NO2 product, Atmos. Meas. Tech., 12, 129–146, https://doi.org/10.5194/amt-12-129-2019, 2019.
Leitch, J. W., Delker, T., Good, W., Ruppert, L., Murcray, F., Chance, K., Liu, X., Nowlan, C., Janz, S. J., Krotkov, N. A., Pickering, K. E., Kowalewski, M., and Wang, J.: The GeoTASO airborne spectrometer project, in: Earth Observing Systems XIX, San Diego, California, United States, 17–21 August 2014, Proc. SPIE, 9218, 92181H–92181H–9, https://doi.org/10.1117/12.2063763, 2014.
Lelieveld, J. and Dentener, F. J.: What controls tropospheric ozone?, J. Geophys. Res., 105, 3531–3551, https://doi.org/10.1029/1999JD901011, 2000.
Levelt, P. F., van den Oord, G. H. J., Dobber, M. R., Dirksen, R. J., Malkki, A., Visser, H., de Vries, J., and Stammes, P.: The ozone monitoring instrument, IEEE T. Geosci. Remote, 44, 1093–1101, https://doi.org/10.1109/TGRS.2006.872333, 2006.
Liu, S., Valks, P., Pinardi, G., Xu, J., Chan, K. L., Argyrouli, A., Lutz, R., Beirle, S., Khorsandi, E., Baier, F., Huijnen, V., Bais, A., Donner, S., Dörner, S., Gratsea, M., Hendrick, F., Karagkiozidis, D., Lange, K., Piters, A. J. M., Remmers, J., Richter, A., Van Roozendael, M., Wagner, T., Wenig, M., and Loyola, D. G.: An improved TROPOMI tropospheric NO2 research product over Europe, Atmos. Meas. Tech., 14, 7297–7327, https://doi.org/10.5194/amt-14-7297-2021, 2021.
Liu, X., Mizzi, A. P., Anderson, J. L., Fung, I., and Cohen, R. C.: The potential for geostationary remote sensing of NO2 to improve weather prediction, Atmos. Chem. Phys., 21, 9573–9583, https://doi.org/10.5194/acp-21-9573-2021, 2021.
Lorente, A., Folkert Boersma, K., Yu, H., Dörner, S., Hilboll, A., Richter, A., Liu, M., Lamsal, L. N., Barkley, M., De Smedt, I., Van Roozendael, M., Wang, Y., Wagner, T., Beirle, S., Lin, J.-T., Krotkov, N., Stammes, P., Wang, P., Eskes, H. J., and Krol, M.: Structural uncertainty in air mass factor calculation for NO2 and HCHO satellite retrievals, Atmos. Meas. Tech., 10, 759–782, https://doi.org/10.5194/amt-10-759-2017, 2017.
Loyola, D. G., Gimeno García, S., Lutz, R., Argyrouli, A., Romahn, F., Spurr, R. J. D., Pedergnana, M., Doicu, A., Molina García, V., and Schüssler, O.: The operational cloud retrieval algorithms from TROPOMI on board Sentinel-5 Precursor, Atmos. Meas. Tech., 11, 409–427, https://doi.org/10.5194/amt-11-409-2018, 2018.
Lu, C. H. and Chang, J. S.: On the indicator-based approach to assess ozone sensitivities and emissions features, J. Geophys. Res., 103, 3453–3462, https://doi.org/10.1029/97JD03128, 1998.
Martin, R. V., Chance, K., Jacob, D. J., Kurosu, T. P., Spurr, R. J. D., Bucsela, E., Gleason, J. F., Palmer, P. I., Bey, I., Fiore, A. M., Li, Q., Yantosca, R. M., and Koelemeijer, R. B. A.: An improved retrieval of tropospheric nitrogen dioxide from GOME, J. Geophys. Res.-Atmos., 107, ACH 9-1–ACH 9-21, https://doi.org/10.1029/2001JD001027, 2002.
Martin, R. V., Fiore, A. M., and Donkelaar, A. V.: Spase-based diagnosis of surface ozone sensitivity to anthropogenic emissions, Geophys. Res. Lett., 31, L06120, https://doi.org/10.1029/2004GL019416, 2004.
McLinden, C. A., Fioletov, V., Boersma, K. F., Krotkov, N., Sioris, C. E., Veefkind, J. P., and Yang, K.: Air quality over the Canadian oil sands: A first assessment using satellite observations, Geophys. Res. Lett., 39, L04804, https://doi.org/10.1029/2011GL050273, 2012.
Nowlan, C. R., Liu, X., Leitch, J. W., Chance, K., González Abad, G., Liu, C., Zoogman, P., Cole, J., Delker, T., Good, W., Murcray, F., Ruppert, L., Soo, D., Follette-Cook, M. B., Janz, S. J., Kowalewski, M. G., Loughner, C. P., Pickering, K. E., Herman, J. R., Beaver, M. R., Long, R. W., Szykman, J. J., Judd, L. M., Kelley, P., Luke, W. T., Ren, X., and Al-Saadi, J. A.: Nitrogen dioxide observations from the Geostationary Trace gas and Aerosol Sensor Optimization (GeoTASO) airborne instrument: Retrieval algorithm and measurements during DISCOVER-AQ Texas 2013, Atmos. Meas. Tech., 9, 2647–2668, https://doi.org/10.5194/amt-9-2647-2016, 2016.
Nowlan, C. R., Liu, X., Janz, S. J., Kowalewski, M. G., Chance, K., Follette-Cook, M. B., Fried, A., González Abad, G., Herman, J. R., Judd, L. M., Kwon, H.-A., Loughner, C. P., Pickering, K. E., Richter, D., Spinei, E., Walega, J., Weibring, P., and Weinheimer, A. J.: Nitrogen dioxide and formaldehyde measurements from the GEOstationary Coastal and Air Pollution Events (GEO-CAPE) Airborne Simulator over Houston, Texas, Atmos. Meas. Tech., 11, 5941–5964, https://doi.org/10.5194/amt-11-5941-2018, 2018.
Palmer, P. I., Jacob, D. J., Fiore, A. M., and Martin, R. V., Air mass factor formulation for spectroscopic measurements from satellites: Application to formaldehyde retrievals from the Global Ozone Monitoring Experiment, J. Geophys. Res., 106, 14539–514550, https://doi.org/10.1029/2000JD900772, 2001.
Qin, W., Fasnacht, Z., Haffner, D., Vasilkov, A., Joiner, J., Krotkov, N., Fisher, B., and Spurr, R.: A geometry-dependent surface Lambertian-equivalent reflectivity product for UV–Vis retrievals – Part 1: Evaluation over land surfaces using measurements from OMI at 466 nm, Atmos. Meas. Tech., 12, 3997–4017, https://doi.org/10.5194/amt-12-3997-2019, 2019.
Riess, T. C. V. W., Boersma, K. F., van Vliet, J., Peters, W., Sneep, M., Eskes, H., and van Geffen, J.: Improved monitoring of shipping NO2 with TROPOMI: decreasing NOx emissions in European seas during the COVID-19 pandemic, Atmos. Meas. Tech., 15, 1415–1438, https://doi.org/10.5194/amt-15-1415-2022, 2022.
Ren, J., Guo, F., and Xie, S.: Diagnosing ozone–NOx–VOC sensitivity and revealing causes of ozone increases in China based on 2013–2021 satellite retrievals, Atmos. Chem. Phys., 22, 15035–15047, https://doi.org/10.5194/acp-22-15035-2022, 2022.
Schroeder, J. R., Crawford, J. H., Fried, A., Walega, J., Weinheimer, A., Wisthaler, A., Wisthaler, A., Muller, M., Mikoviny, T., Chen, G., Shook, M., Blake, D., and Tonesen, G. S.: New insights into the column ratio as an indicator of near-surface ozone sensitivity, J. Geophys. Res.-Atmos., 122, 8885–8907, https://doi.org/10.1002/2017JD026781, 2017.
Schenkeveld, V. M. E., Jaross, G., Marchenko, S., Haffner, D., Kleipool, Q. L., Rozemeijer, N. C., Veefkind, J. P., and Levelt, P. F.: In-flight performance of the Ozone Monitoring Instrument, Atmos. Meas. Tech., 10, 1957–1986, https://doi.org/10.5194/amt-10-1957-2017, 2017.
Sillman, S.: The relation between ozone, NOx and hydrocarbons in urban and polluted rural environments, Atmos. Environ., 33, 1821–1845, 1999.
Silvern, R. F., Jacob, D. J., Mickley, L. J., Sulprizio, M. P., Travis, K. R., Marais, E. A., Cohen, R. C., Laughner, J. L., Choi, S., Joiner, J., and Lamsal, L. N.: Using satellite observations of tropospheric NO2 columns to infer long-term trends in US NOx emissions: the importance of accounting for the free tropospheric NO2 background, Atmos. Chem. Phys., 19, 8863–8878, https://doi.org/10.5194/acp-19-8863-2019, 2019.
Souri, A. H.: Characterization of Errors in Satellite-based HCHO/NO2, Tropospheric Column Ratios with Respect to Chemistry, Column to PBL Translation, Spatial Representation, and Retrieval Uncertainties, GitHub [code], https://github.com/ahsouri/STREET, 2022 (last access: 31 January 2023).
Souri, A. H., Choi, Y., Jeon, W., Li, X., Pan, S., Diao, L. and Westenbarger, D. A.: Constraining NOx emissions using satellite NO2 measurements during 2013 DISCOVER-AQ Texas campaign, Atmos. Environ., 131, 371–381, https://doi.org/10.1016/j.atmosenv.2016.02.020, 2016.
Souri, A. H., Choi, Y., Jeon, W., Woo, J.-H., Zhang, Q., and Kurokawa, J.-i.: Remote sensing evidence of decadal changes in major tropospheric ozone precursors over East Asia, J. Geophys. Res., 122, 2474–2492, https://doi.org/10.1002/2016JD025663, 2017.
Souri, A. H., Nowlan, C. R., Wolfe, G. M., Lamsal, L. N., Chan Miller, C. E., Abad, G. G., Janz, S. J., Fried, A., Blake, D. R., Weinheimer, A. J., Diskin, G. S., Liu, X., and Chance, K.: Revisiting the effectiveness of ratios for inferring ozone sensitivity to its precursors using high resolution airborne remote sensing observations in a high ozone episode during the KORUS-AQ campaign, Atmos. Environ., 224, 117341, https://doi.org/10.1016/j.atmosenv.2020.117341, 2020.
Souri, A. H., Chance, K., Bak, J., Nowlan, C. R., González Abad, G., Jung, Y., Wong, D. C., Mao, J., and Liu, X.: Unraveling pathways of elevated ozone induced by the 2020 lockdown in Europe by an observationally constrained regional model using TROPOMI, Atmos. Chem. Phys., 21, 18227–18245, https://doi.org/10.5194/acp-21-18227-2021, 2021.
Souri, A. H., Chance, K., Sun, K., Liu, X., and Johnson, M. S.: Dealing with spatial heterogeneity in pointwise-to-gridded- data comparisons, Atmos. Meas. Tech., 15, 41–59, https://doi.org/10.5194/amt-15-41-2022, 2022.
Souri, A. H., Johnson, M. S., Wolfe, G. M., Crawford, J. H., Fried, A., Wisthaler, A., Brune, W. H., Blake, D. R., Weinheimer, A. J., Verhoelst, T., Compernolle, S., Pinardi, G., Vigouroux, C., Langerock, B., Choi, S., Lamsal, L., Zhu, L., Sun, S., Cohen, R. C., Min, K.-E., Cho, C., Philip, S., Liu, X., and Chance, K.: Characterization of errors in satellite-based HCHO NO2 tropospheric column ratios with respect to chemistry, column-to-PBL translation, spatial representation, and retrieval uncertainties, Atmos. Chem. Phys., 23, 1963–1986, https://doi.org/10.5194/acp-23-1963-2023, 2023.
Tack, F., Merlaud, A., Iordache, M.-D., Pinardi, G., Dimitropoulou, E., Eskes, H., Bomans, B., Veefkind, P., and Van Roozendael, M.: Assessment of the TROPOMI tropospheric NO2 product based on airborne APEX observations, Atmos. Meas. Tech., 14, 615–646, https://doi.org/10.5194/amt-14-615-2021, 2021.
Tonnesen, G. S. and Dennis, R. L.: Analysis of radical propagation efficiency to assess ozone sensitivity to hydrocarbons and NOx 2. Long-lived species as indicators of ozone concentration sensitivity, J. Geophys. Res., 105, 9227–9241, 2000.
US EPA (U.S. Environmental Protection Agency): National Ambient Air Quality Standards for Ozone - Final Rule, Federal Register, 80, 65292–65468, https://www.gpo.gov/fdsys/pkg/FR-2015-10-26/pdf/2015-26594.pdf (last access: 24 May 2022), 2015.
Van Dingenen, R., Dentener, F. J., Raes, F., Krol, M. C., Emberson, L., and Cofala, J.: The global impact of ozone on agricultural crop yields under current and future air quality legislation, Atmos. Environ., 43, 604–618, https://doi.org/10.1016/j.atmosenv.2008.10.033, 2009.
van Geffen, J., Boersma, K. F., Eskes, H., Sneep, M., ter Linden, M., Zara, M., and Veefkind, J. P.: S5P TROPOMI NO2 slant column retrieval: method, stability, uncertainties and comparisons with OMI, Atmos. Meas. Tech., 13, 1315–1335, https://doi.org/10.5194/amt-13-1315-2020, 2020.
van Geffen, J., Eskes, H., Compernolle, S., Pinardi, G., Verhoelst, T., Lambert, J.-C., Sneep, M., ter Linden, M., Ludewig, A., Boersma, K. F., and Veefkind, J. P.: Sentinel-5P TROPOMI NO2 retrieval: impact of version v2.2 improvements and comparisons with OMI and ground-based data, Atmos. Meas. Tech., 15, 2037–2060, https://doi.org/10.5194/amt-15-2037-2022, 2022.
Vasilkov, A., Qin, W., Krotkov, N., Lamsal, L., Spurr, R., Haffner, D., Joiner, J., Yang, E.-S., and Marchenko, S.: Accounting for the effects of surface BRDF on satellite cloud and trace-gas retrievals: a new approach based on geometry-dependent Lambertian equivalent reflectivity applied to OMI algorithms, Atmos. Meas. Tech., 10, 333–349, https://doi.org/10.5194/amt-10-333-2017, 2017.
Vasilkov, A., Yang, E.-S., Marchenko, S., Qin, W., Lamsal, L., Joiner, J., Krotkov, N., Haffner, D., Bhartia, P. K., and Spurr, R.: A cloud algorithm based on the O2–O2 477 nm absorption band featuring an advanced spectral fitting method and the use of surface geometry-dependent Lambertian-equivalent reflectivity, Atmos. Meas. Tech., 11, 4093–4107, https://doi.org/10.5194/amt-11-4093-2018, 2018.
Veefkind, J. P., de Haan, J. F., Sneep, M., and Levelt, P. F.: Improvements to the OMI O2–O2 operational cloud algorithm and comparisons with ground-based radar–lidar observations, Atmos. Meas. Tech., 9, 6035–6049, https://doi.org/10.5194/amt-9-6035-2016, 2016.
Verhoelst, T., Compernolle, S., Pinardi, G., Lambert, J.-C., Eskes, H. J., Eichmann, K.-U., Fjæraa, A. M., Granville, J., Niemeijer, S., Cede, A., Tiefengraber, M., Hendrick, F., Pazmiño, A., Bais, A., Bazureau, A., Boersma, K. F., Bognar, K., Dehn, A., Donner, S., Elokhov, A., Gebetsberger, M., Goutail, F., Grutter de la Mora, M., Gruzdev, A., Gratsea, M., Hansen, G. H., Irie, H., Jepsen, N., Kanaya, Y., Karagkiozidis, D., Kivi, R., Kreher, K., Levelt, P. F., Liu, C., Müller, M., Navarro Comas, M., Piters, A. J. M., Pommereau, J.-P., Portafaix, T., Prados-Roman, C., Puentedura, O., Querel, R., Remmers, J., Richter, A., Rimmer, J., Rivera Cárdenas, C., Saavedra de Miguel, L., Sinyakov, V. P., Stremme, W., Strong, K., Van Roozendael, M., Veefkind, J. P., Wagner, T., Wittrock, F., Yela González, M., and Zehner, C.: Ground-based validation of the Copernicus Sentinel-5P TROPOMI NO2 measurements with the NDACC ZSL-DOAS, MAX-DOAS and Pandonia global networks, Atmos. Meas. Tech., 14, 481–510, https://doi.org/10.5194/amt-14-481-2021, 2021.
Vigouroux, C., Langerock, B., Bauer Aquino, C. A., Blumenstock, T., Cheng, Z., De Mazière, M., De Smedt, I., Grutter, M., Hannigan, J. W., Jones, N., Kivi, R., Loyola, D., Lutsch, E., Mahieu, E., Makarova, M., Metzger, J.-M., Morino, I., Murata, I., Nagahama, T., Notholt, J., Ortega, I., Palm, M., Pinardi, G., Röhling, A., Smale, D., Stremme, W., Strong, K., Sussmann, R., Té, Y., van Roozendael, M., Wang, P., and Winkler, H.: TROPOMI–Sentinel-5 Precursor formaldehyde validation using an extensive network of ground-based Fourier-transform infrared stations, Atmos. Meas. Tech., 13, 3751–3767, https://doi.org/10.5194/amt-13-3751-2020, 2020.
Wu, S., Lee, H. J., Anderson, A., Liu, S., Kuwayama, T., Seinfeld, J. H., and Kleeman, M. J.: Direct measurements of ozone response to emissions perturbations in California, Atmos. Chem. Phys., 22, 4929–4949, https://doi.org/10.5194/acp-22-4929-2022, 2022.
Zara, M., Boersma, K. F., De Smedt, I., Richter, A., Peters, E., van Geffen, J. H. G. M., Beirle, S., Wagner, T., Van Roozendael, M., Marchenko, S., Lamsal, L. N., and Eskes, H. J.: Improved slant column density retrieval of nitrogen dioxide and formaldehyde for OMI and GOME-2A from QA4ECV: intercomparison, uncertainty characterisation, and trends, Atmos. Meas. Tech., 11, 4033–4058, https://doi.org/10.5194/amt-11-4033-2018, 2018.
Zhao, X., Griffin, D., Fioletov, V., McLinden, C., Cede, A., Tiefengraber, M., Müller, M., Bognar, K., Strong, K., Boersma, F., Eskes, H., Davies, J., Ogyu, A., and Lee, S. C.: Assessment of the quality of TROPOMI high-spatial-resolution NO2 data products in the Greater Toronto Area, Atmos. Meas. Tech., 13, 2131–2159, https://doi.org/10.5194/amt-13-2131-2020, 2020.
Zhu, L., González Abad, G., Nowlan, C. R., Chan Miller, C., Chance, K., Apel, E. C., DiGangi, J. P., Fried, A., Hanisco, T. F., Hornbrook, R. S., Hu, L., Kaiser, J., Keutsch, F. N., Permar, W., St. Clair, J. M., and Wolfe, G. M.: Validation of satellite formaldehyde (HCHO) retrievals using observations from 12 aircraft campaigns, Atmos. Chem. Phys., 20, 12329–12345, https://doi.org/10.5194/acp-20-12329-2020, 2020.
Zoogman, P., Liu, X., Suleiman, R., M., Pennington,W. F., Flittner, D. E., Al-Saadi, J. A., Hilton, B. B., Nicks, D. K., Newchurch, M. J., Carr, J. L., Janz, S. J., Andraschko, M. R., Arola, A., Baker, B. D., Canova, B. P., Chan Miller, C., Cohen, R. C., Davis, J. E., Dussault, M. E., Edwards, D. P., Fishman, J., Ghulam, A., González Abad, G., Grutter, M., Herman, J. R., Houck, J., Jacob, D. J., Joiner, J., Kerridge, B. J., Kim, J., Krotkov, N. A., Lamsal, L., Li, C., Lindfors, A., Martin, R. V., McElroy, C. T., McLinden, C., Natraj, V., Neil, D. O., Nowlan, C. R., O'Sullivan, E. J., Palmer, P. I., Pierce, R. B., Pippin, M. R., Saiz-Lopez, A., Spurr, R. J. D., Szykman, J. J., Torres, O., Veefkind, J. P., Veihelmann, B., Wang, H., Wang, J., and Chance, K.: Tropospheric emissions: Monitoring of pollution (TEMPO), J. Quant. Spectrosc. Ra., 186, 17–39, https://doi.org/10.1016/j.jqsrt.2016.05.008, 2017.