the Creative Commons Attribution 4.0 License.
the Creative Commons Attribution 4.0 License.
 | 26 May 2023
Assessment of severe aerosol events from NASA MODIS and VIIRS aerosol products for data assimilation and climate continuity
Amanda Gumber
Jeffrey S. Reid
Robert E. Holz
Thomas F. Eck
N. Christina Hsu
Robert C. Levy
Jianglong Zhang
Paolo Veglio
While the use and data assimilation (DA) of operational Moderate Resolution Imaging Spectroradiometer (MODIS) aerosol data is commonplace, MODIS is scheduled to sunset in the next year. For data continuity, focus has turned to the development of next-generation aerosol products and sensors such as those associated with the Visible Infrared Imaging Radiometer Suite (VIIRS) on Suomi NPOESS Preparation Project (S-NPP) and NOAA-20. Like MODIS algorithms, products from these sensors require their own set of extensive error characterization and correction exercises. This is particularly true in the context of monitoring significant aerosol events that tax an algorithm's ability to separate cloud from aerosol and account for multiple scattering related errors exacerbated by uncertainties in aerosol optical properties. To investigate the performance of polar-orbiting satellite algorithms to monitor and characterize significant events, a level 3 (L3) product has been developed using a consistent aggregation methodology for 4 years of observations (2016–2019) that is referred to as the SSEC/NRL L3 product. Included in this product are the AErosol RObotic NETwork (AERONET), MODIS Dark Target, Deep Blue, and Multi-Angle Implementation of Atmospheric Correction (MAIAC) algorithms. These MODIS “baseline algorithms” are compared to NASA's recently released NASA Deep Blue algorithm for use with VIIRS. Using this new dataset, the relative performance of the algorithms for both land and ocean were investigated with a focus on the relative skill of detecting severe events and accuracy of the retrievals using AERONET. Maps of higher-percentile aerosol optical depth (AOD) regions of the world by product identified those with the highest measured AODs and determined what is high by local standards. While patterns in AOD match across products and median to moderate AOD values match well, there are regionally correlated biases between products based on sampling, algorithm differences, and AOD range – in particular for higher AOD events. Most notable are differences in boreal biomass burning and Saharan dust. Significant percentile biases must be accounted for when data are used in trend studies, data assimilation, or inverse modeling. These biases vary by aerosol regime and are likely due to retrieval assumptions in lower boundary conditions and aerosol optical models.
- Article
(26594 KB) - Full-text XML
-
Supplement
(1766 KB) - BibTeX
- EndNote


Monitoring the aerosol system is an integral part of many applications, such as air quality, human health, climate monitoring, and visibility impairment. Passive imager observations, from polar-orbiting sun-synchronous satellites, have allowed researchers to monitor global aerosol for decades. With once-a-day or better coverage over most areas of the globe, these satellite sensors have helped to characterize overall aerosol climatology but also to detect significant events of dust, smoke, and pollution. From such data, research frequently maps regional impacts and estimate emissions. More recently, the incorporation of satellite aerosol data into data assimilation (DA) systems has worked to systematize inverse estimations of emissions, improve aerosol forecasting, and open numerous new climate applications (2D-Var – Zhang et al., 2008; 3D-Var – Randles et al., 2017; 4D-Var – Benedetti et al., 2009; ensemble Kalman filter – Schutgens et al., 2010; Khade et al., 2012; Pagowski and Grell, 2012; Rubin et al., 2016, 2017; hybrid – Schwartz et al., 2014). Model reanalyses that depend heavily on consistent and well-characterized satellite datasets in their assimilation and evaluation cycles are used by the community to establish trends and estimate emissions (Lynch et al., 2016; Randles et al., 2017; Yumimoto et al., 2017; Inness et al., 2019). Yet, although satellite data are continuing to improve, bias and uncertainty remain due to instrument calibration and retrieval method shortcomings (Zhang and Reid, 2006, 2010; Shi et al., 2011; Sayer et al., 2013; Levy et al., 2018). This is especially true for observing and quantifying severe events, which is the focus of this paper. Indeed, the transition from the Terra and A-Train sensors to the Joint Polar Satellite System is happening just as significant climate change events such as wildfires are on the rise (Bondur et al., 2020; Coogan et al., 2020; Zhang et al., 2020).
In addition to simple stochastic errors, satellite products show strong and spatially correlated errors that systematically vary with aerosol optical depth (AOD), composition, and lower boundary conditions (e.g., non-aerosol surface reflectance, molecular scatterings and absorptions, clouds; Shi et al., 2011). Both inverse modeling and data assimilation (DA) systems are sensitive to observational errors, thus requiring significant quality-assurance corrections and careful filtering of the satellite data (Zhang et al., 2008; Hyer et al., 2011).
Examples of satellite-derived datasets used for DA or inverse modeling include aerosol retrievals from the Moderate Resolution Imaging Spectroradiometer (MODIS, on Terra and Aqua (Sessions et al., 2015; Xian et al., 2019) and more recently from the Visible Infrared Imaging Radiometer Suite (VIIRS) on the Suomi-National Polar-orbiting Operational Environmental Satellite System Preparation Project (S-NPP) and JPSS-1 (now known as NOAA-20) satellites. While other satellite products have been used in data assimilation, including the Cloud-Aerosol Lidar with Orthogonal Polarization (CALIOP) and Multi Angle Imaging Spectroradiometer (MISR) (Sekiyama et al., 2010; Zhang et al., 2011; Lynch et al., 2016), product lines associated with MODIS and VIIRS see the most usage due to their coverage, accessibility, delivery speed, and high level of characterization (see requirements outlined in Zhang et al., 2014; Benedetti et al., 2018). Given the imminent transition from MODIS- to VIIRS-based global observations, the focus is on their derived products of total aerosol optical depth (AOD).
Since quality-assured data are needed for aerosol DA, it is important to identify and characterize biases and uncertainties for products from specific instruments and retrieval algorithms. In addition, for “severe aerosol events”, which occur relatively infrequently and may be defined differently based on application and location, one must be extremely careful in assessing uncertainties. In other words, characterizing outlier uncertainty may be an entirely different exercise than characterizing bulk uncertainty.
The operational MODIS- and VIIRS-derived AOD datasets are intended to represent aerosol conditions in clear-sky (non-cloudy) conditions and over land and ocean surfaces that are free of ice and snow, glint, and underwater sediments. Therefore, their bulk uncertainty is related to (1) estimation of the lower boundary condition (e.g., surface reflectance plus Rayleigh/molecular scattering and absorption); (2) assumption of an aerosol model (e.g., physical and optical properties) that is sufficiently representative of the aerosol in the scene; and (3) masking of clouds, ice/snow, and other retrieval “obstacles”. For the lowest AOD conditions, it is relatively easy to separate aerosols from clouds and the choice of aerosol model is relatively unimportant. Therefore, for low AOD, aerosol retrieval uncertainties are dominated by uncertainties in the surface boundary condition. As AOD increases, choice of aerosol model becomes more important, as errors in assumed single scattering albedo (SSA), size or shape distributions, and interactions of multiple scattering lead to increased error (Shi et al., 2019). At even larger AODs, opaque aerosol begins to look like clouds or other retrieval obstacles. In fact, for the largest (extreme) AODs, the algorithm may mask these scenes entirely, leading to no retrieval at all.
A challenge facing satellite aerosol data product development is that there is no fundamental spatially contiguous dataset to provide validation; everything is typically inferred from point measurements. While field experiments often provide a high frequency of observation over a small area, most of the validation relies on using ground-based measurements from the AErosol RObotic NETwork (AERONET; Holben et al., 1998). AERONET consists of globally distributed sun photometers capable of providing near-real-time AOD. Size and absorption data have become the validation standard throughout the satellite aerosol community to benchmark products and identifying biases (Zhang and Reid, 2006; Hyer et al., 2011; Shi et al., 2011; Sayer et al., 2013, 2018). AERONET measurements are also incorporated into aerosol forecasting models despite the limited amount of spatial coverage they have (Schutegens et al., 2010; Randles et al., 2017; Rubin et al., 2017).
While providing a global benchmark dataset with numerous sites, using AERONET to investigate severe aerosol events is limited due to the inherent sparse nature of AERONET coverage where AERONET rightly observes low AOD, but nearby thick aerosol plume features exist (or vice versa – AERONET manages to sample an extremely localized plume). AERONET provides an overall strict cloud screening, meaning that satellite co-locations with such ground-based data are essentially doubly cloud-screened, leading to an underestimate of satellite retrieval uncertainty. Nevertheless, while cloud screening has been vastly improved, AERONET version 3 level 2 products can still screen out haze conditions (Eck et al., 2018). For the very highest AOD conditions, the solar disk can be so attenuated that mid-visible AOD measurements are no longer possible. Regardless, with these caveats and performing the work in proper context, AERONET is still the most reliable instrument for providing verification if placed in the proper context, especially over larger scales.
This is the first report of several studies that investigate the nature and trend in severe aerosol events in remote sensing data and modeling simulations. The first task is to answer the question of what constitutes a severe aerosol event. That is, what is the measured median AOD versus 84th, 95th, or 98th percentile events over the globe? In this article, a baseline of the global distribution of higher-percentile AOD retrievals from NASA's polar orbiting MODIS and VIIRS aerosol products is developed, and the resulting probability distributions and biases are examined. The MODIS and VIIRS instruments are the basis for the multi-decadal NASA aerosol climate data records and are the most applied products used for model evaluation and DA. Also of interest is comparison of the product performance as the community transitions of the EOS MODIS to the JPSS VIIRS era and what this implies for monitoring trends in significant events in association with climate change. The focus is on the bulk relative probability distributions of high AOD events and pairwise relationships between products. However, since the most severe aerosol events occur near their terrestrial sources over land, statistics are developed that define severe events locally.
While many aerosol product evaluation studies have been conducted (Remer et al., 2008; Levy et al., 2010; Hyer et al., 2011; Sayer et al., 2013; Li et al., 2014; Bilal et al., 2018; Lyapustin et al., 2018; Wei et al., 2019; Reid et al., 2022), this study deviates in that it does not strictly compare products against AERONET, or even between each other, but rather it is an assessment of differences in the probability distribution functions of AOD with a focus on the relative differences between the aerosol retrieval algorithms. Section 2 describes each of the satellite data products and the ground-based AERONET observation used in the SSEC/NRL L3 product. Section 3 describes the methods used to aggregate the data and the data analysis used throughout. Section 4 provides both a global overview of the satellite datasets describing the aerosol probability distribution functions (PDFs) and characterizing the nature of severe events. Section 5 identifies and investigates regions associated with high aerosol loading using satellite datasets and using AERONET data to provide a quantitative assessment of the retrieval biases of severe events. The discussion and conclusions of this study are resolved in Sect. 6.
The datasets in this study use AOD values at 0.55 mm (AOD550). Here a 4-year time span is used from 2016–2019 to create a L3 product called the SSEC/NRL L3 product gridded at using a consistent aggregation method similar to commonly applied DA products. From each dataset the highest quality-assurance flag available is used to approximate the quality of assimilation-grade data without additional filtering. By using the highest-quality retrievals, the amount of AOD pixels is reduced by approximately 55 %, 52 %, and 51 % for VIIRS AERDB, MODIS DT and DB, and MODIS MAIAC.
2.1 AERONET
The federated AErosol RObotic NETwork (AERONET; Holben et al., 1998) network of Cimel sun-sky radiometers is the primary basis set for evaluating satellite products. The nature of these data is discussed in detail in Giles et al. (2019). The spectral AOD measured by direct sun observations in AERONET are highly accurate, with level 2 data uncertainties for overhead sun ranging from ∼0.01 in the visible and near-infrared to ∼0.02 in the UV (Eck et al., 1999). AOD uncertainties in level 1.5 data that do not have the final calibration applied are on average an additional ∼0.01 higher at 500 nm at midday and mid-deployment (assuming a 1–2-year deployment interval), and therefore exhibit an average uncertainty of ∼0.02 at 500 nm (Giles et al., 2019; Fig. 20). Over the 4-year time span, 261 255 AERONET AOD observations are collected from 102 to 231 sites each day. To match typical DA cycles, all AERONET data are sampled globally and averaged at a 6 h time interval for each file. While this study uses version 3 level 1.5 AOD data, it is noteworthy that these products now share the same cloud screening criterion as level 2 and products are regularly updated to final calibrations as instruments are recalibrated. Thus, they are much more similar to level 2 than in the past. Since AERONET sun photometers do not observe AOD at the 550 nm wavelength, the Spectral Deconvolution Algorithm (SDA) is applied to the five 380, 440, 500, 675, and 870 nm channels to derive AOD550 (O'Neill et al., 2003, 2008; Kaku et al., 2014). SDA is also used in the analysis to separate fine- and coarse-mode AODs from AERONET. Under very high AOD conditions the AOD cannot be measured since the high value limit of sun photometry in measuring AOD is , where m is the optical air mass or path length through the atmosphere (Eck et al., 2019; Giles et al., 2019).
2.2 Satellite products
This study focuses on the transition and consistency of Terra- and Aqua-based MODIS to S-NPP and JPSS VIIRS products with the data quality assessed in the context for data assimilation. The polar orbiting sun-synchronous morning Terra and afternoon Aqua satellites were launched in 1999 and 2002, respectively. Since both Aqua and S-NPP are both in afternoon orbit, this study only focuses on Aqua-MODIS.
For MODIS, this study examines products from three of NASA's aerosol retrieval algorithms. Two of them, known as Dark Target (DT) and Deep Blue (DB), are contained together in a product known as MYD04. DT retrieves aerosols over ocean and vegetated (dark) land, whereas DB retrieves over vegetated and barren (brighter) surfaces. Although derived separately, DT and DB are also combined into a joint product within the MYD04 and that DT/DB product is used in this study. It is important to note that both DT and DB are performing instantaneous single-view granule-based retrievals, meaning that there is no information used from previous or subsequent granules. Collection 6.1 is used in this study. On the other hand, the Multi-Angle Implementation of Atmospheric Correction (MAIAC) utilizes multiple overpasses to derive a higher-resolution 1 km product with simultaneous AOD and land surface products. MAIAC products are contained in a product known as MCD19, and they are derived using combinations of MODIS observations from both Terra and Aqua. The product can be separated by satellite, so only Aqua is used in this study. The latest version of MCD19 is known as Collection 6.
For VIIRS, a product known as AERDB is examined, which follows the heritage of DB on MODIS. Unlike on MODIS, where DB is performed over land only, DB also uses an algorithm known as Satellite Ocean Aerosol Retrieval (SOAR) to retrieve over ocean. This study uses version 1.0 of the AERDB product. Note that now there is now an available version of DT on VIIRS (known as AERDT; Sawyer et al., 2020), but this was not yet operational at the commencement of this study.
All products include an estimation of total AOD at 0.55 µm (AOD550) as well as spectral AOD at selected wavelength bands. Given this is a study of severe aerosol events, it is important to note the maximum AOD values produced by each algorithm. The DT and DB algorithms have a maximum AOD of 5. MAIAC has a maximum AOD value of 4.
2.2.1 MODIS combined Dark Target Deep Blue
The MODIS Dark Target (DT) algorithm is the heritage aerosol algorithm used for global aerosol monitoring. DT generates AOD550 products over visually dark surfaces such as vegetated land and ocean regions using two separate algorithms (Kaufman et al., 1997; Levy et al., 2013). Retrievals are based on the aggregates of N×N worth of native-resolution pixels, where the N equals 40, 20, or 10 depending on the native resolution, resulting in nadir retrieval sizes ranging from 10×10 km (at nadir) to km (edge of swath). Numerous studies have evaluated DT's performance from inception of collection 3.1 until its current version of collection 6.1 with evaluations provided in Levy et al. (2013), Sayer et al. (2013, 2017), and Wei et al. (2019). Collection 6.1 has significantly removed many of the previous deficiencies, such as insufficient cloud screening, better aerosol–cloud discrimination, and improvements in constraining the lower boundary condition.
A limitation of the DT algorithm is its inability to retrieve AOD over bright desert surfaces due to the loss of contrast to isolate the aerosol signal in visible bands. The MODIS Deep Blue (DB) algorithm was initially developed to better retrieve AOD550 over bright desert surfaces, taking advantage of the fact that iron in sand and soil absorbs blue light and thus reduces the surface albedo. In other words, deserts appear “dark” at blue and deep blue (e.g., 0.41 µm) wavelengths to provide sufficient contrast for aerosol retrieval. Since vegetation also appears dark in deep blue wavelengths, the DB algorithm has been subsequently expanded to also include vegetated surfaces. Like DT, the MODIS DB algorithm is only performed over snow-free and cloud-cleared land pixels; however, it instead uses top-of-atmosphere reflectance at 650, 470, and 412 nm to determine spectral AOD550 (Hsu et al., 2004, 2013) by matching to lookup tables. Also, like DT, the DB product for MODIS is provided at a nadir spatial resolution of 10×10 km and edge of swath 50×30 km. Collection 6.1 contains improvements for heavy smoke detection, heterogeneous terrain, elevated surface types, and changes within aerosol optical models (Sayer et al., 2019).
Given the different use cases of the DT and DB algorithms, the MODIS combined product provides a retrieval-by-retrieval selection from both algorithms to form a merged dataset that is recommended for general use by both the DT and DB development teams. Selection is based on the underlying surface's monthly averaged normalized difference vegetation index (NDVI) value gleaned from a separate MODIS product (Levy et al., 2013). So, just as there have traditionally been over-ocean and over-land retrievals, the current paradigm is to likewise have land retrievals separated by lower boundary condition with future releases even able to retrieve over snow and ice. Using the combined Dark Target and Deep Blue product increases spatial coverage, especially over deserts and low-vegetation regions. This combined DT and DB methodology is most comparable to the Deep Blue retrieval applied to VIIRS (see below) and thus is the focus of this analysis.
2.2.2 MAIAC
The MODIS Multi-Angle Implementation of Atmospheric Correction (MAIAC) product uses time series analysis and a combination of image-based and pixel–base processing (Lyapustin et al., 2011, 2018). MAIAC grids MODIS L1B data to a 1 km resolution and creates a 16 d time series using a sliding window technique in order to obtain multiple viewing angles to capture the surface bidirectional reflectance distribution function (BRDF). This time series analysis separates slowly varying lower boundary conditions from more rapid atmospheric conditions to provide a 1×1 km product projected onto a sinusoidal grid. While MAIAC is generated for overland pixels, it also captures coastal waters and major island areas. The highest quality assurance of the product only retrieves AOD over land and land-containing regions.
There have been several regional evaluation studies of the MAIAC algorithm (Martins et al., 2017; Superczynski et al., 2017; Chen et al., 2021). However, to our knowledge this is first multiyear global analysis.
2.2.3 VIIRS NASA Deep Blue
VIIRS on S-NPP and NOAA-20 has 22 spectral bands ranging from 0.412 to 12.01 µm. While both MODIS and VIIRS have a fixed field of view (FOV), VIIRS data are aggregated on board to provide a more consistent spatial resolution across the swath with a nominal surface footprint of 750 m for the moderate-resolution (M) band channels that are used by the algorithms (Sayer et al., 2017). The sensor has a swath width of 3060 km, allowing for complete global coverage over a day, including at the Equator where MODIS has gaps. A version of the Deep Blue algorithm that produces aerosol AOD and their properties at a nadir spatial resolution of 6×6 km for both dark scenes and bright land surfaces was selected by NASA as the primary Earth system data record (ESDR) for VIIRS. Over land, Deep Blue draws its heritage from the MODIS-based Deep Blue product of Hsu et al. (2013, 2019), while over water the product uses the Satellite Ocean Aerosol Retrieval (SOAR; Sayer et al., 2017, 2018). SOAR has heritage based on SeaWiFS aerosol products and uses a traditional least-squares fit of multiple channels to retrieve AOD550 (Sayer et al., 2010). There are two primary aerosol products produced for VIIRS by both NASA and NOAA, but this study only uses the NASA product.
3.1 L3 data integration through YORI
For the purposes of global model applications, data are aggregated and regridded to resolution suitable for most global aerosol data assimilation applications using a python toolkit developed by the UW A-SIPS called Yori that provides a consistent framework to integrate multiple products into a gridded dataset known as level 3 (L3). Yori provides easy integration of new datasets from both satellite and ground-based observations, allowing for custom filtering and masks and multi-dimensional histograms for each grid cell. Currently, Yori is used for the L3 cloud products for VIIRS and is being integrated into the MODIS processing for Collection 7 to generate the L3 cloud and aerosol MYD08 products. That is, the regrading tool used in this study is the same one used operationally at NASA for its operational aerosol products. The products for this analysis are gridded at every 6 h to match the standard output of the global aerosol models. The creation of this SSEC/NRL L3 product differs from other operational L3 products because of the use of a consistent aggregation method and the options for filtering and masking that Yori provides.
Figure 1a provides a map of AERONET sites used in this analysis and the subdomains for more in-depth discussion. Figure 1b, c, and d provide maps of the number of aggregated data points for MODIS Aqua DT/DB, MAIAC, and VIIRS, respectively, generated over the 2016–2019 study period. Clearly, there are significantly different numbers of samples by a product for any given region, largely dictated by cloud cover and for over ocean, sun glint, and available daylight. This is highlighted further in Fig. 1e–g, where the ratios of the number of data points between products is provided. For example, for the same Aqua MODIS swath, MAIAC provides a 10 %–20 % higher data population when upscaled to the grid. This is because with its 1 km uniform resolution and Boolean cloud flag nature, there is likelihood of generating data somewhere within the grid. The VIIRS AERDB product, with its 30 % wider swath, geometrically out-samples the Aqua MODIS counterpart by a similar amount. Interestingly, overland Aqua MODIS MAIAC out-samples VIIRS in some regions by as much as a factor of 2, again due to its much higher 1 km resolution.
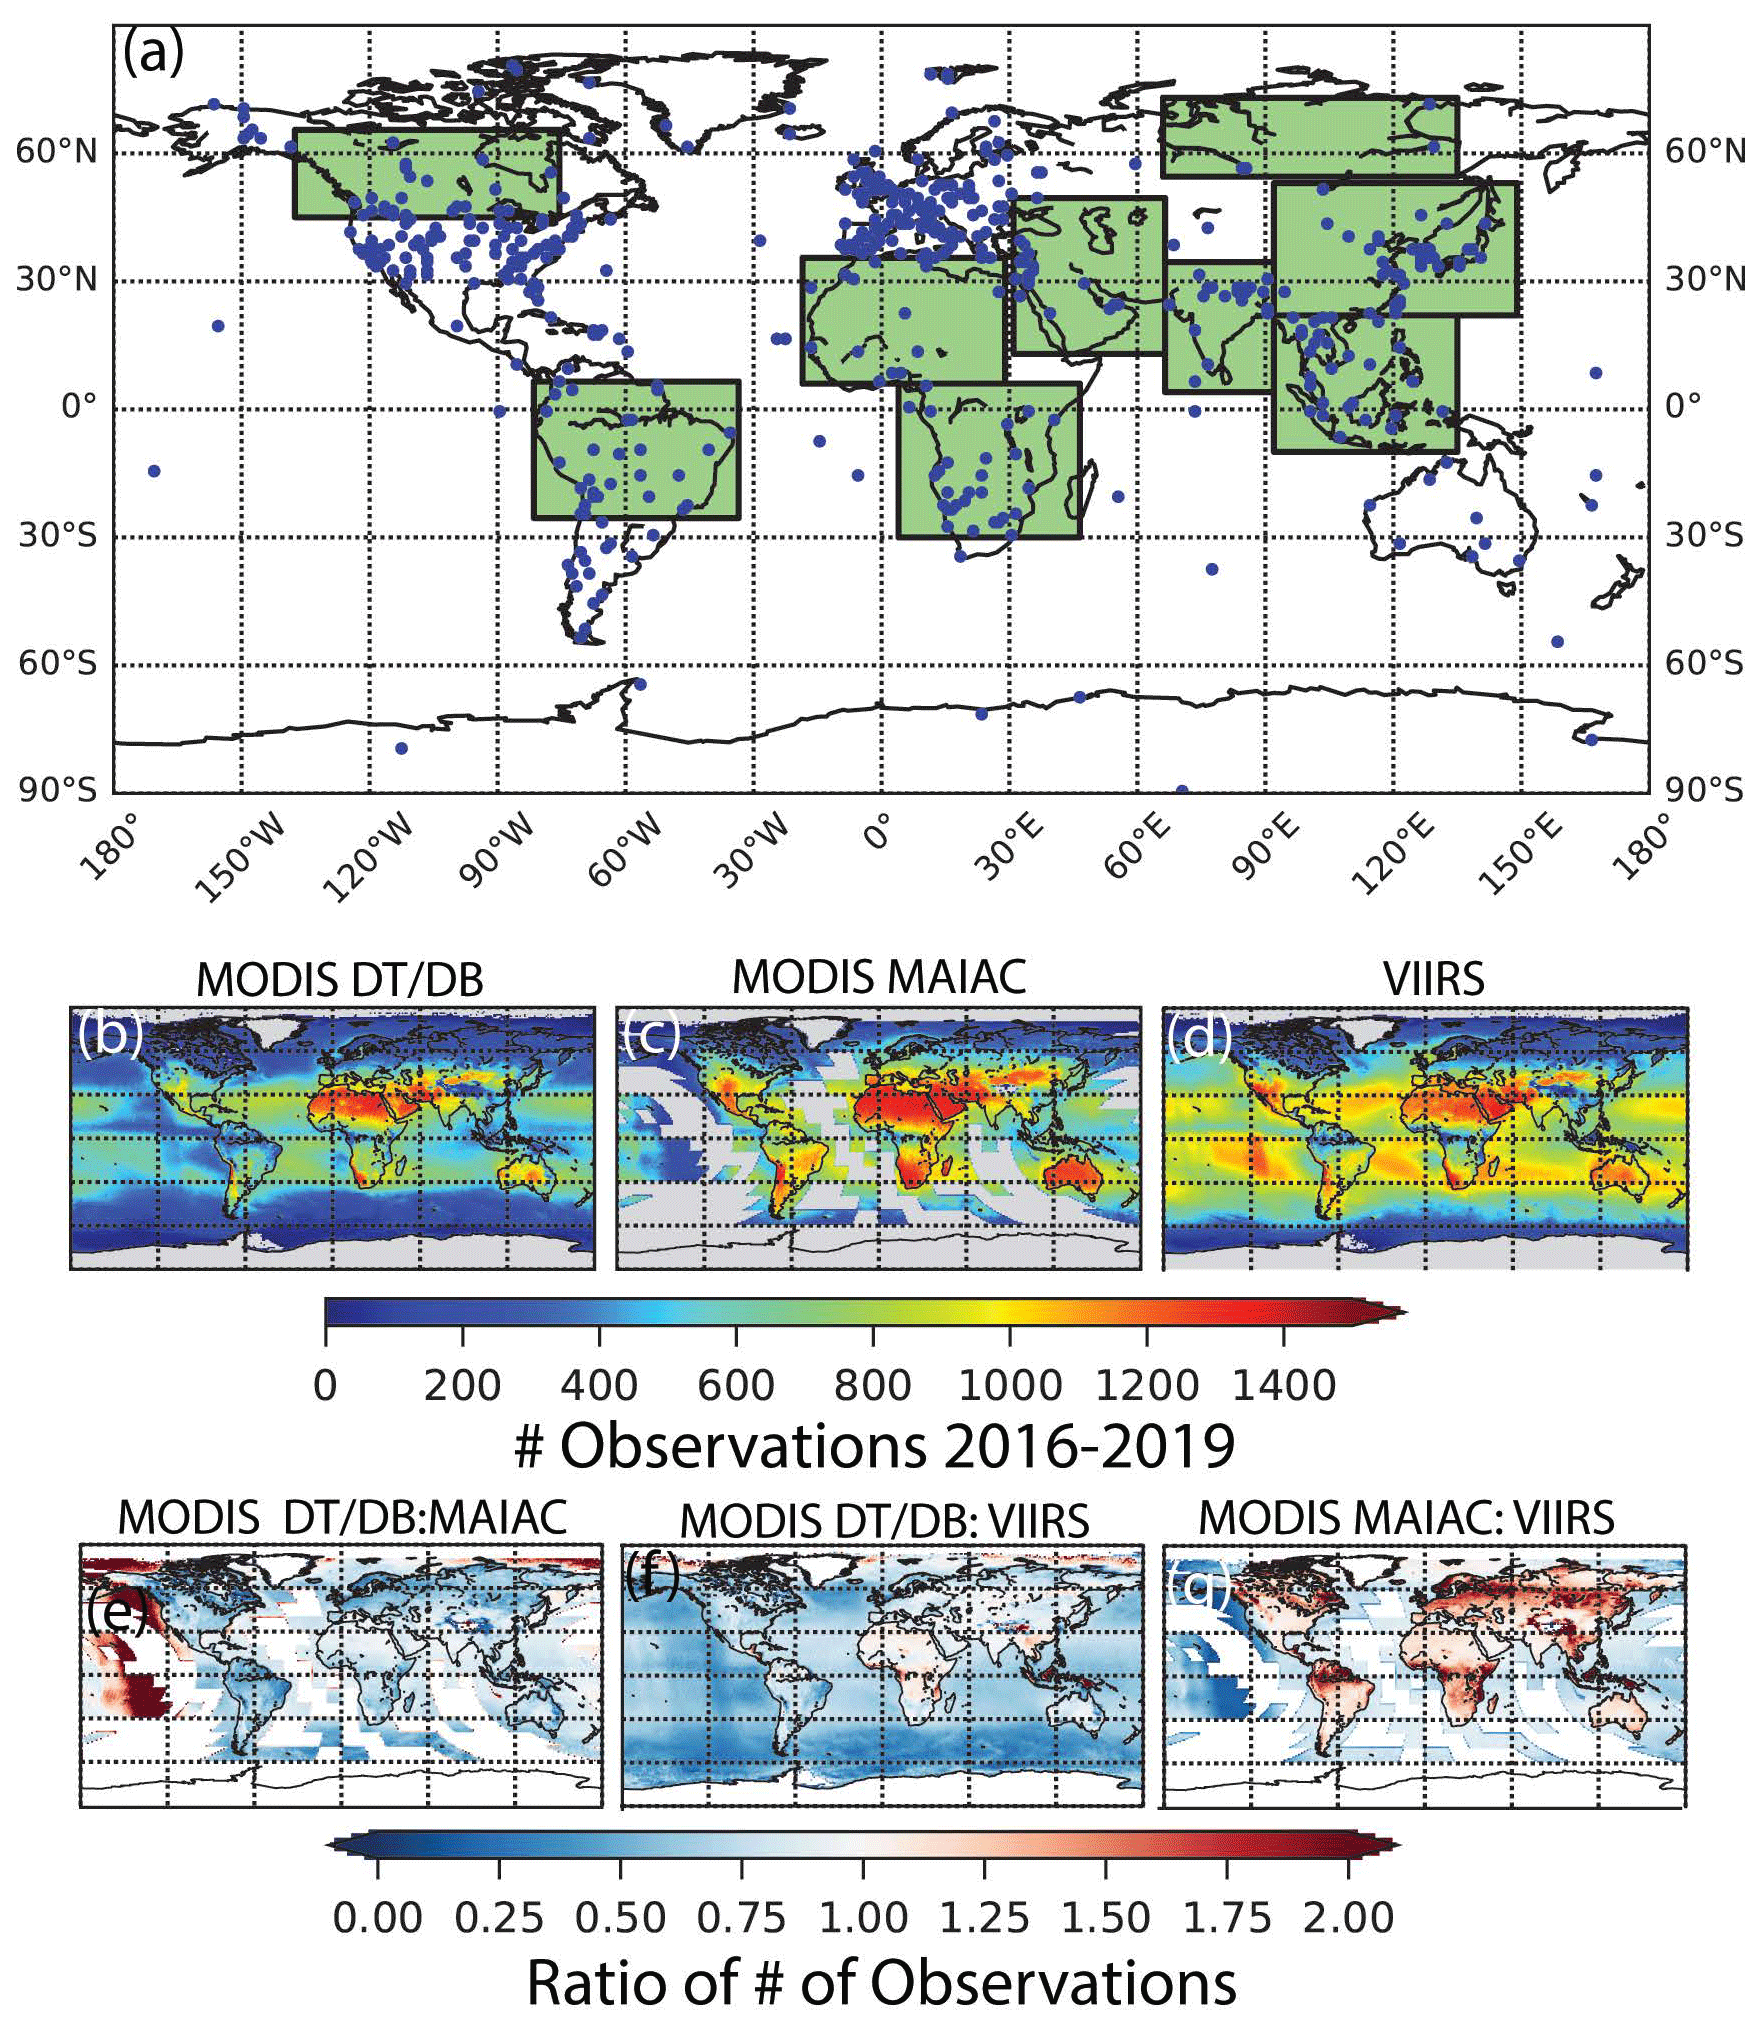
Figure 1(a) Selected regions for more detailed analysis of severe events, including boreal North America, South America, Saharan Africa, central Africa, southwestern Asia, South Asia, eastern Asia, boreal Asia, and Southeast Asia. Included are the AERONET locations used in this analysis. (b–d) The number of data points used over the 4-year study period for MODIS DT/DB, MODIS MAIAC, and VIIRS. (e–g) Ratios of the number of data points between products.
3.2 Global analysis metrics
There are many metrics available to intercompare satellite products. Here two approaches are taken, a global analysis of the differences in product probability distribution functions and pairwise comparisons by regression. In Sect. 4, the relative differences in the global distribution of aerosol events across MODIS and VIIRS algorithms are globally mapped by probability distribution (Sect. 4.1) followed by mapped regressions in a manner similar to Shi et al. (2011) in Sect. 4.2. Gridded netCDF files of there data in these figures are provided in the Supplement.
The global analysis of severe aerosol events begins with the comparison of probability distribution functions. Since AERONET is limited in terms of spatial area in comparison to the satellite products, only the satellite data are used in this section. Over the 4-year period, a probability distribution function is performed on each grid cell.
The other metric used in the global analysis is a pairwise regression analysis similar to what was presented in Shi et al. (2011). The pairwise metrics are used to analyze the spatial bias between each of these satellite datasets. For the regression, the gridded satellite data are matched up pairwise for where there are AOD values <0.8. The regression parameters studied include r2, slope, and intercept. It is important to investigate all of these metrics because satellite products are often well correlated but show slope and intercept biases. Shi et al. (2011) revealed areas with larger intercept values are often linked to differences in surface reflectance values. Highly correlated areas with larger slope values were linked to aerosol microphysical biases. AOD values >0.8 tend to show nonlinearities when regressed, so pairwise mean ratios calculations were used to explore the spatial biases of each product.
3.3 Regional analysis metrics
The global overview provided an initial review of the relative distributions of high AOD550 events between the three AOD products. But dissimilarities in the AOD550 distributions can be a result of several aforementioned root causes of sampling, microphysics, lower boundary condition, and aerosol–cloud discrimination. To attribute product differences by region, nine regions (as shown in Fig. 1) were selected for further discussion based on areas of higher geometric standard deviations, noticeable differences between the datasets, and variation in fractional identification of high-percentile-occurring events. Each region demonstrates its own challenges for retrievals and sampling. Here AERONET is used as a reference dataset for each of the regions given it is the closest form of validation despite its limited coverage. Since AERONET is included in this analysis, the regional satellite datasets only use land data. The regional analysis uses time series, scatter plots, log probability plots, and case studies to demonstrate the challenges in retrieving high AOD events between each of these datasets.
4.1 Event probabilities
The global distribution of 2016 through 2019 aggregated AOD550 datasets is provided in Fig. 2 projecting AOD550 onto a lognormal distribution. Provided for each grid cell are the median (i.e., 50th percentile), 84th percentile, and +1 geometric standard deviation (σg, here taken as the ratio of the 84th percentile to the median). Higher-level percentiles (95th and 98th), as well as the number of days with AOD550>0.8, are provided in Fig. 3. Ratios of the MODIS products to VIIRS are also included in the lower two panel sets in Figs. 2 and 3. VIIRS AERDB is chosen as the baseline for the ratios since it is the newest of the products and provides an integrated bright and dark surface retrieval. Over-land and over-ocean ratios are also provided in Table 1, with additional regional values provided for discussion in Sect. 5. The 84th percentile values account for the value that separates the highest ∼8 weeks of loading for the year, and its ratio to the median (an approximation of σg) is a measure of the relative dispersion of the AOD550 probability distribution. The 95th and 98th percentile values of AOD550 (e.g., highest 18 and 7 d) focus on the tail end of the distribution, which comprises the most significant severe events. Finally, the number of days with AOD550>0.8 metric provides an absolute threshold of the world's most significant aerosol hotspots. These metrics where selected to provide insight to where the most significant aerosol events occurred, what is locally considered an exceptional event, and how these events vary spatially between datasets. It also shows areas where datasets do not make retrievals, such as over the Arctic and over most of the ocean for MODIS MAIAC, which contains a quality flag requiring a portion of land within the sinusoidal gridded area. It is important to highlight that given the lack of a truth dataset for the global results, it is not possible to directly screen for incorrect cloud or aerosol classification.
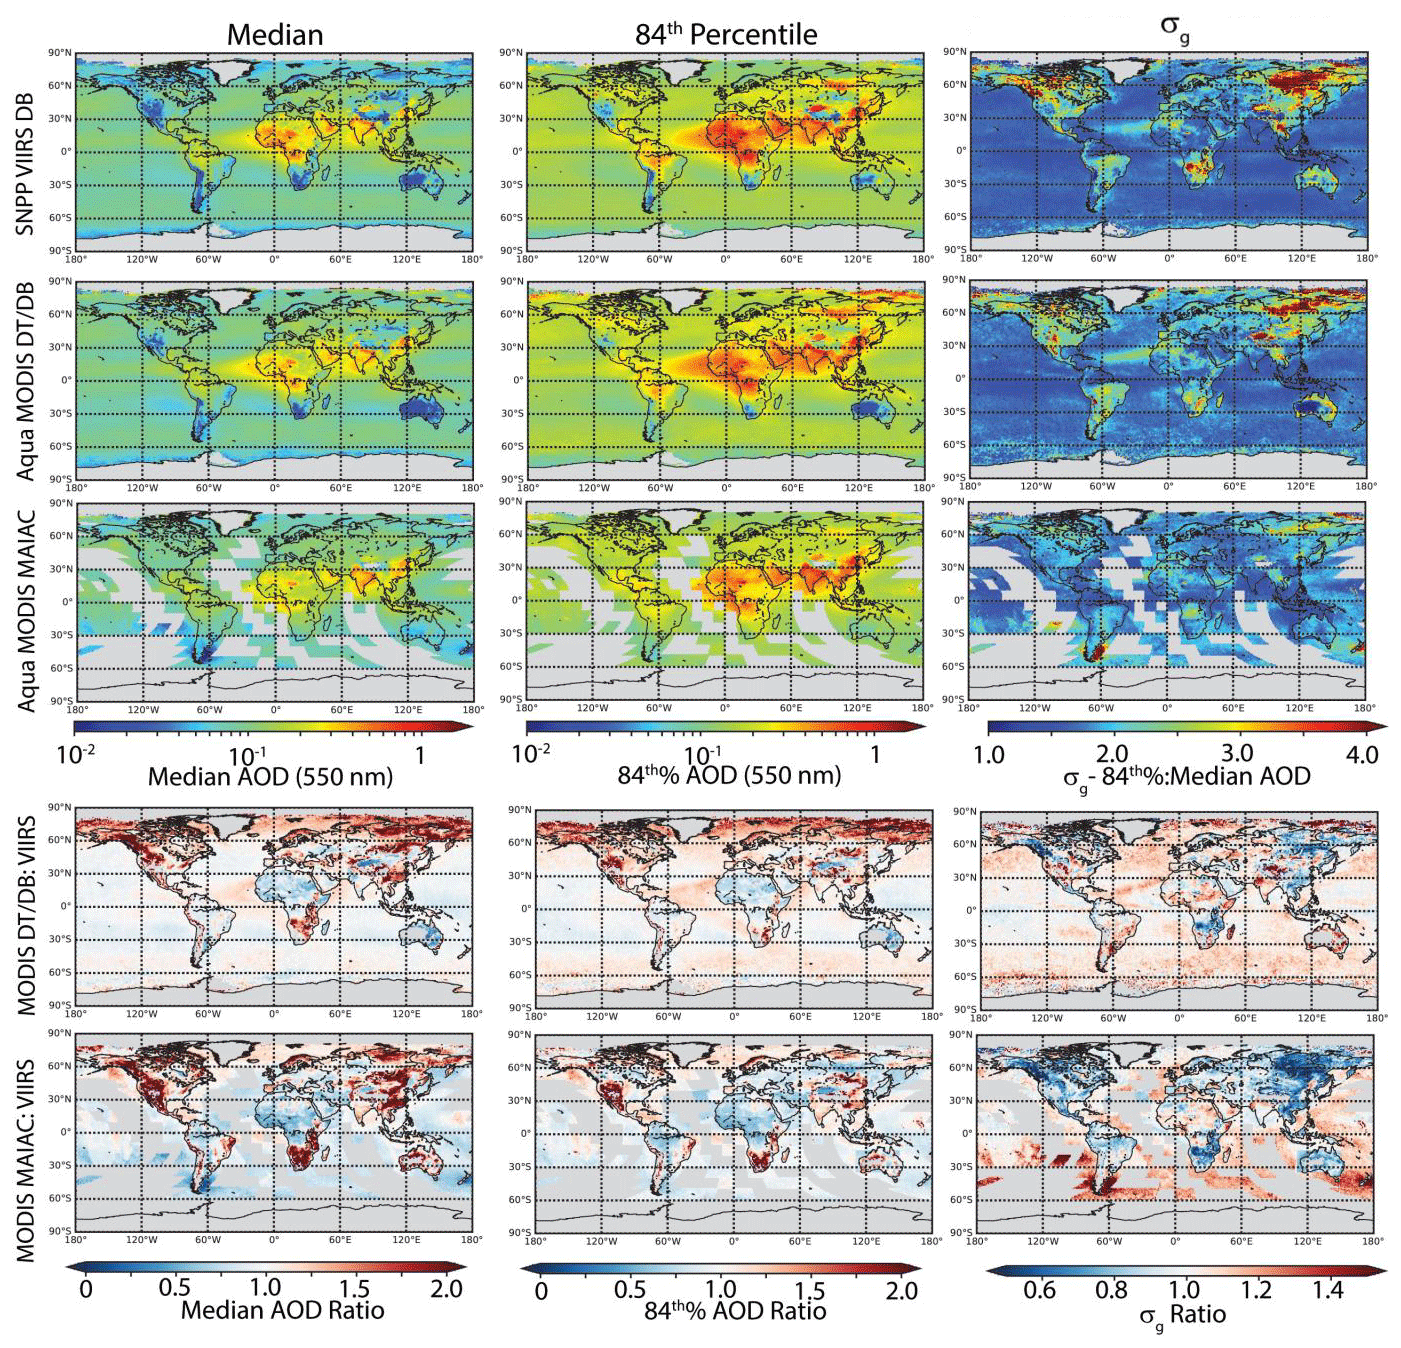
Figure 2Median (left), 84th percentile (center), and geometric standard deviation (right) of AOD for VIIRS Deep Blue, MODIS Dark Target/Deep Blue combined, and MODIS MAIAC. The bottom two rows present the ratio of MODIS DT/DB and MODIS MAIAC relative to VIIRS AERDB over the years 2016–2019 for each individual area. The ratios filter areas where the 84th percentile of AOD is <0.1.
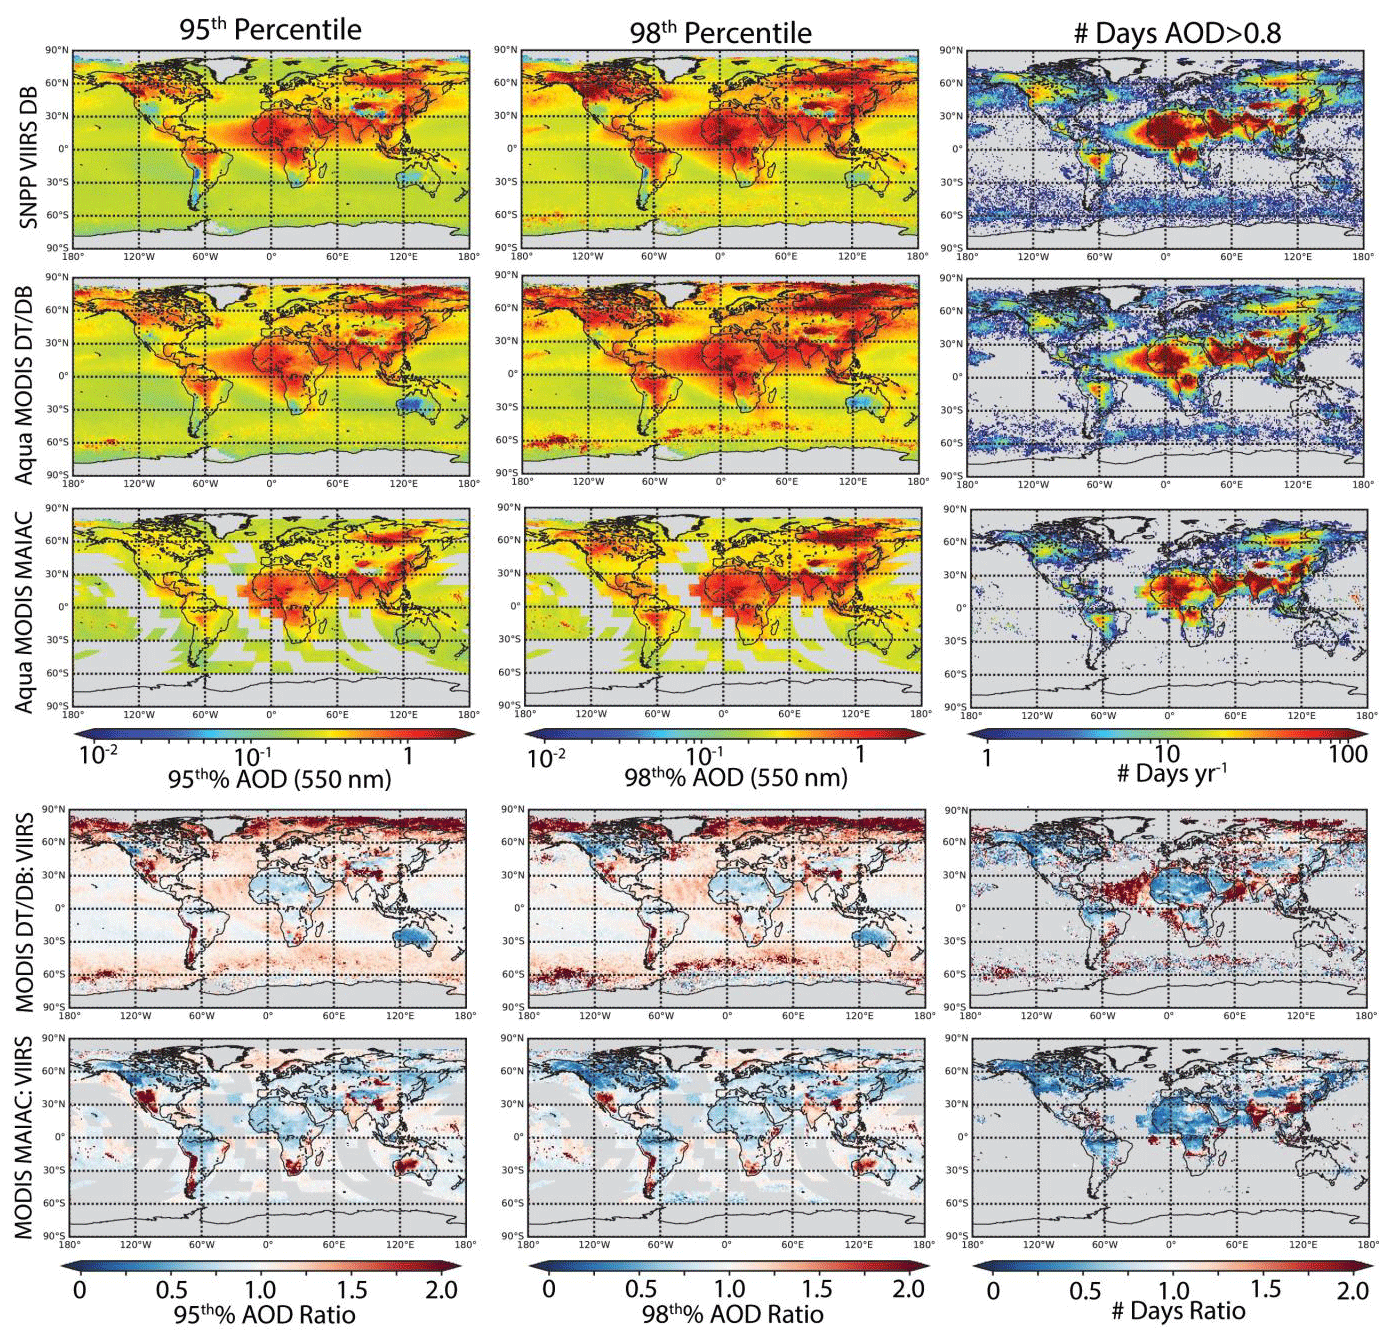
Figure 3The 95th percentile of AOD (left), 98th percentile of AOD (center), and number of days where AOD >0.8 (right) for VIIRS AERDB, MODIS DT/DB, and MODIS MAIAC for 2016–2019. The ratio of MODIS DT/DB and MODIS MAIAC to VIIRS AERDB is presented in the bottom two rows.
Table 1AOD550 median, 84th percentile, and +1 geometric standard deviation (σg) for selected regions for each dataset. Apart from global ocean, all values are for over land only.
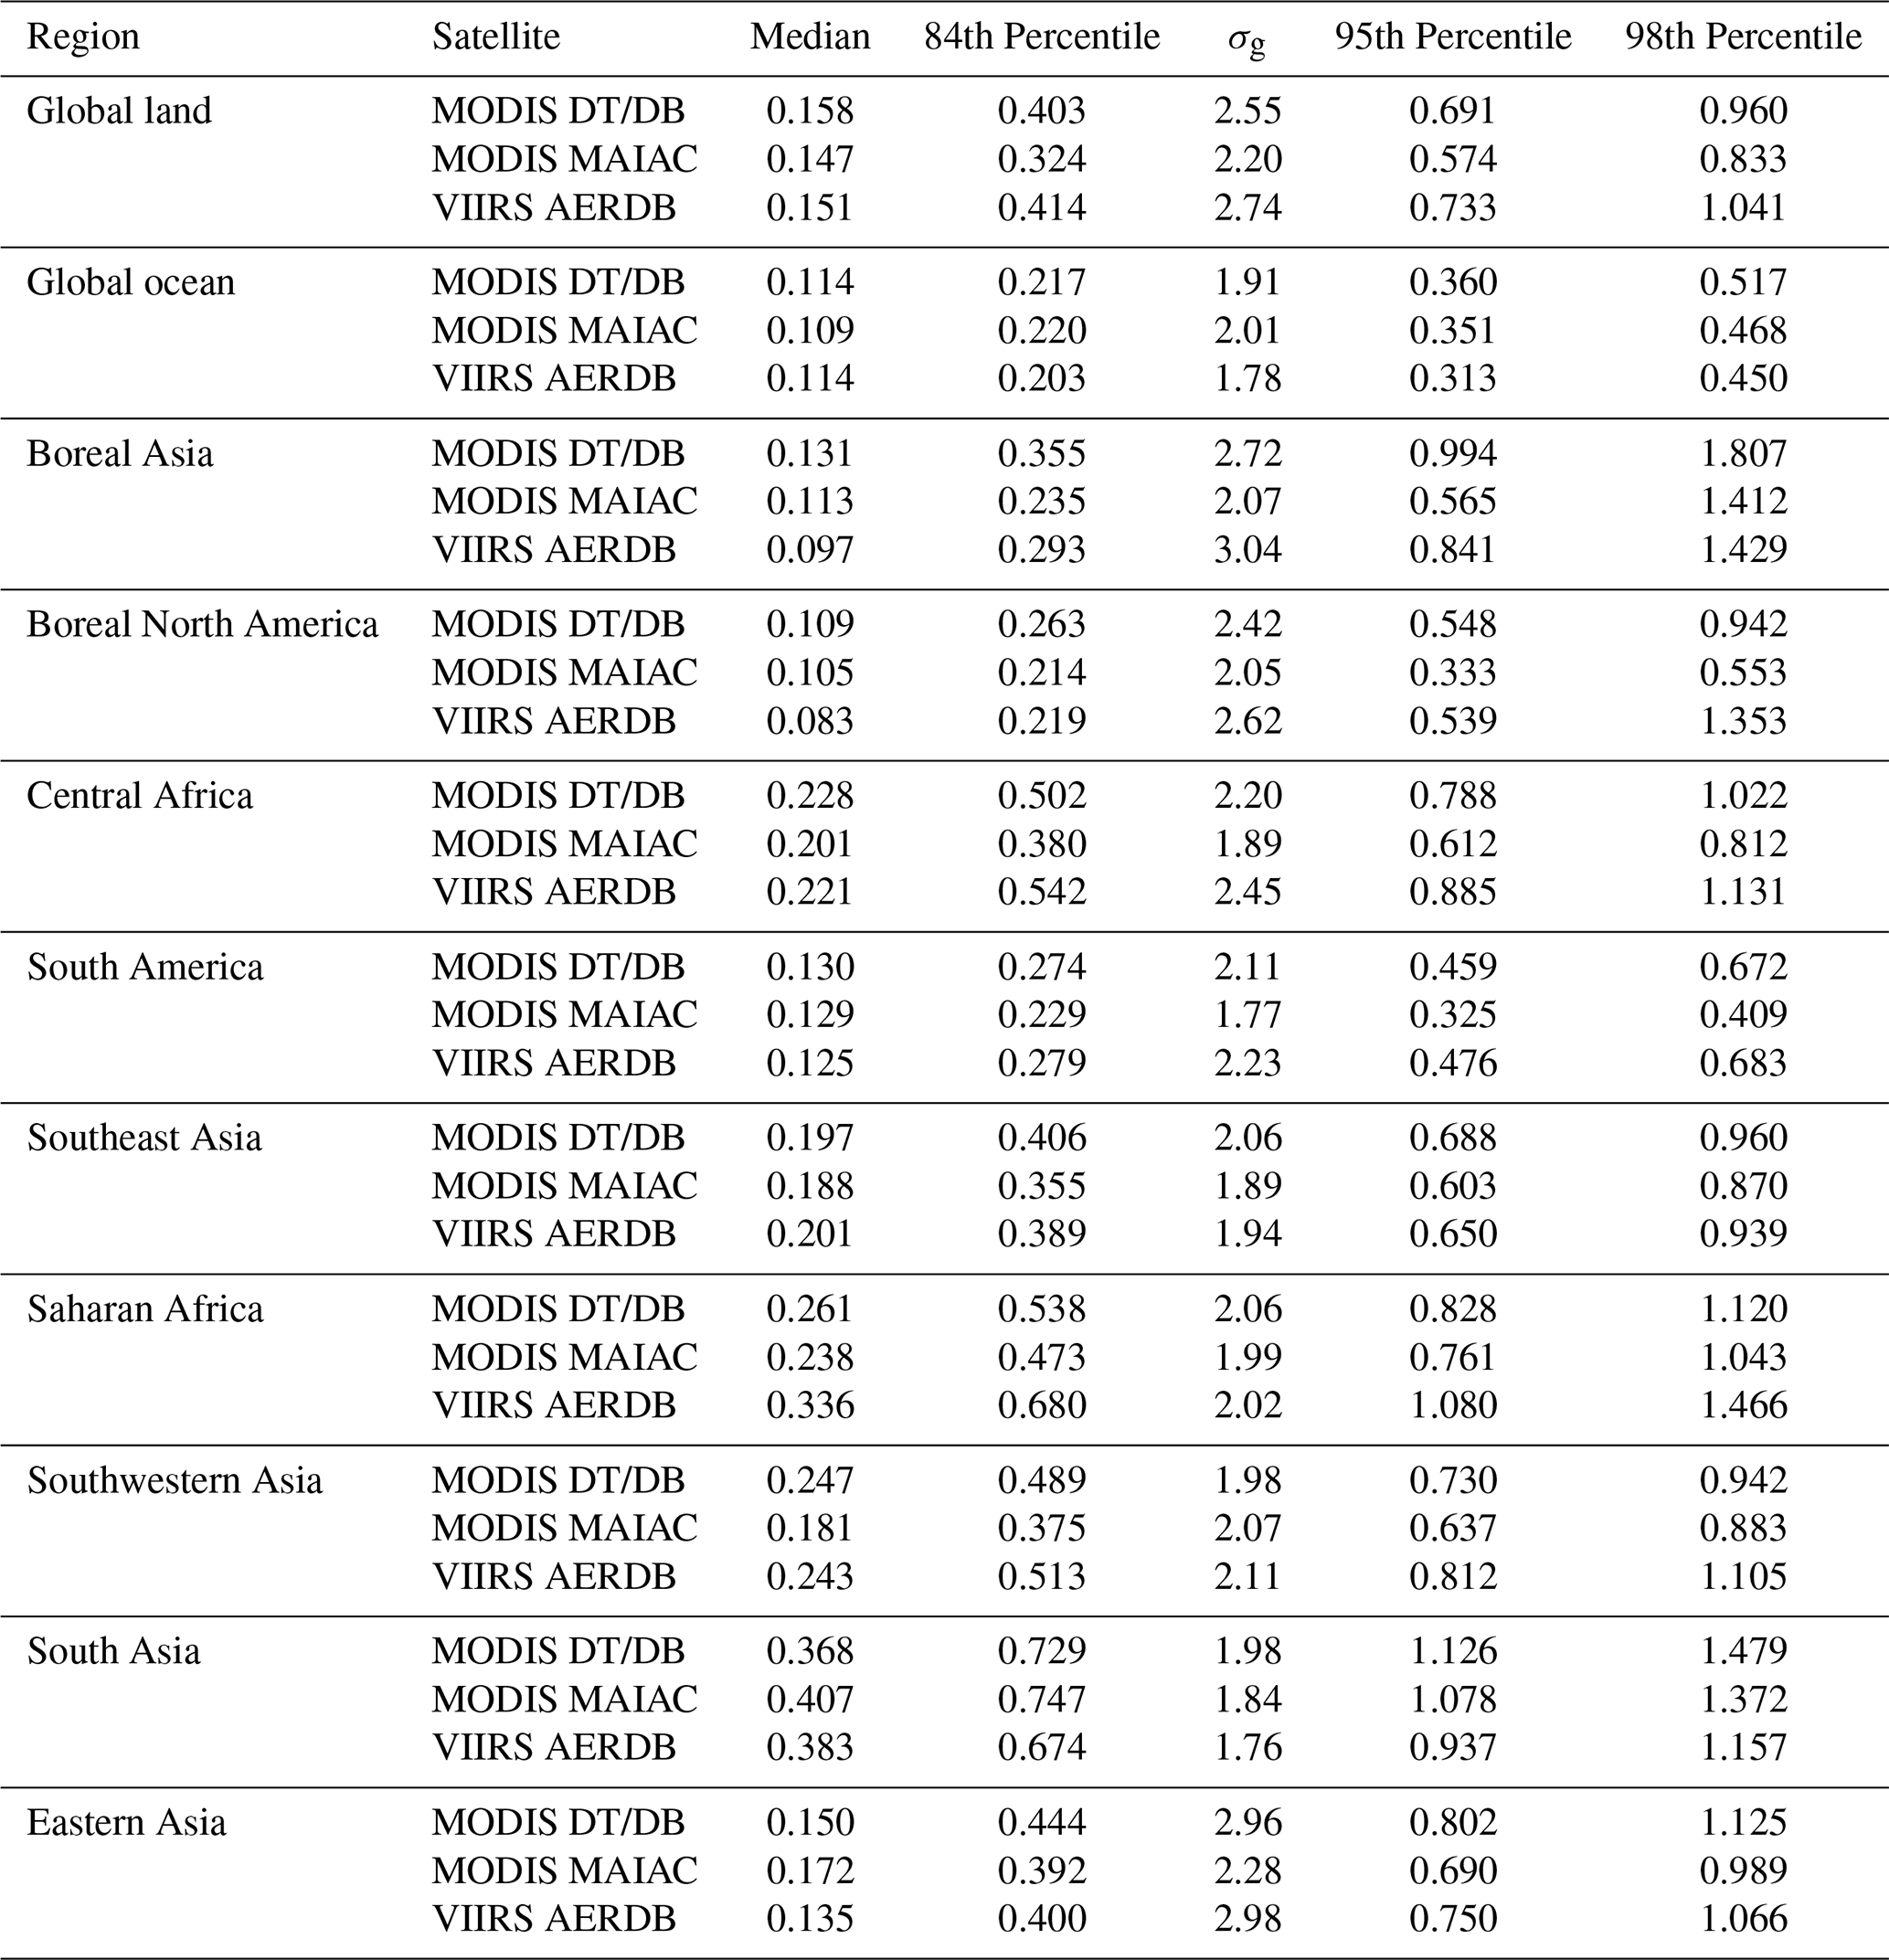
As expected, the overall distribution of median AOD550 is consistent with existing aerosol climatologies of aerosol means by satellite (Mishchenko et al., 2007; Remer et al., 2008; Li et al., 2009; Wei et al., 2019; Sogacheva et al., 2020) and operational model (Sessions et al., 2015; Xian et al., 2019). Globally the median over-land AOD550 is consistent between products, ranging from 0.14 to 0.15 (Table 1). Median AOD550 was in agreement by product and was highest in the subtropical belt of (i) the South Asian Indo-Gangetic Plain, , for pollution and biomass burning coupled with haze formation (Dey and Di Girolamo, 2011); (ii) Saharan Africa, , for dust (Caton Harrison et al., 2019); (iii) tropical and central Africa for smoke (Swap et al., 2003; Eck et al., 2013); and (iv) southwestern Asia, , for a combination of dust and pollution (Reid et al., 2013; Al-Taani et al., 2019). Additional sub-domain hotspots in median AOD550 include portions of the North China Plain (An et al., 2019) and the Taklamakan Desert (Ge et al., 2014). Over ocean, MODIS DT/DB and VIIRS are within 0.01 of each other (0.10–0.12). By region, however, spatially correlated biases between products are readily apparent. For the ratios of MODIS products to VIIRS in Fig. 2, values greater than 1 indicate the MODIS products observed higher AOD550 values, whereas values lower than 1 indicate VIIRS AERDB observed higher AOD values. As reflected in the domain average, VIIRS AERDB overall shows the highest climatological magnitude of gridded AOD550 medians while MODIS MAIAC has the lowest magnitudes. The most notable locations of differences are clean background (low-AOD) regions of the arid western United States, the Gobi Desert, and the Arctic, where both MODIS products are higher than VIIRS. At the median level this is only a 0.03 difference in AOD. For more heavily loaded environments, the largest discrepancies are in central and southern Africa and East Asia. In Sect. 5, these regional differences are investigated using AERONET to help quantify the biases.
At the 84th percentile level, which inherently accounts for some seasonality in aerosol loadings, additional aerosol hot spots are visible that defined the remainder of the regions in Fig. 1. Most notable are the biomass burning regions of South America, Southeast Asia, boreal Asia, and Canada, as well as a more consistent identification of the Taklamakan Desert. At the 84th percentile level, AOD550 signal is good in revealing areas of seasonal aerosol loading, and products also largely agree, but some divergence becomes evident. For example, over land at the 84th percentile level, MAIAC provides distinctively lower AODs for nearly all regions (0.31 for MAIAC versus ∼0.4 for MODIS DT/DB and VIIRS). The lowest values for MAIAC are associated with central African and boreal biomass burning. While MODIS DT/DB and VIIRS are largely within 10 % of each other, for Saharan Africa VIIRS is 25 % higher at the 84th percentile. By region, the strongest divergence between satellites is in central and southern Africa – unsurprising given the variability in aerosol speciation, single scattering albedo, and land surface characteristics. Divergence also still exists in the western United States, although even at the 84th level AODs are still quite low. Finally, the sign of the ratios to VIIRS often switches between land and water – an indicator of algorithmic differences used for those two surfaces.
In the context of AOD variability, σg normalizes the 84th percentile with respect to the medians of each dataset to make them more comparable. σg can be used as an indicator of AOD550 dispersion, with higher values indicative of a higher prevalence of episodic aerosol events relative to the mean. Over ocean, the equal area average value is ∼ 1.8–2.0, with notable enhancements associated with the northern portion of the Saharan dust plume (due to seasonal variability) and northern latitudes, presumably due to biomass burning events. Over land, the regions with the highest spread (in excess of 3) include boreal biomass burning regions of Siberia and North America followed by seasonal biomass burning regions of Africa, South America, and Southeast Asia. Datasets are largely consistent in region identification to these hotspots. For dust, the Taklamakan desert and coastal Argentina are also highlighted. Interestingly, the distribution spread for African dust is much more muted – likely owing to the dominance of a single and frequently active dust source.
Notable differences between datasets are apparent in Fig. 2, especially between land and ocean. Overall, MODIS MAIAC, when aggregated, shows the lowest values of dispersion in comparison to the other two datasets. Regions that show high standard deviations for VIIRS AERDB and MODIS DT/DB include northwestern North America, southern Africa, central South America, Southeast Asia, and central Russia. These are all associated with biomass burning events.
To further evaluate the differences between each of these datasets from a severe events perspective, Fig. 3 includes the 95th and 98th percentile values of AOD550 (e.g., highest 18 and 7 d). Over the ocean, MODIS DT/DB generally observes larger 95th percentile values of AOD550 compared to VIIRS AERDB. The difference in products is especially noticeable over the central Atlantic where dust events occur, as well as high to middle latitudes and the Arctic. Over land, both MODIS products show greater values of 95th percentile AOD550 than VIIRS over India, eastern Asia, southwestern North America, the western coast of South America, and southern Africa. VIIRS AERDB dominates over land with higher values over boreal Canada, central South America, Saharan Africa, and boreal Asia. In the case of the Arctic Ocean, Africa, and southwestern Asia a clear transition from a low MODIS to VIIRS ratio to high from the boreal to the Arctic Ocean is likely related to the switch between land and ocean retrievals. The 98th percentile values of AOD550 have similar spatial patterns to the 95th percentile of AOD550. MODIS DT/DB and VIIRS AERDB show a large plume off the western coast of the Hawaiian Islands.
As opposed to probability distributions, the number of days with AOD550>0.8 presented in Fig. 3 was used in this analysis as a threshold benchmark. While probability distributions to an extent normalize out sampling (account for both swath width and for over ocean, the higher swath fraction to glint), threshold scores are useful in their ability to detect an event. AOD550>0.8 is used because the lowest global 98th percentile over-land value of all datasets is approximately 0.8 (0.82 for MAIAC) and corresponds to an AOD alert as part of the ICAP_MME consensus (Sessions et al., 2015). While thresholds are useful, they can also be problematic given the overall lognormal distribution of AOD; slight systematic biases may result in larger systematic differences in a threshold metric. VIIRS, with its wider swath, could be expected to observe higher AOD events than MODIS. However, over land the differences between MODIS and VIIRS largely resemble the differences in the 95th and 98th percentile AODs. Strong gradients in the ratios from land to water further highlight the effect of having different ocean and land retrievals. Thus, retrieval differences for VIIRS overtake the gains made by coverage for this type of metric. This is explored further in the pairwise comparisons conducted in Sect. 4.2.
Taken as a whole, the over-land VIIRS AERDB dataset, with its larger swath, shows the most AOD550>0.8 d in comparison to both MODIS datasets over Africa, boreal Canada, central South America, and boreal Asia. However, both MODIS datasets show more AOD550>0.8 d over India and portions of eastern Asia, and the MODIS DT/DB observes more AOD550>0.8 d over the central Atlantic Ocean. Without having an exact truth to provide validation of AOD550 over whole regions, it is difficult to determine which best captures severe events, although it is suspected that differences can come from several sources. For example, the differences over the central Atlantic Ocean between MODIS DT/DB and VIIRS may be due to the difference in the dust models used in the algorithm over ocean. This is reflected in the high bias in the MODIS DT/DB AOD over the North Atlantic Ocean.
A second type of threshold score is slightly more relative, by calculating the probability of each dataset capturing a 95th percentile event compared to the total number of detected 95th percentile events, as well as the probability of only a single dataset detecting a 95th percentile event. That is, relatively speaking, we ask for a 95th percentile from one set that is matched by 95th percentile of another, thus accounting for slight biases in the datasets. Of course, if no dataset captures a 95th percentile event then it cannot be counted. This metric is used to identify how common it is for the datasets to be in agreement and identify areas where the detection of 95th percentile events is missed by the individual algorithms with the results presented in Fig. 4. In order to focus on high aerosol events, a threshold was set to eliminate points where the 95th percentile AOD550 was less than 0.3. It is important to be reminded that this metric does not define the accuracy of capturing 95th percentile AOD550 events, but rather the consistent conclusion that two algorithms are in agreement that an event has taken place. Such consistency is required to bridge the climate data record between sensors and algorithms and important for data assimilation.
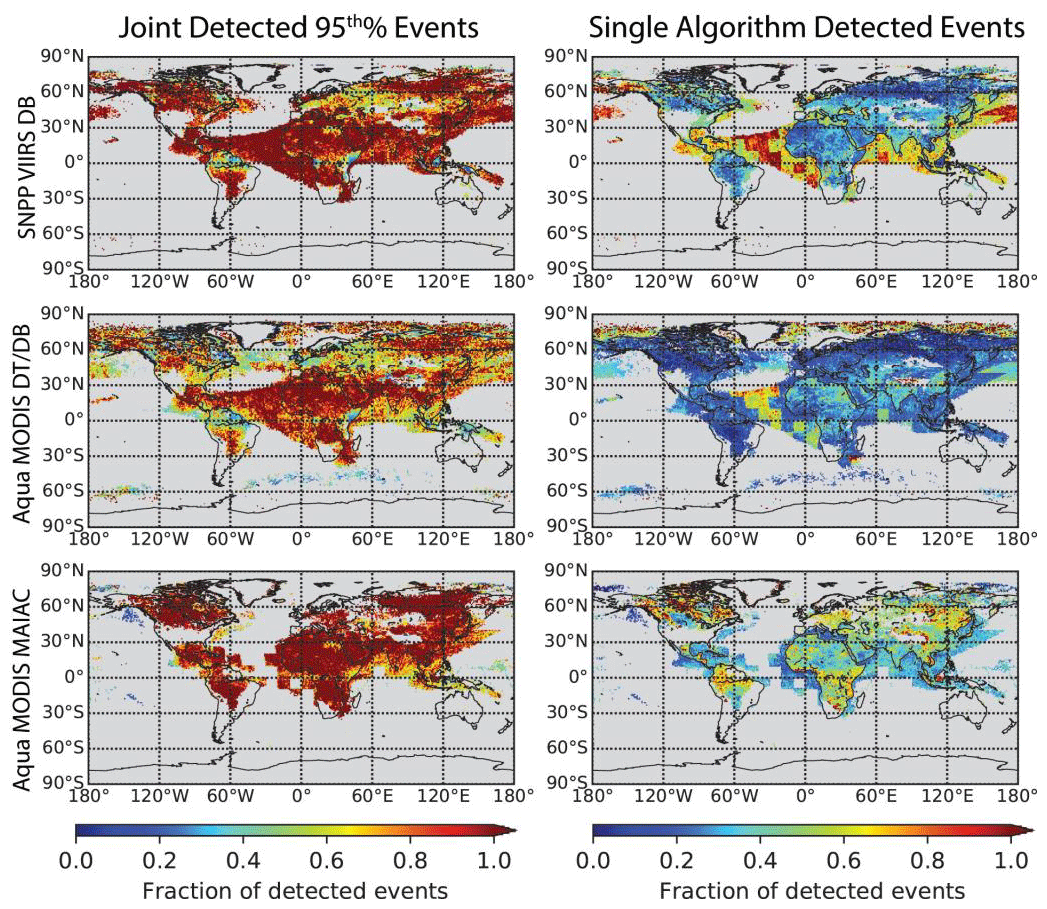
Figure 4Consistency of detection for 95th percentile events by each dataset compared to the total detected 95th percentile events (left) and the amount of 95th percentile events detected by a single sensor or algorithm in comparison to total detected 95th percentile events (right) for VIIRS AERDB (top), MODIS DT/DB (middle), and MODIS MAIAC (bottom) with a threshold for 95th percentile >0.3.
Overall datasets are generally in agreement when detecting 95th percentile aerosol events, particularly in regions where high aerosol loadings occur. Not surprisingly given its increased coverage, VIIRS AERDB shows the highest likelihood of identifying an event at the 95th percentile. VIIRS AERDB is more likely to detect individual 95th percentile events over ocean. Over land, MODIS MAIAC identifies more individual 95th percentile events than the other two datasets.
MODIS DT/DB was regionally inconsistent in detecting 95th percentile events, especially over northern South America, central Europe, northeastern Asia, and the central Atlantic Ocean. This may be due to the cloud conservative nature of the algorithm in order to minimize cloud contamination. This may also be due to a sampling related difference as MODIS DT/DB products are available at 10×10 km resolution at nadir while MODIS MAIAC and VIIRS AERDB aerosol products are available at 1×1 and 6×6 km resolution at nadir, respectively. MODIS DT/DB and MODIS MAIAC show lower detection rates along the ocean coastlines of Asia with respect to VIIRS AERDB with all three datasets seem to be detecting different events within central Africa.
4.2 Global pairwise analysis
While the comparison of the probability distributions of datasets characterizes overall sampling, we also wish to know how products compare at individual points and times, especially for significant AOD events. Here we briefly repeat the pairwise global analysis of Shi et al. (2011) with the updated algorithms and an emphasis on higher AOD regimes where we expect nonlinearities in AOD to exist between products. The global analysis presented here will then feed discussions of specific regional phenomenology that are provided in Sect. 5. While regression is a useful tool, there are considerations when interpreting the results. The quality of a relationship is often indicated in the coefficient of determination (r2), which provides the fraction of variance captured by a regression line. Thus, for a given error bar (e.g., ±0.1 in AOD), data with wider dynamic range will by nature have a higher AOD, and low-AOD environments are penalized by the r2 metric. Further, for higher-AOD events, retrieval microphysical assumptions and degrees of freedom (absorption, size, refractive index, phase function etc.) should create a host of local nonlinear and multi-modal relationships between products. Indeed, the products examined here do not even differentiate between fine and coarse mode over land other than what is regionally pre-defined. Errors due to lower boundary conditions should diminish with increasing AOD. Seasonal differences often exist. Ultimately, linear regression, while useful, is not a universal tool.
To account for nonlinearity, calculations were made in two ways. First, linear regression is performed on the bins for when AOD550<0.8 for either of the products being regressed (Fig. 5). Above this value, we found nonlinearities became prominent. Second, to extract AOD dependent biases we calculate pairwise mean deviation between products for differing optical depth bands (Fig. 6), less than the median (<0.15), moderate AOD in the linear regime (0.15–0.4), transition to multiple scattering (0.4–0.8), multiple scattering (0.8–2), and exceptional AOD550 (2–3). The pairwise occurrences for AOD550>3 were limited, so the comparison ends at that point. The mean ratios calculated in Figs. 5 and 6 are defined as the averages of the ratios of the pairwise satellite products. As noted in Sect. 5, even this formulation is inadequate for regions with multi-modal behavior.
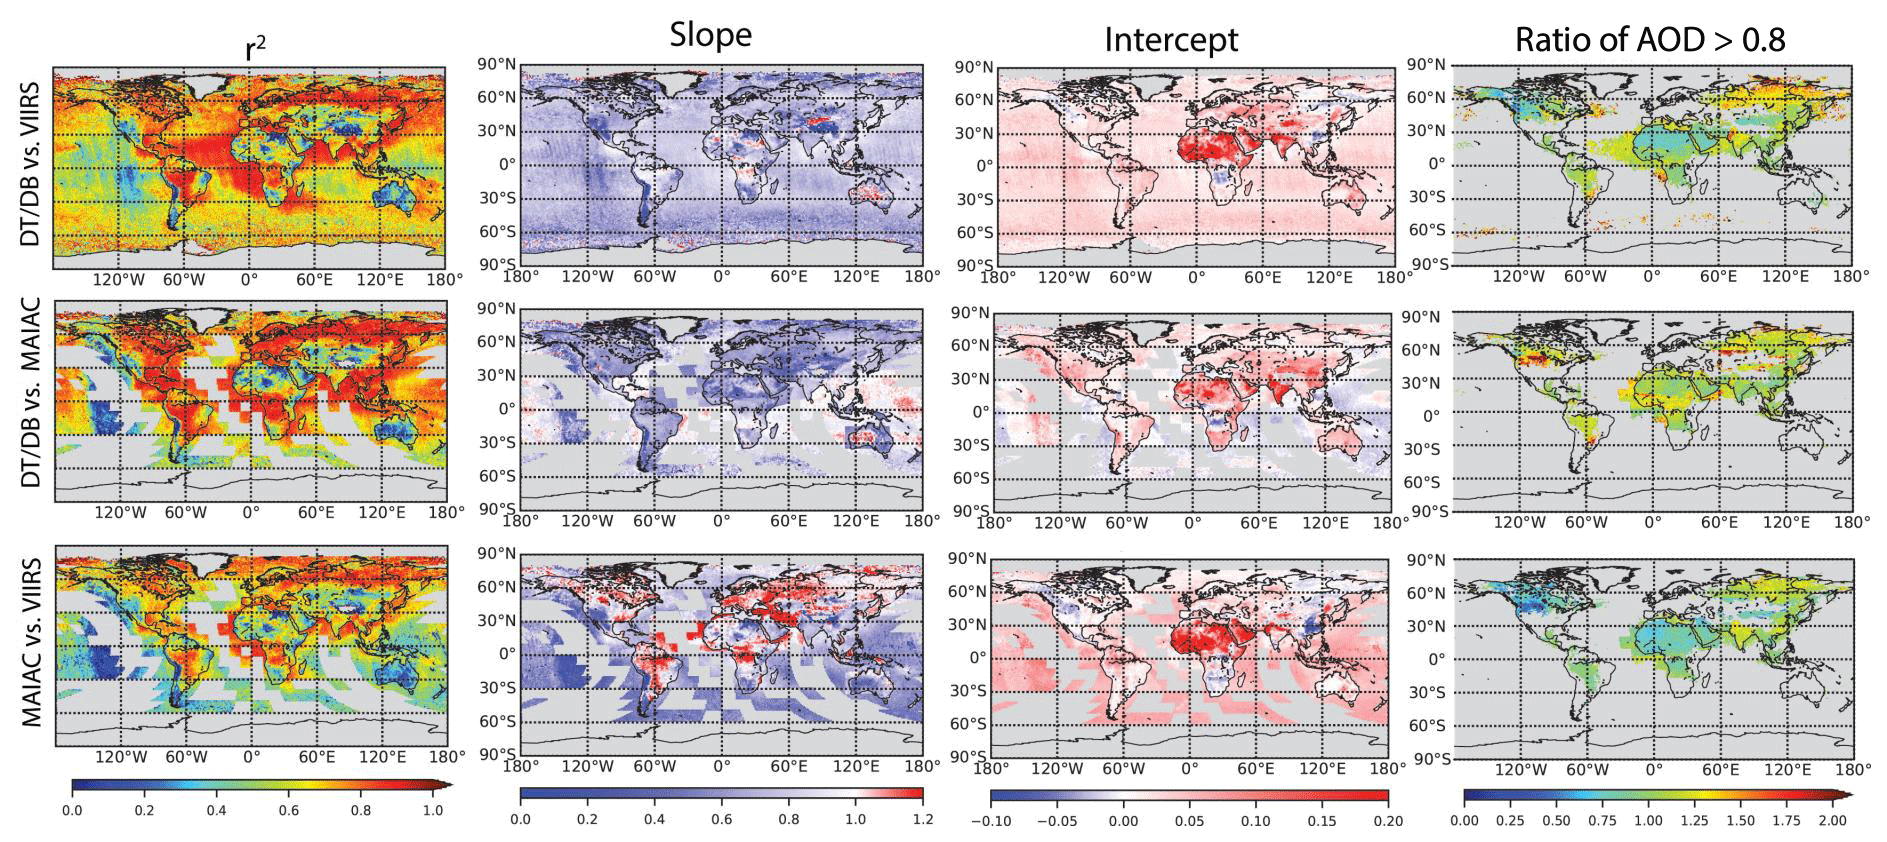
Figure 5Pairwise regression and mean difference maps between the NASA VIIRS Deep Blue, MODIS Dark Target/Deep Blue (DT/DB), and MAIAC optical depth products. Regressions are performed for AOD550<0.8, with the mean ratio between products coming from AOD550>0.8.
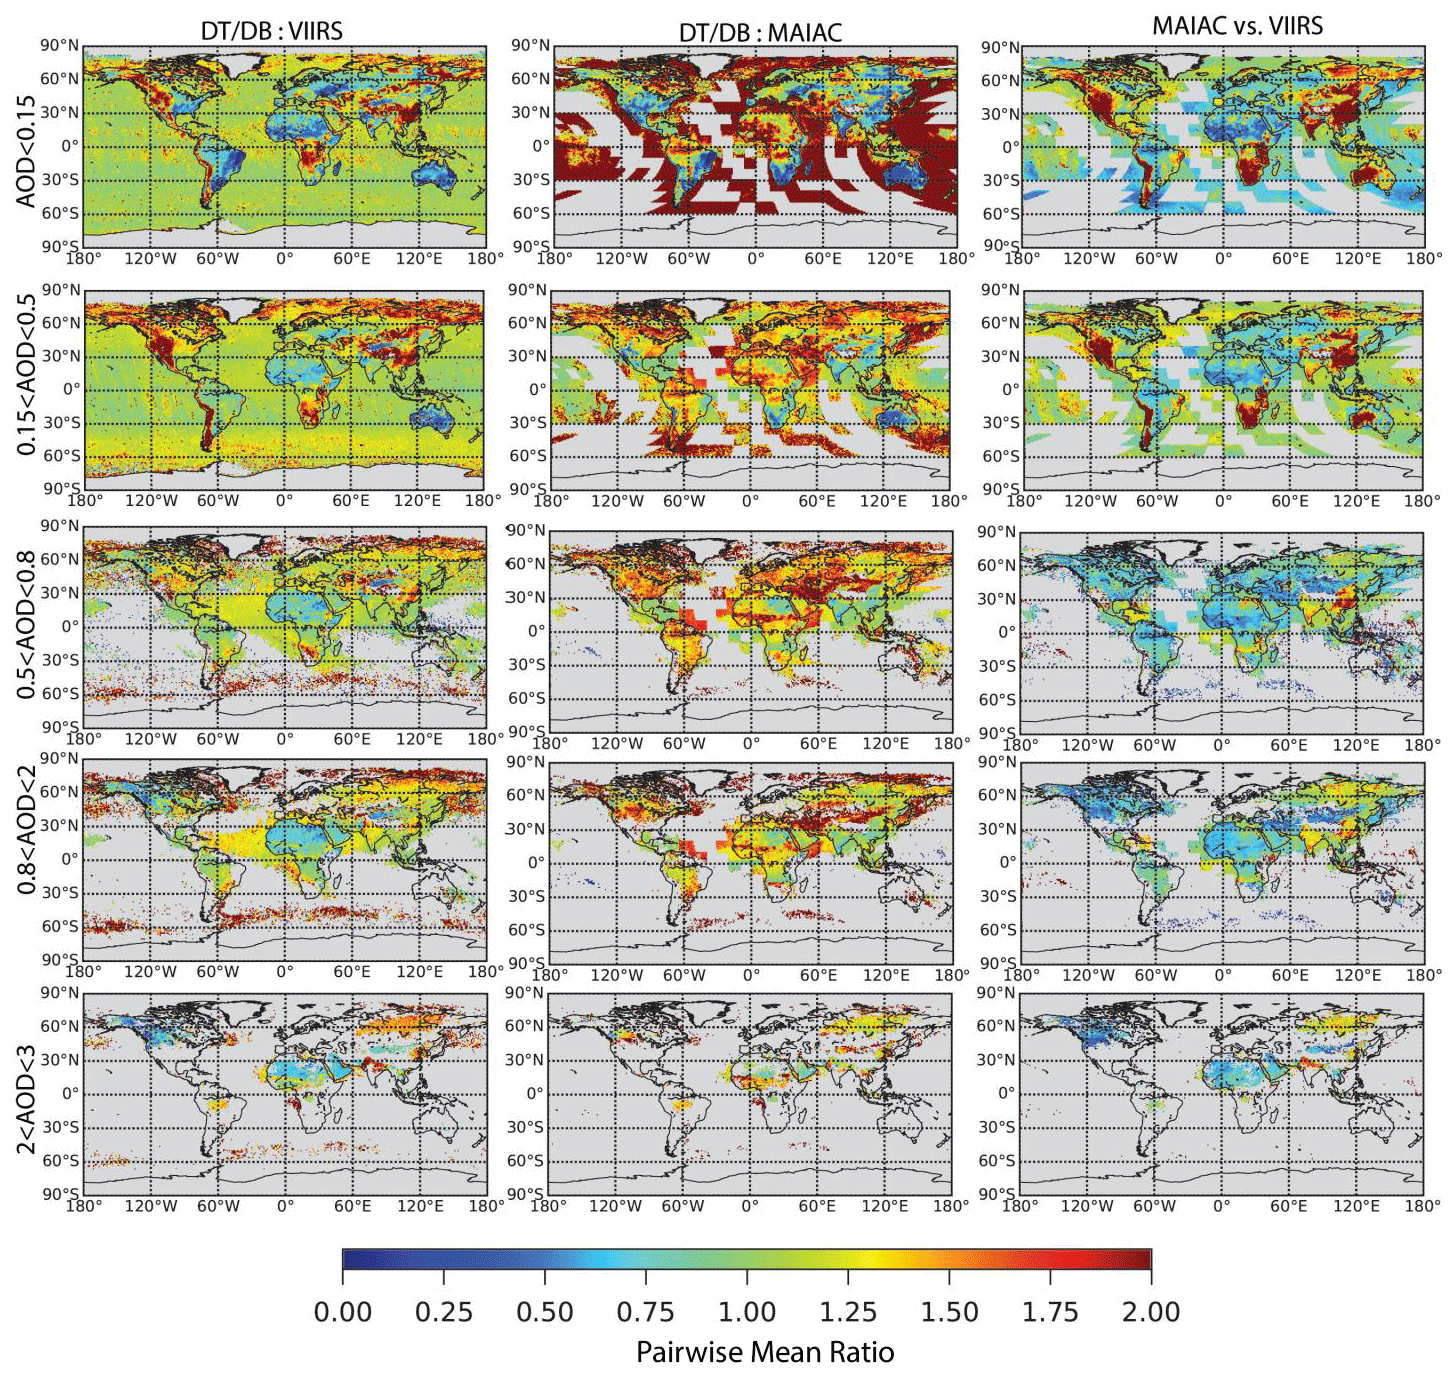
Figure 6Pairwise mean ratios between products for differing AOD ranges where at least one of the products has a value within that range.
As in Shi et al. (2011), strong spatially correlated biases are evident in Figs. 5 and 6, as evidenced by widely varying, slope, intercept, and r2 values. Regions with the highest r2 are coastal waters, no doubt aided by the dark ocean boundary conditions and higher AOD relative to the open ocean. Slopes are also reasonably close to one for VIIRS and DT/DB products, with DT/DB showing slightly low differences from 0 %–20% for moderate AOD. DT/DB also has a slight positive offset. MAIAC coastal waters show stronger gradients in slope than the traditional Dark Target counterparts, perhaps due to its use of more prescriptive optical models.
Over-land products continue to show significant spatial correlation of AOD between products. Over land, the highest correlations are for moderate- to high-AOD regions over low-albedo vegetated lands including biomass burning regions of South America, boreal Asia, central Africa, and peninsular Southeast Asia, as well as the pollution-dominated regions of the eastern United States and Europe. In contrast, regions of low r2 values, and hence indeterminate value of slope and intercept, include the low-AOD areas of the tropical to subtropical Pacific Ocean and the deserts and mountain ranges of the western United States, Chile, central Asia, and Australia. However, arid areas with moderately strong AOD signals also compare poorly, especially Saharan Africa and southwestern and central Asia. Large intercept deviations between products are generally highly localized, likely due to arid land surface features (desert playa, rocks, bare soil) and orographically related haze and dust features (such as in India and western China, as discussed in Sect. 5). Saharan Africa, with its proclivity for dust production, shows the most dispersion between products for a region of moderate to high AOD. Mean deviations from high AOD events likewise have strong regional patterns, again perhaps due to different dust models.
Like the probability distributions, regression and bias statistics are often markedly different across the land and ocean boundary – especially between arid regions and water. Outstanding examples of sharp gradients in model comparisons of this include the transition from Saharan Africa to the Atlantic Ocean and southern and southwestern Asia to the Arabian Gulf and Bay of Bengal. In Reid et al. (2022), this is apparent when the ICAP consensus models are compared to MODIS. These models do not have the sharp boundaries for significant land plume ejections like the MODIS product does. This provides evidence that there are differences between the land and ocean retrievals resulting in coastal changes in AOD even when compared pairwise. While it is surmised that this is largely due to lost signal-to-noise values over bright backgrounds, it is a reflection of the differences in over-land and over-water portions of retrievals. Finally, while mostly regressed out in the pairwise comparison, one must also consider that the very sample populations are different on either side of the shoreline. Influences include orography, glint, and differences in cloud features. The AOD distributions also may be truly different due to land–sea breeze interactions. Over water, sun glint removes up to a third of the large fraction of the swath. In all these cases, examples are provided in the regional results section, and even a cursory view of the NASA Worldview site (https://worldview.earthdata.nasa.gov/, last access: 10 August 2021) will show numerous examples of retrievals being available of only one side of the shoreline.
As noted earlier, while product-to-product regressions are quite useful, they do not explain why one sensor or algorithm might have difficulty capturing AOD-related dependencies on microphysics and lower boundary conditions. By looking at product differences by regime or region, one can begin to infer how algorithm assumptions are influencing them. The largest relative differences are at the lowest AODs and are well correlated with lower boundary conditions. For DT/DB-MODIS versus VIIRS, they are seen at the obvious geographic boundaries between dark and bright surfaces, and in the case of MAIAC relative to traditional dark target they are seen at the land–sea boundary. As AODs increase, the gradients in AOD ratios between products decrease, in part due the diminishing influence of the lower boundary condition but also due to a reduction in coverage of areas with higher AODs. Nevertheless, regional deviations remain for high-AOD environments. For AODs higher than the regression range (i.e., ; ), deviations over regions still span ±40 % over large regions, with perhaps the strongest gradients along the western African and southwestern Asian Coast, with VIIRS having higher AODs550 over MODIS. Interestingly, mean deviations over the Siberian boreal region are opposite in sign to most of boreal Canada. Also notable are strong deviations (greater than a factor of 2 or even 5) over the high-latitude regimes, presumably due to cloud contamination. Likely the same can also be said about ice over the Arctic regions. At the individual pixel level for high-AOD regions, there is still a great deal of variability, most likely due individual sampling differences between products along plume edges. All of these are discussed by region in the following section.
To capture the differences in nature between the different regions, domains are intercompared in three figures. Figure 7 provides an area-averaged time series of Aqua Dark Target/Deep Blue, Aqua MAIAC, SNPP-VIIRS, and AERONET over the 2016–2019 study period. Figure 8 provides the corresponding scatter plots of the MODIS products and AERONET to the VIIRS product. Finally, Fig. 9 plots log probability of individual points that make up the regional averages used in Figs. 7 and 8. Even though AERONET's point nature results in limited coverage, its data are included in these plots to investigate local representativeness (as indicated in Fig. 1a). For better comparison to AERONET, this regional analysis will focus only on land data. In addition to these composite figures, scatter plots between products for each region are provided in Figs. S1–S9 in the Supplement. In the following section, we examine biomass burning (e.g., Fig. 7a–e), dust (e.g., Fig. 7f), and pollution-dominated and mixed environments (Fig. 7g–i).
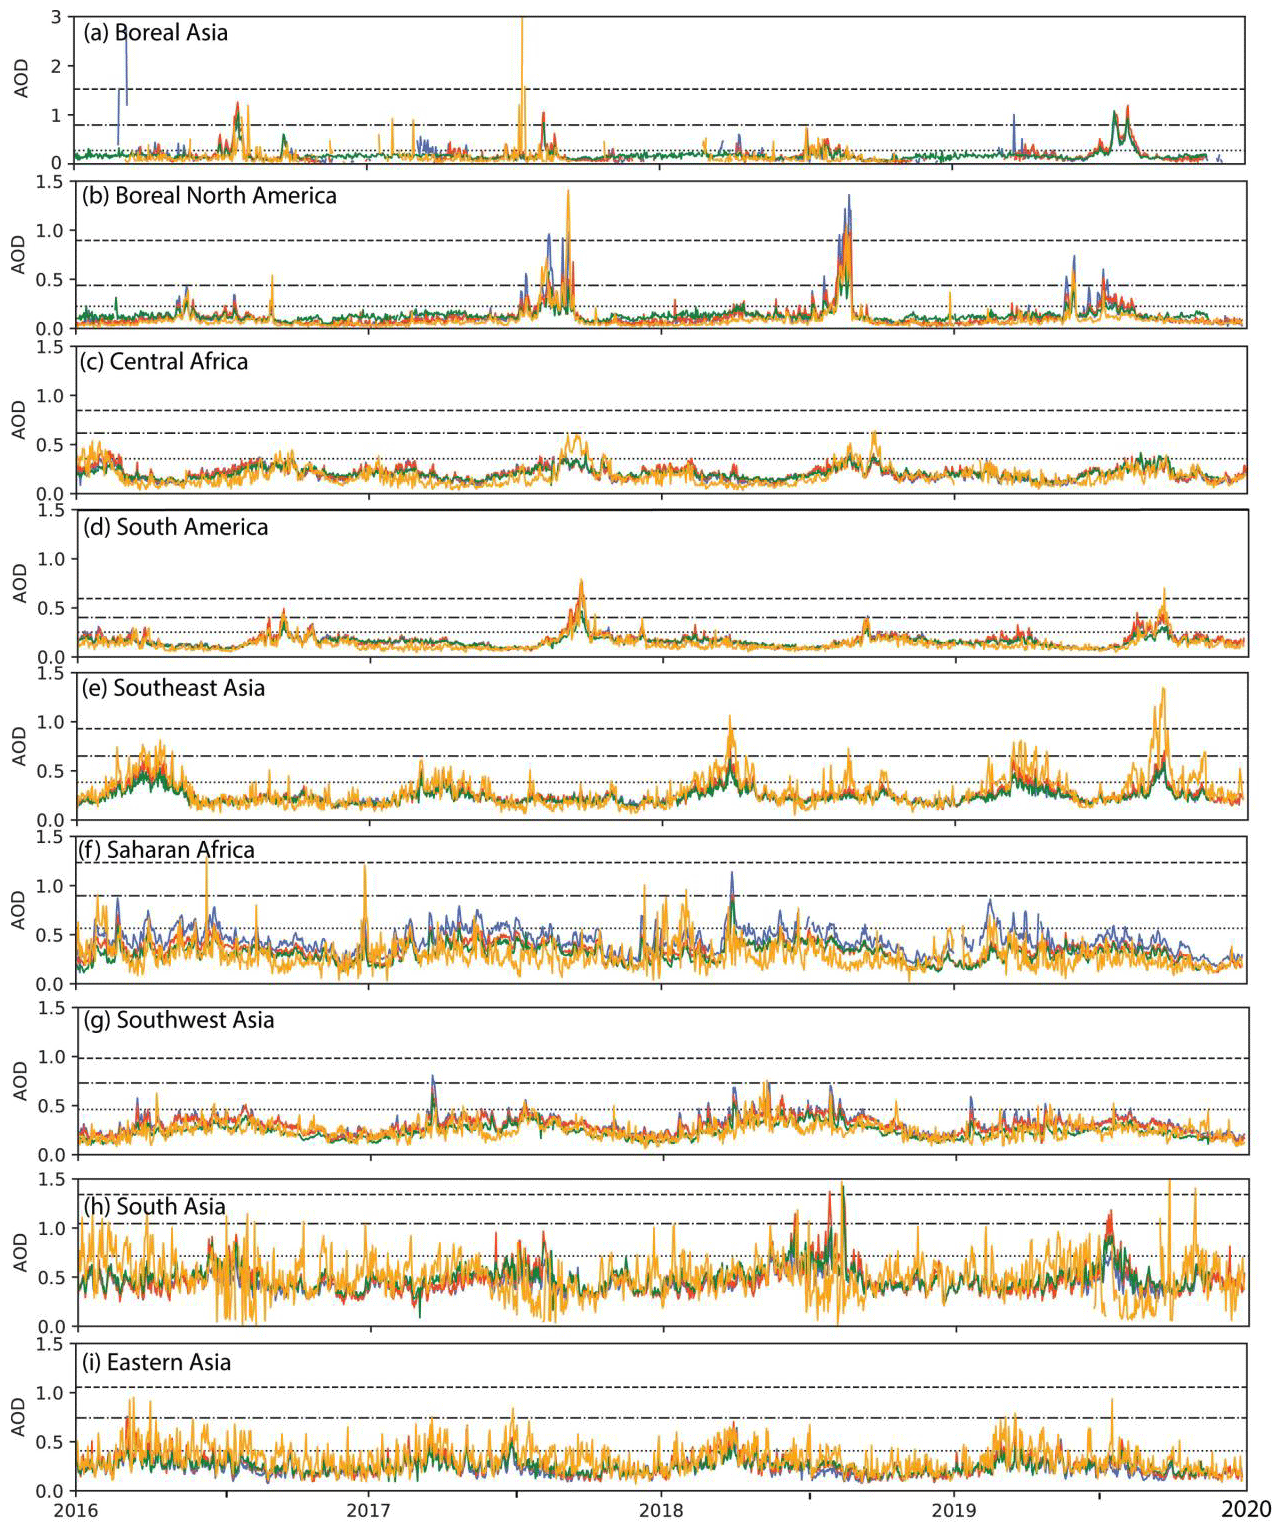
Figure 7Time series of daily mean AOD from 2016-2018 for the regions presented in Fig. 1. Retrievals include AERONET (orange), VIIRS AERDB (blue), MODIS DT/DB (red), and MODIS MAIAC (green). Total 84th percentile (dot), 95th percentile (dot dash), and 98th percentile (dash) values are also indicated for all datasets represented.
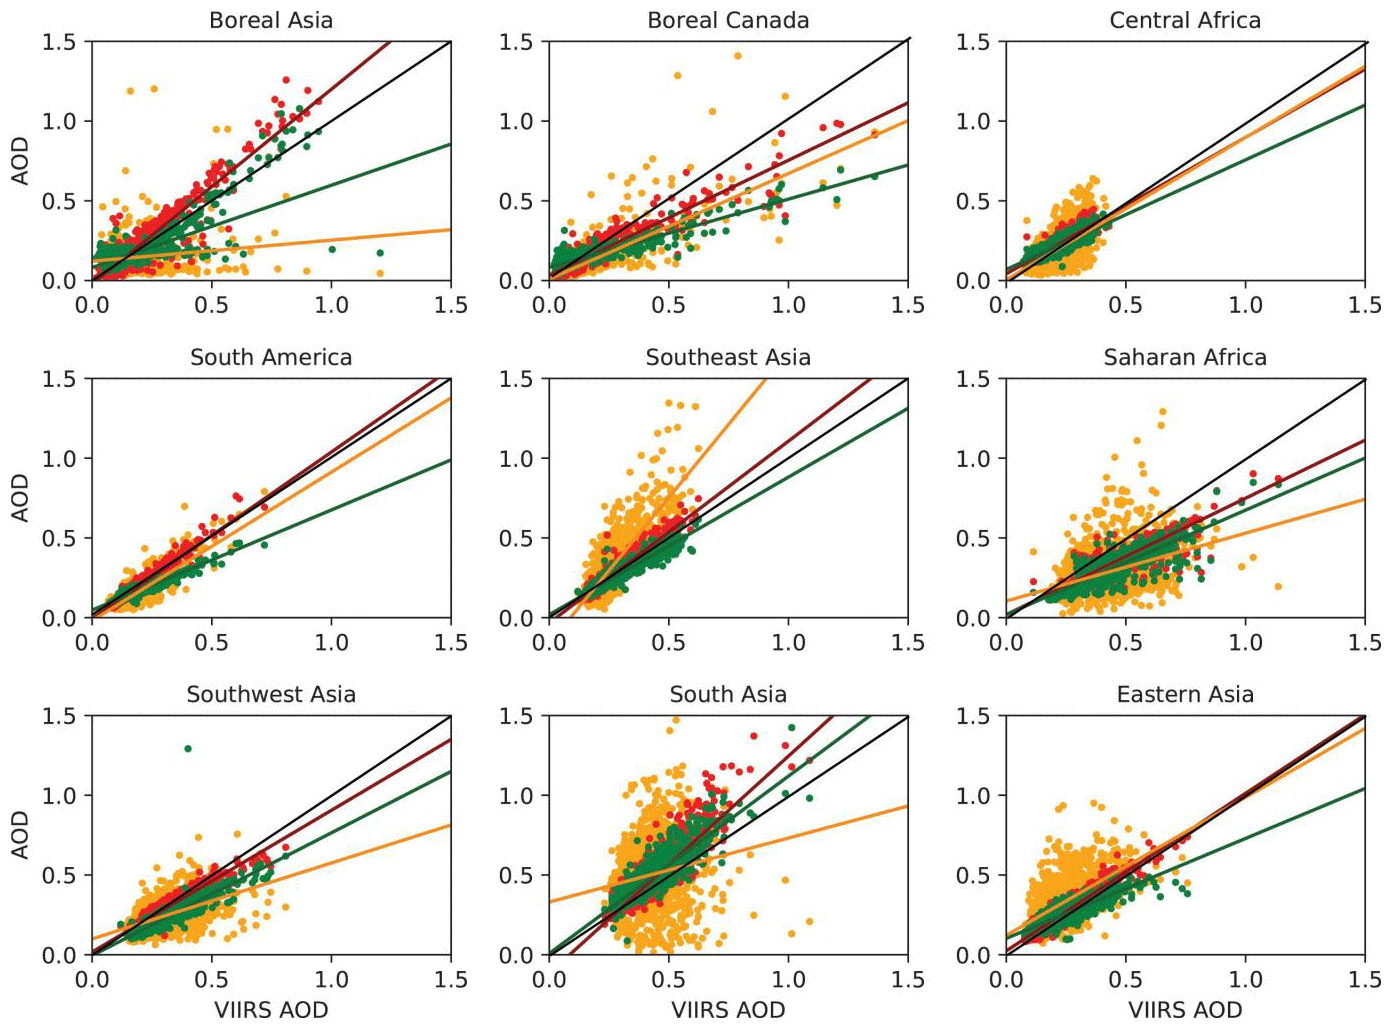
Figure 8Regional scatter plots of time series data presented in Fig. 7. Retrievals include AERONET (orange), MODIS DT/DB (red), and MODIS MAIAC (green). Also shown is the 1:1 line (black).
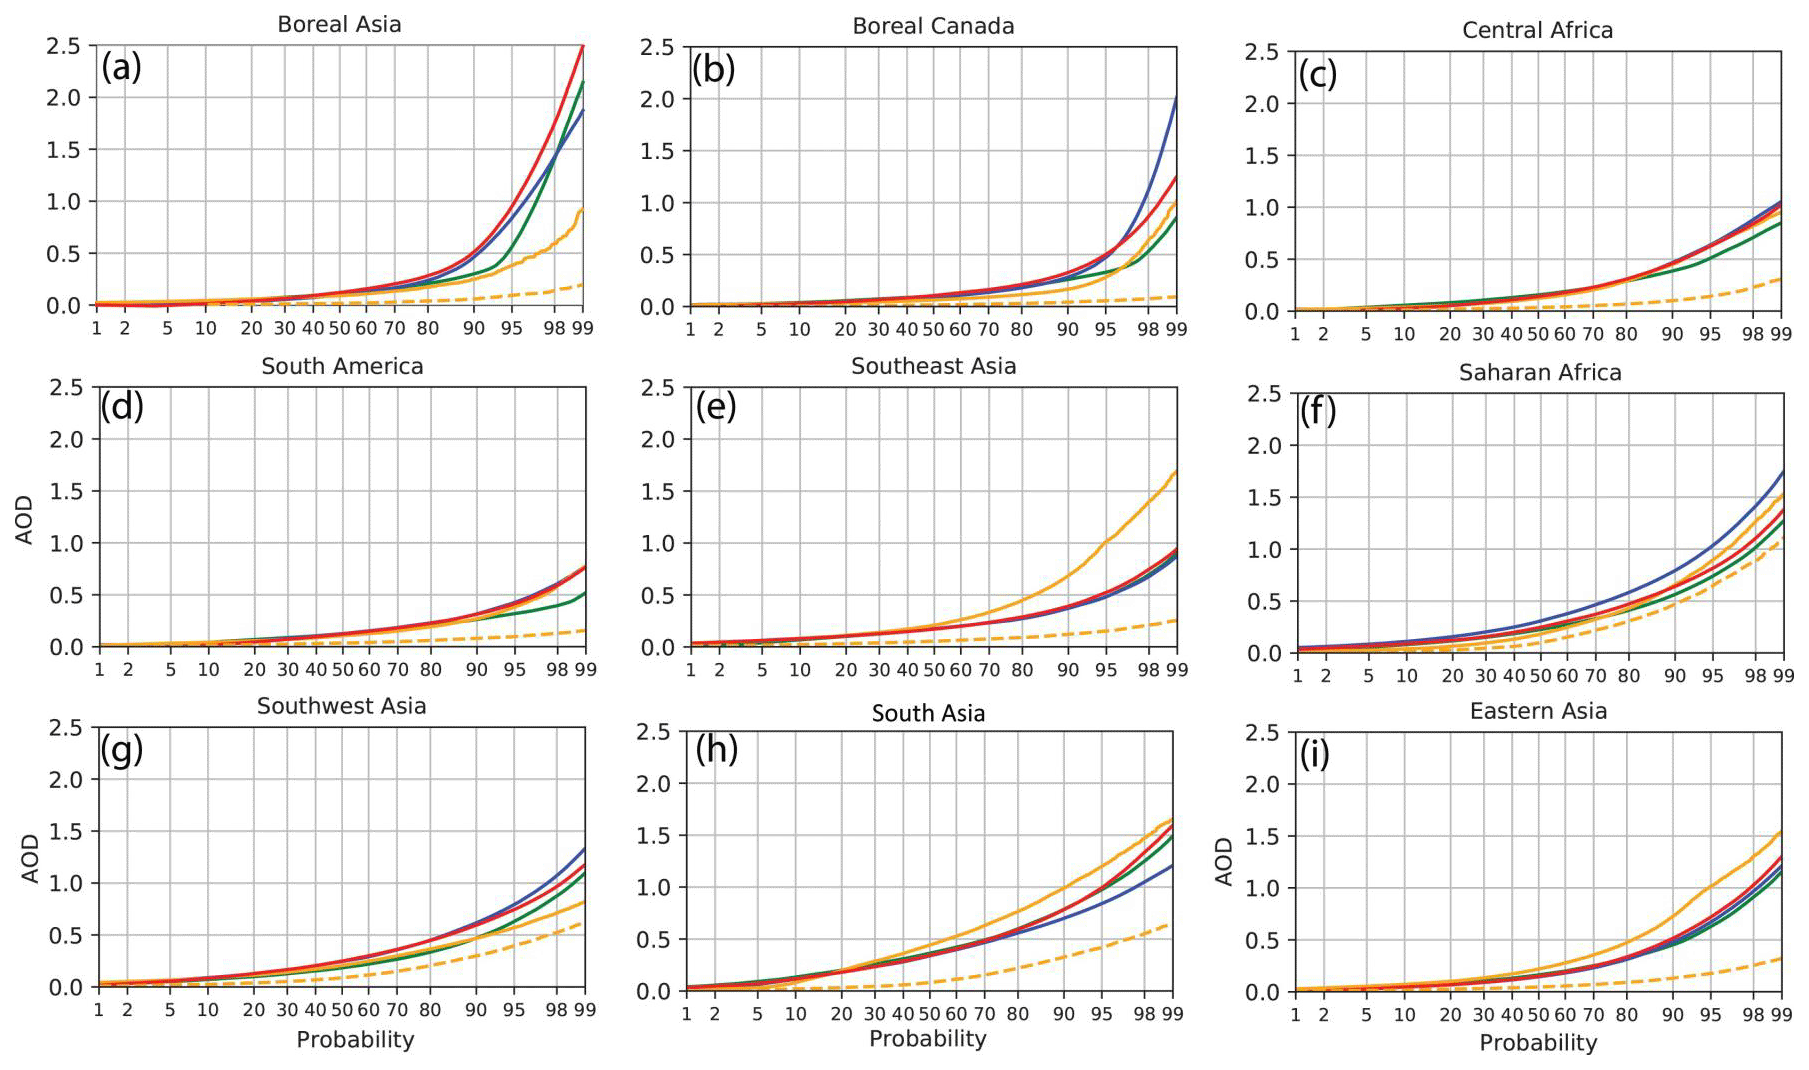
Figure 9Log probability plots of 550 nm AOD taken from the samples within the regions defined in Fig. 1. Retrievals include AERONET (orange), VIIRS AERDB (blue), MODIS DT/DB (red), and MODIS MAIAC (green). SDA-derived coarse-mode AOD from AERONET is also provided (dashed orange).
5.1 Biomass-burning-dominated regimes
While Figs. 2 and 3 demonstrate that biomass burning is second to dust for median or even 84th percentile AOD550, any picture of a significant biomass burning event shows plumes that have some of the very highest AODs on the planet that even locally rival clouds. Even regionally, smoke AODs from fire complexes can be extreme. Peat burning in Indonesia can generate AOD550 values that can only be estimated by AERONET's near-infrared wavelengths, indicating mid-visible AOD >10 (Eck et al., 2019; Shi et al., 2019). Likewise, AERONET data corroborate dramatic photographs of the San Francisco Bay Area during the September 2020 fire season (outside the period of study) where conditions led to twilight conditions at solar noon (https://theglobalherald.com/news/wildfires-on-us-west-coast-turn-day-into-night-dw-news/, last access: 10 August 2021). It is this extreme behavior of smoke emissions that makes the quantitative monitoring of biomass burning by satellites so challenging.
5.1.1 Boreal regions: continental and intercontinental scales
Boreal Asia and Canada (Figs. 7/8/9a and b, respectively) are excellent examples of regions exhibiting extremely dispersive AOD550 distributions, with low median values but occasional severe continental- to intercontinental-scale wildfire smoke events. As shown below, this aerosol domain is perhaps the most difficult to assesses. Nevertheless, within the regional spatial average domains, all three satellite algorithms tracked one another well, even with very sharp peak days without the gradual seasonality seen in other regions (Fig. 8a and b). With only three AERONET sites in boreal Asia, there are periodic spikes due to the proximity of fires to instruments. In comparison, the higher number of AERONET sites in North America shows more convergence between satellite and sun photometers. From a probability distribution point of view (Fig. 9), boreal Asia clearly has the highest prevalence of detected high-AOD events globally, ranging from 1.7 to 2.5 at the 99th percentile level, with boreal North America showing more dispersion between products with 99th percentile AODs, ranging from 0.8 to 2. Not surprisingly, AERONET demonstrates that high AODs are almost always associated with the fine mode. This being said, high-latitude dust does exist from isolated sources or transport (Bullard et al., 2016). However, such events are unlikely to be detected by isolated AERONET sites or identified as being dominated by coarse mode by the satellite products examined here.
The statistics in Figs. 7 and 8 are consistent with Fig. 6; pairwise deviations between products switch in sign between the Asian and North American domains. Indeed, Figs. 9 and S1 and S2 show that DT/DB and MAIAC provide 20 % lower values than VIIRS for boreal Asia. However, for boreal Canada, the MODIS values are greater than VIIRS by more than 50 %. However, for these two regions, the differences between the satellite products are much smaller than the differences between the satellite products and the AERONET data used for verification. Given there are so few AERONET verification points for high AOD and multiple populations visible between copious satellite data populations, one cannot say definitively which product is most “correct.” Assumptions on an individual retrieval's overland size and optical properties (most notably absorption as AOD increases) coupled with multiple scattering are expected to result in spatially correlated differences between products. Indeed, mid-visible single scattering albedo can vary considerably by individual fire and age, ranging from 0.9 to 0.99 (Reid et al., 2005; Eck et al., 2009; Nikonovas et al., 2015).
The extreme behavior of fires in boreal and temperate forested domains provide cautionary examples of sampling and regional averaging. For this study, the most significant boreal smoke outbreak was observed over the North American boreal region domain in early July 2018 (Fig. 7b), for which all products reported smoke AODs over 1. Meanwhile boreal Asia showed modest fire activity with AODs <0.5. However, this North American event was Siberian in origin. Significant thermal hotspot anomalies and smoke build up over the Siberian boreal area started in earnest around 26 June 2018 associated with convection and consistent with lightning. By 1 July, AOD was well above 1 along a 2000 km band over Siberia (Fig. 10a). By 5 July, smoke was advected northeastward into the polar regions along with significant cloud cover masking it from quantification.
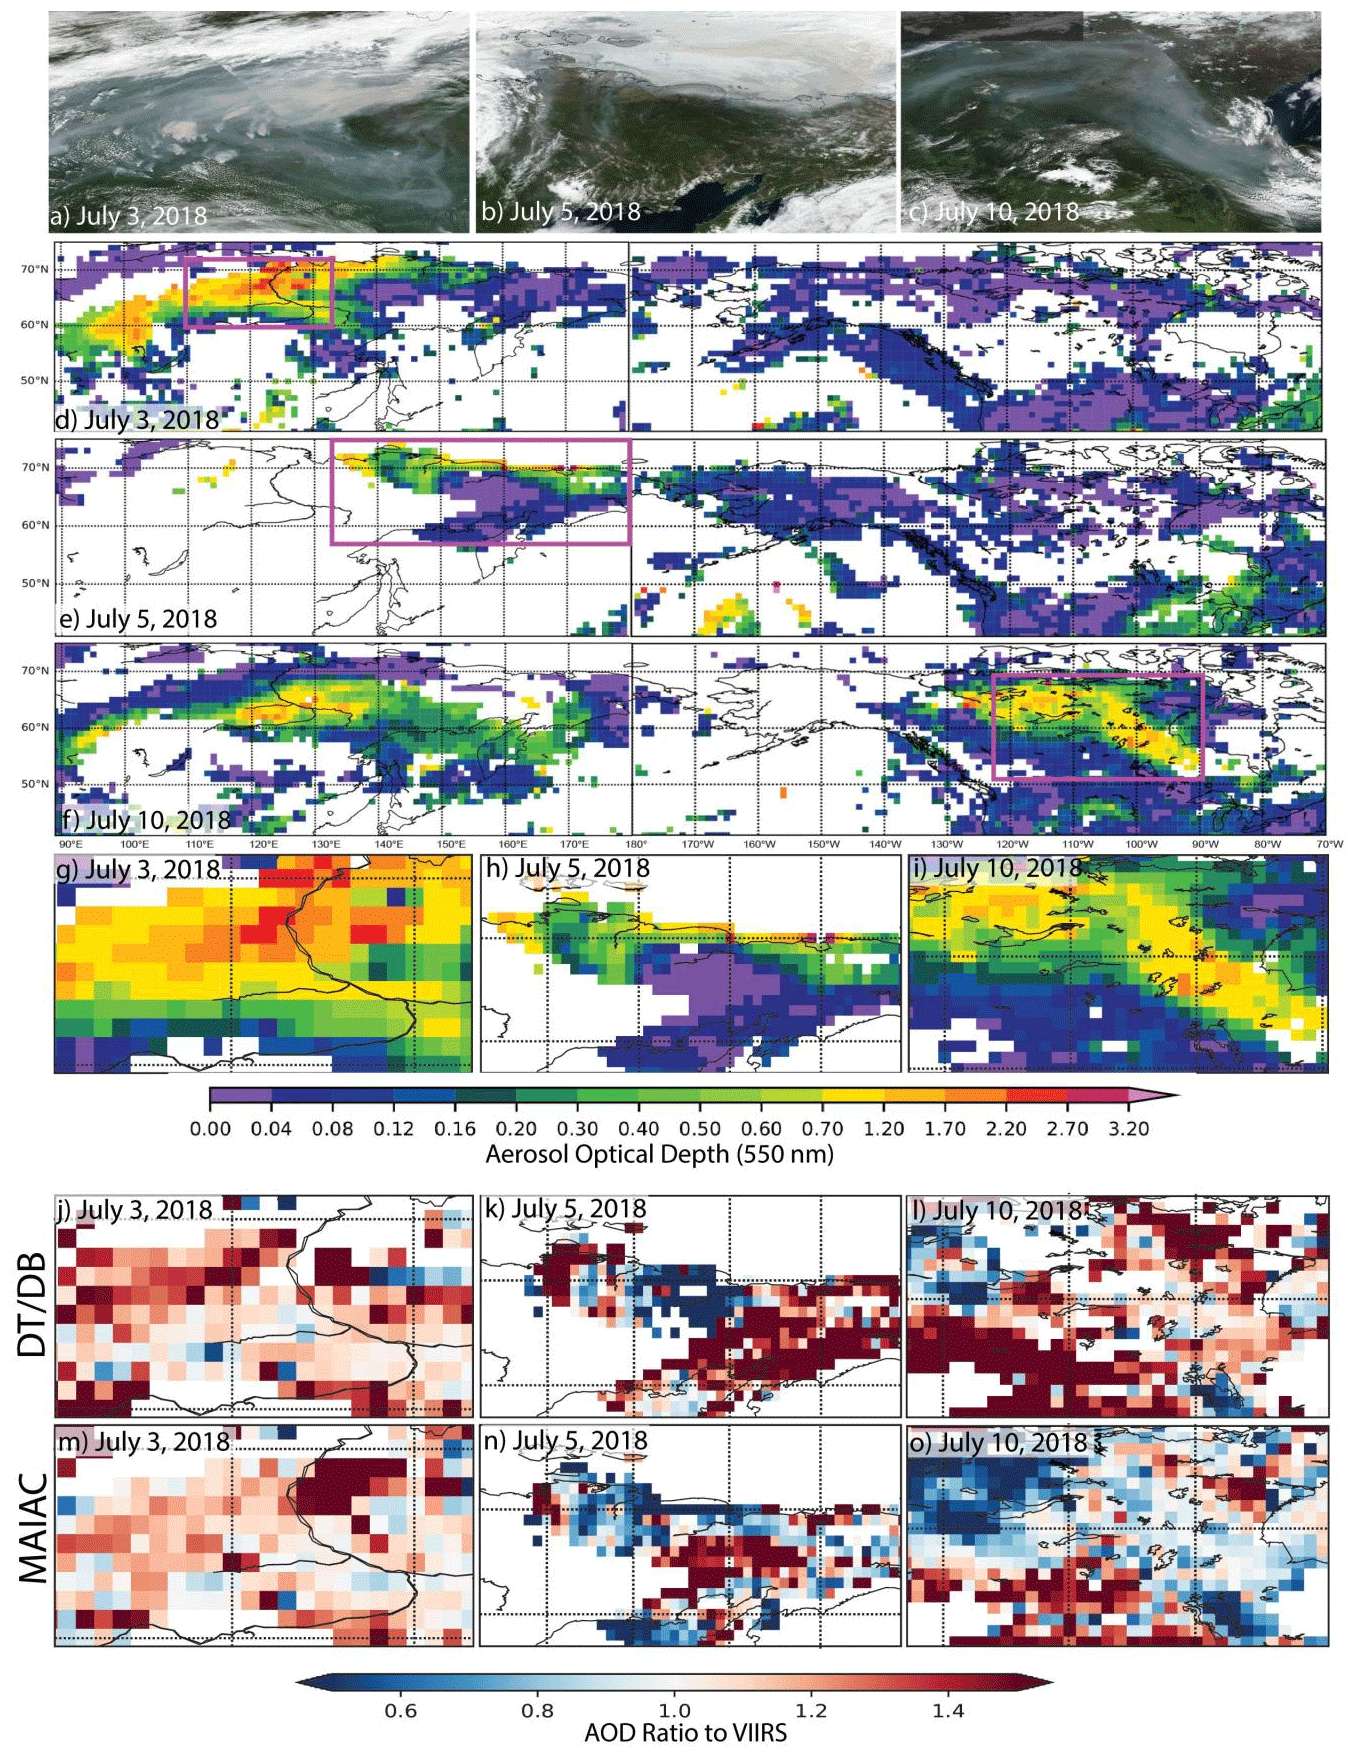
Figure 10A case of Siberian smoke transport from Asia to North America for early 2018. (a–c) Corresponding RGB images of plume evolution for 3, 5, and 10 July 2018, respectively. (d–f) Corresponding VIIRS AOD550 for Asia through North America. The magenta box corresponds to the images in panels (a)–(c) that is zoomed in on in panels (g)–(i). Panels (j–l) and (m–o) show ratios of DT/DB and MAIAC to VIIRS, respectively. Satellite RGB imagery is from NASA Worldview.
This smoke outbreak was colocated with significant cloudiness, and the retrieved AODs are likely biased high. Much of the smoke plume that is cloud free has failed retrievals Fig. 10b. By 9 July, the smoke is adverted southeastward into Canada, again with relatively few observations relative to the 2000 km size of the plume Fig. 10c. Thus, these aerosol events, perhaps the largest by AOD and size, are a significant challenge to track and apportion by standard satellite products alone.
A second difficulty is that for boreal Asia significant AOD events are not just associated with biomass burning. As a second example, strong regional AOD550 values were logged 6 March 2016 (Fig. 11a) for both DT/DB and VIIRS, appearing to be the fringes of a dust storm. Closer manual inspection of these cases showed that they were nearly entirely covered by snow and clouds (Fig. 11a). However, there were just a few retrievals solely associated with a significant Asian dust event along the southern edge of the domain dominating the area average. Such events are exceptional but obviously not impossible. Given that imager retrievals lack information content for fine–coarse partition, aerosol sources can easily be confused. Indeed, numerous thermal anomalies are observed in the region (Fig. 11a), but they are persistent and likely from petrochemical flaring enhanced by the cold background. Such differences between products may become more significant as developers create different cloud- and snow-screening techniques. In light of what is presented here, the observed integer factors in regional bias between products due to sampling and interpretation alone is not unreasonable, although the exact source of the error will require further study.
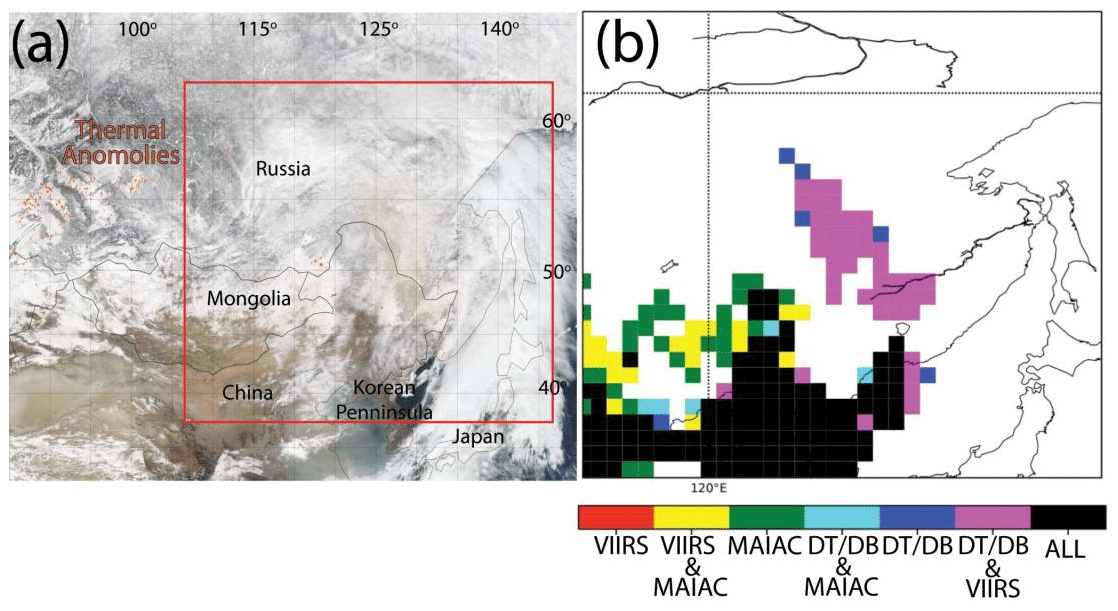
Figure 11Case study of a springtime dust intrusion from China into the Siberian domain on 6 March 2016. Included are (a) an RGB image of dust transport and MODIS thermal anomalies and (b) a map showing where retrievals are available. Satellite RGB imagery is from NASA Worldview.
5.1.2 Central Africa and South America: variability within large-scale plumes
In comparison to the extreme behavior of boreal biomass burning regions, the tropical to subtropical central African and South American biomass burning regions have more manageable seasonal biomass burning signals, dominated by the August to October period (Fig. 7c and d, respectively). Instead of isolated mega-fires with exceptional transport phenomenon, smoke is generated from numerous small grass and deforestation burns that merge into regional plumes embedded in more subdued meteorological regime (Reid et al., 2009). These regions also have significantly higher AERONET site prevalence compared to the boreal region, allowing for more assessment opportunities (Figs. 1, 8, S3 and S4). Over these domains, satellite products and AERONET track well (Fig. 7), and with the exception of a slight discrepancy for MAIAC probability distributions, overlay each other almost exactly (Fig. 9). Over Central Africa satellite products generally show low scatter between each other, although in pairwise comparisons to AERONET they all show a distinct low bias (Fig. S3). Being the world's largest biomass burning source (Mu et al., 2011), Central Africa has a smaller range of regional optical depth than other biomass burning regions. South America in contrast, has even better pairwise consistency between products (Fig. S4) but MAIAC and VIIRS have lower values relative to DT/DB.
While bulk comparisons suggest overall agreement between products, it is of concern that pairwise model biases do not always manifest themselves in comparisons to the prevalent AERONET sites in the region despite their broad plume features. Further, regionally prescribed ωo and differences in over-water retrievals result in sharp discontinuities in inter-product bias (Figs. 5 and 6). For Africa, a well-established seasonal cycle in ωo starting at ∼0.84 in the early season due to a high prevalence of grass fires and increasing in time to 0.93 with increased forest fuels until the end of the season manifests itself in a seasonal cycle in MODIS bias (Eck et al., 2013).
Figure 12 provides plots of 9 September 2018 as an example day of inter-product differences, including (a) an Aqua MODIS RGB; (b) a coverage diagram; (c), (d), (e) DT/DB, MAIAC, and VIIRS AOD, respectively, with AERONET AODs overlaid; and (f), (g), (h) inter-product ratios of DT/DB to VIIRS, MAIAC to VIIRS, and MAIAC to DT/DB, respectively. This example was picked as a typical day, but with an Aqua orbit gap in the middle to allow for examination of extreme differences in scattering angles. At first glance, AOD patterns do match well overall, but there are some spatially correlated regions of difference. These are highlighted in the ratio plots. Notable differences include (1) magnitude, with the largest ratios not being associated with higher AODs but with lower AODs. (2) All three products compare well to AERONET on the eastern portion, but there is low bias in the west, possibly due to differences in smoke optical properties (worthy of future study). The next version of VIIRS V2.0 has been described as improved by its developers. (3) There is a sharp coastal delineation in AODs across the AOD values matching the nearshore AERONET sites. (4) DT/DB relative to VIIRS has a high bias of up to 30 % along the edge of swath views. (5) DT/DB also has varying biases relative to VIIRS offshore of the eastern coast, with higher values in the north with low AOD, a good match west of Madagascar for moderate AODs, and a slightly high bias south of Madagascar. MAIAC yields higher values than the others to the north and lower values to the south. (6) MAIAC has rectangular regions of bias that are quite distinct from both DT/DB and VIIRS. This is likely due to the tile processing nature of MAIAC.
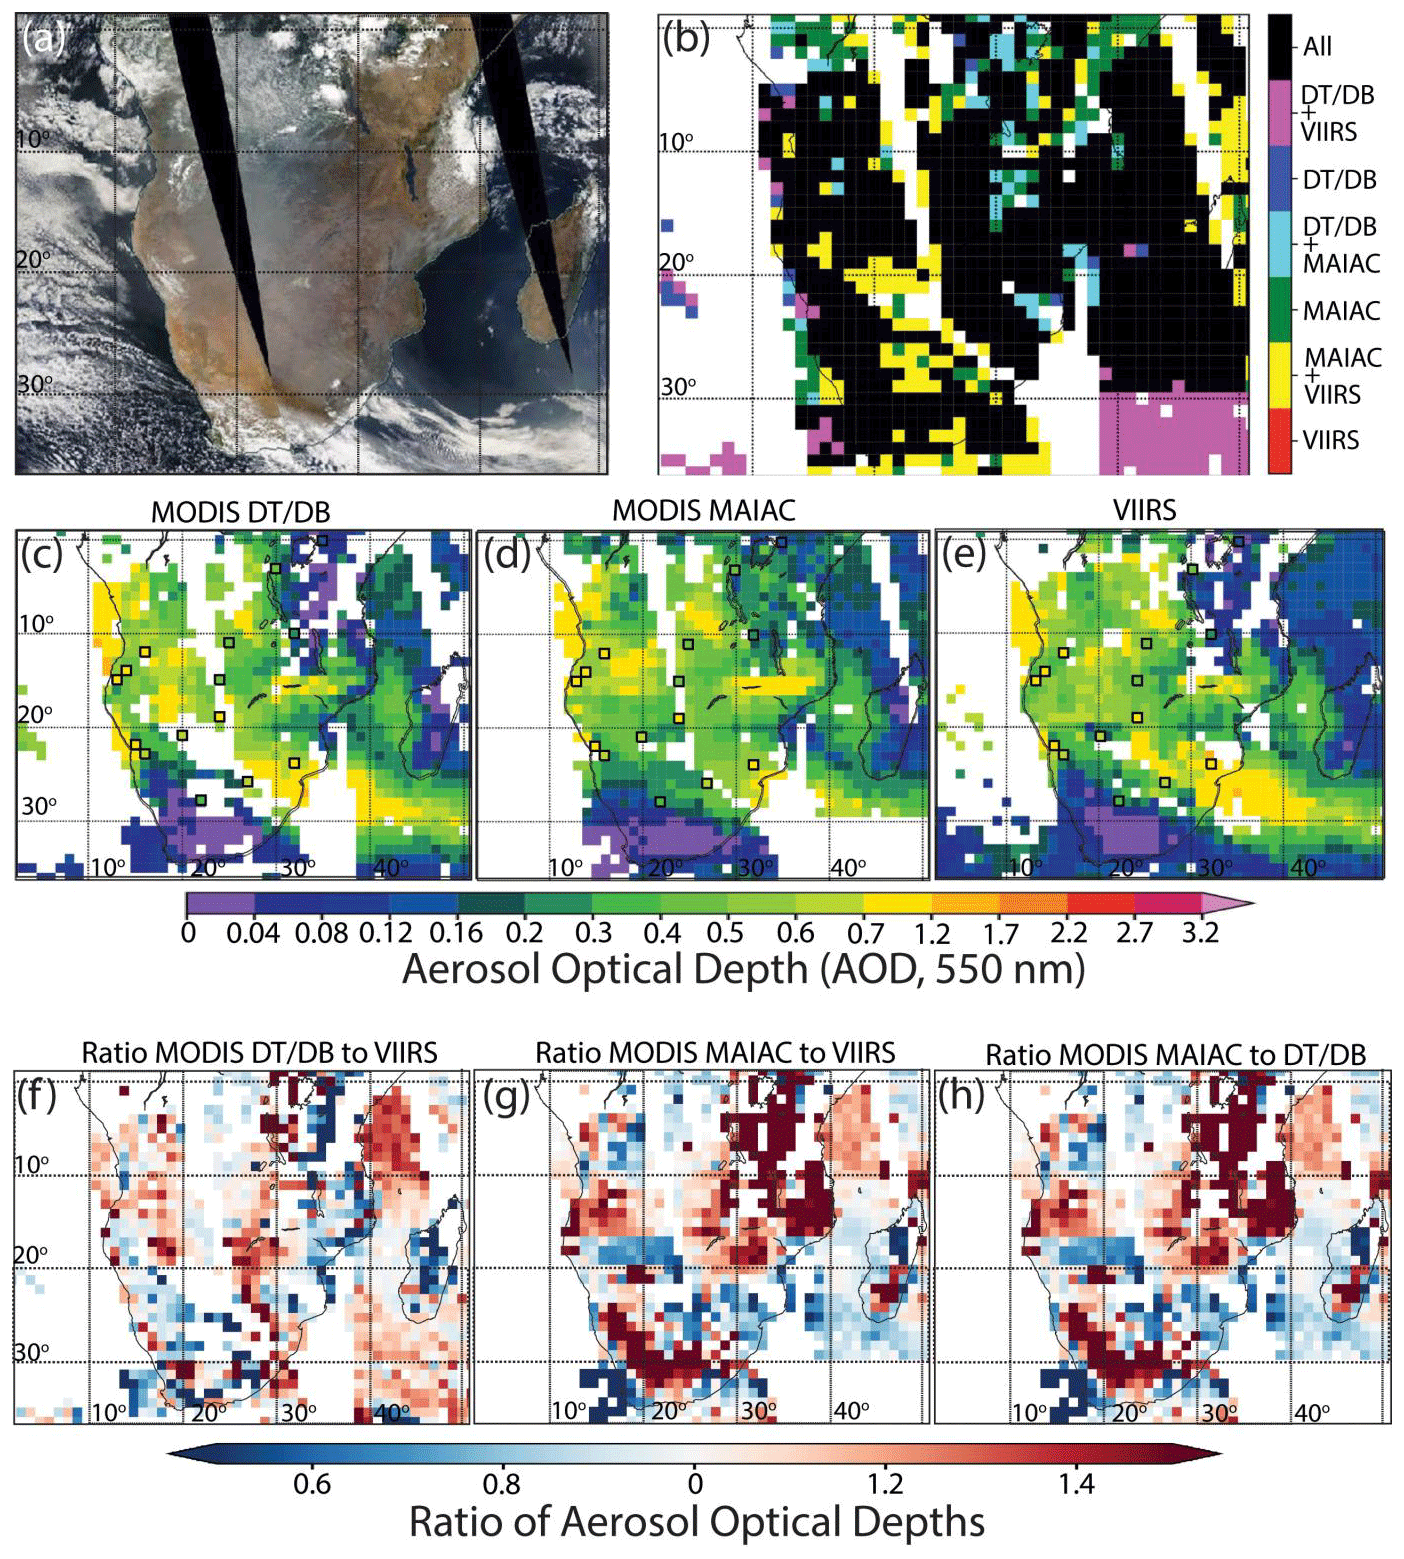
Figure 12Intercomparison of aerosol retrievals for southern Africa for 19 September 2018: (a) Aqua RGB image; (b) locations where retrievals are available; (c–e) MODIS DT/DB, MODIS MAIC, and VIIRS AOD550 retrievals, with AERONET AOD550s in boxes; and (f–h) ratios of retrieved AOD550 to each source. Satellite RGB imagery is from NASA Worldview.
Resolving all of these issues is far outside the scope of this study. But the conclusion here is that it is clear that on a daily basis that significant spatially correlated biases exist between products based on a host of sources even if on a larger scale they converge to similar average values. This finding requires consideration when the data products are used for high-fidelity data assimilation and inverse modeling applications.
5.1.3 Southeast Asia: exceptional AODs
Southeast Asia has two biomass burning seasons: (1) boreal spring agriculture, deforestation, and wildfires in the mainland Southeast Asian countries of Myanmar, Thailand, Cambodia, and Laos and (2) boreal summer and early fall agriculture, deforestation, and peat fires for the maritime Southeast Asian countries of Indonesia and Malaysia (Reid et al., 2012). Mainland Southeast Asia tends to have more consistent seasonal behavior with periodic enhancements (Reid et al., 2013), similar to the African and South American regions. Maritime Southeast Asia, however, has strong variations due to the El Niño–Southern Oscillation (ENSO; Nichol, 1998; Field et al., 2016) and a host of inter-seasonal meteorological dependencies such as the Madden–Julian Oscillation and the boreal summer intraseasonal oscillation (Reid et al., 2012). AODs can be exceptionally high for weeks at a time, so that sun photometers have insufficient solar signal even for wavelengths as long as 870 nm (Eck et al., 2019). Given its high regional cloud cover, extremes in AOD, and variable aerosol optical properties, maritime Southeast Asia is exceptionally poor at sampling these extreme conditions (Reid et al., 2013). Yet, all three satellite products track each other exceptionally well when characterizing regional average (Figs. 7and 8) and show similar probability functions (Fig. 9). Even scatter plots between products show good comparisons (Fig. S5).
Despite the excellent overall comparability, satellite products under-sample extreme events observed by AERONET. Indeed, 99th percentile AOD for the satellite products are only 60 % of the AERONET values (0.95 versus 1.6). This behavior has already been well documented by Reid et al. (2013) and Eck et al. (2019) for drought periods induced by El Niño. Now with version 3 of AERONET, it can infer AOD550>5 by inferring from the 1020 nm channel. For example, the year 2019 in our study period had exceptional biomass burning AOD. Figure 13 provides a time series of 550 nm AOD from AERONET at three sites on Borneo: (a) Palangkaraya (2.3∘ S, 113.9∘ E), in the heart of biomass burning activity in southern Kalimantan Indonesia with maximum measured AODs; (b) Pontianak (0.1∘ N, 109.2∘ E), on the shore of western Kalimantan as smoke exits to the Java Sea; and (c) Kuching (1.5∘ N, 110.3∘ E) on the southern border of Sarawak, Malaysia, as smoke exits into the South China Sea. Over southern Kalimantan in the heart of the source region, we find the greatest discrepancies between products. For the whole month of August, AODs from the satellite products significantly underestimate smoke levels. By mid-September, when smoke loadings are at a maximum, the sun photometer is attenuated, and AODs over 4 can only be estimated by using near-infrared wavelengths. Given saturation, estimates shown in Fig. 13 are not even included in the probability distributions shown earlier in this paper. Owing to its higher resolution, MAIAC has additional coverage compared to the other products. By the end of the season when AODs diminish, AERONET and satellite products reconcile. Along the coast at Pontianak, products compare well between themselves and AERONET, which we hypothesize is due in part to smoke homogenization from many plumes into a single high-AOD region. However, the highest AODs are still understandably missed. At Kuching, smoke AODs are even lower, and all products compare well.
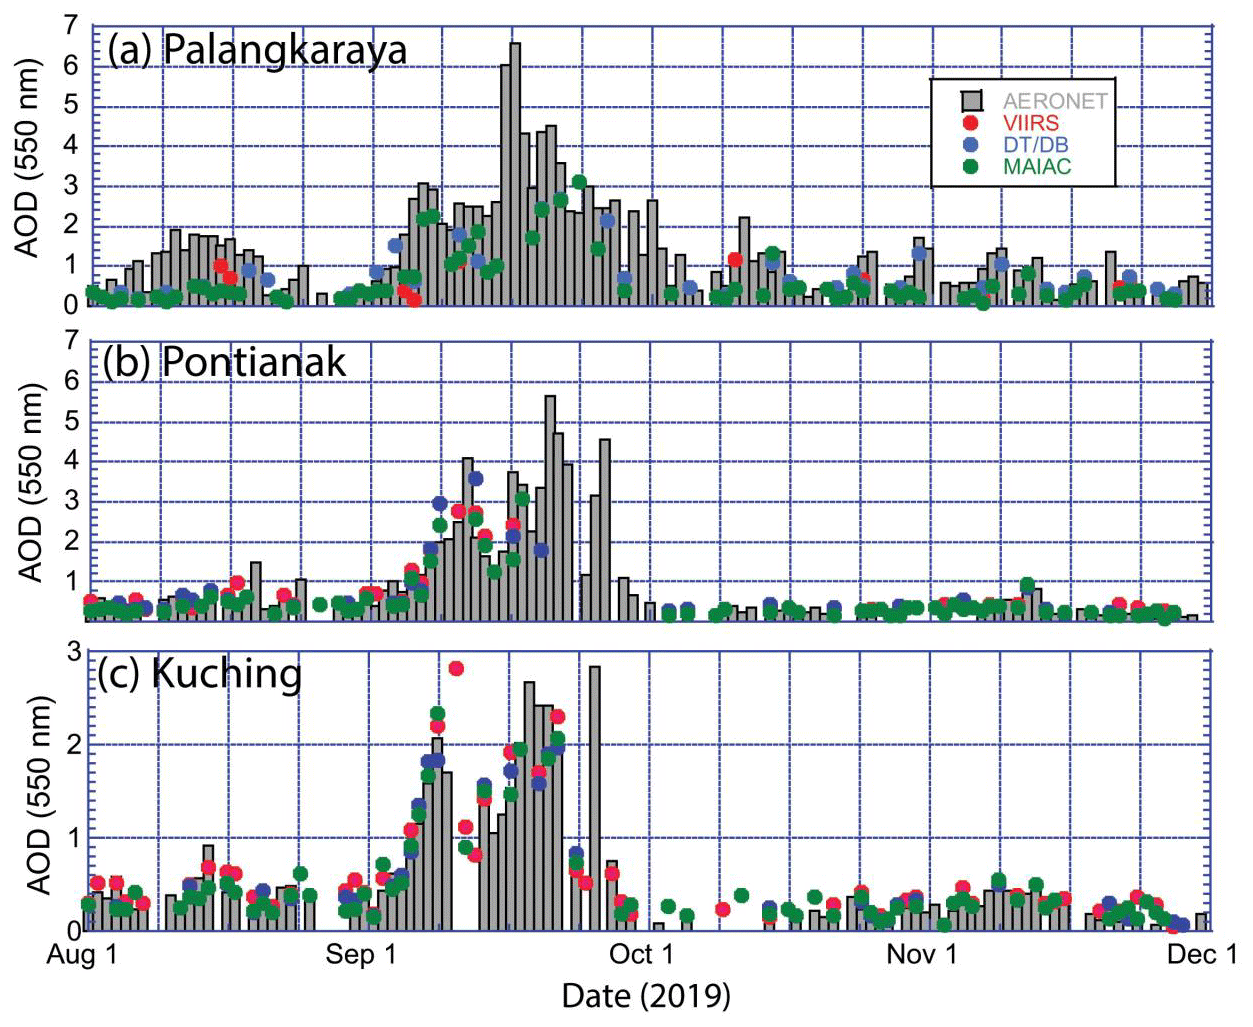
Figure 13Time series of satellite product AOD to AERONET for three sites on Borneo for the 2019 biomass burning season (a) Palangkaraya, southern Kalimantan, Indonesia; (b) Pontianak, western Kalimantan, Indonesia; (c) Kuching, southern Sarawak, Malaysia.
An example day is provided in Fig. 14 in a manner similar to Fig. 12 for Central Africa, with RGB, coverage, AOD, and ratio plot panels. The difference between this case and Africa is striking. Whereas Africa showed good coverage across all products, Borneo shows slight changes in AOD and cloud mask thresholds and increased VIIRS coverage which results in more variable retrieval coverage. All products miss the center of Kalimantan, due to extreme aerosol conditions. Along the border of the plume, ratios between products can be extreme depending on the individual retrievals that make up the aggregates. The conclusion in this case is that all retrievals have some physical limits. To cope when AODs are this exceptional, new techniques need to be developed for measurement, aggregation, and assimilation.
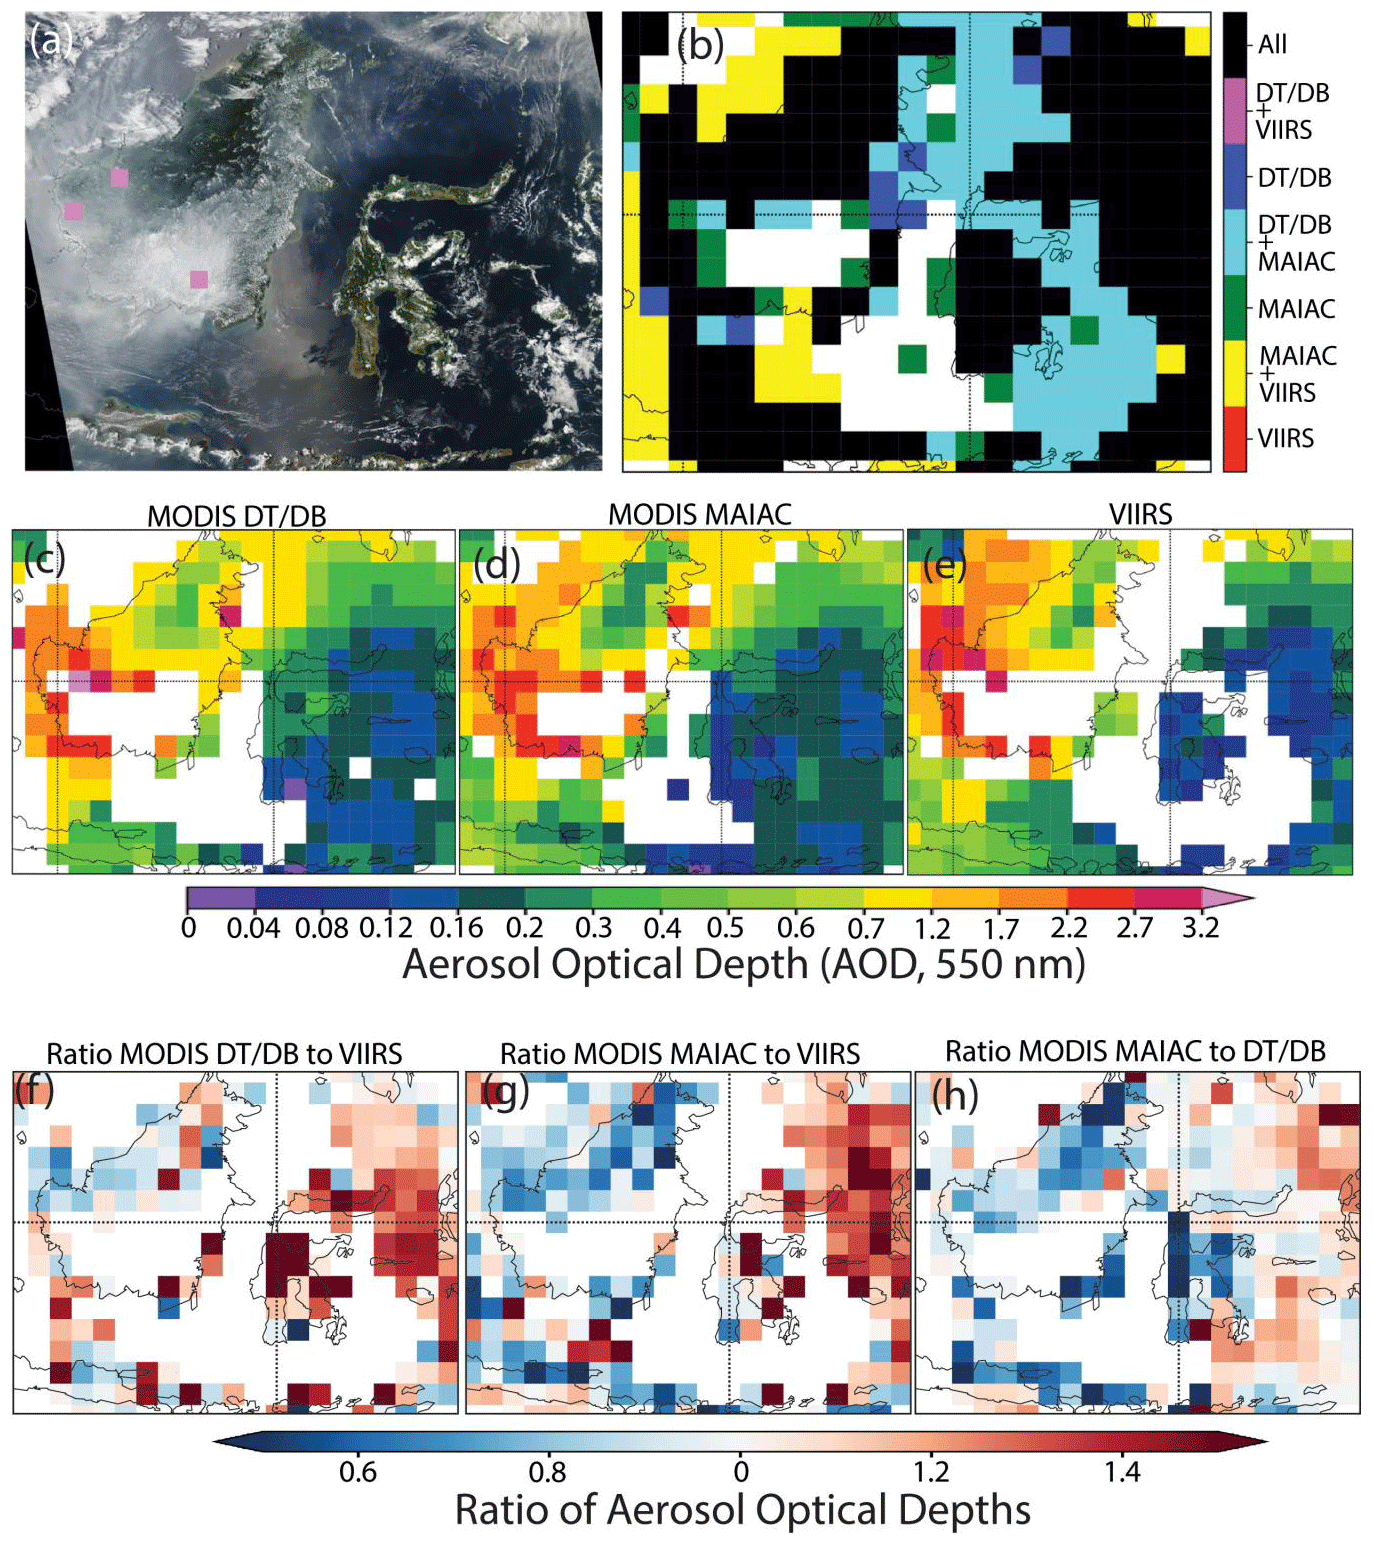
Figure 14A Borneo image and AOD analysis for 16 September 2019. Included is (a) corresponding Aqua MODIS RGB image, (b) coverage coincidence map, (c) MODIS DT/DB AOD, (d) MODIS MAIAC AOD, and (e) VIIRS DB AOD. Also shown are the ratios between products, including (f) MODIS DT/DB : VIIRS DB, (g) MODIS MAIAC : VIIRS DB, and (h) MODIS MAIAC : MODIS DB. Satellite RGB imagery is from NASA Worldview.
5.2 Dust-dominated Saharan domain: bright surfaces and dust microphysics
The North African or Saharan region is the only subcontinental domain that can be said to be fully dominated by dust. With median AODs on the order of ∼0.3 and 98th percentile values of 1 to 1.5 by product, the Sahara is the largest contiguous aerosol feature on Earth. Visible in Fig. 7 is the Sahara's dynamic nature, with frequent region-wide spikes in AOD550. While the dust season is often envisioned as being comprised of massive boreal summer Saharan Air Layer outbreaks traversing across the subtropical Atlantic into the Americas, major events can occur any time of year with only a minor boreal winter minimum.
Generally, regional dust products are comparable for regional average (Figs. 7, 8) and probability density (Fig. 9). Even from a bulk point-by-point comparison (Fig. S6), the products correlate well to themselves and with the few AERONET sites in the region. VIIRS AERDB tends to be consistently higher than its MODIS counterparts by up to 30 %–50 %, most likely due to assumptions in dust optical properties and perhaps some improvements in cloud–dust discrimination. In contrast, MODIS MAIAC shows the lowest daily average of AOD550, which is a difference that persists throughout the analysis of severe events. The AERONET values are less correlated with the satellite observations, likely a result of the sparse sampling in this region. However, close examination of these plots (most notably Fig. S6) in combination with Fig. 5 shows there are multiple data populations embedded into the whole, with regions of significant decorrelation and bias. Areas of particular decorrelation are coincident with areas that are dominated by evaporates (i.e., low Fe absorption), such as the Tenere Desert and Bodele Depression of Chad; the Qattara Depression of Libya and Egypt; and the western Saharan areas of Mali, Mauritania, and Morocco (Goudie et al., 2002; Perlwitz et al., 2015).
The spatially correlated nature of bias between products is provided as an example in Fig. 15 for 6 June 2017. Given the bright surfaces of deserts, dust may not be visually obvious (Fig. 15a). However, there is minimal cloud cover, and excellent satellite coverage is available (Fig. 15b). All three products show the same overall dust features with multiple dust plumes (Fig. 15c–e). However, by ratio, significant patterns emerge (Fig. 15f–h), sometimes with opposite signs in bias for adjacent plume features (e.g., in western Africa), along straight lines due to regional boxes used in the retrieval, along coastlines, and on either side of an orbit where scattering angles abruptly change.
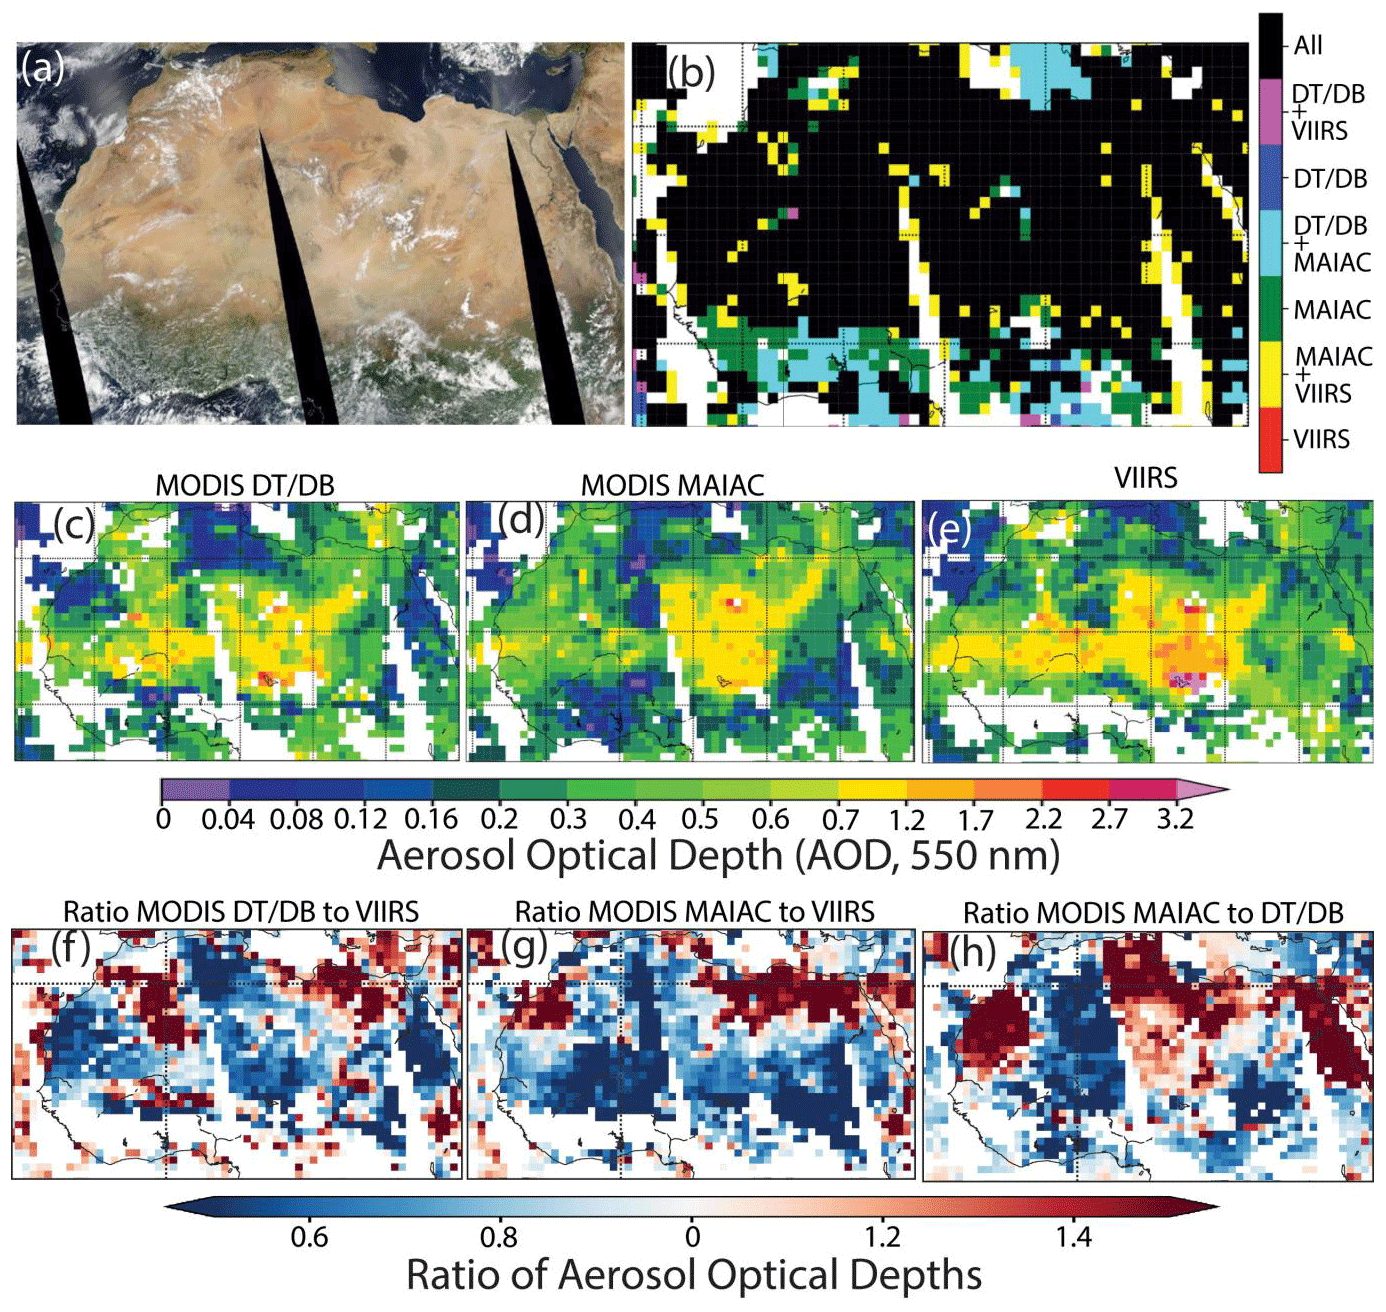
Figure 15A pan-Saharan image and AOD analysis for 8 June 2017. Included is the (a) corresponding Aqua MODIS RGB image, (b) coverage coincidence map, (c) MODIS DT/DB AOD, (d) MODIS MAIAC AOD, and (e) VIIRS DB AOD. Also shown are the ratios between products, including (f) MODIS DT/DB : VIIRS DB, (g) MODIS MAIAC:VIIRS DB, and (h) MODIS MAIAC : MODIS DT/DB. Satellite RGB imagery is from NASA Worldview.
Of all the cases shown in Sect. 5, Fig. 15 best demonstrates the challenges of assimilating or performing source function inversions. Because data assimilation must account for observation localization and there are so few temporal observation opportunities to begin with, differences such as these result in a smeared source area (Khade et al., 2012). Further, since there are so few AERONET sites available and day-to-day changes in solar geometries, these differences are difficult to deconvolve.
5.3 Mixed pollution–dust domains of Asia
It so happens that some of the regions with the strongest pollution emissions are also influenced by dust transport. Indeed, the coastal arc extending from the Arabian Sea through India and up to eastern Asia hosts some of the most heterogeneous “mixed” aerosol environments in the world. Figure 9 shows that southwestern Asia and southern Asia have coarse-mode AODs on the order of 50 % of the total value out past the 99th percentile. East Asia, known for its significant haze dominated by the fine mode, nevertheless is frequently impacted by dust storms from areas of central Asia, such as the Taklamakan and Gobi deserts. The main dust events (high AOD events) in East Asia occur in spring (March–May), but background dust levels persist throughout most of the year. Like the Sahara, correlations and biases across the southwestern to eastern Asian arc have strong spatial variability (Figs. 5, 6). Correlations are best for northern mainland Southeast Asia due to it having dark, vegetated surfaces and sufficiently large biomass burning sources. The areas with the lowest agreement include bright deserts, especially areas with aerosols that have low values of light absorption.
In Asia, there is so much aerosol activity that numerous individual events can be observed on most days. Figure 16 provides a comparison for 3 November 2018, which includes significant dust events over southwestern Asia, biomass burning and pollution over India, and haze over western China (Fig. 16a). Like other cases, products compare well qualitatively (Fig. 16b–d), but there are regional differences over both land and ocean (Fig. 16e–g). Each region has its own characteristics that are described below.
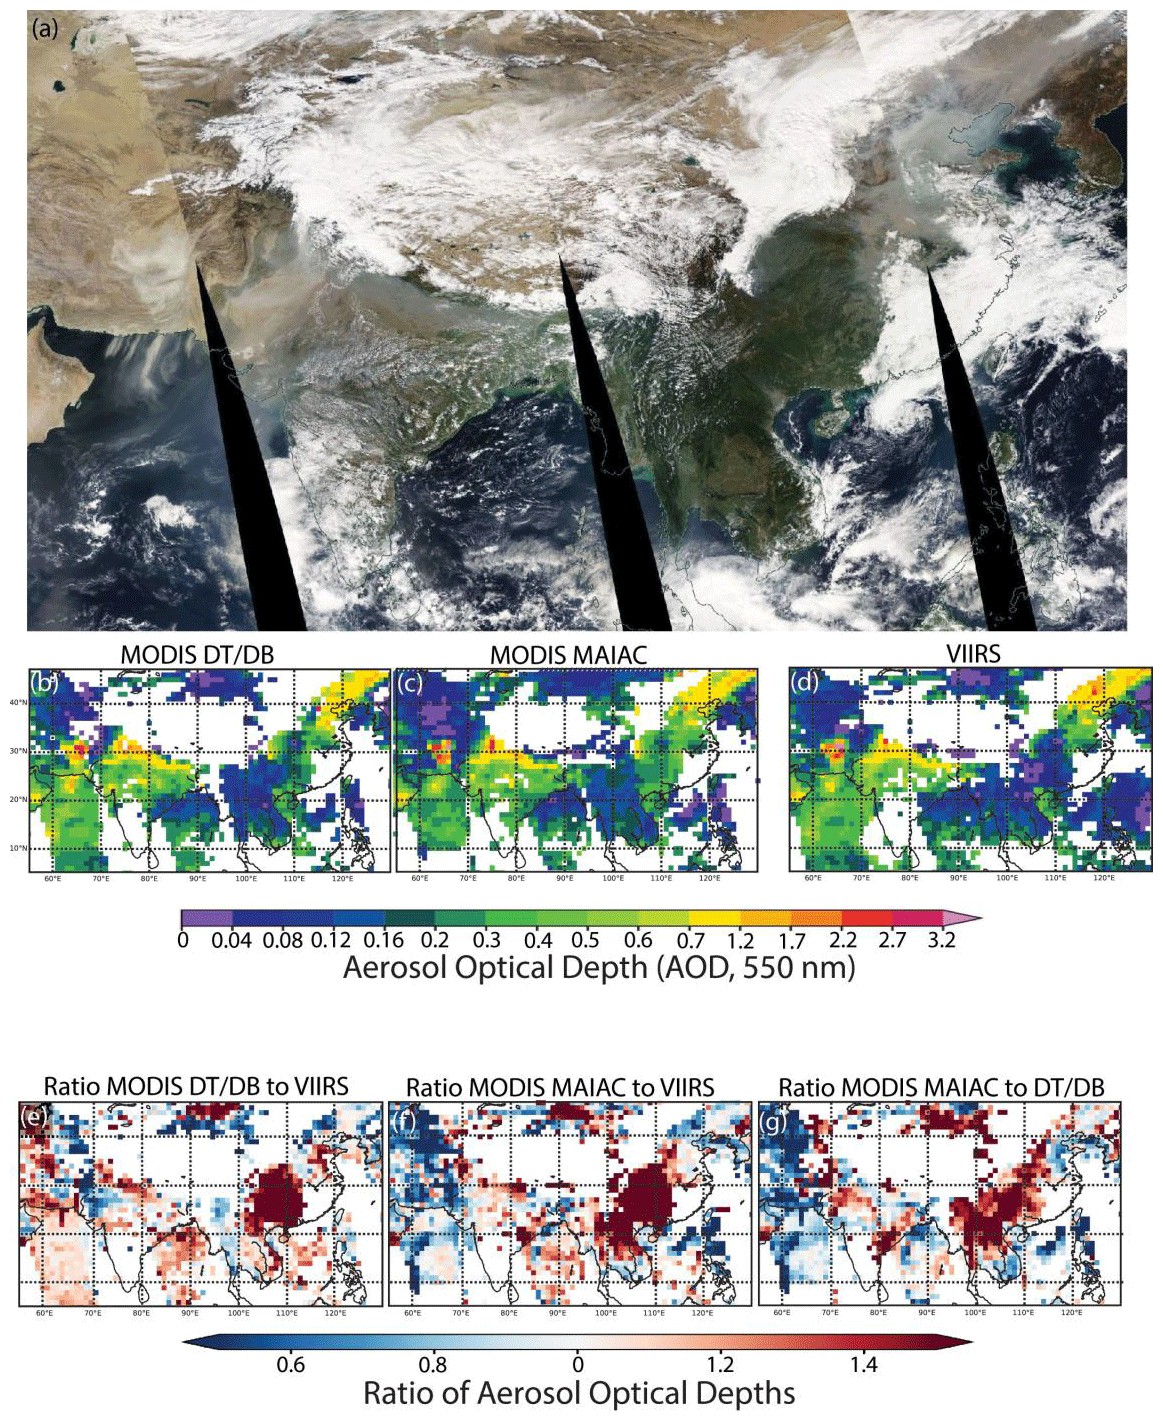
Figure 16A pan-Asian image and AOD analysis for 3 November 2018. Included is the (a) corresponding Aqua MODIS RGB image, (b) MODIS DT/DB AOD, (c) MODIS MAIAC AOD, and (d) VIIRS DB AOD. Also shown are the ratios between products, including (e) MODIS DT/DB : VIIRS DB, (f) MODIS MAIAC : VIIRS DB, and (g) MODIS MAIAC : MODIS DT/DB. Satellite RGB imagery is from NASA Worldview.
5.3.1 Southwestern Asia
Southwestern Asia is a significant producer of dust, albeit to a lesser extent than the Sahara. Like the Sahara, biases are expected due to the lower boundary condition, dust microphysics, and optical geometry. Taken as a whole, products do track each other reasonably well at the seasonal level (Figs. 7 and 8) and even look reasonable in the context of a point-by-point scatter plot (Fig. S7), albeit with some biases. Regression between products at the 1∘ level is likewise poor over land but good over water (Fig. 5). AOD-dependent biases exist between products, especially along the land–ocean border. However, complicating matters beyond the Sahara is that, owing to its large petrochemical-based economy, southwestern Asia also can exhibit exceptionally strong pollution events (e.g., Smirnov et al., 2002; Reid et al., 2008), as exhibited by half the 84th percentile of AERONET AOD being fine mode (Fig. 9g). Thus, while the very largest events are dust dominated, it is not necessarily a given that moderately high AOD is dust – potentially leading to confusion for overland algorithms that cannot extract a fine–coarse partition.
5.3.2 South Asia
Not surprisingly, the South Asian or Indian Subcontinent domain, with its diverse sources from pollution, dust transport, and agricultural biomass burning, has the highest median AOD of the regions studied here. Like almost all regions, products generally agree on the overall distribution statistics (Fig. 8h). Although there are many AERONET sites in the region, AERONET averages depart sharply from the satellite products. Examining the time series further (Fig. 7h), the dominant aerosol features are biomass burning during the fall and haze during the winter and early spring. The pre-monsoon season can also be associated with significant coarse-mode dust. However, taken at the subcontinent scale, the largest AODs detected by the satellites occur during the Northern Hemisphere summers, and the MODIS DT/DB retrieves the largest values. Yet, AERONET retrievals are also not well correlated with the regional satellite depiction, showing higher AODs overall but lower values in the monsoon period. This difference between satellite and AERONET data likely results from (a) the limited network in this region, notably concentrated in the Indo-Gangetic plain, and (b) cloud contamination. To investigate these large disagreements, case studies where selected using NASA Worldview where it shows that there is a correlation between occurrences of peak AOD550 in the satellite datasets and low amounts of AOD550 from the AERONET sites. These correlations arise when there are high AOD events in the northern portion of the country along the Indo–Gangetic Plain of India. In this region, the AERONET stations are located at boundary of the regions with high amounts of AOD. This similarly occurs for the opposite case where the satellite datasets observe lower amounts of AOD and AERONET observes large amounts of aerosol and helps confirm that sampling bias is causing the disagreement in the regional analysis.
5.3.3 East Asia
Completing the coastal arc to East Asia, this region shows better inter-product agreement than any other in this category. This is despite being one of the most heterogeneous environments of the world, with significant dust transported from the Taklamakan and Gobi deserts, wintertime haze over the eastern North China Plain, severe pollution from the Pearl River Delta and industrial centers, and biomass burning intrusions from Southeast Asia and boreal Asia. There are also sharp gradients in land surface properties. Similar to other arid regions, Fig. 5 shows that far western China has the poorest relationships between products. There is gradual improvement eastward. But, taken as a regional average, products largely converge – with the exception of high biases of AERONET sites – a result of sites being selected to monitor some of the most polluted areas of an already highly polluted region. It should also be noted that MODIS products often screen out high-AOD fine-mode events in eastern China since many of these events are associated with significant cloud cover (Eck et al., 2018; Shi et al., 2021). In fact even the version 3 AERONET L2 cloud screening and quality checks result in eliminating ∼15 % of the fine-mode AOD days with fine AOD (500 nm) >1 that are identified by utilizing SDA in the level 1 data before cloud screening is applied (Eck et al., 2018; Table 3). Indeed, even though the region is known for all types of aerosols, AERONET is generally situated in populated areas, likely more reflective of pollution sources with high fine-mode fractions.
It is expected that in late 2023 there will be a marked shift in global aerosol monitoring as the 20+ year MODIS instruments are decommissioned, and the community must finish its adaptation to SNPP/JPSS VIIRS instruments. This transition will have a notable impact on applications such as aerosol data assimilation and the generation of consistent climate data records. An area of particular concern is in the monitoring of extreme events that already stress aerosol algorithms and are expected to become “more extreme” in frequency and magnitude with ongoing climate change. Therefore, to examine potential differences in the efficacy of MODIS- and VIIRS-based AOD algorithms and what a 2023 change in sensor platforms will result in, severe aerosol events from VIIRS DB, MODIS DT/DB, and MODIS MAIAC are assessed at global, regional, and ground-based-sensor perspectives from 2016 to 2019.
Using a consistent gridding methodology across products, statistics related to AOD were generated from each product to identify where most significant aerosol events have occurred, what is considered a locally exceptional event by region, and how these differences spatially vary between datasets. These findings include the following points.
- a.
The median AOD values show relative agreement between all three datasets. Thus, a dramatic shift in typical AOD values as systems progress from MODIS to VIIRS is not expected. However, there are slight regionally correlated biases by region. VIIRS has a slightly higher bias in comparison to MODIS DT/DB and MAIAC in high-aerosol-producing regions. The largest median differences are seen in the clean regions such as the western United States, Gobi Desert, and the Arctic, with the MODIS products being higher than VIIRS. Thus, pristine regions may show a decrease in AOD from MODIS to VIIRS.
- b.
When observing the 84th, 95th, and 98th percentile of AOD values, the biases between products start to become ever more apparent by region, especially surrounding areas impacted by biomass burning. For example, for Africa, midlatitude fires, and the boreal regions, MODIS DT/DB has consistently higher AOD values than VIIRS, with a more neutral bias for South America and a reversal in bias in sub-Sahel and tropical Africa. Conversely, VIIRS provides higher 84th percentile values for African, southwestern Asian, and Asian desert regions. In regions such as the Arctic Ocean, Africa, and southwestern Asia, the ratios of MODIS to VIIRS along the land–ocean border show a clear distinction between the land and ocean retrieval algorithms being used. MAIAC generally retrieves lower high-percentile AOD values than the other retrievals. Areas of correlated bias exist between lower MODIS MAIAC values and their MODIS DT/DB and VIIRS counterparts. This reveals algorithm differences caused by aerosol speciation, single scattering albedo, and surface differences between land and ocean. Thus, AOD observations for higher AOD environments will notably shift with the MODIS to VIIRS transition.
- c.
Over ocean, median and 84th percentile values are also very similar between products. However, for 95th and 98th percentile events VIIRS AERDB retrieves lower values – especially in the central Atlantic, high midlatitudes, and the Arctic. Thus, over ocean we expect a decrease in AOD in the transition from MODIS to VIIRS for high AOD events.
- d.
When comparing the number of days where AOD >0.8, the contrast between the land and ocean further highlights the differences in land and ocean retrievals. The number of days where AOD >0.8 also reveals more of the effects of swath width, sun glint, and different dust models used for ocean algorithms. When comparing the amount of jointly detected 95th percentile AOD events against the events detected by a single algorithm, VIIRS AERDB has the highest likelihood of identifying 95th percentile events over ocean, while MODIS MAIAC presented the highest likelihood over land.
- e.
The global analysis was further investigated by comparing products at individual points through linear regression for AOD values <0.8 and the mean ratios for AOD >0.8. Most notable is a clear reduction in slope from MODIS to VIIRS that is offset by a positive intercept. The highest coefficient of determination (r2) is seen over coastal waters where there are dark ocean boundary conditions and higher AOD values relative to open ocean. For land, the best correlations are seen over low-albedo vegetated lands in biomass burning regions and pollution-dominated regions. The lowest correlations are seen in regions with little dynamic range, such as the tropical Pacific Ocean, Chile, central Asia, western United States, and Australia. The strongest biases are seen for low AOD, correlated with the issue of lower boundary conditions, and at the high latitudes.
Based on the findings above, a series of more in-depth regional analyses were performed aimed at dissecting the product differences in retrievals and sampling. This is done through comparisons to AERONET sensors, time series, probability distributions, and case studies. Regions investigated included a host of biomass burning, arid, polluted, and mixed environments.
- a.
The biomass-burning-dominated regimes were separated into boreal Asia, boreal Canada, central Africa, and South America. All three satellite products are in relatively good agreement with one another and AERONET. These regions show that time series regional averaging can provide a good estimate of severe aerosol events, especially where there is a good distribution of AERONET sites, such as in South America, whereas boreal Asia and central Africa are underrepresented. Nevertheless, there is evidence of issues associated with sampling, scattering angle, the fine–coarse mode partitions, and under-sampling of severe events. Algorithms intercompare best for South America and Central Africa, although MAIAC does exhibit a noticeable low bias. Boreal smoke is more problematic, with reversals in bias between algorithms between Asian and North American boreal smoke plumes.
- b.
In the dust-dominated Saharan region, MODIS products are lower than VIIRS due to changes in assumptions in dust optical properties. Higher values can also be associated with algorithm improvements in cloud and dust discrimination. There are few AERONET sites available for evaluation, however, and correlations are indeterminant.
- c.
Regions with mixed pollution and dust within Asia include southwestern Asia, Southeast Asia, southern Asia, and eastern Asia. The correlations between products are strongest over land for dark vegetated surfaces and biomass burning in northern Southeast Asia and eastern Asia. Like over the Sahara, lower correlations are exhibited in bright deserts. Given the mixed aerosol sources in these regions, there are often difficulties in the fine- and coarse-mode partition and the land–ocean boundaries. Sampling bias seems to occur based on the sensor locations.
The evaluation results of this study show that even after 20 years of experience with Dark Target style algorithms, correlated divergence between products is still problematic for higher-fidelity applications and here notably also for higher optical depths when multiple scattering aggravates errors in assumed aerosol optical properties. This will no doubt require adjustments in 2023 with the shift from the EOS to the JPSS constellations. It can be argued that the spatially correlated biases observed between products here is a natural result of the underdetermined observations that single view and non-polarization passive remote sensing provide for aerosol characterization. Nevertheless, until some agreed upon baseline is made in the community, scientific results on climate change, inverse modeling of sources, and aerosol impacts will continue to have regional biases. Next-generation polarimeters are expected to provide additional information that is hoped to resolve regional biases that are observed in MODIS and VIIRS. Nevertheless, they too will require studies such as conducted here that in turn will require multiyear datasets for evaluation and algorithm integration.
Publicly available software was used to produce the results in this paper. The L3 software used in the analysis is available on GitHub and is in the process of being made open source. Yori L3 Gridding Tools are available at https://sips.ssec.wisc.edu/docs/yori.html (Veglio et al., 2023).
All datasets are publicly available through the NASA data centers or individual NASA products: https://doi.org/10.5194/amt-12-169-2019 (Giles et al., 2019); https://doi.org/10.5067/MODIS/MYD04_L2.006 (Levy and Hsu, 2015), https://doi.org/10.5067/MODIS/MCD19A2.006 (Lyapustin and Wang, 2018), and https://doi.org/10.5067/VIIRS/AERDB_L2_VIIRS_SNPP.011 (Sayer et al., 2021).
The supplement related to this article is available online at: https://doi.org/10.5194/amt-16-2547-2023-supplement.
AG, JSR, and REH participated in the preparation of the manuscript and performed data analysis. NCH, RCL, JZ, and TFE provided expert advice and feedback on data products. PV is the author of the gridding software used in this study.
At least one of the (co-)authors is a member of the editorial board of Atmospheric Measurement Techniques. The peer-review process was guided by an independent editor, and the authors also have no other competing interests to declare.
Publisher's note: Copernicus Publications remains neutral with regard to jurisdictional claims in published maps and institutional affiliations.
This project was funded by the Office of Naval Research (grant no. 322). It is recognized that the development of an algorithm requires a team effort for development and verification across many organizations. We gratefully acknowledge the University of Wisconsin SIPS and Goddard Space Flight Center LAADS for the processing and archiving of VIIRS and MODIS data used in this study. We also wish to thank the members of the federated Aerosol Robotic Network (AERONET) program for their steadfast contributions to satellite product verification. We acknowledge the use of imagery from the NASA Worldview application (https://worldview.earthdata.nasa.gov/, last access: 10 August 2021), part of the NASA Earth Observing System Data and Information System (EOSDIS).
This research has been supported by the Office of Naval Research (grant no. 322).
This paper was edited by Linlu Mei and reviewed by two anonymous referees.
Al-Taani, A. A., Nazzal, Y., Howari, F. M., and Yousef, A.: Long-term trends in ambient fine particulate matter from 1980 to 2016 in United Arab Emirates, Environ. Monit. Assess., 191, 1–19, https://doi.org/10.1007/s10661-019-7259-9, 2019.
An, Z., Huang, R. J., Zhang, R., Tie, X., Li, G., Cao, J., Zhou, W., Shi, Z., Han, Y., Gu, Z., and Ji, Y.: Severe haze in northern China: A synergy of anthropogenic emissions and atmospheric processes, P. Natl. Acad. Sci. USA, 116, 8657–8666, https://doi.org/10.1073/pnas.1900125116, 2019.
Benedetti, A., Morcrette, J.-J., Boucher, O., Dethof, A., Engelen, R. J., Fisher, M., Flentje, H., Huneeus, N., Jones, L., Kaiser, J. W., Kinne, S., Mangold, A., Razinger, M., Simmons, A. J., and Suttie, M.: Aerosol analysis and forecast in the European centre for medium-range weather forecasts integrated forecast system: 2. Data assimilation, J. Geophys. Res.-Atmos., 114, D13205, https://doi.org/10.1029/2008JD011115, 2009.
Benedetti, A., Reid, J. S., Knippertz, P., Marsham, J. H., Di Giuseppe, F., Rémy, S., Basart, S., Boucher, O., Brooks, I. M., Menut, L., Mona, L., Laj, P., Pappalardo, G., Wiedensohler, A., Baklanov, A., Brooks, M., Colarco, P. R., Cuevas, E., da Silva, A., Escribano, J., Flemming, J., Huneeus, N., Jorba, O., Kazadzis, S., Kinne, S., Popp, T., Quinn, P. K., Sekiyama, T. T., Tanaka, T., and Terradellas, E.: Status and future of numerical atmospheric aerosol prediction with a focus on data requirements, Atmos. Chem. Phys., 18, 10615–10643, https://doi.org/10.5194/acp-18-10615-2018, 2018.
Bilal, M., Nazeer, M., Qiu, Z., Ding, X., and Wei, J.: Global validation of MODIS C6 and C6.1 merged aerosol products over diverse vegetated surfaces, Remote Sens.-Basel, 10, 475, https://doi.org/10.3390/rs10030475, 2018.
Bondur, V. G., Mokhov, I. I., Voronova, O. S., and Sitnov, S. A.: Satellite monitoring of Siberian wildfires and their effects: Features of 2019 anomalies and trends of 20-year changes, Dolk. Earth Sci., 492, 370–375, https://doi.org/10.1134/S1028334X20050049, 2020.
Bullard, J. E., Baddock, M., Bradwell, T., Crusius, J., Darlington, E., Gaiero, D., Gassó, S., Gisladottir, G., Hodgkins, R., McCulloch, R., McKenna-Neuman, C., Mockford, T., Stewart, H., and Thorsteinsson, T.: High-latitude dust in the Earth system, Rev. Geophys., 54, 447–485, https://doi.org/10.1002/2016RG000518, 2016.
Caton Harrison, T., Washington, R., and Engelstaedter, S.: A 14-year climatology of Saharan dust emission mechanisms inferred from automatically tracked plumes, J. Geophys. Res.-Atmos., 124, 9665–9690, https://doi.org/10.1029/2019JD030291, 2019.
Chen, X., Ding, J., Liu, J., Wang, J., Ge, X., Wang, R., and Zuo, H.: Validation and comparison of high-resolution MAIAC aerosol products over Central Asia, Atmos. Environ., 251, 118273, https://doi.org/10.1016/j.atmosenv.2021.118273, 2021.
Coogan, S. C., Cai, X., Jain, P., and Flannigan, M. D.: Seasonality and trends in human-and lightning-caused wildfires ≥2 ha in Canada, 1959–2018, Int. J. Wildland Fire, 29, 473–485, https://doi.org/10.1071/WF19129, 2020.
Dey, S. and Di Girolamo, L.: A decade of change in aerosol properties over the Indian subcontinent, Geophys. Res. Lett., 38, L14811, https://doi.org/10.1029/2011GL048153, 2011.
Eck, T. F., Holben, B. N., Reid, J. S., Dubovik, O., Smirnov, A., O'Neill, N. T., Slutsker, I., and Kinne, S.: Wavelength dependence of the optical depth of biomass burning, urban, and desert dust aerosols, J. Geophys. Res., 104, 31333–31349, https://doi.org/10.1029/1999JD900923, 1999.
Eck, T. F., Holben, B. N., Reid, J. S., Sinyuk, A., Hyer, E. J., O'Neill, N. T., Shaw, G. E., Vande Castle, J. R., Chapin, F. S., Dubovik, O., Smirnov, A., Vermote, E., Schafer, J. S., Giles, D., Slutsker, I., Sorokine, M., and Newcomb, W. W.: Optical properties of boreal region biomass burning aerosols in central Alaska and seasonal variation of aerosol optical depth at an Arctic coastal site, J. Geophys. Res.-Atmos., 114, D11201, https://doi.org/10.1029/2008JD010870, 2009.
Eck, T. F., Holben, B. N., Reid, J. S., Mukelabai, M. M., Piketh, S. J., Torres, O., Jethva, H. T., Hyer, E. J., Ward, D. E., Dubovik, O., Sinyuk, A., Schafer, J. S., Giles, D. M., Sorokin, M., Smirnov, A., and Slutsker, I.: A seasonal trend of single scattering albedo in southern African biomass-burning particles: Implications for satellite products and estimates of emissions for the world's largest biomass-burning source, J. Geophys. Res.-Atmos., 118, 6414–6432, https://doi.org/10.1002/jgrd.50500, 2013.
Eck, T. F., Holben, B. N., Reid, J. S., Xian, P., Giles, D. M., Sinyuk, A., Smirnov, A., Schafer, J. S., Slutsker, I., Kim, J., Koo, J.-H., Choi, M., Kim, K. C., Sano, I., Arola, A., Sayer, A. M., Levy, R. C., Munchak, L. A., O'Neill, N. T., Lyapustin, A., Hsu, N. C., Randles, C. A., Da Silva, A. M., Buchard, V., Govindaraju, R. C., Hyer, E., Crawford, J. H., Wang, P., and Xia, X.: Observations of the interaction and transport of fine mode aerosols with cloud and/or fog in Northeast Asia from Aerosol Robotic Network and satellite remote sensing, J. Geophys. Res.-Atmos., 123, 5560–5587, https://doi.org/10.1029/2018JD028313, 2018.
Eck, T. F., Holben, B. N., Giles, D. M., Slutsker, I., Sinyuk, A., Schafer, J. S., Smirnov, A., Sorokin, M., Reid, J. S., Sayer, A. M., Hsu, N. C., Shi, Y. R., Levy, R. C., Lyapustin, A., Rahman, M. A., Liew, S.-C., Cortijo, S. S., Li, T., Kalbermatter, D., Keong, K. L., Yuggotomo, M. E., Aditya, F., Mohamad, M., Mahmud, M., Chong, T. K., Lim, H.-S., Choon, Y. E., Deranadyan, G., Kusumaningtyas, S., and Aldrian, E.: AERONET remotely sensed measurements and retrievals of biomass burning aerosol optical properties during the 2015 Indonesian burning season, J. Geophys. Res.-Atmos., 124, 4722–4740, https://doi.org/10.1029/2018JD030182, 2019.
Field, R. D., Van Der Werf, G. R., Fanin, T., Fetzer, E. J., Fuller, R., Jethva, H., Levy, R., Livesey, N. J., Luo, M., Torres, O., and Worden, H. M.: Indonesian fire activity and smoke pollution in 2015 show persistent nonlinear sensitivity to El Niño-induced drought, P. Natl. Acad. Sci. USA, 113, 9204–9209, https://doi.org/10.1073/pnas.1524888113, 2016.
Ge, J. M., Huang, J. P., Xu, C. P., Qi, Y. L., and Liu, H. Y.: Characteristics of Taklimakan dust emission and distribution: A satellite and reanalysis field perspective, J. Geophys. Res.-Atmos., 119, 11772–11783, https://doi.org/10.1002/2014JD022280, 2014.
Giles, D. M., Sinyuk, A., Sorokin, M. G., Schafer, J. S., Smirnov, A., Slutsker, I., Eck, T. F., Holben, B. N., Lewis, J. R., Campbell, J. R., Welton, E. J., Korkin, S. V., and Lyapustin, A. I.: Advancements in the Aerosol Robotic Network (AERONET) Version 3 database – automated near-real-time quality control algorithm with improved cloud screening for Sun photometer aerosol optical depth (AOD) measurements, Atmos. Meas. Tech., 12, 169–209, https://doi.org/10.5194/amt-12-169-2019, 2019.
Goudie, A. S.: Great Warm Deserts of the World, Landscapes and Evolution, Oxford University Press, New York, ISBN-13: 978-0199245154, 2002.
Holben, B. N., Eck, T. F., Slutsker, I., Tanré, D., Buis, J. P., Setzer, A., Vermote, E., Reagan, J. A., Kaufman, Y. J., Nakajima, T., Lavenu, F., Jankowiak, I., and Smirnov, A.: AERONET–A federated instrument network and data archive for aerosol characterization, Remote Sens. Environ., 66, 1–16, https://doi.org/10.1016/S0034-4257(98)00031-5, 1998.
Hsu, N. C., Tsay, S. C., King, M. D., and Herman, J. R.: Aerosol properties over bright-reflecting source regions, IEEE T. Geosci, Remote, 42, 557–569, https://doi.org/10.1109/TGRS.2004.824067, 2004.
Hsu, N. C., Jeong, M. J., Bettenhausen, C., Sayer, A. M., Hansell, R., Seftor, C. S., Huang, J., and Tsay, S. C.: Enhanced Deep Blue aerosol retrieval algorithm: The second generation, J. Geophys. Res.-Atmos., 118, 9296–9315, https://doi.org/10.1002/jgrd.50712, 2013.
Hsu, N. C., Lee, J., Sayer, A. M., Kim, W., Bettenhausen, C., and Tsay, S. C.: VIIRS Deep Blue Aerosol Products over Land: Extending the EOS Long-Term Aerosol Data Records, J. Geophys. Res.-Atmos., 124, 4026–4053, https://doi.org/10.1029/2018JD029688, 2019.
Hyer, E. J., Reid, J. S., and Zhang, J.: An over-land aerosol optical depth data set for data assimilation by filtering, correction, and aggregation of MODIS Collection 5 optical depth retrievals, Atmos. Meas. Tech., 4, 379–408, https://doi.org/10.5194/amt-4-379-2011, 2011.
Inness, A., Ades, M., Agustí-Panareda, A., Barré, J., Benedictow, A., Blechschmidt, A.-M., Dominguez, J. J., Engelen, R., Eskes, H., Flemming, J., Huijnen, V., Jones, L., Kipling, Z., Massart, S., Parrington, M., Peuch, V.-H., Razinger, M., Remy, S., Schulz, M., and Suttie, M.: The CAMS reanalysis of atmospheric composition, Atmos. Chem. Phys., 19, 3515–3556, https://doi.org/10.5194/acp-19-3515-2019, 2019.
Khade, V. M., Hansen, J. A., Reid, J. S., and Westphal, D. L.: Ensemble filter based estimation of spatially distributed parameters in a mesoscale dust model: experiments with simulated and real data, Atmos. Chem. Phys., 13, 3481–3500, https://doi.org/10.5194/acp-13-3481-2013, 2013.
Kaku, K. C., Reid, J. S., O'Neill, N. T., Quinn, P. K., Coffman, D. J., and Eck, T. F.: Verification and application of the extended spectral deconvolution algorithm (SDA+) methodology to estimate aerosol fine and coarse mode extinction coefficients in the marine boundary layer, Atmos. Meas. Tech., 7, 3399–3412, https://doi.org/10.5194/amt-7-3399-2014, 2014.
Kaufman, Y. J., Tanré, D., Remer, L. A., Vermote, E. F., Chu, A., and Holben, B. N.: Operational remote sensing of tropospheric aerosol over land from EOS moderate resolution imaging spectroradiometer, J. Geophys. Res.-Atmos., 102, 17051–17067, https://doi.org/10.1029/96JD03988, 1997.
Levy, R. and Hsu, C.: MODIS Atmosphere L2 Aerosol Product, Goddard Space Flight Center [data set], USA, https://doi.org/10.5067/MODIS/MYD04_L2.006, 2015.
Levy, R. C., Remer, L. A., Kleidman, R. G., Mattoo, S., Ichoku, C., Kahn, R., and Eck, T. F.: Global evaluation of the Collection 5 MODIS dark-target aerosol products over land, Atmos. Chem. Phys., 10, 10399–10420, https://doi.org/10.5194/acp-10-10399-2010, 2010.
Levy, R. C., Mattoo, S., Munchak, L. A., Remer, L. A., Sayer, A. M., Patadia, F., and Hsu, N. C.: The Collection 6 MODIS aerosol products over land and ocean, Atmos. Meas. Tech., 6, 2989–3034, https://doi.org/10.5194/amt-6-2989-2013, 2013.
Levy, R. C., Mattoo, S., Sawyer, V., Shi, Y., Colarco, P. R., Lyapustin, A. I., Wang, Y., and Remer, L. A.: Exploring systematic offsets between aerosol products from the two MODIS sensors, Atmos. Meas. Tech., 11, 4073–4092, https://doi.org/10.5194/amt-11-4073-2018, 2018.
Li, Z., Zhao, X., Kahn, R., Mishchenko, M., Remer, L., Lee, K.-H., Wang, M., Laszlo, I., Nakajima, T., and Maring, H.: Uncertainties in satellite remote sensing of aerosols and impact on monitoring its long-term trend: a review and perspective, Ann. Geophys., 27, 2755–2770, https://doi.org/10.5194/angeo-27-2755-2009, 2009.
Li, J., Carlson, B. E., Dubovik, O., and Lacis, A. A.: Recent trends in aerosol optical properties derived from AERONET measurements, Atmos. Chem. Phys., 14, 12271–12289, https://doi.org/10.5194/acp-14-12271-2014, 2014.
Lyapustin, A. and Wang, Y.: MCD19A2 MODIS/Terra+Aqua Land Aerosol Optical Depth Daily L2G Global 1km SIN Grid V006, NASA EOSDIS Land Processes DAAC [data set], https://doi.org/10.5067/MODIS/MCD19A2.006, 2018.
Lyapustin, A., Wang, Y., Laszlo, I., Kahn, R., Korkin, S., Remer, L., Levy, R., and Reid, J. S.: Multiangle implementation of atmospheric correction (MAIAC): 2. Aerosol algorithm, J. Geophys. Res.-Atmos., 116, D03211, https://doi.org/10.1029/2010JD014986, 2011.
Lyapustin, A., Wang, Y., Korkin, S., and Huang, D.: MODIS Collection 6 MAIAC algorithm, Atmos. Meas. Tech., 11, 5741–5765, https://doi.org/10.5194/amt-11-5741-2018, 2018.
Lynch, P., Reid, J. S., Westphal, D. L., Zhang, J., Hogan, T. F., Hyer, E. J., Curtis, C. A., Hegg, D. A., Shi, Y., Campbell, J. R., Rubin, J. I., Sessions, W. R., Turk, F. J., and Walker, A. L.: An 11-year global gridded aerosol optical thickness reanalysis (v1.0) for atmospheric and climate sciences, Geosci. Model Dev., 9, 1489–1522, https://doi.org/10.5194/gmd-9-1489-2016, 2016.
Martins, V. S., Lyapustin, A., de Carvalho, L. A. S., Barbosa, C. C. F., and Novo, E. M. L. M.: Validation of high-resolution MAIAC aerosol product over South America, J. Geophys. Res.-Atmos., 122, 7537–7559, https://doi.org/10.1002/2016JD026301, 2017.
Mishchenko, M. I., Geogdzhayev, I. V., Rossow, W. B., Cairns, B., Carlson, B. E., Lacis, A. A., Liu, L., and Travis, L. D: Long-term satellite record reveals likely recent aerosol trend, Science, 1543–1543, https://doi.org/10.1126/science.1136709, 2007.
Mu, M., Randerson, J. T., van der Werf, G. R., Giglio, L., Kasibhatla, P., Morton, D., Collatz, G. J., DeFries, R. S., Hyer, E. J., Prins, E. M., Griffith, D. W. T., Wunch, D., Toon, G. C., Sherlock, V., and Wennberg, P. O.: Daily and 3-hourly variability in global fire emissions and consequences for atmospheric model predictions of carbon monoxide, J. Geophys. Res.-Atmos., 116, D24303, https://doi.org/10.1029/2011JD016245, 2011.
Nichol, J.: Smoke haze in Southeast Asia: A predictable recurrence, Atmos. Environ., 32, 2715–2716, https://doi.org/10.1016/S1352-2310(98)00086-7, 1998.
Nikonovas, T., North, P. R. J., and Doerr, S. H.: Smoke aerosol properties and ageing effects for northern temperate and boreal regions derived from AERONET source and age attribution, Atmos. Chem. Phys., 15, 7929–7943, https://doi.org/10.5194/acp-15-7929-2015, 2015.
O'Neill, N. T., Eck, T. F., Smirnov, A., Holben, B. N., and Thulasiraman, S.: Spectral discrimination of coarse and fine mode optical depth, J. Geophys. Res.-Atmos., 108, 4559, https://doi.org/10.1029/2002JD002975, 2003.
O'Neill, N. T., Eck, T. F., Reid, J. S., Smirnov, A., and Pancrati, O.: Coarse mode optical information retrievable using ultraviolet to short-wave infrared Sun photometry: Application to United Arab Emirates Unified Aerosol Experiment data, J. Geophys. Res.-Atmos., 113, D05212, https://doi.org/10.1029/2007JD009052, 2008.
Pagowski, M. and Grell, G. A.: Experiments with the assimilation of fine aerosols using an ensemble Kalman filter, J. Geophys. Res.-Atmos., 117, D21302, https://doi.org/10.1029/2012JD018333, 2012.
Perlwitz, J. P., Pérez García-Pando, C., and Miller, R. L.: Predicting the mineral composition of dust aerosols – Part 1: Representing key processes, Atmos. Chem. Phys., 15, 11593–11627, https://doi.org/10.5194/acp-15-11593-2015, 2015.
Randles, C. A., Da Silva, A. M., Buchard, V., Colarco, P. R., Darmenov, A., Govindaraju, R., Smirnov, A., Holben, B., Ferrare, R., Hair, J., Shinozuka, Y., and Flynn, C. J.: The MERRA-2 aerosol reanalysis, 1980 onward. Part I: System description and data assimilation evaluation, J. Climate, 30, 6823–6850, https://doi.org/10.1175/JCLI-D-16-0609.1, 2017.
Reid, J. S., Koppmann, R., Eck, T. F., and Eleuterio, D. P.: A review of biomass burning emissions part II: intensive physical properties of biomass burning particles, Atmos. Chem. Phys., 5, 799–825, https://doi.org/10.5194/acp-5-799-2005, 2005.
Reid, J. S., Piketh, S. J., Walker, A. L., Burger, R. P., Ross, K. E., Westphal, D. L., Bruintjes, R. T, Holben, B. N., Hsu, N. C., Jensen, T. L., Kahn, R. A., Kuciauskas, A. P., Mandoos, A. A., Mangoosh, A. A., Miller, S. D., Porter, J. N., Reid, E. A., and Tsay, S. C.: An overview of UAE2 flight operations: Observations of summertime atmospheric thermodynamic and aerosol profiles of the southern Arabian Gulf, J. Geophys. Res.-Atmos., 113, D14213, https://doi.org/10.1029/2007JD009435, 2008.
Reid, J. S., Hyer, E. J., Prins, E. M., Westphal, D. L., Zhang, J., Wang, J., Christopher, S. A., Curtis, C. A., Schmidt, C. C., Eleuterio, D. P., Richardson, K. A., and Hoffman, J. P.: Global monitoring and forecasting of biomass-burning smoke: Description of and lessons from the Fire Locating and Modeling of Burning Emissions (FLAMBE) program, IEEE J. Sel. Top. Appl., 2, 144–162, https://doi.org/10.1109/JSTARS.2009.2027443, 2009.
Reid, J. S., Xian, P., Hyer, E. J., Flatau, M. K., Ramirez, E. M., Turk, F. J., Sampson, C. R., Zhang, C., Fukada, E. M., and Maloney, E. D.: Multi-scale meteorological conceptual analysis of observed active fire hotspot activity and smoke optical depth in the Maritime Continent, Atmos. Chem. Phys., 12, 2117–2147, https://doi.org/10.5194/acp-12-2117-2012, 2012.
Reid, J. S., Hyer, E. J., Johnson, R. S., Holben, B. N., Yokelson, R. J., Zhang, J., Campbell, J. R., Christopher, S. A., Di Girolamo, L., Giglio, L., Holz, R. E., Kearney, C., Miettinen, J., Reid, E. A., Turk, F.J., Wang, J., Xian, P., Zhao, G., Balasubramanian, R., Chew, B. N., Janjai, S., Lagrosas, N., Lestari, P., Lin, N.-H., Mahmud, M., Nguyen, A. X., Norris, B., Oanh, N., Oo, M., Salinas, S. V., Welton, E. J., and Liew, S. C.: Observing and understanding the Southeast Asian aerosol system by remote sensing: An initial review and analysis for the Seven Southeast Asian Studies (7SEAS) program, Atmos. Res., 122, 403–468, https://doi.org/10.1016/j.atmosres.2012.06.005, 2013.
Reid, J. S., Gumber, A., Zhang, J., Holz, R. E., Rubin, J. I., Xian, P., Smirnov, A., Eck, T. F., O'Neill, N. T., Levy, R. C., Reid, E. A., Colarco, P. R., Benedetti, A., and Tanaka, T.: A Coupled Evaluation of Operational MODIS and Model Aerosol Products for Maritime Environments Using Sun Photometry: Evaluation of the Fine and Coarse Mode, Remote Sens.-Basel, 14, 2978, https://doi.org/10.3390/rs14132978, 2022.
Remer, L. A., Kleidman, R. G., Levy, R. C., Kaufman, Y. J., Tanré, D., Mattoo, S., Martins, J. V., Ichoku, C., Koren, I., Yu, H., and Holben, B. N.: Global aerosol climatology from the MODIS satellite sensors, J. Geophys. Res.-Atmos., 113, D14S07, https://doi.org/10.1029/2007JD009661, 2008.
Rubin, J. I., Reid, J. S., Hansen, J. A., Anderson, J. L., Collins, N., Hoar, T. J., Hogan, T., Lynch, P., McLay, J., Reynolds, C. A., Sessions, W. R., Westphal, D. L., and Zhang, J.: Development of the Ensemble Navy Aerosol Analysis Prediction System (ENAAPS) and its application of the Data Assimilation Research Testbed (DART) in support of aerosol forecasting, Atmos. Chem. Phys., 16, 3927–3951, https://doi.org/10.5194/acp-16-3927-2016, 2016.
Rubin, J. I., Reid, J. S., Hansen, J. A., Anderson, J. L., Holben, B. N., Xian, P., Westphal, D. L. and Zhang, J.: Assimilation of AERONET and MODIS AOT observations using variational and ensemble data assimilation methods and its impact on aerosol forecasting skill, J. Geophys. Res.-Atmos., 122, 4967–4992, https://doi.org/10.1002/2016JD026067, 2017.
Sawyer, V., Levy, R. C., Mattoo, S., Cureton, G., Shi, Y., and Remer, L. A.: Continuing the MODIS Dark Target Aerosol Time Series with VIIRS, Remote Sens.-Basel, 12, 308, https://doi.org/10.3390/rs12020308, 2020.
Sayer, A. M., Thomas, G. E., and Grainger, R. G.: A sea surface reflectance model for (A)ATSR, and application to aerosol retrievals, Atmos. Meas. Tech., 3, 813–838, https://doi.org/10.5194/amt-3-813-2010, 2010.
Sayer, A. M., Hsu, N. C., Bettenhausen, C., and Jeong, M. J.: Validation and uncertainty estimates for MODIS Collection 6 “Deep Blue” aerosol data, J. Geophys. Res.-Atmos., 118, 7864–7872, https://doi.org/10.1002/jgrd.50600, 2013.
Sayer, A. M., Hsu, N. C., Lee, J., Carletta, N., Chen, S. H., and Smirnov, A.: Evaluation of NASA Deep Blue/SOAR aerosol retrieval algorithms applied to AVHRR measurements, J. Geophys. Res.-Atmos., 122, 9945–9967, https://doi.org/10.1002/2017JD026934, 2017.
Sayer, A. M., Hsu, N. C., Lee, J., Kim, W. V., Dubovik, O., Dutcher, S. T., Huang, D., Litvinov, P., Lyapustin, A., Tackett, J. L., and Winker, D. M.: Validation of SOAR VIIRS over-water aerosol retrievals and context within the global satellite aerosol data record, J. Geophys. Res.-Atmos., 123, 13496–13526, https://doi.org/10.1029/2018JD029465, 2018.
Sayer, A. M., Hsu, N. C., Lee, J., Kim, W. V., and Dutcher, S. T.: Validation, stability, and consistency of MODIS Collection 6.1 and VIIRS Version 1 Deep Blue aerosol data over land, J. Geophys. Res.-Atmos., 124, 4658–4688, https://doi.org/10.1029/2018JD029598, 2019.
Sayer, A. M., Hsu, N. C., Bettenhausen, C., Lee, J., Kim, W. V., and Smirnov, A.: AERDB_L2_VIIRS_SNPP - VIIRS/SNPP Deep Blue Aerosol L2 6-Min Swath 6 km, LAADS DAAC [data set], https://doi.org/10.5067/VIIRS/AERDB_L2_VIIRS_SNPP.011, 2021.
Schutgens, N. A. J., Miyoshi, T., Takemura, T., and Nakajima, T.: Sensitivity tests for an ensemble Kalman filter for aerosol assimilation, Atmos. Chem. Phys., 10, 6583–6600, https://doi.org/10.5194/acp-10-6583-2010, 2010.
Schwartz, C. S., Liu, Z., Lin, H. C., and Cetola, J. D.: Assimilating aerosol observations with a “hybrid” variational-ensemble data assimilation system, J. Geophys. Res.-Atmos., 119, 4043–4069, https://doi.org/10.1002/2013JD020937, 2014.
Sekiyama, T. T., Tanaka, T. Y., Shimizu, A., and Miyoshi, T.: Data assimilation of CALIPSO aerosol observations, Atmos. Chem. Phys., 10, 39–49, https://doi.org/10.5194/acp-10-39-2010, 2010.
Sessions, W. R., Reid, J. S., Benedetti, A., Colarco, P. R., da Silva, A., Lu, S., Sekiyama, T., Tanaka, T. Y., Baldasano, J. M., Basart, S., Brooks, M. E., Eck, T. F., Iredell, M., Hansen, J. A., Jorba, O. C., Juang, H.-M. H., Lynch, P., Morcrette, J.-J., Moorthi, S., Mulcahy, J., Pradhan, Y., Razinger, M., Sampson, C. B., Wang, J., and Westphal, D. L.: Development towards a global operational aerosol consensus: basic climatological characteristics of the International Cooperative for Aerosol Prediction Multi-Model Ensemble (ICAP-MME), Atmos. Chem. Phys., 15, 335–362, https://doi.org/10.5194/acp-15-335-2015, 2015.
Shi, Y., Zhang, J., Reid, J. S., Hyer, E. J., Eck, T. F., Holben, B. N., and Kahn, R. A.: A critical examination of spatial biases between MODIS and MISR aerosol products – application for potential AERONET deployment, Atmos. Meas. Tech., 4, 2823–2836, https://doi.org/10.5194/amt-4-2823-2011, 2011.
Shi, Y. R., Levy, R. C., Eck, T. F., Fisher, B., Mattoo, S., Remer, L. A., Slutsker, I., and Zhang, J.: Characterizing the 2015 Indonesia fire event using modified MODIS aerosol retrievals, Atmos. Chem. Phys., 19, 259–274, https://doi.org/10.5194/acp-19-259-2019, 2019.
Shi, Y. R., Levy, R. C., Yang, L., Remer, L. A., Mattoo, S., and Dubovik, O.: A Dark Target research aerosol algorithm for MODIS observations over eastern China: increasing coverage while maintaining accuracy at high aerosol loading, Atmos. Meas. Tech., 14, 3449–3468, https://doi.org/10.5194/amt-14-3449-2021, 2021.
Smirnov, A., Holben, B. N., Dubovik, O., O'Neill, N. T., Eck, T. F., Westphal, D. L., Goroch, A. K., Pietras, C., and Slutsker, I.: Atmospheric aerosol optical properties in the Persian Gulf, J. Atmos. Sci., 59, 620–634, https://doi.org/10.1175/1520-0469(2002)059<0620:AAOPIT>2.0.CO;2, 2002.
Sogacheva, L., Popp, T., Sayer, A. M., Dubovik, O., Garay, M. J., Heckel, A., Hsu, N. C., Jethva, H., Kahn, R. A., Kolmonen, P., Kosmale, M., de Leeuw, G., Levy, R. C., Litvinov, P., Lyapustin, A., North, P., Torres, O., and Arola, A.: Merging regional and global aerosol optical depth records from major available satellite products, Atmos. Chem. Phys., 20, 2031–2056, https://doi.org/10.5194/acp-20-2031-2020, 2020.
Superczynski, S. D., Kondragunta, S., and Lyapustin, A. I.: Evaluation of the multi-angle implementation of atmospheric correction (MAIAC) aerosol algorithm through intercomparison with VIIRS aerosol products and AERONET, J. Geophys. Res.-Atmos., 122, 3005–3022, https://doi.org/10.1002/2016JD025720, 2017.
Swap, R. J., Annegarn, H. J., Suttles, J. T., King, M. D., Platnick, S., Privette, J. L., and Scholes, R. J.: Africa burning: a thematic analysis of the Southern African Regional Science Initiative (SAFARI 2000), J. Geophys. Res.-Atmos., 108, 8465, https://doi.org/10.1029/2003JD003747, 2003.
Veglio, P., Holz, R., Gumley, L., Quinn, G., Dutcher, S., and Flynn, B.: Yori: L3 Gridding Tools, Version 1.7.0, SIPS Docs [code], https://sips.ssec.wisc.edu/docs/yori.html, last access: 17 May 2023.
Wei, J., Li, Z., Peng, Y., and Sun, L.: MODIS Collection 6.1 aerosol optical depth products over land and ocean: validation and comparison, Atmos. Environ., 201, 428–440, https://doi.org/10.1016/j.atmosenv.2018.12.004, 2019.
Xian, P., Reid, J. S., Hyer, E. J., Sampson, C. R., Rubin, J. I., Ades, M., Asencio, N., Basart, S., Benedetti, A., Bhattacharjee, P. S., Brooks, M. E., Colarco, P. R., da Silva, A. M., Eck, T. F., Guth, J., Jorba, O., Kouznetsov, R., Kipling, Z., Sofiev, M., Garcia-Pando, C. P., Pradhan, Y., Tanaka, T., Wang, J., Westphal, D. L., Yumimoto, K. and Zhang, J.: Current state of the global operational aerosol multi-model ensemble: An update from the International Cooperative for Aerosol Prediction (ICAP), Q. J. Roy. Meteor. Soc., 145, 176–209, https://doi.org/10.1002/qj.3497, 2019.
Yumimoto, K., Tanaka, T. Y., Oshima, N., and Maki, T.: JRAero: the Japanese Reanalysis for Aerosol v1.0, Geosci. Model Dev., 10, 3225–3253, https://doi.org/10.5194/gmd-10-3225-2017, 2017.
Zhang, J. and Reid, J. S.: MODIS aerosol product analysis for data assimilation: Assessment of over-ocean level 2 aerosol optical thickness retrievals, J. Geophys. Res.-Atmos., 111, D22207, https://doi.org/10.1029/2005JD006898, 2006.
Zhang, J. and Reid, J. S.: A decadal regional and global trend analysis of the aerosol optical depth using a data-assimilation grade over-water MODIS and Level 2 MISR aerosol products, Atmos. Chem. Phys., 10, 10949–10963, https://doi.org/10.5194/acp-10-10949-2010, 2010.
Zhang, J., Reid, J. S., Westphal, D. L., Baker, N. L., and Hyer, E. J.: A system for operational aerosol optical depth data assimilation over global oceans, J. Geophys. Res.-Atmos., 113, D10208, https://doi.org/10.1029/2007JD009065, 2008.
Zhang, J., Campbell, J. R., Reid, J. S., Westphal, D. L., Baker, N. L., Campbell, W. F., and Hyer, E. J.: Evaluating the impact of assimilating CALIOP-derived aerosol extinction profiles on a global mass transport model, Geophys. Res. Lett., 38, L14801, https://doi.org/10.1029/2011GL047737, 2011.
Zhang J., Reid, J. S., Campbell J. R., Hyer E. J., and Westphal D. L.: Evaluating the Impact of Multi-Sensor Data Assimilation on A Global Aerosol Particle Transport Model, J. Geophys. Res.-Atmos., 119, 4674–4689, https://doi.org/10.1002/2013JD020975, 2014.
Zhang, L., Lau, W., Tao, W., and Li, Z.: Large wildfires in the western United States exacerbated by tropospheric drying linked to a multi-decadal trend in the expansion of the Hadley circulation, Geophys. Res. Lett., 47, e2020GL087911, https://doi.org/10.1029/2020GL087911, 2020.