the Creative Commons Attribution 4.0 License.
the Creative Commons Attribution 4.0 License.
 | 30 May 2023
Inferring the vertical distribution of CO and CO2 from TCCON total column values using the TARDISS algorithm
Harrison A. Parker
Joshua L. Laughner
Geoffrey C. Toon
Debra Wunch
Coleen M. Roehl
Laura T. Iraci
James R. Podolske
Kathryn McKain
Bianca C. Baier
Paul O. Wennberg
We describe an approach for determining limited information about the vertical distribution of carbon monoxide (CO) and carbon dioxide (CO2) from total column ground-based Total Carbon Column Observation Network (TCCON) observations. For CO and CO2, it has been difficult to retrieve information about their vertical distribution from spectral line shapes because of the errors in the spectroscopy and the atmospheric temperature profile that mask the effects of variations in their mixing ratio with altitude. For CO2 the challenge is especially difficult given that these variations are typically 2 % or less. Nevertheless, if sufficient accuracy can be obtained, such information would be highly valuable for evaluation of retrievals from satellites and more generally for improving the estimate of surface sources and sinks of these trace gases.
We present here the Temporal Atmospheric Retrieval Determining Information from Secondary Scaling (TARDISS) retrieval algorithm. TARDISS uses several simultaneously obtained total column observations of the same gas from different absorption bands with distinctly different vertical averaging kernels. The different total column retrievals are combined in TARDISS using a Bayesian approach where the weights and temporal covariance applied to the different retrievals include additional constraints on the diurnal variation in the vertical distribution for these gases. We assume that the near-surface part of the column varies rapidly over the course of a day (from surface sources and sinks, for example) and that the upper part of the column has a larger temporal covariance over the course of a day.
Using measurements from the five North American TCCON sites, we find that the retrieved lower partial column (between the surface and ∼ 800 hPa) of the CO and CO2 dry mole fractions (DMFs) have slopes of 0.999 ± 0.002 and 1.001 ± 0.003 with respect to lower column DMF from integrated in situ data measured directly from aircraft and in AirCores. The average error for our lower column CO retrieval is 1.51 ppb (∼ 2 %) while the average error for our CO2 retrieval is 5.09 ppm (∼ 1.25 %). Compared with classical line-shape-derived vertical profile retrievals, our algorithm reduces the influence of forward model errors such as imprecision in spectroscopy (line shapes and intensities) and in the instrument line shape. In addition, because TARDISS uses the existing retrieved column abundances from TCCON (which themselves are computationally much less intensive than profile retrieval algorithms), it is very fast and processes years of data in minutes. We anticipate that this approach will find broad application for use in carbon cycle science.
- Article
(8202 KB) - Full-text XML
-
Supplement
(2160 KB) - BibTeX
- EndNote


Remote sensing retrievals of atmospheric gas abundances are used to diagnose the sources, sinks, and fluxes at local, regional, and global scales (Connor et al., 2008, p. 2; Deeter, 2004; Kerzenmacher et al., 2012; Wunch et al., 2011). Compared with in situ measurements, these retrievals, which are used in carbon cycle science investigations, are less influenced by nearby point sources or sinks and rapidly changing meteorological conditions that would lead to erroneous flux calculations (Keppel-Aleks et al., 2012). Because the column represents the integral of a gas from the surface to the top of the atmosphere, flux estimates from column amounts are less sensitive to errors in the assumed vertical transport than those using surface measurements (Keppel-Aleks et al., 2011, 2012). In contrast, since signals of CO2 and CO fluxes at the surface are muted in the total column (due to the dilution of signals from the surface being integrated throughout an entire column), they are less useful in diagnosing local emissions than in situ measurements. For CO2, the total columns are strongly influenced by synoptic-scale transport in the troposphere, making it even more difficult to discern the influences of surface fluxes (Keppel-Aleks et al., 2011, 2012). For CO, its lifetime of several weeks in the free troposphere results in regional transport influences that can dampen the surface signals in the total column values (Deeter, 2004; Zhou et al., 2019). These issues limit the effectiveness of total column measurements in surface flux analysis – particularly for local sources.
Profile retrievals can, in principle, ameliorate these issues and thereby enable more direct information on surface processes. Theoretical analysis shows that two to three vertical degrees of freedom (DoF) can be achieved in CO2 retrievals from near-infrared (NIR) and mid-infrared (MIR) spectra from high-resolution Fourier transform spectrometers (Connor et al., 2016; Kuai et al., 2012; Roche et al., 2021; Shan et al., 2021). In practice, however, Connor et al. (2016) and Roche et al. (2021) showed that the precision of retrieved CO2 profiles using spectral windows in the NIR was much lower than the theoretical estimate due to uncertainty in the temperature profile and in the forward radiative transfer model. Likewise, Shan et al. (2021) retrieve CO2 profiles using spectral windows in the MIR. They use an a posteriori optimization method to improve the tropospheric CO2 signal, and they report errors near 2 %. Although both of these methods retrieve profiles with sufficient degrees of freedom to observe some signals of the variation in the vertical distribution, they report errors sufficiently large enough to encourage the exploration of other methods for use for carbon cycle studies.
Several operational CO profile retrievals exist, but these products still face the issues of column dilution or larger sensitivity to the free troposphere compared to the surface. The Network for the Detection of Atmospheric Composition Change (NDACC) retrieves profiles of CO in the atmosphere (Buchholz et al., 2017) with ∼ 2 degrees of freedom for the signal providing information of a lower (surface–8 km) layer sensitive to the boundary layer and an upper (8–20 km) layer with ∼ 1 %–3 % uncertainty in the total column (Zhou et al., 2018, 2019). These ground-based measurements require higher spectral resolution than those typically available in the Total Carbon Column Observation Network (TCCON) interferometers. The higher resolution also requires longer measurement time, resulting in fewer observations per day. This limits their ability to capture diurnal changes and makes the measurements more susceptible to variations in solar viewing during acquisition of the interferograms. These measurements also require highly accurate knowledge of the spectral line widths, their temperature dependence, the instrument line shape (ILS), and the solar spectrum. These limitations motivate our work to develop a new product with better sensitivity to surface processes and higher temporal resolution from the existing TCCON retrievals.
In our approach, we do not retrieve profile information directly from the spectra. Instead, we utilize the vertical and temporal domains to infer partial column dry mole fraction (DMF) values. We fit partial column scalar values to match TCCON-retrieved total column DMF that are (i) quality controlled and (ii) individually tied to World Meteorological Organization (WMO) trace gas standard scales, which mitigates a number of errors in the forward radiative transfer model, including those arising from errors in the spectroscopy. We use the extant multiple total column measurements from spectral windows with different line intensities and hence different shapes of column averaging kernel. We extract the vertical information from the diurnally varying differences in these total column values and additional a priori information about the expected temporal covariance in the different partial columns based on known atmospheric behavior. This method allows us to extract information focused on the lower atmosphere where the trace gas DMFs are most sensitive to surface exchange.
The uncertainty of this new method for retrieving partial column values is evaluated using comparisons with in situ vertical profile measurements. Section 2 describes the theory and parameters chosen for our retrieval and the data used for the retrieval, validation, and comparison. Sections 3.1 through 3.3 present our validation data and a sensitivity study of the retrieval parameters. Section 3.4 presents an error and information content analysis. Finally, Sect. 3.5 gives examples of the data retrieved using this approach.
2.1 Total Carbon Column Observing Network
The Total Carbon Column Observing Network (TCCON) is a ground-based network of solar-viewing Fourier transform spectrometers equipped with InGaAs and Si detectors that gather spectra for the 3900 to 15 500 cm−1 spectral region (Wunch et al., 2011). Importantly for our work here on CO, some sites are now equipped with an InSb detector that simultaneously allows spectral measurement down to 2000 cm−1 at the expense of simultaneous observations using the Si detector. CO2 and CO are retrieved simultaneously over several spectral windows (independent spectral bands). These windows are chosen to provide high sensitivity to the gas of interest while limiting interference from other atmospheric absorbers.
Column abundances of atmospheric species are computed from the measured spectra using a nonlinear least-squares fitting algorithm, GFIT, which minimizes the residuals between a measured spectrum and one calculated by uniformly scaling a priori vertical profiles for the fitted atmospheric species, yielding the optimal VMR (volume mixing ratio) scaling factors (VSF) of the fitted gases. The a priori profiles scaled by the VSF are integrated to calculate the total column abundance of a species. The retrieved scaled column abundances are converted to column dry mole fraction (DMF) by multiplying by 0.2095 and dividing by the column of O2, retrieved from a different spectral window of the same spectrum. These retrievals are then quality-controlled and scaled to minimize both air mass dependence and the difference with simultaneously measured in situ profiles.
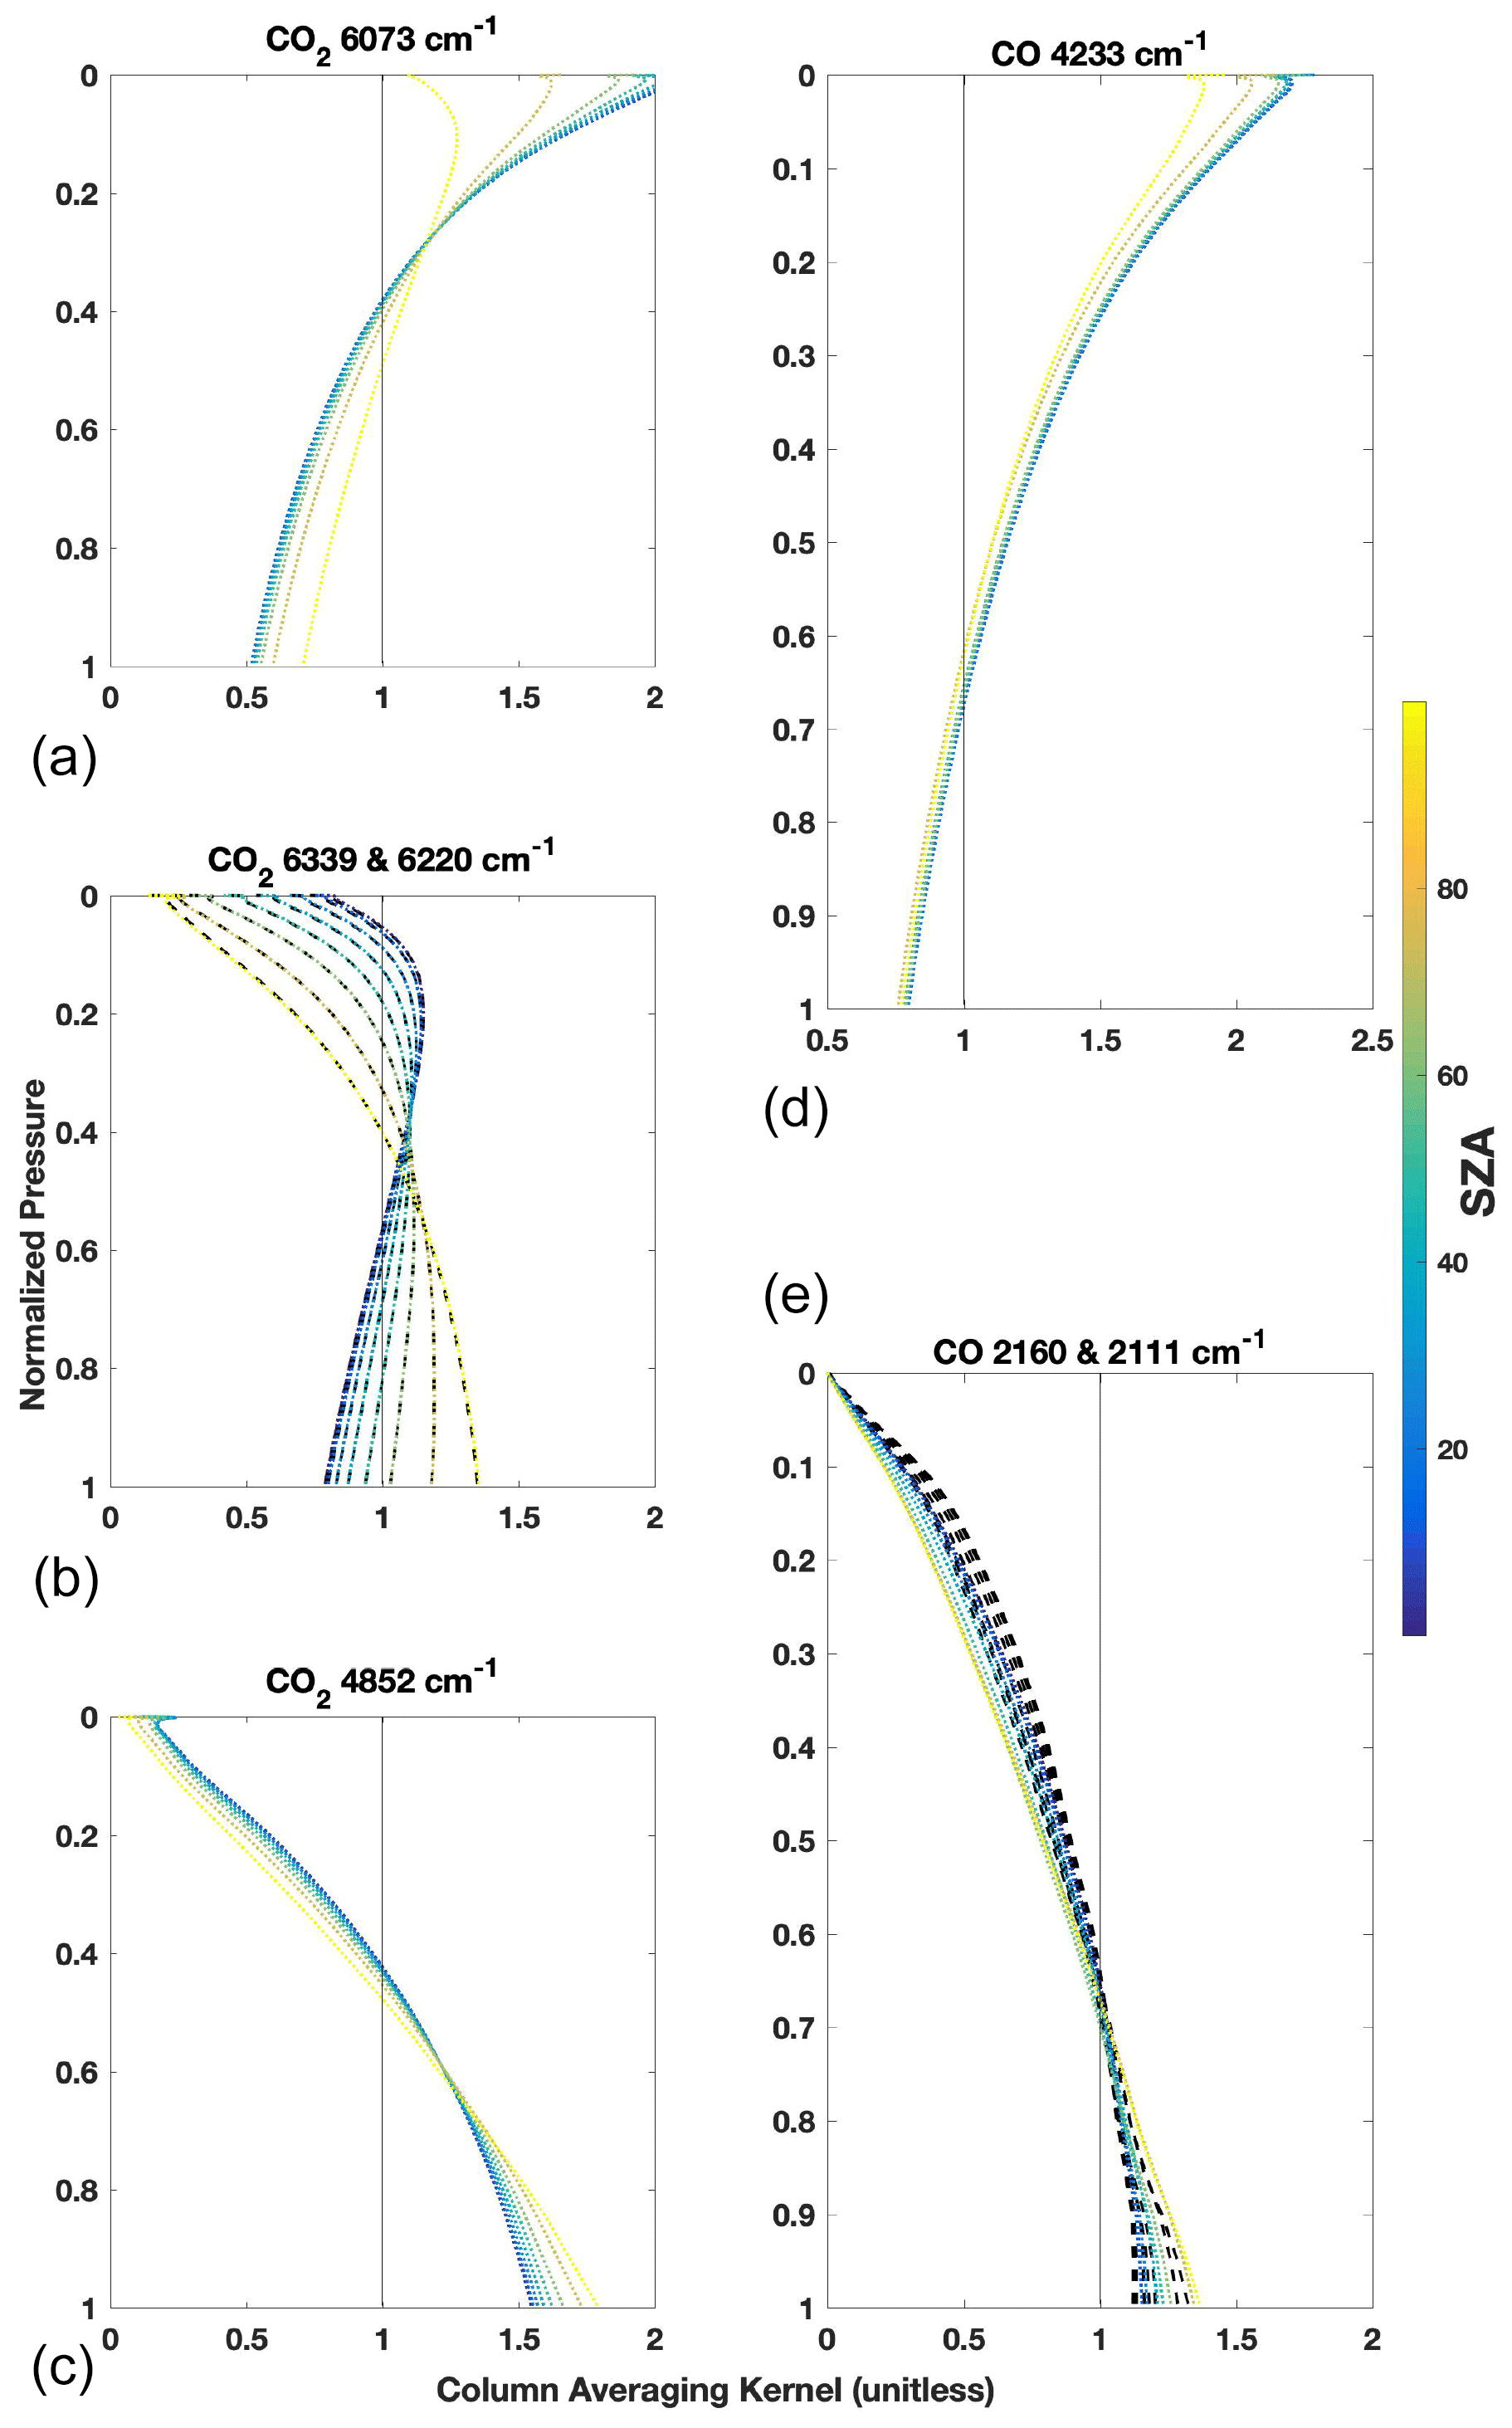
Figure 1Vertical sensitivities of the total column retrievals from GFIT used in our algorithm for both CO2 (a–c) and CO (d, e) plotted against pressure normalized to the surface and color coded by the solar zenith angle (SZA). A column averaging kernel greater than 1 means that the total column is more sensitive to molecules at this pressure level than the average sensitivity. For example, if we move some of the CO2 molecules from 200 hPa to the surface in our a priori profile, the retrieved total column and scale factor (VSF) will decrease for the 6073 cm−1 window and increase for the 4852 cm−1 window while the true and a priori total columns remain unchanged. The 6220 and 6339 cm−1 CO2 and 2160 and 2111 cm−1 CO windows have near-identical kernels due to the CO2 bands being almost identical in their line strengths, separations, widths, and temperature dependences. The 6339 cm−1 CO2 is represented by dashed black lines behind the dotted lines representing the 6220 cm−1 sensitivities, and the 2111 cm−1 CO is represented by dashed black lines behind the dotted lines representing the 2160 cm−1 sensitivities.
For each window and for each spectrum fit by GFIT, an associated column averaging kernel is computed that describes the sensitivity of the total column to changes in species abundance at each altitude (shown in Fig. 1). A perfect column averaging kernel would have values of 1 for all altitudes. More commonly, the kernels will vary slowly with altitude with a pressure-weighted average value close to 1. Values higher (lower) than 1 mean that the retrieval is more (less) sensitive to trace gas changes at that altitude. These sensitivities vary with solar zenith angle (SZA) as the spectral absorption deepens at higher SZA. The vertical sensitivity of each window is a result of its spectral properties. Optically thin spectral regions (windows) tend to be more sensitive to the upper troposphere and the stratosphere while optically thick windows tend to be more sensitive to the lower troposphere. Since information about the stratosphere comes only from near the line center as a result of diminished collisional broadening, if the absorption at the line center is saturated (nearly zero transmission), the spectrum will contain little information about the stratosphere, and hence the kernel will be low there. The differences in column averaging kernel shapes are the main source of information used in the Temporal Atmospheric Retrieval Determining Information from Secondary Scaling (TARDISS) algorithm. The outputs of the VSF values, a priori profiles, total column DMF values, and vertical averaging kernels from standard TCCON processing are used as input for the TARDISS algorithm.
We will refer to the spectral retrievals as being the TCCON retrievals and the temporal partial column retrievals as the TARDISS fit. We also use the terms retrieval and fit interchangeably to refer to the TCCON or TARDISS methodology.
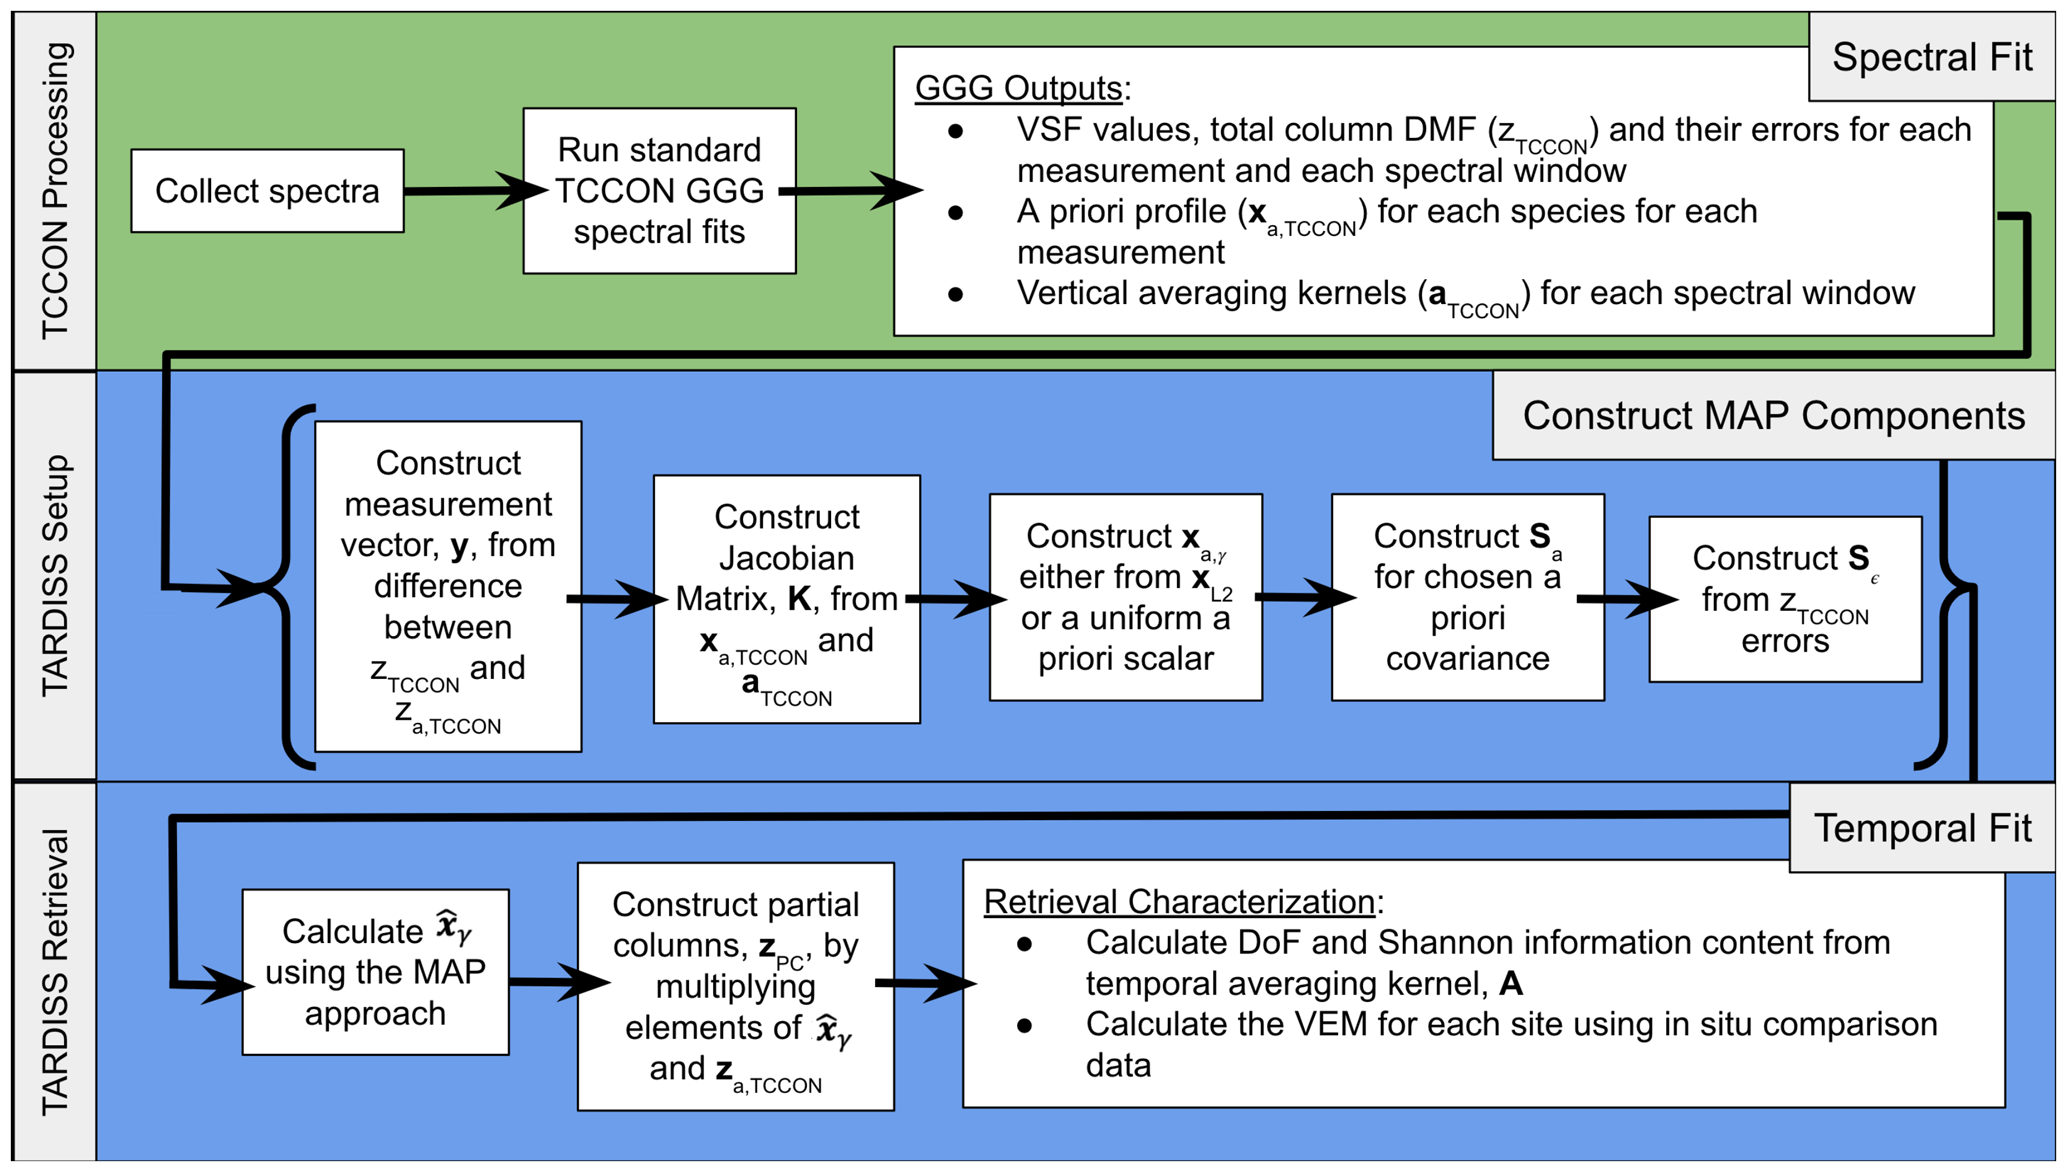
Figure 2Flowchart illustrating the steps performed by of the TARDISS retrieval. The input to the TARDISS retrieval is the output of the spectral fitting done by the GGG2020 software suite represented by the green row. The setup of the components of the TARDISS algorithm from the output of the TCCON spectral fits is shown in Eqs. (11) through (14) and in the middle row. The TARDISS retrieval is performed using Eq. (16), the output partial column DMF values are calculated using Eq. (17), and the information content is calculated by Eqs. (18) and (19) as shown in the bottom row.
2.2 The TARDISS algorithm
Traditional profile retrievals fit spectra by adjusting the abundance of the trace gases at multiple vertical levels to determine the vertical distribution of a specific atmospheric species (Pougatchev et al., 1995; Roche et al., 2021). Here, we describe the Temporal Atmospheric Retrieval Determining Information from Secondary Scaling (TARDISS) algorithm that optimizes the scaling of the profile of our target gas separated into two layers, one near the surface and the other at and above the typical well-mixed surface boundary layer. This is illustrated by the flowchart in Fig. 2. The algorithm minimizes the cost function (Eq. 1) by finding the maximum a posteriori solution for a state vector containing upper and lower column scale factors for all TCCON observations in a given day. That is, if a day has ns observations, the state vector will have ns lower column scale factors and ns upper column scale factors, for 2ns elements total. These are constrained by TCCON column average mole fractions and an assumed temporal covariance. The Jacobian matrix for TARDISS combines the TCCON averaging kernels and the TCCON assumed vertical CO or CO2 profiles in an operator which maps the upper and lower scale factors back to column average mole fractions. We define our cost function as follows:
where y is the measurement vector, K is the Jacobian matrix, is the retrieved state vector, xa,γ is the a priori state vector, Sϵ is the model covariance matrix, and Sa is the prior covariance matrix. In the following sections, we will derive the necessary equations for the construction of the components of the cost function in detail. Table S1 in the Supplement lists all the variable names in this work and their descriptions.
2.2.1 Derivation of the TARDISS Jacobian matrix components
We use the notation and concepts of Rodgers and Connor (2003) with vectors represented with bolded lower-case letters and matrices represented with bolded upper-case letters. We start in the vertical domain where Eqs. (3) through (9) are used for each spectral window, each TCCON measurement, and each species retrieved (CO and CO2 in this work) in the TCCON fit. These equations are used to calculate the weights in the Jacobian matrix and values in the measurement vector for the temporal calculations in Eq. (10) and beyond (represented by the middle and bottom rows of Fig. 2). We will therefore keep Eqs. (3) through (9) agnostic of species and window for this description.
To derive the values used in the Jacobian matrix, K, we start by relating the atmospheric profile of CO or CO2 to the column average mole fractions observed by TCCON. For TARDISS, we assume that the a posteriori atmospheric profile can be described as the profile output by the TCCON retrieval with the bottom q levels scaled separately from the top nl−q levels, where q is a chosen level index and nl is the number of vertical levels in the profile:
Here, xa,TCCON is the TCCON a priori profile scaled by the median TCCON-retrieved VSF across all the TCCON spectral windows for this gas, and the γL and γU values are the lower and upper column scale factors, respectively, which our algorithm retrieves. We relate this to the TCCON total column value using the standard equation from Rodgers and Connor (2003):
where zTCCON is the total column DMF output of a chosen species in a particular window from the TCCON fit, za,TCCON is the original vertical column DMF calculated from the a priori profile scaled by the median VSF of the windows used, and is the vector of column averaging kernel values output from the TCCON processing weighted by the pressure thickness of each atmospheric layer. All components in Eq. (3) are dry mole fractions, except for the averaging kernel which is unitless. Equation (3) tells us how the retrieved DMF would change if the profile constructed from the two partial columns differed from xa,TCCON.
The next step is to rearrange this equation so that our observed quantity is on the left-hand side, and the right-hand side is a linear combination of the two scaling factors. Subtracting za,TCCON from both sides and focusing on the rightmost term of Eq. (3), the averaging kernel is multiplied by the difference of the a priori and scaled DMF profiles summed for each of the nl levels of the atmosphere.
Here, we assign xpart to be the TCCON a priori profile scaled by two independent values, one for the lower partial column and one for the upper partial column. To designate the partial columns, our method splits the total column at a specified altitude level index q and scales the a priori profile below and above the level q independently by the scalar values γL and γU such that
Since Eq. (5) is linear, we then group terms, reducing the right side of Eq. (5) to
Defining two new variables, kL and kU, we can write this as follows:
where,=
and
and kL and kU are both scalar values.
Equation (7) is applicable to all spectral windows for each spectrum measured. For example, for our CO2 retrieval, we use four separate spectral windows per measured spectrum and often have a few hundred spectra measured per day. In the case of the CO2 retrieval, the left-hand side of Eq. (7) and the kL and kU values will be calculated for each of the four spectral windows used for each spectrum fit by TCCON. These values are aggregated into the vectors and matrices described by Eqs. (10)–(14) in order to fit the spectra measured over an entire day at one time.
2.2.2 Deriving the maximum a posteriori equation and solution
While Eq. (7) can be set up and solved for each spectrum using the total column value from each spectral window used in the TCCON fit, the TARDISS retrieval uses an entire day's worth of TCCON retrievals in order to increase the signal-to-noise ratio and to utilize the information from the temporal variation in the kernels. Fitting over an entire day of TCCON retrievals reduces the retrieved partial column error values compared to fitting individual measurements using Eq. (7). Section S1 in the Supplement shows the influence of including multiple observations on the retrieved partial column errors. Let nw denote the number of windows and ns the number of spectra over a day and wi and si denote the ith window and spectrum. We combine the above equations into a matrix form:
where y is the measurement vector composed of values from the left side of Eq. (7)
K is the Jacobian matrix of the kL and kU values over a day
vecxγ is our state vector of partial column scalars which are the same for all windows in each measured spectrum
and xa,γ is our vector of a priori partial column scalars
With ns measurements made in a day, nw spectral windows, and two partial columns, the y vector is of the size 1 by nwns, the K matrix is of the size nwns by 2ns, and the xγ and xa,γ vectors are of the size 2ns by 1. So for each spectrum, there is one γL value and one γU value, representing the partial column scale factors aggregated over the windows.
Since Eq. (10) is linear, we can apply a basic linear least-squares method to solve for the partial column scalars:
while the linear least-squares method provides a useable solution to our retrieval, it also has partial column error values on the order of 10 ppm, due to the strong anti-correlation of the lower and upper partial columns, which render the solutions unsuitable for carbon cycle science. Including constraints through a Bayesian approach reduces the retrieved partial column error values as shown in Fig. S1 in the Supplement. In addition, the least-squares method does not allow us to utilize additional a priori information in the covariance of the partial columns.
We use the maximum a posteriori (MAP) approach (Rodgers, 2008) to calculate the most probable state vector from the given models and a priori information. In line with the assumptions of the MAP approach, we assume our problem is linear and follows a Gaussian distribution. The MAP solution can take a few equivalent forms. In this work we use
where xa,γ is the a priori partial column scalar values, Sa is the a priori covariance matrix, K is the Jacobian matrix, Sϵ is the model covariance matrix, y is the measurement vector, and is the output solution vector. The input components (xa,γ, Sa, and Sϵ) are described in Sect. 2.3.2.
Once we have calculated the most likely solution for the partial column scalars as a vector in temporal space, , we reconstruct the partial column DMF values for the day for the lower and upper partial columns as follows:
where and are the values of the a priori partial column DMFs calculated by integrating the median TCCON a posteriori profiles for the measurements in a day using the same method as the standard TCCON full column retrievals (Wunch et al., 2011).
2.2.3 Calculating informational content
The MAP retrieval allows us to calculate the information content of the retrieval. In particular, we compare the degrees of freedom for our retrieval calculated by taking the trace of the averaging kernel of the fit, calculated as the follows:
as well as the Shannon information content derived from the natural log of the determinant of the difference between the averaging kernel and an identity matrix:
Generally, profile retrieval averaging kernels represent the sensitivity of a specific level of a profile to the rest of the levels in the profile. The averaging kernel for the TARDISS inversion is a temporal averaging kernel relating how each partial column calculation relates to every other measurement during a day. The DoF value for a day of the retrieval represents how many individual pieces of partial column information we can infer over the day of measurements. We either report the number of degrees of freedom from the fit over a day or normalize the degrees of freedom by the number of measurements in each day for a more comparative understanding of the TARDISS degrees of freedom with respect to a traditional profile retrieval and between days with a large variation in the number of measurements.
2.2.4 In situ comparison calculations
To evaluate the accuracy of our partial column retrieval, we use the smoothing calculation shown in Eq. (3) of Wunch et al. (2010), altered to use the terminology of this work, to determine the value of the partial columns of the TCCON total columns used as input:
where is the smoothed column-averaged DMF, za,TCCON is the column-averaged DMF of the scaled a priori profile, is the vertical averaging kernel for the specific spectral window dotted with an integration operator, fxtrue is the measured in situ profile in DMF, and fxa,TCCON is the scaled a priori profile. We use this equation to create the smoothed partial column TCCON DMF values by integrating to the same split point (q) as in Eq. (5). These values serve as a sort of null hypothesis to compare to the TARDISS retrieval to determine if the fits are effective in inferring partial column information.
In order to compare the partial column retrievals to in situ profiles for validation purposes, we calculate the vertical sensitivities of the TARDISS fit (shown in Fig. 8) using the gain matrix, G, from the TARDISS inversion and the averaging kernel profiles from the TCCON measurement windows as follows:
where
and aTCCON is the same vector of column averaging kernels from Eq. (3) without the integration operator for each window used and Avert is the vertical sensitivity of the partial column related to the profile. G has dimensions of 2ns by nwns, ΞTCCON has dimensions of nwns by 51, and Avert has dimensions of 2ns by 51. The gain matrix relates each measurement in a day to the upper and lower partial column calculation, which is useful to calculate the temporal DoF but is not directly comparable to in situ vertical profiles. The Avert term converts the temporal sensitivities of the gain matrix to vertical sensitivities using the TCCON vertical averaging kernel, allowing us to compare with the in situ validation profiles. We apply the average vertical sensitivities for the measurements used in comparison with in situ profile measurements.
Since aTCCON represents the change in TCCON total column DMF (also called Xgas) per change in true DMF at each level () and the gain matrix represents the change in partial column scalar per change in TCCON total column DMF (), Avert has units of change in partial column scalar per change in level DMF value () and relies on the difference between a “true” in situ profile and the a priori profile used in the inversion.
For our TARDISS comparisons, we use an adjusted version of Eq. (20) to determine the value the inversion would return if it were using the true profile instead of the scaled TCCON priors:
where fxa,TCCON is the a priori profile used in Eq. (3) and fxtrue is the measured in situ profile in DMF. The in situ profile is interpolated to the same vertical levels as the TCCON a priori profile as shown in Fig. 4. After calculating the smoothed in situ profile, we integrate the profile from the surface to the vertical level at which the partial columns are separated, q in Eq. (5), for the lower column. For the upper partial column, we integrate from the level q+1 to the top of the atmosphere for the upper column using the method outlined in Wunch et al. (2010). We then compare the integrated and smoothed in situ partial column DMFs directly with the reconstructed lower and upper partial columns calculated by Eq. (17).
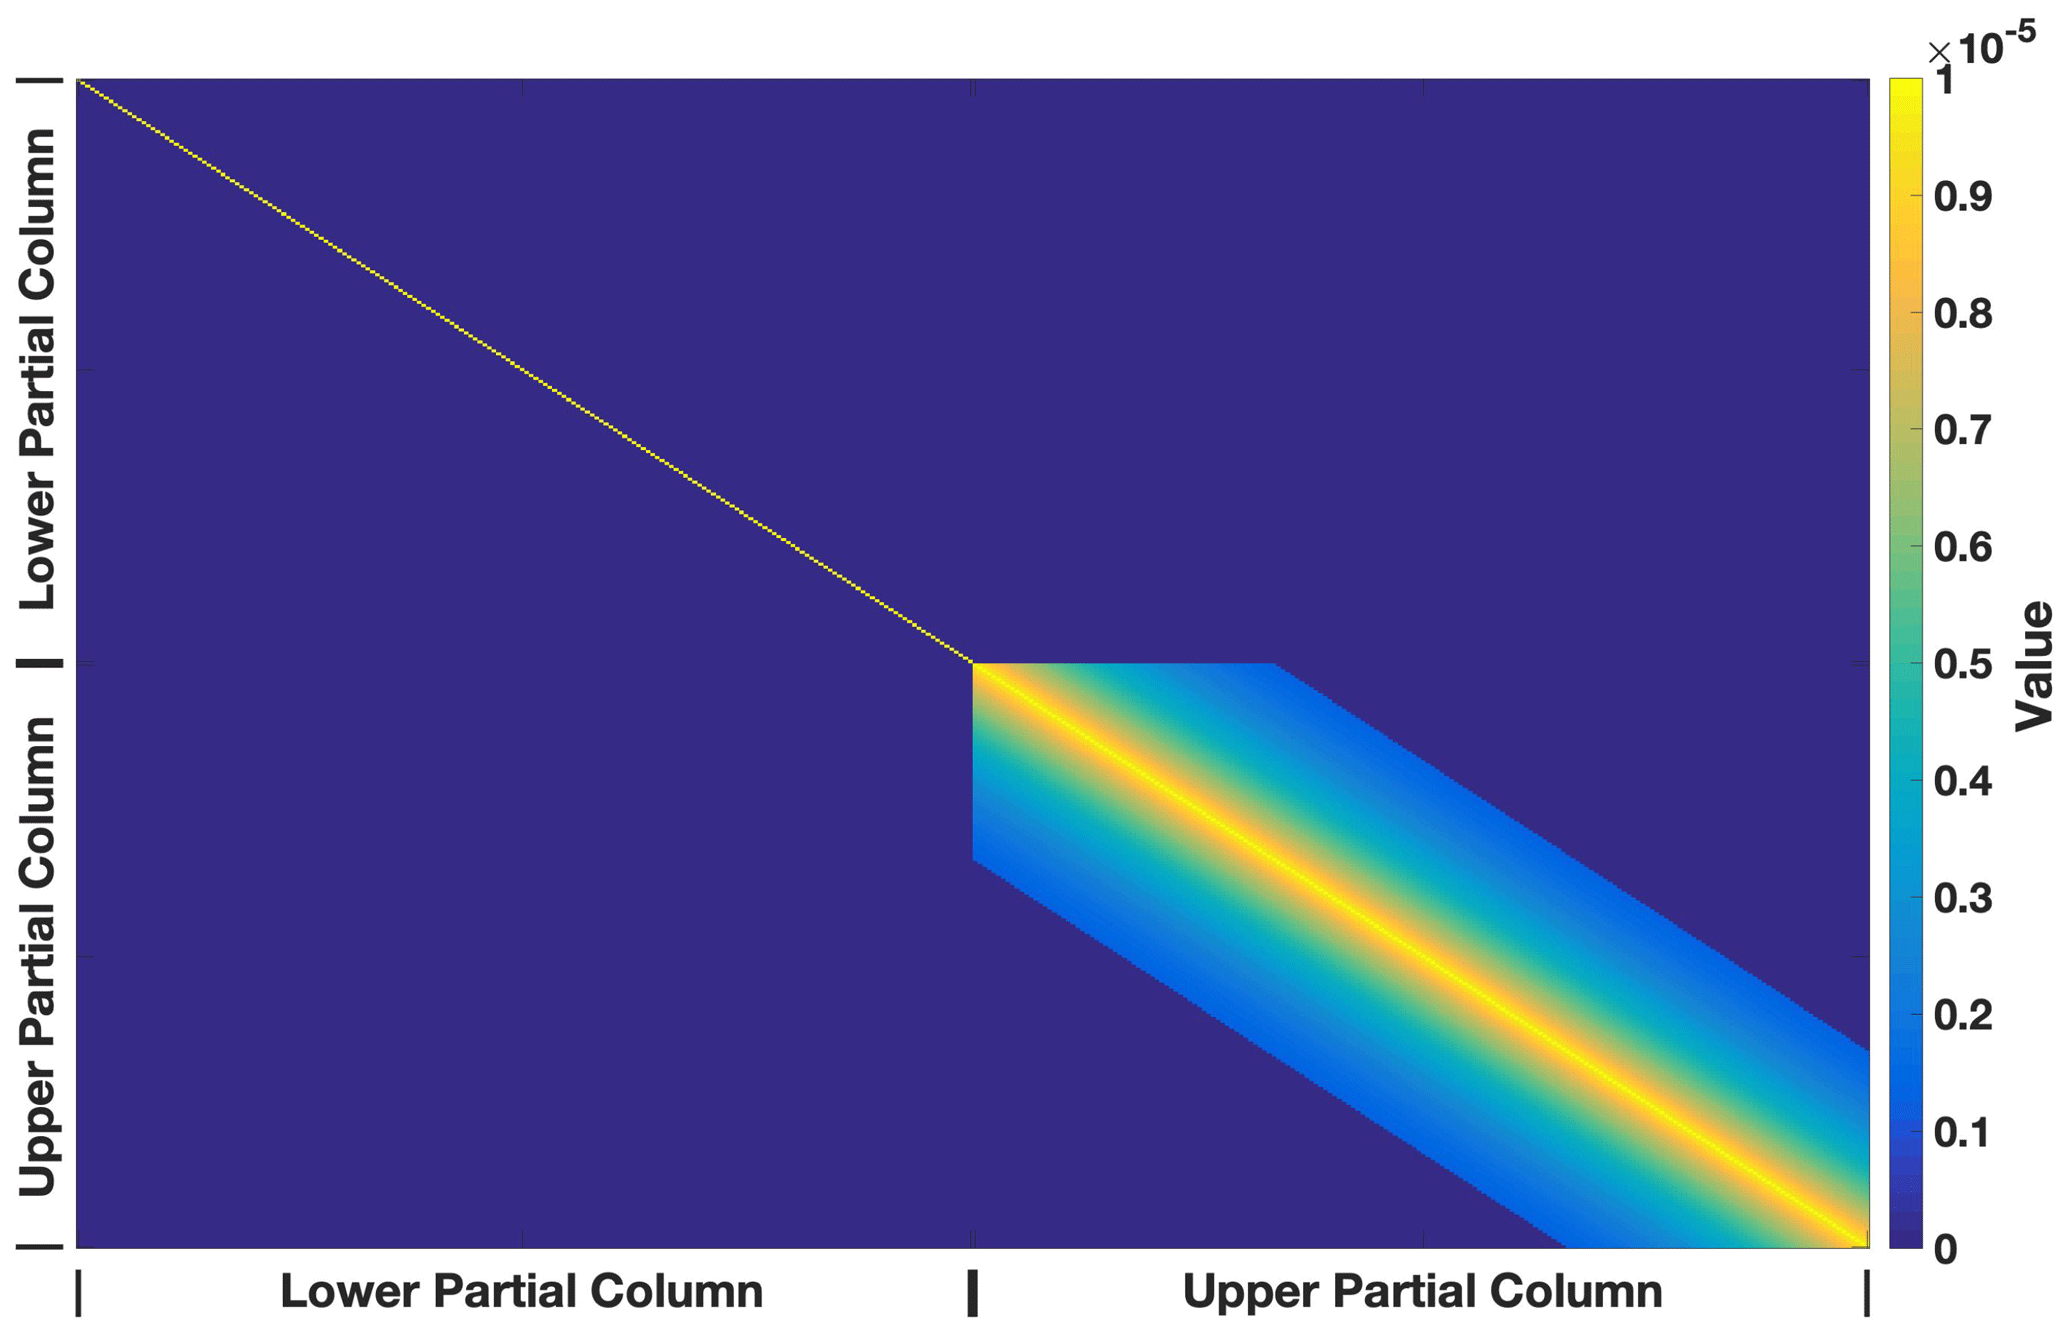
Figure 3Example of an a priori covariance matrix color coded by the magnitude of the value. The axes represent the relationship of the contribution of each measurement to each partial column and each other measurement. The upper-right and lower-left quadrants are dark blue and represent zero assumed correlation between the upper and lower partial columns over a day of measurements, respectively. The diagonal is scaled to constrain the fit and the lower-right quadrant shows the assumed correlation between upper partial column scalar values over a day of measurement. The lower partial column has an a priori covariance that is a scaled identity matrix, the upper partial column has an a priori covariance that decays over one-third of the measurement day, and the cross covariances between the upper and lower partial columns are assumed to be zero.
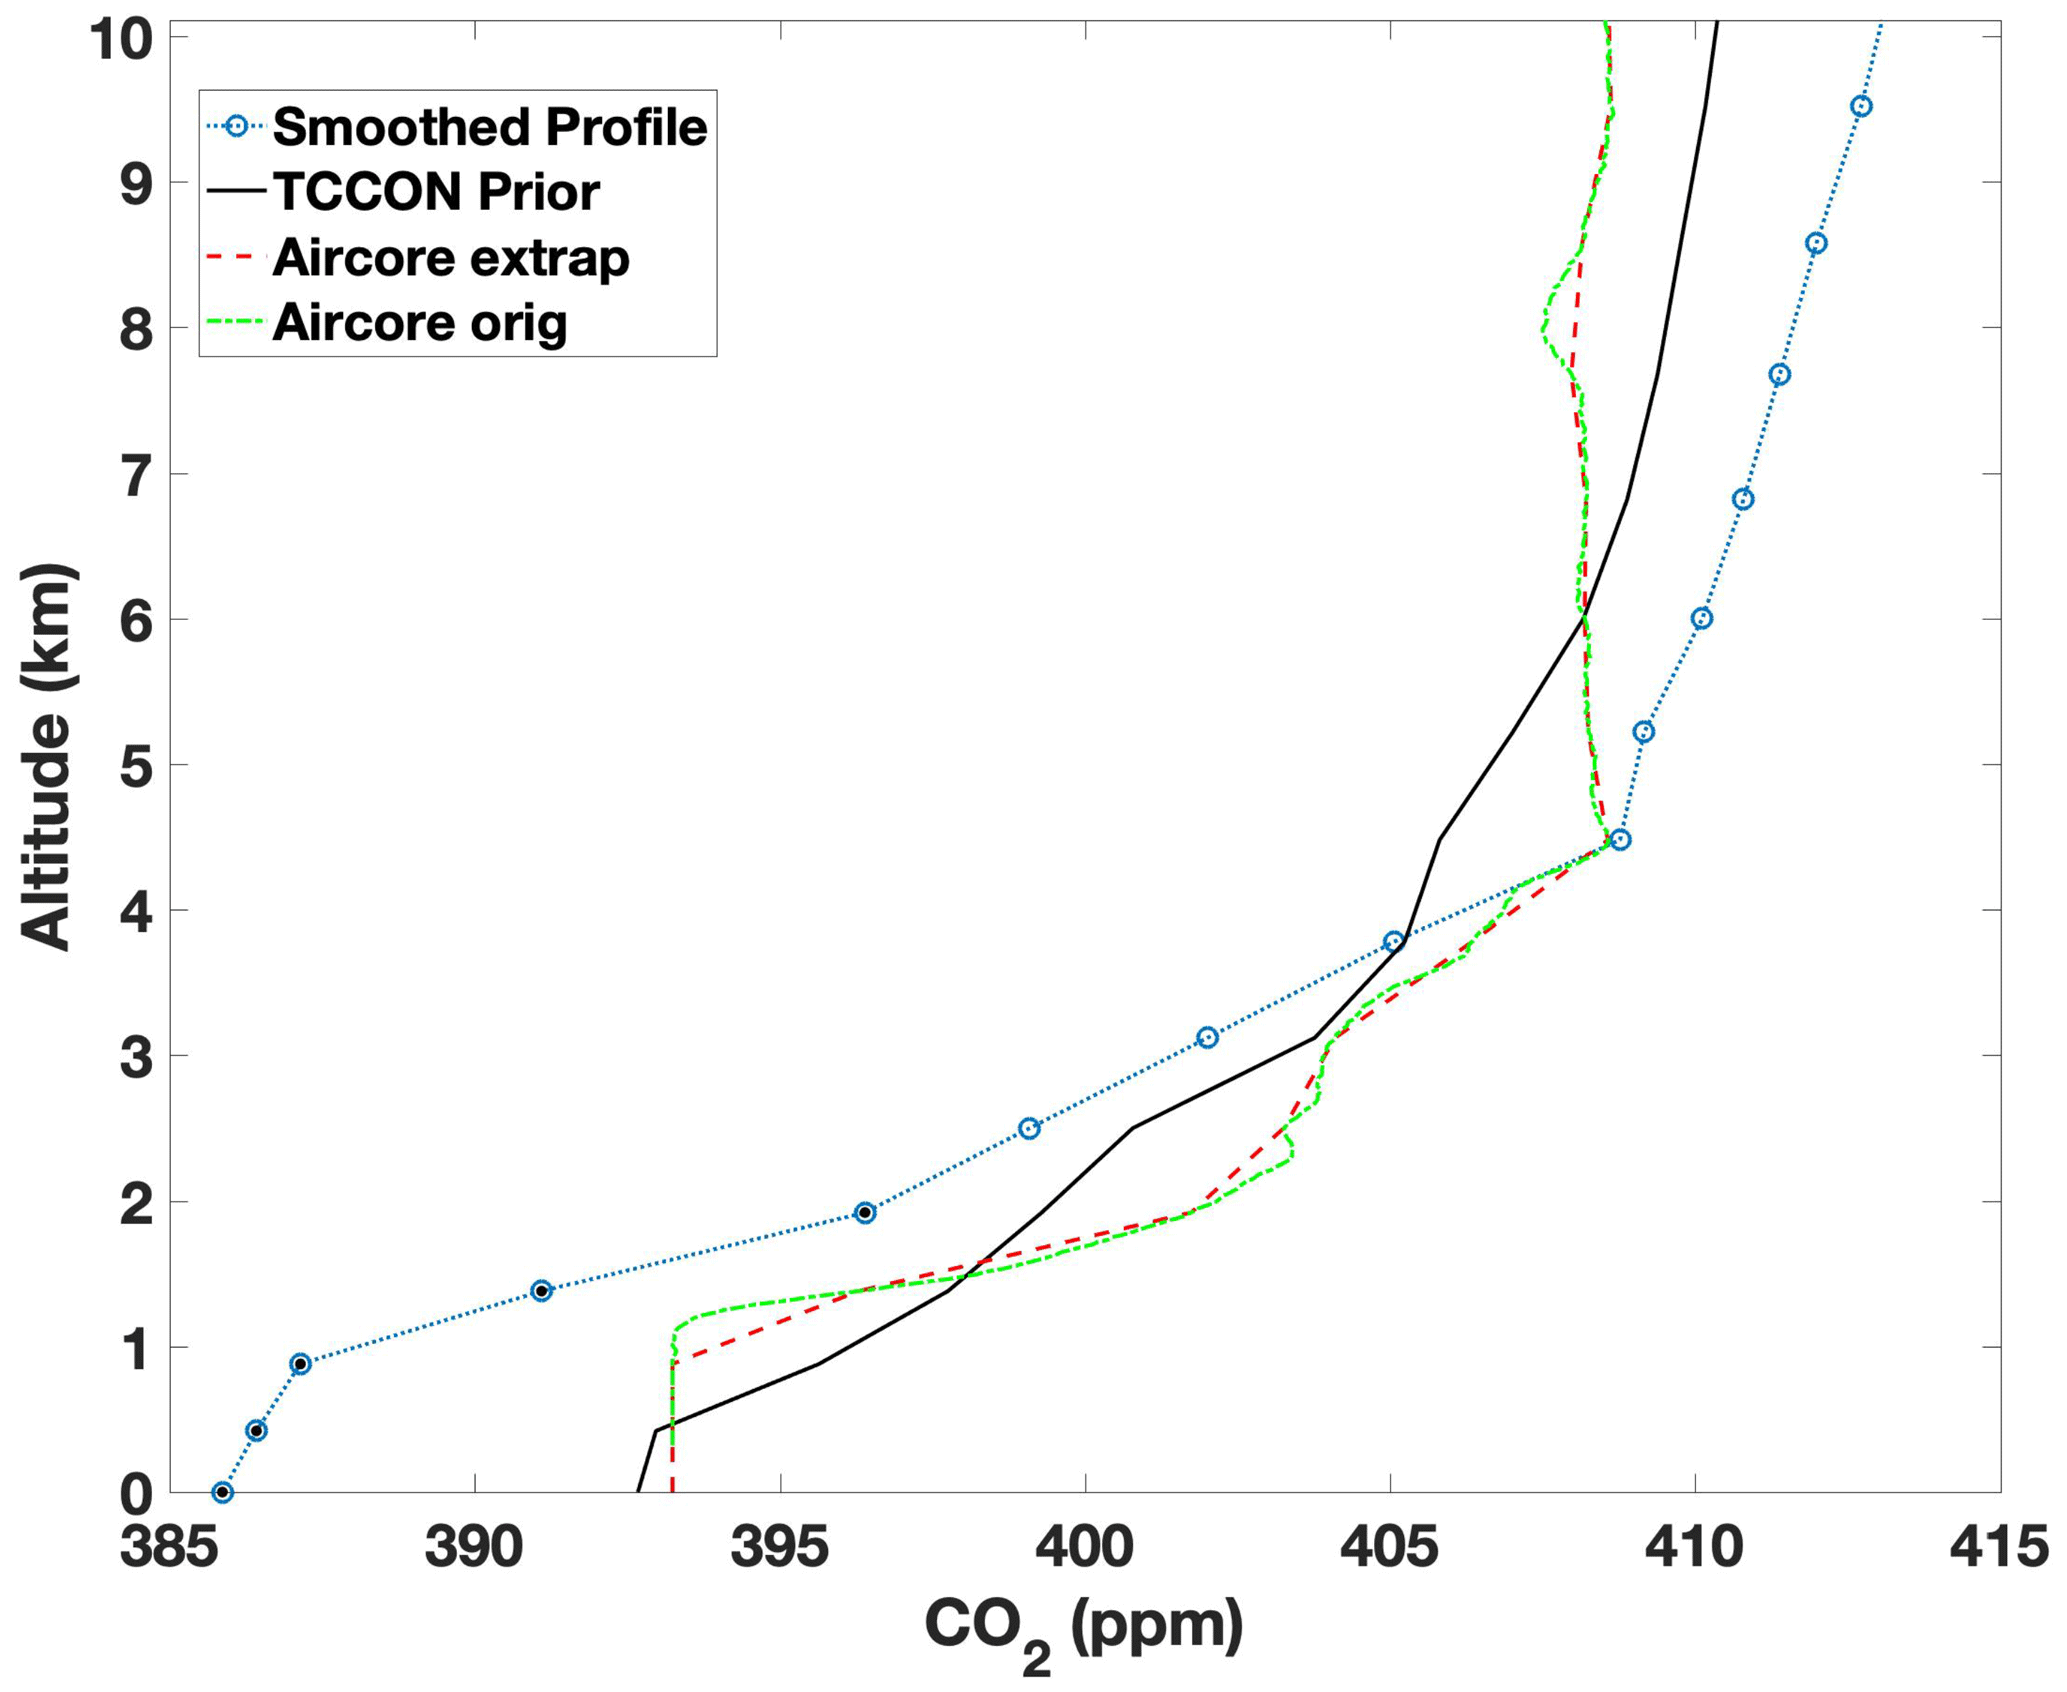
Figure 4An example of the profiles used in the direct comparison calculations using data from the Park Falls site on 27 July 2018. The profile above 10 km is not shown. The solid black line is the TCCON a priori profile scaled by the median of the vertical scaling factors from the spectral windows used. The dotted–dashed green line is the measured AirCore mole fraction. The dashed red line is the AirCore measurements interpolated to the vertical spacing of the TCCON prior, and the dotted blue line with circles is the smoothed vertical-sensitivity-weighted profile that is integrated to calculate the partial column that the TARDISS retrieval would calculate if it had a “true” AirCore profile. The black dots within the blue circles represent the points of the profile that make up the lower partial column.
2.2.5 Error calculations
Finally, the error for the retrieval is made up of model parameter error, smoothing error, and retrieval noise (Rodgers, 2008). There are no model parameters in the state vector of the TARDISS retrieval, so the model parameter error is zero. The smoothing error is the square root of the diagonal of the following matrix:
and the retrieval noise is the square root of the diagonal of the matrix calculated by
and the sum of the two are the total error for the fit.
In order to report an error for our retrieval that reflects the performance of the retrieval in the validation comparisons in Sect. 3.1, the retrieval output errors are multiplied by a scalar calculated from the one-to-one comparisons. Using the multiplier ensures that we are reporting a conservative estimate of the error in the retrieval. We use the one-to-one comparisons to scale our error values to the point where at least 50 % of the comparison points are within the 1 standard deviation error range of the one-to-one line. We calculate the scalar values as follows:
where is the comparison partial column values, is the integrated, smoothed, and in situ partial column values; σ is the output retrieval errors; and VEM is the calculated validation error multiplier that is unitless. The VEM is calculated and applied to all retrieved errors for each site so that the retrieved dataset for a site reflects the best representative error values. If a calculated VEM is less than 1, we use a VEM of 1 instead to avoid spuriously reducing error values. A complete discussion of the retrieval error is in Sect. 3.4.2.
2.3 Algorithm setup and choices
2.3.1 Pre-processing of the TCCON data
We begin by preprocessing the TCCON fits. We take the TCCON a priori profile and scale it by the median value of the TCCON output scalar values for each spectrum from the windows used so that our TARDISS fit is centered around the median TCCON a posteriori profile for each measurement point. The a posteriori errors from each window are not included in this calculation but are included in the formation of the measurement covariance matrix. This assumes that the true column-averaged VMR of a species is some linear combination of the VMRs calculated from the windows used in the TARDISS fit. We then calculate the a priori partial columns by integrating the scaled a priori profiles over the respective pressure levels for the upper and lower partial column. Finally, we assemble the necessary matrices for the fit described by Eq. (16).
2.3.2 Maximum a posteriori components
The different components of Eq. (16) reflect where a priori information can be used in the algorithm and several additional choices can be made to improve the fit. The following describes our standard input for these components. We present tests of the retrieval's sensitivity to these choices in Sect. 3.2.
For the a priori covariance matrix, Sa, we use an identity matrix for the lower partial column scalar portion of the covariance matrix, and we use an exponential decay over the day of measurements from the diagonal for the upper partial column scalar portion of the covariance matrix. This requires that upper column scalar values shift in relation to one another and prevents the upper partial column scalars changing too rapidly in time. The off-diagonal values of the upper partial column portion of the a priori covariance matrix decay with respect to the measurements made before and after them over the course of one-third of a day of measurement. We assume no correlation between the upper and lower partial columns, although this is a place for future study. Since the a priori covariance matrix is inverted in the calculations, decreasing the magnitude of the a priori covariance matrix scalar increases the constraints imposed during the calculations so that a scalar of 10−5 is a more strict constraint than a scalar of 10−4. A discussion of the influence of the temporal covariance is in Sect. 3.4.1.
The measurement error covariance matrix, Sϵ, is a diagonal matrix composed of the squares of the TCCON errors for each spectral window so that measurements with smaller errors are weighted more heavily than those with larger errors.
CO2 and CO use different values for the a priori TARDISS scale factors (xa,γ). For CO, we assume a uniform a priori scale factors of 1 for all observations. For CO2 we use the solution to the least-squares method, xL2 from Eq. (15) as xa,γ in Eq. (16). We adopted different approaches for these two gases since using a static a priori partial column scalar of 1 for the CO2 retrievals worsened the comparison to in situ data but improved the validation comparison for the CO retrievals (shown in Sect. 3.2).
2.3.3 Choosing spectral windows for the TARDISS fit
The primary information content used in our algorithm is derived from the fact that the total column abundances retrieved from different spectral windows of the same species will differ due to differences in their kernels unless the shape of the a priori profile is perfect. Accordingly, for this method to have sufficient information, windows with different vertical averaging kernels are needed, such as those shown in Fig. 1. Preferably, the TARDISS retrieval would use a window that is more sensitive to the lower atmosphere and a window that is more sensitive to the upper atmosphere so that a larger amount of information is contained between them. While it is imperative to use windows that have differing averaging kernel profiles, it is also necessary to use windows that have sufficiently low error in the TCCON fit.
For the partial column CO2 calculations, we use four spectral windows in the TCCON process centered at 6339, 6220, 4852, and 6073 cm−1, which were suggested for profile retrieval exploration by Connor et al. (2016). The 6339 and 6220 cm−1 windows are spectroscopically similar and have column averaging kernel profiles that vary with solar zenith angle providing some vertical information over the course of a day (see Fig. 1). The 4852 cm−1 window has an averaging kernel profile that is largest at the surface and smallest at the upper troposphere and lower stratosphere, and the 6073 cm−1 window has an averaging kernel profile that is effectively the opposite of the 4852 cm−1 window. Both the 4852 and 6073 cm−1 window averaging kernels are largely independent of solar zenith angle with the exception of the highest levels in the 6073 cm−1 window profile. For the partial column CO calculations, we use three spectral windows fit during the TCCON process. There is one window in the NIR region centered at 4233 cm−1, and there are two windows in the MIR region centered at 2111 and 2160 cm−1. The two MIR windows have similar averaging kernel profiles that maximize at the surface and drop to nearly zero at upper levels. The NIR window averaging kernel profile has a minimum at the surface and a maximum at the upper levels.
Unlike the CO2 windows that are all observed by the InGaAs detector, the MIR CO windows are measured by a liquid-nitrogen-cooled InSb detector. For this reason, we only have results of the CO partial column fits at the Caltech, Lamont, and East Trout Lake TCCON sites and, due to the lack of in situ profiling data in Pasadena, we only have direct vertical profile comparison results from the Lamont and East Trout Lake TCCON site.
Other windows output by TCCON retrievals were considered for the partial column calculations for both species. However, they had high levels of error in the TCCON fit or had fits that were particularly sensitive to changes in temperature.
2.3.4 Choice of partial column height
We chose the lower partial column to integrate from the surface through the first five vertical layers of the GEOS meteorological fields. Using this criterion, a site at sea level has a lower partial column from sea level to 2 km and the upper partial column from 2 to 70 km. While somewhat arbitrary, the choice of 2 km was made to have the lower partial column encompass the surface mixed layer at most locations while minimizing the dilution of surface exchange signals that would result from integrating over a larger partial column. If there are known significant species enhancements near the 2 km level (such as CO during wildfire events), the retrieval performance may be degraded, and a different partial column height may be a more appropriate choice.
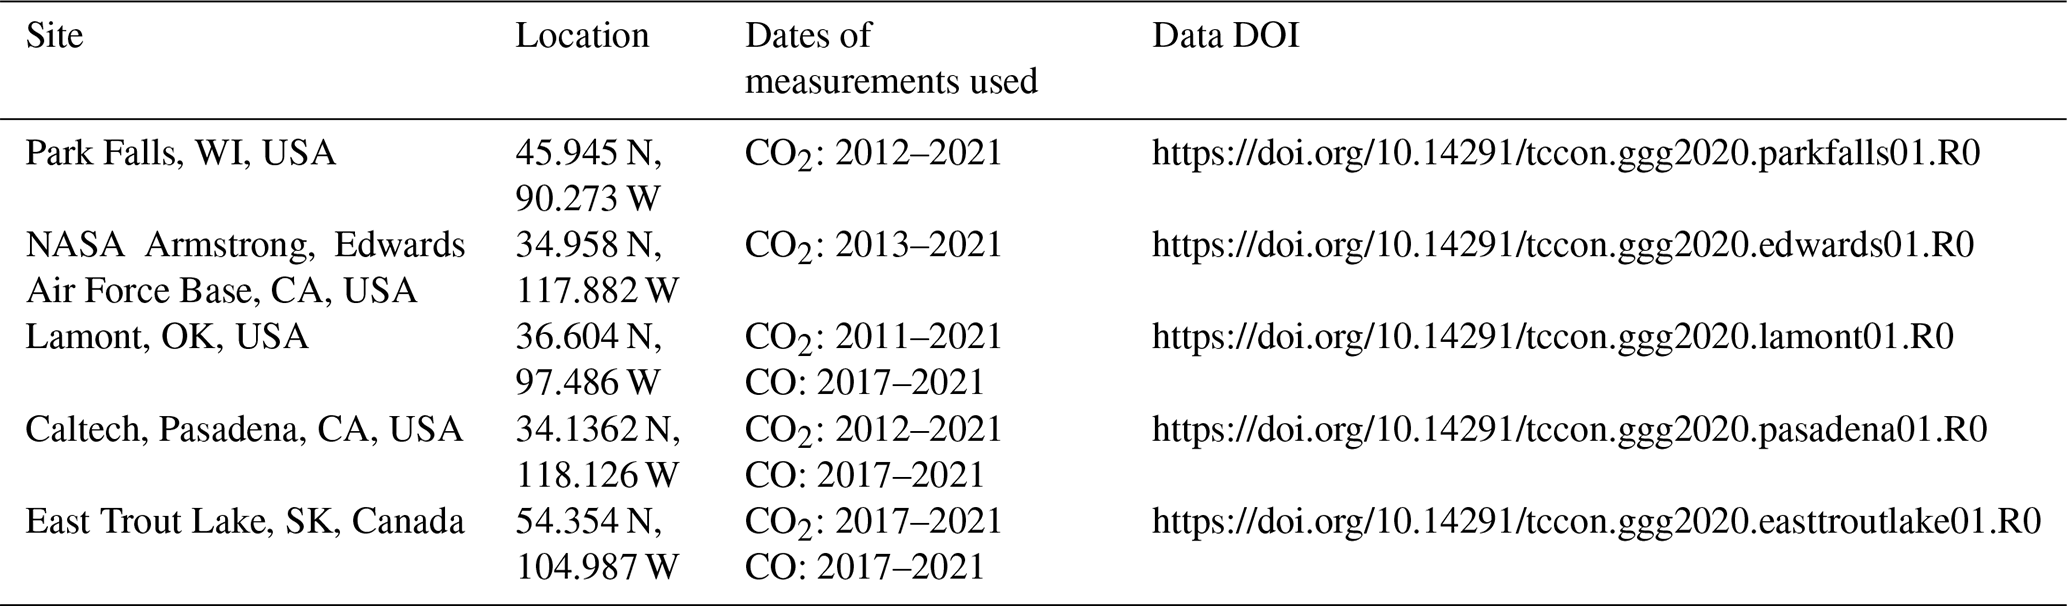
Table 1Location, dates of measurement, and DOIs of the TCCON sites used in this work. CO measurements require an InSb detector to cover the 2160 and 2111 cm−1 windows, which has only been available since 2017 at Caltech, Lamont, and East Trout Lake.
2.4 Sites used in this work
In this study, we use data from the five TCCON sites located across North America (Iraci et al., 2022; Wennberg et al., 2022a, b, c). The data record extends from as early as 2011 to as recent as 2021 (Table 1). These sites are located at Park Falls, Wisconsin; NASA Armstrong, Edwards Air Force Base, California; Lamont, Oklahoma (the Department of Energy Southern Great Plains Atmospheric Radiation Measurement site); the California Institute of Technology (Caltech); in Pasadena, California, and East Trout Lake, Saskatchewan.
Park Falls, WI, hosts the first operational TCCON site (July 2004–present). The site is in a rural, heavily forested area and generally far from anthropogenic influence. The Fourier transform spectrometer (FTS) does not have an InSb detector, so we are able to only retrieve partial column values for CO2. We focus on data obtained since 2012, when the alignment of the instrument has been more consistent. The increased variance of the TARDISS retrieval for data before 2012 likely reflects the inconsistent alignment of the FTS.
We use similar data from the TCCON site located at NASA's Armstrong Flight Research Center (formerly the Dryden Flight Research Center) in California, which has been operational since July 2013. We report CO2 partial column values for the 2013 to 2021 time period. The Armstrong site is on the northwest edge of Rogers Dry Lake within the Edwards Air Force Base in the Mojave Desert.
The Lamont, OK, TCCON site is surrounded by farmland. It has been operational since July 2008, and an InSb detector was installed in October 2016. We focus on data from Lamont obtained after 2011 after an issue with the instrument laser was resolved. We report CO2 partial column values from 2011 to 2021 and CO partial column values from 2017 to 2021.
The TCCON site on the Caltech campus in Pasadena, CA, has been operational since July 2012 with an InSb detector measuring since October 2016. We report CO2 partial column values from 2012 to 2021 and CO partial column values from 2017 to 2021.
The East Trout Lake, SK, TCCON site is located in a remote, heavily forested area in the middle of Saskatchewan. The instrument uses an InSb detector allowing us to retrieve partial column CO values. It has been operational since October 2016, and we report partial column values for CO and CO2 from 2017 to 2021.
2.5 Comparison data
We use in situ data from multiple aircraft programs and AirCore flights between 2008 and 2020 (Cooperative Global Atmospheric Data Integration Project, 2019; Baier et al., 2021) to evaluate our partial column retrieval.
The aircraft CO2 measurements are from the NASA Studies of Emissions and Atmospheric Composition, Clouds and Climate Coupling by Regional Surveys (SEAC4RS) campaign (Toon et al., 2016) using an AVOCET instrument, from the 2016 Atmospheric Tomography Mission (ATom) (Wofsy et al., 2021; Thompson et al., 2022) using a Picarro cavity ring-down spectroscopy (CRDS) trace gas analyzer (Crosson, 2008), from the Korea–United States Air Quality Study (KORUS-AQ) campaign (Crawfored et al., 2021) using a non-dispersive IR spectrometer, and from measurements made by the Goddard Space Flight Center using a Picarro CRDS trace gas analyzer.
We use AirCore profiles from July and August of 2018 at the Armstrong, Lamont, and Park Falls sites (Baier et al., 2021). The AirCore sampling system is composed of coiled stainless-steel tubing that is open on one end while ascending on a balloon to ∼ 30 km and passively samples ambient air as it descends to the ground on a parachute. This sample is then analyzed for CO2, CH4, and CO using a Picarro CRDS trace gas analyzer, and a fill dynamics model accounts for the effect of longitudinal mixing due to diffusion on vertical resolution (Karion et al., 2010; Tans, 2009, 2022).
Finally, we use CO and CO2 data measured at the Lamont site (site code SGP) and at the East Trout Lake site (site code ETL) as a part of the NOAA Global Greenhouse Gas Reference Network (GGGRN) aircraft network in North America (Sweeney et al., 2015). Since these datasets do not include much data within the upper partial column, we compare these measurements only to our retrieved lower partial column values and exclude them from the validation discussion in Sect. 3.2. Table S2 in the Supplement provides a summary of the in situ data used in this work.
The TARDISS algorithm is very quick – taking only a minute of processing time per year of data for each species – because it does not repeat the spectral fitting. This speed enables the validation comparisons to be performed using many different model choices. Thus, we evaluated the sensitivity of the TARDISS inversion by varying different forward model choices. The set of choices that we have designated as the operational setup for CO2 inversion are as follows.
-
The covariance matrix, Sa, is scaled by 10−5 to better constrain the fit.
-
The value of the a priori scalar for the lower and upper partial column scalar (xa,γ in Eq. (16)) is the least-squares solution for the respective column (xL2 in Eq. 15).
For the CO inversion, the operational setup parameters are as follows:
-
a covariance matrix, Sa, scaled by 10−4
-
an ideal a priori partial column scalar (xa,γ) of 1.
We vary two aspects of the algorithm and observe the differences in the validation comparisons. The results of these tests are discussed in Sect. 3.2 and represented in Tables 2 and 3.
3.1 Validation comparisons
We compare retrieved partial column values from three of the five sites presented in this work using measurements from the same set of in situ data used to evaluate and derive the “in situ scaling factor” of the TCCON retrievals (Wunch et al., 2011). For CO2, there are 24 points of comparison obtained between 2013 to 2018. A total of 12 of those comparisons are from the Armstrong TCCON site, four profiles are available above the Park Falls TCCON site, and the remaining eight profiles are from the Lamont TCCON site. As the Lamont site is the only site in this work with an InSb detector and overlapping in situ measurements, the eight profiles measured at the Lamont site serve as the totality of the CO comparison dataset.
We also compare the partial columns calculated from the TCCON individual windows to further contextualize the performance of the TARDISS algorithm in Sect 3.3.1 and summarized in Table 4. The comparisons of the TCCON individual windows are performed in the same way as the TARDISS comparisons using Eq. (20) to calculate the smoothed in situ partial columns.
The comparison profiles were measured by aircraft-based instruments or AirCore measurements as described in Sect. 2.5 and Table S2. We revert to the TCCON priors for parts of the profile not measured by in situ methods. For the errors associated with the aircraft measurements, we use the reported measurement error for the measured parts of the profile, and for the unmeasured parts of the profile we use the average reported measurement error. To account for the errors involved with estimating the parts of the profiles not measured by in situ methods, we add in quadrature twice the standard deviation of the measured profile in the respective partial column. For the errors associated with the AirCore measurements, we use the same approach as for the aircraft measurement and include an extra error term to conservatively account for atmospheric variability as captured by duplicate AirCores launched at approximately the same time. The error for AirCore from atmospheric variability is 0.6 ppm for CO2 and 8 ppb for CO compared to the analyzer error of 0.05 ppm and 3 ppb. The partial column error values are calculated by integrating a profile shifted by the error values and subtracting it from the integration of the original smoothed profile. The difference between these two integrated and smoothed partial columns provides a conservative error value that represents the unlikely occurrence that the profile at every altitude has 100 % error.
We compare the TARDISS retrievals from spectra obtained within 1 h of the in situ profile to the integrated, smoothed, and in situ partial columns calculated using Eq. (24). We report linear fits between the partial column retrievals and the integrated, smoothed, and in situ partial columns. Since our retrieval is designed to be linear, we use fits with y intercepts forced through zero. As there are only scaling values in our retrieval, a non-zero y intercept would introduce spurious error into our analysis. Since the reported coefficient of determination for this linear fit would be spuriously high, we take the ratio of our retrieved partial column to the integrated, smoothed, and in situ measurement and subtract one to quantify how much they deviate from each other. We report the mean of the absolute value of the ratio as it deviates from 1 as the mean ratio deviation. For example, a 1 % difference in values would give a mean ratio deviation of 0.01. This mean ratio deviation value gives a more direct understanding of how the partial column values compare.
We use these validation comparisons to perform sensitivity tests of our algorithm parameters and determine an operational set of parameters. We then use these optimal parameters for the CO2 and CO retrievals to quantify the total error of our retrieval by calculating a validation error multiplier for each site. Validation error multipliers for each site and partial column are shown in Table 6.
3.2 Choice of operational parameters from validation comparison
Several terms in our retrieval do not have unambiguously correct values. To evaluate the sensitivity our retrieval to the choices made for these parameters, we have run our retrieval with alternate values and report the degrees of freedom and comparison to in situ data (specifically, the retrieval comparison error, slope of the zero-forced linear fit, and the mean ratio deviation value of the linear fit) for each test. We tested changes to two terms: the TARDISS a priori scale factors and the a priori covariance matrix scaling.
Table 2Variations in CO2 retrieval upper and lower column validation slopes, upper and lower column mean ratio deviations, upper and lower column comparison errors, and DoF for different TARDISS a priori choices and a priori covariance matrix scaling values. The asterisk in the fourth row indicates that this is the operational set of parameter choices for the CO2 retrieval.
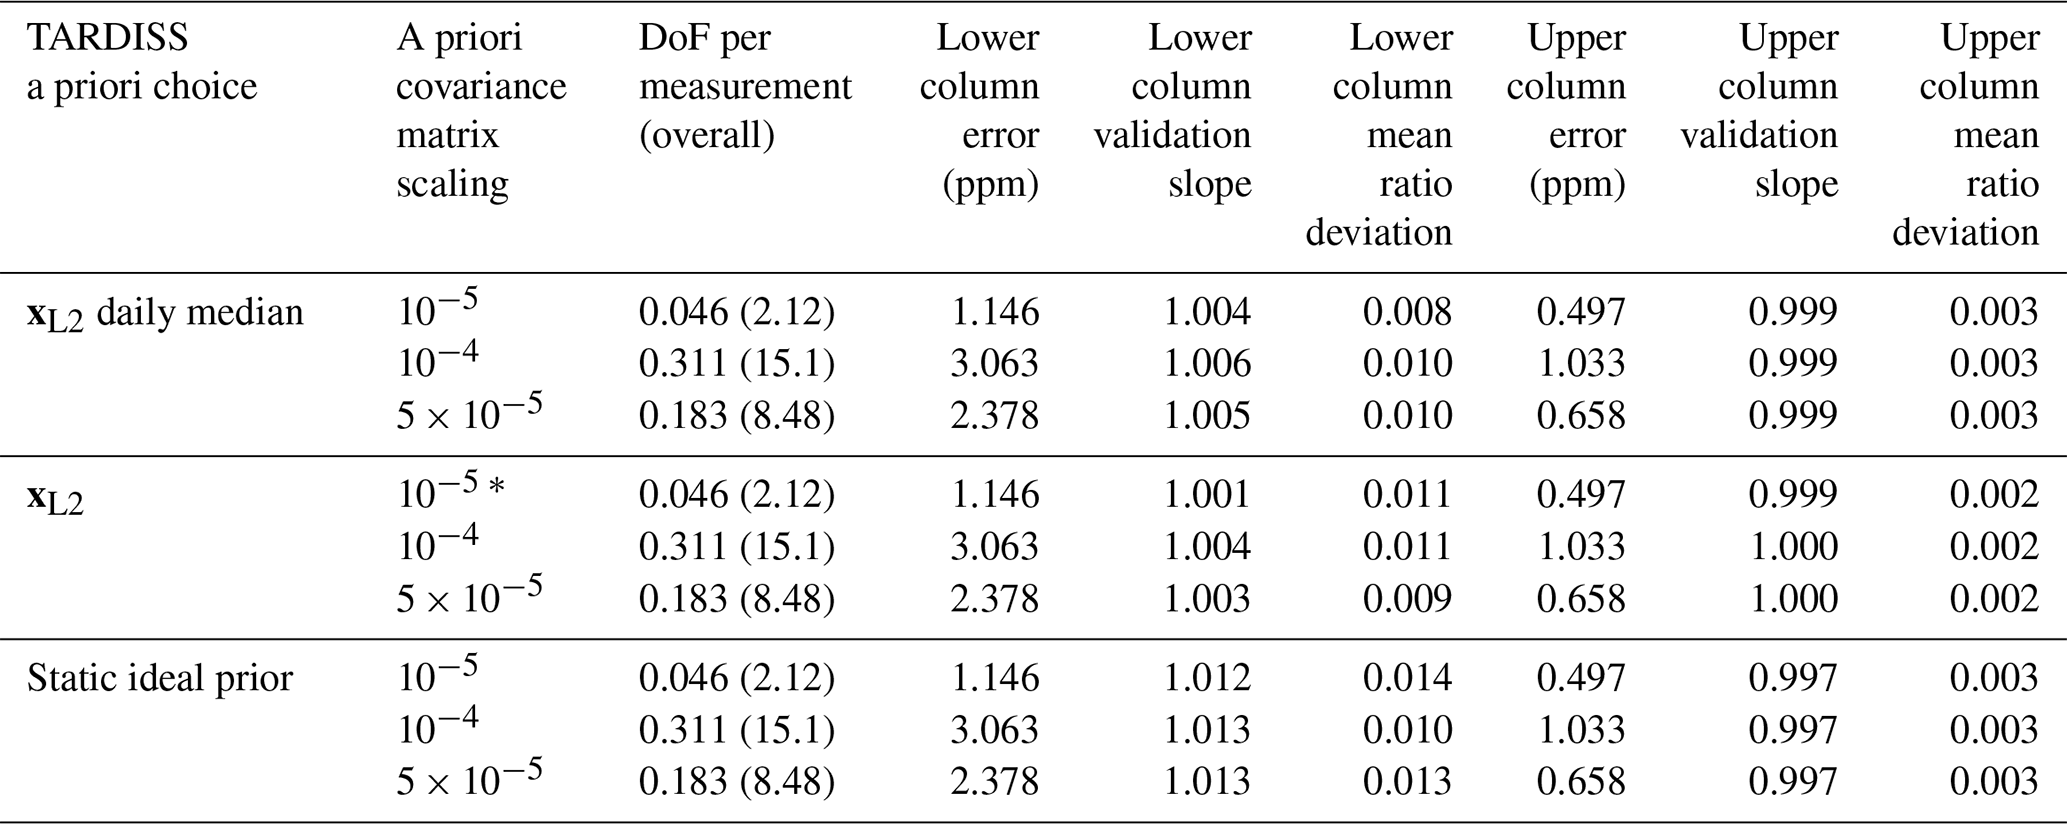
Table 3Variations in CO retrieval upper and lower column validation slopes, upper and lower column mean ratio values, upper and lower column comparison errors, and DoF for different TARDISS a priori choices and a priori covariance matrix scaling values. The asterisk in the second to last row indicates that this is the operational set of parameter choices for the CO retrieval.
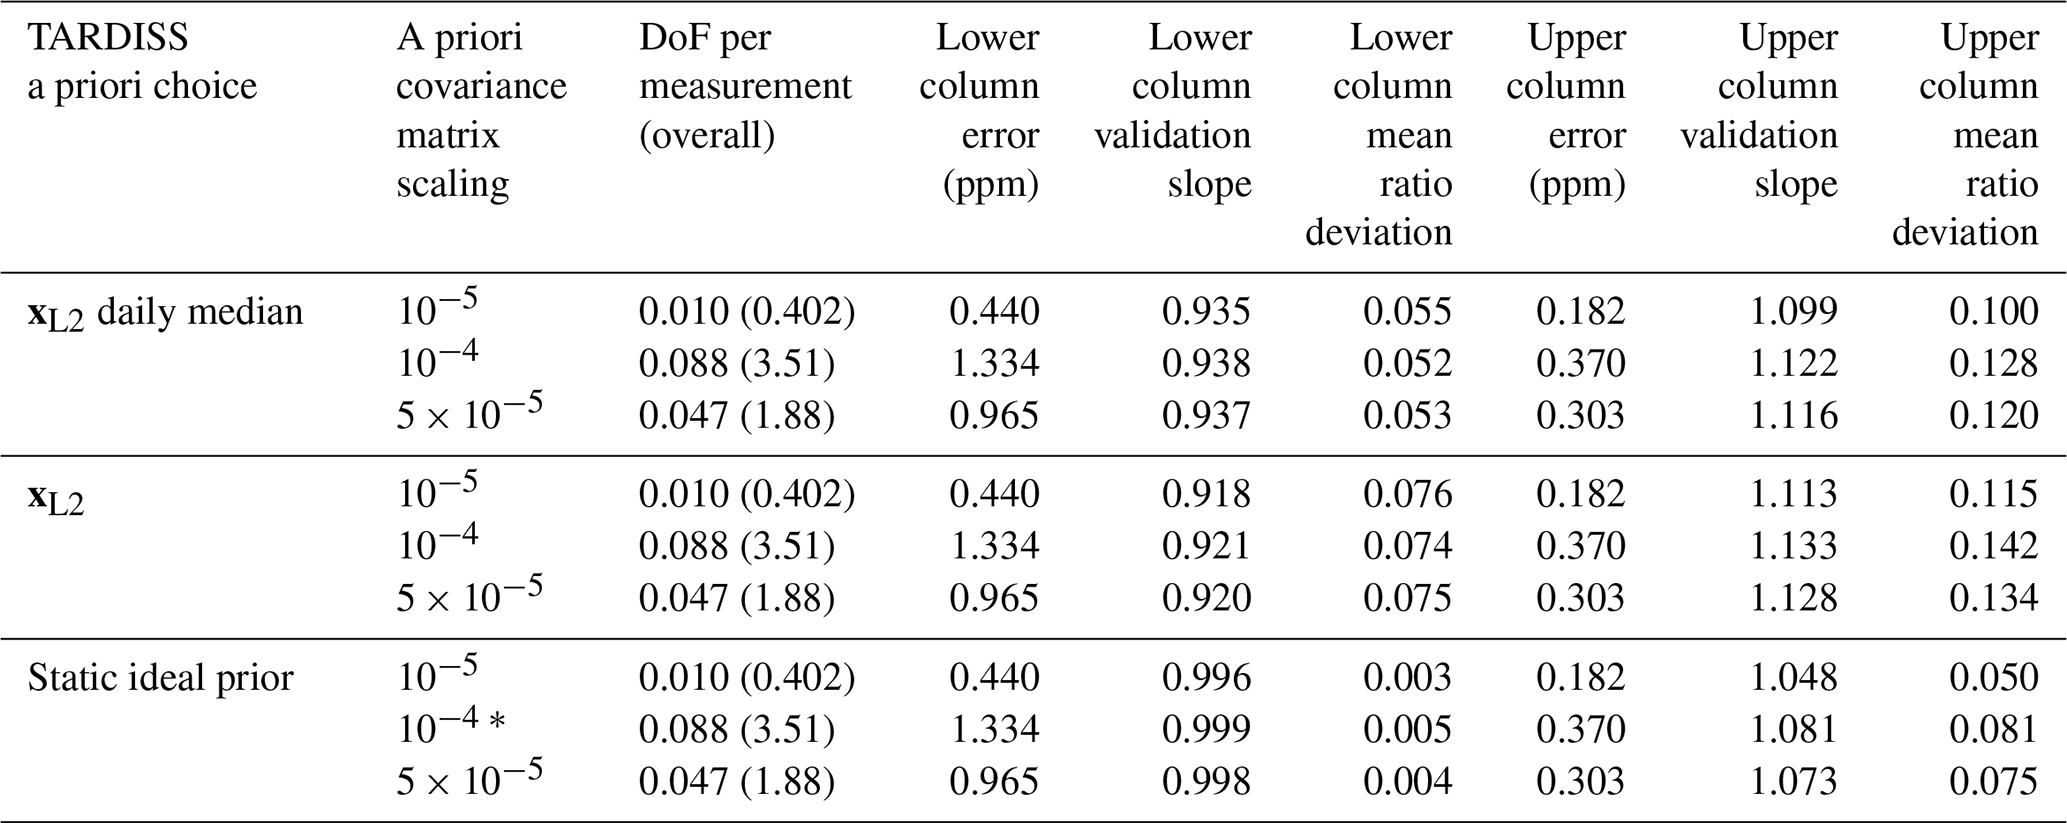
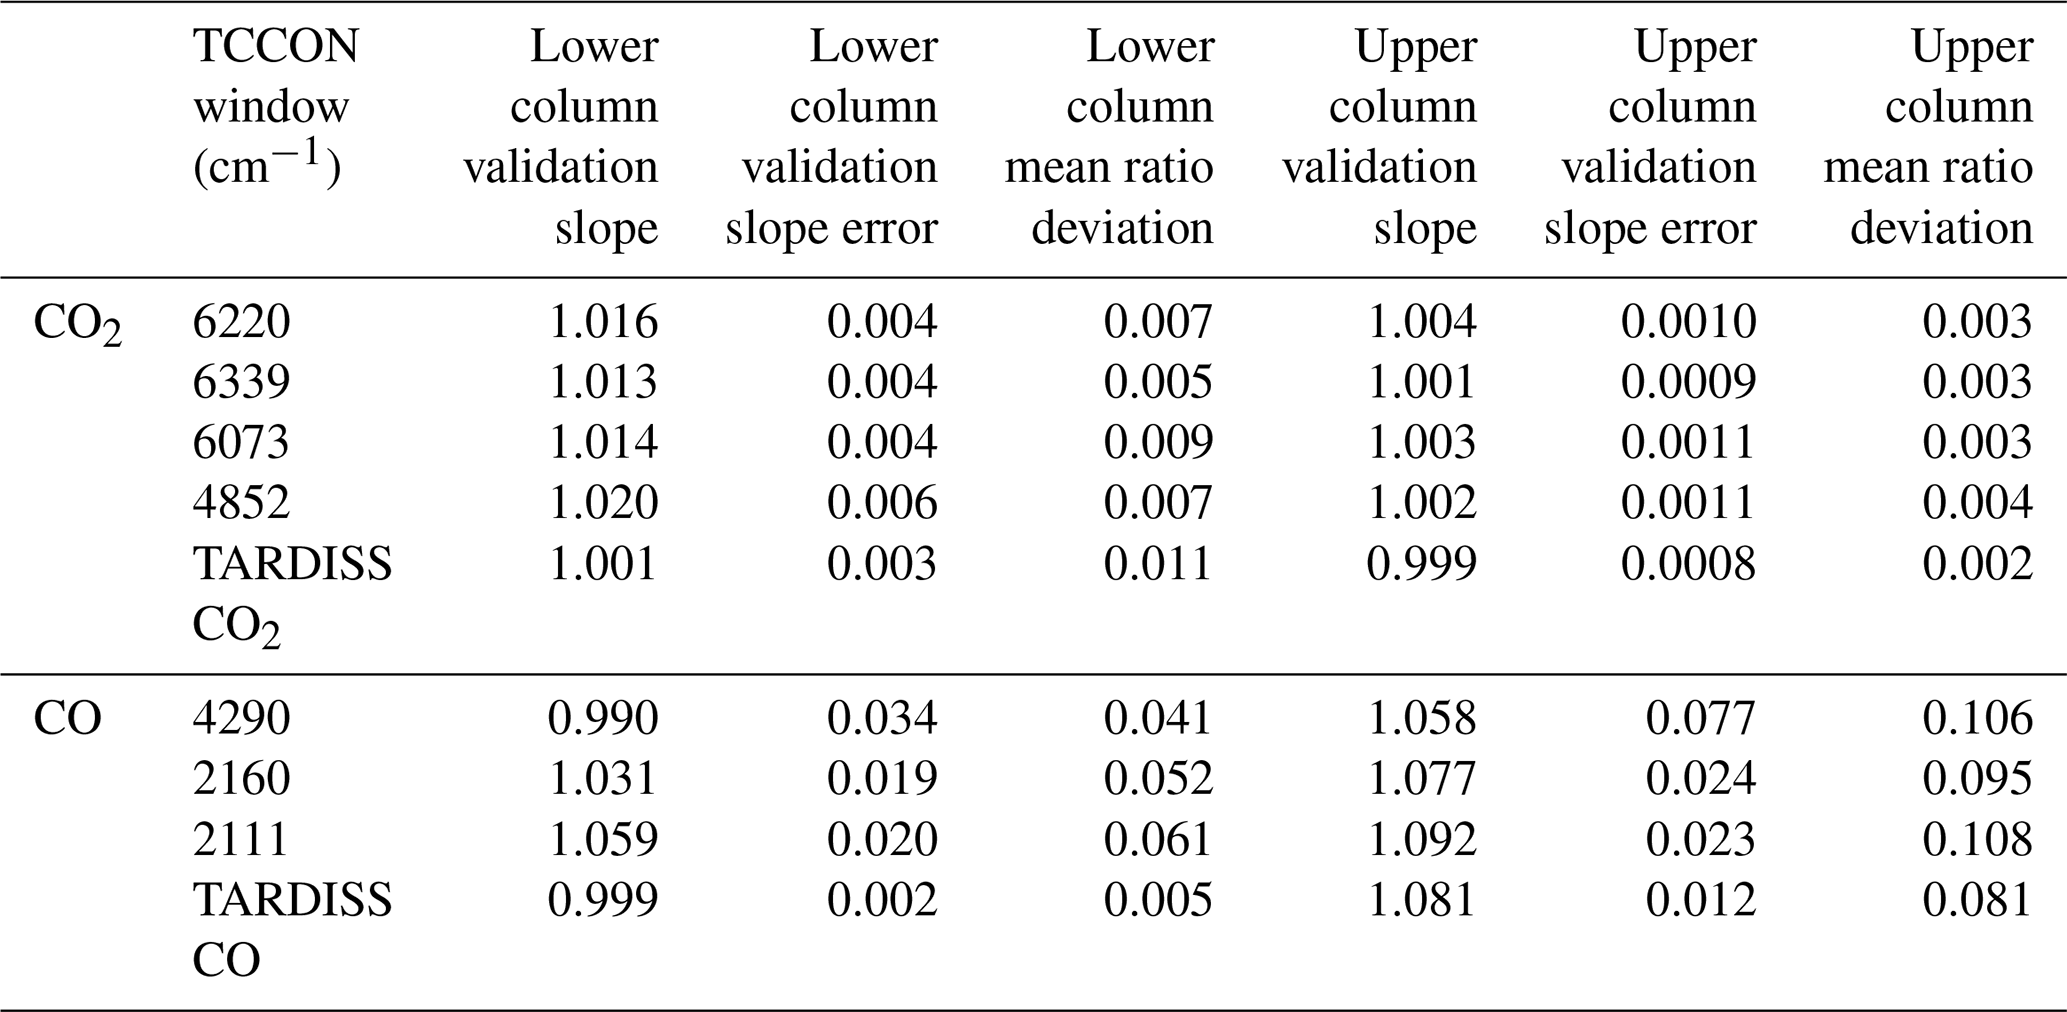
Table 4Comparisons of the TARDISS partial column retrieval to the partial column comparisons of the fits of the TCCON spectral windows from TCCON used as input for the TARDISS algorithm. The data in the TARDISS row uses the operational parameters for the fit that are identified in Tables 2 and 3 by an asterisk.
To test the sensitivity of the retrieval to the partial column scalar prior, we compare the changes in the validation when using xL2 from Eq. (15) as the a priori partial column scalar (our operational choice for CO2), the daily median of xL2, as well as the idealized scalar of unity (our operational choice for CO) to each other. In Tables 2 and 3, these are identified as “xL2,” “xL2 daily median,” and “static ideal prior,” respectively.
We also test the sensitivity of the retrieval to how the a priori covariance matrix is scaled. This term changes how strongly the retrieval is constrained to the prior. In Tables 2 (CO2) and 3 (CO), we illustrate the influence of choosing 1 × 10⁻⁴, 5 × 10⁻⁵, and 1 × 10⁻⁵ as an a priori covariance matrix scalar. While other scaling values were tested, the resulting errors were large enough or the resulting degrees of freedom were small enough that the values were disregarded from further study.
The agreement between the in situ and TARDISS retrievals for CO and CO2 change with both the a priori covariance matrix scaling and the a priori scalar choice. As we are trying to determine the parameters that give the best comparison results between the in situ and lower partial column retrieval data specifically, we chose the parameters that resulted in the validation slope closest to 1 for the lower partial column. For the lower partial column CO2, the best result (slope of 1.001) comes from using the xL2 values as an a priori scalar and scaling the a priori covariance matrix by 10−5. The validation slope for the upper column comparison with these parameters (0.999) is similar to values from other parameter choices. For the lower partial column CO, the best result for the lower column (slope of 0.999) results from the retrieval using a static a priori scalar of 1 and scaling the a priori covariance matrix by 10−4. Over the 2 h of the comparison, the degrees of freedom are about 2.12 for CO2 and 3.51 for CO – consistent with between 1 and 2 DoF per hour of measurements. Since the largest variation in validation slopes in either partial column and either species is driven by the change in the a priori partial column scalar, we posit that the a priori partial column scalar choice is the most significant parameter in the retrieval for determining validation slopes, while the a priori covariance matrix scaling is the most significant parameter for determining the degrees of freedom of the fit and the retrieval errors.
3.3 TARDISS performance using operational parameters
3.3.1 Comparisons with calculated TCCON partial columns
We compare the validation performance of the TARDISS partial column retrievals to the partial column validations of the TCCON individual windows used in the retrieval to demonstrate that TARDISS provides additional information about vertical distribution compared to the TCCON retrieval. We compute a partial column from the TCCON output by integrating the posterior TCCON CO or CO2 profile (i.e., the prior profile times the retrieved TCCON VSF) over the same pressure levels as the partial columns are calculated over for TARDISS. We compare the TCCON partial columns to the integrated, averaging kernel-smoothed, and in situ partial columns calculated using Eq. (20). The comparisons are shown in Table 4, and the slopes of the TCCON window partial column comparisons are shown as dotted lines in Fig. 5.
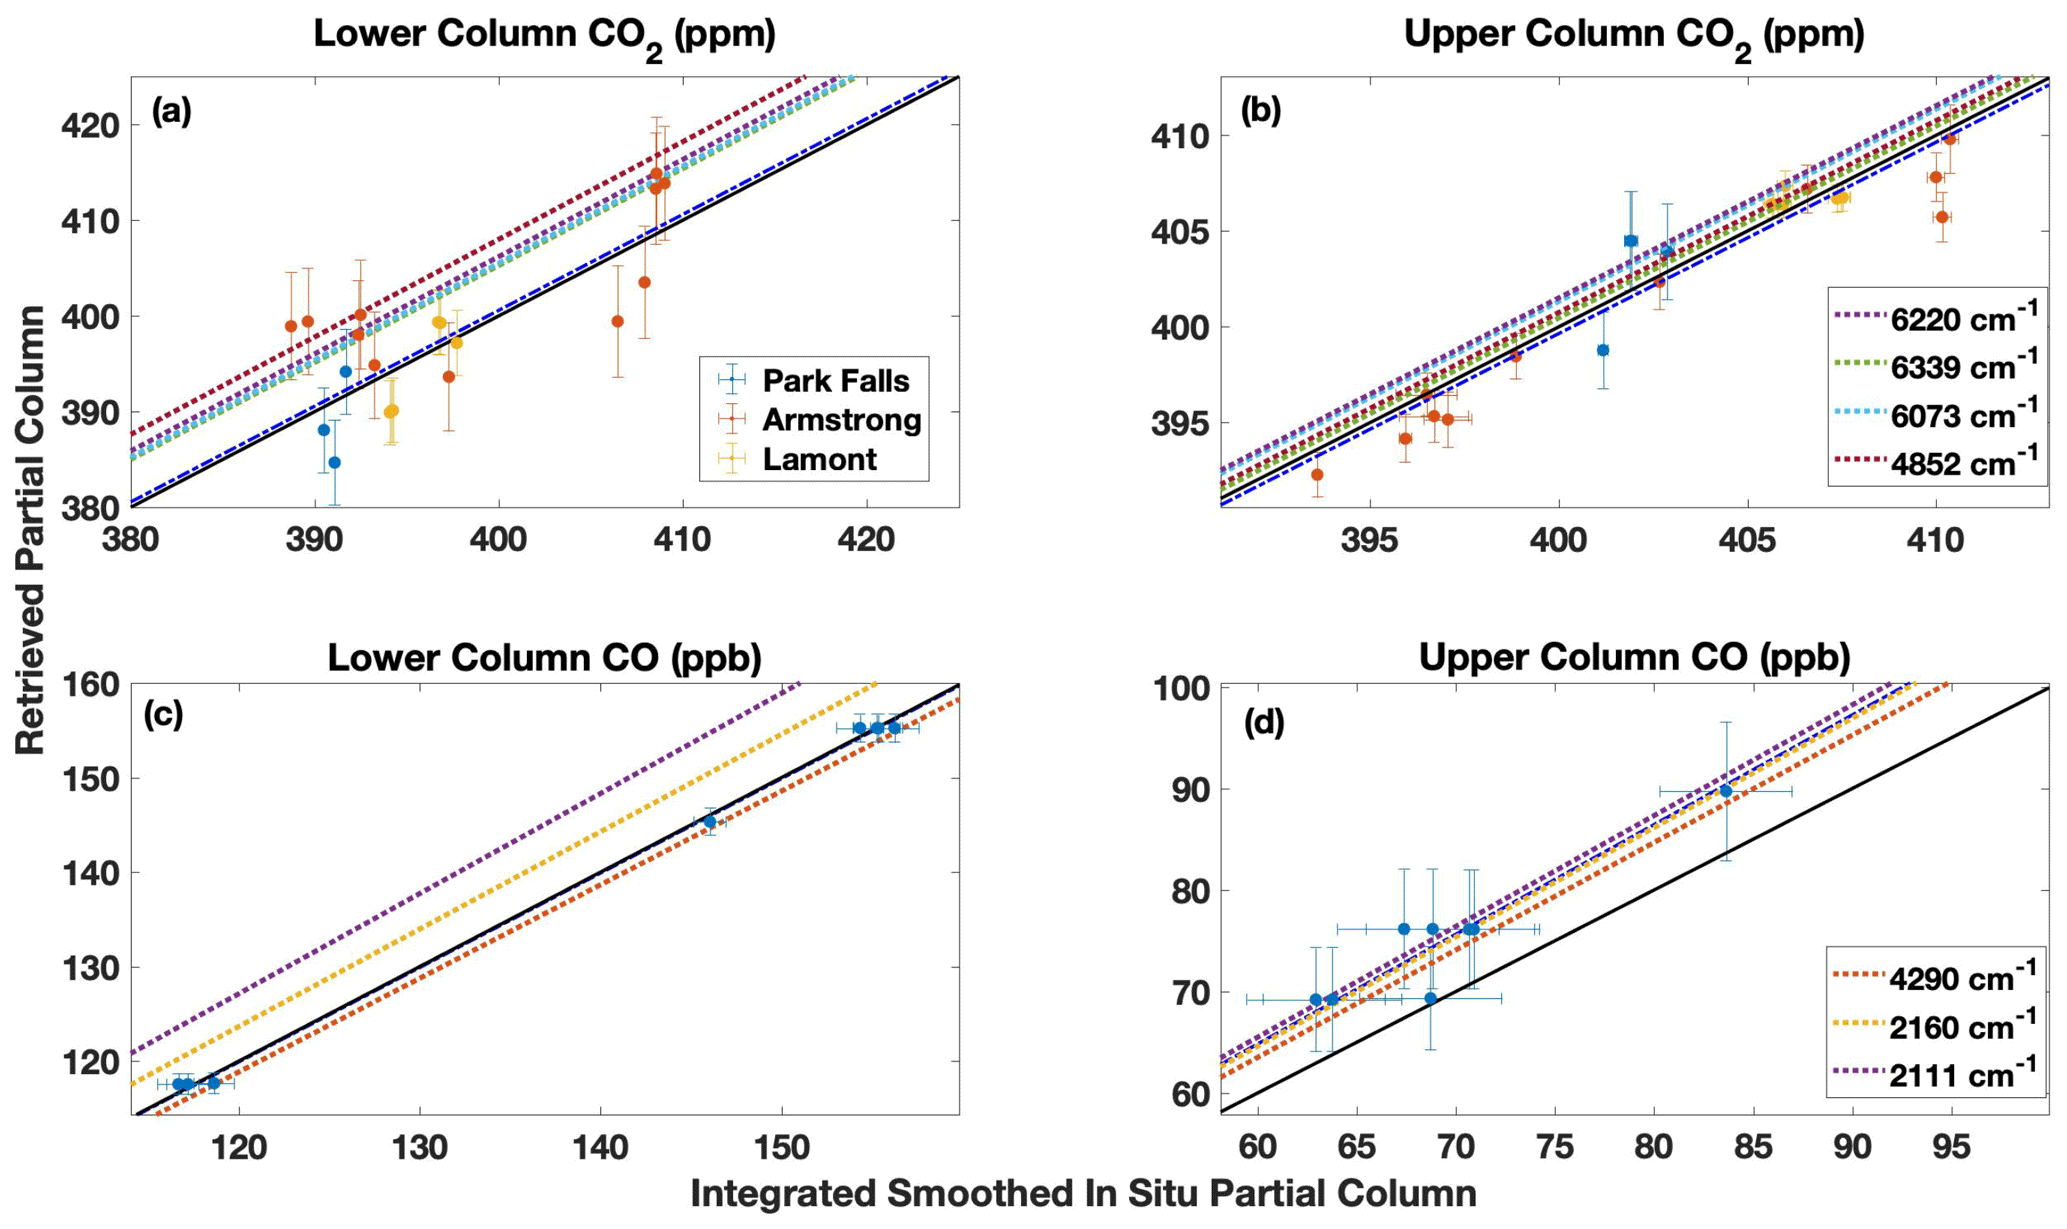
Figure 5The direct comparisons between the partial column DMF values retrieved from the TARDISS fit and the integrated, smoothed in situ partial columns for CO2 (a, b) and CO (c, d) for the lower (a, c) and upper (b, d) columns. The CO2 comparisons are color coded by site, and the CO comparisons are solely from the Lamont site. The error bars in the x direction are the reported errors from the aircraft data smoothed the same way as the in situ measurements, and the error bars in the y direction are the output errors from the TARDISS fit scaled by the VEM values. The solid black line is the one-to-one line, and the dotted–dashed blue line is the linear fit of the data with the y intercept forced through zero. The dotted–dashed blue line for the lower partial column CO fit is overlapping with the solid black line. The slopes of the partial column validation of the TCCON spectral windows used in the retrieval are represented by dashed lines.
The comparisons show that the TARDISS retrieved partial columns for CO2 have lower and upper partial columns slopes closer to 1 than the TCCON input windows. The mean ratio deviation for the lower column CO2 is slightly larger than the mean ratio deviation for the TCCON input windows (0.011 compared to a TCCON average of 0.007), which is reflected in the error of the lower partial column CO2 retrieval. The retrieved lower partial column for CO has a slope much closer to 1 than the slopes of the TCCON input and with a much smaller mean ratio deviation (0.002 compared to a TCCON average of 0.024). The retrieved upper partial column CO has a slope that is between the slopes of the TCCON input windows but still has a smaller mean ratio deviation, suggesting increased precision.
These comparisons suggest that, for CO, the TARDISS algorithm is very effective at separately inferring the lower partial column CO values since the validation slope is closer to 1 and the mean ratio deviation is smaller than the individual windows. The algorithm is limited in its retrieval of the upper partial column CO, which is shown by its direct comparisons and mean ratio deviation being similar to the TCCON input window partial column. The performance of the algorithm suggests that the large variations in the CO vertical profile shapes benefit from the increased flexibility in the lower column but that there might be some spectroscopic biases to correct, particularly in the mid-infrared windows.
For CO2, the comparisons show that the algorithm can effectively infer upper partial column values but is less effective at retrieving the lower partial column CO2 values. The lower partial columns benefit from the secondary scaling as they have less bias (a slope closer to 1) than the individual windows, but the slight increase in mean ratio deviation suggests that the retrieval cannot be as precise at adjusting for the surface errors in the a priori profile shape. The a priori profiles for CO2 intentionally do not include variations of local sources or sinks at the surface but are quite accurate in the middle and upper troposphere. Accordingly, the secondary scaling of the upper partial column has improved accuracy and precision compared to the individual windows.
Finally, we compare the performance of the total column values calculated from the TARDISS scaled partial columns to the total column validations of the TCCON individual windows. The comparisons are shown in Fig. S3 in the Supplement and summarized in Table S3 in the Supplement. The total column comparisons show similar trends to the upper column comparisons. This is likely due to the upper partial column vertical sensitivity being much larger than the lower partial column sensitivities, as is discussed in Sect. 3.4.1.
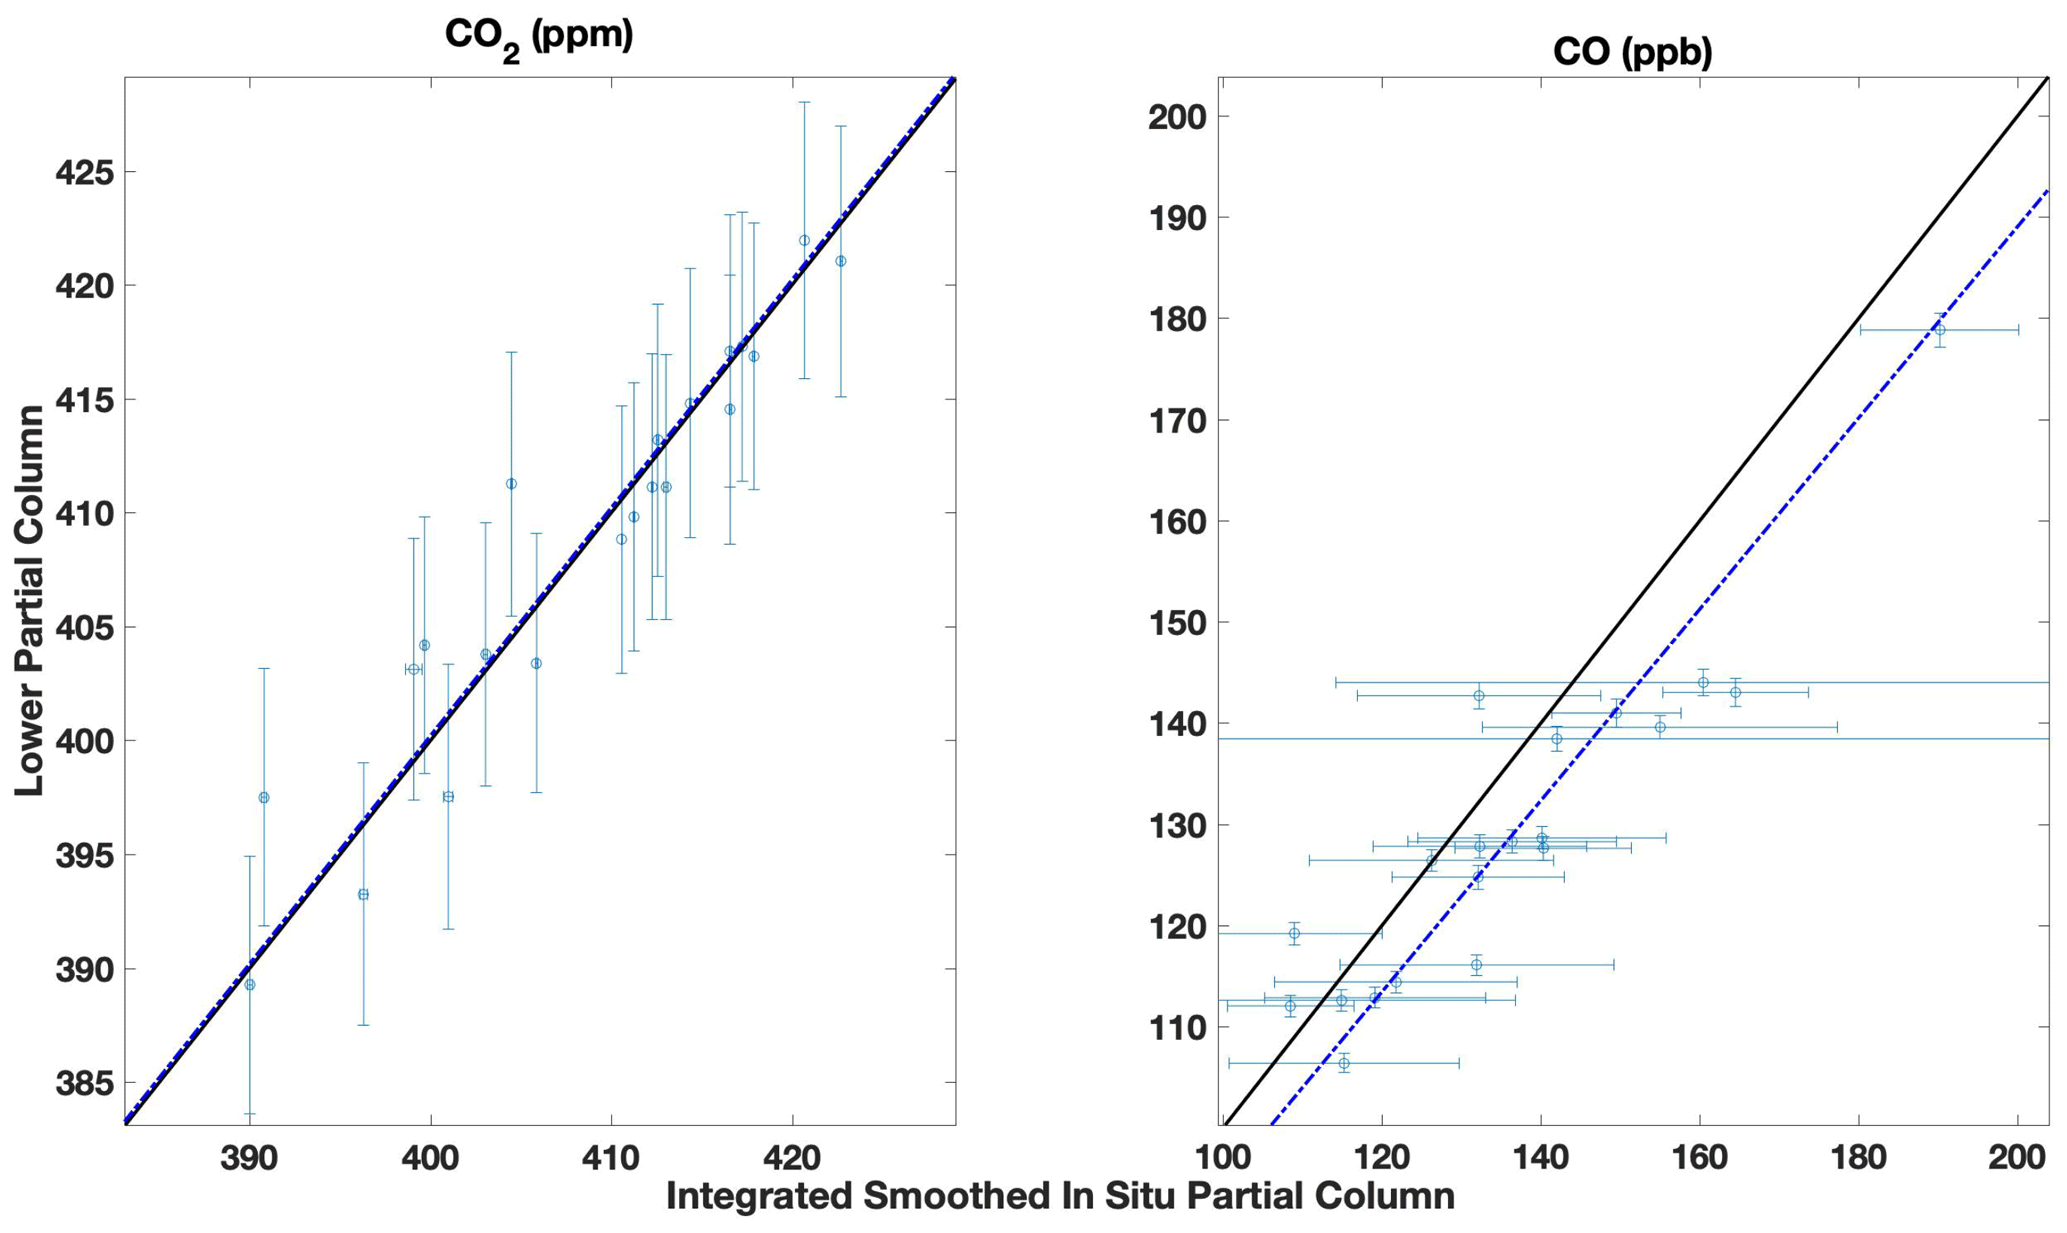
Figure 6East Trout Lake site direct comparisons between the partial column DMF values retrieved from the TARDISS fit and the integrated and smoothed aircraft partial columns for lower column CO2 and CO. The error bars in the x direction are the integrated partial columns of the profile shifted by the error values and then subtracted from the original partial column integration. The error bars in the y direction are the output errors from the TARDISS fit scaled by the VEM value for the site. The solid black line is the one-to-one line, and the dotted–dashed blue line is the linear fit of the data with the y intercept forced through zero. The slope for the fit is 1.001 ± 0.002 for CO2 and is 0.945 ± 0.012 for CO.
3.3.2 Comparisons with low-altitude in situ profiles
In addition to the aircraft and AirCore validation data that include profile measurements at altitudes in the upper troposphere and lower stratosphere, we compare to aircraft data obtained as part of the NOAA GGGRN aircraft program at the Lamont and East Trout Lake sites. These measurements were made more frequently but do not include enough high-altitude measurements to compare with our retrieved upper partial column values, so we use them as an independent comparison to our validation data for our lower column CO2 and CO retrievals. We use data obtained between the surface and 7 km from 26 of the 40 flights made between 2017 and 2020 at East Trout Lake. We also use data obtained between the surface and 6 km from 267 of the 399 flights performed at the Lamont site over the period of 2008 to 2018 and all 34 flights for CO made between 2017 and 2021. Figure 6 (East Trout Lake) and Fig. 7 (Lamont) show the retrieved lower partial column DMF plotted against the integrated, smoothed, and in situ columns similar to Fig. 5.
Similar to the validation comparison, we revert to the a priori profile for altitudes not measured by in situ methods. To account for the errors in using the a priori profile, we add twice the standard deviation of the partial column that is measured to the average measurement error in quadrature. Given the lower altitudes measured by the GGGRN program, the errors associated with the parts of the profile that use the a priori profile are higher, and therefore the errors in the long-term comparative measurements tend to be much higher than the validation measurements, as shown in the CO comparisons in Fig. 6.
Despite the larger error values, the consistency of the statistical parameters (summarized in Table S4 in the Supplement) using the larger number of measurements in the long-term comparisons further motivates the use of the extended validation dataset. Some of the in situ profile comparisons occur during times with larger CO DMFs that suggest influences from sources not accounted for by the TCCON a priori profiles such as those from wildfires, which likely resulted in the large VEM for the long-term CO comparisons. Although the comparisons with the long-term data are not used for validation, the long-term comparisons show that the validation comparisons are generally representative of the performance of the TARDISS algorithm overall.
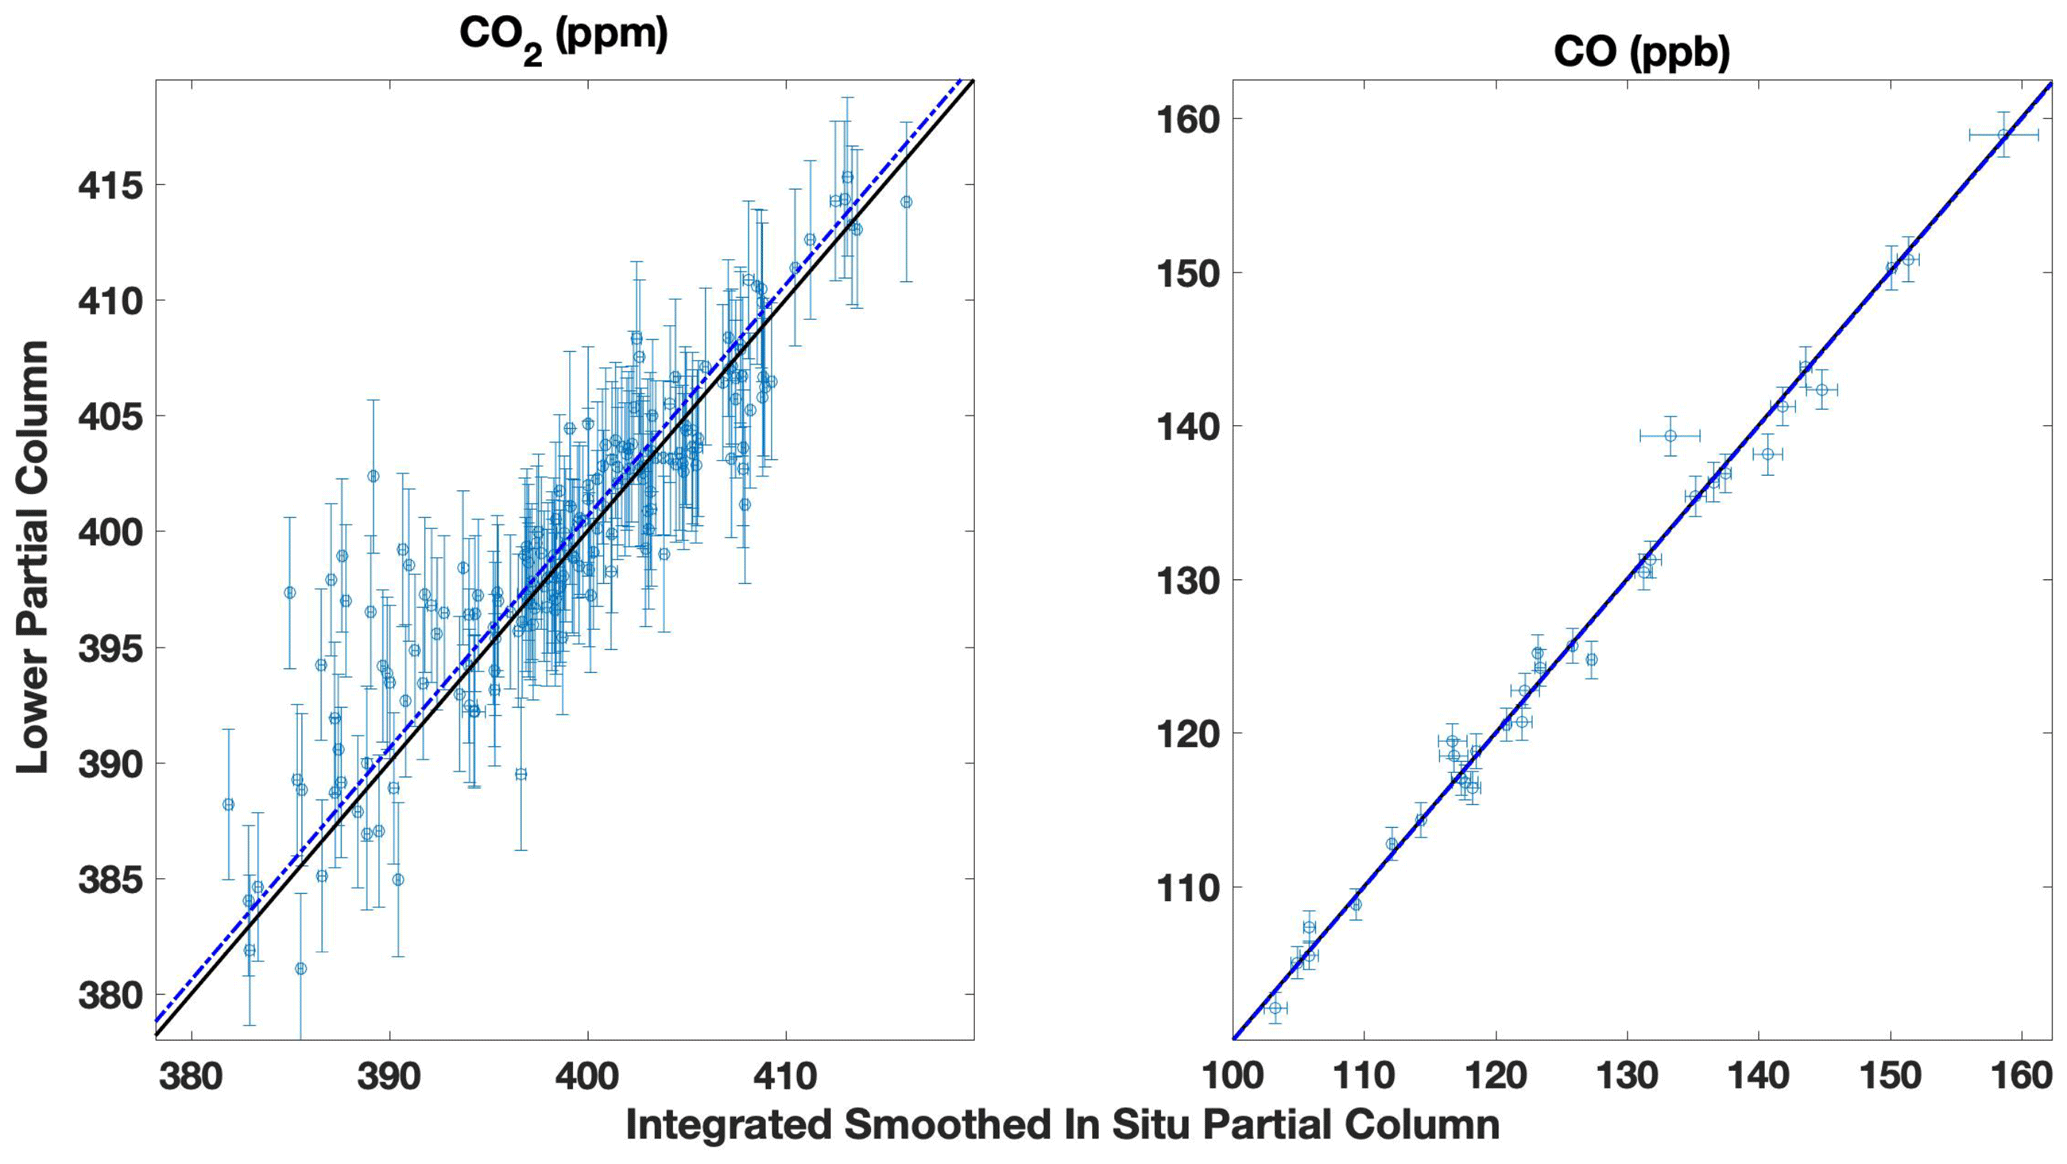
Figure 7Lamont site direct comparisons between the partial column DMF values retrieved from the TARDISS fit and the integrated and smoothed airborne partial columns for lower column CO2 and CO. The error bars in the x direction are the integrated partial columns of the profile shifted by the error values and then subtracted from the original partial column integration. The error bars in the y direction are the output errors from the TARDISS fit scaled by the VEM value for the site. The solid black line is the one-to-one line, and the blue line is the linear fit of the data with the y intercept forced through zero. The slope for the fit is 1.002 ± 0.001 for CO2 and is 1.000 ± 0.002 for CO.
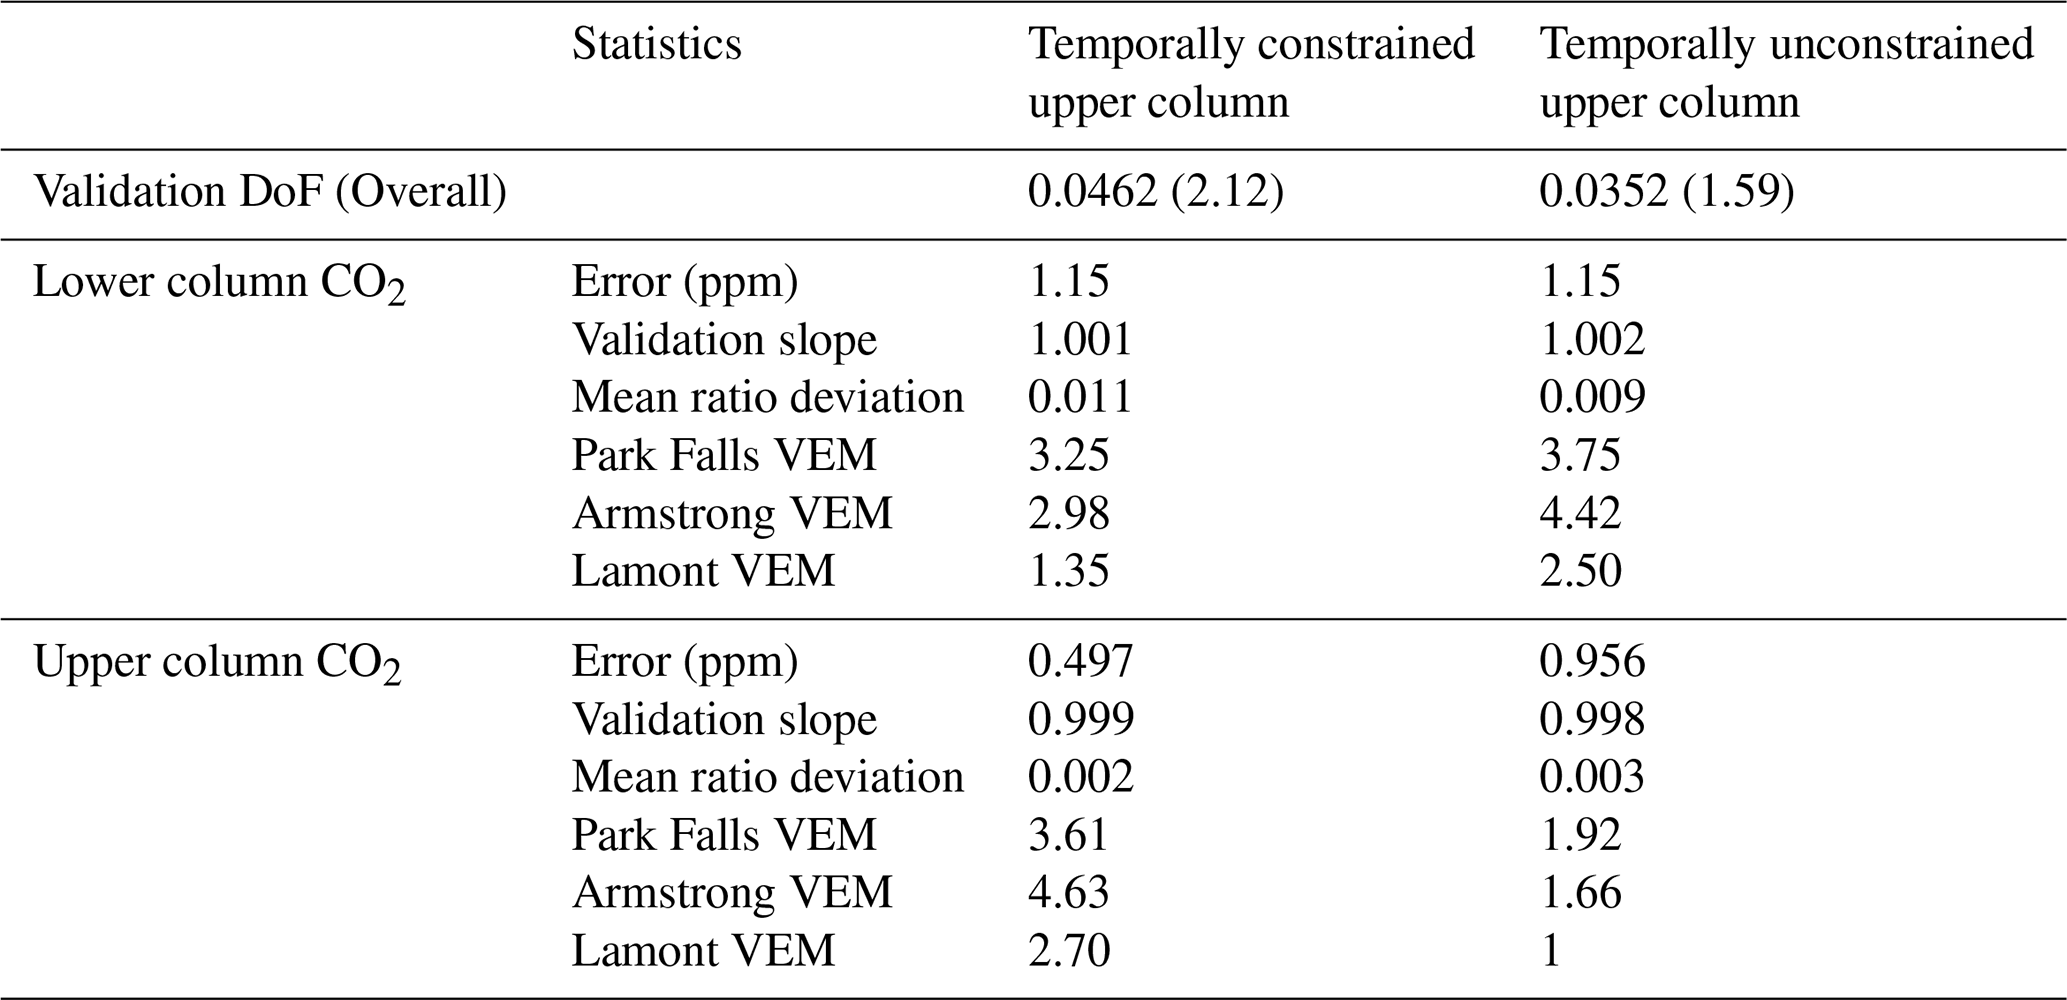
Table 5Validation comparison DoF, error, validation slope, mean ratio deviation, and site VEM values for lower and upper column CO2 for retrievals using a temporally constrained upper column and a temporally unconstrained upper column. The retrievals are performed with the operational parameters denoted by asterisks in Table 2.
3.4 Retrieval characterization
3.4.1 TARDISS vertical sensitivity and temporal covariance
TARDISS uses an a priori covariance matrix with temporal covariance between upper partial column scalars over the course of a day of measurement, as shown in Fig. 3. To determine how this constraint influences the retrievals, we compare the data above to the validation comparison from a CO2 retrieval not constrained by a temporal covariance. The a priori covariance matrix without the temporal covariance is simply a diagonal matrix of the 10−5 scalar value. Table 5 shows that the retrievals without temporal constraints have a slightly poorer validation comparison overall, including larger errors and fewer degrees of freedom. However, the site-by-site differences in validation data show that the upper column VEM values are smaller when using a temporally unconstrained fit, whereas the lower column VEM values are improved when implementing the temporal constraints. While the purpose of this study is to create a universally applicable operational algorithm, local differences in the sources and meteorology may alter the effects of the a priori covariance matrix choice on the site VEMs. This suggests that site-by-site parameter choices may enable smaller errors and increased precision.
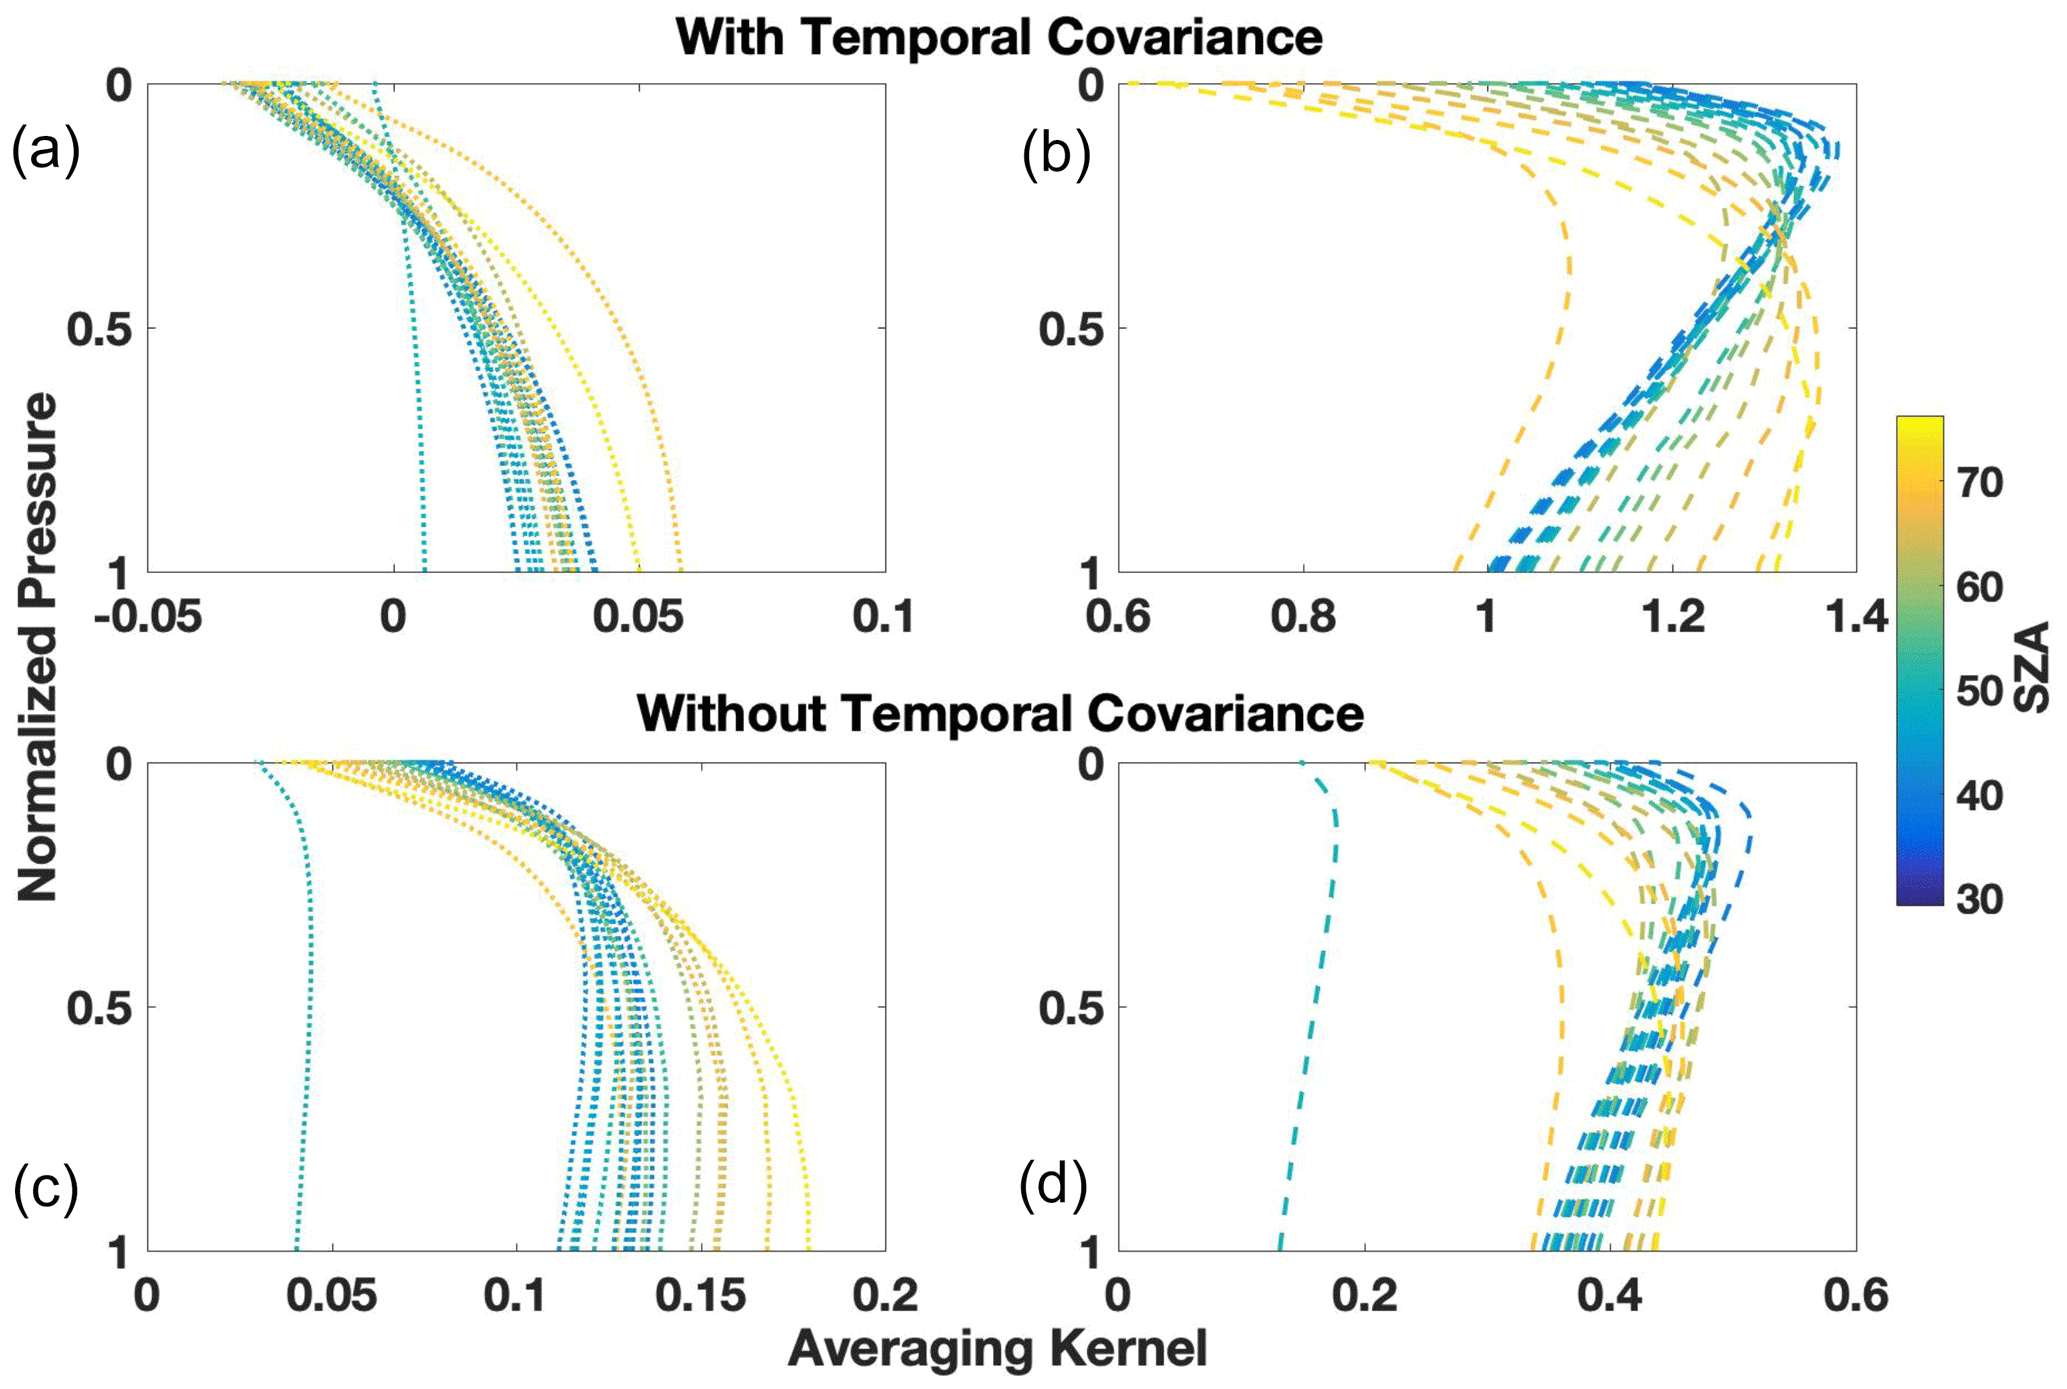
Figure 8Vertical sensitivities of the lower partial column (a, c) and upper partial column (b, d) scalars color coded by solar zenith angle in degrees. The sensitivities calculated when using a temporally covariant a priori covariance matrix are shown in the top row, and the sensitivities calculated when using a non-temporally covariant a priori covariance matrix are shown in the bottom row.
The temporal covariance impacts our validation comparison through the partial column vertical sensitivities described in Eq. (22) via the gain matrix (Eq. 21). To assess the importance of the choice of a priori covariance matrix, we compare the vertical sensitivities for a temporally constrained upper column and a temporally unconstrained upper column (shown in Fig. 8) for a representative day (27 July 2018, at the Lamont site).
Without the temporal constraint, the upper column sensitivities are on the same order as the lower column sensitivities with values between −0.05 and 0.18. The upper column sensitivity peaks around the 15 km level at low solar zenith angles, and the peak moves toward the surface at higher solar zenith angles consistent with the changing kernel of the 6220 and 6339 cm−1 bands. The lower column sensitivities always peak near the surface (∼ 2 km or below) and the sensitivity increases at higher solar zenith angles.
With the temporal constraint, the altitude of the maximum sensitivities with respect to SZA remains similar but the upper column sensitivities are roughly twice the value and the lower column sensitivities are half the value of the temporally unconstrained values. The imposed temporal covariance constrains the upper column to vary slowly over the span of a measurement day so that a change in the column at one measurement point induces changes at other measurement points, thereby increasing the vertical sensitivities in the upper column over the entire day. This constraint is also stringent enough that it propagates into the sensitivity of the lower column scalar. Since our goal is to retrieve a lower partial column, it seems counterintuitive that using sensitivities with an order of magnitude difference provides a better validation comparison. However, for this method we assume that we know the shape and behavior of the upper column fairly well and that most of the change occurs near the surface. Given these assumptions, constraining the upper column more heavily by introducing expected daily patterns through the a priori covariance matrix allows for the lower column retrieval to have improved comparisons with in situ data despite the decreased vertical sensitivities.
While we test retrievals simply with and without temporal covariance, the possible choice of a priori covariance matrix shape could be much more complex. Future study could include using model-generated or back-trajectory-based temporal covariances to include outside information in the retrieval dynamically. For an operational retrieval product, we will include the temporal covariance in the a priori covariance matrix as an operational parameter.
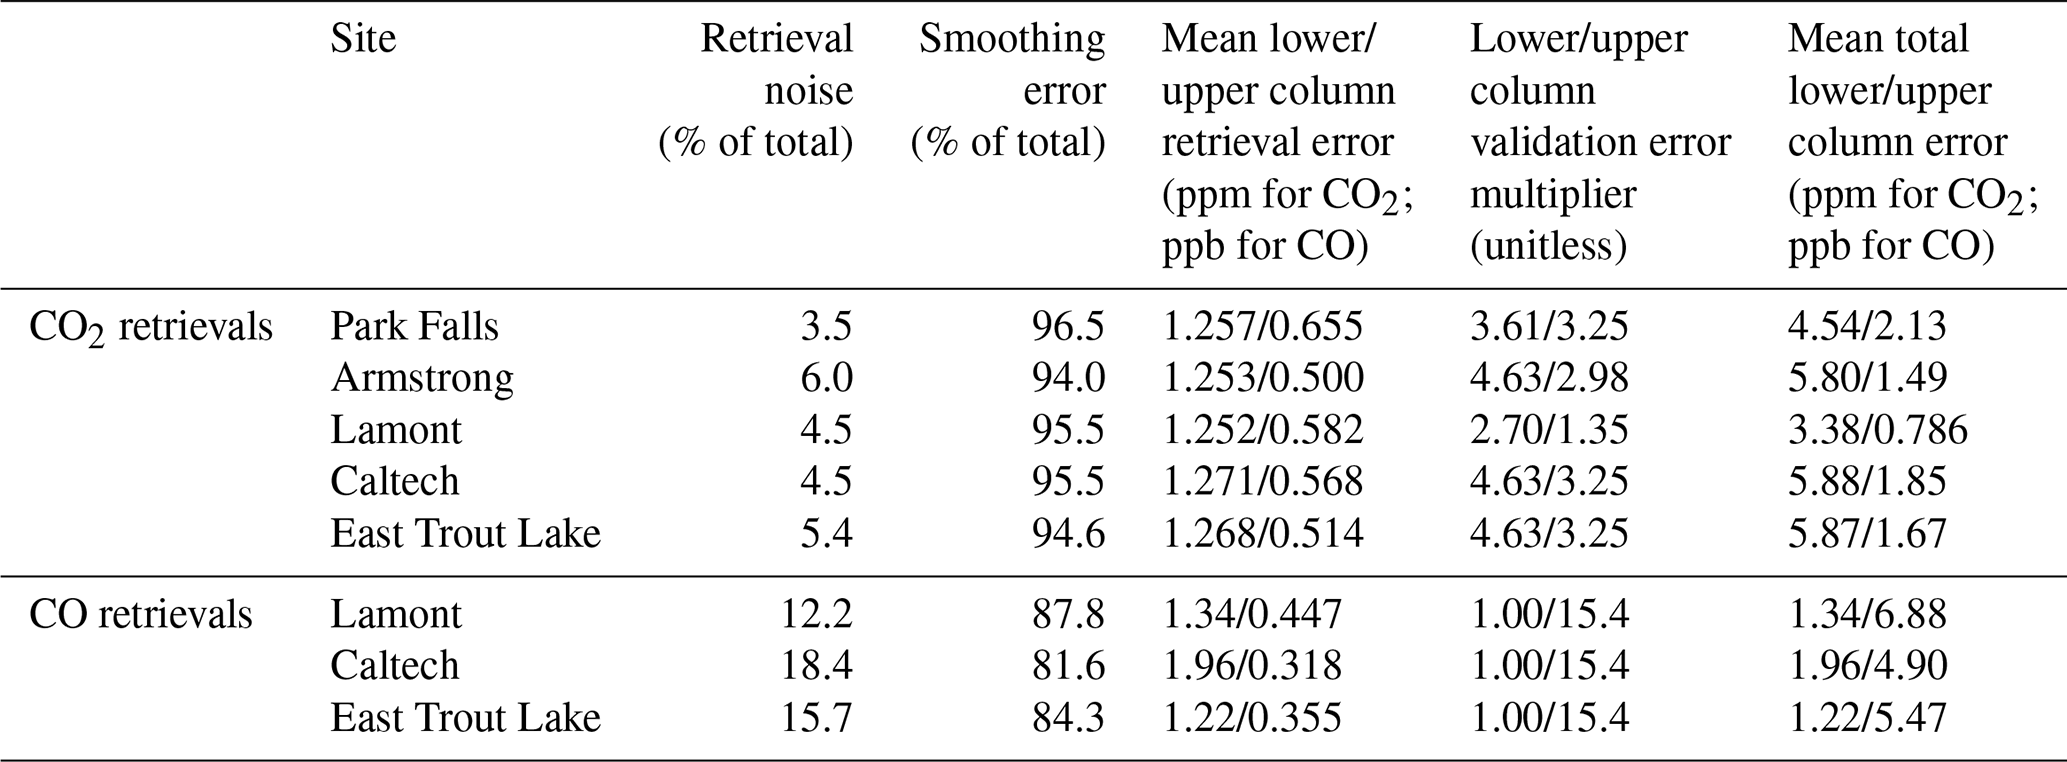
Table 6Errors in the CO and CO2 lower partial column retrievals of each site shown as the average of the entire data time series and broken down into total retrieval error, retrieval noise, smoothing error, validation error multiplier, and total error. The values for total retrieval error and total error represent 1 standard deviation.
3.4.2 Error analysis
Using the information from the validation comparison, we can evaluate the errors of the entire dataset from each of the five sites. The output of the retrieval is the partial column scalar and the error retrieved is the standard deviation of the partial column scalar calculated from the retrieval variance and represented as another scalar value. To convert our partial column scalar error to a dry air mole fraction, we multiply the error scalar value by the a priori partial column mixing ratio (za,TCCON in Eq. 17). Error varies from site to site due to variations in the TCCON total column errors that are input to the measurement covariance matrix and due to how well the a priori partial column DMF matches the (generally unknown) actual partial column DMF. We report the total retrieval error, retrieval error components, and the error contribution from the validation comparison measurements in Table 6.
The retrieval error values range from 1.16 to 1.41 ppm for lower column CO2 and from 0.26 to 1.33 ppm for the upper column CO2. For CO retrievals, the average total retrieval error ranges from 0.48 to 14.0 ppb for the lower column and 0.032 to 2.23 ppb for the upper column. In general, the errors vary minimally over the record, but there is a distinct seasonality for both lower column CO and CO2 retrievals with the highest errors during the summer perhaps as a result of errors in the near surface a priori profiles (Fig. S4). The absolute errors for CO2 generally increase over time simply because CO2 is increasing due to anthropogenic emissions. Fractionally, the errors remain similar across the dataset for both CO and CO2 (Fig. S5).
Because the model parameter error goes to zero in our implementation, the current total retrieval error is the square root of the sum of the smoothing error (Eq. 25) and the retrieval noise (Eq. 26). The smoothing error is 94.0 % to 96.5 % of the total retrieval error on average for CO2 and 81.6 % to 87.8 % of the total retrieval error on average for CO depending on the site and is directly related to the scaling of the a priori covariance matrix. While using a more constrained a priori covariance matrix increases the smoothing error, it also results in a reduction to the total retrieval error. Furthermore, the fit of the lower partial column CO2 benefits from a stronger constraint since the slope of the lower partial column CO2 validation is closest to 1 when using the tightest covariance matrix as shown in Table 2. The retrieval noise is 3.5 % to 6.0 % of the total retrieval error on average for CO2 and 18.4 % to 12.2 % of the total retrieval error on average for CO depending on the site and has the opposite relationship to the scaling of the a priori covariance matrix. The retrieval noise reflects the effect of the model covariance matrix that is composed of the TCCON total column measurement errors, and therefore reducing these errors would also reduce the retrieval noise.
Using the operational setup for our TARDISS fit, we calculate the site-specific VEM values using Eq. (27) (Tables 5 and 6). These values are used to scale the error of the TARDISS fit for all the comparisons in this work. The VEM-scaled errors serve as a conservative estimate for the retrieval errors and should be reevaluated with additional in situ profile measurements as they become available. For CO2 at Park Falls, the lower and upper column VEM are 3.61 and 3.25; at Armstrong, the lower and upper column values are 4.63 and 2.98; and at Lamont the values are 2.70 and 1.35 for the lower and upper column, respectively. Since Caltech and East Trout Lake do not have comparison data, we apply error multiplier values of 4.63 and 3.25 as they are the largest multiplier values from among the other sites. For CO, the Lamont site multiplier values are 1.00 and 15.4, which we use for the Caltech and East Trout Lake site CO retrieval data as well.
Since the TARDISS retrieval cannot fully optimize the shape of the partial profile, the site-to-site differences in VEM are likely due to the variation in the accuracy of the TCCON priors, which by design do not capture the local source, sink, and transport complexities. For CO2, the upper column VEM and retrieval error values are consistently smaller than the associated lower column values, suggesting that these data support the assumption that the shape of the profile of the upper partial column is generally much more accurately captured by the TCCON priors.
The total error for each site is determined by multiplying the retrieved errors by the site and partial column respective VEM values. After implementing the VEMs, the errors for the lower partial column CO2 retrieval range from 3.38 to 5.88 ppm and from 1.22 to 1.96 ppb for CO across all sites and data. As the Caltech and East Trout Lake sites have no validation comparisons, we use the largest validation error multiplier (that of the lower column Armstrong and upper column Park Falls comparison) as a higher bound.
Since the overall biases are small with validation slopes close to 1, the errors are sufficiently small that the TARDISS retrievals have skill in evaluating CO2 fluxes at TCCON sites. The error compared to the overall lower partial column DMF is small: 1.25 % on average across the five sites for CO2.
3.4.3 Information content analysis
The information content of the retrieval is determined by the DoF and Shannon information content (H) of the retrieval, each calculated from the averaging kernel. The DoF values represent the independent pieces of information that can be retrieved from a measurement. We report our DoF values normalized by both the number of measurements made in a day and the daily overall DoF. Since the DoF values are calculated as the trace of the averaging kernel, we isolate and report the DoF from the upper and lower column separately along with the total. The Shannon information content is a single value to represent the effectiveness of the retrieval when recovering information from the model with respect to the variance in the data. Higher Shannon information content values correspond to a retrieval with a higher possible effectiveness.
Table 7Degrees of freedom per measurement (and per day) for the lower column, upper column, and total retrieval, in addition to the Shannon information content separated by site for the CO and CO2 retrievals.
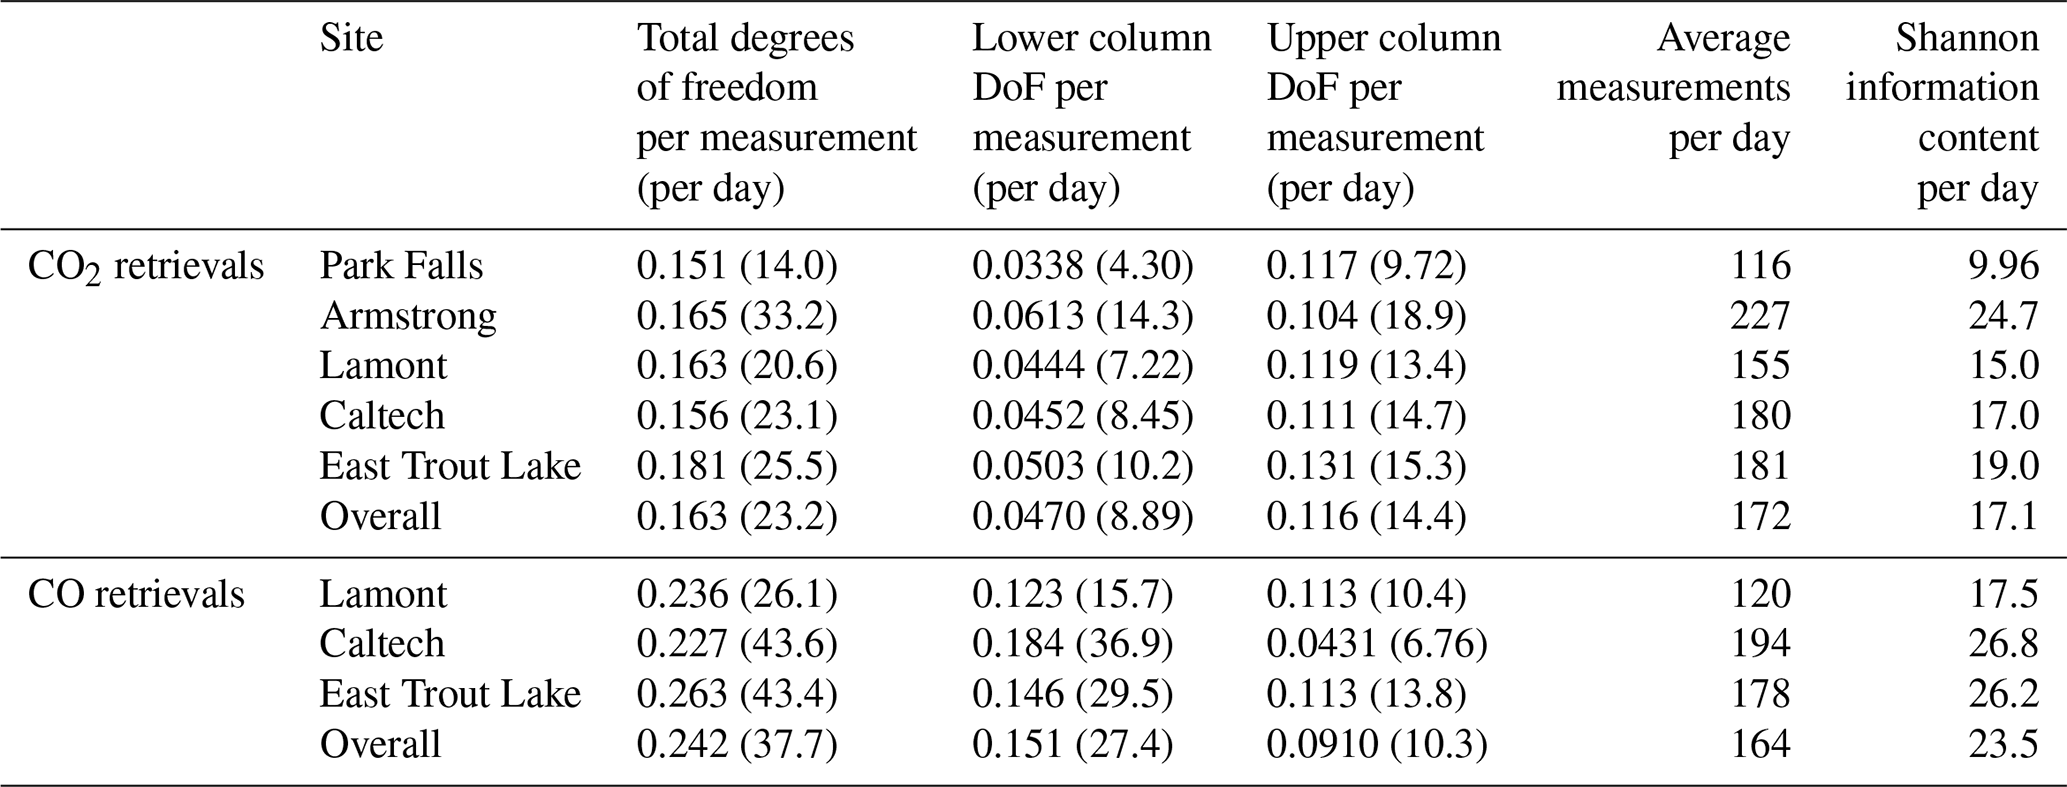
The information content is summarized for each site in Table 7. The overall average lower column DoF per measurement across all sites and collected data is 0.047 for CO2 and 0.15 for CO. The lowest DoF average value of 0.034 is in Park Falls, the highest DoF average value of 0.061 is in Armstrong for CO2, and between the three sites with CO retrievals Caltech has the highest average lower column DoF of 0.18 compared to 0.12 for Lamont and 0.15 for East Trout Lake. The retrievals of CO have much larger DoF compared to CO2 primarily since the CO2 requires a stronger scaling constraint of the a priori covariance matrix, limiting the amount of information that can be inferred.
Ideally, DoF values greater than 1 are desired for traditional profile retrievals. However, the temporal aspect of our retrieval complicates the discussion. If we consider the CO2 retrievals, the five sites used in this work made an average of 172 measurements per day so that the DoF value average of 0.0470 per measurement yields 8.08 independent pieces of information about the lower partial column per day which provides significant information on the diurnal variation and the fluxes into and out of the lower column.
The information content shown in the DoF is mirrored in the Shannon information content. Similar to the DoF, Park Falls has the lowest and Armstrong the highest Shannon information content on average for CO2. These differences are likely driven by the combination of the TCCON retrieval errors and how well the a priori covariance matrix matches the temporal aspects of local meteorology, such as cloud cover or upper tropospheric transport, or the magnitude and timescales of the local carbon fluxes in the boreal forest versus the lack of such fluxes in the Mojave Desert. For CO, the Caltech retrieval has the highest DoF and Shannon information content of the three sites. While the differences in Shannon information content and DoF between sites are not necessarily directly comparable, these differences also might be due to the TCCON retrieval errors and how well the chosen a priori covariance matrix constrains the solution.
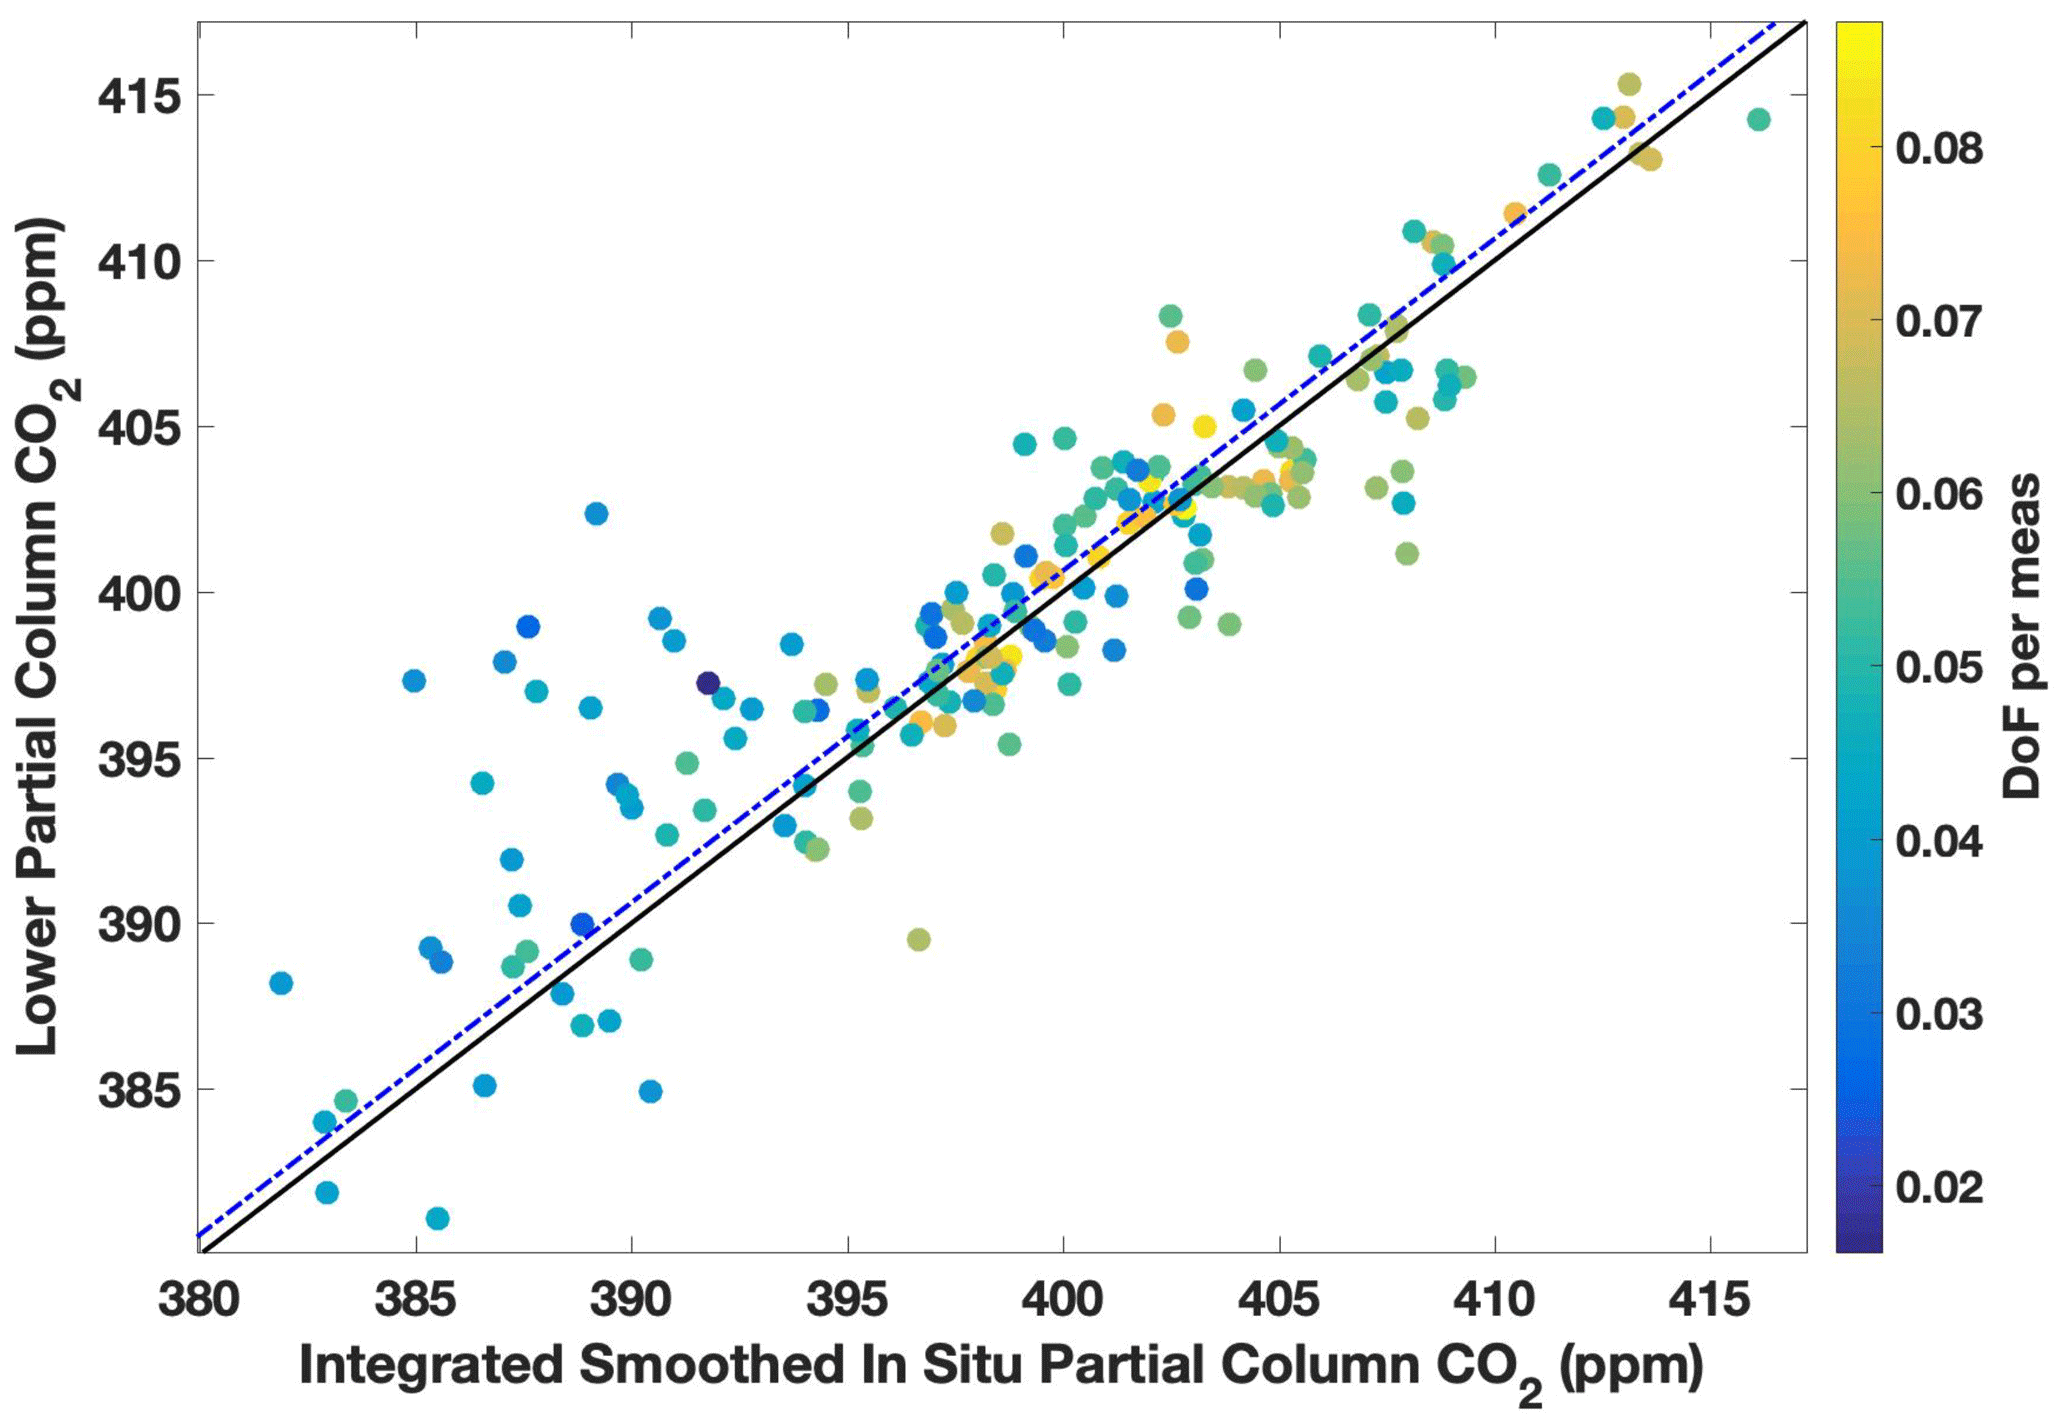
Figure 9The same comparison shown in Fig. 7 is shown here without error bars and color coded by the DoF per measurement for the comparison day retrieval. The dotted–dashed blue line above the black one-to-one line is the linear fit of the data with the y intercept forced through zero with a slope of 1.002 ± 0.001.
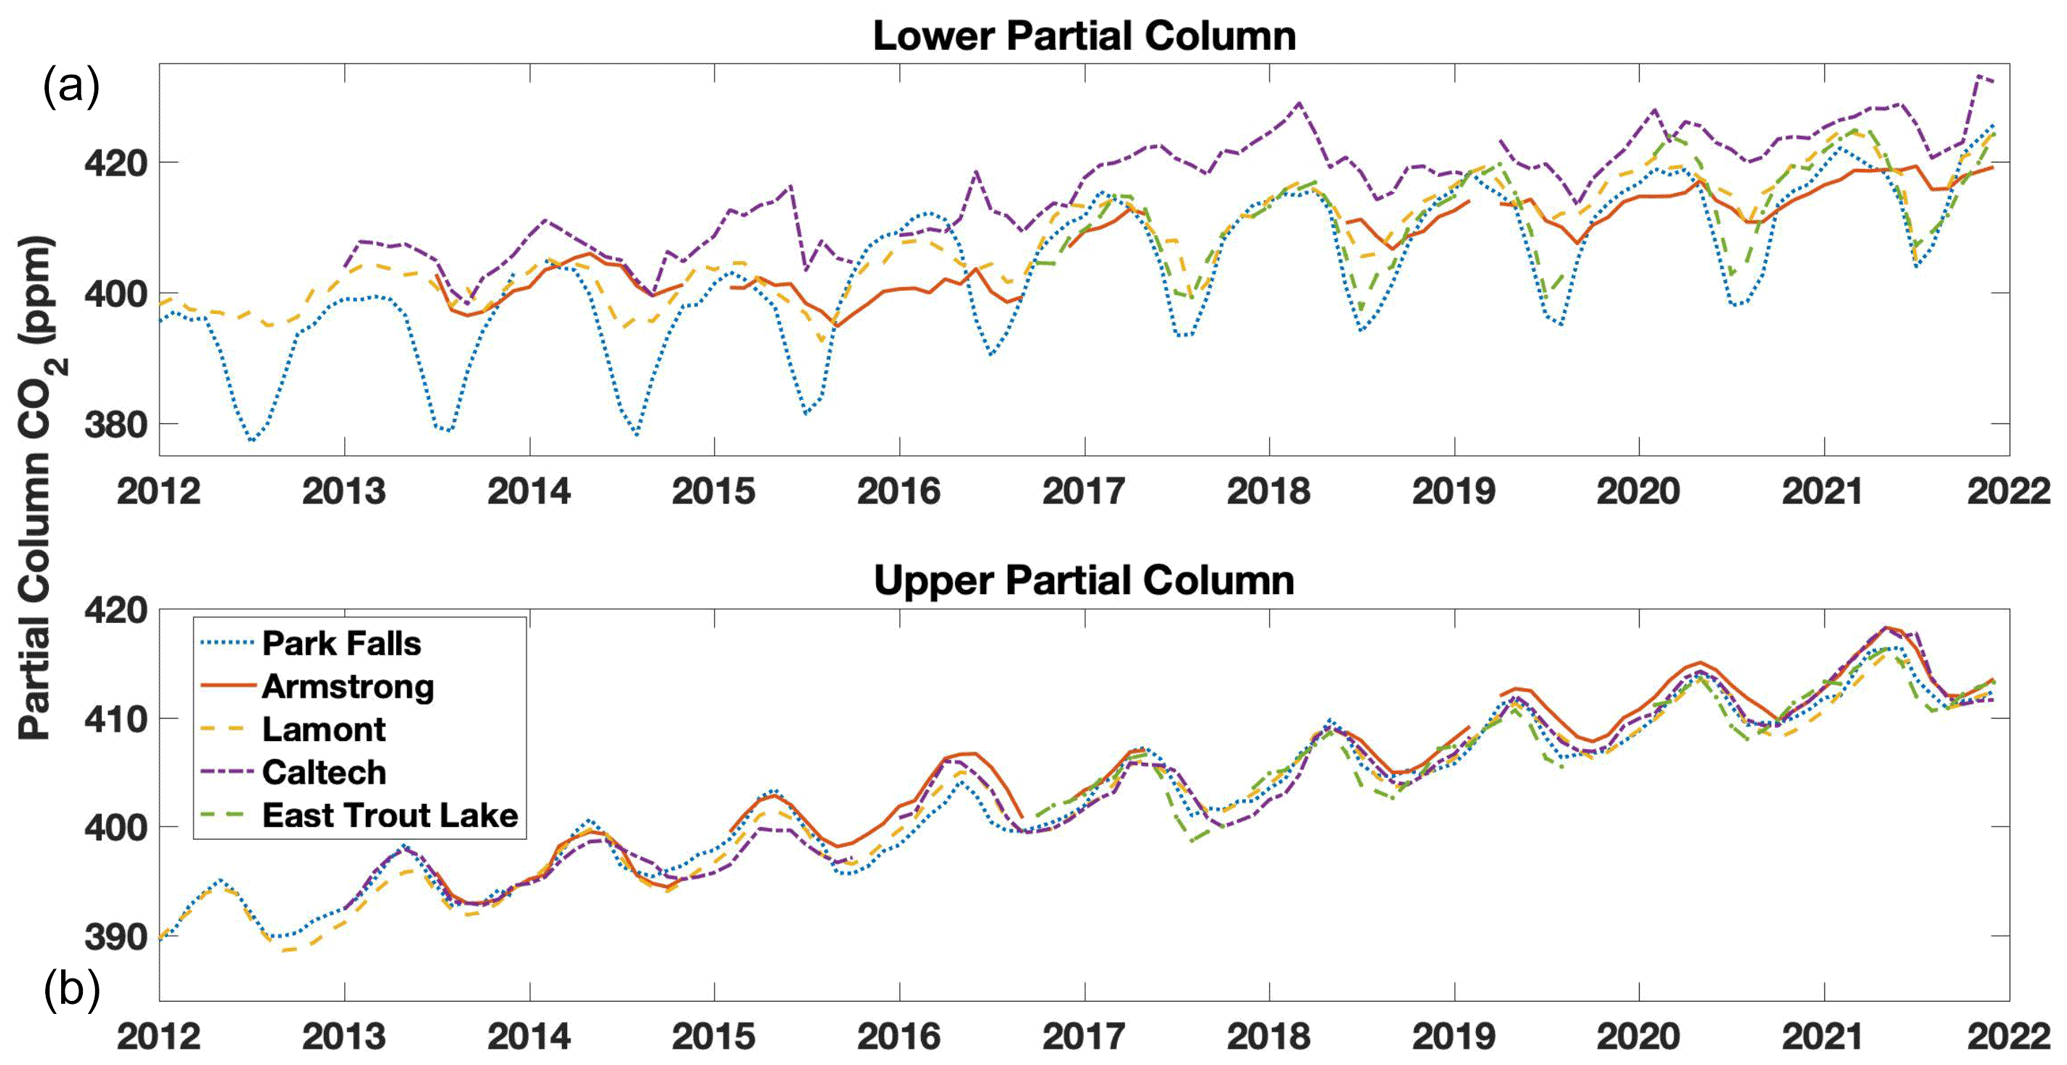
Figure 10Time series plot of the monthly median lower (a) and upper (b) partial column values of CO2 (in ppm) for the five sites used in the work from 2012 (or the start of measurement) to the end of 2021. Data from before 2012 measured at Park Falls and 2011 at Lamont are not used due to instrument alignment issues and laser issues.
The informational content of the retrieval assists in evaluating the TARDISS algorithm, but also serves as a diagnostic of the effectiveness of the retrieval for each day of measurement. Figure 9 shows the long-term comparisons between the retrieved lower partial column and the smoothed, integrated, and in situ data at the Lamont site color coded by the DoF per measurement for each point. The comparisons with higher DoF per measurement generally sit closer to the one-to-one line as expected and suggest that days with higher DoF per measurement have lower associated VEM. Figure S7 shows the VEM calculated after removing days that have DoF per measurement values below a specific threshold. The VEM calculated for the long-term comparison data decreases consistently with increasing DoF filters until it reaches 1 at ∼ 0.07 DoF per measurement. This, however, excludes roughly 90 % of the data. As a first step, the data could be filtered for low DoF or low Shannon information content. In the future, the information content could be used to create more dynamic VEM values for our datasets and provide more precise error values than the conservative, static VEM per site reported in Table 6.
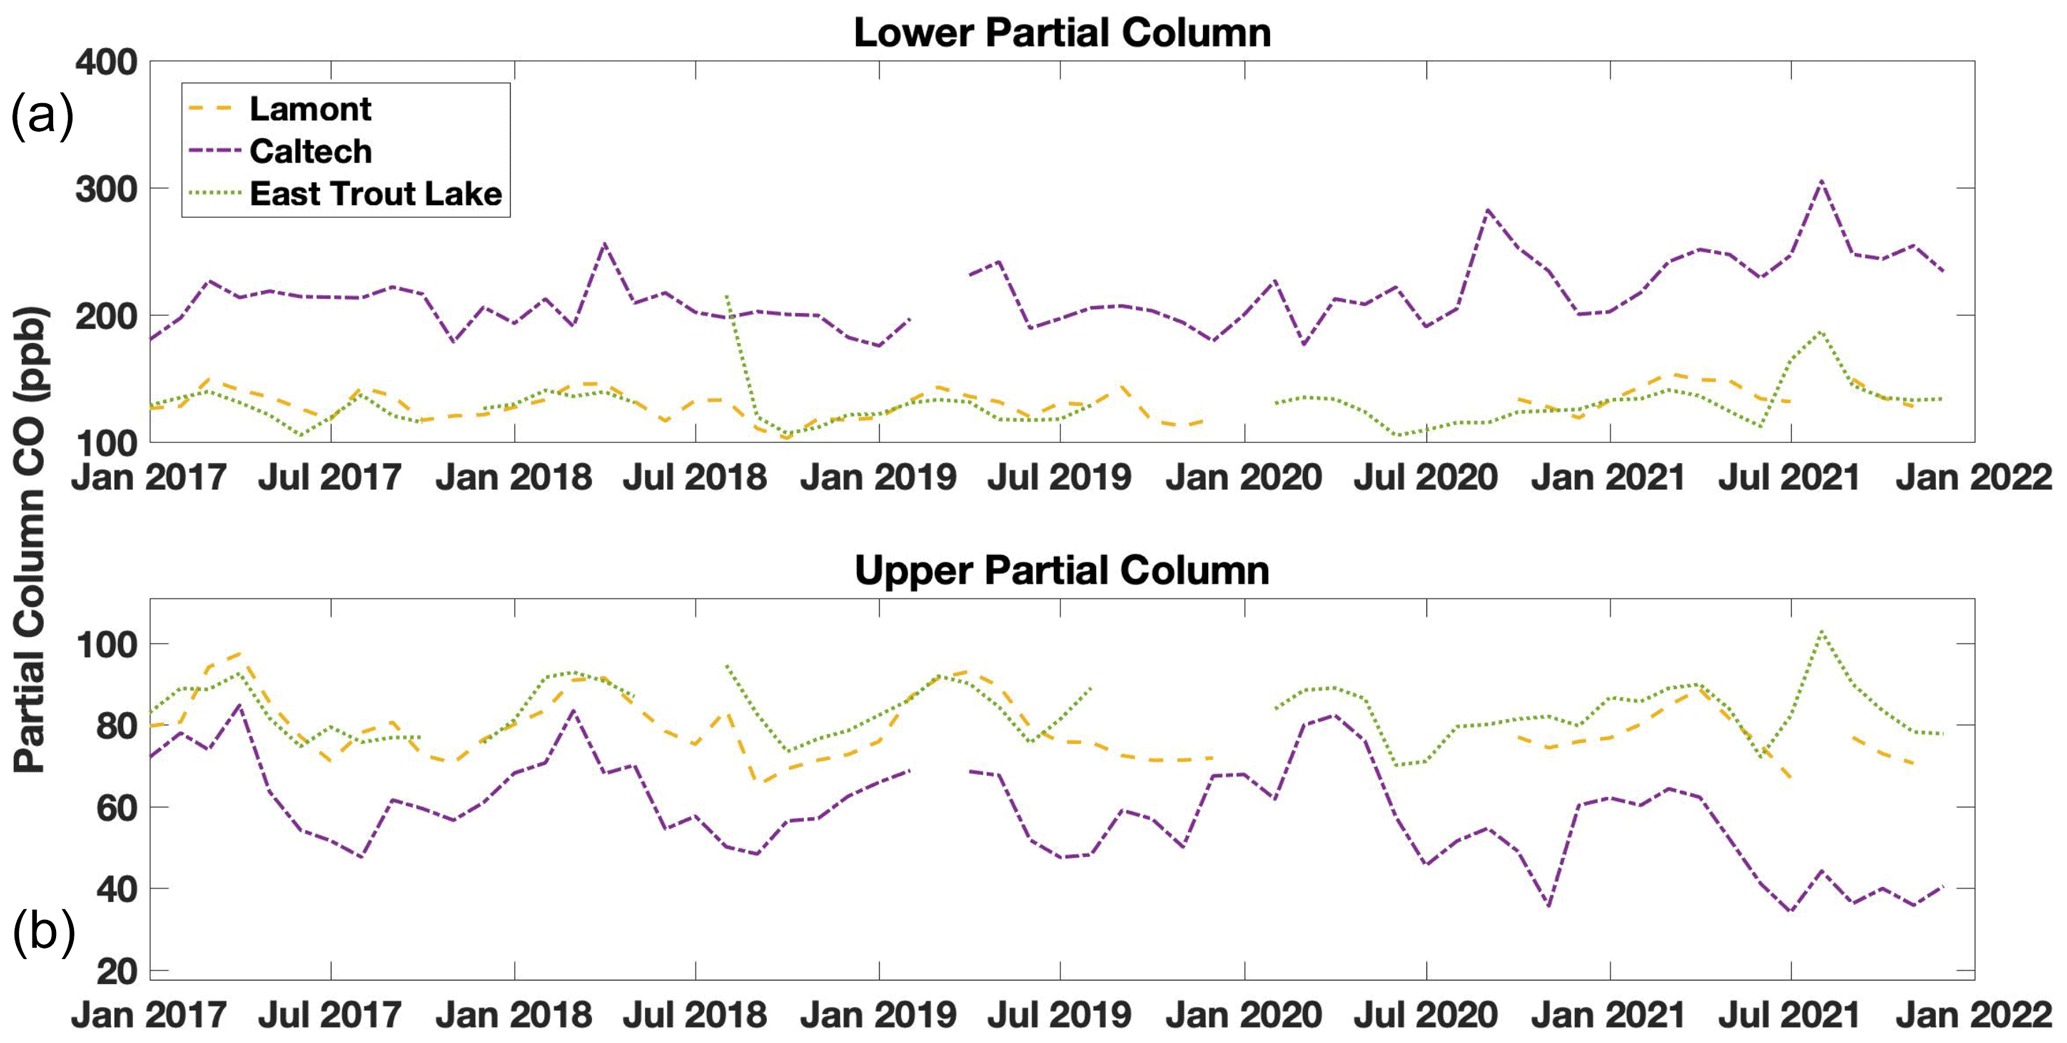
Figure 11Time series plot of the monthly median lower (a) and upper (b) partial column values of CO (in ppb) for the three sites used in the work that have the InSb detector from 2017 to the end of 2021. CO has been declining in most of the US cities due to emissions control technologies.
3.5 Time series of the TARDISS retrieval
The TARDISS algorithm is applicable to any spectra reported as TCCON data with the correct detector requirements (InGaAs for CO2 and both InGaAs and InSb for CO). Overall, there are at least 9 years of CO2 data at each site in this work and approximately 5 years of CO data at the East Trout Lake, Lamont, and Caltech sites.
Figure 10 shows the monthly mean lower and upper partial column data retrieved from spectra obtained over the last decade at the North American TCCON sites. These upper columns reflect the global seasonal patterns in CO2. The lower column at Park Falls and East Trout Lake reflect the local influences on CO2 in the sharp decline in surface CO2 when the surrounding forest is most photosynthetically active. In contrast, the lower column Caltech trace shows a consistent urban enhancement over the global trends of ∼ 5 ppm. All five upper column traces are generally consistent with one another and have a ∼ 6 ppm seasonal fluctuation.
Figure 11 shows the monthly median retrieved lower and upper partial column CO data from the East Trout Lake, Lamont, and Caltech sites. We observe a slight seasonality at each site with maximums in the winter months and minimums in the summer months. The CO lower partial column data from the Caltech site tends to be larger than those from the Lamont site due to the urban enhancement despite the recent decreasing trend. An example of the effect of the urban enhancement on total and partial column values is shown in Fig. S8.
The TARDISS retrieval algorithm enables partial column information to be derived from the TCCON total column observations of CO2 and CO derived from different absorption bands with different vertical averaging kernels. Compared to traditional vertical retrieval approaches, the algorithm relaxes the requirement of very accurate meteorology knowledge, is less biased by spectroscopic errors, and is computationally inexpensive to run since it does fit spectra directly. By inferring information from the differences between total column DMF values from spectral windows that are quality controlled, the retrieval is restricted to imposing small changes to the partial and total columns. This effectively limits the amount of informational content that can be retrieved but also mitigates the issues of oscillation or large deviations in the retrieved vertical profile, in this case partial columns. Finally, this algorithm takes advantage of the temporal dimension by fitting over an entire day of measurements to retrieve enough information to infer temporal changes in the lower (surface to ∼ 2 km) and upper (2 to 70 km) partial columns, which also allows for the input of external, a priori, and temporal information that is shown to improve the information content in the lower partial column fit.
Using measurements from the five North American TCCON sites, we compare our retrieved partial columns of CO and CO2 DMF to the partial columns calculated from integrated and smoothed in situ data measured by aircraft and AirCore. We report slopes of 1.001 ± 0.003 and 0.999 ± 0.001 for the lower and upper partial column CO2 comparisons, respectively, and slopes of 0.999 ± 0.002 and 1.081 ± 0.012 for the lower and upper partial column CO comparisons, respectively. The retrieved partial columns have improved direct comparisons and precision compared to the partial columns calculated from the original TCCON spectral windows.
We use the comparison data to calculate validation error multiplier (VEM) values to scale retrieved errors to be representative of the in situ comparisons. The average VEM scaled errors for the lower partial column CO and CO2 retrievals are 1.51 ppb (∼ 2 %) and 5.09 ppm (∼ 1.25 %), respectively. The magnitudes of these error values suggest that the TARDISS retrieval will be useful in its current state for understanding surface fluxes of CO and will have some power for evaluating surface fluxes of CO2.
The Bayesian TARDISS algorithm enables the informational content of the retrieval to be estimated. The average DoF for the lower partial column retrievals are 8.89 and 27.4 degrees of freedom so that ∼ 9 and ∼ 27 lower partial column values can be retrieved over a day of measurement for CO2 and CO, respectively. The information content is affected by the parameters of the retrieval so that there is a tradeoff between retrieved error and the DoF of the retrieval. Furthermore, the daily DoF normalized by the number of measurements made in a day could serve as a quality control variable.
Future implementations of the retrieval could use the DoF values to create dynamic VEM to provide error values that are more precise than the static VEM. Similarly, future work could improve the effectiveness of the retrieval of lower partial column CO2 using the TARDISS algorithm with the input of external information through the a priori covariance matrix, a priori partial column scalar, or the inclusion of the other parameters in the state vector.
The data used in this study are made up of TARDISS retrieval products from five TCCON stations. The retrieval data are publicly available through CaltechDATA (https://doi.org/10.22002/pn9de-cry27, Parker et al., 2022), and the data input into the retrieval are publicly available via https://tccondata.org/ (last access: 28 April 2023; TCCON, 2023). The retrieval code is also available through CaltechDATA (https://doi.org/10.22002/dakd7-cdp29, Parker et al., 2023).
The supplement related to this article is available online at: https://doi.org/10.5194/amt-16-2601-2023-supplement.
HAP wrote the TARDISS algorithm following an approach suggested by POW. HAP retrieved the data with it and prepared the paper with thorough feedback from the other co-authors. JLL developed the theoretical framework for the TARDISS algorithm. CMR retrieved the TCCON data using GGG for the Lamont, Caltech, and Park Falls sites. GCT gave input on the retrieval algorithm. DW gave input on the validation data and method. LTI and JRP maintain the Armstrong site. KM and BCB provided insights and in situ data for the validation. All authors contributed to the review and editing of the work.
The contact author has declared that none of the authors has any competing interests.
Publisher's note: Copernicus Publications remains neutral with regard to jurisdictional claims in published maps and institutional affiliations.
The authors thank the ObsPack team and data providers for the in situ profile data used for validation. The data were downloaded from https://gml.noaa.gov/ccgg/obspack/data.php?id=obspack_co2_1_GLOBALVIEWplus_v5.0_2019-08-12 (last access: 2 September 2022). In particular, we thank the NASA LaRC AVOCET and DACOM groups for the KORUS-AQ CO2 and CO data, respectively; NASA Goddard for the Picarro CO2 data at the Armstrong AFB; the SEAC4RS and ATom groups for the CO2 data; and the NOAA Global Monitoring Laboratory for the AirCore CO2 and CO data and the long-term aircraft CO2 and CO at the SGP and ETL sites.
This work was funded via grant no. 80NSSC22K1066 for supporting the retrievals from the TCCON stations. A portion of this research was carried out at the Jet Propulsion Laboratory, California Institute of Technology, under a contract with the National Aeronautics and Space Administration (grant no. 80NM0018D0004). Bianca C. Baier is supported by NASA (grant no. 80NSSC18K0898).
This paper was edited by Thomas von Clarmann and reviewed by two anonymous referees.
Andrews, A. E., Kofler, J. D., Trudeau, M. E., Williams, J. C., Neff, D. H., Masarie, K. A., Chao, D. Y., Kitzis, D. R., Novelli, P. C., Zhao, C. L., Dlugokencky, E. J., Lang, P. M., Crotwell, M. J., Fischer, M. L., Parker, M. J., Lee, J. T., Baumann, D. D., Desai, A. R., Stanier, C. O., De Wekker, S. F. J., Wolfe, D. E., Munger, J. W., and Tans, P. P.: CO2, CO, and CH4 measurements from tall towers in the NOAA Earth System Research Laboratory's Global Greenhouse Gas Reference Network: instrumentation, uncertainty analysis, and recommendations for future high-accuracy greenhouse gas monitoring efforts, Atmos. Meas. Tech., 7, 647–687, https://doi.org/10.5194/amt-7-647-2014, 2014.
Baier, B., Sweeney, C., Newberger, T., Higgs, J., and Wolter, S.: NOAA AirCore atmospheric sampling system profiles (20210813) [data set], NOAA GML, https://doi.org/10.15138/6AV0-MY81, 2021.
Buchholz, R. R., Deeter, M. N., Worden, H. M., Gille, J., Edwards, D. P., Hannigan, J. W., Jones, N. B., Paton-Walsh, C., Griffith, D. W. T., Smale, D., Robinson, J., Strong, K., Conway, S., Sussmann, R., Hase, F., Blumenstock, T., Mahieu, E., and Langerock, B.: Validation of MOPITT carbon monoxide using ground-based Fourier transform infrared spectrometer data from NDACC, Atmos. Meas. Tech., 10, 1927–1956, https://doi.org/10.5194/amt-10-1927-2017, 2017.
Connor, B. J., Boesch, H., Toon, G., Sen, B., Miller, C., and Crisp, D.: Orbiting Carbon Observatory: Inverse method and prospective error analysis: OCO INVERSE METHOD, J. Geophys. Res.-Atmos., 113, 1–14, https://doi.org/10.1029/2006JD008336, 2008.
Connor, B. J., Sherlock, V., Toon, G., Wunch, D., and Wennberg, P. O.: GFIT2: an experimental algorithm for vertical profile retrieval from near-IR spectra, Atmos. Meas. Tech., 9, 3513–3525, https://doi.org/10.5194/amt-9-3513-2016, 2016.
Cooperative Global Atmospheric Data Integration Project: Multi-laboratory compilation of atmospheric carbon dioxide data for the period 1957–2017; obspack_co2_1_GLOBALVIEWplus_v4.2_2019-03-19 [data set], NOAA GML, https://doi.org/10.25925/20190319, 2018.
Crosson, E. R.: A cavity ring-down analyzer for measuring atmospheric levels of methane, carbon dioxide, and water vapor, Appl. Phys. B, 92, 403–408, https://doi.org/10.1007/s00340-008-3135-y, 2008.
Deeter, M. N.: Vertical resolution and information content of CO profiles retrieved by MOPITT, Geophys. Res. Lett., 31, L15112, https://doi.org/10.1029/2004GL020235, 2004.
Iraci, L. T., Podolske, J. R., Roehl, C., Wennberg, P. O., Blavier, J.-F., Allen, N., Wunch, D., and Osterman, G. B.: TCCON data from Edwards (US), Release GGG2020.R0 (Version R0) [Data set], CaltechDATA, https://doi.org/10.14291/tccon.ggg2020.edwards01.R0, 2022.
Karion, A., Sweeney, C., Tans, P., and Newberger, T.: AirCore: An Innovative Atmospheric Sampling System, J. Atmos. Ocean. Tech., 27, 1839–1853, https://doi.org/10.1175/2010JTECHA1448.1, 2010.
Keppel-Aleks, G., Wennberg, P. O., and Schneider, T.: Sources of variations in total column carbon dioxide, Atmos. Chem. Phys., 11, 3581–3593, https://doi.org/10.5194/acp-11-3581-2011, 2011.
Keppel-Aleks, G., Wennberg, P. O., Washenfelder, R. A., Wunch, D., Schneider, T., Toon, G. C., Andres, R. J., Blavier, J.-F., Connor, B., Davis, K. J., Desai, A. R., Messerschmidt, J., Notholt, J., Roehl, C. M., Sherlock, V., Stephens, B. B., Vay, S. A., and Wofsy, S. C.: The imprint of surface fluxes and transport on variations in total column carbon dioxide, Biogeosciences, 9, 875–891, https://doi.org/10.5194/bg-9-875-2012, 2012.
Kerzenmacher, T., Dils, B., Kumps, N., Blumenstock, T., Clerbaux, C., Coheur, P.-F., Demoulin, P., García, O., George, M., Griffith, D. W. T., Hase, F., Hadji-Lazaro, J., Hurtmans, D., Jones, N., Mahieu, E., Notholt, J., Paton-Walsh, C., Raffalski, U., Ridder, T., Schneider, M., Servais, C., and De Mazière, M.: Validation of IASI FORLI carbon monoxide retrievals using FTIR data from NDACC, Atmos. Meas. Tech., 5, 2751–2761, https://doi.org/10.5194/amt-5-2751-2012, 2012.
Kuai, L., Wunch, D., Shia, R.-L., Connor, B., Miller, C., and Yung, Y.: Vertically constrained CO2 retrievals from TCCON measurements, J. Quant. Spectrosc. Ra., 113, 1753–1761, https://doi.org/10.1016/j.jqsrt.2012.04.024, 2012.
Parker, H., Laughner, J., and Wennberg, P.: TARDISS Partial Column Retrieval Dataset, CaltechDATA [data set], https://doi.org/10.22002/pn9de-cry27, 2022.
Parker, H., Laughner, J., and Wennberg, P. O.: TARDISS Partial Column Retrieval Code, CaltechDATA [code], https://doi.org/10.22002/dakd7-cdp29, 2023.
Pougatchev, N. S., Connor, B. J., and Rinsland, C. P.: Infrared measurements of the ozone vertical distribution above Kitt Peak, J. Geophys. Res., 100, 16689, https://doi.org/10.1029/95JD01296, 1995.
Roche, S., Strong, K., Wunch, D., Mendonca, J., Sweeney, C., Baier, B., Biraud, S. C., Laughner, J. L., Toon, G. C., and Connor, B. J.: Retrieval of atmospheric CO2 vertical profiles from ground-based near-infrared spectra, Atmos. Meas. Tech., 14, 3087–3118, https://doi.org/10.5194/amt-14-3087-2021, 2021.
Rodgers, C. D.: Inverse methods for atmospheric sounding: theory and practice, Repr., World Scientific, Singapore, 240 pp., ISBN 981-02-2740-X, 2008
Rodgers, C. D. and Connor, B. J.: Intercomparison of remote sounding instruments, J. Geophys. Res., 108, 4116, https://doi.org/10.1029/2002JD002299, 2003.
Shan, C., Wang, W., Liu, C., Guo, Y., Xie, Y., Sun, Y., Hu, Q., Zhang, H., Yin, H., and Jones, N.: Retrieval of vertical profiles and tropospheric CO2 columns based on high-resolution FTIR over Hefei, China, Opt. Express, 29, 4958, https://doi.org/10.1364/OE.411383, 2021.
Sweeney, C., Karion, A., Wolter, S., Newberger, T., Guenther, D., Higgs, J. A., Andrews, A. E., Lang, P. M., Neff, D., Dlugokencky, E., Miller, J. B., Montzka, S. A., Miller, B. R., Masarie, K. A., Biraud, S. C., Novelli, P. C., Crotwell, M., Crotwell, A. M., Thoning, K., and Tans, P. P.: Seasonal climatology of CO2 across North America from aircraft measurements in the NOAA/ESRL Global Greenhouse Gas Reference Network, Journal of Geophysical Research, 36, https://doi.org/10.1002/2014JD022591, 2015.
Tans, P.: System and method for providing vertical profile measurements of atmospheric gases, U.S. Patent No. 7,597,014 B2, Washington, DC: U.S. Patent and Trademark Office, 2009.
Tans, P.: Fill dynamics and sample mixing in the AirCore, Atmos. Meas. Tech., 15, 1903–1916, https://doi.org/10.5194/amt-15-1903-2022, 2022.
TCCON: Total Carbon Column Observing Network (TCCON), TCCON [data set], https://tccondata.org/ (last access: 28 April 2023), 2023.
Thompson, C. R., Wofsy, S. C., Prather, M. J., Newman, P. A., Hanisco, T. F., Ryerson, T. B., Fahey, D. W., Apel, E. C., Brock, C. A., Brune, W. H., Froyd, K., Katich, J. M., Nicely, J. M., Peischl, J., Ray, E., Veres, P. R., Wang, S., Allen, H. M., Asher, E., Bian, H., Blake, D., Bourgeois, I., Budney, J., Bui, T. P., Butler, A., Campuzano-Jost, P., Chang, C., Chin, M., Commane, R., Correa, G., Crounse, J. D., Daube, B., Dibb, J. E., DiGangi, J. P., Diskin, G. S., Dollner, M., Elkins, J. W., Fiore, A. M., Flynn, C. M., Guo, H., Hall, S. R., Hannun, R. A., Hills, A., Hintsa, E. J., Hodzic, A., Hornbrook, R. S., Huey, L. G., Jimenez, J. L., Keeling, R. F., Kim, M. J., Kupc, A., Lacey, F., Lait, L. R., Lamarque, J.-F., Liu, J., McKain, K., Meinardi, S., Miller, D. O., Montzka, S. A., Moore, F. L., Morgan, E. J., Murphy, D. M., Murray, L. T., Nault, B. A., Neuman, J. A., Nguyen, L., Gonzalez, Y., Rollins, A., Rosenlof, K., Sargent, M., Schill, G., Schwarz, J. P., Clair, J. M. St., Steenrod, S. D., Stephens, B. B., Strahan, S. E., Strode, S. A., Sweeney, C., Thames, A. B., Ullmann, K., Wagner, N., Weber, R., Weinzierl, B., Wennberg, P. O., Williamson, C. J., Wolfe, G. M., and Zeng, L.: The NASA Atmospheric Tomography (ATom) Mission: Imaging the Chemistry of the Global Atmosphere, B. Am. Meteorol. Soc., 103, E761–E790, https://doi.org/10.1175/BAMS-D-20-0315.1, 2022.
Toon, O. B., Maring, H., Dibb, J., Ferrare, R., Jacob, D. J., Jensen, E. J., Luo, Z. J., Mace, G. G., Pan, L. L., Pfister, L., Rosenlof, K. H., Redemann, J., Reid, J. S., Singh, H. B., Thompson, A. M., Yokelson, R., Minnis, P., Chen, G., Jucks, K. W., and Pszenny, A.: Planning, implementation, and scientific goals of the Studies of Emissions and Atmospheric Composition, Clouds and Climate Coupling by Regional Surveys (SEAC4RS) field mission, J. Geophys. Res.-Atmos., 121, 4967–5009, https://doi.org/10.1002/2015JD024297, 2016.
Wennberg, P. O., Roehl, C. M., Wunch, D., Blavier, J.-F., Toon, G. C., Allen, N. T., Treffers, R., and Laughner, J.: TCCON data from Caltech (US), Release GGG2020.R0 (Version R0) [data set], CaltechDATA, https://doi.org/10.14291/tccon.ggg2020.pasadena01.R0, 2022a.
Wennberg, P. O., Wunch, D., Roehl, C. M., Blavier, J.-F., Toon, G. C., and Allen, N. T.: TCCON data from Lamont (US), Release GGG2020.R0 (Version R0) [data set], CaltechDATA, https://doi.org/10.14291/tccon.ggg2020.lamont01.R0, 2022b.
Wennberg, P. O., Roehl, C. M., Wunch, D., Toon, G. C., Blavier, J.-F., Washenfelder, R., Keppel-Aleks, G., and Allen, N. T.: TCCON data from Park Falls (US), Release GGG2020.R0 (Version R0) [data set], CaltechDATA, https://doi.org/10.14291/tccon.ggg2020.parkfalls01.R0, 2022c.
Wofsy, S. C., Afshar, S., Allen, H. M., Apel, E. C., Asher, E. C., Barletta, B., Bent, J., Bian, H., Biggs, B. C., Blake, D. R., Blake, N., Bourgeois, I., Brock, C. A., Brune, W. H., Budney, J. W., Bui, T. P., Butler, A., Campuzano-Jost, P., Chang, C. S., Chin, M., Commane, R., Correa, G., Crounse, J. D., Cullis, P. D., Daube, B. C., Day, D. A., Dean-Day, J. M., Dibb, J. E., DiGangi, J. P., Diskin, G. S., Dollner, M., Elkins, J. W., Erdesz, F., Fiore, A. M., Flynn, C. M., Froyd, K. D., Gesler, D. W., Hall, S. R., Hanisco, T. F., Hannun, R. A., Hills, A. J., Hintsa, E. J., Hoffman, A., Hornbrook, R. S., Huey, L. G., Hughes, S., Jimenez, J. L., Johnson, B. J., Katich, J. M., Keeling, R. F., Kim, M. J., Kupc, A., Lait, L. R., McKain, K., Mclaughlin, R. J., Meinardi, S., Miller, D. O., Montzka, S. A., Moore, F. L., Morgan, E. J., Murphy, D. M., Murray, L. T., Nault, B. A., Neuman, J. A., Newman, P. A., Nicely, J. M., Pan, X., Paplawsky, W., Peischl, J., Prather, M. J., Price, D. J., Ray, E. A., Reeves, J. M., Richardson, M., Rollins, A. W., Rosenlof, K. H., Ryerson, T. B., Scheuer, E., Schill, G. P., Schroder, J. C., Schwarz, J. P., St.Clair, J. M., Steenrod, S. D., Stephens, B. B., Strode, S. A., Sweeney, C., Tanner, D., Teng, A. P., Thames, A. B., Thompson, C. R., Ullmann, K., Veres, P. R., Wagner, N. L., Watt, A., Weber, R., Weinzierl, B. B., Wennberg, P. O., Williamson, C. J., Wilson, J. C., Wolfe, G. M., Woods, C. T., Zeng, L. H., and Vieznor, N.: ATom: Merged Atmospheric Chemistry, Trace Gases, and Aerosols, Version 2, ORNL DAAC, Oak Ridge, Tennessee, USA, https://doi.org/10.3334/ORNLDAAC/1925, 2021.
Wunch, D., Toon, G. C., Wennberg, P. O., Wofsy, S. C., Stephens, B. B., Fischer, M. L., Uchino, O., Abshire, J. B., Bernath, P., Biraud, S. C., Blavier, J.-F. L., Boone, C., Bowman, K. P., Browell, E. V., Campos, T., Connor, B. J., Daube, B. C., Deutscher, N. M., Diao, M., Elkins, J. W., Gerbig, C., Gottlieb, E., Griffith, D. W. T., Hurst, D. F., Jiménez, R., Keppel-Aleks, G., Kort, E. A., Macatangay, R., Machida, T., Matsueda, H., Moore, F., Morino, I., Park, S., Robinson, J., Roehl, C. M., Sawa, Y., Sherlock, V., Sweeney, C., Tanaka, T., and Zondlo, M. A.: Calibration of the Total Carbon Column Observing Network using aircraft profile data, Atmos. Meas. Tech., 3, 1351–1362, https://doi.org/10.5194/amt-3-1351-2010, 2010.
Wunch, D., Toon, G. C., Blavier, J.-F. L., Washenfelder, R. A., Notholt, J., Connor, B. J., Griffith, D. W. T., Sherlock, V., and Wennberg, P. O.: The Total Carbon Column Observing Network, Philos. T. R. Soc. A, 369, 2087–2112, https://doi.org/10.1098/rsta.2010.0240, 2011.
Zhou, M., Langerock, B., Vigouroux, C., Sha, M. K., Ramonet, M., Delmotte, M., Mahieu, E., Bader, W., Hermans, C., Kumps, N., Metzger, J.-M., Duflot, V., Wang, Z., Palm, M., and De Mazière, M.: Atmospheric CO and CH4 time series and seasonal variations on Reunion Island from ground-based in situ and FTIR (NDACC and TCCON) measurements, Atmos. Chem. Phys., 18, 13881–13901, https://doi.org/10.5194/acp-18-13881-2018, 2018.
Zhou, M., Langerock, B., Vigouroux, C., Sha, M. K., Hermans, C., Metzger, J.-M., Chen, H., Ramonet, M., Kivi, R., Heikkinen, P., Smale, D., Pollard, D. F., Jones, N., Velazco, V. A., García, O. E., Schneider, M., Palm, M., Warneke, T., and De Mazière, M.: TCCON and NDACC XCO measurements: difference, discussion and application, Atmos. Meas. Tech., 12, 5979–5995, https://doi.org/10.5194/amt-12-5979-2019, 2019.