the Creative Commons Attribution 4.0 License.
the Creative Commons Attribution 4.0 License.
 | 30 May 2023
An automated online field instrument to quantify the oxidative potential of aerosol particles via ascorbic acid oxidation
Battist Utinger
Steven John Campbell
Nicolas Bukowiecki
Alexandre Barth
Benjamin Gfeller
Ray Freshwater
Hans-Rudolf Rüegg
Markus Kalberer
Large-scale epidemiological studies have consistently shown that exposure to ambient particulate matter (PM) is responsible for a variety of adverse health effects. However, the specific physical and chemical properties of particles that are responsible for the observed health effects, as well as the underlying mechanisms of particle toxicity upon exposure, remain largely uncertain. Studies have widely suggested that the oxidative potential (OP) of aerosol particles is a key metric to quantify particle toxicity. OP is defined as the ability of aerosol particle components to produce reactive oxidative species (ROSs) and deplete antioxidants in vivo. Traditional methods for measuring OP using acellular assays largely rely on analyzing PM collected in filters offline. This is labor intensive and involves a substantial time delay between particle collection and OP analysis. It therefore likely underestimates particle OP because many reactive chemical components which contribute to OP are short-lived and therefore degrade prior to offline analysis. Thus, new techniques are required to provide a robust and rapid quantification of particle OP, capturing the chemistry of oxidizing and short-lived, highly reactive aerosol components and their concentration dynamics in the atmosphere. To address these measurement shortcomings, we developed a portable online instrument that directly samples particles into an ascorbic acid-based assay under physiologically relevant conditions of pH 6.8 and 37 ∘C, providing continuous, accurate OP measurements with a high time resolution (5 min). The instrument runs autonomously for up to 3 d and has a detection limit of about 5 µg m−3 in an urban environment, which allows the characterization of particle OP even in low-pollution areas.
- Article
(2146 KB) - Full-text XML
-
Supplement
(545 KB) - BibTeX
- EndNote


Numerous epidemiological studies have linked anthropogenic air pollution to adverse health effects (Laden et al., 2006; Lepeule et al., 2012; Hart et al., 2015). They demonstrate that exposure to elevated levels of ambient aerosol particles is linked to increased hospital admissions and premature death from various diseases such as cancer and respiratory and cardiovascular diseases (Brunekreef and Holgate, 2002; Künzi et al., 2013). The World Health Organization estimates in a recent report (World Health Organization, 2016) that one in eight deaths worldwide are related to air pollution. Despite compelling epidemiological evidence, the chemical and physical properties of aerosol particles and the detailed pathways of particle toxicity that cause these negative health effects are largely unknown (Bates et al., 2019).
Many countries adopted limit values for the total particle mass as an indicator of particle toxicity. However, several studies have shown that composition, for example, elemental black carbon or transition metal levels, is a better proxy for particle toxicity than particle mass concentrations alone (Oberdörster et al., 2005; Koike and Kobayashi, 2006; Godri et al., 2010). Moreover, studies have demonstrated that the oxidative stress resulting from exposure to PM2.5 could be a key mechanism to explain the health effects observed upon exposure to particles. Oxidative stress occurs when an imbalance develops in cells and tissues between reactive oxygen species (ROSs) and natural antioxidant defense mechanisms. This imbalance could lead to oxidative stress and therefore trigger various biological effects, such as inflammation, alteration of DNA and/or proteins, cell damage, and death (Prahalad et al., 2001; Baulig et al., 2003; Donaldson et al., 2001; Li et al., 2003; Offer et al., 2022).
ROSs (i.e., inorganic and organic radicals and peroxides such as hydroxyl radical (•OH), superoxide (O) and hydrogen peroxides (H2O2), in some cases including organic peroxides) can be delivered exogenously by inhalation of PM into the lung. ROSs can also be generated in vivo through redox chemistry initiated by aerosol components such as redox-active transition metals and quinones. This ability of PM components to produce ROSs, possibly catalytically, through redox chemistry and subsequent antioxidant depletion in biological cells or tissue is defined as oxidative potential (OP) (Bates et al., 2019). Measurement methods have been developed to quantify OP using cellular assays (Lehman et al., 2016) or acellular assays (Campbell et al., 2021). In epidemiological studies, cellular and acellular assays have shown a correlation between the overall oxidative capacity of PM and its negative effects on human health (Steenhof et al., 2011; GBD 2013 Risk Factors Collaborators, 2015; Yang et al., 2016; Bates et al., 2019; Zhang et al., 2021). In recent years, several acellular assays have been developed. The advantages of acellular assays are that they are usually cheaper and less time-consuming. The most commonly used assays are the dithiothreitol (DTT), ascorbic acid (AA), glutathione (GHS) and 2,7-dichlorofluorescin–horseradish peroxidase (DCFH) assays.
Traditionally, acellular ROS and OP measurement methods are based on the collection of PM filters, with quantification of OP taking place days, weeks or even months later (Venkatachari et al., 2005; Godri et al., 2011; Salana et al., 2021; Zhang et al., 2021). This most likely results in an underestimation of PM OP because many highly reactive aerosol components, including particle-bound ROSs (e.g., ROOH, R• and RO•x species in particular) are short-lived and unstable (Fuller et al., 2014; Zhang et al., 2021). In a recent study, we showed that only a very small fraction (<10 %) of particle-bound ROSs in organic aerosol collected on filters is stable when compared to in situ online DCFH measurements (Zhang et al., 2021), emphasizing the need for the rapid collection of particles to capture the chemistry of highly reactive aerosol components. Other studies, which measured the decay rate of organic radicals (Campbell et al., 2019b), peroxy pinic acid (Steimer et al., 2018) or hydrolysis of organic hydroperoxides in particles (Zhao et al., 2018), also show the half-life times of these unstable compounds, ranging from minutes to hours.
Therefore, new direct online measurement methods are required with direct-to-assay particle collection and rapid OP quantification to accurately assess the influence of highly reactive components on total OP. Providing robust OP measurements is a key step in achieving a more realistic assessment of the link between particle OP and particle toxicity (Fuller et al., 2014). Thus, various attempts have been made to build online methods and instruments to obtain faster measurements with a higher temporal resolution (Wang et al., 2011; Fang et al., 2015; Wragg et al., 2016; Gao et al., 2017).
The OP measurement depends on not only the aerosol composition but also the assay used. The human lung-lining layer contains, in addition to AA, other components such as glutathione, uric acid and many more anti-oxidants. Calas et al. (2017) showed that a simulated, epithelium lung lining to mimic the lung conditions might be favorable. However, Pietrogrande et al. (2019) demonstrated that, when assessing the OP with a mixture of antioxidants, the absolute signal of each antioxidant is lower because the OP is reduced by different antioxidants, which results in higher detection limits.
In this study, we present the development, characterization and first field deployment of a new online instrument that continuously quantifies OP in aerosol particles based on AA oxidation with a high time resolution (ca. 5 min). The online oxidative potential ascorbic acid instrument (OOPAAI) is the first instrument that provides rapid, highly-time-resolved OP quantification based on the oxidation of ascorbic acid. We run the OOPAAI using an AA-only-based assay to achieve as low a detection limit as possible, allowing quantification of OP in a range of polluted and moderate-pollution environments. The OOPAAI is an instrument with vastly improved performance, e.g., a better detection limit and functionality, compared to the method presented by Campbell et al. (2019a), now running at physiologically relevant conditions and including improved hardware components compared to the instrument developed by Wragg et al. (2016).
2.1 Reagents
All chemicals were obtained from Sigma-Aldrich, and all gases were obtained from Carbagas and were used without further purification unless otherwise indicated; these chemicals and gases include ascorbic acid (AA, 99.0 %), dehydroascorbic acid (DHA, 99.0 %), 0.1 M HCl solution, 0.1 M NaOH solution, Chelex 100 sodium form, CuSO4 (99.0 %), FeSO4 (99 %), Fe2(SO4)3 (98 %), o-phenylenediamine (OPDA, ≥99.5 %), HEPES (4-(2-hydroxyethyl)-1-piperazineethanesulfonic acid, ≥99 %), α-pinene (≥98 %), β-pinene (≥98 %), naphthalene (≥99 %), zero-grade air (Medipac 2000 Superplus, Donaldson Company) and N2 gas (purity 99.999 %). The H2O used to prepare the solutions was purified with an ultrapure water (resistivity ≥18.2 MΩ cm−1; Synergy, Merck).
2.2 Chemical preparation
All solutions were made fresh every day, unless otherwise specified. Ultrapure water was additionally purified using a fritted column filled with 100 g of Chelex 100. An amount of 500 mL of ultrapure water was added, and the valve was adjusted to a flow of one drop per minute. The Chelex resin treatment was used to remove trace metals (e.g., copper and iron) from ultrapure water and to ensure a stable, low transition-metal-free background, which would otherwise interfere with AA oxidation from the sample. The AA solution (200 µM) was prepared at least 1 h before the experiment so that the background drift could stabilize with a 20 mM HEPES buffer at pH 6.8. The HEPES buffer working solution was prepared using 1:10 dilution with Chelexed ultrapure water from a stock solution, which is stored in the refrigerator. OPDA solutions were prepared by dissolving 0.432 g of OPDA in 250 mL of 0.1 hydrochloric acid (20 mM OPDA) immediately before the experiment to reduce OPDA oxidation. AA solutions were stored in opaque plastic bottles (250 mL; Nalgene, Merck) which were rinsed with hydrochloric acid to remove trace amounts of metals.
2.3 Ascorbic acid chemistry
An AA assay was used to quantify the OP of a given sample by measuring the oxidized form of AA, dehydroascorbic acid (DHA), as shown in Fig. 1. The pKa of AA is around 4.1; therefore, at pH 6.8 in an aqueous environment, AA is present mostly as the ascorbate anion (AH−). AA and AH− can be directly oxidized by metals such as Fe(III) or Cu(II) to form DHA, or they can be oxidized over the intermediate monodehydroascorbate radical (A•−). In Fig. 1, only the most important pathways that occur at a physiologically relevant pH 6.8 are shown. In the oxidation of AA, DHA is the first stable reaction product, and therefore DHA was chosen here as a direct measure of AA oxidation. DHA was then further reacted in a condensation reaction with o-phenylenediamine (OPDA) under acidic conditions at pH 2 to form the fluorophore (1,2-dihydroxyethyl)-fluoro[3,4-b]quinoxaline-1-one (DFQ) that is quantified in this assay. The chemistry of the AA assay and the mechanism of AA oxidation are described in more detail by Campbell et al. (2019a) and Shen et al. (2021).
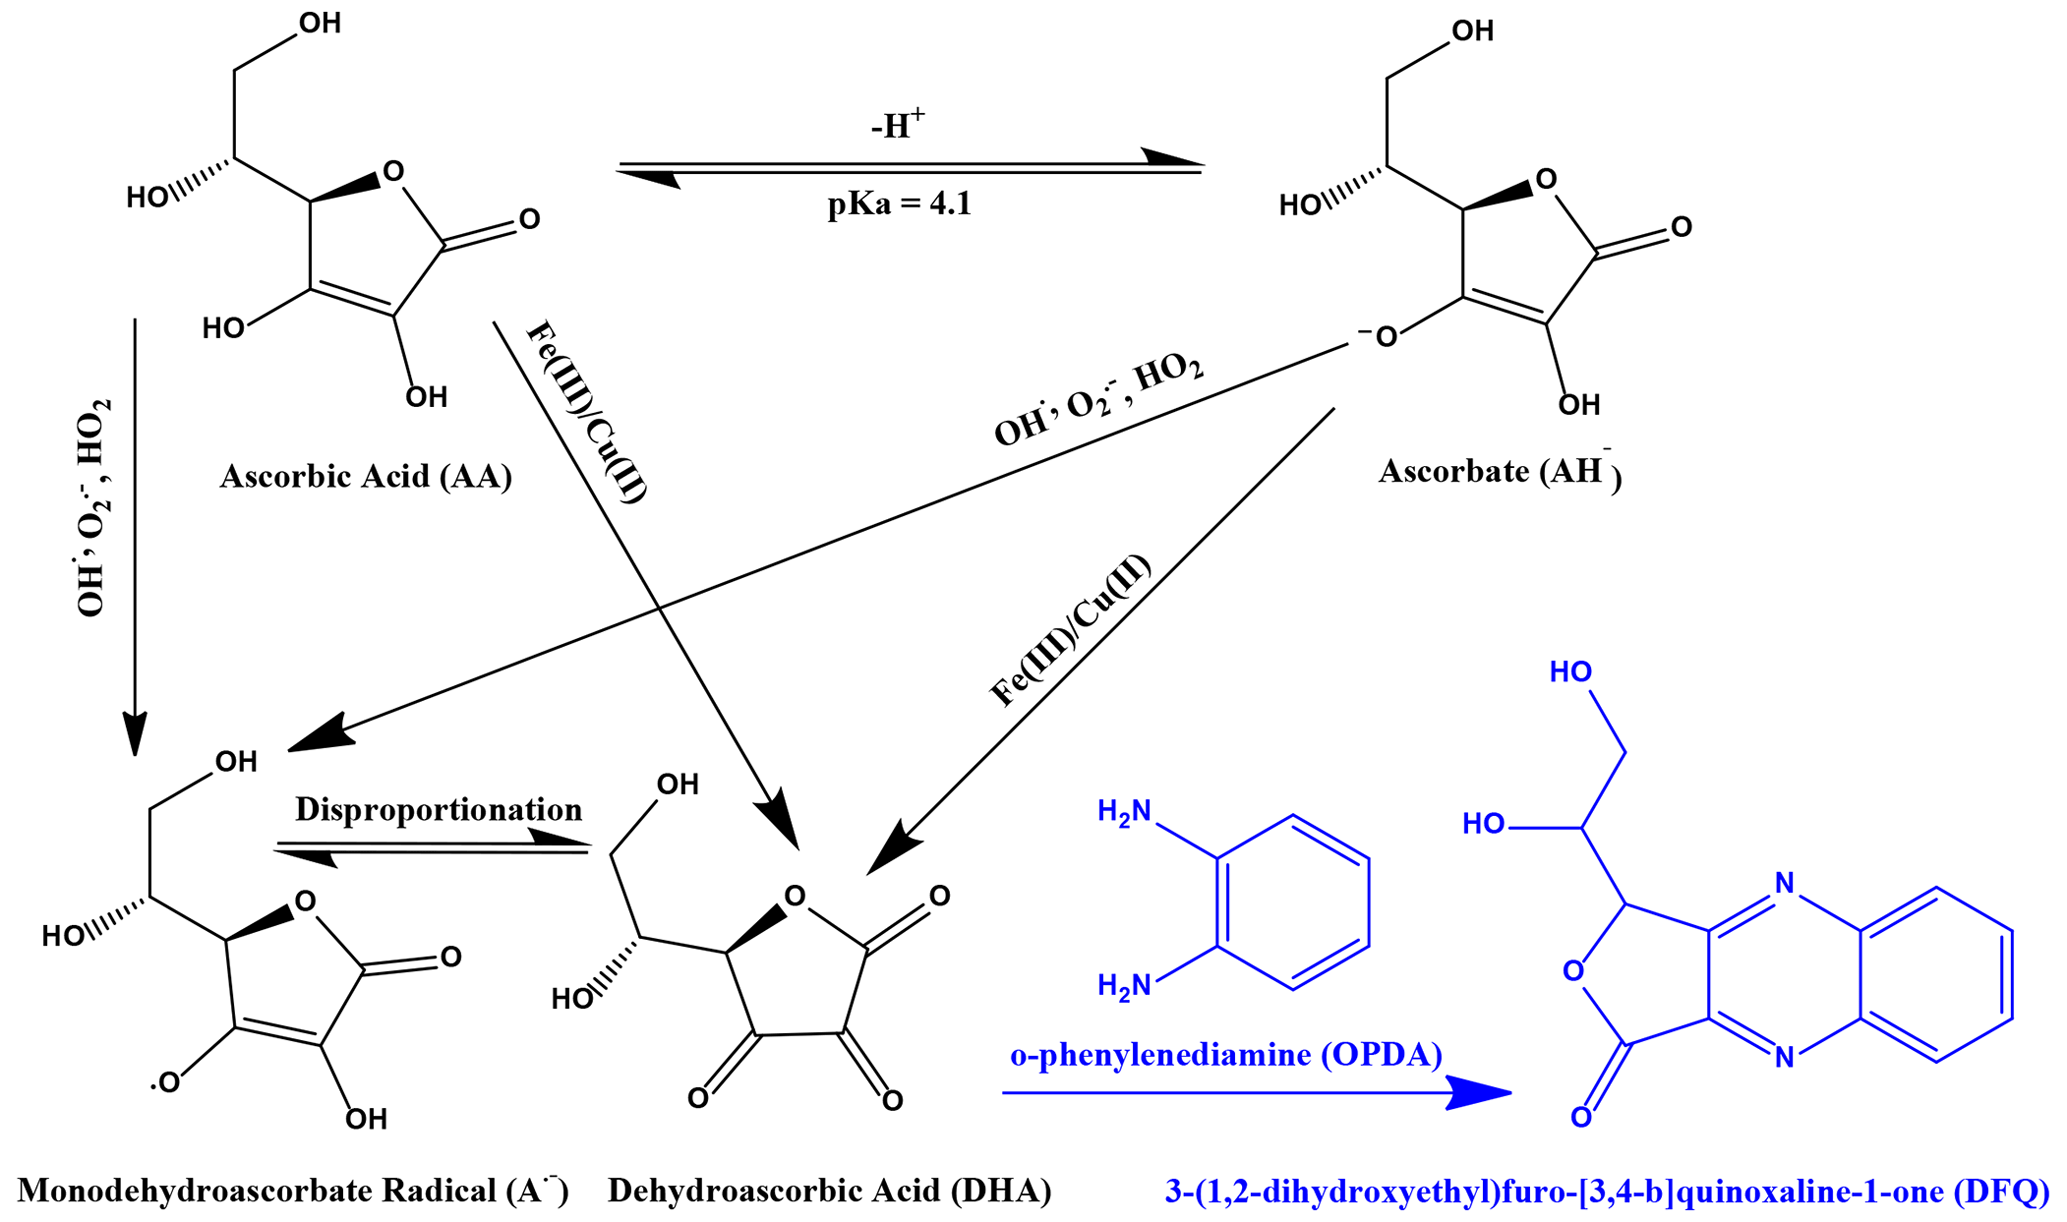
Figure 1Simplified reaction scheme describing AA and AH oxidation by ROSs and redox-active transition metals (black) and the condensation reaction with o-phenylendiamine (OPDA) to the fluorophore (1,2-dihydroxyethyl)-fluoro[3,4-b]quinoxaline-1-one (DFQ) (purple).
The fluorescence detection approach (i.e., reaction of DHA with OPDA) was selected over a direct UV–VIS absorbance measurement of AA because fluorescence spectra are often more specific for an individual compound than UV–VIS absorbance, although the fluoresce detection approach needs an additional condensation step (see Fig. S1 in the Supplement). AA has a broad UV absorption peak at a wavelength of 265 nm. Many other organic compounds present in aerosol extracts also have strong absorbance in near-UV (see Fig. S2) (Birdwell and Engel, 2010; Huang et al., 2018). Therefore, it is not feasible to devise an instrument for continuous online operation using absorbance detection where a decrease in AA would need to be quantified in the presence of a larger background that potentially varies substantially with changes in the organic aerosol composition.
2.4 Offline measurements
Secondary organic aerosol (SOA) particles (using α-pinene as the precursor) were collected on filters for offline AA analysis to determine particle OP decay. SOA produced from OH-initiated photooxidation of α-pinene is commonly used as an atmospherically representative SOA (Campbell et al., 2019b). High-mass-concentration SOA (approximately 80 mg m−3) was produced using the Organic Coating Unit (OCU) (Keller et al., 2022) collected on quartz filters for 100 s. These very high aerosol concentrations were necessary to minimize the time between particle generation and analysis and therefore reduce the decay of short-lived OP-active aerosol components. Keller et al. (2022) showed that the OCU produces SOA, even at high masses, with an atmospherically relevant, realistic chemical composition when compared to conditions in the particle mass range of low microgram values per cubic meter (Keller et al., 2022). In the OCU, an organic precursor is oxidized in a small flow chamber by OH and ozone under controlled relative humidity (65 %) and temperature conditions (fully described by Keller et al., 2022). After the OCU, an additional flow tube with additional ozone flow was added to oxidize the VOC that was not oxidized in the OCU and to increase the particle mass. Furthermore, the aerosol passed through a charcoal denuder to remove unreacted ozone and VOCs with an efficiency of 99.9 % (Campbell et al., 2019b).
The filters were then collected and extracted after different time intervals and analyzed with an offline AA assay using the same chemical conditions as the OOPAAI AA-based assay. A 47 mm quartz filter was extracted directly in 3 mL of 200 µM AA, buffered with 20 mM HEPES and then vortexed for 3 min. The slurry is then filtered with a syringe filter (PTFE, pore size 0.45 µm, Agilent). An amount of 900 µL of the extract was then incubated for 20 min in a 37 ∘C heating bath, which corresponds to the reaction time between aerosol extract and AA in the online instrument (see below). Subsequently, 100 µL OPDA dissolved in 0.1 M HCl was added and reacted for an additional 3 min at room temperature, and then the fluorescent signal was measured immediately with a spectrometer (QePro-UV-VIS, Ocean Insight). The fluorescent product DFQ was excited at λex=365 nm, with peak fluorescence emission monitored at λem=430 nm.
2.5 The online oxidative potential ascorbic acid instrument (OOPAAI)
Figure 2 shows a schematic overview of the OOPAAI. The key components of the instrument are as follows: (1) the PILS (PILS, model 4001, Brechtel), where the aerosol particles are collected into the liquid phase; (2) the heating bath, where ROS and the other OP-active particle components react with AA to form DHA under physiological conditions (pH 6.8 and 37 ∘C) and where the condensation reaction occurs between DHA and OPDA to form the fluorescent product DFQ; (3) the detection cell, where the fluorophore DFQ is quantified using a spectrometer.
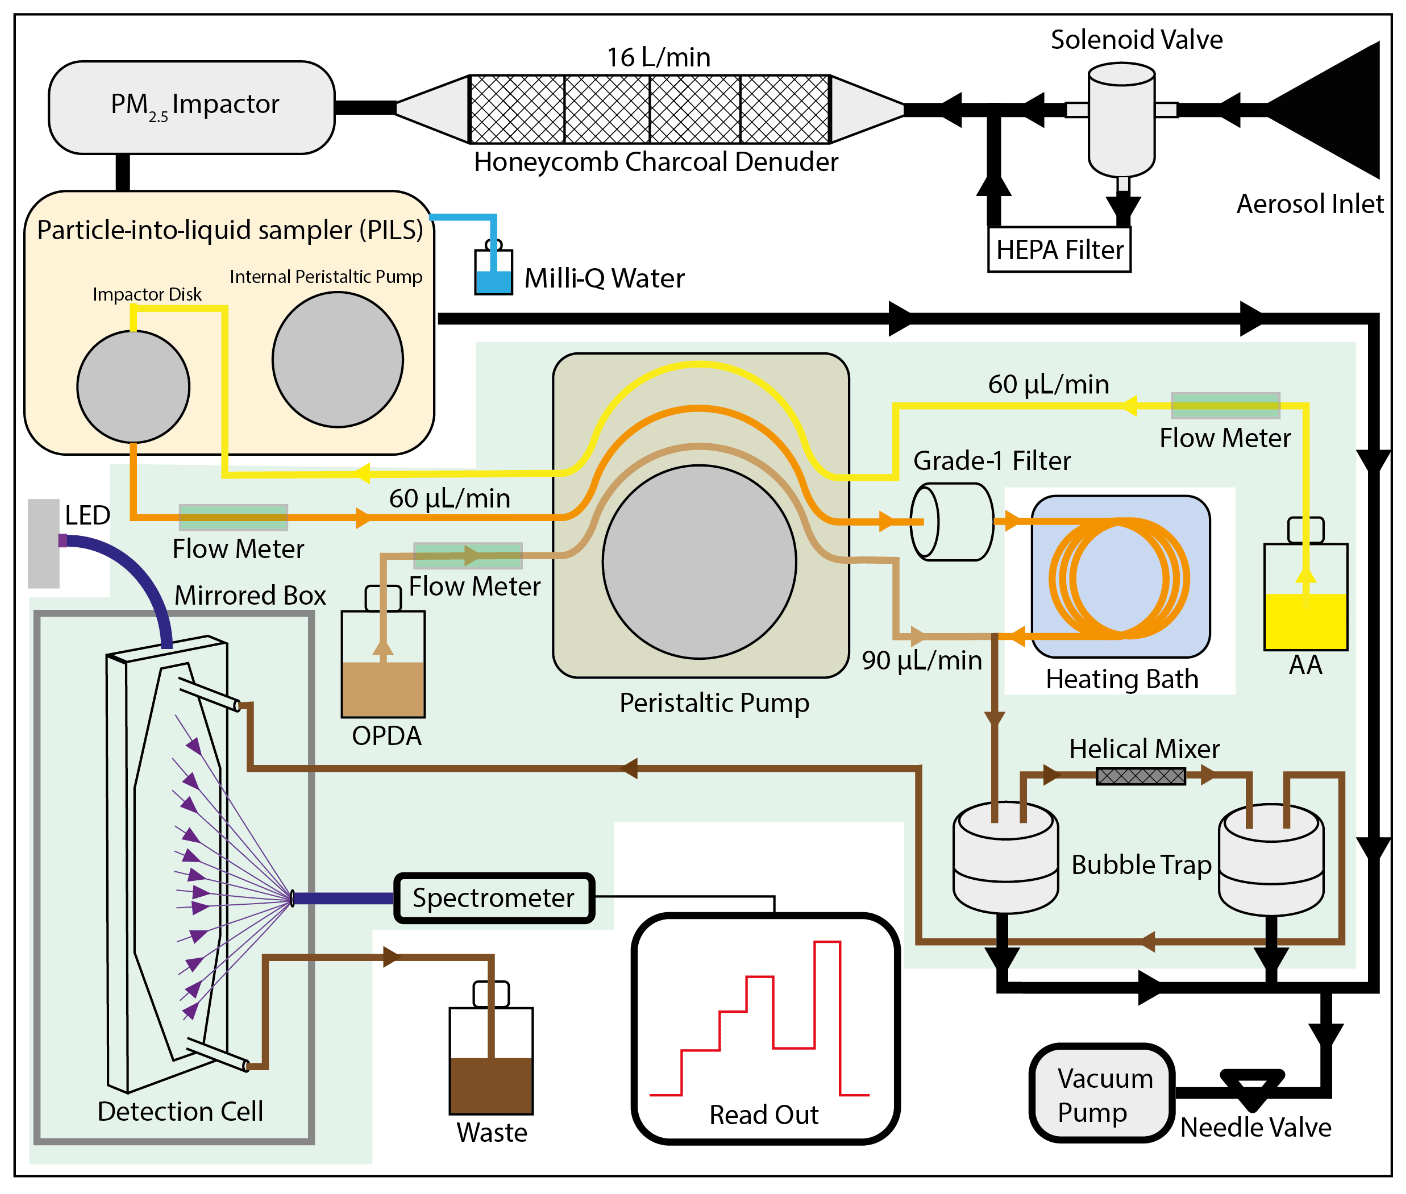
Figure 2Schematic overview of the OOPAAI. Black lines illustrate air flows where air gets pulled into the PILS via a denuder and an impactor. In the PILS, the aerosol is collected with a wash flow containing ascorbic acid (yellow line) and pumped into a heating bath via a grade-1 filter (orange line). OPDA (light-brown line) is then added, and the condensation reaction of DHA with OPDA to form DFQ takes place (dark-brown line). After a mixing piece and two bubble traps, the liquid is pumped into the detection cell, where DFQ is excited by an LED and the fluorescent emission is quantified by a spectrometer. All components are mounted in an aluminum box, and the components with a light-green background are in the thermos-controlled compartment of the OOPAAI.
The aerosol is pumped into the instrument using a vacuum pump (N035.1.2AN.18, KNF) at a flow rate of 16 L min−1 through a sample inlet (Fig. 2, black lines), where a solenoid valve allows switching between a HEPA filter (HEPA-CAP 75, Whatman), which removes 99.9 % of particles (to allow for blank measurements with particle-free air), and no HEPA filter. The aerosol then passes through four activated-charcoal honeycomb denuders (charcoal honeycomb denuders, Ionicon) with a total length of 14 cm to remove all gaseous oxidizing volatile compounds that can result in an increased OP signal. After the charcoal denuder, particles >2.5 µm are removed with a round jet impactor. The impactor is part of the PILS, which was modified for our purposes. The wash flow in the PILS is not operated by the internal peristaltic pump but with an external peristaltic pump (Ismatec_REGLO Peristaltic Pump, Fisher Scientific) that can adjust flows for each channel independently. Furthermore, the internal bubble trap was removed from the PILS and replaced with two external ones. External bubble traps are placed after mixing with the OPDA, contributing to better mixing. To maximize and stabilize the air flow rate to 16 L min−1, the internal orifice was enlarged, and an additional needle valve was added after the pump. In the condensation chamber of the PILS, the particles are activated by supersaturated water vapor before they reach the impaction plate. Although steam is generated around 100 ∘C, the measured temperature in the condensation chamber, even close (1 cm) to the tip of the heat generator, is only between 35 and 40 ∘C. Therefore, it is unlikely that this moderate temperature increase will significantly affect the concentrations of OP-active aerosol components within the PILS. The extraction efficiency of the PILS was determined by comparing the AA oxidation of aerosol measured directly with the PILS (normal setup, as described in Fig. 2) and aerosol simultaneously collected on a filter (assuming 100 % particle collection efficiency on the filter), which was then extracted and the AA oxidation quantified using the fluorescence detection setup in the OOPAAI. Taking the differences of these two analyses, the collection efficiency of the PILS operated under conditions described here (i.e., very low liquid flow rates and further modifications) was calculated to be 20 %–25 %. The online measurements in Fig. 3 are corrected for the lower particle collection efficiency to ensure inter-comparison between online and offline measurements, but the other measurements are not corrected because we want to show the actual capability of the instrument at its current development stage.
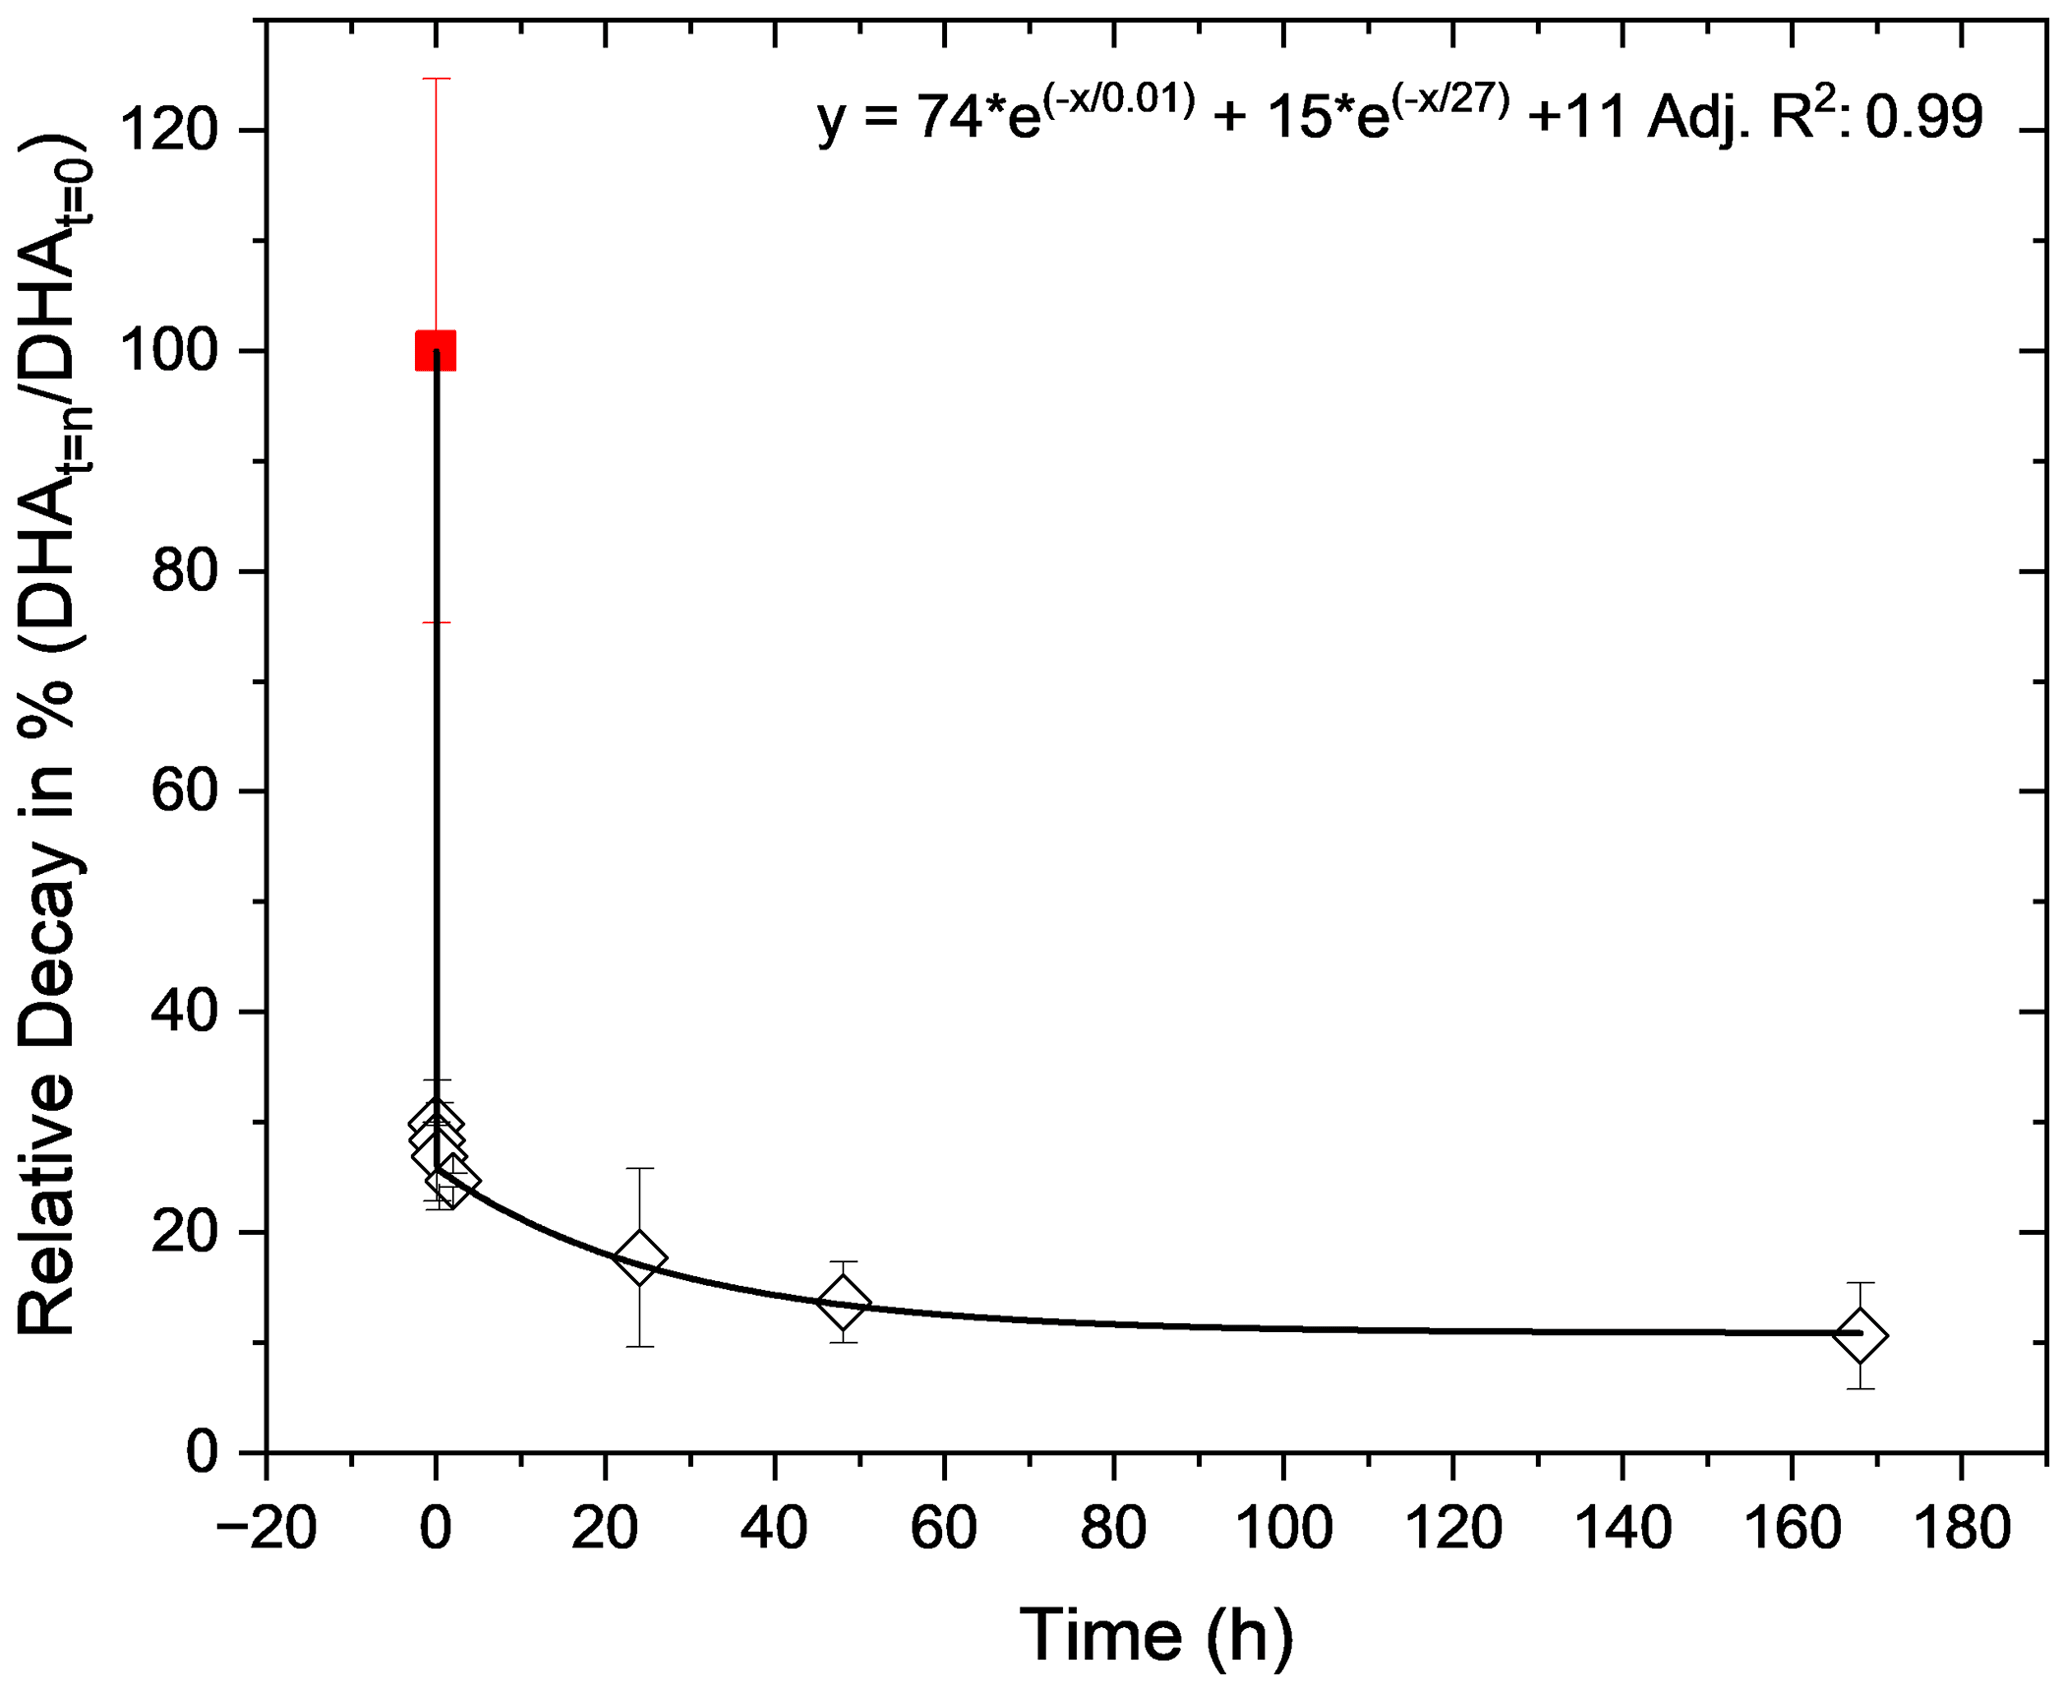
Figure 3Offline decay of AA oxidation by α-pinene aerosol (black diamonds) and comparison with online quantification using the OOPAAI (red square). For the offline decay of OP-active compounds in SOA, DHA concentrations were quantified between 2 min and 7 d after sampling. A two-phase exponential decay function is used for the fit and gives an adjusted R square of 0.998. The relative decay values are normalized to 100 % for the online signal. Error bars represent the standard deviation observed over three experimental repeats.
Activated aerosol particles are collected on the quartz impaction plate at the end of the condensation chamber of the PILS (Weber et al., 2010). This quartz impaction plate is washed with a continuous flow of 60 µL min−1 of AA (200 µM) buffered at pH 6.8 with a 10 mM HEPES buffer. HEPES is considered to be a buffer that generally does not form strong complexes with metals, which is advantageous because the AA assay is very sensitive to redox-active transition metals (see Fig. S3 in the Supplement) (Ferreira et al., 2015). For several highly OP-active metals such as iron or copper, the speciation of soluble complexes and the distribution between their soluble form and precipitates are strongly pH dependent. Therefore, maintaining a physiologically relevant pH is crucial to avoid changing the soluble fraction of metals and their speciation because the reactivity of AA (or any anti-oxidant) with metals will change significantly depending on the metal speciation and soluble or insoluble fractions.
The buffered AA–aerosol mixture is then pumped from the PILS in a polyether ether ketone (PEEK) tube through a peristaltic pump operated with polyvinyl chloride (PVC) peristaltic tubing (AHF, inner diameter 1.02 mm, white-white) at a flow rate of 60 µL min−1 flow through a cellulose filter (grade-1 filter, pore size 11 µm, Whatman) to remove any insoluble particles. Then, the reaction mixture flows through a heating bath filled with ethylene glycol at 37 ∘C, with a residence time of 20 min. This ensures that fast-reacting particle components contributing to OP, for example, organic radicals, as well as radicals formed by metals catalytically, are captured. A different residence time might change the sensitivity of the instrument towards specific OP components, where a longer residence time might enhance the contribution of catalytically active or slowly reacting components to the overall measured OP signal, and a shorter reaction time might enhance the contribution of short-lived OP components. Additionally, as DHA is not stable over time (Huelin, 1949) under physiological conditions, an extended residence time would lead to enhanced degradation of DHA, reducing the sensitivity of the OOPAAI. This reaction time of 20 min in the heating bath at body temperature and physiologically representative AA concentrations (200 µM) and physiologically relevant pH (pH 6.8) mimics the conditions in the human lung and the initial reactivity of the aerosol components with AA when aerosol particles get deposited on the lung-lining layer.
The liquid flow is then mixed in a t piece and two helical mixers ( in. or 1.5875 mm, Stamixco) with a 90 µL min−1 flow of OPDA (20 mM in 0.1 M hydrochloric acid) for approximately 2 min before reaching the detector. The short reaction time was optimized to minimize shifting reaction conditions as a result of the low pH (see the Supplement for details). DHA and OPDA react to form the fluorescent product DFQ with a 1:1 stoichiometry, which is then detected by fluorescence spectroscopy. To reduce oxidation and keep the solutions fresh over multiple days, the AA and OPDA solutions in the reservoir were continuously degassed with 50 mL min−1 of N2. There was only a minimal increase in the blank signal over time, which was detrended by a linear fit if necessary.
All liquid flows in the system are constantly monitored using liquid flow meters (SLF3S-0600F, Sensirion). For fluorescence measurements, the liquid enters the detection cell before being pumped out of the instrument as waste. The detection cell is a home-built unit that uses a commercial flow through the cell (137-2-40, Hellma Analytics) with a height of 2 mm, a length of 40 mm and a width of 10 mm. At the end of the detection cell, the cuvette narrows where the inlet and outlet are placed perpendicular to the flow direction (see Fig. 2). To enhance light transmission through the cuvette, the narrow sides of the cuvette are polished to make them transparent. The LED (Roithner Lasertechnik, type UVLED-365-330-SMD, peak emission wavelength 365 nm) is soldered on a printed circuit board (PCB), which is screwed to a home-built thermoelectric element to ensure stable temperature conditions and therefore a more stable LED output.
The optical fiber from the LED is in close contact with the polished short side of the detection cell and excites the solute. The emitted light is then collected from the side of the large surface area of the detection cell with a collimating lens (74-UV, Ocean Insight) and focused on a 1500 µm fiber with a numerical aperture of 0.5 (UV–VIS fiber, FP1500RET SMA, Thorlabs). The fluorescence detection cell is enclosed in a light-tight box, which has a mirroring surface (reflecting tape) to maximize the collection efficiency of the fluorescence emission. Right in front of the collimating lens, a bandpass filter (FBH430-10, Thorlabs) from 420 to 440 nm is installed to remove the scattering of the excitation peak. The peak fluorescence emission light at 430 nm is measured using a spectrometer (QePro-UV-VIS, Ocean insight). The fluorescence signal was integrated at a window over 10 nm across the peak emission at 430 nm (425–435 nm). A raw spectrum of DFQ, measured with the QePro from Ocean Insight, is shown in the Supplement (see Fig. S4).
The liquid reservoirs, all tubing, the peristaltic pump, the spectrometer and the flow cell are enclosed in a compartment inside the aluminum box that is insulated and temperature controlled by a thermoelectric cooler (PK 50, ELMEKO) and the corresponding control unit (TPC300, ELMEKO) with two thermistors to measure and regulate the temperature to minimize temperature-related changes in reaction rates (green box in Fig. 2). The control of instrument components, as well as data acquisition, is performed using a LabVIEW (National Instruments) script, which sets the input parameters for the peristaltic pump and monitors the liquid flow rates of the flow meters. A feedback maintains a constant flow at the specified set point. Furthermore, the LabVIEW collects auxiliary data (various temperatures and potential errors).
All these components and devices are integrated into an aluminum box ( cm) for better thermal stability and for easy transport. A fixed position of the different components ensures improved instrument performance and stability, as movement of key components, such as the optical fibers, has a noticeable effect on the fluorescence signal. The vacuum pump is kept external to minimize vibrations within the instrument. The waste reservoir is also kept external to minimize the amount of liquid inside the OOPAAI.
3.1 OP lifetime of SOA particles
SOA is often a major component of aerosol particles in urban and remote locations (Chen et al., 2022). However, little is known about the OP properties of SOA, particularly how long-lived the components which contribute to OP in SOA are. In the online instrument, the AA solution is brought into contact with the particles inside the PILS, i.e., within seconds after the particles entered the OOPAAI; therefore, very reactive components are also quantified, as described in detail in the method section above. Seven filters were collected and stored at room temperature between 2 min and 7 d and analyzed in triplicates. Figure 3 shows the relative decrease in DHA formation over time, normalized to the online OOPAAI measurement (red square). The offline measurements (black diamonds) and the online measurements are fitted with a two-phase exponential decay function. The stability of OP-active components in α-pinene SOA can be broadly divided into the following three fractions: a very reactive and short-lived fraction with a half-life of less than 1 min, which is only captured by the online OOPAAI; a second fraction that decays slower and has a half-life time of about 20 h; and a third fraction that is stable for more than a week. The online signal is more than 3 times higher than the immediately measured offline time point, and after a week almost 90 % of the OP-active components are lost. Overall, this will lead to a significant underestimation of the OP signal when using traditional offline analysis, especially if filter samples are not analyzed immediately. In a recent review, Wang et al. (2023) reported lifetimes for peroxide from seconds to days. Therefore, the decomposition of these peroxides may contribute to reduced OP on filter samples, as they may well degrade prior to analysis. A similar decay was also observed for offline measurements for the DCFH assay in several studies (Fuller et al., 2014; Wragg et al., 2016; Zhang et al., 2021). Note that OP decay characteristics could be different for SOA produced from other precursors. In addition, in ambient PM, inorganic particle components such as redox-active transition metals could also contribute to OP. These experiments clearly demonstrate that OP-active components in SOA decay on a timescale (minutes to about 1–2 d) that is much faster than typical offline analysis from particles collected on filters or impactors.
3.2 Response of the OOPAAI: condensation of DHA with OPDA
For the routine calibration of the OOPAAI, we use aqueous solutions of known concentrations of DHA to determine the instrument response and detection limit with respect to DHA detection. The calibration of the OOPAAI was performed at pH 2 to assure stability of the solutions during the calibration procedure. Calibration solutions of known DHA concentrations were pumped directly through the PILS without altering anything else in the instrument. The advantages of this calibration method are that there are minimal changes in the instrument setup, and at the same time, it also offers an easy and robust method to perform calibrations during field deployments of the OOPAAI. Figure 4 shows a calibration of DHA in which nine concentrations of DHA ranging from 0–100 µM were measured for 20 min each.

Figure 4DHA calibration curve. (a) Each concentration of DHA solution was measured for 20 min with the setup described in Fig. 1. (b) The calibration curve is linear (adj. R2=0.997) in the dynamic range of 0–200 µM. The error bars are calculated from the standard deviation of each plateau.
Figure 4a shows the raw detector signal that illustrates the fast time response after changing the DHA calibration solution. At concentrations <10 µM, i.e., the concentration range measured in ambient particles (see Fig. 8), the signal equilibrated to a new steady-state DHA concentration within 5 min, which is equal to the instrument's time resolution. This smear-out effect is due to diffusion, wall effects and turbulence in the tubing, bubble traps and the connectors of the instrument. Thus, the instrument is able to resolve changes in the OP concentration under ambient conditions on a timescale of a few minutes. Figure 4b shows the calibration curve for DHA concentrations from 1–100 µM. At DHA concentrations larger than 100 µM, the calibration curve starts to flatten, and such DHA concentrations are therefore considered to be beyond the linear calibration range of the instrument (data not shown). The error bars indicate the standard deviation obtained for each plateau of the corresponding measurement. This demonstrates a strong linear relationship between DHA concentration and fluorescence signal, with a dynamic range of at least 2 orders of magnitude. All subsequent calibration curves are blank subtracted (see first 30 min in Fig. 4a) and converted from fluorescence counts into DHA concentration using data from the calibration curve (Fig. 4), as shown in the first term of Eq. (1).
3.3 AA oxidation by filter extracts from SOA, metals and ambient aerosol
The AA assay is highly sensitive to redox-active transition metals such as Fe and Cu (Shen et al., 2021) but also reacts with organic components present in secondary organic aerosols but less efficiently than with metals (Pietrogrande et al., 2022). To determine the sensitivity of the OOPAAI to both metals and organic aerosols, calibrations were performed as illustrated in Fig. 5. In Fig. 5a, the calibration of α-pinene SOA aqueous extracts is shown with an adjusted R2 of 0.994, which indicates a good linearity over 2 orders of magnitude. In Fig. 5b, the OOPAAI response for iron(II) sulfate solutions is given with an adjusted R2 of 0.99 for a sigmoidal fit. The linear range of the response for Fe(II) is between about 0.5–2 µg mL−1; above about 2 µg mL−1, the calibration curve flattens. The reactivity of our AA assay is approximately 2 orders of magnitude higher for iron(II) sulfate than for α-pinene SOA, consistent with Campbell et al. (2019a). However, in ambient aerosol particles, the mass concentration of the organic aerosol is often 1–2 orders of magnitude higher than that of redox-active metals (Kamphus et al., 2010; Calvo et al., 2013; Hama et al., 2018), so despite the lower sensitivity of the AA assay towards organic constituents, they still have a large impact on the overall OP of the particles measured with AA and therefore potentially on the oxidative stress that aerosols might generate in the lung.
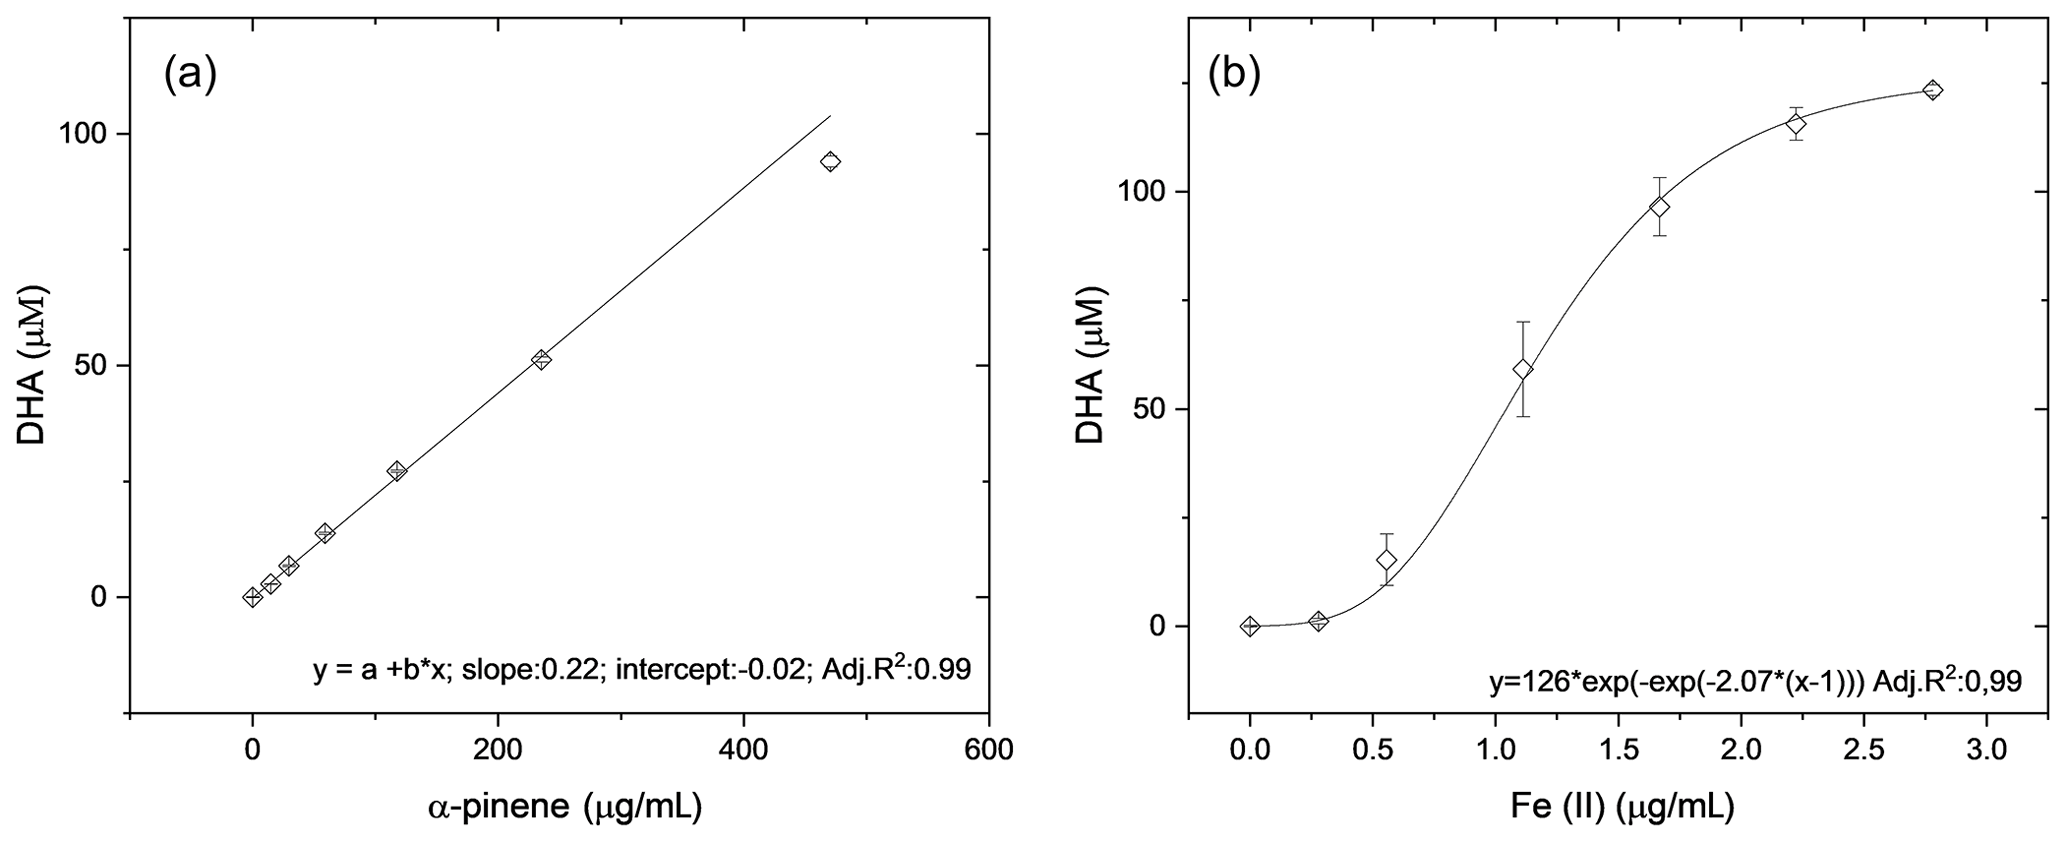
Figure 5Response curves generated form (a) α-pinene SOA from filter extracts and (b) from Fe(II)SO4 solutions. The error bars represent the standard deviation of the spectrometer signal normalized to the DHA concentration during the 30 min measurement. The slope of the linear fits through the data and, therefore, the sensitivity are around 100 times higher for the iron sulfate than for SOA.
To characterize the OOPAAI with a more complex chemical system, we used an aqueous extract of ambient aerosol samples collected on filters. This allowed us to evaluate the instrument performance with solutions of complex chemical composition that include a wide range of organic and inorganic components. For these measurements, the PILS was bypassed, and the AA solution was mixed in the instrument with the filter extract using the peristaltic pump of the OOPAAI. Figure 6 shows a series of dilutions of a filter collected in Beijing in 2016 during the Atmospheric Pollution and Human Health campaign (APHH) (Shi et al., 2019; Campbell et al., 2021). For these measurements, 10 punches (diameter of 1 cm) were extracted in 30 mL of ultrapure Chelexed water by vortexing a 50 mL falcon tube for 3 min. Afterwards, the filter slurry was filtrated with a syringe filter (0.45 µM pore size) and collected in another falcon tube (full description of the method in Campbell et al. (2019a). A good linearity (R2 of 0.99) is obtained, illustrating that complex ambient aerosol extracts can also be quantified with the OOPAAI.
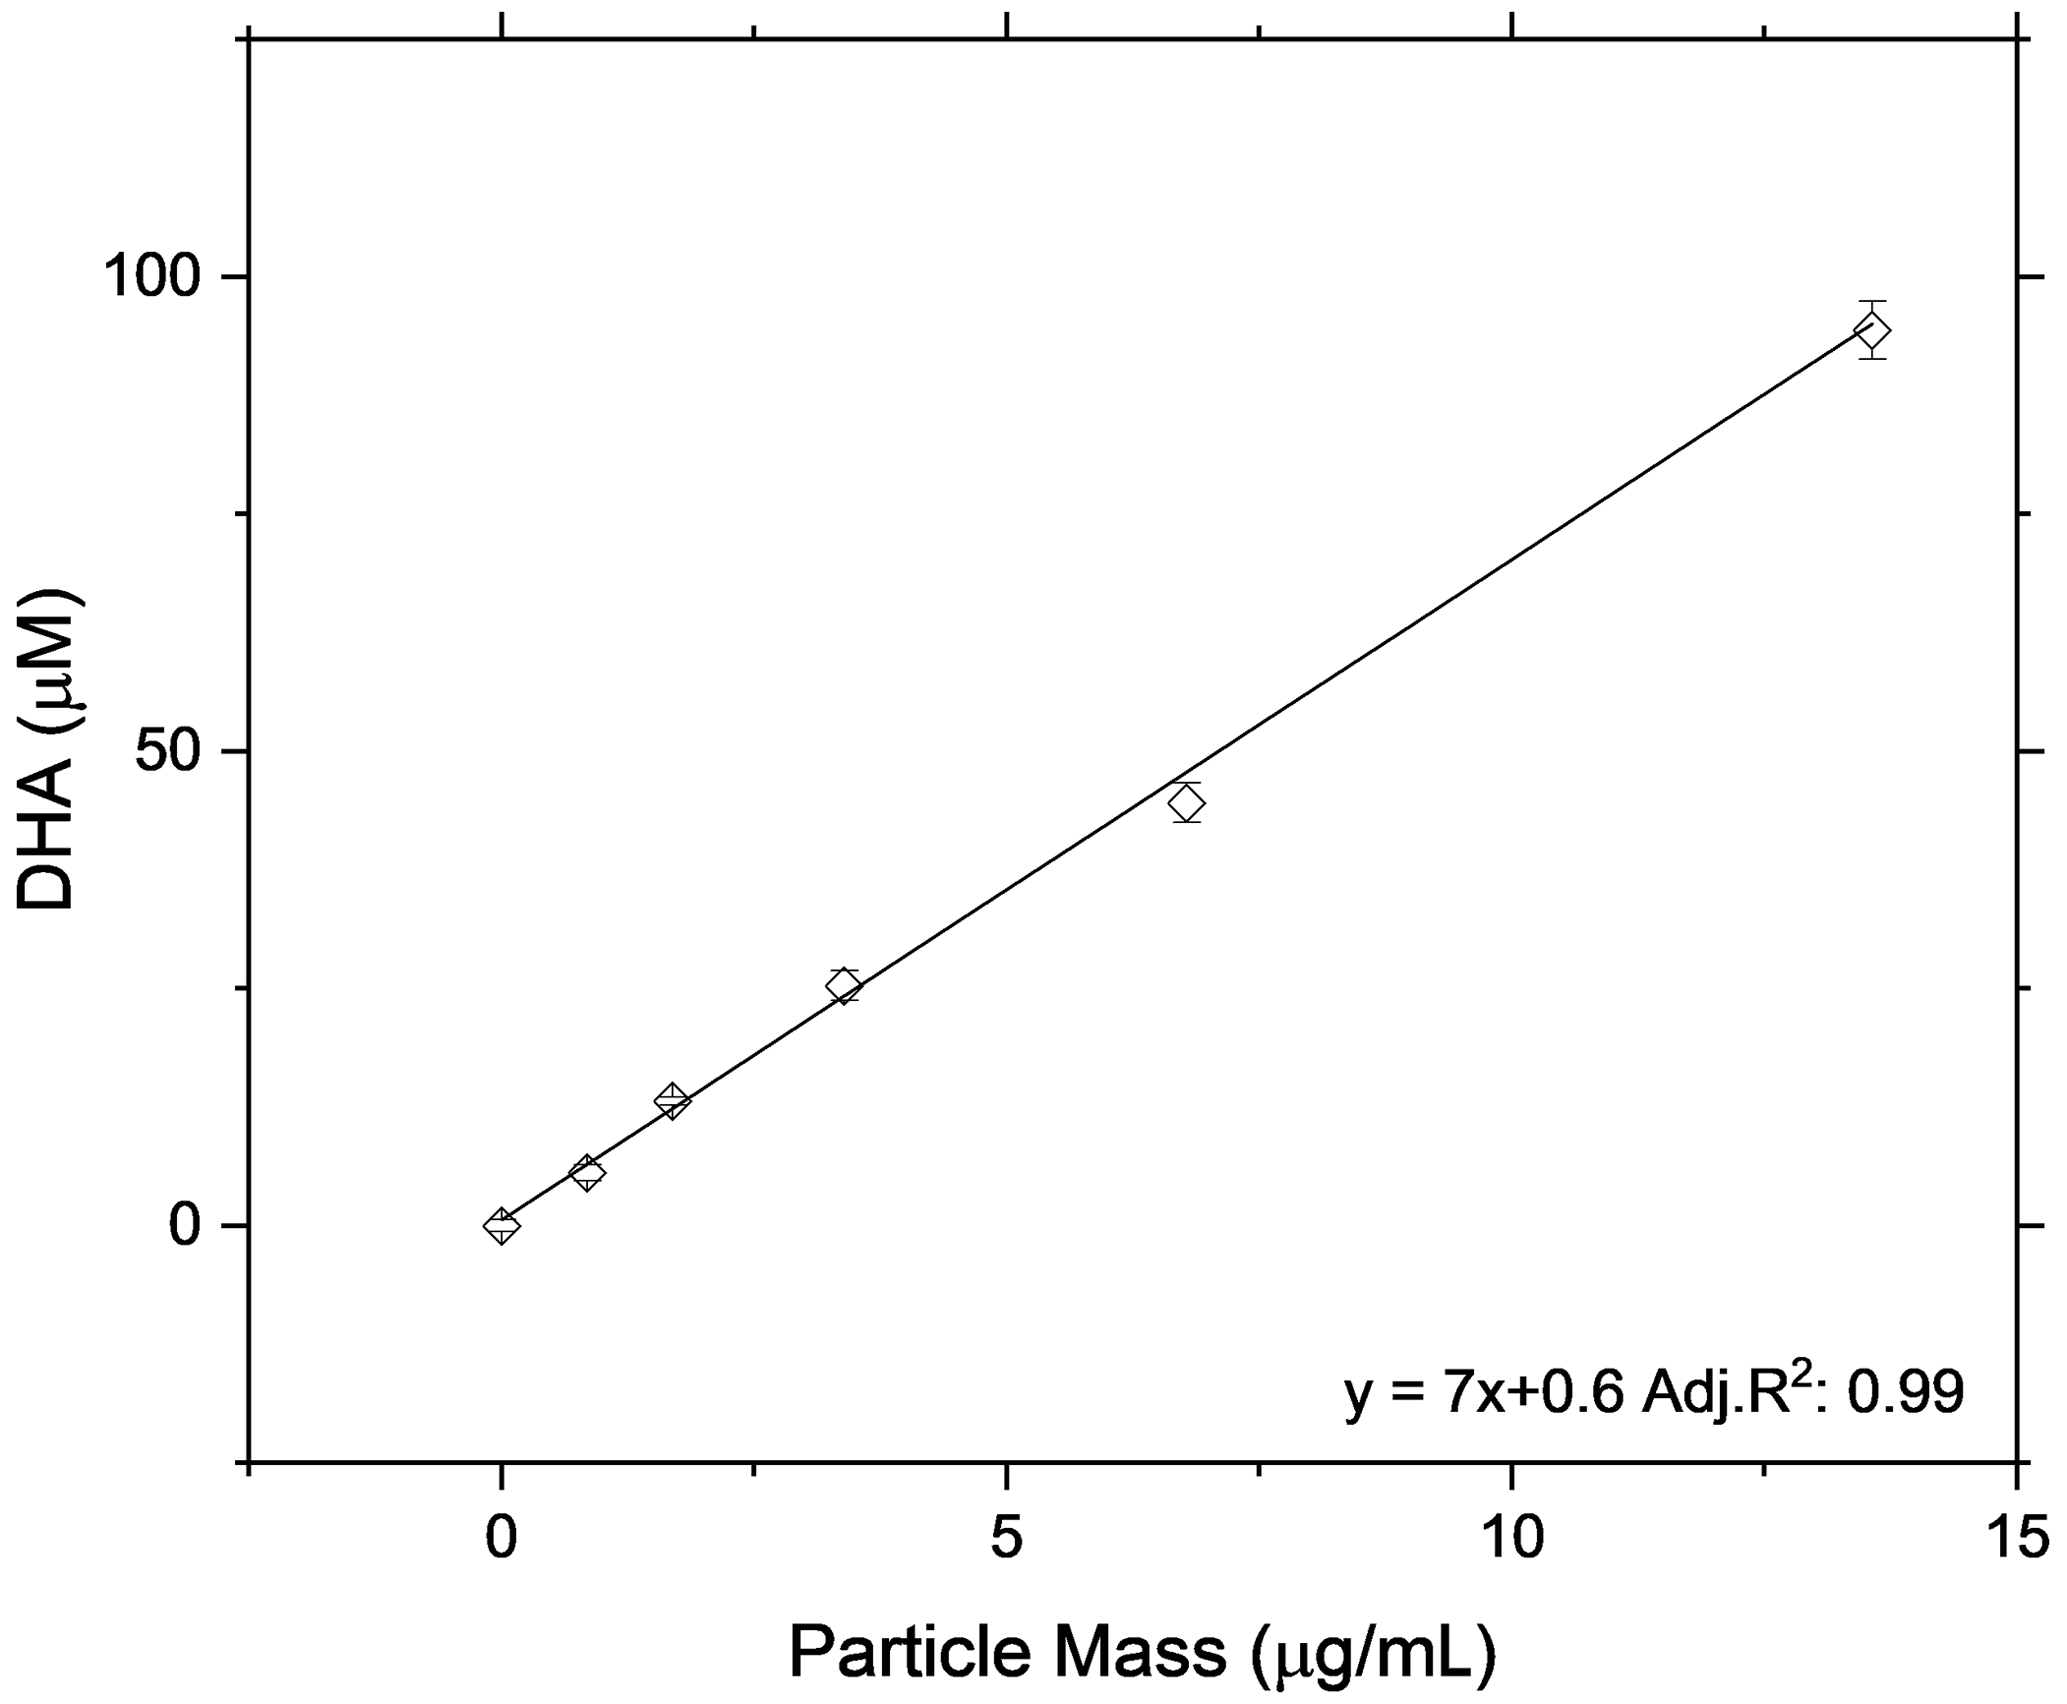
Figure 6Response of the OOPAAI using particle extracts from a filter collected at an urban location in Beijing, China. A clear linear relationship is obtained between the particle mass in the extracts and the instrument signal. Error bars represent the variability of the OOPAAI signal.
3.4 Calibration with biogenic and anthropogenic aerosol
As a further experiment to show the linearity of the OOPAAI response towards SOA aerosol particles in a wide mass range, the OOPAAI was run in full operational mode (i.e., including the PILS). The aerosol generated by the OCU was diluted to generate particle concentrations in the range of around 50 to 1000 µg m−3 and passed through a home-built charcoal denuder, removing ozone and gaseous VOC residues. In parallel, a scanning mobility particle sizer (SMPS (3080), DMA (3081), CPC (3776), TSI) was operated. The SMPS was set to a scan time of 105 s, and a SOA particle density of 1.4 g cm−3 was assumed (Kostenidou et al., 2007). SOA from two different precursors of VOC, an anthropogenic precursor (naphthalene) and a biogenic precursor (β-pinene), were generated and quantified with the OOPAAI. In Fig. 7, the OOPAAI response is shown as a function of SOA mass per cubic meter for the two SOA types. It illustrates the linear relationship over more than 1 order of magnitude of particle mass with synthesized, atmospherically relevant aerosol particles; this is in contrast to the filter extract, which was used for the measurements shown in Figs. 5 and 6. The abscissa error in Fig. 7 is the standard deviation of the variability in the production of particle mass. The ordinate error represents the standard deviation of the variability of the OOPAAI signal. Naphthalene SOA particles cause a significantly higher OOPAAI response (i.e., slope) than β-pinene SOA, which has also been seen by others (Tuet et al., 2017; Chowdhury et al., 2018; Zhang et al., 2021; Offer et al., 2022). This could be because AA reacts very efficiently and catalytically with quinones, which are known oxidation products in naphthalene SOA, in comparison to β-pinene SOA, where no quinones are present (Isaacs and Van Eldik, 1997; McWhinney et al., 2013; Roginsky et al., 1999).
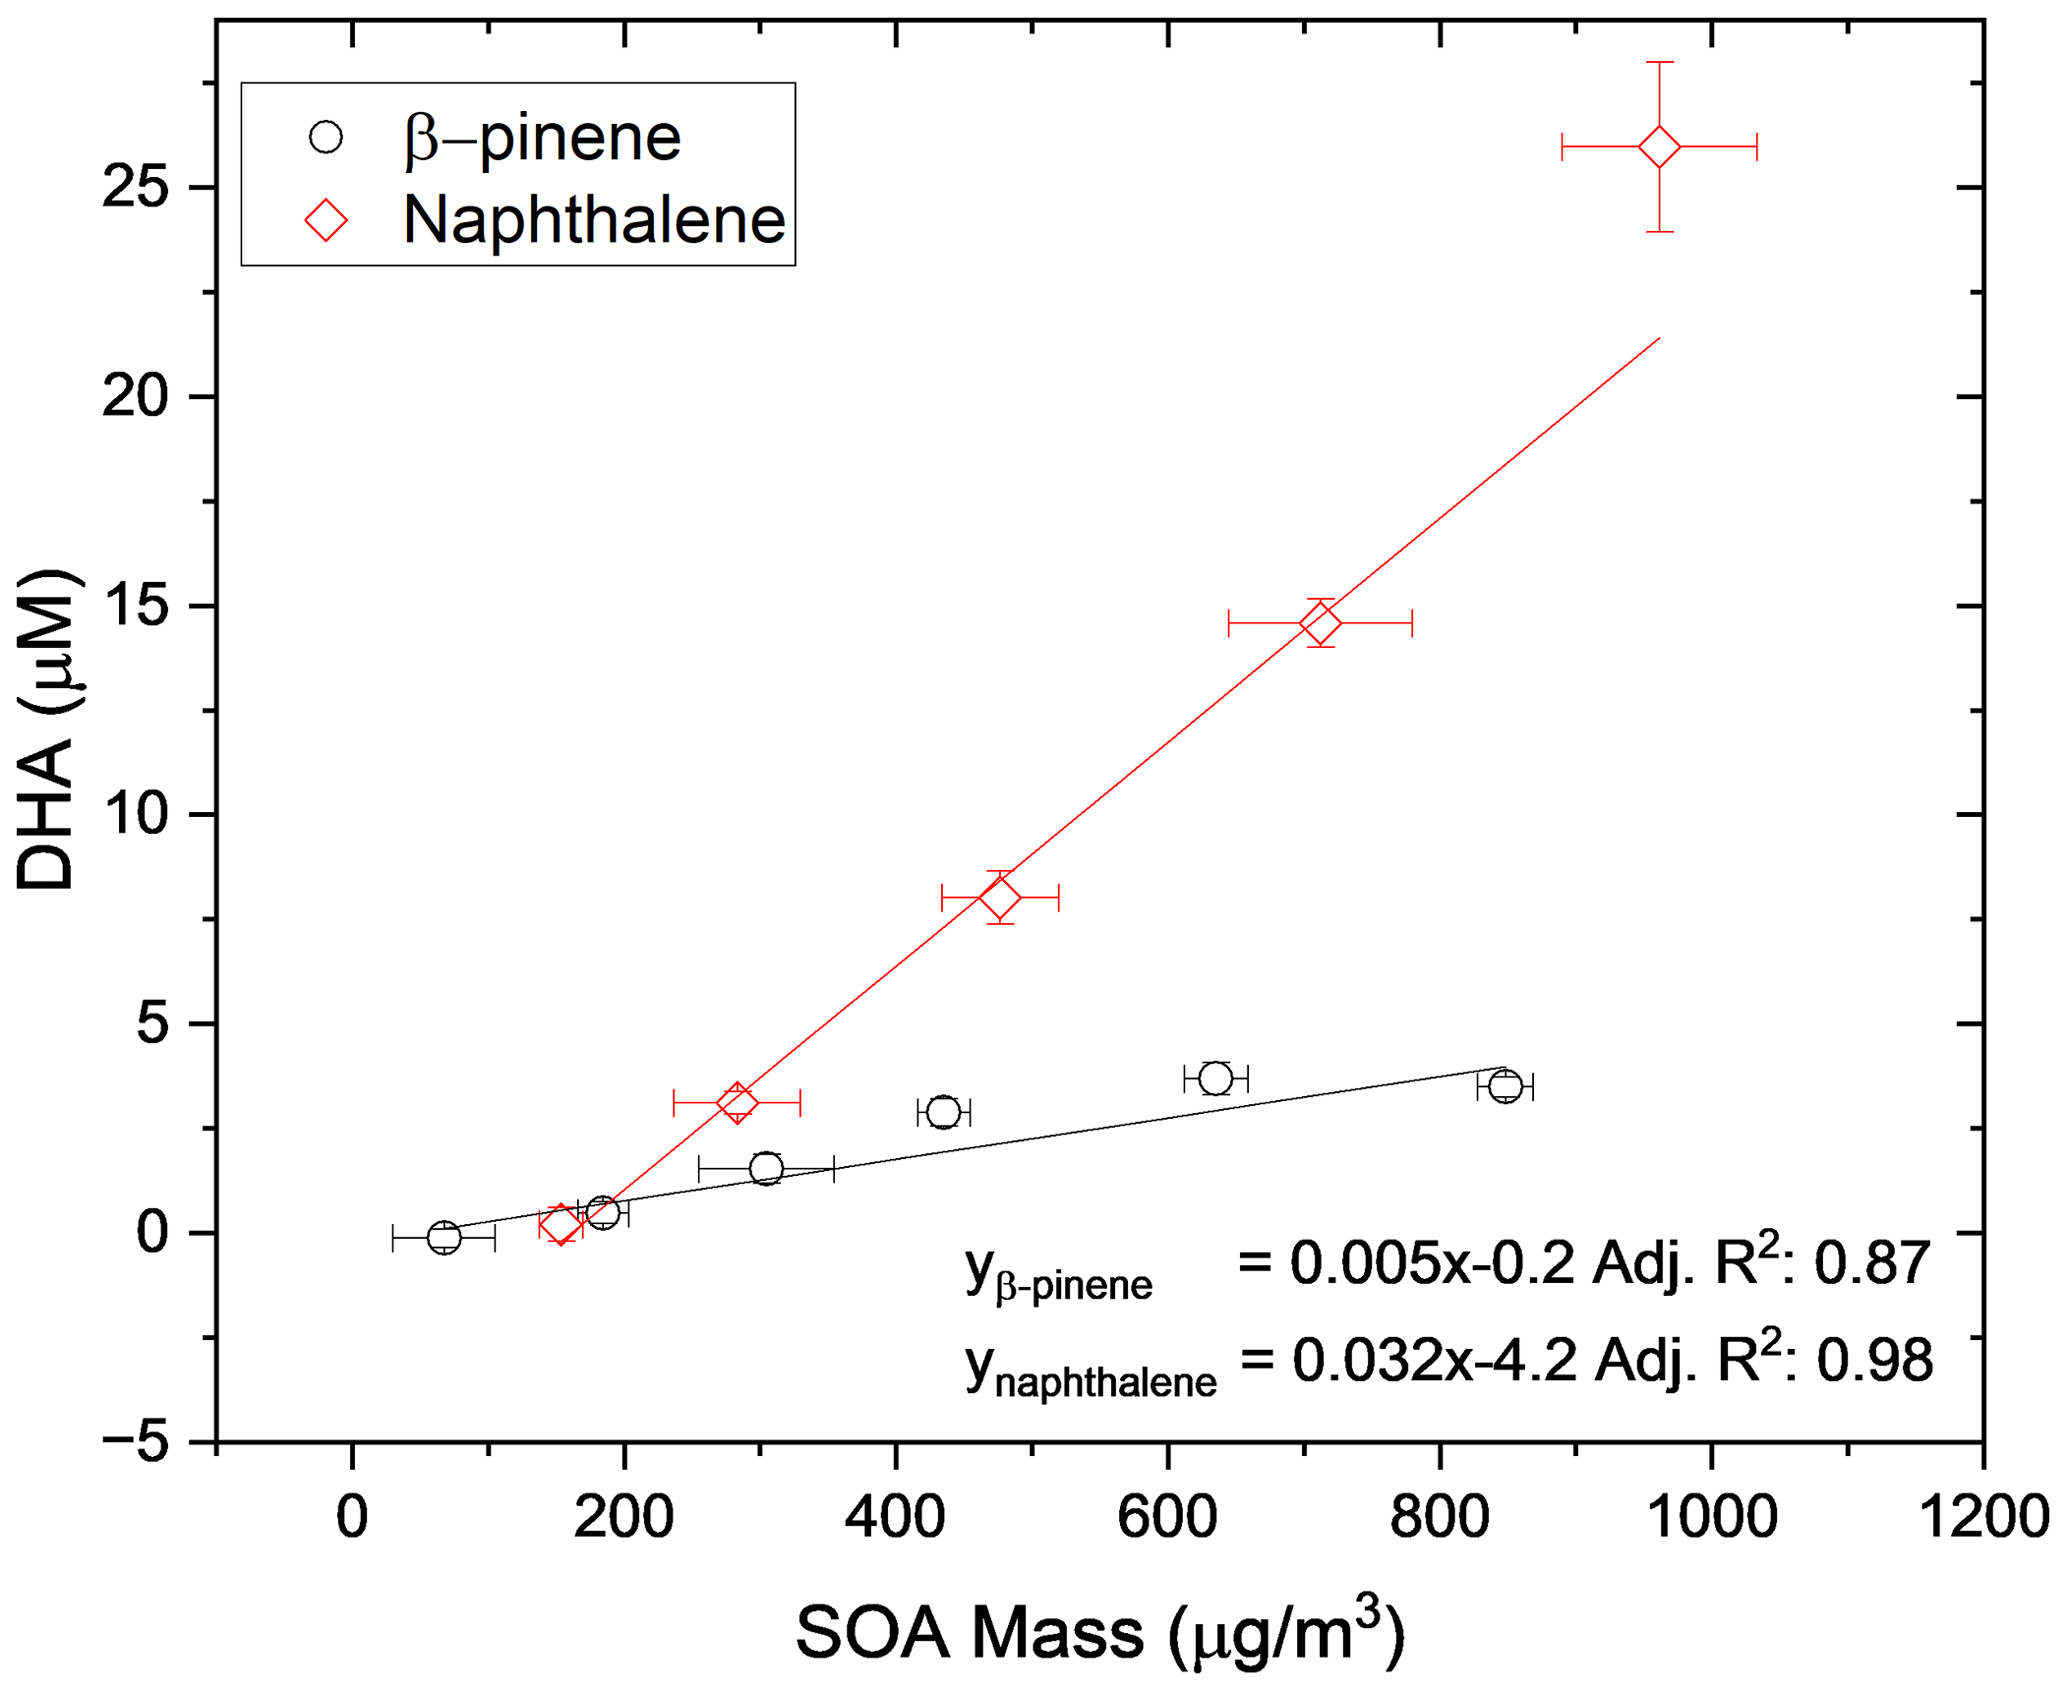
Figure 7SOA was produced from an anthropogenic and biogenic precursor at different mass concentrations using an Organic Coating Unit (OCU) (Keller et al., 2022). The OOPAAI signal shows a linear response for both SOA types as a function of particle mass, with the anthropogenic SOA being much more reactive towards the AA assay.
3.5 Ambient measurements
To determine the response of the OOPAAI for ambient aerosol, proof-of-concept measurements were performed at an urban background location in the city center of Basel, Switzerland. In Fig. 8a, the raw detector signal from an ambient measurement is shown where OP, in nanomole DHA per cubic meter of air, is plotted over a 4 d period together with PM2.5 data for the same time. OP and PM2.5 show a clear diurnal cycle, with maxima of around 12 nmol DHA m−3 and 17 µg m−3, respectively, in the evening and during the night. PM2.5 concentrations were measured with a Fidas 200 (PALAS) at Basel St. Johanns-Platz by Luftqualität Nordwestschweiz with a time resolution of 1 min (Lufthygiene Amt beider Basel, 2023). This station is in close proximity (approximately 500 m) to the measurement location where the OOPAAI was operated. The air-volume-normalized signal of OOPAAI (Fig. 8a) has a very similar diurnal trend compared to the aerosol mass, demonstrating that OOPAAI is capable of quantifying OP in urban particles, even at low PM concentrations of only a few µg m−3, with a high time resolution of approximately 5 min.
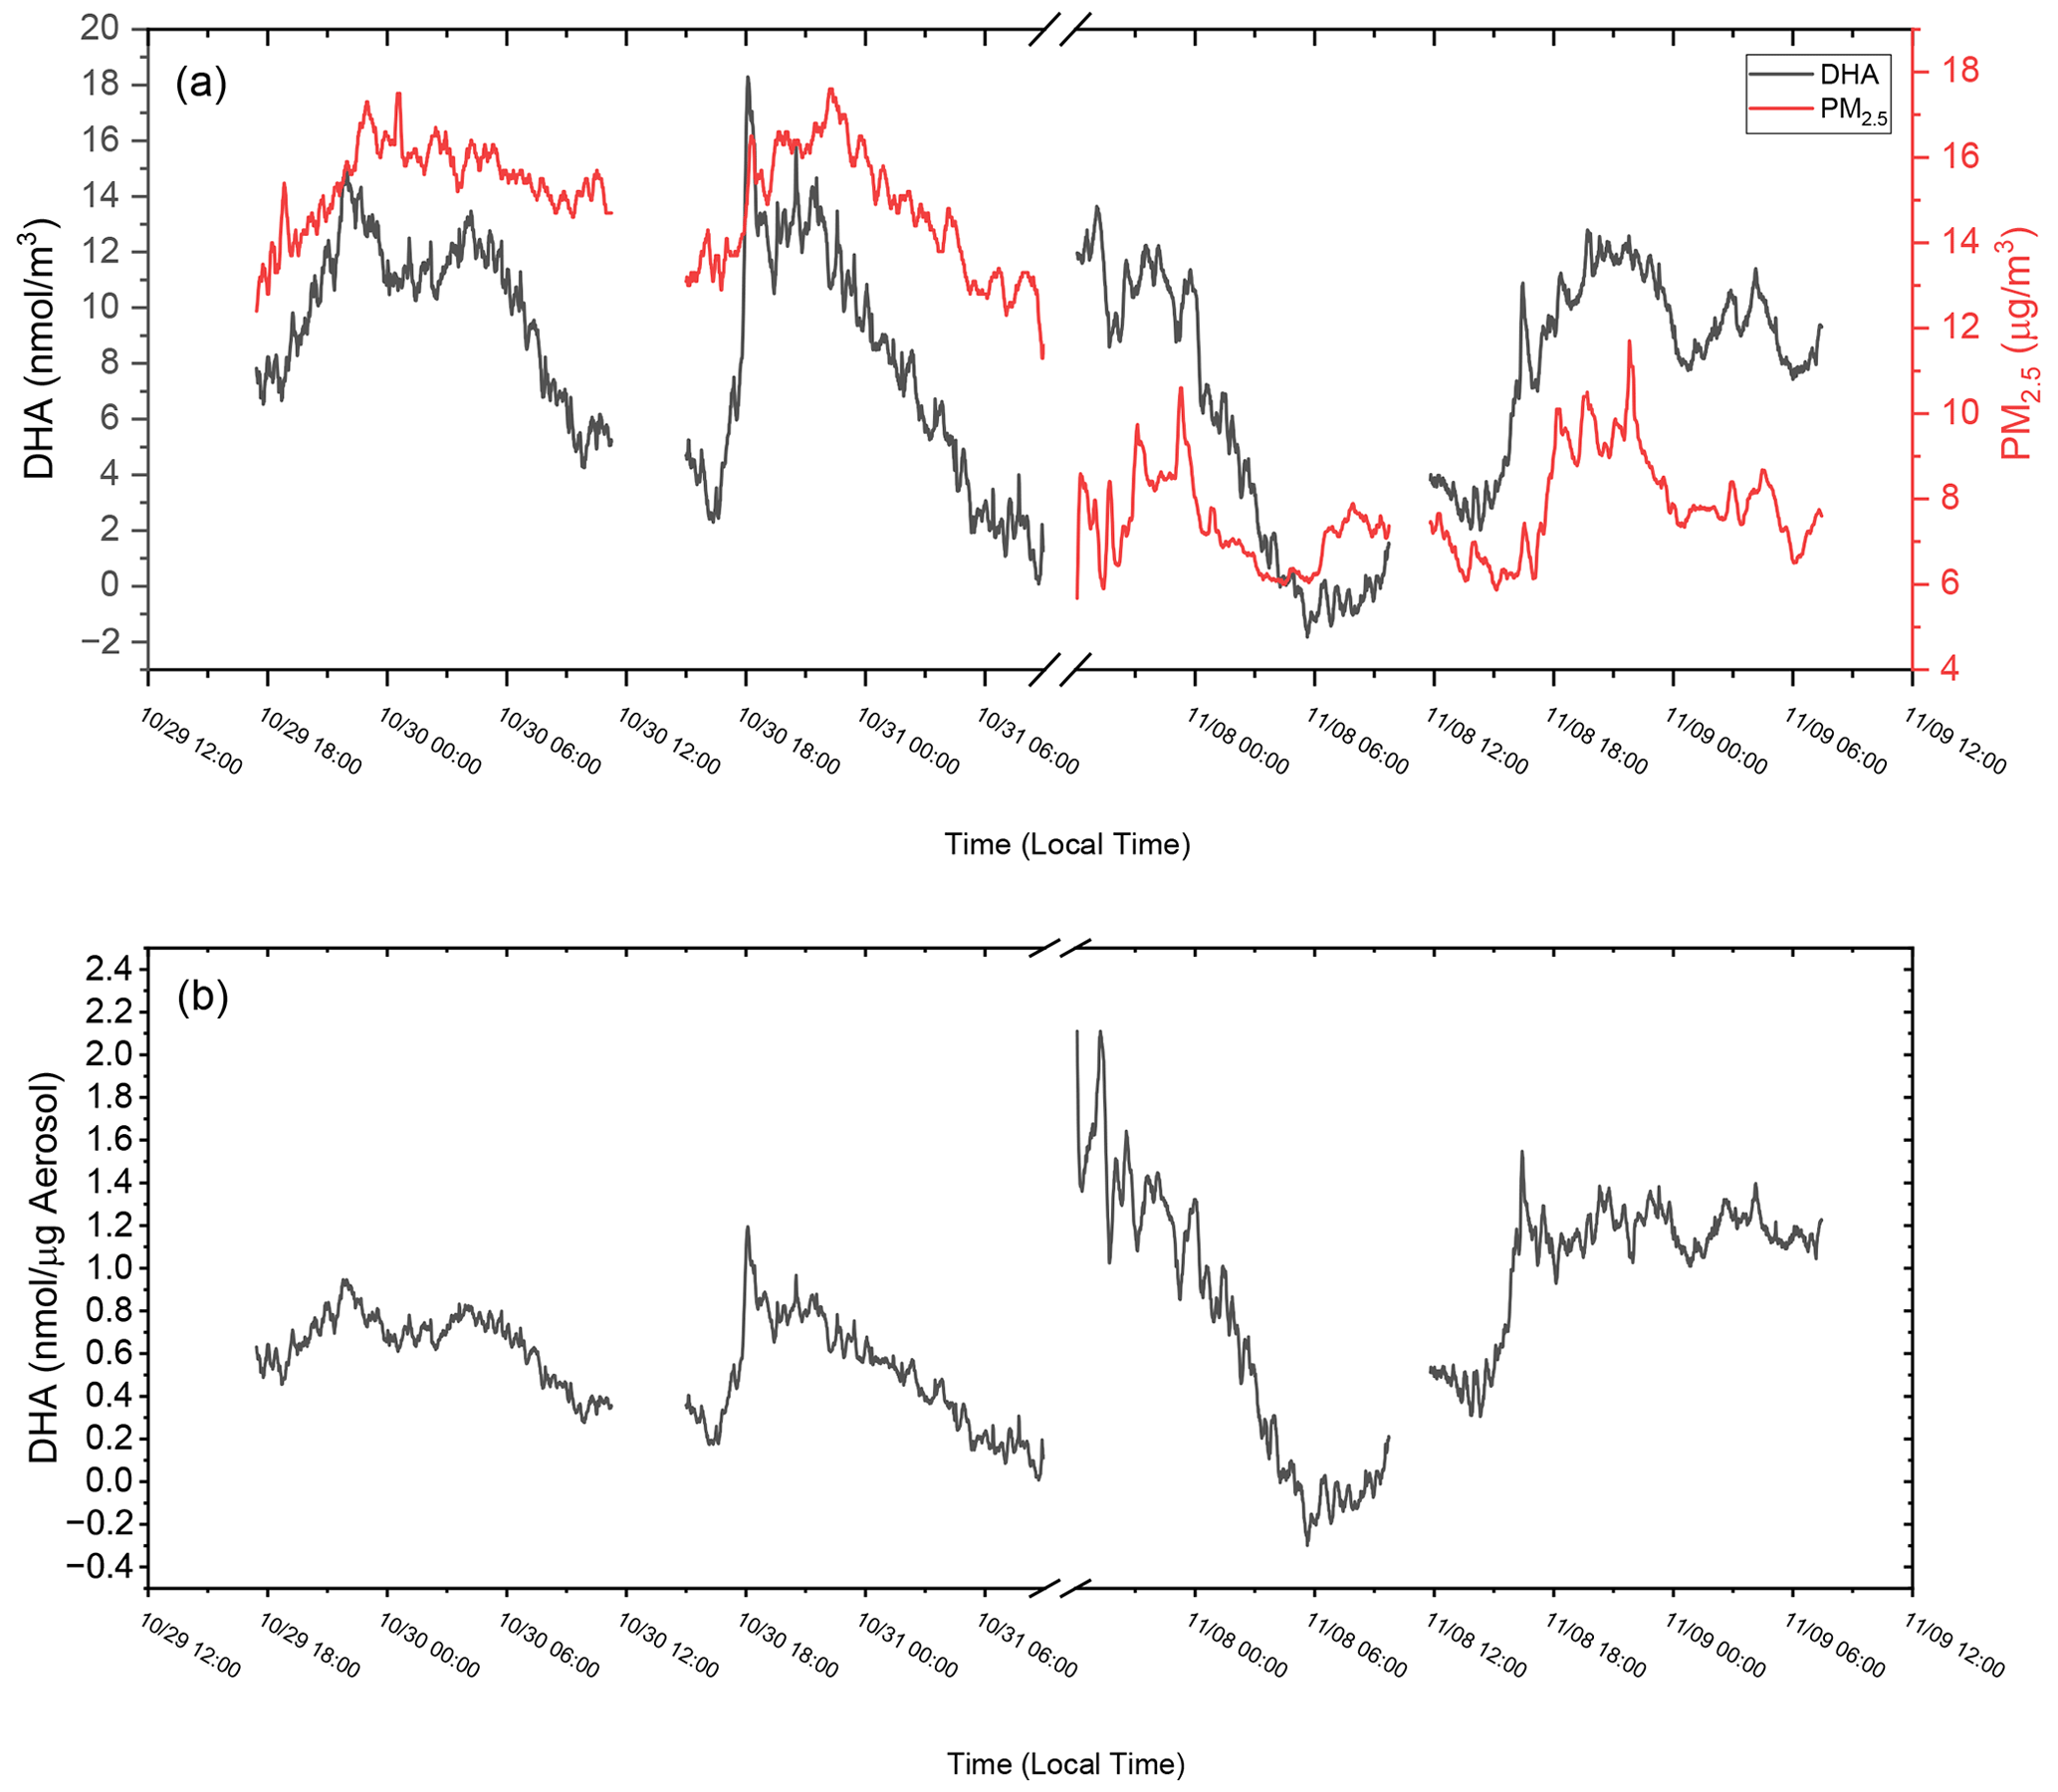
Figure 8Ambient OOPAAI measurements in Basel (Switzerland) at Klingelbergstrasse 27, an urban background location, in October and November 2022. (a) On the left x axis, DHA in nanomole normalized to air volume is plotted versus time; on the right x axis, PM2.5 mass over time is plotted versus time. (b) DHA concentrations normalized to the mass of PM2.5 at the same time. Gaps in the data are due to changing solutions in the OOPAAI or blank measurements. The LOD for ambient measurements is approximately 5 µg m−3.
Figure 8b shows the OP data mass normalized for PM2.5, with OP concentrations varying by more than 1 order of magnitude from about 0.1 to 2 nmol µg−1. The formula used to calculate mass-normalized OP is given in Eq. (1). The first term in Eq. (1) converts the counts of the spectrometer in the OOPAAI into DHA concentrations via the DHA calibration curve. The second term normalizes the OP signal for volume air through the liquid and air flow rates of the OOPAAI, and the third term normalizes for PM2.5 mass.
Figure 8b clearly indicates that the OP content in PM2.5 is not constant on a diurnal timescale and that, in some cases (e.g., 30 November, 18:00 UTC+1), OP concentrations change by more than a factor of 5 within about an hour. This demonstrates that the composition of PM2.5 and sources with very different OP content can vary quickly in an urban environment. Organics and metals, for example, have very different OPs, as illustrated in Fig. 5, and could contribute to the changes in the OP-active aerosol mass fraction. Alternatively, inorganic ions such as nitrate, sulfate and ammonium are OP inactive but may also exhibit a diurnal profile (Timonen et al., 2014) that would affect the total mass fraction of OP. To better understand how such compositional changes drive the OP particle mass fractions and potentially particle toxicity, more ambient measurements are required.
The limit of the detection of the OOPAAI characterized in this study was calculated using the 3σbl methods. The detection limit of the OOPAAI for DHA is 0.7±0.1 µM. For the urban ambient aerosol measured in this study, the OOPAAI is sensitive enough to show a significant response down to PM2.5 mass concentrations of around 5 µg m−3.
A novel automated, online OP instrument has been designed and thoroughly characterized. The OOPAAI can continuously quantify OP concentrations in different types of aerosols with a physiologically relevant AA assay (i.e., pH 6.8 and 37 ∘C) with an unparalleled time resolution of about 5 min. The OP-active components in the particles react within seconds after the particles enter the instrument, and thus very short-lived OP components (the majority of the total OP in SOA particles) are quantified, overcoming the limitations of current offline-based measurement methods. A comparison of the OOPAAI instrument with offline filter-based OP quantification shows that about 90 % of OPs in SOA particles have a lifetime of minutes to hours and that only about 10 % of OP can be detected after a couple of days. In particular, the OP components which have the shortest lifetime of less than a minute are likely formed in the particle via photochemical processes. These compounds may be continuously formed while particles are exposed to sunlight or oxidants in the atmosphere (Alpert et al., 2021); thus, this short-lived OP fraction might also be relevant for health aspects. Therefore, to capture the entire OP concentration, an online instrument such as the one presented here, with fast collection and analysis time, is essential for an accurate quantification of aerosol OP, and any offline method is likely to severely underestimate health-relevant OP.
The instrument is portable and capable of running autonomously for about 3 d; thus, it is well suited to field campaigns and laboratory experiments. The OOPAAI is sensitive to a wide range of different compounds and aerosol types and can measure their OP over a wide range of environments, from ambient to laboratory-generated particles. Its detection limit for urban aerosol is around 5 µg m−3, and a proof-of-principle deployment at an urban background site in Basel, Switzerland, demonstrated the highly dynamic nature of OP-active components in PM2.5, which can only be captured with the fast-response, high-time-resolution and robust OP measurement facilitated by the OOPAAI.
This novel online instrument characterizes and accurately quantifies OP for the first time in extended field studies at a high time resolution, which will be essential for an improved understanding of the sources and formation processes of particle OP and to identify the link between particle OP and particle health effects.
All LabVIEW VIs can be accessed from the corresponding author upon request.
All data can be accessed from the corresponding author upon request.
The supplement related to this article is available online at: https://doi.org/10.5194/amt-16-2641-2023-supplement.
BU developed the instrument, conducted all the experiments, analyzed the data and wrote the paper. SJC, AB and BG helped with the various experiments. NB wrote the software, RF designed and built many of the electronic components, and HRR assisted with the hardware. MK conceived the study and oversaw the research.
The contact author has declared that none of the authors has any competing interests.
Publisher’s note: Copernicus Publications remains neutral with regard to jurisdictional claims in published maps and institutional affiliations.
The authors gratefully acknowledge Sandra Andris-Ogorka and René Glanzmann from the Lufthygieneamt beider Basel for the FIDAS data and the mechanical workshop of the University of Cambridge and Basel for the construction of the hardware parts.
This research has been supported by the Schweizerischer Nationalfonds zur Förderung der Wissenschaftlichen Forschung (grant no. 200021_192192/1).
This paper was edited by Pierre Herckes and reviewed by Rodney Weber and two anonymous referees.
Alpert, P. A., Dou, J., Corral Arroyo, P., Schneider, F., Xto, J., Luo, B., Peter, T., Huthwelker, T., Borca, C. N., Henzler, K. D., Schaefer, T., Herrmann, H., Raabe, J., Watts, B., Krieger, U. K., and Ammann, M.: Photolytic radical persistence due to anoxia in viscous aerosol particles, Nat. Commun., 12, 1–8, https://doi.org/10.1038/s41467-021-21913-x, 2021.
Bates, J. T., Fang, T., Verma, V., Zeng, L., Weber, R. J., Tolbert, P. E., Abrams, J. Y., Sarnat, S. E., Klein, M., Mulholland, J. A., and Russell, A. G.: Review of Acellular Assays of Ambient Particulate Matter Oxidative Potential: Methods and Relationships with Composition, Sources, and Health Effects, Environ. Sci. Technol., 53, 4003–4019, https://doi.org/10.1021/acs.est.8b03430, 2019.
Baulig, A., Garlatti, M., Bonvallot, V., Marchand, A., Barouki, R., Marano, F., and Baeza-Squiban, A.: Involvement of reactive oxygen species in the metabolic pathways triggered by diesel exhaust particles in human airway epithelial cells, Am. J. Physiol.-Lung C., 285, L671–L679, https://doi.org/10.1152/ajplung.00419.2002, 2003.
Birdwell, J. E. and Engel, A. S.: Characterization of dissolved organic matter in cave and spring waters using UV-Vis absorbance and fluorescence spectroscopy, Org. Geochem., 41, 270–280, https://doi.org/10.1016/J.ORGGEOCHEM.2009.11.002, 2010.
Brunekreef, B. and Holgate, S. T.: Air pollution and health, Lancet (London, England), 360, 1233–1242, https://doi.org/10.1016/S0140-6736(02)11274-8, 2002.
Calas, A., Uzu, G., Martins, J. M. F., Voisin, D., Spadini, L., Lacroix, T., and Jaffrezo, J. L.: The importance of simulated lung fluid (SLF) extractions for a more relevant evaluation of the oxidative potential of particulate matter, Scientific Reports, 7, 1–12, https://doi.org/10.1038/s41598-017-11979-3, 2017.
Calvo, A. I., Alves, C., Castro, A., Pont, V., Vicente, A. M., and Fraile, R.: Research on aerosol sources and chemical composition: Past, current and emerging issues, Atmos. Res., 120–121, 1–28, https://doi.org/10.1016/J.ATMOSRES.2012.09.021, 2013.
Campbell, S. J., Utinger, B., Lienhard, D. M., Paulson, S. E., Shen, J., Griffiths, P. T., Stell, A. C., and Kalberer, M.: Development of a physiologically relevant online chemical assay to quantify aerosol oxidative potential, Anal. Chem., 91, 13088–13095, https://doi.org/10.1021/acs.analchem.9b03282, 2019a.
Campbell, S. J., Stevanovic, S., Miljevic, B., Bottle, S. E., Ristovski, Z., and Kalberer, M.: Quantification of Particle-Bound Organic Radicals in Secondary Organic Aerosol, Environ. Sci. Technol., 53, 6729–6737, https://doi.org/10.1021/acs.est.9b00825, 2019b.
Campbell, S. J., Wolfer, K., Utinger, B., Westwood, J., Zhang, Z.-H., Bukowiecki, N., Steimer, S. S., Vu, T. V., Xu, J., Straw, N., Thomson, S., Elzein, A., Sun, Y., Liu, D., Li, L., Fu, P., Lewis, A. C., Harrison, R. M., Bloss, W. J., Loh, M., Miller, M. R., Shi, Z., and Kalberer, M.: Atmospheric conditions and composition that influence PM2.5 oxidative potential in Beijing, China, Atmos. Chem. Phys., 21, 5549–5573, https://doi.org/10.5194/acp-21-5549-2021, 2021.
Chen, G., Canonaco, F., Tobler, A., Aas, W., Alastuey, A., Allan, J., Atabakhsh, S., Aurela, M., Baltensperger, U., Bougiatioti, A., De Brito, J. F., Ceburnis, D., Chazeau, B., Chebaicheb, H., Daellenbach, K. R., Ehn, M., El Haddad, I., Eleftheriadis, K., Favez, O., Flentje, H., Font, A., Fossum, K., Freney, E., Gini, M., Green, D. C., Heikkinen, L., Herrmann, H., Kalogridis, A.-C., Keernik, H., Lhotka, R., Lin, C., Lunder, C., Maasikmets, M., Manousakas, M. I., Marchand, N., Marin, C., Marmureanu, L., Mihalopoulos, N., Močnik, G., Nęcki, J., O'Dowd, C., Ovadnevaite, J., Peter, T., Petit, J.-E., Pikridas, M., Matthew Platt, S., Pokorná, P., Poulain, L., Priestman, M., Riffault, V., Rinaldi, M., Różański, K., Schwarz, J., Sciare, J., Simon, L., Skiba, A., Slowik, J. G., Sosedova, Y., Stavroulas, I., Styszko, K., Teinemaa, E., Timonen, H., Tremper, A., Vasilescu, J., Via, M., Vodička, P., Wiedensohler, A., Zografou, O., Cruz Minguillón, M., and Prévôt, A. S. H.: European aerosol phenomenology – 8: Harmonised source apportionment of organic aerosol using 22 Year-long ACSM/AMS datasets, Environ. Int., 166, 107325, https://doi.org/10.1016/j.envint.2022.107325, 2022.
Chowdhury, P. H., He, Q., Lasitza Male, T., Brune, W. H., Rudich, Y., and Pardo, M.: Exposure of Lung Epithelial Cells to Photochemically Aged Secondary Organic Aerosol Shows Increased Toxic Effects, Environ. Sci. Tech. Let., 5, 424–430, https://doi.org/10.1021/acs.estlett.8b00256, 2018.
Donaldson, K., Stone, V., Seaton, A., and MacNee, W.: Ambient particle inhalation and the cardiovascular system: Potential mechanisms, Environ. Health Persp., 109, 523–527, https://doi.org/10.1289/ehp.01109s4523, 2001.
Fang, T., Verma, V., Guo, H., King, L. E., Edgerton, E. S., and Weber, R. J.: A semi-automated system for quantifying the oxidative potential of ambient particles in aqueous extracts using the dithiothreitol (DTT) assay: results from the Southeastern Center for Air Pollution and Epidemiology (SCAPE), Atmos. Meas. Tech., 8, 471–482, https://doi.org/10.5194/amt-8-471-2015, 2015.
Ferreira, C. M. H., Pinto, I. S. S., Soares, E. V., and Soares, H. M. V. M.: (Un)suitability of the use of pH buffers in biological, biochemical and environmental studies and their interaction with metal ions – a review, RSC Adv., 5, 30989–31003, https://doi.org/10.1039/c4ra15453c, 2015.
Fuller, S. J., Wragg, F. P. H., Nutter, J., and Kalberer, M.: Comparison of on-line and off-line methods to quantify reactive oxygen species (ROS) in atmospheric aerosols, Atmos. Environ., 92, 97–103, https://doi.org/10.1016/j.atmosenv.2014.04.006, 2014.
Gao, D., Fang, T., Verma, V., Zeng, L., and Weber, R. J.: A method for measuring total aerosol oxidative potential (OP) with the dithiothreitol (DTT) assay and comparisons between an urban and roadside site of water-soluble and total OP, Atmos. Meas. Tech., 10, 2821–2835, https://doi.org/10.5194/amt-10-2821-2017, 2017.
GBD 2013 Risk Factors Collaborators: Global, regional, and national comparative risk assessment of 79 behavioural, environmental and occupational, and metabolic risks or clusters of risks in 188 countries, 1990–2013: A systematic analysis for the Global Burden of Disease Study 2013, Lancet, 386, 2287–2323, https://doi.org/10.1016/S0140-6736(15)00128-2, 2015.
Godri, K. J., Duggan, S. T., Fuller, G. W., Baker, T., Green, D., Kelly, F. J., and Mudway, I. S.: Particulate matter oxidative potential from waste transfer station activity, Environ. Health Persp., 118, 493–498, https://doi.org/10.1289/ehp.0901303, 2010.
Godri, K. J., Harrison, R. M., Evans, T., Baker, T., Dunster, C., Mudway, I. S., and Kelly, F. J.: Increased oxidative burden associated with traffic component of ambient particulate matter at roadside and Urban background schools sites in London, PLoS One, 6, e21961, https://doi.org/10.1371/journal.pone.0021961, 2011.
Hama, S. M. L., Cordell, R. L., Staelens, J., Mooibroek, D., and Monks, P. S.: Chemical composition and source identification of PM10 in five North Western European cities, Atmos. Res., 214, 135–149, https://doi.org/10.1016/J.ATMOSRES.2018.07.014, 2018.
Hart, J. E., Liao, X., Hong, B., Puett, R. C., Yanosky, J. D., Suh, H., Kioumourtzoglou, M. A., Spiegelman, D., and Laden, F.: The association of long-term exposure to PM2.5 on all-cause mortality in the Nurses' Health Study and the impact of measurement-error correction, Environmental Health, 14, 38, https://doi.org/10.1186/s12940-015-0027-6, 2015.
Huang, S., Gan, W., Yan, M., Zhang, X., Zhong, Y., and Yang, X.: Differential UV–vis absorbance can characterize the reaction of organic matter with ClO2, Water Res., 139, 442–449, https://doi.org/10.1016/J.WATRES.2018.04.006, 2018.
Huelin, F. E.: Investigations on the stability and determination of dehydroascorbic acid, Aust. J. Biol. Sci., 2, 346–354, https://doi.org/10.1071/BI9490346, 1949.
Isaacs, N. S. and Van Eldik, R.: A mechanistic study of the reduction of quinones by ascorbic acid, J. Chem. Soc. Perk. T. 2, 8, 1465–1467, https://doi.org/10.1039/a701072i, 1997.
Kamphus, M., Ettner-Mahl, M., Klimach, T., Drewnick, F., Keller, L., Cziczo, D. J., Mertes, S., Borrmann, S., and Curtius, J.: Chemical composition of ambient aerosol, ice residues and cloud droplet residues in mixed-phase clouds: single particle analysis during the Cloud and Aerosol Characterization Experiment (CLACE 6), Atmos. Chem. Phys., 10, 8077–8095, https://doi.org/10.5194/acp-10-8077-2010, 2010.
Keller, A., Kalbermatter, D. M., Wolfer, K., Specht, P., Steigmeier, P., Resch, J., Kalberer, M., Hammer, T., and Vasilatou, K.: The organic coating unit, an all-in-one system for reproducible generation of secondary organic matter aerosol, Aerosol Sci. Technol., 56, 947–958, https://doi.org/10.1080/02786826.2022.2110448, 2022.
Koike, E. and Kobayashi, T.: Chemical and biological oxidative effects of carbon black nanoparticles, Chemosphere, 65, 946–951, https://doi.org/10.1016/j.chemosphere.2006.03.078, 2006.
Kostenidou, E., Pandis, S. N., Pathak, R. K., Pandis, S. N., Kostenidou, E., and Pandis, S. N.: An Algorithm for the Calculation of Secondary Organic Aerosol Density Combining AMS and SMPS Data, Aerosol Sci. Tech., 41, 1002–1010, https://doi.org/10.1080/02786820701666270, 2007.
Künzi, L., Mertes, P., Schneider, S., Jeannet, N., Menzi, C., Dommen, J., Baltensperger, U., Prévôt, A. S. H., Salathe, M., Kalberer, M., and Geiser, M.: Responses of lung cells to realistic exposure of primary and aged carbonaceous aerosols, Atmos. Environ., 68, 143–150, https://doi.org/10.1016/j.atmosenv.2012.11.055, 2013.
Laden, F., Schwartz, J., Speizer, F. E., and Dockery, D. W.: Reduction in fine particulate air pollution and mortality: Extended follow-up of the Harvard Six Cities Study, Am. J. Resp. Crit. Care, 173, 667–672, https://doi.org/10.1164/rccm.200503-443OC, 2006.
Lehman, S. E., Morris, A. S., Mueller, P. S., Salem, A. K., Grassian, V. H., and Larsen, S. C.: Silica nanoparticle-generated ROS as a predictor of cellular toxicity: Mechanistic insights and safety by design, Environ. Sci.-Nano, 3, 56–66, https://doi.org/10.1039/c5en00179j, 2016.
Lepeule, J., Laden, F., Dockery, D., and Schwartz, J.: Chronic exposure to fine particles and mortality: An extended follow-up of the Harvard six cities study from 1974 to 2009, Environ. Health Persp., 120, 965–970, https://doi.org/10.1289/ehp.1104660, 2012.
Li, N., Hao, M., Phalen, R. F., Hinds, W. C., and Nel, A. E.: Particulate air pollutants and asthma: A paradigm for the role of oxidative stress in PM-induced adverse health effects, Clin. Immunol., 109, 250–265, https://doi.org/10.1016/j.clim.2003.08.006, 2003.
Lufthygiene Amt beider Basel: Luftqualität Nordwestschweiz, https://luftqualitaet.ch/messdaten/datenarchiv/abfrage, last access: 7 January 2023.
McWhinney, R. D., Zhou, S., and Abbatt, J. P. D.: Naphthalene SOA: redox activity and naphthoquinone gas–particle partitioning, Atmos. Chem. Phys., 13, 9731–9744, https://doi.org/10.5194/acp-13-9731-2013, 2013.
Oberdörster, G., Oberdörster, E., and Oberdörster, J.: Nanotoxicology: An emerging discipline evolving from studies of ultrafine particles, Environ. Health Persp., 113, 823–839, https://doi.org/10.1289/ehp.7339, 2005.
Offer, S., Hartner, E., Di Bucchianico, S., Bisig, C., Bauer, S., Pantzke, J., Zimmermann, E. J., Cao, X., Binder, S., Kuhn, E., Huber, A., Jeong, S., Käfer, U., Martens, P., Mesceriakovas, A., Bendl, J., Brejcha, R., Buchholz, A., Gat, D., Hohaus, T., Rastak, N., Jakobi, G., Kalberer, M., Kanashova, T., Hu, Y., Ogris, C., Marsico, A., Theis, F., Pardo, M., Gröger, T., Oeder, S., Orasche, J., Paul, A., Ziehm, T., Zhang, Z.-H. H., Adam, T., Sippula, O., Sklorz, M., Schnelle-Kreis, J., Czech, H., Kiendler-Scharr, A., Rudich, Y., and Zimmermann, R.: Effect of Atmospheric Aging on Soot Particle Toxicity in Lung Cell Models at the Air-Liquid Interface: Differential Toxicological Impacts of Biogenic and Anthropogenic Secondary Organic Aerosols (SOAs), Environ. Health Persp., 130, 1–19, https://doi.org/10.1289/EHP9413, 2022.
Pietrogrande, M. C., Bertoli, I., Manarini, F., and Russo, M.: Ascorbate assay as a measure of oxidative potential for ambient particles: Evidence for the importance of cell-free surrogate lung fluid composition, Atmos. Environ., 211, 103–112, https://doi.org/10.1016/j.atmosenv.2019.05.012, 2019.
Pietrogrande, M. C., Romanato, L., and Russo, M.: Synergistic and Antagonistic Effects of Aerosol Components on Its Oxidative Potential as Predictor of Particle Toxicity, Toxics, 10, 196, https://doi.org/10.3390/TOXICS10040196, 2022.
Prahalad, A. K., Inmon, J., Dailey, L. A., Madden, M. C., Ghio, A. J., and Gallagher, J. E.: Air pollution particles mediated oxidative DNA base damage in a cell free system and in human airway epithelial cells in relation to particulate metal content and bioreactivity, Chem. Res. Toxicol., 14, 879–887, https://doi.org/10.1021/tx010022e, 2001.
Roginsky, V. A., Barsukova, T. K., and Stegmann, H. B.: Kinetics of redox interaction between substituted quinones and ascorbate under aerobic conditions, Chem.-Biol. Interact., 121, 177–197, https://doi.org/10.1016/S0009-2797(99)00099-X, 1999.
Salana, S., Wang, Y., Puthussery, J. V., and Verma, V.: A semi-automated instrument for cellular oxidative potential evaluation (SCOPE) of water-soluble extracts of ambient particulate matter, Atmos. Meas. Tech., 14, 7579–7593, https://doi.org/10.5194/amt-14-7579-2021, 2021.
Shen, J., Griffiths, P. T., Campbell, S. J., Utinger, B., Kalberer, M., and Paulson, S. E.: Ascorbate oxidation by iron, copper and reactive oxygen species: review, model development, and derivation of key rate constants, Sci. Rep.-UK, 11, 1–14, https://doi.org/10.1038/s41598-021-86477-8, 2021.
Shi, Z., Vu, T., Kotthaus, S., Harrison, R. M., Grimmond, S., Yue, S., Zhu, T., Lee, J., Han, Y., Demuzere, M., Dunmore, R. E., Ren, L., Liu, D., Wang, Y., Wild, O., Allan, J., Acton, W. J., Barlow, J., Barratt, B., Beddows, D., Bloss, W. J., Calzolai, G., Carruthers, D., Carslaw, D. C., Chan, Q., Chatzidiakou, L., Chen, Y., Crilley, L., Coe, H., Dai, T., Doherty, R., Duan, F., Fu, P., Ge, B., Ge, M., Guan, D., Hamilton, J. F., He, K., Heal, M., Heard, D., Hewitt, C. N., Hollaway, M., Hu, M., Ji, D., Jiang, X., Jones, R., Kalberer, M., Kelly, F. J., Kramer, L., Langford, B., Lin, C., Lewis, A. C., Li, J., Li, W., Liu, H., Liu, J., Loh, M., Lu, K., Lucarelli, F., Mann, G., McFiggans, G., Miller, M. R., Mills, G., Monk, P., Nemitz, E., O'Connor, F., Ouyang, B., Palmer, P. I., Percival, C., Popoola, O., Reeves, C., Rickard, A. R., Shao, L., Shi, G., Spracklen, D., Stevenson, D., Sun, Y., Sun, Z., Tao, S., Tong, S., Wang, Q., Wang, W., Wang, X., Wang, X., Wang, Z., Wei, L., Whalley, L., Wu, X., Wu, Z., Xie, P., Yang, F., Zhang, Q., Zhang, Y., Zhang, Y., and Zheng, M.: Introduction to the special issue “In-depth study of air pollution sources and processes within Beijing and its surrounding region (APHH-Beijing)”, Atmos. Chem. Phys., 19, 7519–7546, https://doi.org/10.5194/acp-19-7519-2019, 2019.
Steenhof, M., Gosens, I., Strak, M., Godri, K. J., Hoek, G., Cassee, F. R., Mudway, I. S., Kelly, F. J., Harrison, R. M., Lebret, E., Brunekreef, B., Janssen, N. A. H., and Pieters, R. H. H.: In vitro toxicity of particulate matter (PM) collected at different sites in the Netherlands is associated with PM composition, size fraction and oxidative potential - the RAPTES project, Part. Fibre Toxicol., 8, 26, https://doi.org/10.1186/1743-8977-8-26, 2011.
Steimer, S. S., Delvaux, A., Campbell, S. J., Gallimore, P. J., Grice, P., Howe, D. J., Pitton, D., Claeys, M., Hoffmann, T., and Kalberer, M.: Synthesis and characterisation of peroxypinic acids as proxies for highly oxygenated molecules (HOMs) in secondary organic aerosol, Atmos. Chem. Phys., 18, 10973–10983, https://doi.org/10.5194/acp-18-10973-2018, 2018.
Timonen, H., Aurela, M., Carbone, S., Saarnio, K., Frey, A., Saarikoski, S., Teinilä, K., Kulmala, M., and Hillamo, R.: Seasonal and diurnal changes in inorganic ions, carbonaceous matter and mass in ambient aerosol particles in an urban, background area, Boreal Environ. Res., 19, 71–86, https://helda.helsinki.fi/handle/10138/160095 (last access: 27 December 2022), 2014.
Tuet, W. Y., Chen, Y., Fok, S., Gao, D., Weber, R. J., Champion, J. A., and Ng, N. L.: Chemical and cellular oxidant production induced by naphthalene secondary organic aerosol (SOA): Effect of redox-active metals and photochemical aging, Sci. Rep.-UK, 7, 1–10, https://doi.org/10.1038/s41598-017-15071-8, 2017.
Venkatachari, P., Hopke, P. K., Grover, B. D., and Eatough, D. J.: Measurement of particle-bound reactive oxygen species in rubidoux aerosols, J. Atmos. Chem., 50, 49–58, https://doi.org/10.1007/s10874-005-1662-z, 2005.
Wang, S., Zhao, Y., Chan, A. W. H., Yao, M., Chen, Z., and Abbatt, J. P. D.: Organic Peroxides in Aerosol: Key Reactive Intermediates for Multiphase Processes in the Atmosphere, Chem. Rev., 123, 1635–1679, https://doi.org/10.1021/acs.chemrev.2c00430, 2023.
Wang, Y., Hopke, P. K., Sun, L., Chalupa, D. C., and Utell, M. J.: Laboratory and Field Testing of an Automated Atmospheric Particle-Bound Reactive Oxygen Species Sampling-Analysis System, Journal of Toxicology, 2011, 419476, https://doi.org/10.1155/2011/419476, 2011.
Weber, R. J., Orsini, D., Daun, Y., Lee, Y. N., Klotz, P. J., and Brechtel, F.: A Particle-into-Liquid Collector for Rapid Measurement of Aerosol Bulk Chemical Composition, Aerosol Sci. Tech., 35, 718–727, https://doi.org/10.1080/02786820152546761, 2010.
World Health Organisation: Ambient Air Pollution: A Global Assessment of Exposure and Burden of Disease, World Health Organization, https://www.who.int/publications/i/item/9789241511353 (last access: 8 February 2021), 2016.
Wragg, F. P. H., Fuller, S. J., Freshwater, R., Green, D. C., Kelly, F. J., and Kalberer, M.: An automated online instrument to quantify aerosol-bound reactive oxygen species (ROS) for ambient measurement and health-relevant aerosol studies, Atmos. Meas. Tech., 9, 4891–4900, https://doi.org/10.5194/amt-9-4891-2016, 2016.
Yang, A., Janssen, N. A. H., Brunekreef, B., Cassee, F. R., Hoek, G., and Gehring, U.: Children's respiratory health and oxidative potential of PM2.5: the PIAMA birth cohort study, Occup. Environ. Med., 73, 154–160, https://doi.org/10.1136/oemed-2015-103175, 2016.
Zhang, Z.-H., Hartner, E., Utinger, B., Gfeller, B., Paul, A., Sklorz, M., Czech, H., Yang, B. X., Su, X. Y., Jakobi, G., Orasche, J., Schnelle-Kreis, J., Jeong, S., Gröger, T., Pardo, M., Hohaus, T., Adam, T., Kiendler-Scharr, A., Rudich, Y., Zimmermann, R., and Kalberer, M.: Are reactive oxygen species (ROS) a suitable metric to predict toxicity of carbonaceous aerosol particles?, Atmos. Chem. Phys., 22, 1793–1809, https://doi.org/10.5194/acp-22-1793-2022, 2021.
Zhao, R., Kenseth, C. M., Huang, Y., Dalleska, N. F., Kuang, X. M., Chen, J., Paulson, S. E., and Seinfeld, J. H.: Rapid Aqueous-Phase Hydrolysis of Ester Hydroperoxides Arising from Criegee Intermediates and Organic Acids, J. Phys. Chem. A, 122, 5190–5201, https://doi.org/10.1021/acs.jpca.8b02195, 2018.