the Creative Commons Attribution 4.0 License.
the Creative Commons Attribution 4.0 License.
 | 31 May 2023
Characterizing the automatic radon flux transfer standard system Autoflux: laboratory calibration and field experiments
Daniel Rabago
Scott Chambers
Carlos Sáinz
Roger Curcoll
Peter P. S. Otáhal
Eliška Fialová
Luis Quindos
Arturo Vargas
High-quality, long-term measurements of terrestrial trace gas emissions are important for investigations of atmospheric, geophysical and biological processes to help mitigate climate change and protect the environment and the health of citizens. High-frequency terrestrial fluxes of the radioactive noble gas 222Rn, in particular, are useful for validating radon flux maps and used to evaluate the performance of regional atmospheric models, to improve greenhouse gas emission inventories (by the radon tracer method) and to determine radon priority areas for radiation protection goals.
A new automatic radon flux system (Autoflux) was developed as a transfer standard (TS) to assist with establishing a traceability chain for field-based radon flux measurements. The operational characteristics and features of the system were optimized based on a literature review of existing flux measurement systems. To characterize and calibrate Autoflux, a bespoke radon exhalation bed (EB) facility was also constructed with the intended purpose of providing a constant radon exhalation under a specific set of controlled laboratory conditions. The calibrated Autoflux was then used to transfer the derived calibration to a second continuous radon flux system under laboratory conditions; both instruments were then tested in the field and compared with modeled fluxes.
This paper presents (i) a literature review of state-of-the-art radon flux systems and EB facilities; (ii) the design, characterization and calibration of a reference radon EB facility; (iii) the design, characterization and calibration of the Autoflux system; (iv) the calibration of a second radon flux system (INTE_Flux) using the EB and Autoflux, with a total uncertainty of 9 % (k = 1) for an average radon flux of ∼ 1800 mBq m−2 s−1 under controlled laboratory conditions; and (v) an example application of the calibrated TS and INTE_Flux systems for in situ radon flux measurements, which are then compared with simulated radon fluxes. Calibration of the TS under different environmental conditions and at lower reference fluxes will be the subject of a separate future investigation.
- Article
(2593 KB) - Full-text XML
-
Supplement
(1364 KB) - BibTeX
- EndNote


The radioactive noble gas radon (222Rn) contributes over half of the total public radiation dose from natural sources (WHO, 2009). However, due to its short half-life (3.8 d) and chemical inertness, radon is also widely used as an environmental tracer for atmospheric and geophysical processes (Grossi et al., 2012; Vargas et al., 2015; Chambers et al., 2016, 2018; Zhang et al., 2021). In particular, climate scientists are using co-located measurements of atmospheric radon and greenhouse gas (GHG) concentrations to apply the so-called radon tracer method (RTM) for estimating local- to regional-scale GHG emissions (Grossi et al., 2018; Levin et al., 2021).
These applications require information, at high temporal resolution and low uncertainty, about (i) the quantity of radon emitted per unit area and time from a surface of interest (the radon flux F or exhalation rate; usually expressed in mBq m−2 s−1) and (ii) the atmospheric radon activity concentration (SI units Bq m−3).
Terrestrial radon exhalation is the result of 222Rn escape from soil pore spaces to the atmosphere after its formation by 226Ra decay (Nazaroff, 1992). 222Rn exhalation rates are primarily driven by diffusion processes and depend strongly on the soil 226Ra content and soil properties (porosity, tortuosity, soil humidity, etc.). Consequently, the 238U content and parameters influencing diffusive transport in the soil need to be known to properly estimate the spatial and temporal variability of 222Rn exhalation rates (Schüßler, 1996; Lopez-Coto et al., 2013; Karstens et al., 2015). Furthermore, the emanation factor of radon from the soil grains to the pore spaces is influenced by soil humidity (Nazaroff, 1992; Zhuo et al., 2006, 2008).
Although diffusion is the primary transport mechanism of radon in soils, driven by the strong vertical concentration gradient (Karstens et al., 2015), advective transport can also occur, but this has not been thoroughly investigated and is likely to be highly site specific. Advective transport typically results from local pressure gradients, changing wind speed and direction, etc. Consequently, advective processes could influence radon flux measurements (Gutiérrez-Álvarez et al., 2020a). Other factors including soil type, atmospheric pressure, rainfall (related to soil moisture) and soil temperature can affect the radon flux. However, complex dependencies between these factors makes it difficult to quantify changes in radon flux due to any one of these factors in isolation (e.g., a precipitation event is often also associated with a drop in pressure and temperature).
To date, most radon flux studies have been based on random sampling and short temporal measurement data due to the lack of robust continuous radon flux systems. Unfortunately, these kinds of datasets are not sufficient to clarify relationships between radon flux and environmental factors. This is also a contributing factor to why some studies reach contradictory conclusions about the influence of individual parameters on the radon flux.
Long-term, reliable radon flux measurements are needed in conjunction with corresponding environmental observations in the soil and lower atmosphere (McLaughlin, 2011; Yang et al., 2017). To ensure reliable measurements, it is important to characterize and calibrate the operational radon flux systems, which requires (i) a 222Rn exhalation bed (EB) facility, to provide reference radon fluxes under controlled laboratory conditions; (ii) a transfer standard (TS) instrument, to be calibrated using the EB and used as a reference monitor for calibrating other new or existing monitors or to be used directly for in situ measurement campaigns; and (iii) planned field-based intercomparison campaigns of different radon flux systems under in situ environmental conditions.
The need of an EB facility is justified because, despite the fact that the response of the radon monitors itself can be previously studied within a STAR (System for Test Atmospheres with Radon) in comparison with a known reference radon concentration and that geometries of external volumes making the radon flux systems could be measured separately with their own uncertainties, the total tubes and internal volume estimation could lead to high uncertainties. Thus, comparing the radon flux system response with the reference exhalation bed will allow us to characterize the effective height of the systems needed for the flux calculation with minimum uncertainty.
One of the main aims of the EMPIR 19ENV01 project (henceforth traceRadon), which started in June 2020, was to provide the necessary measurement infrastructure and transfer standards to enable traceable radon flux and atmospheric radon activity concentration measurements. These goals are being achieved in collaboration with, among other research groups, the Integrated Carbon Observation System (ICOS, http://www.icos-cp.eu, last access: 24 May 2023) network, whose researchers are interested in introducing traceable radon flux and atmospheric radon concentration measurements to sites within this network for RTM applications.
The specific contributions of this study to the overall traceRadon objectives are to offer a calibrated and characterized continuous TS system, equipped with soil and atmosphere sensors, that can be used to carry out radon flux campaigns at different sites to help improve and evaluate the performance of contemporary radon flux maps and models (Szegvary et al., 2009; Karstens et al., 2015), as well as be used to calibrate other radon flux systems under laboratory or field conditions.
The remainder of this paper is arranged in the following way: first, a review is made of the state-of-the-art EB facilities, including a description of the one newly designed, built and characterized by the University of Cantabria (UC) for the traceRadon project; next, a review is presented of contemporary, available state-of-the-art radon flux systems, including a description of the new automated system (Autoflux) designed, characterized and calibrated by the Australian Nuclear Science and Technology Organisation (ANSTO) and the Universitat Politècnica de Catalunya (UPC); next, the protocol applied to calibrate another automatic radon flux system (INTE_Flux), designed by the Institute of Energy Technologies of the UPC, using Autoflux and the UC EB facility is described. Finally, both radon flux systems are tested during a field-based intercomparison campaign and the results compared with previous tests of these systems and with radon flux model outputs available at the ICOS Carbon Portal (http://www.icos-cp.eu/).
2.1 Overview of theoretical radon flux estimation
A review of relevant literature found that radon flux studies have historically been carried out using a theoretical value as a reference. IAEA (1992) suggested that radon flux systems should be calibrated using a thin layer model, under the assumption of “pure” diffusion and a soil with well-characterized 226Ra activity concentration, depth (thickness), porosity and radon emanation characteristics (UNSCEAR, 1988; Rogers and Nielson, 1991; Nazaroff, 1992; Porstendörfer, 1994). In contrast, most contemporary radon flux studies have been based on the experimental accumulation chamber method (Hassan et al., 2009), resulting in a standard method reflected in the ISO 11665-7:2012 “Accumulation method for estimating surface exhalation rate”. In these cases, the reference value used for calibration of the radon flux system, and the method of flux measurement, is based on the results of an exponential fit of the increasing radon activity concentration inside a chamber of known volume, or in a STAR (ISO, 2009), over several days.
The theoretical approach enables calculation of the radon flux F by the diffusion equation (Porstendörfer, 1994)
where ε is the radon emanation factor, CRa is the 226Ra activity of the soil (Bq kg−1), ρ is the dry bulk density (kg m−3) of the soil, L is the radon diffusion length in the soil (m), z is the soil thickness (m) and λ is the radon decay constant (2.0993 × 10⁻⁶ s−1 following Morawska, 1989).
Within Eq. (1), the emanation factor is defined as the fraction of radon atoms produced by radium disintegration that escape into the soil pore space. Its value varies between 0, when radon does not escape the 226Ra-containing soil grain, and 1, when all radon escapes. This factor depends on many things, including grain size and shape, moisture content, porosity, permeability, and the distribution of 226Ra atoms in the mineral grains (Baskaran, 2016).
Considering a soil sample of a determinate mass, where the sample is sufficiently well distributed to ensure that all radon atoms successfully entering the pore spaces of the sample will eventually escape to the air volume and be measured, the emanation factor ε can be defined as
where ARa is the total radium activity of the sample and ARn is the radon activity that escapes from the sample. The radium activity is usually measured by gamma spectrometric analysis of the soil sample (i.e., Quindos et al., 1994). To determine the radon activity that escapes from the sample, an airtight stainless-steel container of known volume is commonly used, and the rate of escape is determined by the increase in radon concentration inside (i.e., Stoulos et al., 2004).
The bulk density ρ can be calculated from the sample weight and volume of the dry soil (Hosoda et al., 2007). When the soil thickness is much smaller than the radon diffusion length (i.e., z≪L), as is the case for the exhalation bed used in this study, the approximation can be used. Thus, the final equation will be (Lopez-Coto et al., 2009)
In order to prove the applicability of Eq. (3), the diffusion length L has to be evaluated and compared with z. L can be estimated as
where D is the effective diffusion coefficient of the trace gas in the soil air (hereafter also named effective diffusivity). D is assumed to be constant with depth (Karstens et al., 2015) and can be estimated from water saturation (ws) and porosity p using the following expression (Rogers and Nielson, 1991; Prasad et al., 2012):
where Dair is the radon diffusion coefficient in air (1.1 × 10⁻⁵ m2s−1).
Karstens et al. (2015) made reference to Jin and Jury (1996) and Millington and Quirk (1961), who proposed, and verified, another experimental estimation of the effective diffusivity:
where wV (m3 m−3) is the volumetric water content (VWC) of the soil. Equations (5) and (5a) were both derived empirically and are quite consistent with each other, mainly for dry soils, as will be shown in the following sections.
The porosity and water saturation ws (m3 m−3) (Indoria et al., 2020; IAEA, 2013) are given by
where ρg is the grain density, and
where wc (kg kg−1) is the mass water content of the soil sample and ρw is the water density (1000 kg m−3). Karstens et al. (2015) reported that the temperature dependence of 222Rn diffusivity could also be estimated according to Schery and Wasiolek (1998):
where T is the mean soil temperature in Kelvin and D0 the effective diffusivity at the reference temperature T0 = 273 K.
The experimental approach allows the flux of a given soil surface to be calculated from the increase in radon activity concentration CRn(t) within a chamber of known volume during a time t, as described by Eq. (9):
where the effective decay constant λeff is the sum of the radon decay constant λ, possible radon lost due to system leakages λl and radon concentration reabsorbed by the ground λr, as described by Grossi et al. (2011). C0 is the initial radon activity concentration within the volume, Veff is the effective volume where the radon is free to accumulate and A is the area of the exhaling surface.
2.2 State-of-the-art exhalation bed facilities
Table S1 in the Supplement presents a summary of EB facilities found in the literature. The Canada Centre for Mineral and Energy Technology (CANMET) built a national reference standard flux bed for calibrating flux monitoring instrumentation. This 5 m diameter bed consisted of a 5.5 cm thick layer of uranium-bearing material from uranium tailings and provided a radon flux of 285 ± 41 mBq m−2 s−1 (Stieff et al., 1996). In the University of South China Radon Laboratory, a standard facility simulating radon exhalation from soil was built in 2001 (Tan and Xiao, 2011). It consisted of a radon source located at the bottom of a conical volume. The middle cylindrical part was made of a plaster and spumy board that simulates the soil or sand porosity. Finally, in the upper part, there is powdery calcium carbonate to maintain the radon concentration in the conical volume. The reference flux for this system is 1482 ± 50 mBq m−2 s−1, which was measured using an activated charcoal box and Lucas cells. It is still operating, and some studies continue to use it (Tan and Xiao, 2013; Tan et al., 2020). Oak Ridge Associated Universities (Tennessee, USA) constructed a multilayer exhalation bed. It consists of a base layer of uranium ore spread over the bottom of a rectangular Hardigg polyethylene case of dimensions 84 cm × 53 cm. The base has a 10 cm covering layer of dirt to create a uniform flux at the top surface. The reference exhalation rate of this system was determined by the accumulation method, using a continuous radon monitor, and by using activated charcoal canisters and electrets. The range of values obtained varied from approximately 80 to 430 mBq m−2 s−1 (Altic, 2014). Onishchenko et al. (2015), from the Institute of Industrial Ecology, Ural Branch of the Russian Academy of Sciences (UB RAS) (Yekaterinburg, Russia), designed a calibration system to test radon flux measurement devices. It was constructed from a 200 L metal drum filled with quartz sand (radium concentration less than 2.5 Bq kg−1), with a calibrated 226Ra source in the bottom space of the system. The reference exhalation rate obtained by the accumulation method and charcoal canisters was 700 ± 80 mBq m−2 s−1.
Gutiérrez-Álvarez et al. (2020a, b) performed an experimental characterization of a soil exhalation rate using the accumulation method (Eq. 9). Two reference exhalation soils were prepared using phosphogypsum in rectangular polypropylene boxes with 6.0 and 13.0 cm soil thicknesses, respectively. Means of the experimental results of the bed exhalation rates were of 13.3 ± 0.4 and 23.4 ± 0.5 mBq m−2 s−1, with an uncertainty for σ=1 of 2 %–3 %. These previous values were compared to exhalation rates determined by applying the theoretical approach (Eq. 3), which gave values of 12 and 23 mBq m−2 s−1, respectively, for the two exhalation beds, with a total uncertainty of about 20 %.
2.3 Design of a reference radon exhalation bed
In the framework of traceRadon, and using information from the previous section, a radon EB was designed and built at the University of Cantabria (UC) following Gutiérrez-Álvarez et al. (2020a, b). The EB structure consisted of five stainless-steel plates, welded in the shape of a box and open at the top. In this configuration it is important to minimize air leakages through the plates that may lead to the loss of radon activity. The intended purpose of this EB was to provide a constant, well-characterized radon emanation rate under a specific set of controlled laboratory conditions. Since soil moisture influences on the radon emanation were not of specific interest in this case, a relatively shallow soil matrix was sufficient for the EB aims.
The EB structure was filled with a high 226Ra content soil, extracted from a former Spanish uranium mine in Saelices el Chico (Spain), managed by the Spanish National Uranium Company, ENUSA. A total soil mass of around 400 kg was collected. The material was then transported to UC laboratory and distributed over a 30 m2 plastic surface in a layer of thickness of approximately 1 cm to be dried and homogenized. Soil homogenization was performed according to technical document 1415 (IAEA, 2004) using the following steps: (i) the material was manually homogenized using a stainless-steel rake, and (ii) it was sieved with a 2 mm aperture sieve (the device has a woven wire mesh in accordance with DIN ISO 3310-1). For the sieving process, soil was taken randomly in 5 kg amounts. Finally, the homogenized soil was placed into the EB container.
The EB facility was installed in the basement of the UC Faculty of Medicine, in the Laboratory of Environmental Radioactivity (LaRUC). Sensors were installed to continuously monitor temperature, pressure and soil moisture. Two thermometers (testo 175T2) measured the soil temperature and air temperature inside the accumulation chambers. Soil moisture was measured with an ODYSSEY (Xtreem) probe, and all environmental parameters were recorded by a datalogger every minute. Table S2 of the Supplement summarizes the main characteristics of the selected sensors.
The EB radon flux was estimated theoretically and experimentally using the approaches presented in Sect. 2.1. To apply Eq. (3), the various soil parameters were measured and/or calculated, as explained in Sect. 3. The experimental derivation of the EB's radon flux was performed using Eq. (9) as by Gutiérrez-Álvarez et al. (2020a). For this, the whole surface of the EB was covered with a stainless-steel container of known volume (Fig. S1 of the Supplement). Three radon monitors, an RTM 2200 (SARAD GmbH), a Radon Scout (SARAD GmbH) and an AlphaE (Bertin Instruments), were used simultaneously to measure the increase of radon concentration within the effective accumulation volume. Please note that the sum of the volumes occupied by the solid components of the three monitors were lower than 1 % of the total available volume of the accumulation chamber. In addition, several small air samples were also taken using the grab sampling technique and analyzed with the ionization chamber IK-250 (RADON v.o.s.).
2.4 State-of-the-art in radon flux systems
A literature review carried out in the framework of traceRadon found that radon monitors employed in flux measurement systems mainly fall into two categories: active or passive. Active monitors analyze the air in real time, whereas passive monitors (i.e., charcoal canisters) rely on the progressive accumulation of radon by diffusion. The accumulated radon is then measured using a separate system (e.g., by gamma spectroscopy or ionization chamber) (McLaughlin, 2011). Due to the need for radon flux systems capable of high-frequency measurements (capable of resolving diurnal variability), only active systems will be presented and discussed here.
Generally, radon flux systems are comprised of two main parts: a continuous radon monitor and an accumulation volume to be placed on the soil surface. The radon flux (or exhalation rate) is then calculated by Eq. (9) using the measured increase of radon within the known volume. However, Eq. (9) can only be solved if the exhalation rate F and the total system leakage λeff remain constant over the designated time period. This condition is hard to satisfy for long-term radon flux measurements under field conditions, making it difficult to apply the ISO-suggested exponential fit. Variability of environmental parameters, in the soil and/or atmosphere, may force changes in the quantity of radon exhaled from the surface. Furthermore, gradients of temperature and/or pressure between internal and external air of the accumulation chamber may change the leakage of the system (λeff). For short measurement periods, and the initial concentration within the accumulation chamber is relatively close to the atmospheric value, which is usually small (C0≈0). Thus, Eq. (9) can be substituted with a Taylor series of the exponential truncated to the first order as
where is referred to as the effective height of the system (Morawska, 1989). Thus, to minimize radon flux and/or λeff variability during the measurements, it is advisable to perform short radon flux measurements, which are also important validate radon flux models.
The main characteristics of radon flux systems in the literature based on continuous radon monitors are summarized here (see Table S3 and Fig. S2 of the Supplement for more detail). System 1 was designed and built by ANSTO. While not a commercial system, it is based on a commercial AlphaGUARD (AG) monitor and has a drum-like accumulation chamber with a lid that can be automatically opened and closed. A separate pump is used to circulate air from the accumulation chamber to the AG in a closed loop. No monitoring of the air inside the accumulation chamber is performed by this system. System 2 (the emanometer), also designed and built by ANSTO, is the predecessor of System 1 and is based on the flow-through accumulation method. In this case the accumulation volume is permanently closed, and to perform a measurement the edges of the accumulation chamber are buried in soil to make a reasonable seal with the emanating surface (Zahorowski and Whittlestone, 1996). The system has two detection volumes (scintillation cells) separated in the flow path by approximatively 5 min to enable separate radon and thoron (220Rn) flux estimation (more details in Zahorowski and Whittlestone, 1996). System 3 is a commercial accumulation chamber designed and built by LI-COR (http://www.licor.com, last access: 24 May 2023). To date, this chamber is only sold together with an 8100-401 chamber control kit for the purpose of automatic CO2 flux measurements. So far it has never been coupled with any commercial radon monitor. Systems 4, 5 and 6 are research products, each using different radon monitors and types of accumulation chambers, some of which can be opened and closed automatically. System 6, in particular, developed at the Helmholtz Zentrum München (Institute of Radiation Protection), Neuherberg, Germany, allows radon flux measurements to be made at different sites around a circular path, using a mechanical arm (Yang et al., 2017). Unfortunately, System 6 is no longer available due to the discontinuation of the research group. Systems 7 and 8, built by INTE-UPC and UC, respectively, are based on radon monitors (DOSEman and AlphaE) operating in diffusion mode. Radon monitors operating in diffusion mode can influence the flux instrument's response time, as well as the subsequent fit calculation for estimating the flux, as will be shown in Sect. 3. Both systems have accumulation chambers that can only be opened manually, but air is refreshed by an external pump.
The importance of the accumulation chamber characteristics when measuring soil gas fluxes should not be underestimated. An inherent challenge in flux chamber design is minimizing the influence that the chamber may have on the measurements, especially for long-term observations. Based on our literature review, the main characteristics required for radon flux systems (monitors and accumulation chambers) are listed and have been taken into account when developing a radon flux system suitable for use as a transfer standard.
For a system capable of making radon flux measurements at high temporal resolution, which minimizes the disturbance of flux estimates by changing environmental parameters inside the accumulation chamber, the main requirements are the following.
-
Use a continuous direct radon monitor that measures activity concentration in flow mode (not diffusion mode) at a high temporal resolution (e.g., 1–10 min) and with a minimum detectable radon activity concentration low enough to measure short-term radon increases within the accumulation chamber with a statistical uncertainty lower than 20 %, allowing radon flux measurements to be obtained using Eq. (10).
-
The accumulation chamber needs to open completely and automatically after each measurement period to establish the initial condition of C0 equal to the ambient radon concentration.
-
Environmental sensors are needed inside and outside the accumulation chamber.
-
The accumulation chamber needs to have a smooth internal geometry to avoid inhomogeneous internal concentration distribution.
-
The accumulation chamber should be painted gloss white, to minimize the temperature difference between air inside and outside of the chamber when the chamber is in direct sunlight.
-
The chamber should have a matching collar to attach to (via an easy to clean and seal flange), which can be firmly seated in the soil (to a depth of 2–10 cm, depending on soil type/texture) to minimize radon losses (Gutiérrez-Álvarez et al., 2020b).
2.5 Design of a new radon flux transfer standard (TS) system
Based on the monitor requirements described in Sect. 2.4, an automatic and low maintenance radon flux measurement system was designed and built at ANSTO in September 2020 as an alternative implementation of System 1, described previously. This new system was implemented in collaboration with the UPC and subsequently fully characterized by UPC in collaboration with UC, in the framework of traceRadon. UPC also implemented the means to remotely control the system for data download during the experiments and improved the scripts for the flux calculations and analysis.
This instrument enables eight automatic flux measurements to be performed each day, every 3 h. Autoflux is comprised of an AG PQ2000 PRO (Saphymo) radon monitor (working in 10 min flow mode), an accumulation chamber (drum) with an automatic lid and several environmental sensors installed within the soil, inside the drum and outside the drum at 50 cm above ground level. An internal lip near the bottom of the accumulation chamber allows the chamber to be pushed 5 cm into the soil to make a good seal with the surface. The radon flux is estimated by performing a linear fit of the radon concentration increase within the closed drum every 10 min over a 1 h period using Eq. (10). The drum's hinged lid is opened and closed using a classic rod linear actuator. The actuator is fitted with an external limit switch kit, powered by a 4 × 12 V DC relay card and controlled by a CSI CR1000 datalogger (https://www.campbellsci.es/cr1000, last access: 24 May 2023). The opening (default 2 h) and closing (default 1 h) times of the accumulation chamber are adjustable and controlled by the program in the datalogger.
The novelty of this system is that the diurnal and seasonal variability of soil radon fluxes can be observed and studied in parallel with measurements of soil properties and meteorological conditions. The Autoflux system was constructed in such a way that it can perform long-term measurements of radon flux and environmental parameters with almost zero maintenance requirements. Unfortunately, this system does not provide a movable arm to allow a periodic change of the measurement spot. Consequently, the positioning of the lid, even when fully open, can sometimes partially shelter the measurement surface from the rainfall that the surrounding surface is receiving. To best match conditions inside and outside of the chamber when open, the accumulation chamber should be positioned such that the lid opens into the direction of the sun at midday, to maximize the sunlight received by the surface inside.
Figure 1 shows the Autoflux system during a typical radon flux field measurement. Figure S3 of the Supplement presents a simplified scheme of the actual state of the Autoflux system.
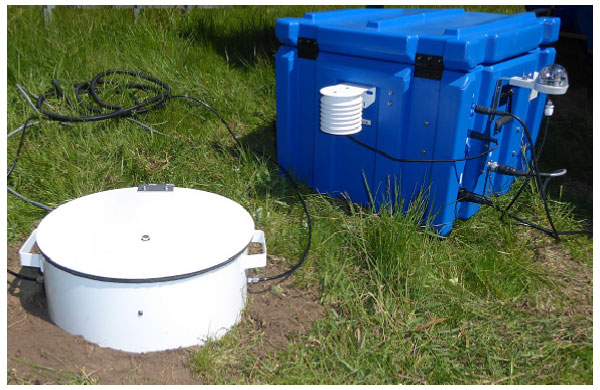
Figure 1Image of the Autoflux system running in the field. The radon activity concentration, internal air temperature, differential pressure and soil characteristics are measured within the white drum. Ambient temperature, humidity, pressure and rainfall are measured on the side of the transport case (∼ 50 cm a.g.l.), and the main system components are located inside the waterproof transport case.
The air exhaled from the soil, rich in radon and thoron (220Rn), enters the accumulation nominal volume VD = 0.02 m3 and is pumped at Q = (1 ± 0.1) L min−1 first through a filter (Pall Acro 50) and then through a Perma Pure PD gas dryer, intended to maintain humidity levels below saturation conditions within the AG monitor. The low humidity air stream then enters a delay volume (VTh = 6 × 10⁻³ m3), within which the ambient thoron decays. Next, the air passes into the detection volume of the AG (VAG = 0.62 × 10⁻³ m3), where the radon concentration is measured with a 10 min temporal resolution. The total volume of the circuit tubes is VTubes ≈ 0.3 × 10⁻³ m3. The area of the exhaling surface is A = 0.126 m2. Considering the total volume where the radon concentration will be accumulating, Veff will be in this case equal to = 2.6 × 10⁻³ m3 and the effective height heff in Eq. (10) is equal to 0.204 m.
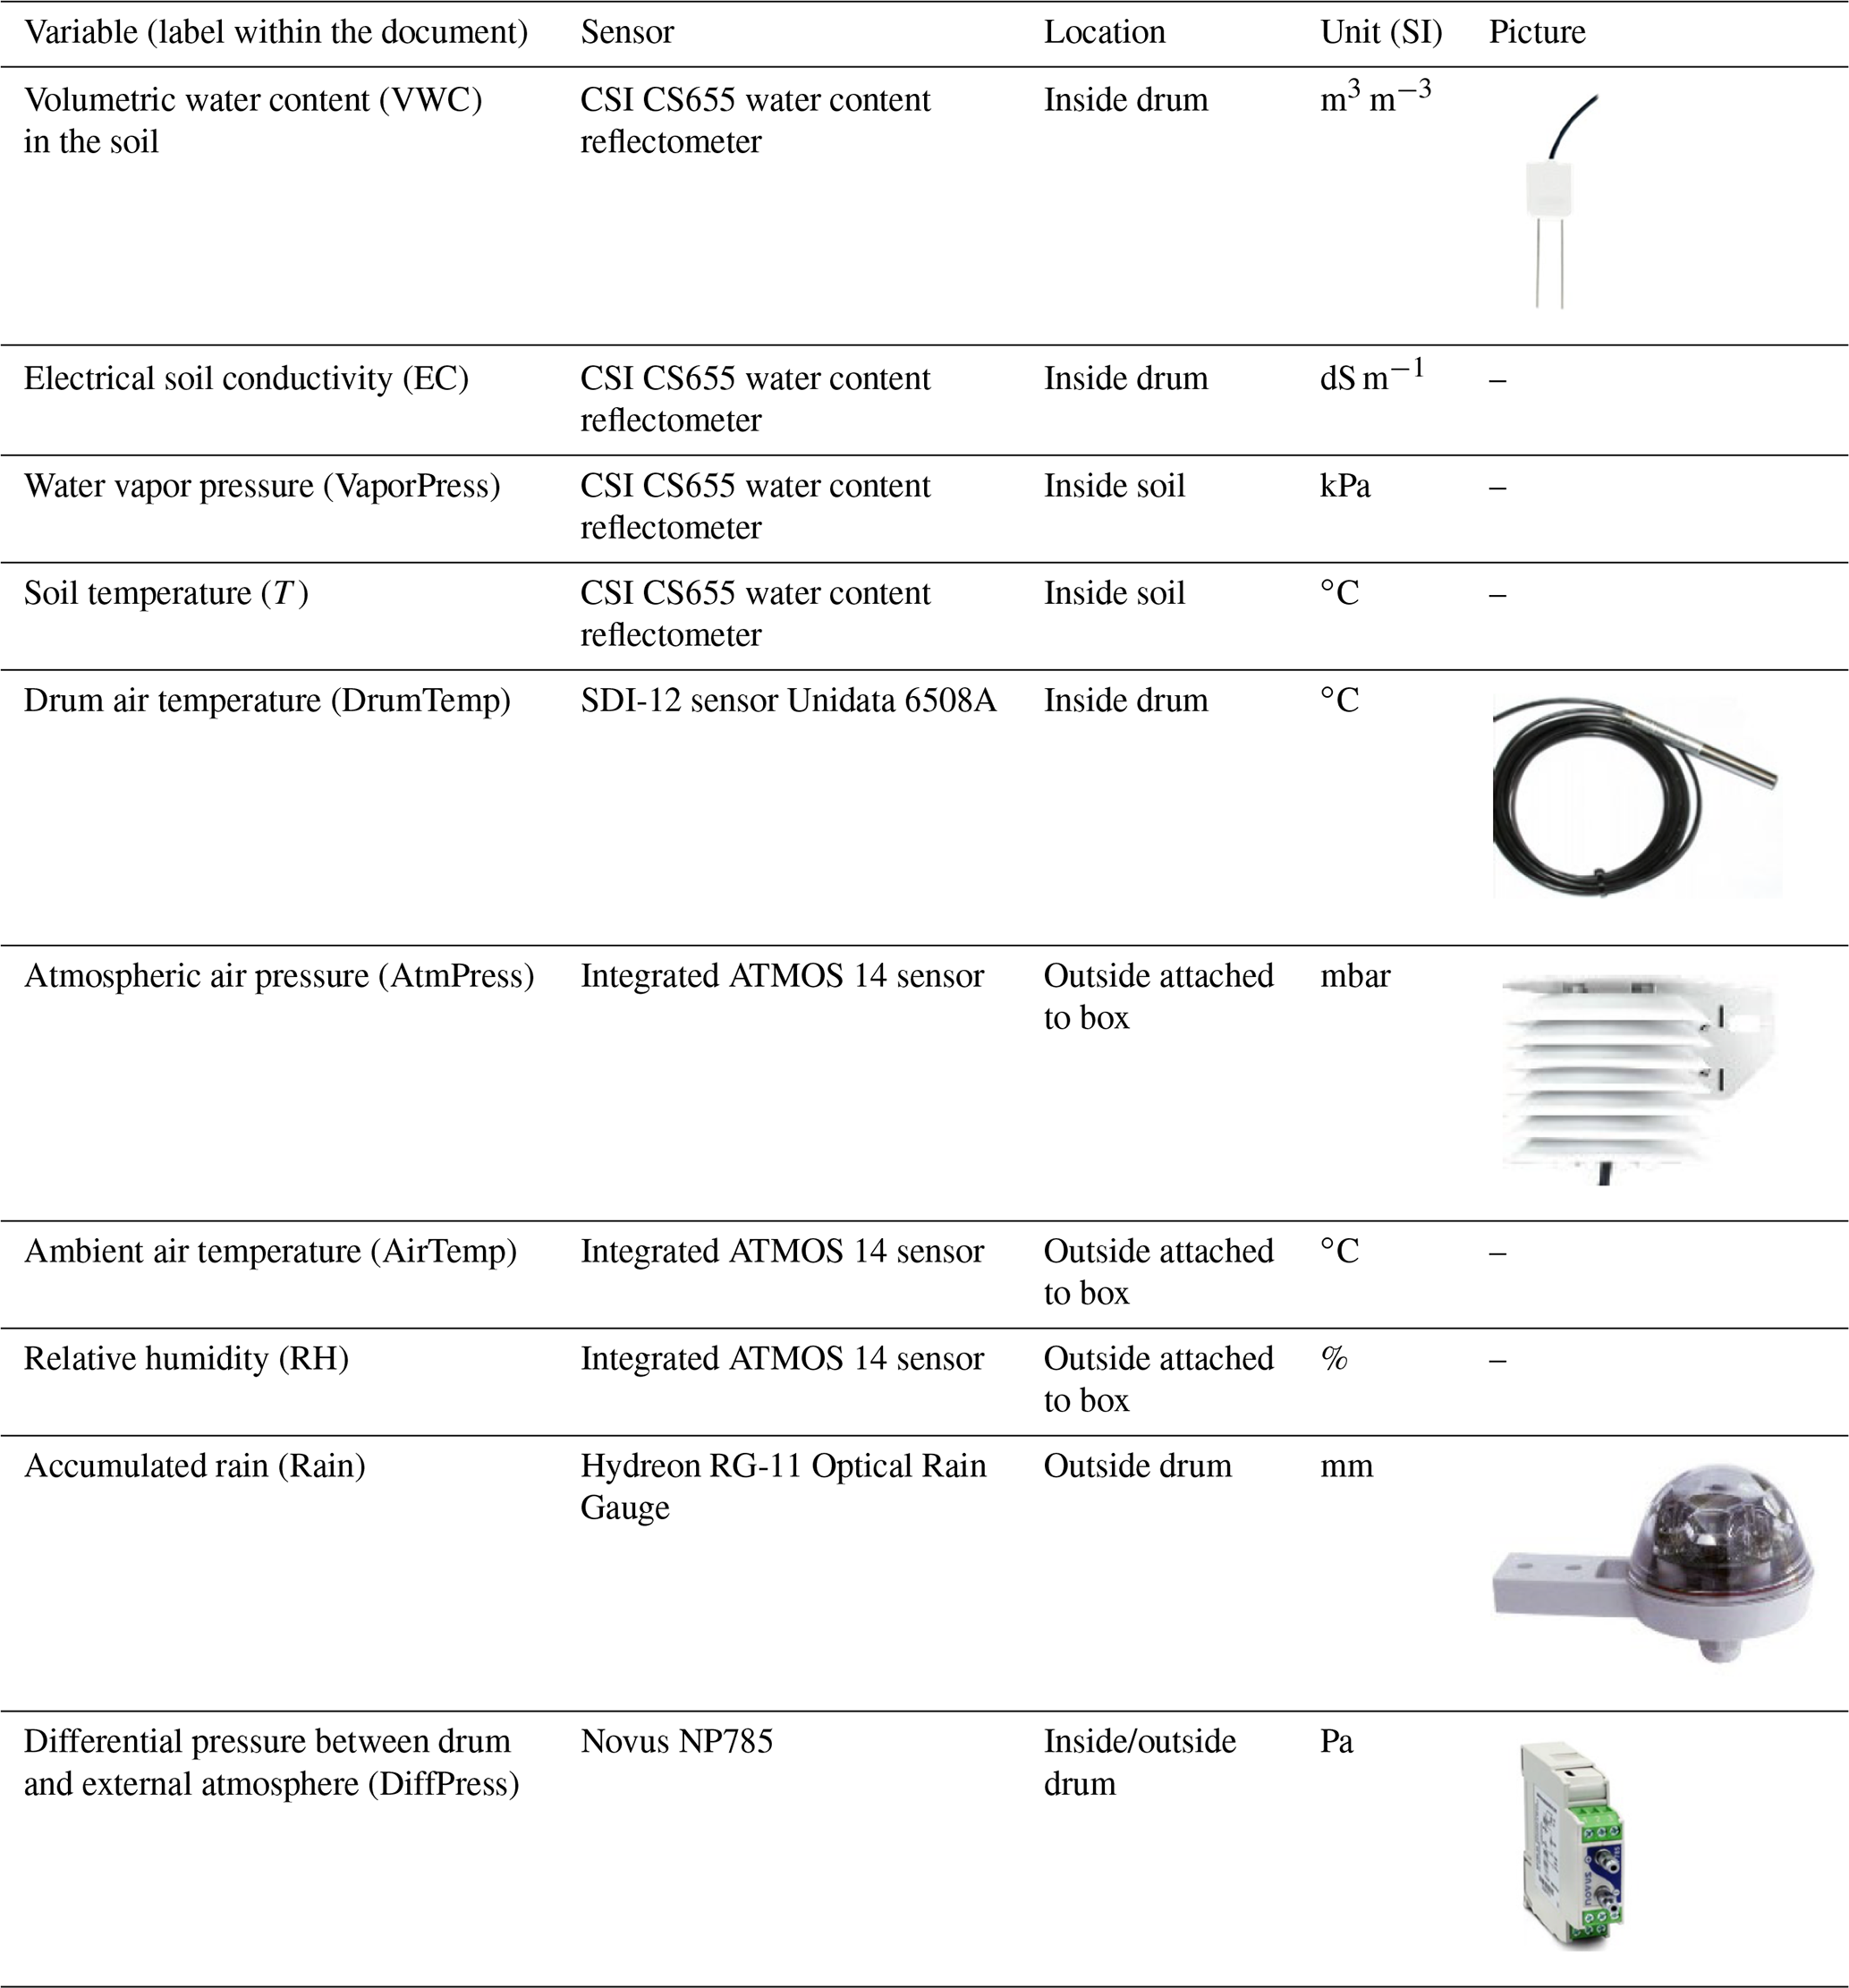
The drum and soil sensors are installed directly into the soil. All sensor outputs are read by a CR1000 datalogger. A Raspberry Pi 4 (RPi) enables scheduled data downloads from both the CR1000 datalogger and AG via a RS232 serial port and serial-to-USB FTDI adapter. The RPi, AG, datalogger, PD and all electronic components of the Autoflux system are safety located within a sturdy, waterproof transport case. External sensors are installed on the outer walls of the blue transport case. Table 1 summarizes the sensors installed within the Autoflux system. Data stored on the RPi, which are downloaded from the AG and datalogger hourly, can be transferred to a notebook computer by connecting the RPi with an Ethernet cable, assuming a Bitvise SSH Client is installed.
Figure S4 of the Supplement shows the accumulation chamber of the Autoflux system in its closed state (left side) and opened state (right side) during a typical radon flux measurement.
2.6 Calibration of a secondary radon flux system using Autoflux and the UC EB facility
After the characterization of the EB (see Sect. 3.1) and the calibration of the TS under stable laboratory conditions with a constant reference radon flux (see Sect. 3.2), they were used together to calibrate a second radon flux system (INTE_Flux, system 6 of Sect. 2.3).
The INTE_Flux system also operates continuously and is capable of making three radon flux measurements per day. It consists of a cylindrical metallic chamber connected to two electro valves and a pump. The electro valves and pump are controlled using a programmable logic controller (PLC), and the system is powered via a 30 m waterproof cable. To measure a radon flux with this system, the 222Rn concentration in the chamber exhaled from the soil surface is continuously measured using a DOSEman monitor in diffusion mode, which was previously calibrated at the radon reference chamber (secondary) of the INTE-UPC in agreement with the IEC 61577-4. The DOSEman monitor is powered by an internal battery that lasts 15 d.
A typical calibration experiment setup, as carried out at the UC EB facility, is shown in Fig. 2, where the INTE_Flux and TS were installed on the EB between 29 June and 1 July 2021.
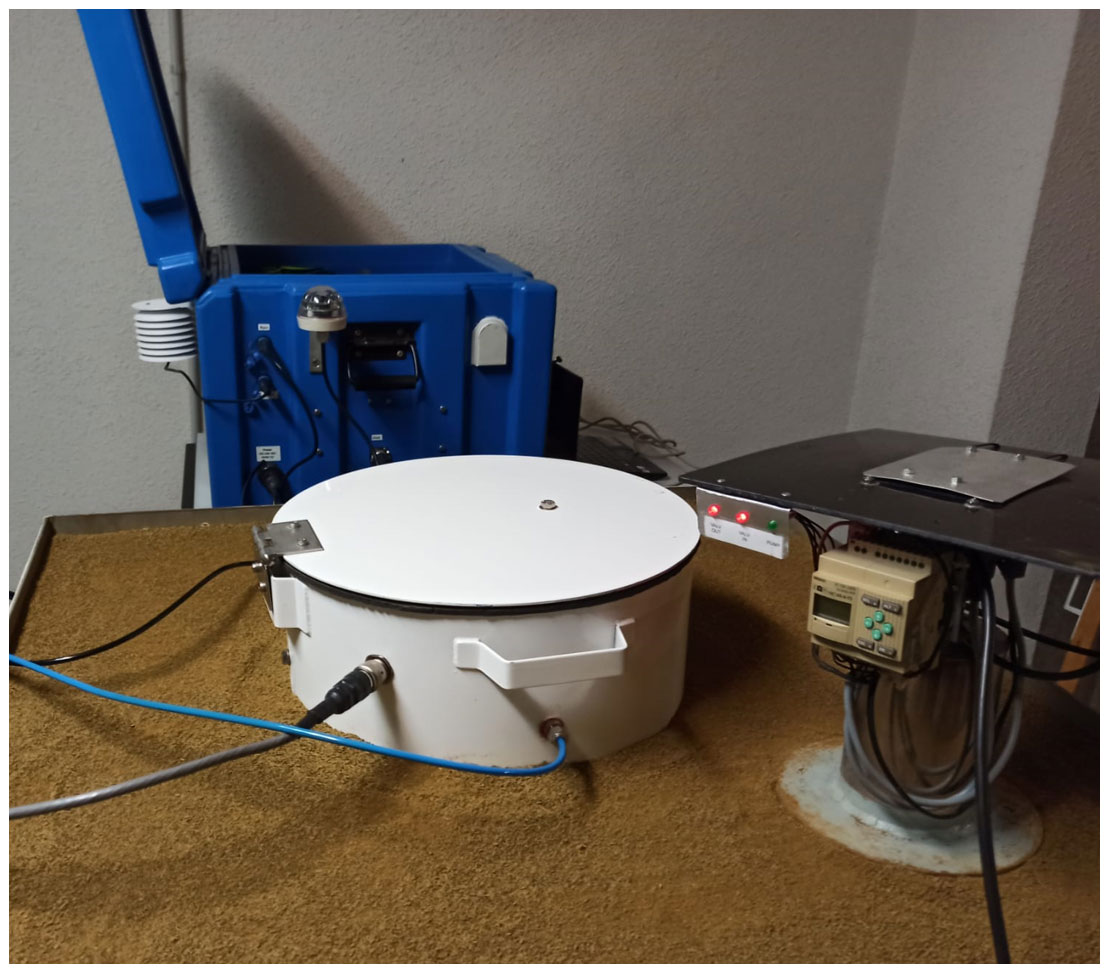
Figure 2Typical calibration experiment carried out at the UC laboratory: the INTE_Flux system is installed together with the TS system on the EB facility.
3.1 Characterization of the radon exhalation bed (EB) facility
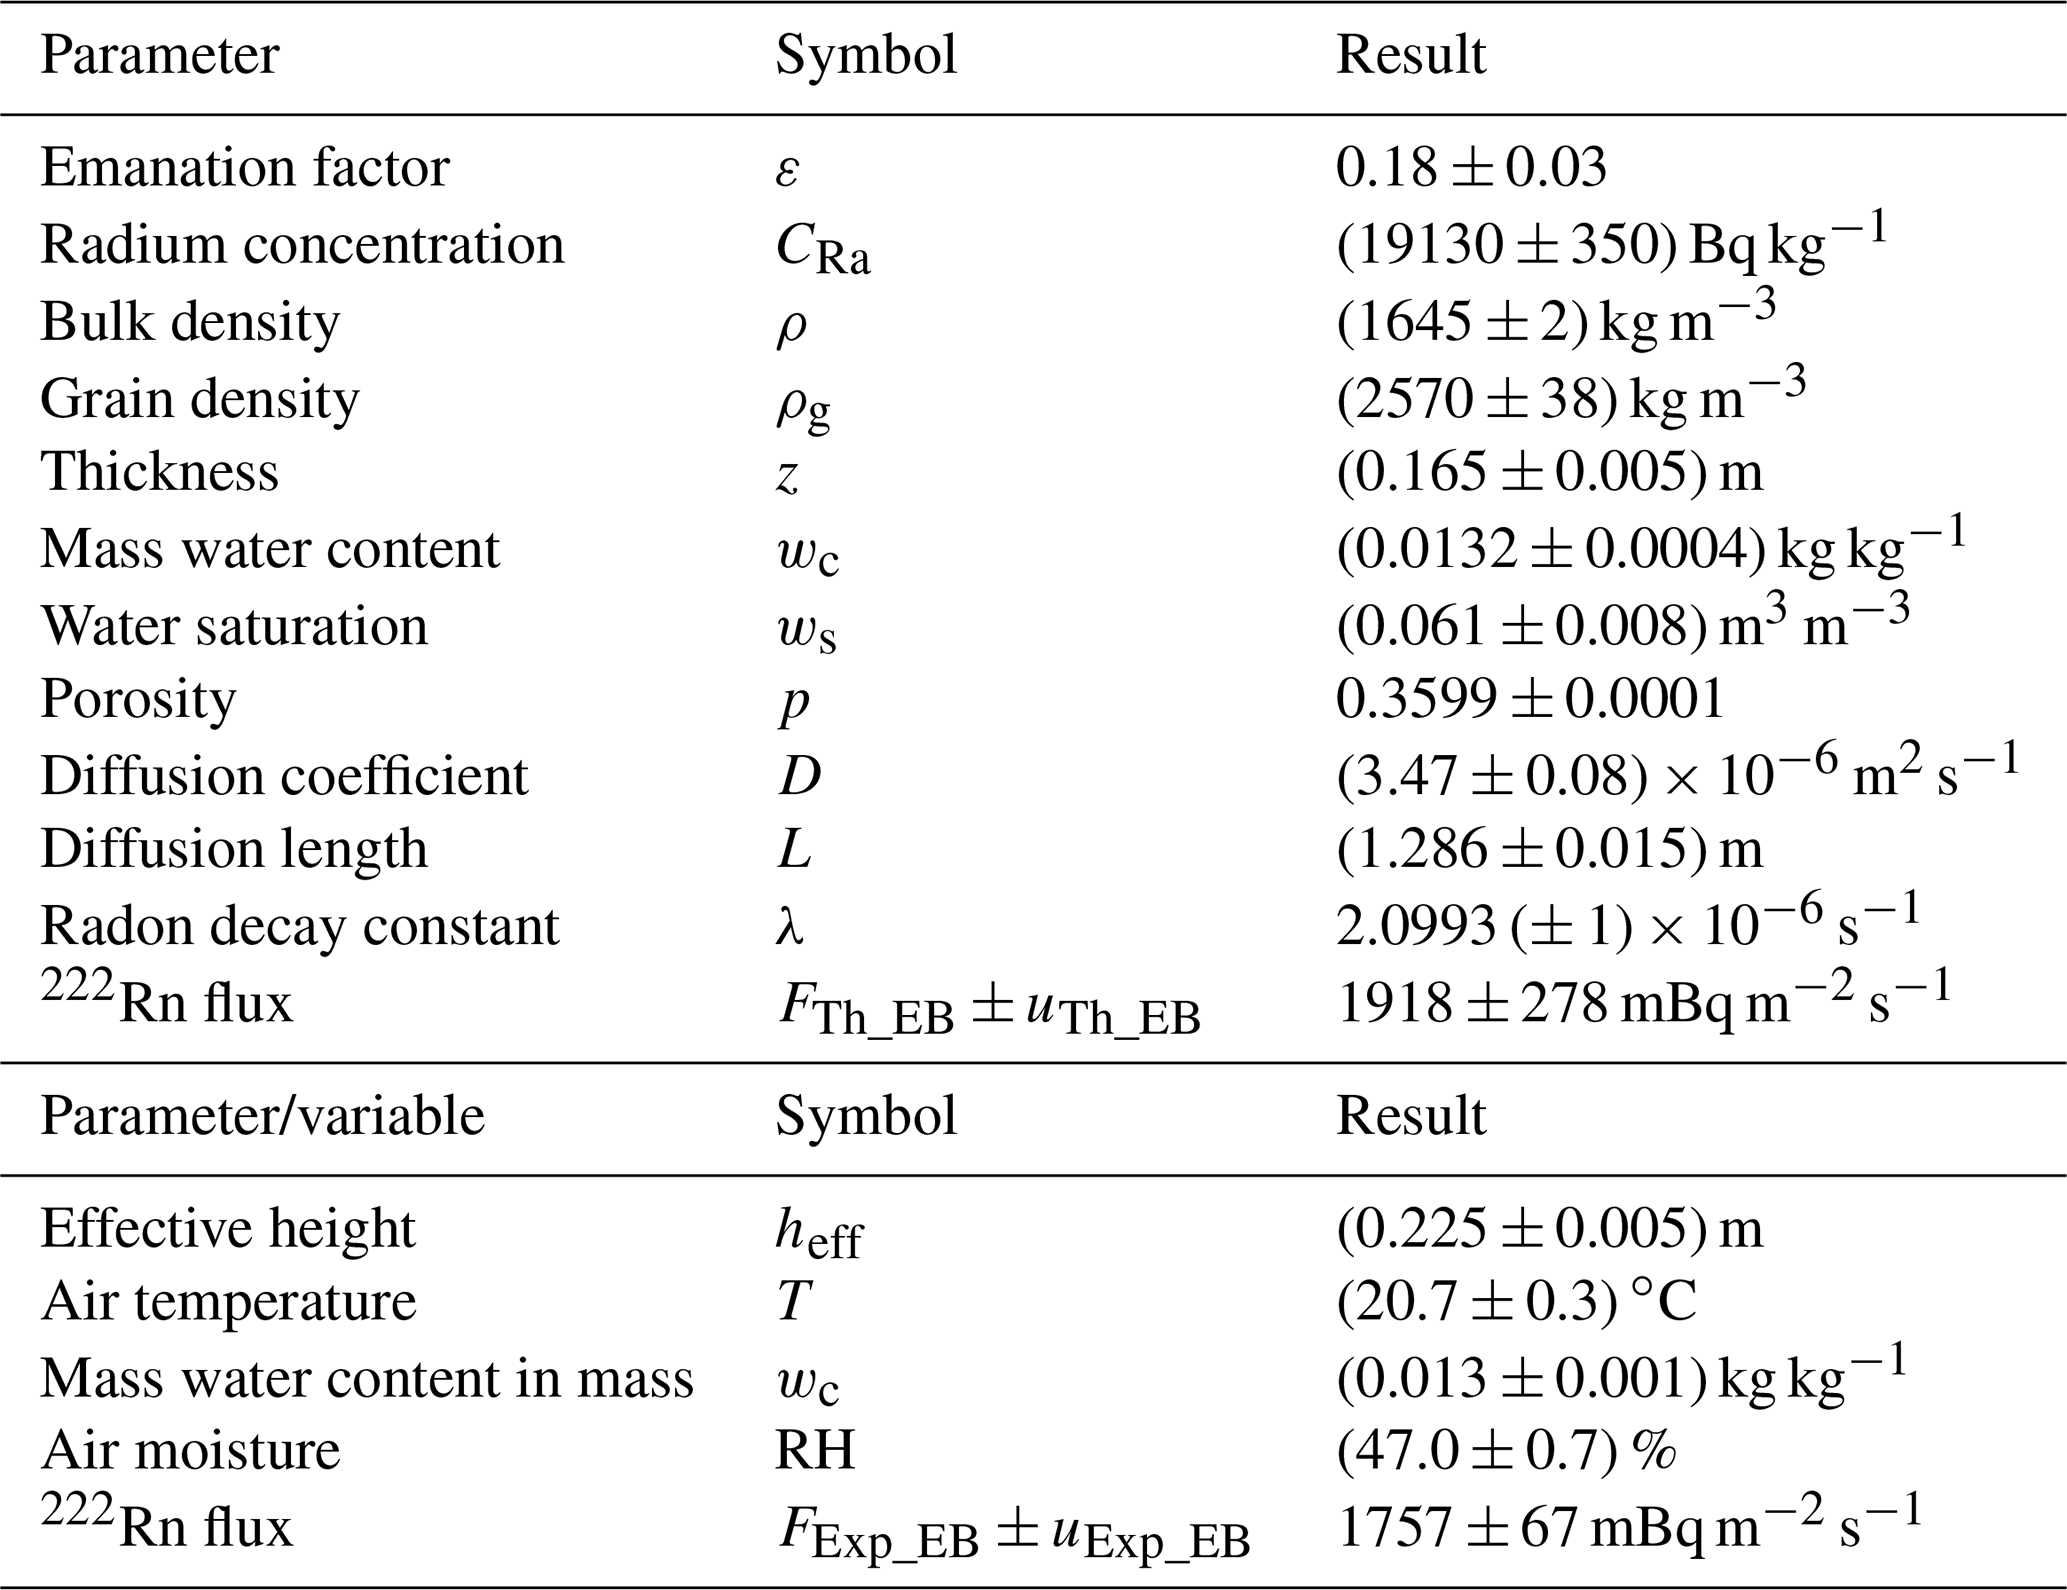
The EB radon flux was determined under laboratory conditions at specific points in time using both theoretical and experimental approaches, as explained in Sect. 2.1. The necessary parameters to apply Eq. (3) were measured and/or calculated, as explained later in this section, and are presented in Table 2, along with their respective uncertainties (with k = 1). Table 2 also presents all variables and parameters measured or calculated for the experimental characterization of the EB within a week of its installation, together with values obtained from the literature (D and λ).
Table 2Results of the parameters/variables influencing the calculation/measurements of radon flux from the exhalation bed configuration for the theoretical and experimental approaches, respectively. Uncertainties are expressed without any coverage factor (k = 1).
3.1.1 Radium activity concentration (CRa)
The average radium activity concentration of the soil in the EB was obtained by gamma spectrometry analysis of five separate samples. The samples were extracted from the center and each of the four corners of the EB at a depth of 10–15 cm. Samples were hermetically sealed in a cylindrical container for 1 month to allow the 226Ra to reach secular equilibrium with its short-lived progeny (214Pb and 214Bi). After this time, the radium activity was determined using the 214Pb photopeak (351.93 keV) with a high-resolution gamma HPGe (high-purity germanium) coaxial detector (model BE3820, Canberra, USA) following Celaya et al. (2018). The mean 226Ra activity concentration was 19 130 ± 350 Bq kg−1.
3.1.2 Emanation factor (ε)
The initial emanation factor ε0 of the EB soil was obtained by measuring the ratio between the radon activity (ARn) within the pores of a small, thin (< 5 mm) soil sample and its radium activity (ARa) (Eq. 2). ARn in a M=100 g soil sample was measured by Eq. (9) after hermetically sealing the sample within a volume V=0.024 m3 and making an exponential approximation of the radon concentration increase with time. The experiment was repeated n = 3 times.
Each experiment was run over a period of 500 h and was replicated at standard temperature conditions (T=298 K) with a dried soil sample. A continuous radon monitor (Radon Scout; SARAD GmbH) was used for these tests after being calibrated in the LaRUC radon chamber (Fuente et al., 2018). A final average emanation factor was obtained as
with ϕ the activity rate of radon (Bq s−1), obtained as the mean of the three exponential fits, and λeff = (2.2 ± 0.3) × 10−6 s−1 the effective decay constant of the system. The estimated uncertainty of the mean of the initial emanation factor was determined from the standard deviation of the three experiments, and it was equal to 0.03. It can be observed that λeff≈λ, the decay constant of radon, ensuring negligible leakages within the system. A typical measurement experiment is shown in Fig. S5 of the Supplement.
As mentioned in the introduction, the emanation factor could vary over time because – apart from the grain size – it also depends on the moisture content and temperature of the material. Zhuo et al. (2006, 2008) investigated the relationship between the emanation factor variability with soil moisture and soil temperature and derived the following empirical relationship in Eq. (12):
where ε is the radon emanation factor estimated for a given temperature T, and ε0 is the radon emanation factor measured at a temperature of T=298 K for dried soil (see Eq. 11). ws is the water saturation fraction, and a, b and c are parameters calculated for different types of soil textures and declared by Zhuo et al. (2008).
3.1.3 Bulk density (ρ)
The soil bulk density ρ was calculated by measuring the mass M, with a calibrated balance and dividing this by its volume Vs. The volume was measured from an undisturbed soil sample using a test tube manufactured according to ISO 4788. A value of 1645 ± 2 kg m−3 was calculated.
3.1.4 Radon diffusion length (L)
As explained in Sect. 2, to simplify Eqs. (1) to (3) the soil thickness z of the EB needs to be much smaller than the radon diffusion length L in the material. Equations (4) to (7) had to be applied after measuring and/or calculating the required soil parameters for these equations: water saturation ws and porosity p of the soil. In addition, to apply Eqs. (6) and (7) the grain density and water content of the soil sample had to be measured. The mass water content wc (kg kg−1) can be measured as the ratio of the mass of water and the mass of dry soil. It is measured by weighing a soil sample mwet, then drying the sample to remove the water and weighing it again, mdry:
The grain density ρg is the ratio of the mass of a dry sample and its volume after eliminating the contribution of the interparticle void volume. It can be calculated from the sample weight mdry and the volume Vdry of dry soil from
The diffusion coefficient D and the diffusion length L can now be calculated using Eqs. (4) and (5), and L is equal to (1.286 ± 0.015) m. The measured EB thickness is equal to (0.165 ± 0.005) m; thus, the hypothesis z≪L is verified. Using all the previous parameters the radon flux from the EB can be theoretically estimated by Eq. (3), and it is FTh_EB = 1918 ± 278 mBq m−2 s−1.
Figure 3 shows the theoretical radon flux of the EB calculated using Eq. (1), assuming that the emanation factor varies according to Eq. (11) of Zhuo et al. (2008). The two versions of radon flux presented in Fig. 3 represent changes in the adopted diffusion coefficient D. In one case the flux has been calculated using the D from Eq. (5) (blue dots) and the other D from Eq. (5a) (black dots). It is evident that no significant difference in EB flux estimate was observed between these methods in the range of water saturation values for which the EB characterization was performed.
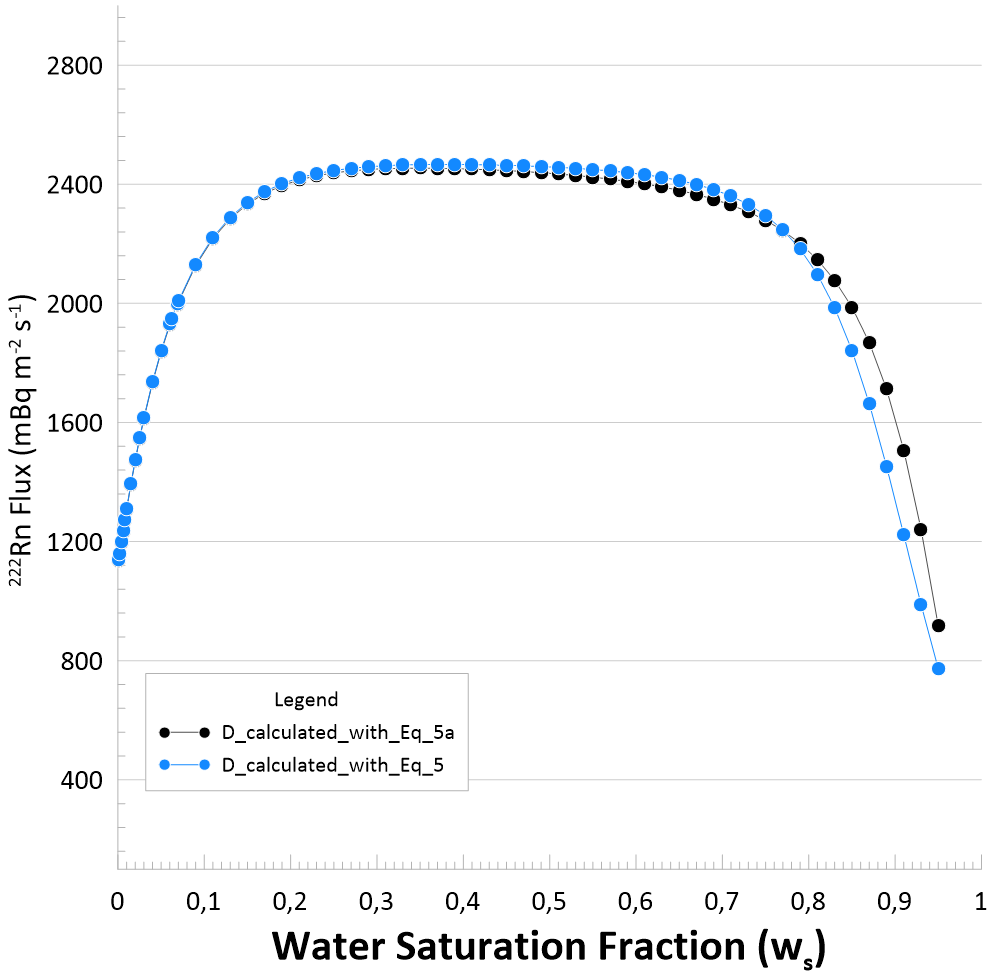
Figure 3Variability of EB 222Rn flux calculated using Eq. (1), where the emanation factor variability follows Eq. (11), and the diffusion coefficient D was estimated using both Eq. (5) (black dots) and Eq. (5a) (blue dots).
As explained in the Methods section, an empirical evaluation of the EB radon flux was also undertaken by enclosing the whole exhaling surface with a cover of known volume. The experiments were performed using different radon monitors inside the closed volume to monitor the radon buildup. Figure S6 of the Supplement shows the results of a typical accumulation experiment to estimate the EB radon exhalation rate. The experiment was repeated several times to confirm its reliability. The response time of the RTM device was set to 1 min, while it was 10 min for the Radon Scout and AlphaE. Air samples were also collected from the enclosed volume every 15 min for independent analysis. Radon concentrations inside the volume reached values of about 130 kBq m−3 after only 5 h. The diffusion mode of operation for the AlphaE and Radon Scout monitors (green and orange dots, respectively, in Fig. S6) is not capable of correctly representing the temporal variability of radon within the volume, so data from these devices were not used to estimate the EB radon exhalation rate.
The radon exhalation rate was obtained by applying Eq. (10) using parameters summarized in Table 2 (bottom part). Mean values observed by the environmental sensors of the EB facility during the experiments are also reported. The mean of the experimental radon flux was Fexp_EB = 1757 ± 67 mBq m−2 s−1.
3.2 Characterization of the radon flux transfer standard (TS) system
Autoflux was characterized and calibrated under controlled laboratory conditions using the EB facility, as described previously. Figure S7 of the Supplement shows the Autoflux setup for a typical laboratory measurement at UC. Two laboratory experiments were performed at standard environmental conditions: (i) from 28 June to 1 July 2021 (19 radon flux measurements) and (ii) from 7 to 12 July 2021 (39 radon flux measurements). Figure 4 shows the radon activity concentrations (upper panels) measured by Autoflux's AG during the two continuous experiment periods for each accumulation hour. The bottom panels of Fig. 4 show the soil volumetric water content (VWC) time series measured by the CSI CS655 Water Content Reflectometer and the air temperature inside the drum measured by the SDI-12 (Unidata 6508A) sensor during these experiments. A constant increase of around 28 × 103 Bq m−3 of radon and 1 ∘C of temperature was measured during the 1 h accumulation phase within the system. The volumetric water content (VWC) measured during the two experiments ranged between 0.025 and 0.029 m3 m−3.
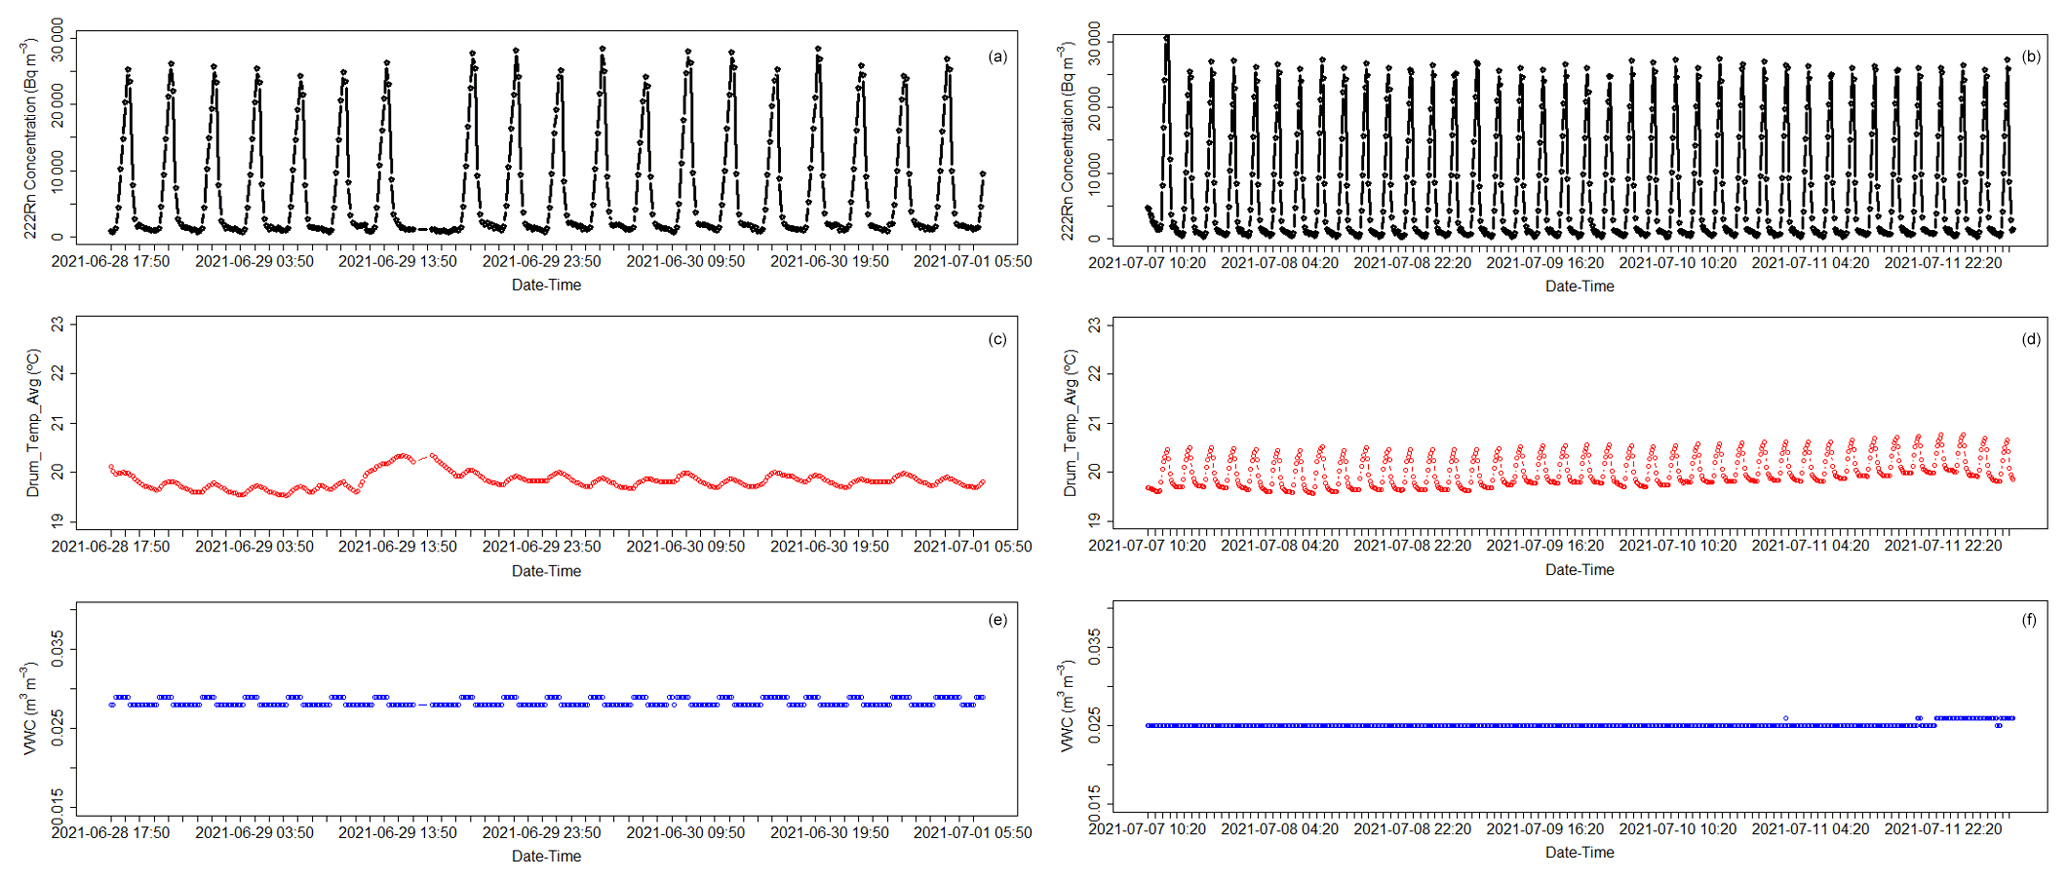
Figure 4Radon activity concentrations (dotted black lines in panels a and b) measured by Autoflux's AG during the two calibration experiments. The bottom panels show the time series of the soil VWC (dotted blue lines in panels e and f) and air temperature inside the drum (dotted red lines in panels c and d) during the experiments.
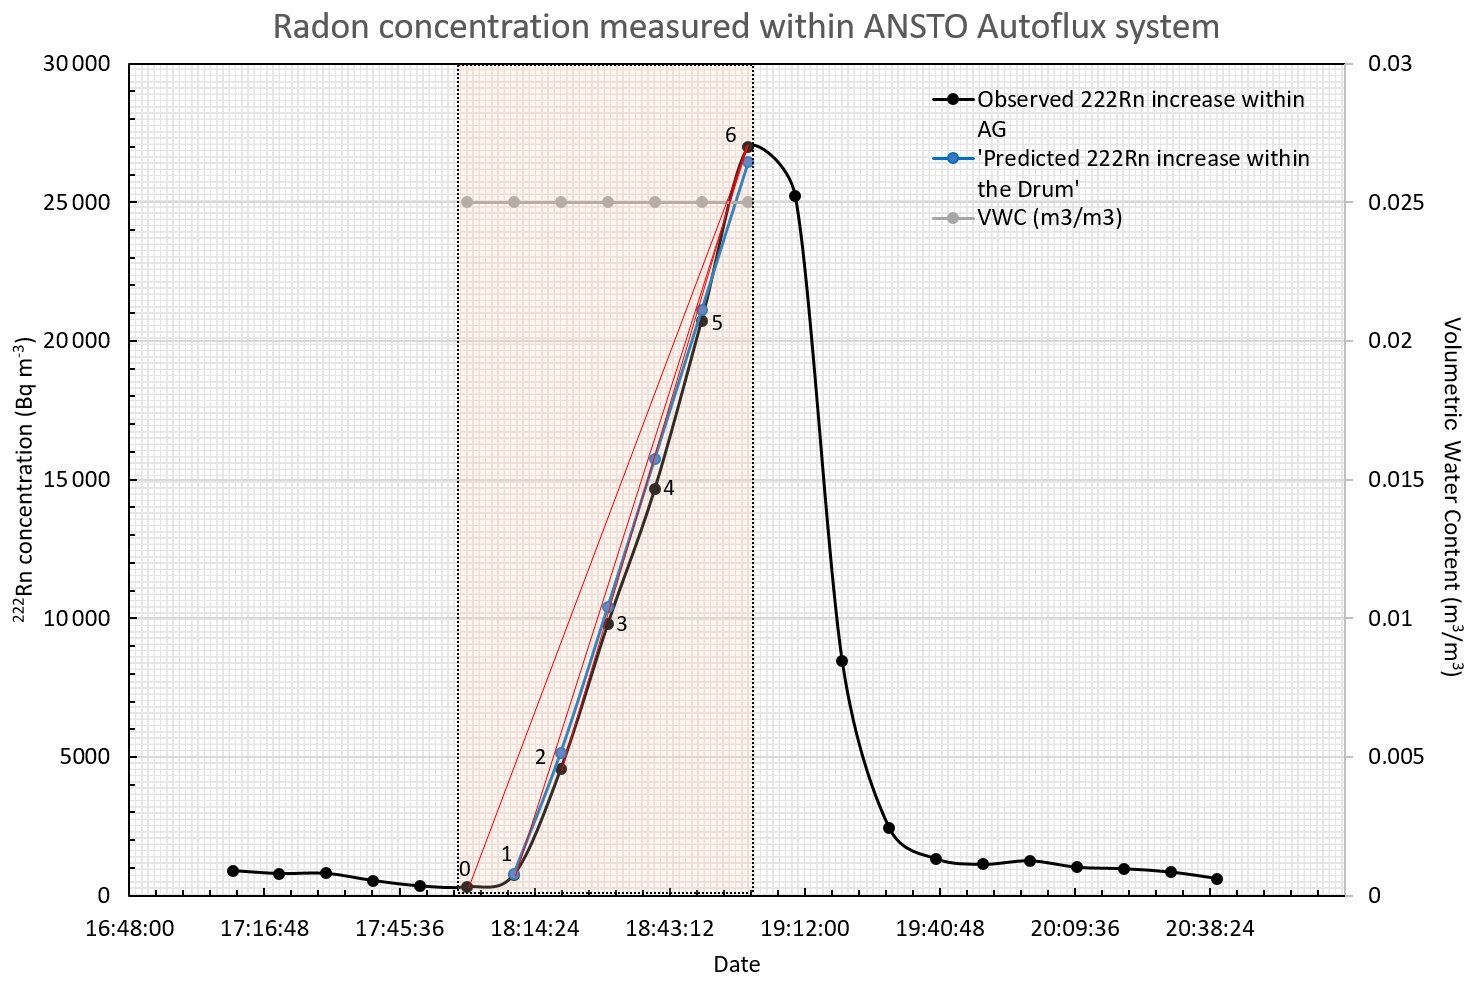
Figure 5Increase in radon activity concentration within Autoflux's accumulation chamber during a typical radon flux measurement (dotted black line). The dotted blue line represents the theoretical value calculated within the AG volume. The grey dots indicate the VWC measured in the soil at the same time. Red lines show different slopes obtained when considering different values.
An example of the increase in radon activity concentration measured by Autoflux's AG during a typical 1h accumulation period for a single flux measurement is shown in Fig. 5. It is evident that the first two values after the chamber closes (0 and 1 in Fig. 5) do not follow the expected theoretical linear increase from Eq. (10). Including these values in the slope calculation could lead to an underestimation of the flux. To better understand the process going on within the drum during a measurement, it is important to note that the 10 min AG data are representative of the mean radon activity concentration measured over that period, and that the timestamp assigned to each recorded value is at the end of each measurement period. Consequently, the first output value after the chamber is closed (0 in Fig. 5) actually represents the mean radon concentration measured over the 10 min period leading up to the point of closure. This value has therefore not been considered for the experimental linear fit analysis.
A box model (Eqs. 15, 16 and 17 and Fig. S8 of the Supplement) can be used to better understand the behavior of radon activity concentrations in the Autoflux system during the hour of accumulation. Figure S8 shows the three main volumes of the system: VAG is the AlphaGUARD detection volume, VD is the drum (accumulation chamber) volume and Vu is the total volume of all tubing (Vtubes) plus the thoron delay volume (VTh). The change in radon concentration with time in each volume of the system components can be described by the following set of differential equations:
Equations (15), (16) and (17) do not take into account the decay of the radon within these volumes because it will be negligible during the 1h accumulation experiment length. Figure S9 of the Supplement shows the theoretical increase of radon concentration with time in each of the respective volumes CD (drum concentration), Cu (concentration in thoron delay and tubes) and CAG (concentration in the AG) during the first hour of system closure, obtained through the analytical solution of Eqs. (15), (16) and (17) with the software Mathematica (Wolfram Mathematica). The observed increase in radon within the AG becomes parallel to the radon increase within the accumulation chamber only after 700 s (≈ 12 min). Therefore, the second value measured by the AG after the accumulation volume is closed (point 1 in Fig. 5) also cannot be considered as part of the experimental linear fit analysis due to the system response time delay.
Looking at Fig. 5, the slope of the experimental data (black dotted line) during the accumulation hour, ignoring the first two points (0 and 1) for the reasons mentioned above, gives a radon flux of (1899 ± 60) mBq m−2 s−1 according to Eq. (10), where the associated uncertainty is calculated from the residual standard error (rse) of the linear fit. These data were measured with a mean volumetric water content wV of 0.025 m3 m−3, equal to a soil water saturation ws = 0.069 m3 m−3 that, according to Eqs. (1) and (11), gives a theoretical radon flux of (1974 ± 277) mBq m−2 s−1. Finally, the experimental data (dotted black line in Fig. 5) were fitted with theoretical data (dotted blue line in Fig. 5) obtained by solving differential Eqs. (15), (16) and (17) with a radon flux of about (FTh_AF = 1871 ± 187) mBq m−2 s−1, where the uncertainty of 10 % (k = 1) is due to the volume estimations and flow variability during the accumulation hour. All of these results are consistent if the associated uncertainties are taken into account and support the understanding of the system response.
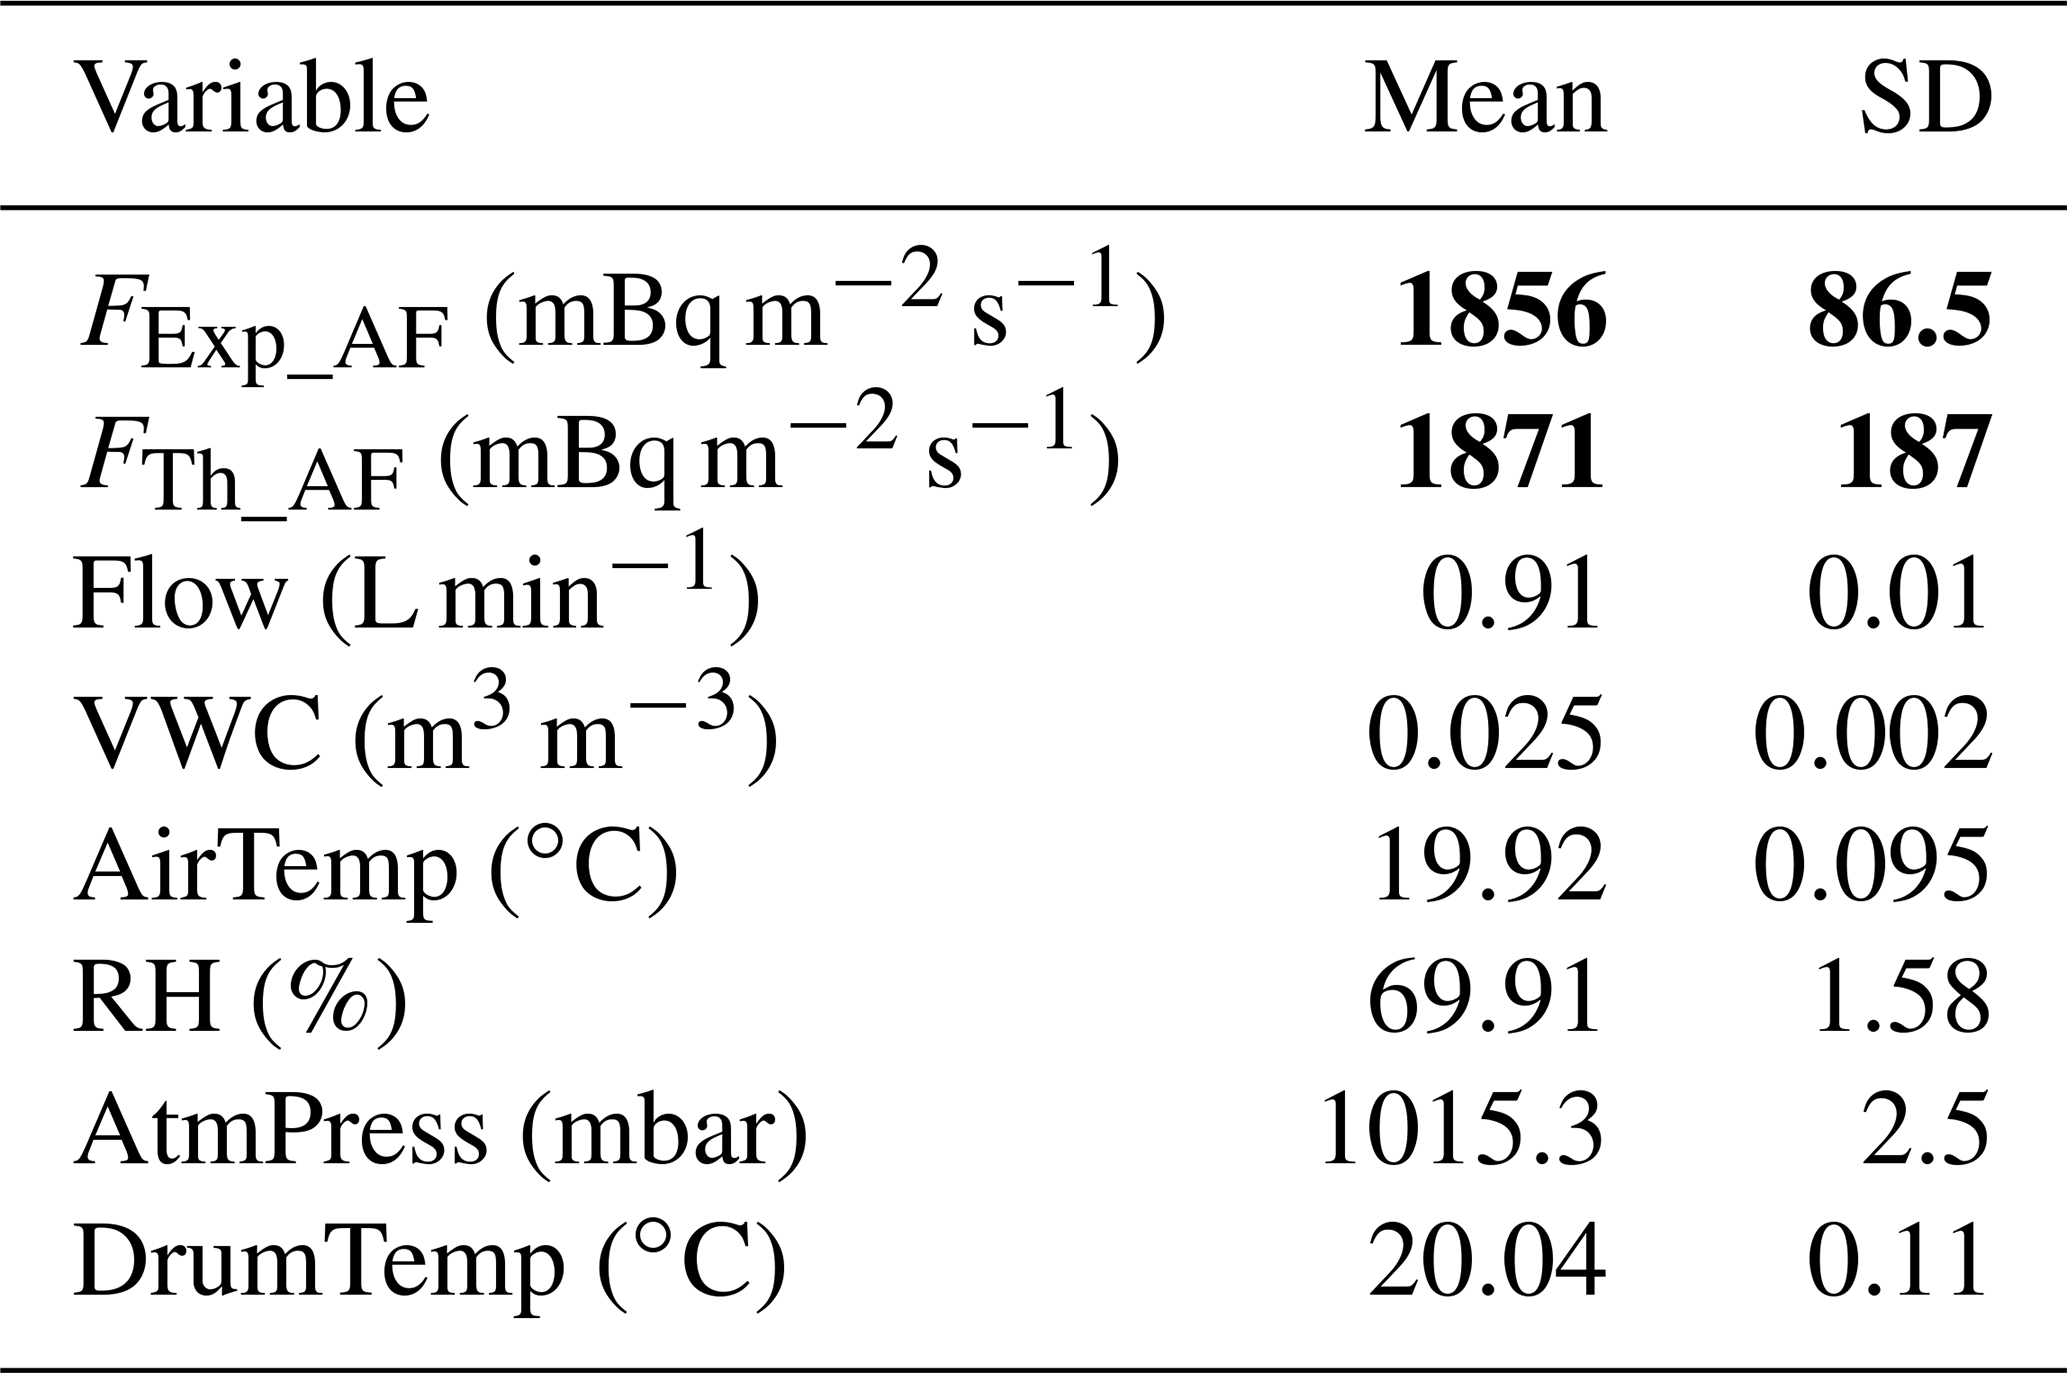
Radon concentration time series obtained by exposing the Autoflux system to the UC EB facility (Experiments I and II in Fig. 4) were analyzed, and Eq. (10) was used to calculate the radon fluxes for each measurement using only points 2, 3, 4, 5 and 6 of the accumulation phase. This resulted in a mean radon flux of FExp_AF = 1856 mBq m−2 s−1 with a standard deviation of σAutoflux = 86.5 mBq m−2 s−1 over a total of n = 58 radon flux measurements. The error of the mean of the flux measured experimentally by the Autoflux monitor will be = 11.4 mBq m−2 s−1. All results are consistent within their respective uncertainties. Finally, Table 3 summarizes the mean radon flux measured by the Autoflux system during experiments I and II at the UC EB facility in October 2021. The means and standard deviations of the variables measured by the Autoflux environmental sensors are also reported.
Table 3Results of 222Rn fluxes and environmental parameters calculated and/or measured using the Autoflux system during experiments I and II carried out at the UC facility in October 2021 (values in bold font have been calculated using Eqs. 10 and 15–17).
Considering the agreement between the theoretical and experimental results of the mean radon flux values obtained directly from the EB (FTh_EB and FExp_EB) or using Autoflux on the EB (FTh_AF and FExp_AF), the calibration factor of the Autoflux monitor can be now calculated as = 0.95. The uncertainty of the calibration factor uCal_Autoflux = 0.07 is calculated following the “Guide to the Expression of Uncertainty in Measurement” (JCGM 100) by Eq. (18):
It should be noted that FExp_EB and FExp_AF were measured within a 1 % of variability of the water saturation condition of the emanating soil, which could induce up to a 6 % of variability on the measured flux. This possible variability should be considered within the calculation of the uncertainty of the calibration factor of the transfer standard monitor, including a correction factor FCorr = 1 with un uncertainty uF_Corr = 0.06.
3.3 Calibration of the INTE_Flux system using the TS and the EB facility
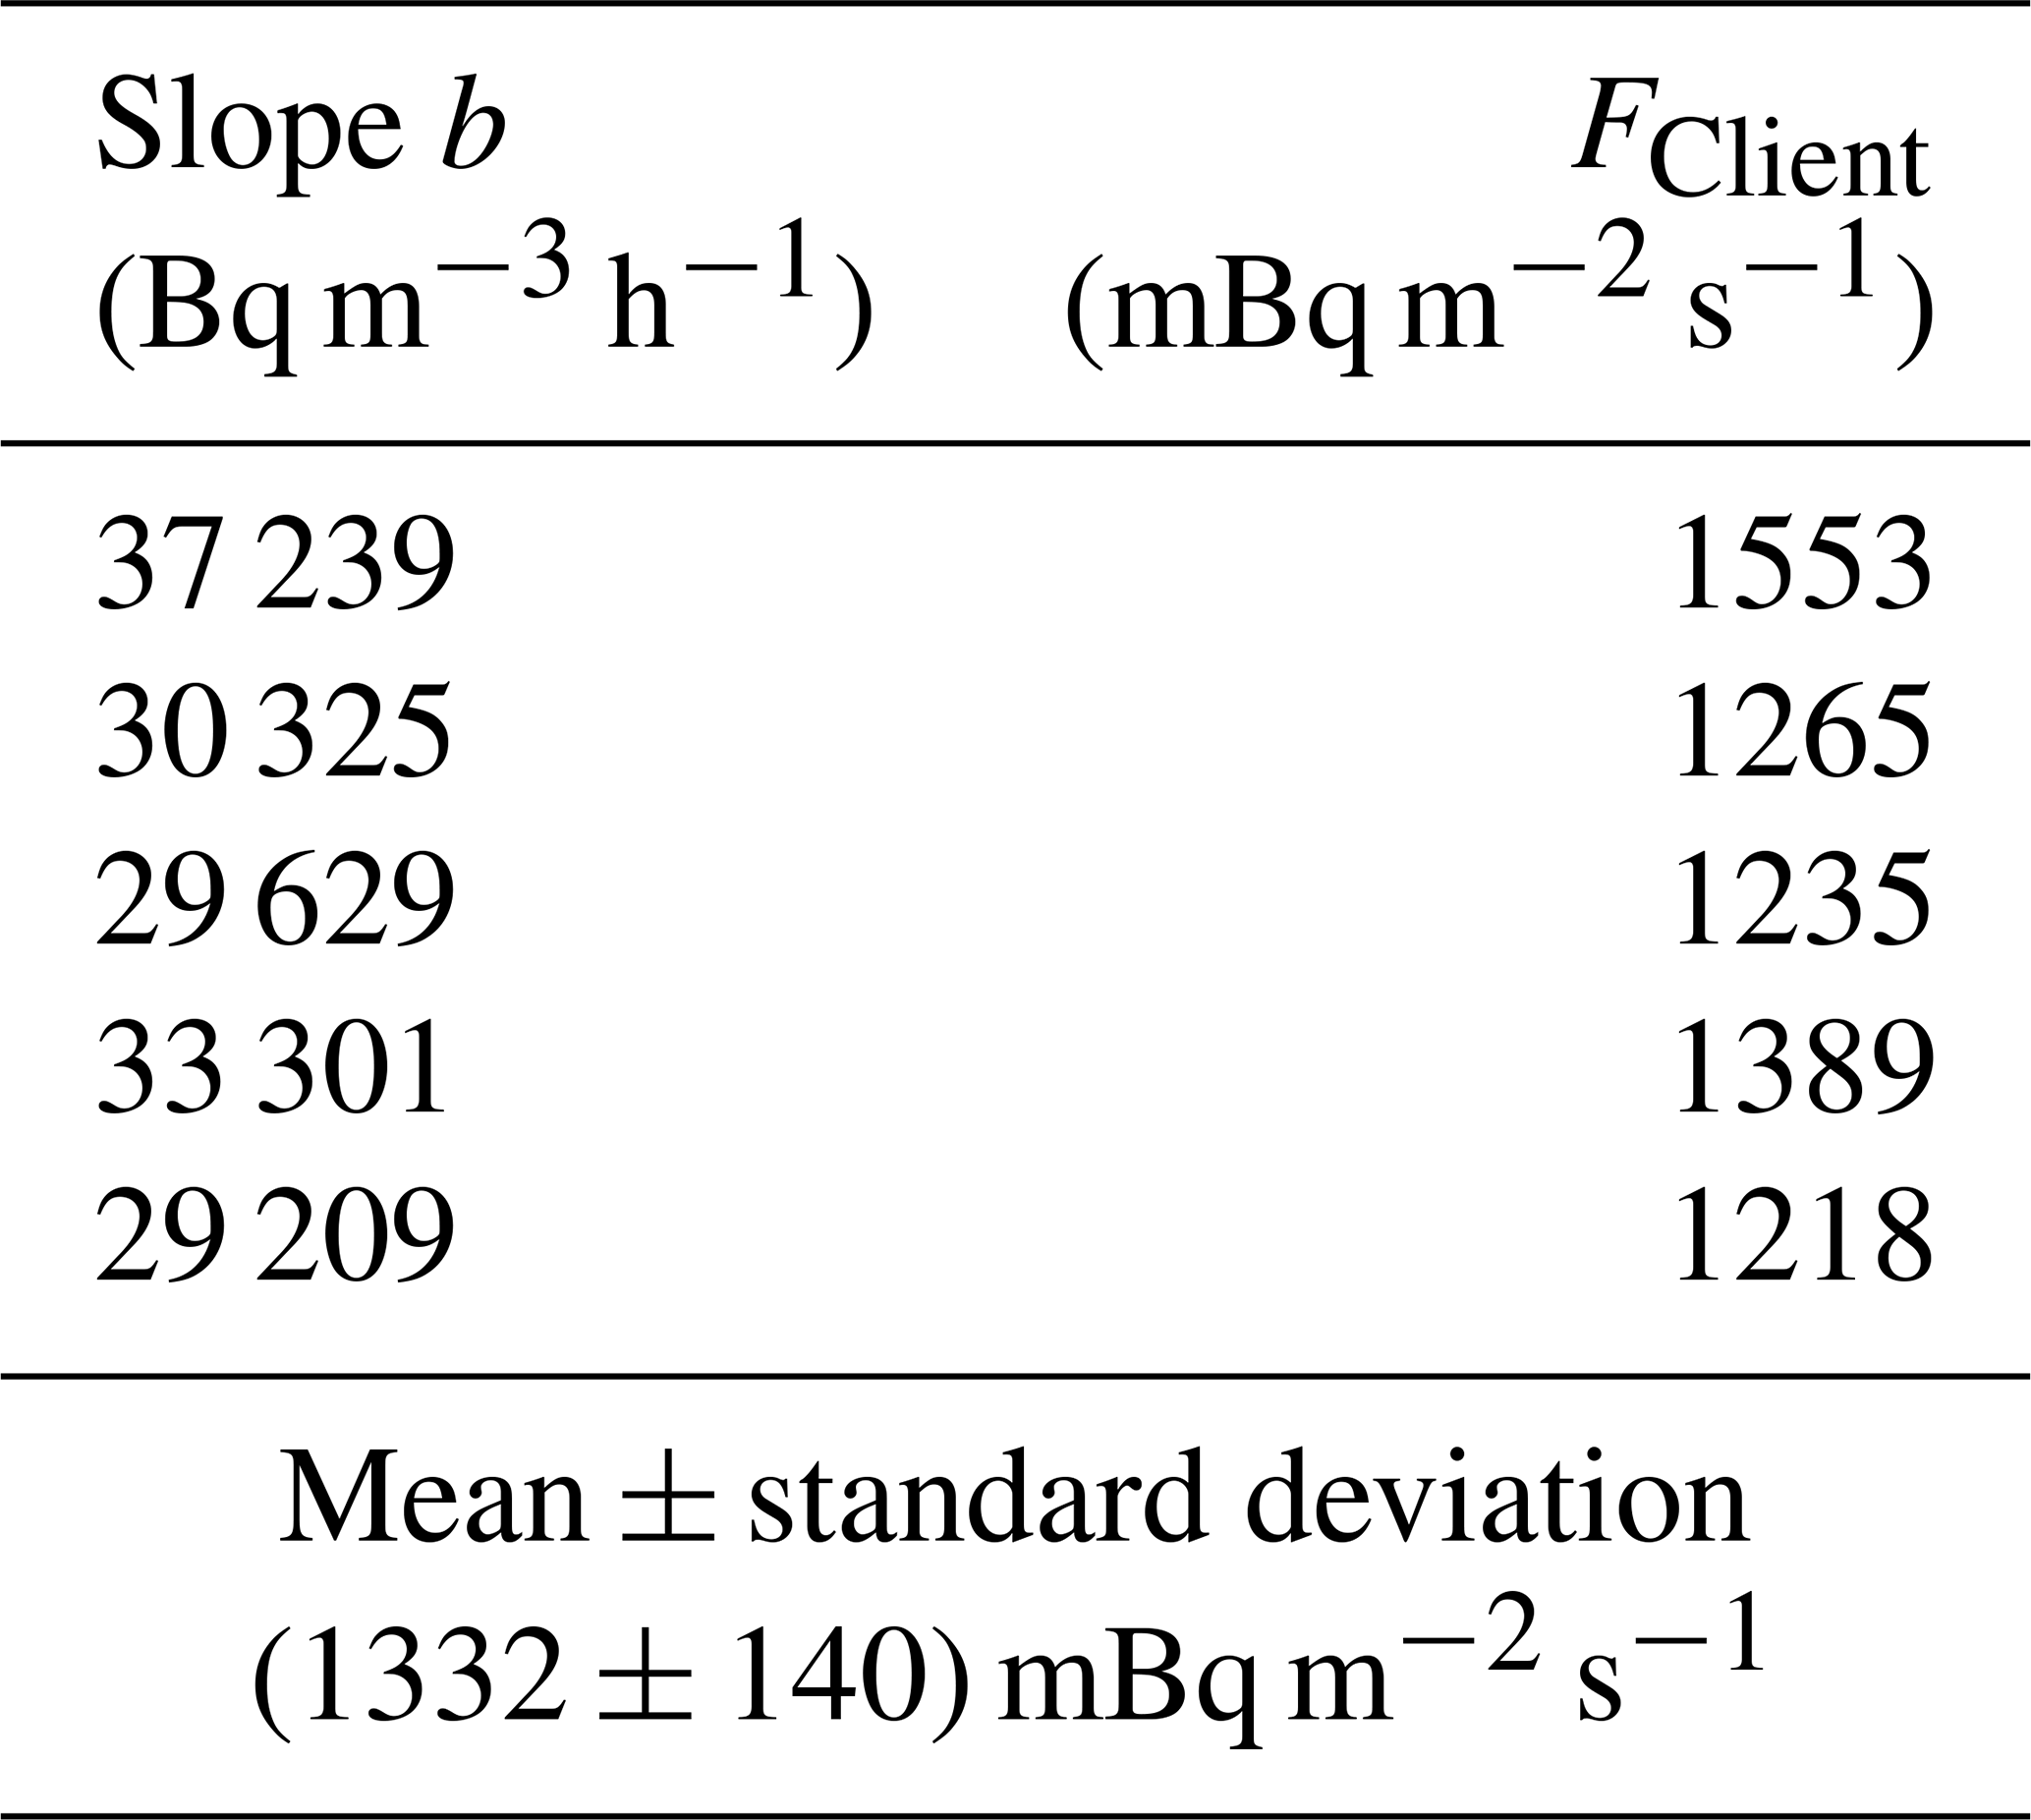
The upper panel of Fig. 6 shows the radon concentration time series measured at the same time by the DOSEman included within the accumulation chamber of the INTE_Flux system and by the AG used for the Autoflux system. The slope b in Eq. (10) can be calculated for each radon accumulation period of the INTE_Flux, and it has been reported in Table 4, together with the radon fluxes measured by the INTE_Flux when a nominal heff = 0.15 m is applied. The mean value of the radon flux calculated using the INTE_Flux system was FClient = 1332 mBq m−2 s−1, with a standard deviation of σClient = 140 mBq m−2 s−1 and the standard error of the mean = 63 mBq m−2 s−1, where n = 5, the number of radon flux measurements carried out with the INTE_Flux system. The mean of the radon flux measured by the TS instrument (Autoflux) during the same period was FRef = 1868 mBq m−2 s−1, with a standard deviation of σRef = 137 mBq m−2 s−1 and a standard error of the mean uRef = 39.5 mBq m−2 s−1 (nRef = 12). The calibration factor of the INTE_Flux system can be estimated as = 1.33, where represents the calibrated radon flux value obtained by the ANSTO Autoflux system over the experiment.
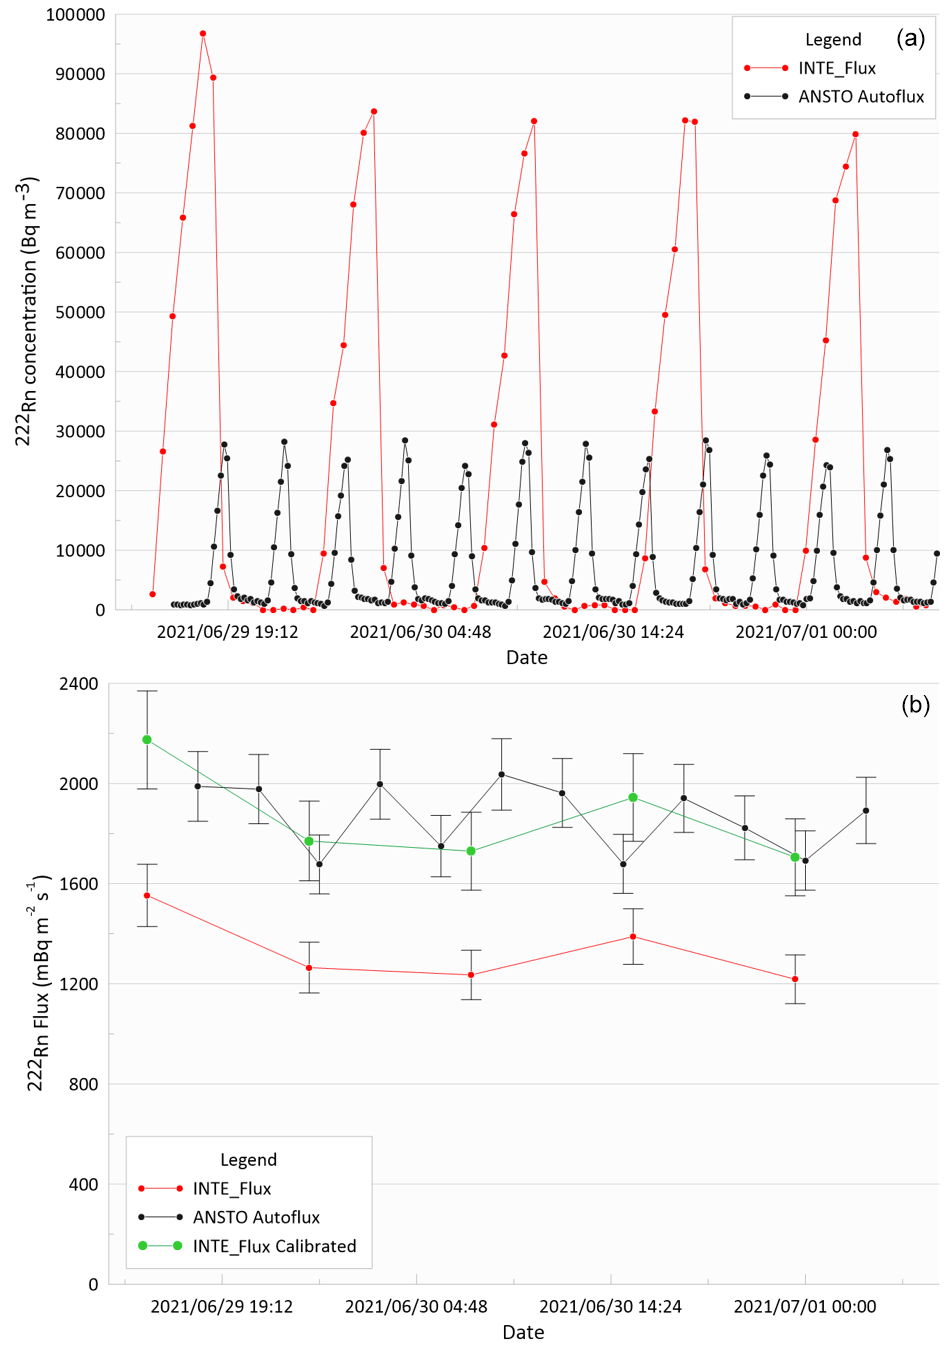
Figure 6(a) Time series of radon concentrations measured by the DOSEman (output each 30 min) in the INTE_Flux system accumulation chamber and by the AG (output each 10 min) used for Autoflux on the EB facility of the University of Cantabria during the accumulation and ventilation phases of both instruments. (b) Time series of the radon fluxes obtained with the Autoflux system (dotted black line) by the INTE_Flux system (Client) before the calibration factor being applied (dotted red line) and after its application (dotted green line).
Table 4Slope and fluxes obtained by Eq. (10) for the INTE_Flux system.
To estimate the total uncertainty uCal of the calibration factor FCal in agreement with the “Guide to the Expression of Uncertainty in Measurement” (JCGM 100) was used in Eq. 19:
Thus, the calibration factor FCal value will be obtained with a total associated uncertainty equal to uCal = 0.12, which corresponds to 9 % of the calibration factor. To ensure a confidence level of 95 %, the Welch–Satterthwaite equation was used to calculate an approximation to the effective degrees of freedom of the uCal variable and to select the corresponding Student t coverage factor. A total expanded uncertainty UCal = 0.24 (k = 2) was calculated.
3.4 Short field comparison between TS, INTE_Flux and modeled radon fluxes
The calibrated Autoflux and INTE_Flux systems were used during two intercomparison campaigns presented by Rábago et al. (2022). Figure 7 shows time series of radon concentrations measured within both systems at a low radium content area campaign between 23 and 28 October 2021 in Esles, Santa María de Cayón, Spain (lat 43.28, long −3.80). Time series of measured VWC and drum temperature from Autoflux are also shown. It can be noted that temperature cycles are mostly related with day/night atmospheric conditions where the soil moisture shows a generally decreasing trend over the duration of the campaign. The reader should take into account that the higher radon concentrations measured by the INTE_Flux system are inversely proportional to its smaller volume.
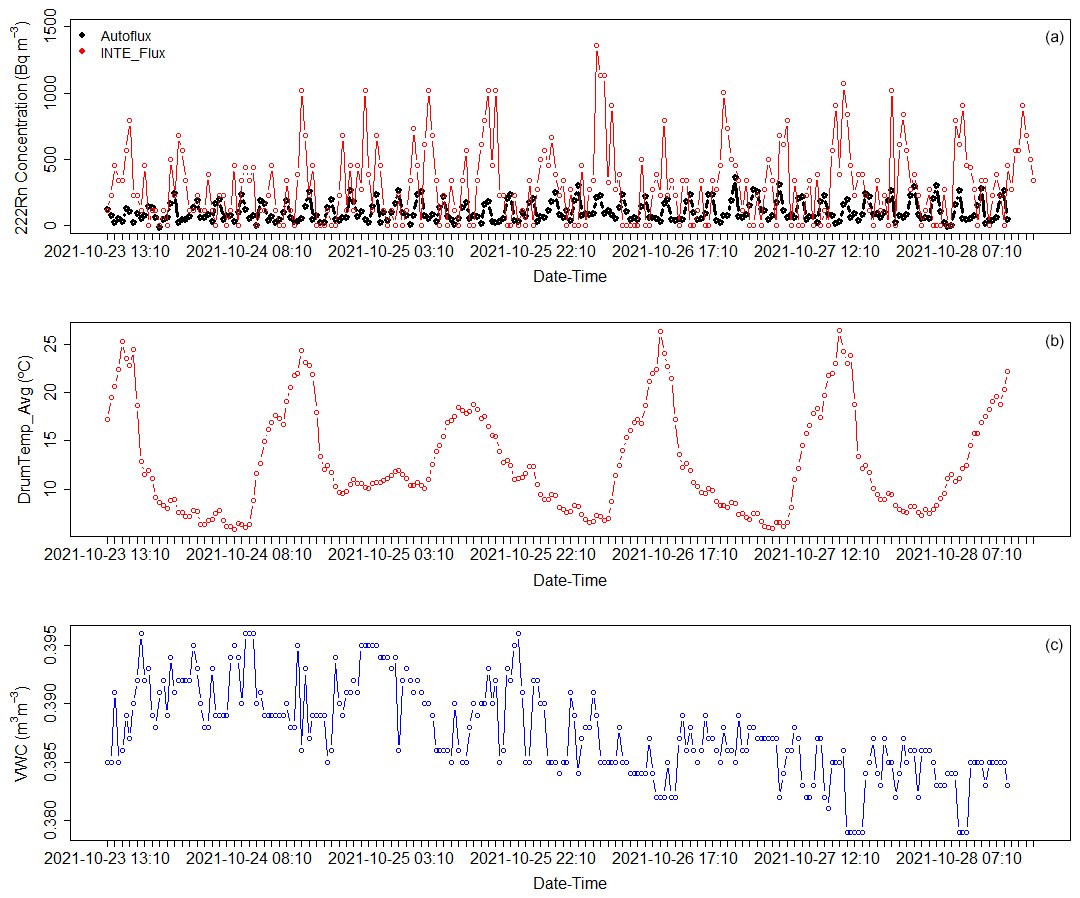
Figure 7(a) Time series of radon concentrations measured by Autoflux's AG every 10 min (dotted black line) and the INTE_Flux's DOSEman every 30 min (dotted red line), (b) drum temperature (dotted red line) and (c) VWC (dotted black line) measured by Autoflux sensors.
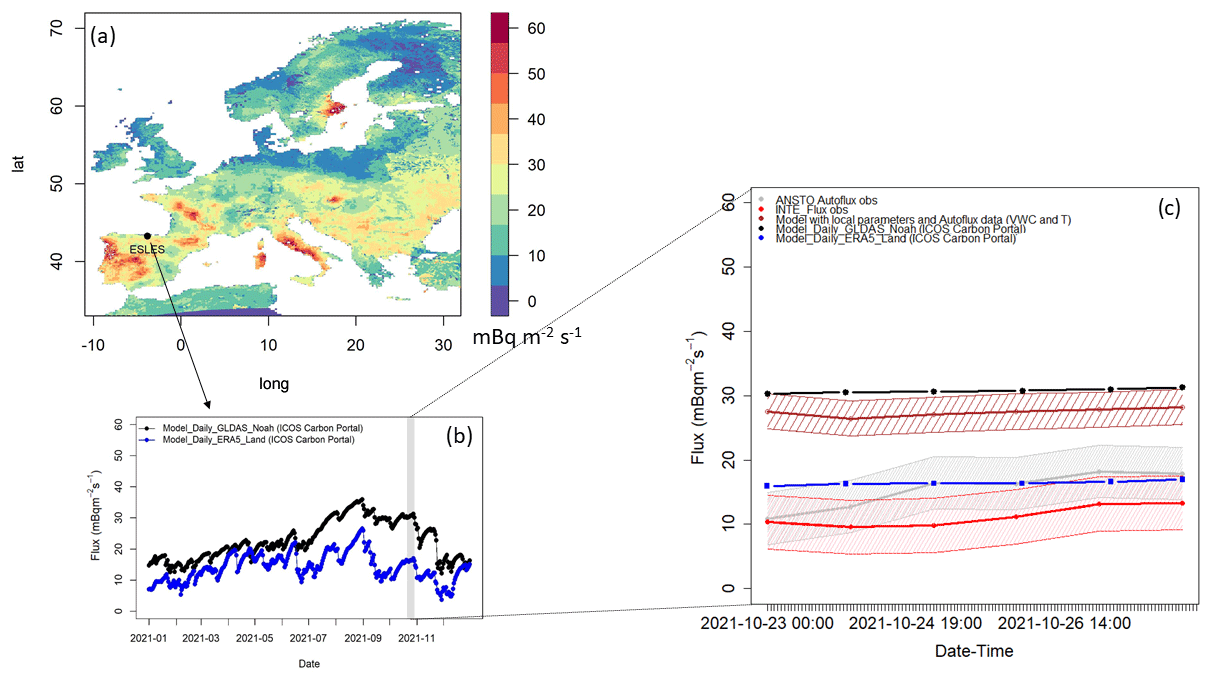
Figure 8(a) Radon flux map for Europe for October 2021 based on GLDAS_Noah reanalysis data and Esles location. (b) Time series of daily radon fluxes for 2021 modeled using GLDAS_Noah (black dots) and ERA5-Land (blue dots) reanalysis data at Esles coordinates. (c) Daily fluxes and standard deviations of Autoflux observations (dotted black line), INTE_Flux observations (dotted red line), model based on measurements (dotted brown line), model based on ERA5-Land reanalysis (dotted orange line) and GLDAS_Noah reanalysis (dotted blue line).
Daily mean radon fluxes measured by the Autoflux and INTE_Flux systems throughout the campaign are shown in Fig. 8c together with the following.
- i.
Data from the traceRadon daily radon flux maps for Europe 2021 (Fig. 8a) based on ERA5-Land and on GLDAS_Noah v2.1 soil moisture reanalysis data (Fig. 8b), respectively, are available at the ICOS Carbon Portal (Karstens and Levin, 2022b). Radon fluxes are calculated following Karstens et al. (2015) and including the calculation of the emanation factor proposed by Zhuo et al. (2008) but taking into account only half of the temperature influence ( in Eq. 12). The soil uranium content and the soil proprieties needed to apply Eq. (1) within these maps were extracted by EANR (European Commission, 2020) and ESDB (Hiederer, 2013), respectively.
- ii.
Radon fluxes are calculated by applying the model by Karstens et al. (2015) and the complete emanation factor proposed by Zhuo et al. (2008) with soil temperature and soil moisture values measured by Autoflux sensors during the measurement campaign. The uranium content of the soil and soil parameters to apply Eq. (1) were directly measured in the laboratory on soil samples extracted at the measurement site.
It can be observed that radon fluxes measured by the two calibrated systems are in agreement during the field measurements, and they increase throughout the campaign in accordance with the decrease in soil water content (Fig. 7c). Output of the model based on ERA5-Land and GLDAS_Noah data do not show any increase over the measurement period. Radon fluxes modeled using GLDAS_Noah reanalysis data or local measured parameters seem to be twice as high as experimental values and ERA5-Land radon-flux-based data. This might be related to a better estimation of the ERA5-Land soil water content and to an underestimation of the soil water content measured by the one-point sensor of Autoflux and of the GLDAS_Noah data for these days.
Reliable long-term radon flux observations are important to validate radon flux maps used for radiation protection and climate goals.
In the present study a new automatic radon flux system, which allows 3-hourly measurement of radon fluxes together with environmental parameters in the soil and ambient air, has been characterized and calibrated for being used as a transfer standard to enable traceable radon flux measurements. This was done using a bespoke exhalation bed built and characterized for this purpose. The new radon flux system (Autoflux) was then used to calibrate a second radon flux monitor (INTE_Flux). Both calibrated monitors were tested during a short in situ measurement campaign, and results were compared with ones obtained from available radon flux maps using soil proprieties from European datasets (traceRadon daily radon flux maps for Europe 2021 based on ERA5-Land and on GLDAS_Noah v2.1 soil moisture reanalysis data, respectively, available at the ICOS Carbon Portal) or local measurements.
The exhalation bed, designed and built as primary standard, was characterized both theoretically and experimentally to check its reliability and to better understand how the variability of some soil conditions, such as the water content, could influence the measured radon exhalation. The experimental approach allows a significant reduction of the uncertainty of the radon exhalation rate.
Based on the results so far, the automatic Autoflux system appears to be a reasonable option for a transfer standard; however, further studies of this kind should be carried out at lower reference radon exhalation rates (in the order of tens mBq m−2 s−1) and under extreme environmental conditions of soil moisture and temperature to better understand subdaily timescale variability of measured fluxes and to quantify the increase of the total flux value uncertainty for these cases. In addition, the Autoflux system, for low radon flux soils, may be used with a continuous radon monitor with a faster response and a higher sensitivity to allow us to observe the linear increase of the radon concentration within the accumulation chamber with the smallest possible standard deviation.
Daily radon flux observations during the short field intercomparison campaign carried out in northern Spain from the two calibrated systems are coherent within their daily standard deviations and in agreement with the daily radon fluxes modeled using ERA5-Land reanalysis. Daily radon fluxes modeled using local measured parameters and variable or GLDAS_Noah reanalysis data show higher values. This last result shows the importance of validating the input parameters (porosity, bulk density, etc.) and variables (i.e., volumetric water content and temperature in the soil) used within the model and to perform long-term measurements at different soils and under different meteorological conditions.
The data and the codes from this study are available from the corresponding author and at the following link: https://github.com/ClauGro/GRL_Data (last access: 30 May 2023; https://doi.org/10.5281/zenodo.7331337, Grossi, 2022). Scripts of the software R v. 3.6.2 (with RStudio) and Python v. 3.8 (with Spyder) were used and are also shared in the GitHub repository.
The supplement related to this article is available online at: https://doi.org/10.5194/amt-16-2655-2023-supplement.
CG, DR, SC, RC and AV led the data analysis and the writing of the paper. DR, CS and LQ carried out the literature study and the design, building and characterization of the exhalation bed facility. PPSO and EF led the literature study of the radon flux systems. CG, AV and DR carried out the experimental and theoretical characterization of the Autoflux system. All authors participated in the discussion of the results and the writing of the paper.
The contact author has declared that none of the authors has any competing interests.
Publisher’s note: Copernicus Publications remains neutral with regard to jurisdictional claims in published maps and institutional affiliations.
This article is part of the special issue “Outcomes of the traceRadon project: radon metrology for use in climate change observation and radiation protection at the environmental level”. It is a result of the 19ENV01 traceRadon project (June 2020–May 2023).
The authors want to thank the work of Sylvester Werczynski, previously employed at ANSTO, who worked on the design and control software of the Autoflux system, and of Ute Kartsens, who made available the radon fluxes model data.
This research has been supported by the European Metrology Programme for Innovation and Research (grant no. 19ENV01 traceRadon).
This paper was edited by Hartwig Harder and reviewed by two anonymous referees.
Altic, N. A.: Pilot study report for radon exhalation measurements, Oak Ridge Associated Universities, Tennessee, dcn: 2052-TR-41-0(RFTA 11-016), 2014.
Baskaran, M.: Radon: A tracer for geological, geophysical and geochemical studies, Springer, Detroit, USA, https://doi.org/10.1007/978-3-319-21329-3, 2016.
Celaya González, S., Rábago Gómez, D., Fuente Merino, I., Quindós López, L., Bon Carreras, N., Valero Castell, M. T., Gutierrez Villanueva, J. L., and Sainz Fernández, C.: A simple national intercomparison of radon in water, Radiat. Prot. Dosim., 181, 343–349, 2018.
Chambers, S. D., Galeriu, D., Williams, A. G., Melintescu, A., Griffiths, A. D., Crawford, J., Dyer, L., Duma, M., and Zorila, B.: Atmospheric stability effects on potential radiological releases at a nuclear research facility in Romania: Characterising the atmospheric mixing state, J. Environ. Radioactiv., 154, 68–82, https://doi.org/10.1016/j.jenvrad.2016.01.010, 2016.
Chambers, S. D., Preunkert, S., Weller, R., Hong, S.-B., Humphries, R. S., Tositti, L., Angot, H., Legrand, M., Williams, A. G., Griffiths, A. D., Crawford, J., Simmons, J., Choi, T. J., Krummel, P. B., Molloy, S., Loh, Z., Galbally, I., Wilson, S., Magand, O., Sprovieri, F., Pirrone, N., and Dommergue, A.: Characterizing Atmospheric Transport Pathways to Antarctica and the Remote Southern Ocean Using Radon-222, Front. Earth Sci., 6, 190, https://doi.org/10.3389/feart.2018.00190, 2018.
European Commission: European atlas of natural radiation, European Commission, Joint Research Centre, edited by: Cinelli, G., De Cort, M., and Tollefsen, T., Publications Office of the European Union, https://doi.org/10.2760/46388, 2020.
Fuente, M., Rabago, D., Herrera, S., Quindos, L., Fuente, I., Foley, M., and Sainz, C.: Performance of radon monitors in a purpose-built radon chamber, J. Radiol. Prot., 38, 1111, https://doi.org/10.1088/1361-6498/aad969, 2018.
Grossi, C.: Characterizing the automatic radon flux Transfer Standard system Autoflux: laboratory calibration and field experiments (V 1.0), Zenodo [data set], https://doi.org/10.5281/zenodo.7331337, 2022.
Grossi, C., Vargas, A., Camacho, A., Lopez, C. I., Bolívar, J., Xia, Y., and Conen, F.: Inter-Comparison of Different Direct and Indirect Methods to Determine Radon Flux from Soil, Radiat. Meas., 46, 112–118, https://doi.org/10.1016/J.Radmeas.2010.07.021, 2011.
Grossi, C., Arnold, D., Adame, A. J., Lopez-Coto, I., Bolivar, J. P., de la Morena, B. A., and Vargas, A.: Atmospheric 222Rn concentration and source term at El Arenosillo 100 m meteorological tower in southwest Spain, Radiat. Meas., 47, 149–162, https://doi.org/10.1016/j.radmeas.2011.11.006, 2012.
Grossi, C., Vogel, F. R., Curcoll, R., Àgueda, A., Vargas, A., Rodó, X., and Morguí, J.-A.: Study of the daily and seasonal atmospheric CH4 mixing ratio variability in a rural Spanish region using 222Rn tracer, Atmos. Chem. Phys., 18, 5847–5860, https://doi.org/10.5194/acp-18-5847-2018, 2018.
Gutiérrez-Álvarez, I., Martín, J. E., Adame, J. A., Grossi, C., Vargas, A., and Bolívar, J. P.: Applicability of the closed-circuit accumulation chamber technique to measure radon surface exhalation rate under laboratory conditions, Radiat. Meas., 133, 106284, https://doi.org/10.1016/j.radmeas.2020.106284, 2020a.
Gutiérrez-Álvarez, I., Guerrero, J. L., Martín, J. E., Adame, J. A., and Bolívar, J. P.: Influence of the accumulation chamber insertion depth to measure surface radon exhalation rates, J. Hazard. Mater., 393, 122344, https://doi.org/10.1016/j.jhazmat.2020.122344, 2020b.
Hassan, N. M., Hosoda, M., Ishikawa, T., Sorimachi, A., Sahoo, S. K., Tokonami, S., and Fukushi, M.: Radon migration process and its influence factors; review, Japanese Journal of Health Physics, 44, 218–231, https://doi.org/10.5453/jhps.44.218, 2009.
Hiederer, R.: Mapping soil properties for Europe – Spatial representation of soil database attributes, Joint Research Centre, Institute for Environment and Sustainability, Publications Office, https://doi.org/10.2788/94128, 2013.
Hosoda, M., Shimo, M., Sugino, M., Furukawa, M., and Fukushi, M.: Effect of soil moisture content on radon and thoron exhalation, J. Nucl. Sci. Technol., 44, 664-672, https://doi.org/10.1080/18811248.2007.9711855, 2007.
IAEA: Measurement and Calculation of Radon Releases from Uranium Mill Tailings, IAEA-TECDOC-333, IAEA, Vienna, ISBN 92-0-101092-3, 1992.
IAEA: Soil Sampling for Environmental Contaminants, IAEA-TECDOC-1415, IAEA, Vienna, ISBN 92-0-111504-0, 2004.
IAEA: Measurement and Calculation of Radon Releases from NORM Residues, IAEA-TECDOC-77, IAEA, Vienna, ISBN 978-92-0-142610-9, 2013.
Indoria, A. K., Sharma, K. L., and Reddy, K. S.: Hydraulic properties of soil under warming climate, Climate Change and Soil Interactions, chap. 18, Elsevier Ltd., 473–508, https://doi.org/10.1016/B978-0-12-818032-7.00018-7, 2020.
ISO 61577-4:2009: Equipment for the production of reference atmospheres containing radon isotopes and their decay products (STAR), ISO, Geneva, Switzerland, ISBN 2-8318-1031-3, 2009.
Jin, Y. and Jury, W. A.: Characterizing the Dependence of Gas Diffusion Coefficient on Soil Properties, Soil Sci. Soc. Am. J., 60, 66–71, https://doi.org/10.2136/sssaj1996.03615995006000010012x, 1996.
Karstens, U. and Levin, I.: traceRadon daily radon flux map for Europe 2021 (based on ERA5-Land soil moisture), ICOS ERIC – Carbon Portal, https://hdl.handle.net/11676/NvC7D-BVXlnHtFBdUSKpNVHT, last access: 22 August 2022a.
Karstens, U. and Levin, I.: traceRadon daily radon flux map for Europe 2021 (based on GLDAS-Noah v2.1 soil moisture), ICOS ERIC – Carbon Portal, https://hdl.handle.net/11676/JoDR653JxQuqLvEwzqI2kdMw, last access: 22 August 2022b.
Karstens, U., Schwingshackl, C., Schmithüsen, D., and Levin, I.: A process-based 222radon flux map for Europe and its comparison to long-term observations, Atmos. Chem. Phys., 15, 12845–12865, https://doi.org/10.5194/acp-15-12845-2015, 2015.
Levin, I., Karstens, U., Hammer, S., DellaColetta, J., Maier, F., and Gachkivskyi, M.: Limitations of the radon tracer method (RTM) to estimate regional greenhouse gas (GHG) emissions – a case study for methane in Heidelberg, Atmos. Chem. Phys., 21, 17907–17926, https://doi.org/10.5194/acp-21-17907-2021, 2021.
López-Coto, I., Mas, J. L., Bolivar, J. P., and García-Tenorio, A.: A short-time method to measure the radon potential of porous materials, Appl. Radiat. Isotopes, 67, 133–138, https://doi.org/10.1016/j.apradiso.2008.07.015, 2009.
López-Coto, J., Mas, J. L., and Bolivar, J. P.: A 40-year retrospective European radon flux inventory including climatological variability, Atmos. Environ., 73, 22–33, https://doi.org/10.1016/j.atmosenv.2013.02.043, 2013.
McLaughlin, T.: Technical Bases And Guidance For Radon Flux Monitoring At Uranium Mill Tailing Sites, Technical report, DOE CONTRACT NO. DE-AC05-06OR23100, (RFTA 11-010) DCN 2042-TR-01-0, 2011.
Millington, R. J. and Quirk, J. P.: Permeability of porous solids, Trans. Faraday Soc., 57, 1200–1207, 1961.
Morawska, L.: Two ways of 222Rn determining the emanation coefficient, Health Phys., 57, 481–483, 1989.
Nazaroff, W. W.: Radon transport from soil to air, Rev. Geophys., 30, 137–160, https://doi.org/10.1029/92RG00055, 1992.
Onishchenko, A., Zhukovsky, M., and Bastrikov, V.: Calibration system for measuring the radon flux density, Radiat. Prot. Dosim., 164, 582–586, https://doi.org/10.1093/rpd/ncv315, 2015.
Porstendörfer, J.: Properties and behaviour of radon and thoron and their decay products in the air, J. Aerosol Sci., 25, 219–263, https://doi.org/10.1016/0021-8502(94)90077-9, 1994.
Prasad, G., Ishikawa, T., Hosoda, M., Sorimachi, A., Janik, M., Sahoo, S. K., and Uchida, S.: Estimation of radon diffusion coefficients in soil using an updated experimental system, Rev. Sci. Instrum., 83, 093503, https://doi.org/10.1063/1.4752221, 2012.
Quindos, L. S., Fernandez, P. L., and Soto, J.: A method for the measurement of the emanation factor for 222Rn in small samples of porous materials, Radiat. Prot. Dosim., 56, 171–173, 1994.
Rábago, D., Quindós, L., Vargas, V., Sainz, C., Radulescu, I., Ioan, I., Cardellini, F., Capogni, M., Celaya, S., Fuente, M., and Grossi, C.: Intercomparison of Radon Flux Monitors at Low and at High Radium Content Areas under Field Conditions, Int. J. Env. Res. Pub. He., 19, 4213, https://doi.org/10.3390/ijerph19074213, 2022.
Rogers, V. C. and Nielson, K. K.: Multiphase radon generation and transport in porous materials, Health Phys., 60, 807–815, https://doi.org/10.1097/00004032-199106000-00006, 1991.
Schery, S. D. and Wasiolek, M. A.: Radon and Thoron in the Human Environment, chap. Modeling Radon Flux from the Earth's Surface, World Scientific Publishing, Singapore, 207–217, 1998.
Schüßler, W.: Effektive Parameter zur Bestimmung des Gasaustauschs zwischen Boden und Atmosphäre, PhD thesis, Heidelberg University, Germany, 1996.
Stieff, L., Kotrappa, P., and Bigu, J.: Passive E-perm radon flux monitors for measuring undisturbed radon flux from the ground, in: Proc. International Radon Symposium, 29 September–2 October 1996, Haines City, FL, USA, American Assoc. of Radon Scientists and Technologists, 1996.
Stoulos, S., Manolopoulou, M., and Papastefanou, C.: Measurement of radon emanation factor from granular samples: effects of additives in cement, Appl. Radiat. Isotopes, 60, 49–54, https://doi.org/10.1016/j.apradiso.2003.10.004, 2004.
Szegvary, T., Conen, F., and Ciais, P.: European 222Rn inventory for applied atmospheric studies, Atmos. Environ., 43, 1536–1539, https://doi.org/10.1016/j.atmosenv.2008.11.025, 2009.
Tan, Y. and Xiao, D.: Revision for measuring the radon exhalation rate from the medium surface, IEEE T. Nucl. Sci., 58, 209–213, https://doi.org/10.1109/TNS.2010.2090897, 2011.
Tan, Y. and Xiao, D.: A novel method to measure the radon exhalation rate in only one measurement cycle, Anal. Methods, 5, 805–808, https://doi.org/10.1039/C2AY26134K, 2013.
Tan, Y., Yuan, H., Xie, Y., Liu, C., Liu, X., Fan, Z., and Kearfott, K.: No flow meter method for measuring radon exhalation from the medium surface with a ventilation chamber, Appl. Radiat. Isotopes, 166, 109328, https://doi.org/10.1016/j.apradiso.2020.109328, 2020.
UNSCEAR: Sources, effects and risks of ionizing radiation, United Nations Scientific Committee on the Effects of Atomic Radiation, New York, ISBN 92-1-142143-8, 1988.
Vargas, A., Arnold, D., Adame, J. A., Grossi, C., HernándezCeballos, M. A., and Bolívar, J. P.: Analysis of the vertical radon structure at the Spanish “El Arenosillo” tower station, J. Environ. Radioactiv., 139, 1–17, https://doi.org/10.1016/j.jenvrad.2014.09.018, 2015.
WHO: Handbook on indoor radon: a public health perspective, World Health Organization, 1–122, ISBN 9789241547673, 2009.
Yang, J., Buchsteiner, M., Salvamoser, J., Irlinger, J., Guo, Q., and Tschiersch, J.: Radon Exhalation From Soil And Its Dependence From Environmental Parameters, Radiat. Prot. Dosim., 177, 21–25, https://doi.org/10.1093/Rpd/Ncx165, 2017.
Zahorowski, W. and Whittlestone, S.: A fast portable emanometer for field measurements of radon and thoron flux, Radiat. Prot. Dosim., 67, 109–120, https://doi.org/10.1093/oxfordjournals.rpd.a031802, 1996.
Zhang, B., Liu, H., Crawford, J. H., Chen, G., Fairlie, T. D., Chambers, S., Kang, C.-H., Williams, A. G., Zhang, K., Considine, D. B., Sulprizio, M. P., and Yantosca, R. M.: Simulation of radon-222 with the GEOS-Chem global model: emissions, seasonality, and convective transport, Atmos. Chem. Phys., 21, 1861–1887, https://doi.org/10.5194/acp-21-1861-2021, 2021.
Zhuo, W., Iida, T., and Furukawa, M.: Modeling radon flux density from the Earth's surface, J. Nucl. Sci. Technol., 43, 479–482, 2006.
Zhuo, W., Guo, O., Chen, B., and Cheng, G.: Estimating the amount and distribution of radon flux density from the soil surface in China, J. Environ. Radioactiv., 99, 1143–1148, https://doi.org/10.1016/j.jenvrad.2008.01.011, 2008.