the Creative Commons Attribution 4.0 License.
the Creative Commons Attribution 4.0 License.
 | 05 Jun 2023
SMEARcore – modular data infrastructure for atmospheric measurement stations
Kristo Hõrrak
Lauri R. Ahonen
Tuomo Nieminen
Pasi P. Aalto
Pasi Kolari
Markku Kulmala
Tuukka Petäjä
Heikki Junninen
We present the SMEARcore data infrastructure framework: a collection of modular programs and processing workflows intended for measurement stations and campaigns as a real-time data analysis and management platform. SMEARcore enables new SMEAR (Station for Measuring Ecosystem–Atmosphere Relations) stations to be integrated in a way that is consistent with existing stations and transfers the existing data curation experience to the new station. It establishes robust data pipelines that allow easier diagnosis of problems. We show practical examples of how SMEARcore is utilized at operational measurement stations. This work differs from earlier similar concepts, such as those used at stations within ACTRIS (Aerosols, Clouds and Trace Gases Research Infrastructure) and ICOS (Integrated Carbon Observation System) networks, in three important aspects: firstly, by keeping all the processing under the control of the data owners; secondly, by providing tools for making data interoperable in general instead of harmonizing a particular set of instruments; and thirdly, by being extensible to new instruments. As such it is not meant as a replacement for these infrastructures but to be used in addition to them and to bring structured data curation to more measurement stations not yet using these practices.
- Article
(1634 KB) - Full-text XML
- BibTeX
- EndNote


The volume of environmental data doubles faster than every 2 years (Guo, 2017). Atmospheric composition is continuously monitored with a combination of satellite remote sensing (e.g., Drusch et al., 2012; Beamish et al., 2020) and comprehensive in situ observations (e.g., Kulmala, 2018; Petäjä et al., 2021). The data are integrated and synthesized in a suite of Earth system models (e.g., Hurrell et al., 2013; Randall et al., 2018). There are ambitions for developing a digital twin of the whole Earth system (Bauer et al., 2021), which would enable upscaling, incorporation of human actions, and taking advantage of advances in digital information technology to provide solutions for a sustainable future.
Managing the big data related to the atmosphere is a challenge. Here we place a focus on ground-based in situ atmospheric observations. In this field, recent technological advances and particularly a wide use of online atmospheric high-resolution mass spectrometry allow us to determine concentrations of trace gases and the chemical composition of atmospheric aerosol particles with unprecedented accuracy (e.g., Junninen et al., 2010; Yao et al., 2018; Wang et al., 2020). At the same time, there is a constant need for observations at a higher spatial resolution and therefore more stations that provide targeted observations for the region, e.g., to tackle specific issues related to air quality or climate change (Kulmala, 2018). More stations and instruments also mean more data. Doing as much processing as possible at the station can aid in the management of the volume of data. Modern atmospheric observations are not single observation points but are operated in a network, providing harmonized and high-quality data (Laj et al., 2020). To take full advantage of these observations, it is imperative that these systems are well defined and documented. The measurements need to be watched for measurement instrumentation, hardware malfunctions, and anomalies. Measurement systems must also be flexible and ease changes in hardware, personnel, and software as these are inevitable in practice.
On the European scale, topic-specific research infrastructures have been set up to provide harmonized observations, such as the Integrated Carbon Observation System (ICOS; Yver-Kwok et al., 2021) and Aerosols, Cloud, and Trace Gases Research Infrastructure (ACTRIS; e.g., Pandolfi et al., 2018). A global perspective is available through the World Meteorological Organization's Global Atmospheric Watch (WMO GAW; Laj et al., 2020). Comprehensive and co-located European infrastructures are endorsed by the SMEAR (Station for Measuring Ecosystem–Atmosphere Relations) concept (Hari et al., 2016; Kulmala, 2018). Such stations can be tailored to tackle different grand challenges, such as air quality (e.g., Liu et al., 2020) or climate change (Hari and Kulmala, 2005; Noe et al., 2015).
The various large-scale networks provide mutually different and network-specific standard operating procedures for the stations, ensuring harmonized end-user data in their thematic context. The journey from raw data to the data formats provided to end users is often very labor-intensive and done by different people for different instruments. Documenting the steps taken to process the raw data clearly and reproducibly is not simple. The traceability of data deteriorates further when it is used in scientific articles, where reproducibility is a known problem (Buck, 2015). Simply put, there can be no reproducibility without proper documentation of what was done. Data analysis, in this paper meaning any process from raw data to products such as end-user data or diagnostics, often lacks such rigor. Developing documented workflows for situations not covered by large-scale network protocols is a problem many stations need to solve.
We introduce SMEARcore, which aims to answer the problems of data management pertinent to both experimental campaigns and long-term measurement stations such as the SMEAR stations (Hari and Kulmala, 2005). It provides a set of modular tools for acquiring, transporting, indexing, monitoring, storing, and analyzing data. SMEARcore also provides a consistent interface to access the collected data. This enables the development of other programs on top of it or embedding the results in, for example, web pages. The interfaces also enable building small networks on top of SMEARcore directly. We illustrate the key features of SMEARcore and show that a station running SMEARcore will provide a streamlined data pipeline from the instruments, measurement computers, and databases all the way to the end user. SMEARcore features functionalities that provide station managers with real-time updates on data quality; data collection problems; and the status of instruments, measurement computers, and accessories. We store these metadata for further analysis. This allows us to automatically make calibrations and visualizations, which aid in identifying and solving problems with data collection. This standardization of operations and analysis allows us to do science faster and more reliably, and there is a continuous process of supporting metadata and documentation generation for future reference. SMEARcore provides a flexible and scalable framework that can be applied at the instrument, station, or multiple-station level.
SMEARcore has four main goals: collect raw data from disparate sources, monitor and display this process, provide access to these raw data in a common format for further analysis, and do routine analysis to aid operators. We decided to make a modular architecture, which allows us to use already-existing software solutions whenever possible. It also allows us to program on top of stable interfaces so that the modules are replaceable, and indeed our adjustments to different stations swap the implementation of modules. We hope that in the future this will also allow independent development of data infrastructures based on our interfaces.
To effectively operate and expand a network of atmospheric stations, the observations need to be supported by coherent data and document management. This is to keep the processes from observational raw data to data products as simple as possible. There seem to be no common tools for getting from measurements into well-structured data that could be widely used in the atmospheric science community. Thus, creating a consistent set of processing tools for collecting and processing station data is necessary, and in some subsets of measurements this is already being done (e.g., Mammarella et al., 2016).
Data management is more than making consistent calculations. Any system can experience errors, and a typical measurement station has many things that can go wrong. If errors are not detected, it is not possible to intervene in time and data are lost. It is critical to detect errors promptly, and that requires automation of the detection. This monitoring should watch the data transfers, computing hardware, and calculations in addition to the measurements.
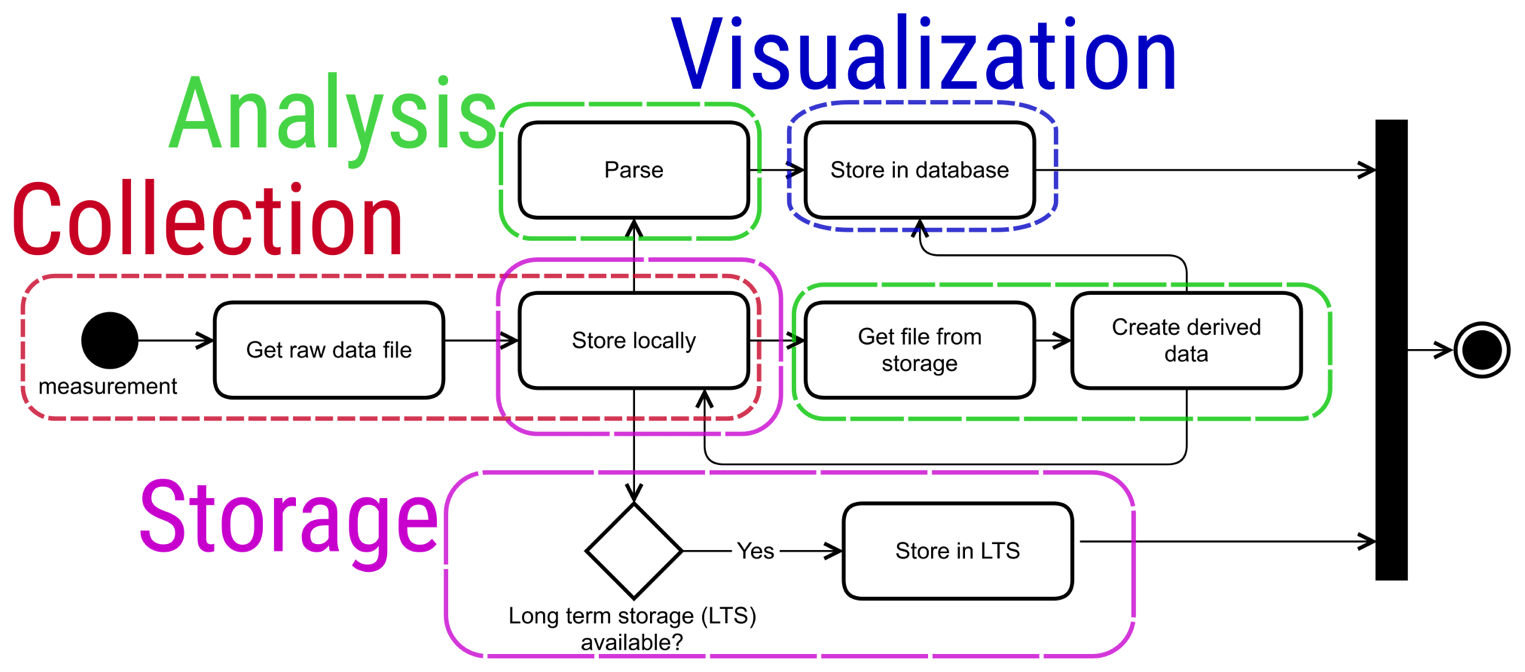
Figure 1Workflow of the processing of a raw file of time series data and creating derived data products from it. The data file is collected, parsed, and stored; then various further processing can be done to it to create derived data. The differently colored dashed boxes show which implementation part of SMEARcore is involved in each processing step. The implementation parts are explained in Sect. 3. The black-bordered boxes are steps in the workflow. The black dot on the right of the figure marks the end of the workflow.
What does one need from a station-scale solution when systemically collecting observational data? In general, the requirements can be summarized in six categories:
-
the ability to collect raw data from several measurement computers;
-
performing routine analysis that combines several measurements, such as inversions;
-
storing raw and derived data for an intermittent period for analysis and visualization;
-
displaying these data to the people conducting measurements for quality control;
-
transferring data to long-term storage as backup and vacating local space for new data;
-
logging and presenting file collection metadata.
It should be noted that within SMEARcore we assume that the raw data for the analysis are provided by a combination of sensors, instruments, and the associated data acquisition software producing a raw data file. This means we leave making these raw data files up to the data acquisition software.
A SMEARcore installation is defined by a set of computations, defined as workflows, implementing these steps for a set of instruments and analyses and the backing computational infrastructure. We will now go through some of these workflows to explain what we mean by this concept. It should be noted that the individual workflows are simple, since they are focused on a single purpose. Any complex analysis will use the results of previous workflows, and the challenge is mostly in coordinating their execution. One usually also includes checks to avoid duplicating work already done in earlier workflows, but these are omitted in this paper for clarity. The underlying technical solutions will be described in later sections of this paper.
2.1 Time series data
This is the simplest case of data processing in SMEARcore. The process is visualized in Fig. 1. We read the raw data in and provide them for visualization and long-term storage in different forms. The input data from different instruments differ mostly in how the instrument-specific raw data format should be interpreted and parsed for visualization, meaning most instruments can be handled by SMEARcore almost identically. A practical example of such a data process is acquiring the total submicron aerosol number concentration from a condensation particle counter (e.g., Mordas et al., 2008). Conceptually this dataset is a time series of parameters with native averaging from the instrument. The data streams include a timestamp, number concentration, information on the time resolution, and relevant metadata for the instrument and measurement location.
We often create derived datasets from our raw data, for example to do calibrations or calculate new variables. This is done in the workflow in Fig. 1 by having a node that uses previously collected raw data. In practice, plots and collecting several datasets for export in different formats also conform to this pattern, as they are just data products.
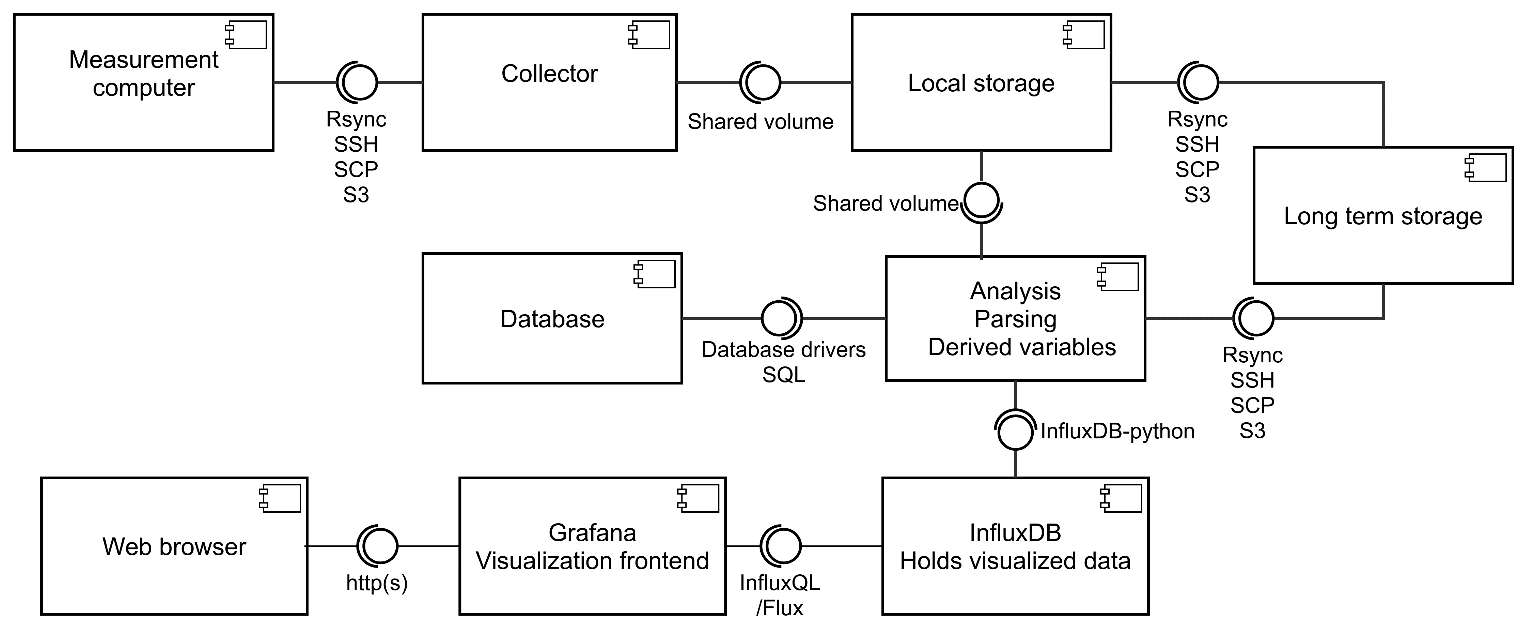
Figure 2A schematic picture of the different modules and interfaces between them in SMEARcore. The implementation within the box depends on the available hardware on the station, while the interface allows the implementation to change. For example, the analysis does not care where the data are stored if the interface allows for retrieving them. The connections with the circle and cup represent the interfaces between the components. The labels in the interface refer to the technologies currently supported in at least one of our SMEARcore installations. The technology abbreviations are hypertext transfer protocol secure (https), secure shell (SSH), secure file copy (SCP), simple storage service (S3), structured query language (SQL), and influx query language (InfluxQL). These are all protocols or languages the components use to transfer data. Rsync is the name of a file transfer program and protocol associated with it. InfluxDB is a database program, and Flux is a scripting language for it.
2.1.1 Examples of workflows
An example of producing derived datasets is the inversion of the raw data files produced by the differential mobility particle sizer (DMPS; for more details see, e.g., Aalto et al., 2001, and Kulmala et al., 2012). The DMPS selects aerosol particles based on their electrical mobility using a differential mobility analyzer (DMA). The concentration of differently sized particles is measured by a condensation particle counter (CPC). Therefore, the primary data measured by a DMPS are particle concentration from the CPC at different operating voltages of the DMA, and the voltages need to be converted into a size range. The auxiliary data (various flow rates, pressures, and temperatures) which are needed for this inversion are usually stored in the same raw data file (for more details on the inversion process of DMPS raw data, see, e.g., Kulmala et al., 2012). This means the required procedure corresponds to the workflow in Fig. 1, with the inversion function handling the processing node. Section 3 explains how the various parts are implemented in SMEARcore.
Another similar, independent, workflow is the processing of flux data from eddy-covariance (EC) measurements. The EC is a technique which uses high-frequency measurements of wind and atmospheric variables (e.g., CO2, H2O or particle concentrations) for calculating vertical turbulent fluxes between atmosphere and Earth surface. The collected data files are 10 Hz raw measurement data, and the EC flux is calculated from the covariance of the fluctuating components of vertical wind and the quantity of interest over some representative time window (typically 30 min). The EC data are further processed with the help of auxiliary meteorological data. The creation of derived data involves applying several data processing methods such as detrending, despiking, coordinate rotation, dilution correction and covariance calculations (for detailed descriptions of these methods, see Mammarella et al., 2016). Most atmospheric data processing implemented within SMEARcore can be abstracted to such branching workflows.
2.1.2 Metadata and conventions
Metadata are used to interpret data. Metadata consist of information such as measurement units, calibrations, and column names. We also create metadata about file processing, such as when files were processed, their sizes, where they were saved and what data files were combined to produce the resulting file.
There are several ways to store metadata. Some file formats such as NASA-AMES used by ACTRIS, or hierarchical data format (HDF) files store it in the data file itself. For us this would result in duplication of the metadata, and it is not well suited for file processing metadata. We store the metadata as database tables and link to files, as necessary. It is possible to export metadata from the databases to file formats when required by workflows.
In this section we describe the software and hardware used for SMEARcore. Any centralized solution needs at least three things: a server, storage space and a network connecting the computers. The server handles the computing work involved in collecting, indexing, and serving the data to end users. It also provides the platform for any data analysis tasks defined by the workflows. An overview of the system is shown in Fig. 2.
3.1 Software
SMEARcore is built mostly with Python, which is a general-purpose programming language. The choice was based on the permissive license and availability of relevant libraries for data handling and analysis. Python also allows one to call other programs via command line interfaces, which extends our available options by using analysis and processing codes written in other languages.
The entire system is packaged as Docker containers, allowing easy installation to a single server via Docker Compose or on any Kubernetes-enabled platform with a series of configuration files. Additional configuration is required to set secrets such as passwords and various routing options and select the systems' different modular components.
3.1.1 Storage
There are two kinds of storage we need. First is the local storage. This is used to store the files while they are being processed. The other is long-term storage which is used to save the files when they are not in active use. These can be on the same device or service. Long-term storage may also be completely external such as another service or offline backups. These storage options act as the repository of all the measurement data in the system.
We can use multiple backends from local disks to cloud-based S3 storage. For local installations, failure protection is a desirable feature, so setting up RAID (redundant array of independent disks) for the storage disks and a regular backup schedule are recommended.
3.1.2 Databases
Databases are used for monitoring the service itself, what files have been collected, what workflows have been run on which data files, and what was produced. They also feed time series data to the plotting software. This means the databases store the status of the station.
We use three different databases: InfluxDB is a time series database that can be integrated with visualization software and holds the time series data. PostgreSQL and MongoDB, both database programs, hold the information used to coordinate running the workflows. SQLite, which is another database program, is used in some versions to hold information about which files have been processed, but this can also be done with the other two databases. The raw data are stored in the original files and accessed on demand. This is due to a variety of formats, which are not suited for column storage, such as multidimensional fields.
3.1.3 Visualization
For online visualizations we are using Grafana (Grafana, 2022). It provides a simple web interface with multiple views that the user can customize. Multiple views allow us to get an overview of the stations' health and enable the diagnosis of specific problems by consulting the details from the interface. By default, views are configured to show the status of the measurement computers, as measured by configurable monitoring scripts, and the status of the data collection, as indexed by the SMEARcore database. The interface also allows one to set alarm levels to get a quick notification of the station status.
3.1.4 Data collection
We have currently implemented four different data collection methods for different circumstances:
-
The first is SSH (secure shell) access and rsync-based transport. This is our first choice since it allows the server to control transport, but the measurement computer needs an SSH server to allow incoming connections.
-
The second is SCP (secure file copy) transport from the measurement computer with scripted WinSCP, an SCP program.
-
The third is shared folders and scripted copying to them on the measurement computer.
-
The fourth is storage into an S3 filesystem.
Options 2–4 are similar, since the measurement computer handles transport and it is difficult to change without physically going to the computer. They are sometimes necessary due to installation limitations. All forms of transport offer security via passwords or key-based authentication. They also allow us to isolate instruments so that each has their own folders, and they cannot even accidentally overwrite other data. This provides protections from unintentional data corruption and allows easy management when instruments are changed or the people responsible change.
3.1.5 Analysis
The analysis part of the software runs on top of Apache Airflow (Airflow, 2022). This software allows us to define workflows such as calibrations and inversions based on multiple measurement files and run them on a schedule. The software also comes with visualizations of the states of the workflows and possible failures. The workflows themselves are composed of Python functions.
There is also an alternative implementation that is done by launching containers directly to do the analysis. In this case each workflow is self-contained.
3.2 Hardware
The server and storage can be co-located and thus far have been in our installations at Estonia (Noe et al., 2015), Beijing (Liu et al., 2020), and the Arctic Ocean on board RV Polarstern (AWI, 2017) during the MOSAiC (Multidisciplinary drifting Observatory for the Study of Arctic Climate) campaign (see, e.g., Krumpen et al., 2021). In these cases, both roles were fulfilled by a network-attached storage (NAS) system that supports container virtualization. In general, any computer that supports container virtualization and has enough storage can work as the server.
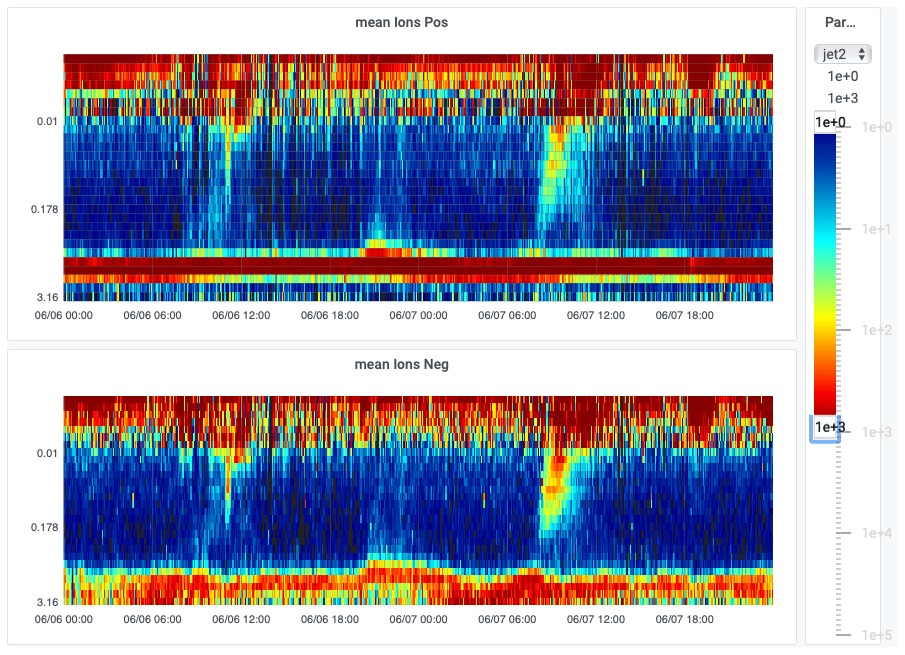
Figure 3Online visualization of the number–size distribution of positive (top panel) and negative (bottom panel) air ions measured with a Neutral cluster and Air Ion Spectrometer (NAIS) at Järvselja SMEAR station on 6–7 June 2021 (all times in the figures are local time). The y axis displays the ion mobility in units of sV cm−2 on a logarithmic scale. The color scale indicates the number concentration with units of cm−3. The user can select the period of interest and set the color scales to look at different concentration ranges as they wish.
The hardware parts can also be distributed and run on any cloud provider or external server, allowing functionality without any extra hardware at the station. However, this solution requires a robust network connection from the station. This is the case with our SMEAR III (Järvi et al., 2009) installation, where we use a cloud platform provided by CSC (the Finnish IT Center for Science).
The choice of hardware boils down to how much processing needs to be done and how many data need to be stored. It is also possible to separate the data collection and do postprocessing on any other platform as is traditionally done. One part of the hardware must be well planned, the local network infrastructure. Since the network serves as the primary way of both transporting the data and watching the station, throttling or disruptions in the network result in degradation of the service. It is possible to run the system without access to the internet, but a local network is still necessary. In practice this usually means setting up routers and a wired ethernet connection between the computers.
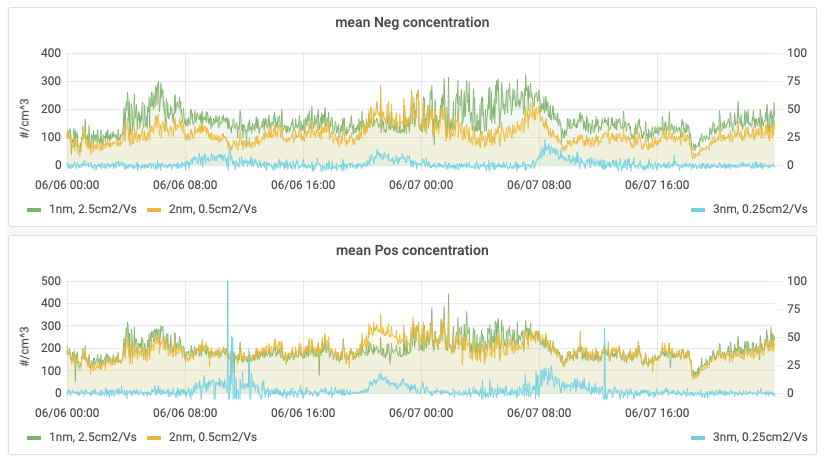
Figure 4Concentrations of atmospheric ions with 1 nm (green line) and 2 nm (yellow line) geometric mean diameter cluster ions and 3 nm (cyan line) intermediate ions measured at the Järvselja SMEAR station during 6–7 June 2021 measured by the cluster ion counter (CIC). Negative ions are shown in the top panel and positive ions in the bottom panel. The plots are linked, and the user can select any period they want from the database.
4.1 Case study: SMEAR Estonia
The first installation was for the SMEAR station in Järvselja, Estonia (Noe et al., 2015). It uses a centralized server on location and rsync agents installed on the measurement computers so that data can be pulled by the server with data collection method 1 outlined in Sect. 3.1.4. SMEARcore software containers are run on this server with Docker and are defined using Docker Compose. The data collection and parsing workflows are organized as data acquisition units (DAQs), one pair for each monitored instrument type. The pairs are coordinated using RabbitMQ message queues and a MongoDB database for persistence. SMEAR Estonia offers visualization and metadata, such as collected filenames and times, about the collection process through Grafana. There is also direct access to the collected files using sftp (secure file transfer protocol) and data transfer to off-site storage at the University of Tartu high-performance computing center.
At the SMEAR Estonia station there are currently nine instruments which are monitored by SMEARcore at two locations, a main container, and a separate measurement cottage. The instruments measure aerosol properties, meteorological parameters, and background radiation. SMEARcore is integrated with the mass spectrometer data analysis software tofTools (Junninen et al., 2010) and allows time-of-flight mass spectrometer data to be processed in near real time (once per hour). This makes it possible to present online processed data as concentrations of chemical groups rather than intensities of single peaks.
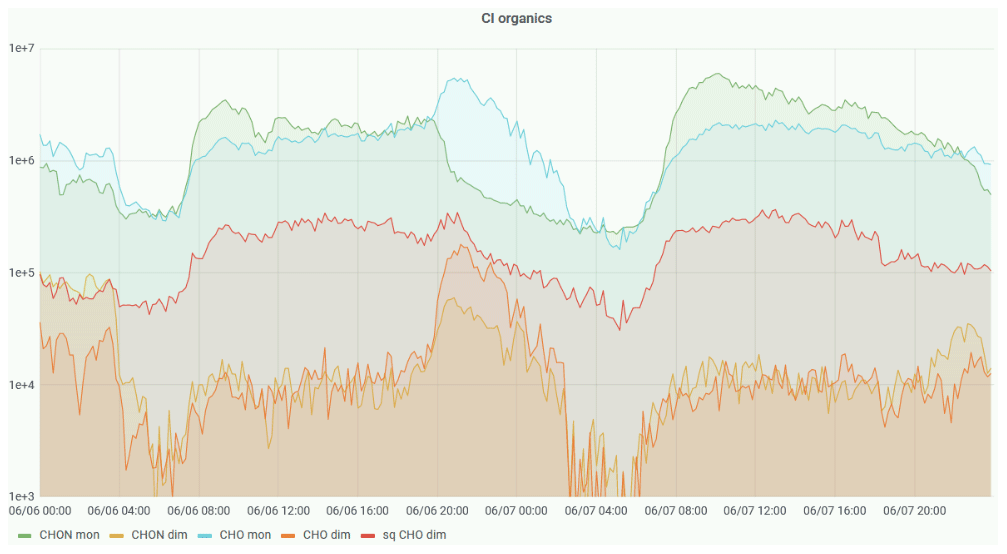
Figure 5Chemical ionization atmospheric pressure interface time-of-flight (CI-APiTOF) mass spectrometer online data of highly oxidized organic molecule (HOM) concentrations measured at the SMEAR Estonia station during 6–7 June 2021. In the legend capital letters denote chemical elements present in the molecule, “mon” denotes monomers and “dim” dimers, and the prefix “sq” denotes that HOMs are formed from sesquiterpenes. The others are formed from monoterpenes. Both sesquiterpenes and monoterpenes are volatile compounds emitted by vegetation. Inorganic acid concentrations could be presented similarly or even added to the plot by the user as needed. The processing done by SMEARcore allows showing these concentrations instead of raw counts from the instrument.
The case study is from measurements in the SMEAR Estonia station from the period 6 to 7 June 2021. The figures presented show screenshots from instrument-specific real-time dashboards. During this period, we see two daytime new particle formation (NPF) events and a nighttime clustering event at 20:00 on 6 June 2021 – 02:00 LT (local time) on 7 June 2021 (Figs. 3 and 4). The NPF events are seen in the number–size distributions measured by the Neutral cluster and Air Ion Spectrometer (NAIS) as formation of initially 2 nm air ions and their subsequent growth to larger sizes over several hours (Fig. 3). The NAIS data visualization is done with a custom plugin developed at the SMEAR station. The color map and the number concentration scale can be changed by the user for their preferred viewing experience. The concentrations of sub-2 nm cluster ions measured by the cluster ion counter (CIC) show diurnal variation, and the concentration of 3 nm ions shows a maximum during NPF events (Fig. 4). During a nighttime clustering event, the atmospheric pressure interface time-of-flight mass spectrometer (CI-APiTOF) observed a simultaneous increase in highly oxidized organic molecules (HOM) dimer concentrations (Fig. 5). Similar nighttime clustering events producing small (sub-10 nm) particles which do not grow into larger particles as in daytime NPF events have been observed also at SMEAR II station in Hyytiälä, Finland (Rose et al., 2018).
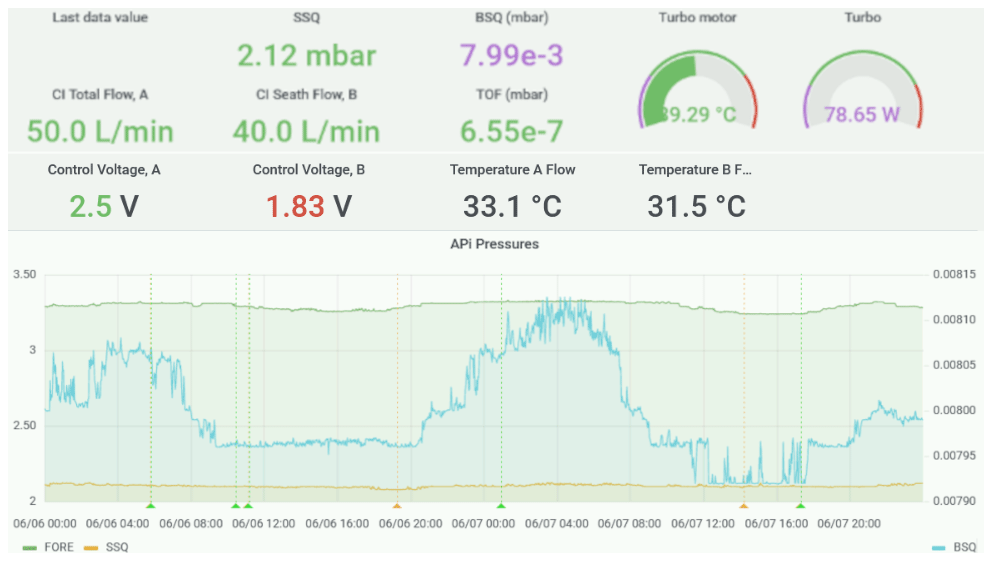
Figure 6Instrument monitoring parameters for the APiTOF are plotted online. Alerts are triggered if values are out of the operation range. The orange and green arrows in the pressure graph indicate that an alert was present.
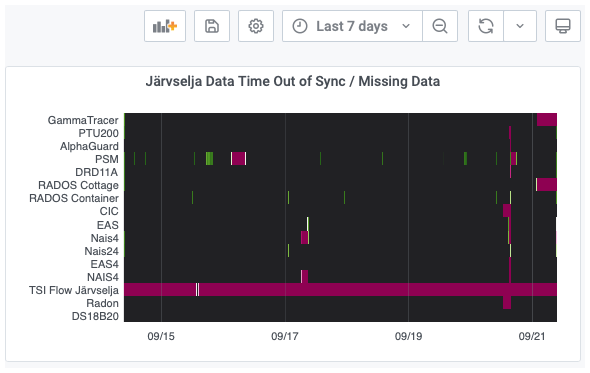
Figure 7Data-syncing statistics from several instruments. Red and green indicate missing and mistimed data, respectively. This allows for the detection of problems in the measurement and network.
4.1.1 Utilizing metadata
Figures 6 and 7 show dashboards on the instrument level and station level. An example dashboard from the CI-APiTOF mass spectrometer is shown in Fig. 6. For the instrument it is important that pressures in different chambers are in the correct range; too low pressure in the first chambers (SSQ and BSQ) indicates clogging of the orifice, and mechanical cleaning is required, while too high values again indicate malfunction of pumps, and pump maintenance is required. In the dashboard monitoring, values change colors from magenta (too low) to green (correct) to red (too high). In addition to current parameter readings, time series of pressure readings are also displayed; this helps to identify the reasons for the problem and to see when the problem surfaced. In the case of critical operational parameters, an alert is given on the screen and an email is sent to the operator.
Various auxiliary measurements can be constantly monitored to ensure the integrity of the measurement devices. Alerts call attention to abnormal readings and can be collected into figures such as Fig. 7. In this dashboard successful file readings are marked with background color, but timing problems due to slow internet or intranet speeds are marked with green color and completely missing files are marked with red. Figure 7 shows current problematic measurements, like with GammaTRACER and RADOS Cottage and longer-lasting problems like with TSI Flow Järvselja, which is not at the station, and thus the data are missing. When the instrument is fixed and brought back to the station, the status will return to normal.
In addition to measurement metadata, we collect metadata from the data collection and parsing processes themselves. Last file access times, file sizes, counts of parsed columns, and how long the parsing took are all things that are monitored. Figure 8 shows an example of how these data can be used to determine the effect of a power cut on collected data. Input voltage UPS (uninterruptible power supply) indicates if the UPS is being charged; if there is no input voltage, then the system is operated from backup power. Gaps in graphs on 12 and 13 January are the result of such a long power cut that communication with the station was also interrupted. The file size is also smaller due to limited measurement time (Fig. 8).
4.2 Case study: SMEAR III
Our newest installation is an implementation of parts of the SMEAR III (Järvi et al., 2009) data analysis. The SMEAR III station is located at the University of Helsinki Kumpula campus in Helsinki, Finland. The instruments included are the DMPS; basic meteorological instrumentation such as temperature, wind direction, and wind speed; and trace gas measurement of ozone, carbon monoxide, and nitrogen oxide. The storage backend is S3 in the CSC – IT Center for Science cloud service, with a computer simply pushing new files there as they are generated. The data are on a set retention policy, which means that old data are cleared automatically.
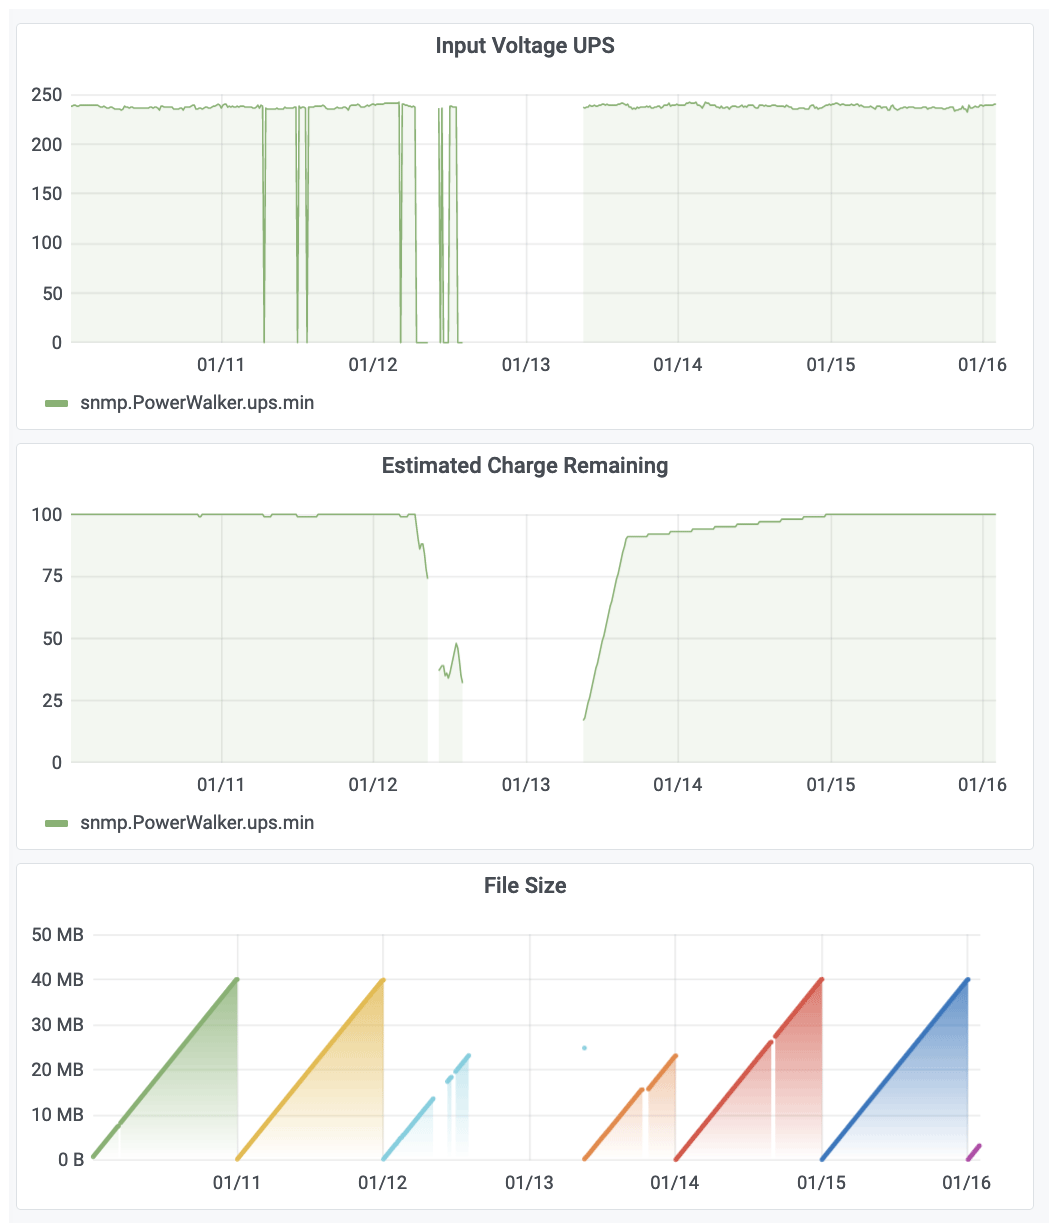
Figure 8Effects of a long power cut on data collection at the SMEAR Estonia station on 10–15 January 2021. UPS is fully discharged, and the station experienced network-related issues due to no power. The observed data file size is considerably smaller due to missing data, and this is easily diagnosed from the collected metadata.
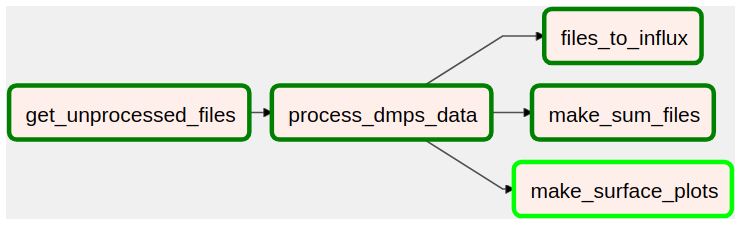
Figure 9The DMPS processing graph in Airflow. It follows the same structure as the workflow in Fig. 2. Influx refers to the database used for storing the processed data. Sum files are the processed file type, and surface plots are used for visualization. The arrows represent dependencies, and the last three tasks can be done in parallel. All files are stored in an S3 instance. Colors stand for the status of the task. In this case everything but make_surface_plots has been completed successfully, while that task is still running.
Visualization is done in Grafana, and the interface is facing the public internet, allowing the users access from predetermined remote locations. The analysis workflows in Airflow are defined by graphs. Figure 9 shows one such graph from the Airflow user interface. The analysis and visualization components are run in an OpenShift cloud service also at CSC. In this case the main design choice was enabling remote access to users, so the system could not be co-located with the measurements.
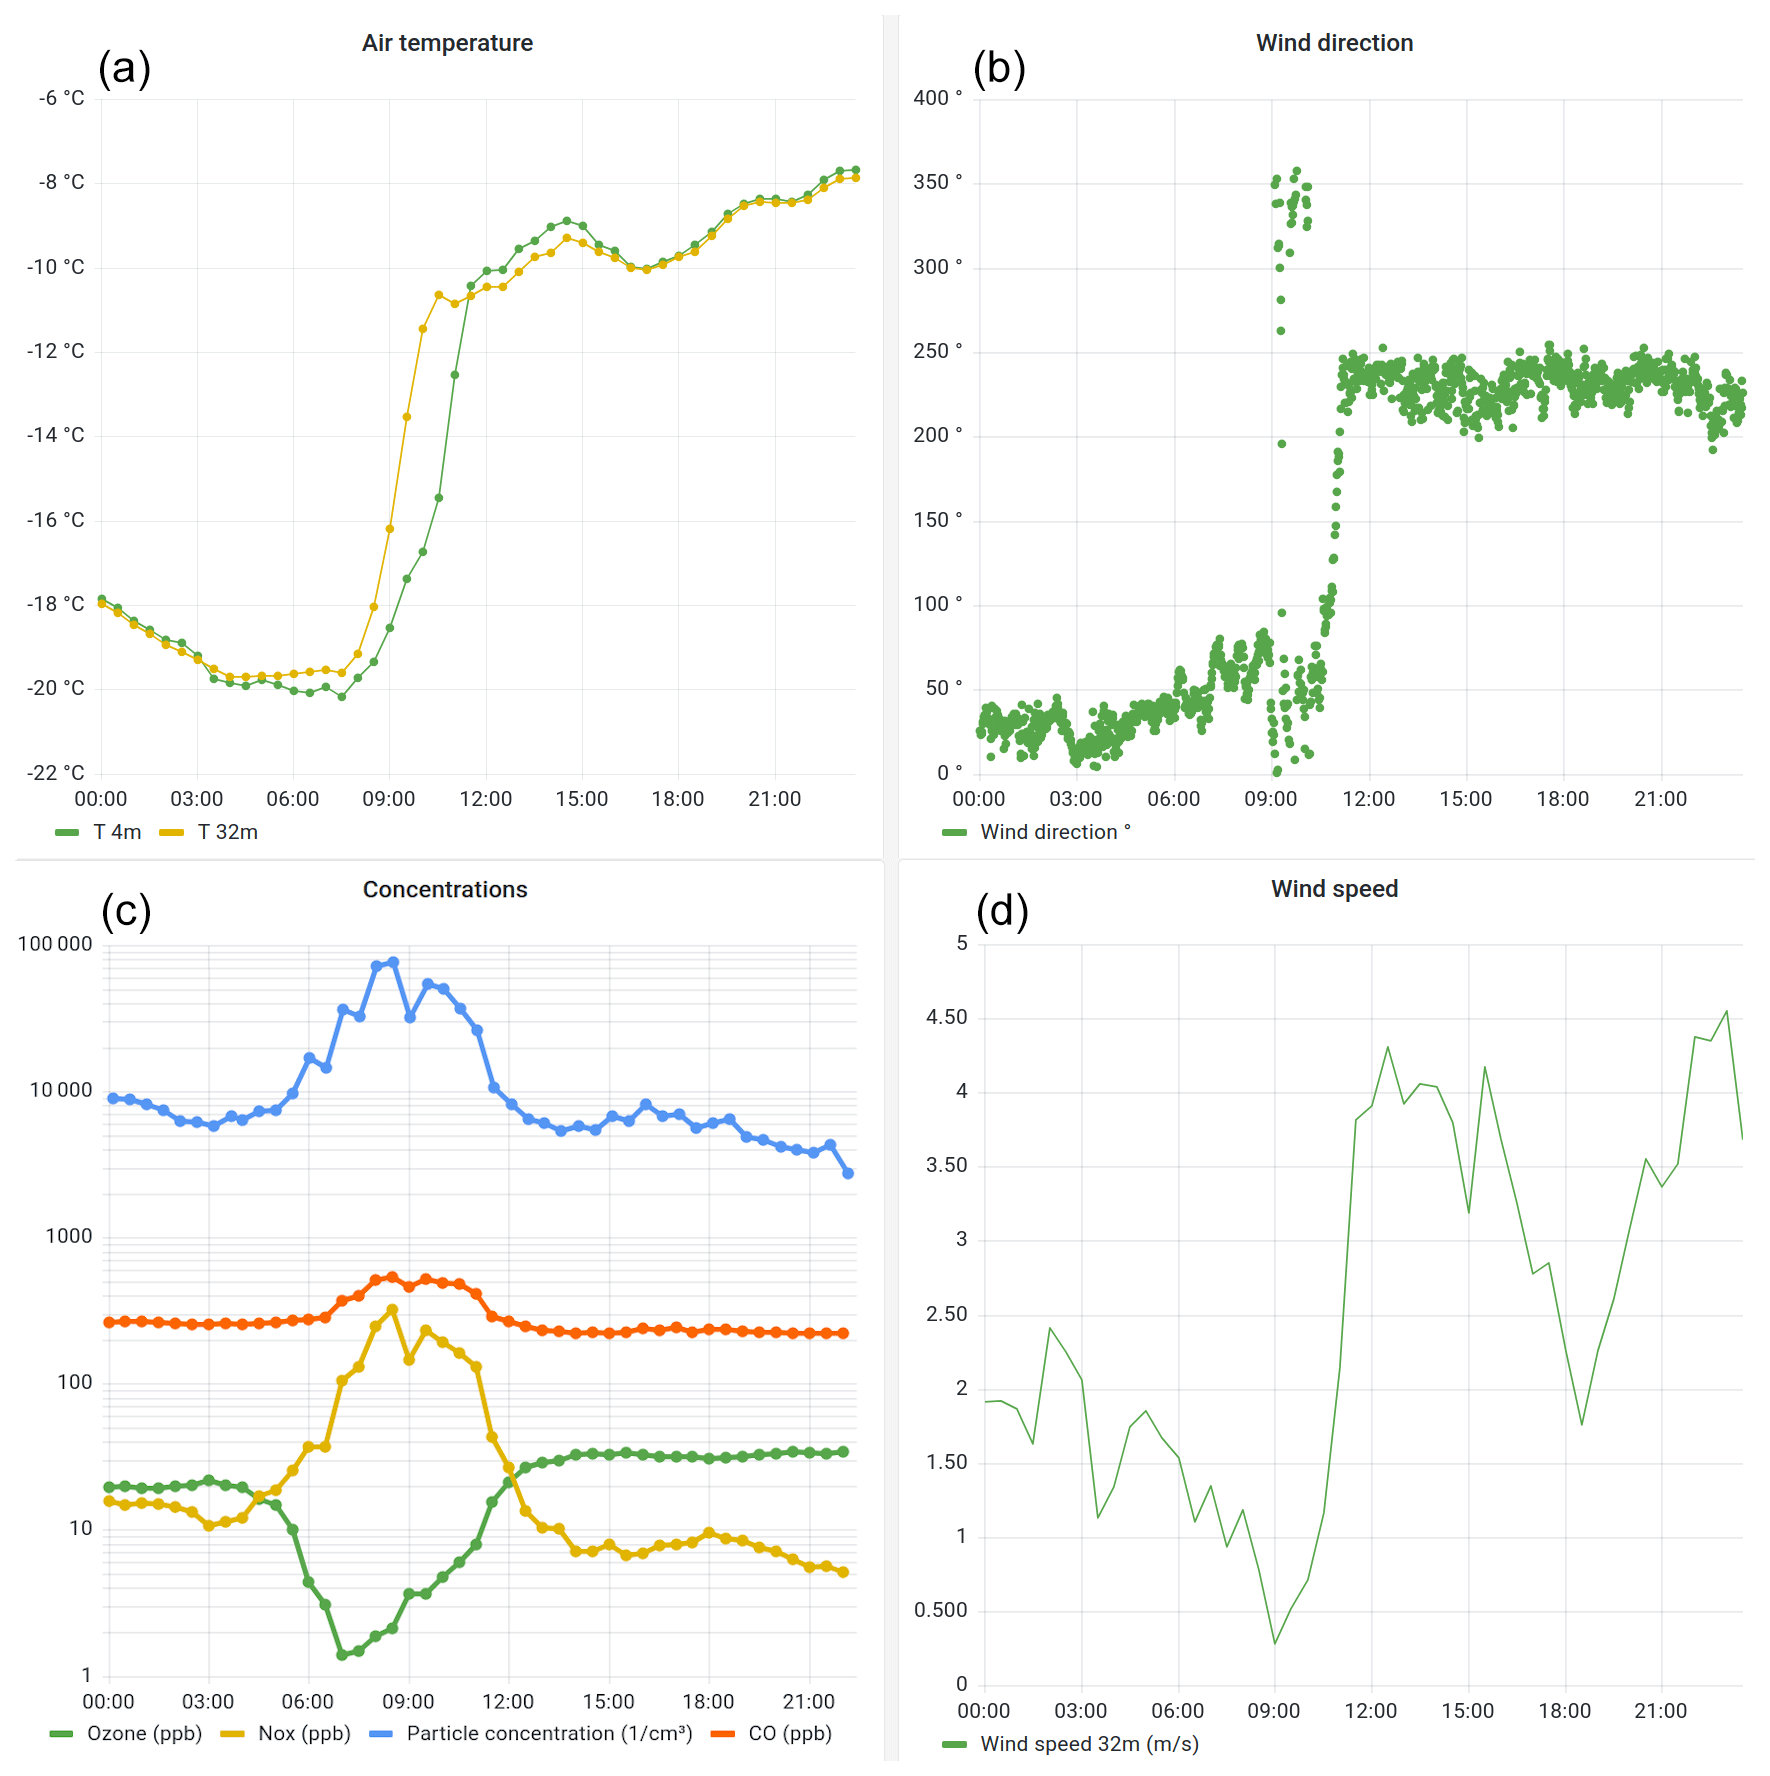
Figure 10Example of measurements of temperature at heights of 4 and 32 m (a), wind direction (b), trace gas (ozone, nitrogen oxides, and carbon monoxide) and particle concentrations (total concentration in size range 3–820 nm) (c), and wind speed (d) at the SMEAR III station in Helsinki, Finland, on 18 February 2021. All the data are visible in a single dashboard.
Figure 10 shows an example visualization of the SMEAR III measurement data. On the morning of 18 February 2021 during 06:00–11:00 LT, a clear surface temperature inversion is visible from the increase in the temperature profile from 4 to 32 m height above ground (Fig. 10a). At the same time, wind speed is also very low (below 1 m s−1), and the wind is from north to northeast from the direction of a nearby highway a few hundred meters from the measurement site (Fig. 10b and d). The temperature inversion and the low wind speeds lead to inefficient mixing of the air close to the ground and accumulation of pollutants emitted from vehicles in the morning traffic and other nearby anthropogenic sources. The particle concentration in the size range 3–820 nm and the concentration of nitrogen oxides (NOx, the sum of NO and NO2) and carbon monoxide (CO) start increasing between 06:00–08:00 LT, and at the same time the ozone concentration is depleted by more than a factor of 10 to below 1 ppb (Fig. 10c). Similar ground-level ozone depletion episodes have been observed at the Hyytiälä SMEAR II station mostly in autumn and winter, connected with a low mixing layer, high relative humidity, and low solar radiation intensity (Chen et al., 2018). The temperature inversion is strongest around 10:30 LT, when the temperature measured at 32 m height (−10.9 ∘C) is almost 5 ∘C higher compared to temperature at 4 m (−15.8 ∘C). We see the highest particle concentrations (above 5 × 104 cm−3) and NOx concentrations (above 200 ppb) at the same time. The ozone concentration has already started to increase. By 11:30 LT the temperature inversion has disappeared; the wind speed has increased; and as the result of more efficient vertical and horizontal mixing of the air, the measured pollutant concentrations are close to their typical background levels for the Helsinki area. This case study shows how easy-to-use data visualization tools, which allow efficient comparisons between datasets from multiple instruments, can help in identification of interesting phenomena in the measurements.
We present a concept for station data management and acquisition using interchangeable components. The concept is in operational use at SMEAR Estonia and has been tested in several campaigns. The components we use are built on popular, well-known open-source projects. This framework is suggested for use at new SMEAR stations and could be useful for larger campaigns as well. Since our system is completely modular, different configurations allow it to be adapted for most common use cases. The system can also easily be extended for more instruments and in the future new technological solutions, as necessary. Compared to centralized solutions such as ICOS or ACTRIS stations, this allows users to fully control how their data are processed, monitor them in real time, and control how they are transferred outside the station. This makes it useful for measurements not controlled by the centralized solutions or it can be used as a backup for the data owner in parallel with data transfer to centralized networks. While using our framework does require some technical planning to ensure sufficient hardware resources, we believe the benefits and possibilities of automated data analysis outweigh the costs. We demonstrated with two case studies how continuous visualizations of data and metadata, such as device diagnostics and data file availability, can help quickly identify interesting phenomena and abnormal situations in measurements.
Since the SMEARcore software allows one to combine multiple data sources, it also provides new opportunities for networking measurement stations together and automatically cross-referencing diverse sources of data in the routine operation of the station. This means it is possible to establish smaller networks more easily with the software. An improvement for the management of measurements would be shared storage between stations, where one could check instrument settings or normal operating values at different stations. Another possibility for improving the data usage would be automatically integrating model or satellite data into the analysis or automatically producing the input files for such models, since they can be considered just data products in the SMEARcore framework. In short, automating data processing in the way SMEARcore does also provides opportunities to automate further steps of the scientific process.
We use several open-source software components as a combination. Our changes are configuring them correctly to operate as a whole, which depends on the station and contains sensitive details which are not shareable. Thus there is no code to distribute as such, but one can get the software directly from the open-source projects themselves:
-
Airflow: https://airflow.apache.org/ (Airflow, 2022),
-
Grafana: https://github.com/grafana/grafana (Grafana, 2022),
-
InfluxDB: https://github.com/influxdata/influxdb (InfluxDB, 2023),
-
PostgreSQL: https://www.postgresql.org/ (PostgreSQL, 2023),
-
Python: https://www.python.org/ (Python, 2023).
The data are used merely to demonstrate the use of SMEARcore. The conclusions of the paper do not depend on the exact data used. Thus it has not been collected in a repository. In the case of Kumpula, the data are available from https://doi.org/10.23729/6e74091b-1036-4668-a5a8-9132e344a850 (Aalto et al., 2022). The data in the SMEAR Estonia figures are available on request.
AR, MK, TP, HJ, PPA, and PK participated in the initial design of the SMEARcore concept. MK, TP, and HJ participated in funding acquisition, resource acquisition and supervision of the project. AR, KH, HJ, PPA, and LRA participated in software development and data curation. AR, KH, and HJ investigated the concept by setting up and operating installations. AR, KH, HJ, and TN made the analysis presented in the examples and provided visualizations. All co-authors participated in the writing of and commenting on the manuscript.
The contact author has declared that none of the authors has any competing interests.
Publisher's note: Copernicus Publications remains neutral with regard to jurisdictional claims in published maps and institutional affiliations.
Technical and scientific staff in Järvselja, Beijing, and Hyytiälä stations are acknowledged. We thank Marjut Kaukolehto for discussions during the planning of SMEARcore. The authors wish to acknowledge CSC – IT Center for Science, Finland, for computational resources.
This research has been supported by the following projects: ACCC (Atmosphere and Climate Competence Center) Flagship funded by the Academy of Finland (grant no. 337549); an academy professorship funded by the Academy of Finland (grant no. 302958); Academy of Finland project nos. 1325656, 316114, 325647, 333397, 334792, 329274, 352415, 328616, and 345510; the “Quantifying carbon sink, CarbonSink+ and their interaction with air quality” INAR project funded by the Jane and Aatos Erkko Foundation; the European Research Council (ERC) project ATM-GTP (contract no. 742206); and the Arena for the gap analysis of the existing Arctic Science Co-Operations (AASCO) funded by the Prince Albert II of Monaco Foundation (contract no.2859). This work was supported by the European Regional Development Fund (MOBTT42), Estonian Research Council (project PRG714), Estonian Environmental Observatory (KKOBS, project 2014-2020.4.01.20-0281), and Academy of Finland (grant no. 311932). Open-access funding was provided by the Helsinki University Library.
This paper was edited by Brigitte Buchmann and reviewed by two anonymous referees.
Aalto, P., Hämeri, K., Becker, E., Weber, R., Salm, J., Mäkelä, J. M., Hoell, C., O'dowd, C. D., Hansson, H.-C., Väkevä, M., Koponen, I. K., Buzorius, G., and Kulmala, M.: Physical characterization of aerosol particles during nucleation events, Tellus B, 53, 344–358, https://doi.org/10.3402/tellusb.v53i4.17127, 2001.
Aalto, P., Keronen, P., Leskinen, M., Siivola, E., and Järvi, L.: SMEAR III Kumpula meteorology, greenhouse gases and air quality (Version 2), University of Helsinki, Institute for Atmospheric and Earth System Research [data set], https://doi.org/10.23729/6e74091b-1036-4668-a5a8-9132e344a850, 2022.
Airflow: https://airflow.apache.org (last access: 12 January 2022), 2022.
Alfred-Wegener-Institut Helmholtz-Zentrum für Polar- und Meeresforschung: Polar Research and Supply Vessel POLARSTERN Operated by the Alfred-Wegener-Institute, Journal of large-scale research facilities, 3, A119, https://doi.org/10.17815/jlsrf-3-163, 2017.
Bauer, P., Stevens B., and Hazeleger. W.: A digital twin of Earth for the green transition, Nat. Clim. Change, 11, 80–83, 2021.
Beamish, A., Raynolds M. K., Epstein, H., Frost, G. V., Macander, M. J., Bergstedt, H., Bartsch, A., Kruse, S., Miles, V., Tanis, C. M., Heim, B., Fuchs, M., Chabrillat, S., Shevtsova, J., Verdonen, M., and Wagner, J.: Recent trends and remaining challenges for optical remote sensing of Arctic tundra vegetation: A review and outlook, Remote Sens. Environ., 246, 111872, https://doi.org/10.1016/j.rse.2020.111872, 2020.
Buck, S.: Solving reproducibility, Science, 348, 1403, https://doi.org/10.1126/science.aac8041, 2015.
Chen, X., Quéléver, L. L. J., Fung, P. L., Kesti, J., Rissanen, M. P., Bäck, J., Keronen, P., Junninen, H., Petäjä, T., Kerminen, V.-M., and Kulmala, M.: Observations of ozone depletion events in a Finnish boreal forest, Atmos. Chem. Phys., 18, 49–63, https://doi.org/10.5194/acp-18-49-2018, 2018.
Drusch, M., Del Bello, U., Carlier, S., Colin, O., Fernandez, V., Gascon, F., Hoersch, B., Isola, C., Laberinti, P., Martimort, P., Meygret, A., Spoto, F., Sy, O., Marchese, F., and Bargellini, P.: Sentinel-2: ESA's Optical High-Resolution Mission for GMES Operational Services, Remote Sens. Environ., 120, 25–36, https://doi.org/10.1016/j.rse.2011.11.026, 2012.
Grafana: grafana, GitHub [code], https://github.com/grafana/grafana (last access: 12 January 2022), 2022.
Guo, H.: Big Earth data: A new frontier in Earth and information sciences, Big Earth Data, 1, 4–20, https://doi.org/10.1080/20964471.2017.1403062, 2017.
Hari, P. and Kulmala, M.: Station for measuring ecosystem-atmosphere relations (SMEAR II), Boreal Environ. Res., 10, 315–322, 2005.
Hari, P., Petäjä, T., Bäck, J., Kerminen, V.-M., Lappalainen, H. K., Vihma, T., Laurila, T., Viisanen, Y., Vesala, T., and Kulmala, M.: Conceptual design of a measurement network of the global change, Atmos. Chem. Phys., 16, 1017–1028, https://doi.org/10.5194/acp-16-1017-2016, 2016.
Hurrell, J. W., Holland, M. M., Gent, P. R., Ghan, S., Kay, J. E., Kushner, P. J., Lamarque, J.-F., Large, W. G., Lawrence, D., Lindsay, K., Lipscomb, W. H., Long, M. C., Mahowald, N., Marsh, D. R., Neale, R. B., Rasch, P., Vavrus, S., Vertenstein, M., Bader, D., Collins, W. D., Hack, J. J., Kiehl, J., and Marshall, S.: The Community Earth System Model: A Framework for Collaborative Research, B. Am. Meteorol. Soc., 94, 1339–1360, https://doi.org/10.1175/BAMS-D-12-00121.1, 2013.
InfluxDB: influxdb, GitHub [code], https://github.com/influxdata/influxdb (last access: 2 June 2023), 2023.
Järvi, L., Hannuniemi, H., Hussein, T., Junninen, H., Aalto, P. P., Hillamo, R., Mäkelä, T., Keronen, P., Siivola, E., Vesala, T., and Kulmala, M.: The urban measurement station SMEAR III: Continuous monitoring of air pollution and surface-atmosphere interactions in Helsinki, Finland, Boreal Environ. Res., 14 (SUPPL. A), 86–109, 2009.
Junninen, H., Ehn, M., Petäjä, T., Luosujärvi, L., Kotiaho, T., Kostiainen, R., Rohner, U., Gonin, M., Fuhrer, K., Kulmala, M., and Worsnop, D. R.: A high-resolution mass spectrometer to measure atmospheric ion composition, Atmos. Meas. Tech., 3, 1039–1053, https://doi.org/10.5194/amt-3-1039-2010, 2010.
Krumpen, T., von Albedyll, L., Goessling, H. F., Hendricks, S., Juhls, B., Spreen, G., Willmes, S., Belter, H. J., Dethloff, K., Haas, C., Kaleschke, L., Katlein, C., Tian-Kunze, X., Ricker, R., Rostosky, P., Rückert, J., Singha, S., and Sokolova, J.: MOSAiC drift expedition from October 2019 to July 2020: sea ice conditions from space and comparison with previous years, The Cryosphere, 15, 3897–3920, https://doi.org/10.5194/tc-15-3897-2021, 2021.
Kulmala, M.: Build a global Earth observatory, Nature, 553, 21–23, 2018.
Kulmala, M., Petäjä, T., Nieminen, T., Sipilä, M., Manninen, H. E., Lehtipalo, K., Dal Maso, M., Aalto, P. P., Junninen, H., Paasonen, P., Riipinen, I., Lehtinen, K. E. J., Laaksonen, A., and Kerminen, V.-M.: Measurement of the nucleation of atmospheric aerosol particles, Nat. Protoc., 7, 1651–1667, https://doi.org/10.1038/nprot.2012.091, 2012.
Laj, P., Bigi, A., Rose, C., Andrews, E., Lund Myhre, C., Collaud Coen, M., Lin, Y., Wiedensohler, A., Schulz, M., Ogren, J. A., Fiebig, M., Gliß, J., Mortier, A., Pandolfi, M., Petäja, T., Kim, S.-W., Aas, W., Putaud, J.-P., Mayol-Bracero, O., Keywood, M., Labrador, L., Aalto, P., Ahlberg, E., Alados Arboledas, L., Alastuey, A., Andrade, M., Artíñano, B., Ausmeel, S., Arsov, T., Asmi, E., Backman, J., Baltensperger, U., Bastian, S., Bath, O., Beukes, J. P., Brem, B. T., Bukowiecki, N., Conil, S., Couret, C., Day, D., Dayantolis, W., Degorska, A., Eleftheriadis, K., Fetfatzis, P., Favez, O., Flentje, H., Gini, M. I., Gregorič, A., Gysel-Beer, M., Hallar, A. G., Hand, J., Hoffer, A., Hueglin, C., Hooda, R. K., Hyvärinen, A., Kalapov, I., Kalivitis, N., Kasper-Giebl, A., Kim, J. E., Kouvarakis, G., Kranjc, I., Krejci, R., Kulmala, M., Labuschagne, C., Lee, H.-J., Lihavainen, H., Lin, N.-H., Löschau, G., Luoma, K., Marinoni, A., Martins Dos Santos, S., Meinhardt, F., Merkel, M., Metzger, J.-M., Mihalopoulos, N., Nguyen, N. A., Ondracek, J., Pérez, N., Perrone, M. R., Petit, J.-E., Picard, D., Pichon, J.-M., Pont, V., Prats, N., Prenni, A., Reisen, F., Romano, S., Sellegri, K., Sharma, S., Schauer, G., Sheridan, P., Sherman, J. P., Schütze, M., Schwerin, A., Sohmer, R., Sorribas, M., Steinbacher, M., Sun, J., Titos, G., Toczko, B., Tuch, T., Tulet, P., Tunved, P., Vakkari, V., Velarde, F., Velasquez, P., Villani, P., Vratolis, S., Wang, S.-H., Weinhold, K., Weller, R., Yela, M., Yus-Diez, J., Zdimal, V., Zieger, P., and Zikova, N.: A global analysis of climate-relevant aerosol properties retrieved from the network of Global Atmosphere Watch (GAW) near-surface observatories, Atmos. Meas. Tech., 13, 4353–4392, https://doi.org/10.5194/amt-13-4353-2020, 2020.
Liu, Y., Yan, C., Feng, Z., Zheng, F., Fan, X., Zhang, Y., Li, C., Zhou, Y., Lin, Z., Guo, Y., Zhang, Y., Ma, L., Zhou, W., Liu, Z., Dada, L., Dällenbach, K., Kontkanen, J., Cai, R., Chan, T., Chu, B., Du, W., Yao, L., Wang, Y., Cai, J., Kangasluoma, J., Kokkonen, T., Kujansuu, J., Rusanen, A., Deng, C., Fu, Y., Yin, R., Li, X., Lu, Y., Liu, Y., Lian, C., Yang, D., Wang, W., Ge, M., Wang, Y., Worsnop, D. R., Junninen, H., He, H., Kerminen, V.-M., Zheng, J., Wang, L., Jiang, J., Petäjä, T., Bianchi, F., and Kulmala, M.: Continuous and comprehensive atmospheric observations in Beijing: a station to understand the complex urban atmospheric environment, Big Earth Data, 4, 295–321, 2020.
Mammarella, I., Peltola, O., Nordbo, A., Järvi, L., and Rannik, Ü.: Quantifying the uncertainty of eddy covariance fluxes due to the use of different software packages and combinations of processing steps in two contrasting ecosystems, Atmos. Meas. Tech., 9, 4915–4933, https://doi.org/10.5194/amt-9-4915-2016, 2016.
Mordas, G., Manninen, H. E., Petäjä, T., Aalto, P. P., Hämeri, K., and Kulmala, M.: On Operation of the Ultra-Fine Water-Based CPC TSI 3786 and Comparison with Other TSI Models (TSI 3776, TSI 3772, TSI 3025, TSI 3010, TSI 3007), Aerosol Sci. Tech., 42, 152–158, 2008.
Noe, S. M., Niinemets, Ü., Krasnova, A., Krasnov, D., Motallebi, A., Kängsepp, V., Jõgiste, K., Hõrrak, U., Komsaare, K., Mirme, S., Vana, M., Tammet, H., Bäck, J., Vesala, T., Kulmala, M., Petäjä, T., and Kangur, A.: SMEAR Estonia: Perspectives of a large-scale forest ecosystem - atmosphere research infrastructure, Metsanduslikud uurimused, 63, 56–84, 2015.
Pandolfi, M., Alados-Arboledas, L., Alastuey, A., Andrade, M., Angelov, C., Artiñano, B., Backman, J., Baltensperger, U., Bonasoni, P., Bukowiecki, N., Collaud Coen, M., Conil, S., Coz, E., Crenn, V., Dudoitis, V., Ealo, M., Eleftheriadis, K., Favez, O., Fetfatzis, P., Fiebig, M., Flentje, H., Ginot, P., Gysel, M., Henzing, B., Hoffer, A., Holubova Smejkalova, A., Kalapov, I., Kalivitis, N., Kouvarakis, G., Kristensson, A., Kulmala, M., Lihavainen, H., Lunder, C., Luoma, K., Lyamani, H., Marinoni, A., Mihalopoulos, N., Moerman, M., Nicolas, J., O'Dowd, C., Petäjä, T., Petit, J.-E., Pichon, J. M., Prokopciuk, N., Putaud, J.-P., Rodríguez, S., Sciare, J., Sellegri, K., Swietlicki, E., Titos, G., Tuch, T., Tunved, P., Ulevicius, V., Vaishya, A., Vana, M., Virkkula, A., Vratolis, S., Weingartner, E., Wiedensohler, A., and Laj, P.: A European aerosol phenomenology – 6: scattering properties of atmospheric aerosol particles from 28 ACTRIS sites, Atmos. Chem. Phys., 18, 7877–7911, https://doi.org/10.5194/acp-18-7877-2018, 2018.
Petäjä, T., Ganzei, K. S., Lappalainen, H. K., Tabakova, K., Makkonen, R., Räisänen, J., Chalov, S., Kulmala, M., Zilitinkevich, S., Baklanov, P. Y., Shakirov, R. B., Mishina, N. V., Egidarev, E. G., and Kondrat'ev, I. I.: Research agenda for the Russian Far East and utilization of multi-platform comprehensive environmental observations, Int. J. Digit. Earth, 14, 311–337, https://doi.org/10.1080/17538947.2020.1826589, 2021.
PostgreSQL: The World's Most Advanced Open Source Relational Database, https://www.postgresql.org/ (last access: 2 June 2023), 2023.
Python: Welcome to Python.org, https://www.python.org/ (last access: 2 June 2023), 2023.
Randall, D. A., Bitz, C. M., Danabasoglu, G., Denning, A. S., Gent, P. R., Gettelman, A., Griffies, S. M., Lynch, P., Morrison, H., Pincus, R., and Thuburn, J.: 100 Years of Earth System Model Development, Meteor. Mon., 59, 12.1–12.66, https://doi.org/10.1175/AMSMONOGRAPHS-D-18-0018.1, 2018.
Rose, C., Zha, Q., Dada, L., Yan, C., Lehtipalo, K., Junninen, H., Mazon, S. B., Jokinen, T., Sarnela, N., Sipilä, M., Petäjä, T., Kerminen, V.-M., Bianchi, F., and Kulmala, M.: Observations of biogenic ion-induced cluster formation in the atmosphere, Science Advances, 4, eaar5218, https://doi.org/10.1126/sciadv.aar5218, 2018.
Wang, M., Kong, W., Marten, R., He, X.-C., Chen, D., Pfeifer, J., Heitto, A., Kontkanen, J., Dada, L., Kürten, A., Yli-Juuti, T., Manninen, H. E., Amanatidis, S., Amorim, A., Baalbaki, R., Baccarini, A., Bell, D. M., Bertozzi, B., Bräkling, S., Brilke, S., Murillo, L. C., Chiu, R., Chu, B., De Menezes, L.-P., Duplissy, J., Finkenzeller, H., Carracedo, L. G., Granzin, M., Guida, R., Hansel, A., Hofbauer, V., Krechmer, J., Lehtipalo, K., Lamkaddam, H., Lampimäki, M., Lee, C. P., Makhmutov, V., Marie, G., Mathot, S., Mauldin, R. L., Mentler, B., Müller, T., Onnela, A., Partoll, E., Petäjä, T., Philippov, M., Pospisilova, V., Ranjithkumar, A., Rissanen, M., Rörup, B., Scholz, W., Shen, J., Simon, M., Sipilä, M., Steiner, G., Stolzenburg, D., Tham, Y. J., Tomé, A., Wagner, A. C., Wang, D. S., Wang, Y., Weber, S. K., Winkler, P. M., Wlasits, P. J., Wu, Y., Xiao, M., Ye, Q., Zauner-Wieczorek, M., Zhou, X., Volkamer, R., Riipinen, I., Dommen, J., Curtius, J., Baltensperger, U., Kulmala, M., Worsnop, D. R., Kirkby, J., Seinfeld, J. H., El-Haddad, I., Flagan, R. C., and Donahue, N. M.: Rapid growth of new atmospheric particles by nitric acid and ammonia condensation, Nature, 581, 184–189, https://doi.org/10.1038/s41586-020-2270-4, 2020.
Yao, L., Garmash, O., Bianchi, F., Zheng, J., Yan, C., Kontkanen, J., Junninen, H., Mazon, S. B., Ehn, M., Paasonen, P., Sipilä, M., Wang, M., Wang, X., Xiao, S., Chen, H., Lu, Y., Zhang, B., Wang, D., Fu, Q., Geng, F., Li, L., Wang, H., Qiao, L., Yang, X., Chen, J., Kerminen, V.-M., Petäjä, T., Worsnop, D. R., Kulmala, M., and Wang, L.: Atmospheric new particle formation from sulfuric acid and amines in a Chinese megacity, Science, 361, 278–281, https://doi.org/10.1126/science.aao4839, 2018.
Yver-Kwok, C., Philippon, C., Bergamaschi, P., Biermann, T., Calzolari, F., Chen, H., Conil, S., Cristofanelli, P., Delmotte, M., Hatakka, J., Heliasz, M., Hermansen, O., Komínková, K., Kubistin, D., Kumps, N., Laurent, O., Laurila, T., Lehner, I., Levula, J., Lindauer, M., Lopez, M., Mammarella, I., Manca, G., Marklund, P., Metzger, J.-M., Mölder, M., Platt, S. M., Ramonet, M., Rivier, L., Scheeren, B., Sha, M. K., Smith, P., Steinbacher, M., Vítková, G., and Wyss, S.: Evaluation and optimization of ICOS atmosphere station data as part of the labeling process, Atmos. Meas. Tech., 14, 89–116, https://doi.org/10.5194/amt-14-89-2021, 2021.