the Creative Commons Attribution 4.0 License.
the Creative Commons Attribution 4.0 License.
 | 13 Jun 2023
Total column ozone retrieval from a novel array spectroradiometer
Luca Egli
Julian Gröbner
Herbert Schill
Eliane Maillard Barras
This study presents a new total column ozone (TCO) retrieval from the Koherent system, developed at the Physikalisch-Meteorologisches Observatorium Davos, World Radiation Center (PMOD/WRC). The instrument is based on a small, cost-effective, robust, low-maintenance and state-of-the-art-technology array spectroradiometer. It consists of a BTS-2048-UV-S-F array spectroradiometer from Gigahertz-Optik GmbH, coupled with an optical fibre to a lens-based telescope mounted on a sun tracker for measuring direct UV irradiance in the ultraviolet wavelength band between 305 to 345 nm.
Two different algorithms are developed for retrieving TCO from these spectral measurements: (1) TCO retrieved by a least-squares-fit algorithm (LSF) and (2) a custom-double-ratio (CDR) technique using four specifically selected wavelengths from the spectral measurements. The double-ratio technique is analogous to the retrieval algorithm applied for the Dobson instruments and the Brewer instruments but is adopted here for TCO retrieval with Koherent. The instrument was calibrated in two different ways: (a) absolute calibration of the spectra using the portable reference for ultraviolet radiation QASUME for the LSF retrieval and (b) relative calibration of the extraterrestrial constant (ETC) of the CDR retrieval by minimising the slope between air mass and the relative differences of TCO from QASUME and Koherent. This adjustment of the ETC allows the instrument to be calibrated with standard TCO reference instruments during calibration campaigns, such as a double-monochromator Brewer.
A 2-year comparison in Davos, Switzerland, between Koherent and the Brewer 156 (double monochromator) shows that TCO derived from Koherent and the Brewer 156 agree, on average, over the entire period within 0.7 % for all retrievals in terms of offset. The performance in terms of slant path depends on the selected retrieval and the applied corrections. The stray-light-corrected LSF retrieval exhibits a smaller slant path dependency than the CDR retrieval and performs almost as well as a double-monochromator system. The slant path dependency of the CDR is comparable to the slant path dependency of a single Brewer monochromator. The combination of both retrievals leads to performance with an offset close to zero compared to Brewer 156, a seasonal amplitude of the relative difference of 0.08 % and a slant path dependency of maximum 1.64 %, which is similar to other standard TCO instruments such as single Brewer or Dobson.
Applying the double-ratio technique by selecting the wavelengths and slit functions from Brewer and Dobson, respectively, allows for the determination of the effective ozone temperature with an uncertainty of 3 K in terms of daily averages. With the improved TCO retrieval, Koherent serves as a new low-maintenance instrument which could also be used to monitor TCO at remote sites. The TCO retrieval presented here may be applied to other array-based spectroradiometers, providing direct spectral measurements in the ultraviolet wavelength band.
- Article
(4276 KB) - Full-text XML
- BibTeX
- EndNote


The depletion of the stratospheric ozone layer was discovered in the 1970s (e.g. Molina and Rowland, 1974; Solomon, 1999; Staehelin et al., 2018) and since then has been continuously reported in the Word Meteorological Organisation (WMO) assessment of ozone depletion (e.g. WMO, 2018) on a quadrennial schedule. In order to monitor the evolution of the ozone layer, accurate instrumentation such as the Dobson spectroradiometer (Dobson, 1968; Komhyr et al., 1989) and the Brewer spectroradiometer (Kerr et al., 1981) has been developed to ensure worldwide long-term observations of total column ozone (TCO), forming a global network. The ozone layer absorbs solar ultraviolet radiation at wavelengths shorter than 350 nm and protects life on Earth's surface from harmful UV radiation. A spectroradiometer allows the retrieval of TCO by accurately measuring direct sun irradiance at the Earth's surface in the UV wavelength band and by using an atmospheric model based on the Beer–Lambert law (Kerr et al., 1988). In the Dobson instruments, prisms are used to select the four specific wavelengths which are used for the ozone retrieval (Evans, 2008). Most of the Dobsons are manually operated and therefore require substantial manpower for the operation at remote sites. The three Swiss Dobsons used in this study have been automated (Stübi et al., 2021). In the 1980s, the Brewer spectroradiometer (Kerr et al., 1981, 1985) was developed as an automatic device measuring direct solar UV radiation with gratings instead of prisms. The first instruments were single monochromators with one grating to select the wavelengths at the specific slits. Later in the development, Brewers were equipped with two gratings to form double-monochromator instruments. Double-monochromator devices perform UV measurements with insignificant stray-light impact in contrast to single-monochromator Brewers or to Dobsons, which suffer from the effect of stray light at high solar zenith angles and corresponding high air masses. The Brewers were used to form a network of automated stations, which require less operational manpower as an advantage for remote sites. However, the network still requires regular maintenance by trained experts.
For the Dobson and the Brewer spectrophotometers, the retrieval of TCO is obtained by the double-ratio technique at four specific wavelengths in the UV absorption band (see Sect. 2.2). Comparison studies (e.g. Kerr, 2002; Vanicek, 2006; Scarnato et al., 2009; Redondas et al., 2014; Gröbner et al., 2021) showed that the greatest consistency between TCO from Brewer and Dobson can be achieved by using the G14 ozone absorption cross section (Serdyuchenko et al., 2014) and the inclusion of effective ozone temperature from balloon soundings for the Dobson retrieval. Both instruments require the extraterrestrial constant (ETC), which defines the inferred response of the instrument to the irradiance at the top of the atmosphere as a parameter of the retrieval. This parameter is determined by Langley plot calibration at some specific sites with stable atmospheric conditions (Mauna Loa, Hawaii, US; and Izaña, Teneriffe, Spain), or it is determined by on-site comparison with a regional reference instrument (Köhler et al., 2018; Redondas et al., 2019). In the framework of the Global Atmosphere Watch programme (GAW), WMO defined the Brewer and the Dobson instruments as the standard instruments for TCO monitoring from Earth's surface.
In recent years, other instruments measuring direct solar irradiance between 300 and 340 nm were developed to retrieve TCO without the requirement of on-site calibration by reference instruments. In particular, array spectroradiometers have the advantage that a continuous spectral range is measured instead of only discrete wavelength values, as is done by the Brewer or the Dobson. The instruments are small and robust, require low maintenance during their operation, and acquire spectra within a time frame of seconds. However, it is also reported that array spectroradiometers suffer from stray light due to the single-monochromator setup (Egli et al., 2016).
An example of an array-spectroradiometer-based system is the Pandora system, which forms a global network for atmospheric composition measurements, including TCO (Herman et al., 2017). The instrument measures solar spectra with an array spectroradiometer and an input optic connected by a fibre to the spectroradiometer. TCO is retrieved by a spectral fitting algorithm wavelength band between 305 and 330 nm. Comparison of the Pandora system with Dobson instruments shows an averaged difference of 2.1 %±3.2 % (Herman et al., 2017). Herman et al. (2017) reported that TCO has been corrected for the impact of effective ozone temperature and for the influence of stray light. Similarly to the Pandora, the entrance optics of the Phaeton system consist of a fibre-coupled telescope connected to an array spectroradiometer (Kouremeti et al., 2008). The spectral measurements from Phaeton are used to retrieve TCO by a differential optical absorption spectroscopy (DOAS) or multi-axis DOAS (MAXDOAS) technique using the wavelength band between 315 and 337 nm. Averaged biases of 0.94 % ± 1.26 % of TCO from Phaeton are observed by comparison with a Brewer single-monochromator spectroradiometer when using the effective ozone temperature as input for the retrieval (Gkertsi et al., 2018).
The BiTec-Sensor (BTS) array spectroradiometer from Gigahertz-Optik GmBH (Zuber et al., 2018a) reduces stray light by filtering solar radiation with different bandpass filters inside the array spectroradiometer (Zuber et al., 2021). Contrary to the aforementioned systems, the BTS Solar is based on a BTS array spectroradiometer unit with a directly mounted diffusor entrance optic and a tube for field-of-view limitation for irradiance measurements instead of a fibre coupled telescope (Zuber et al., 2018b, 2021). The retrieval algorithm is based on the comparison from two selected wavelength bands (307 to 311 nm and 319 to 324 nm) of the measured data with a lookup table pre-calculated by the libRadtran software package for radiative transfer calculations (Emde et al., 2016). The look-up table is pre-calculated for a specific location and requires ground pressure for correction but does not use the effective ozone temperature. A long-term intercomparison in 2019 and 2020 of the BTS Solar at Hohenpeissenberg, Germany, showed a bias of less than 0.1 % with a standard deviation of less than 0.8 % compared to Brewer using the Bass and Paur cross section. Stray-light effects of BTS are discussed and reported to be minor for TCO retrieval by the look-up table technique (Zuber et al., 2018a, b, 2021). Also in Zuber et al. (2021), the Koherent system operated at the Physikalisch-Meteorologisches Observatorium Davos, World Radiation Center (PMOD/WRC) was introduced as an instrument which connects the BTS array spectroradiometer by an optical fibre to a lens-based telescope (see Sect. 2.1). Since Koherent was first built as a research instrument, the configuration with the optical fibre was chosen to test several additional filters with an in-line filter wheel and to test telescopes with different fields of view. However, with today's knowledge and for even more simplicity and robustness, a collimating tube in front of the diffusor, as provided by the BST Solar (Gigahertz-Optics Gmbh), would be a better solution than a telescope connected with an optical fibre. In analogy to Huber et al. (1995) and Egli et al. (2022), a least-squares (LSF) spectral fitting algorithm (see Sect. 2.2) is applied for TCO retrieval during 2019 and 2020 in Davos, Switzerland. TCO from a first version of the LSF technique exhibits an averaged bias of 1.7 % with a standard deviation of 1.4 % and a seasonal cycle of about 2 % when compared with Brewer 163 using the Bass and Paur cross section (Zuber et al., 2021). The first version of the LSF algorithm used in Zuber et al. (2021) did not include the effective ozone temperature as input in the retrieval, and it was discussed whether the seasonal cycle is caused by remaining stray-light effects or by the retrieval at a constant effective ozone temperature of 228 K through the seasons. However, it remained unclear which effect caused the seasonal cycle.
Recently, Egli et al. (2022) presented traceable TCO measurements from the world portable reference spectroradiometer for UV radiation QASUME (Gröbner et al., 2005). QASUME consists of a scanning double monochromator measuring direct solar UV spectral irradiance at wavelengths between 305 and 345 nm. QASUME is fully characterised in the laboratory with sources that are traceable to primary International System of Units (SI) standards with an unbroken calibration procedure and a comprehensive uncertainty analysis for the entire calibration chain (Hülsen et al., 2016; Gröbner et al., 2017). TCO from these high-quality direct UV spectral measurements is used for an improved, well-tested and optimised LSF retrieval algorithm in the wavelength band between 305 and 345 nm. In Egli et al. (2022), the improved LSF retrieval and the specific settings, such as extraterrestrial spectrum, cross-section and aerosol optical depth parameterisation, are described in detail, and the same algorithm and settings are applied here for the retrieval of traceable TCO measurements from spectral solar measurements of Koherent. A long-term comparison of QASUME TCO with a Brewer double monochromator and a Dobson in Davos, Switzerland, showed an offset of about 1 % and a seasonal cycle of less than 0.2 %. This small seasonal variation indicates the proper inclusion of the effective ozone temperature for QASUME LSF retrieval and the negligible impact of stray light.
This study aims first to apply the QASUME LSF retrieval algorithm to spectral measurements from the BTS array spectroradiometer system Koherent, including the effective ozone temperature, to investigate potential stray-light effects of Koherent. Since stray-light effects occur from Koherent measurements, a stray-light correction will be applied to improve TCO observations from Koherent. The LSF retrieval is a complementary algorithm tested and validated with QASUME, which allows TCO to be retrieved with traceable SI units when the system is calibrated on an absolute level. Second, the measured spectra of Koherent are used as an input to apply a custom-double-ratio (CDR) technique (in analogy to the Dobson and Brewer retrieval) to further develop the performance of Koherent. The advantage of the CDR technique is that this algorithm allows for the calibration of the instrument with dedicated ozone reference instruments such as the Brewer in periodic-calibration field campaigns or with traceable-SI-unit instruments such as QASUME by adjusting the extraterrestrial constant. The study also investigates the potential of the double-ratio technique applied at Koherent to retrieve the effective ozone temperature from ground-based measurements, as shown in Kerr (2002).
The results of TCO from Koherent calculated by the new LSF and the CDR technique are compared with the double-monochromator Brewer 156 of MeteoSwiss, operated at the World Radiation Center (PMOD/WRC), in Davos, Switzerland. The comparison during the period from 1 October 2019 to 30 September 2021 allows for the validation of the performance of Koherent. The overall objective is to obtain continuous TCO observations from a small, robust and low-maintenance instrument for remote sites with unattended operation.
2.1 Koherent array-spectroradiometer-based instrument
The transportable system Koherent was built as a research instrument to test the ability of a novel array spectroradiometer for continuous TCO monitoring. As described in Zuber et al. (2021), Koherent is based on a fibre-coupled BTS-2048-UV-S-F array spectroradiometer, which is connected to a lens-based imaging telescope (Fig. 1). The telescope with a field of view of about ±0.6∘ is mounted on a sun tracker following the sun to measure direct solar irradiance at the measurement platform at PMOD/WRC, Davos, Switzerland, at 1560 m a.s.l. (metres above sea level; coordinates: 46.81∘ N, 9.83∘ E). The small array spectroradiometer is enclosed in a temperature-stabilised, weather-proofed box to ensure a constant temperature through all seasons of the year. The BTS is controlled with a Python software routine on an embedded computer inside the box. The raw data are stored immediately on the embedded computer and transferred to an external server on a 5 min schedule. During the operation between 2019 and 2021, the system performed reliably on more than 99 % of all days and can be considered to be technically mature. The time interval of each reading is usually 1 min, since the device needs around 45 s for one measurement. However, at conditions with low direct-sun irradiance intensity (e.g. cirrus clouds or high solar zenith angles (SZAs)), around 150 s are needed due to increased integration time (Zuber et al., 2021). Since the air mass can change rapidly at high solar zenith angles, higher integration times than 150 s were not permitted in the measurement programme. For example, using a 45 s integration time, the air mass changes by 0.35 % at air mass 3.5 (or SZA of around 75∘) and to 1.15 % for integration times of 150 s, leading to an uncertainty of TCO of the same relative amount.
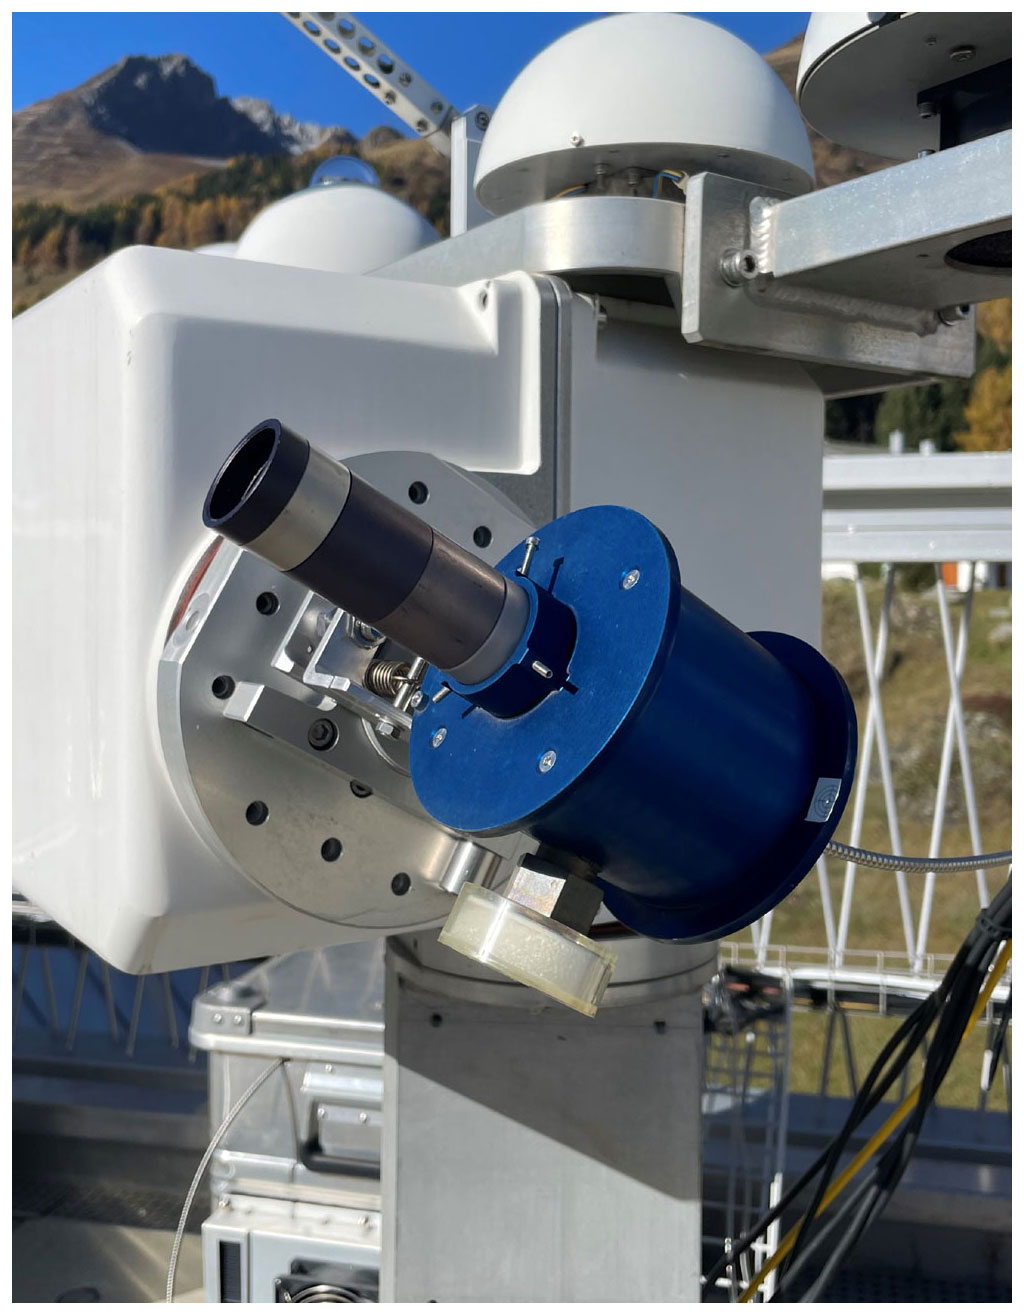
Figure 1The lens-based telescope of Koherent on a sun tracker at the measurement platform of PMOD/WRC. The telescope is connected by an optical fibre to the BTS array spectroradiometer in the temperature-stabilised box.
The postprocessing to prepare the spectra for TCO retrieval was performed off-line with the steps outlined below.
First, the raw counts of the readings were converted to irradiance using in situ calibration with the world reference for UV radiation QASUME (Gröbner et al., 2005; Hülsen et al., 2016 Gröbner et al., 2017). Spectral measurements of QASUME are traceable to the primary spectral-irradiance standard of the Physikalisch Technische Bundesanstalt (PTB) (Gröbner and Sperfeld, 2005) via secondary-standard tungsten–halogen 1 kW FEL lamps. The stability of QASUME is monitored in the field with 250 W tungsten–halogen lamps on the measurement platform (Egli et al., 2022). The responsivity from Koherent was calibrated by the spectra from QASUME at local noon (12:00 UTC) using data from four clear-sky days between 5 and 15 September 2020, when the sun irradiance was as stable as possible over time. This in situ calibration was used for all other days of the 2-year period. Zuber et al. (2021) highlighted the difficulties of laboratory calibration of the telescope entrance optics with poor reproducibility of the calibration. Therefore, the direct in situ calibration with the world UV reference QASUME was chosen for most of the results of this study. The field calibration with QASUME showed a standard deviation of 0.96 %. Combined with the uncertainty of QASUME for direct radiation (0.91 %; Hülsen et al., 2016), the uncertainty of Koherent spectra is about 1.32 %. The lamp calibration will later be used when adjusting the ETC in the double-ratio technique (Sect. 3.2b). Figure 2 displays the ratio between synchronous spectra from QASUME and Koherent for individual wavelength bands normalised to local noon (12:00 UTC), exhibiting an increase for all wavelengths longer than 310 nm of +2 % between SZA 60∘ and 70∘. The wavelength band at 305 nm increases after a small decrease during the morning, up to 4 % at high solar zenith angles. The larger increase at 305 nm is a sign of stray-light impact at shorter wavelengths, which will be addressed and discussed later.
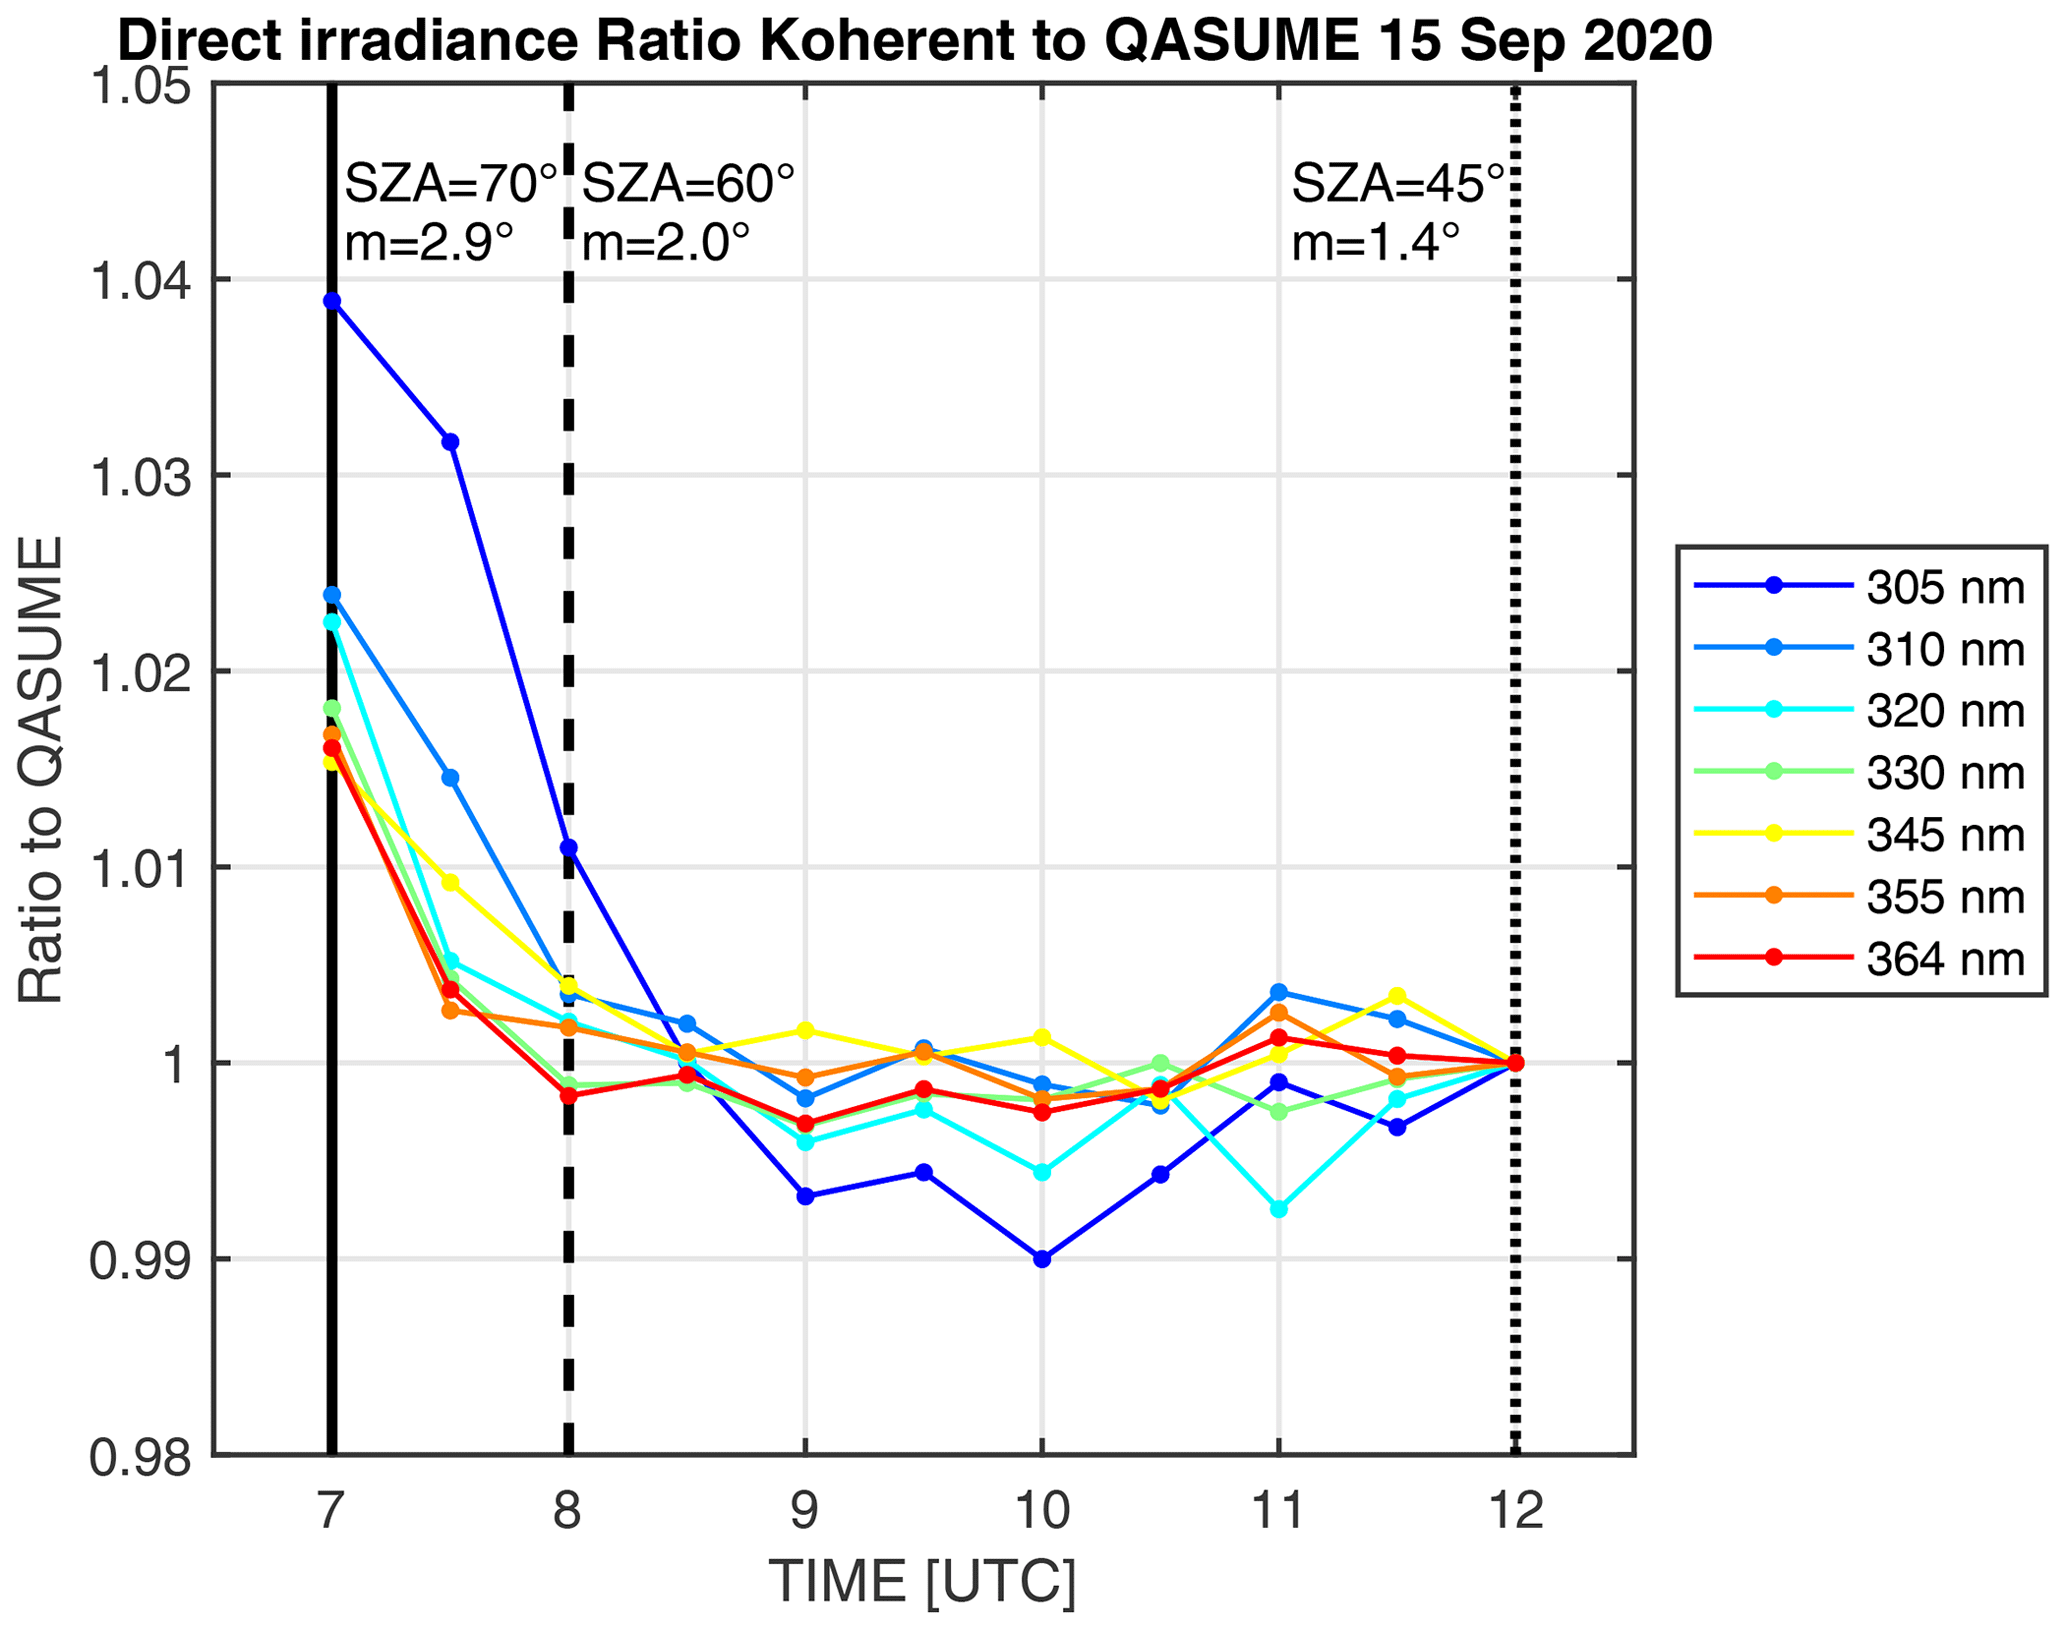
Figure 2Comparison between QASUME and Koherent spectra on the morning of 15 September 2020, displaying the direct-irradiance ratios for individual wavelength bands within ±2.5 nm. The ratios are normalised to the ratio at 12:00 UTC (noon). The solar zenith angles (SZAs) and the air mass (m) for 07:00, 09:00 and 12:00 UTC (noon) are indicated by vertical lines.
The second step of the postprocessing chain, consisting of a wavelength shift correction and spectrum homogenisation using the MatSHIC software developed at PMOD/WRC (Egli et al., 2022), was applied to the Koherent spectrum to obtain a standard spectrum for further retrieval of TCO. For this study, the resulting spectra were homogenised to 0.01 nm wavelength increments and convolved with a triangular slit function of 0.5 nm full width at half maximum for the least-squares (LSF) fit algorithm (see Sect. 2.2) and to 0.1 nm for the custom-double-ratio technique (Sect. 2.3), respectively. The so-homogenised spectra were used to retrieve TCO with the algorithms outlined in the following.
2.2 Least-squares (LSF) fitting algorithm
Egli et al. (2022) presented a revised algorithm to retrieve TCO from spectral-irradiance measurements. The same algorithm, thoroughly tested in Egli et al. (2022), is applied here for TCO retrieval from Koherent. The algorithm used here differs from the algorithm used in Zuber et al. (2021) by the inclusion of the effective ozone temperature as an input parameter and differs in other specific settings (e.g. solar-spectrum Total and Spectral Solar Irradiance Sensor – TSIS; Coddington et al., 2021), as it was shown to be the best configuration in Egli et al. (2022).
In summary, the LSF algorithm uses a spectral least-squares fitting procedure by minimising the residuals of the fit in the wavelength range between 305 to 345 nm and implements an atmospheric model based on the Beer–Lambert law.
In the equation above, Iλ denotes the modelled spectral irradiance at the wavelength λ. indicates the TSIS solar reference spectrum at the top of the atmosphere (Coddington et al., 2021), while the air mass m denotes the path length of radiation through the atmosphere. The atmospheric model accounts for the effect of ozone absorption at each wavelength and furthermore the attenuation by the atmosphere, including aerosols, Rayleigh scattering and sulfur dioxide (SO2). The resulting attenuated modelled solar spectrum using Eq. (1) is then compared with the solar spectrum measured by Koherent by minimising the spectral residuals between the modelled and measured solar spectrum and returning the corresponding model parameters, including TCO (Egli et al., 2022).
For the term of ozone attenuation, , in Eq. (1), the SG14 ozone absorption cross section (Serdyuchenko et al., 2014; Egli et al., 2022) for different effective ozone temperatures (T) is used in the retrieval algorithm. TCO retrieved with SG14 shows a dependency on effective ozone temperature of 0.1% K−1 (Egli et al., 2022). This implies that the effective ozone temperature is required as input for the TCO retrieval algorithm to achieve uncertainties in retrieved TCO of less than about 1%. In analogy to Gröbner et al. (2021) and Egli et al. (2022), the effective ozone temperature retrieved from balloon sounding at the nearest sounding station in Payerne, Switzerland, is taken as daily input for the retrieval algorithm. Since ozone soundings take place three times a week, the effective temperatures from ozone sondes were linearly interpolated to daily values. Moreover, ozone and temperature above the sonde burst height are calculated by extending the measured ozone and temperature profiles with the standard ozone and temperatures taken from the US Standard Atmosphere temperature and ozone density values just below the sonde burst height, as in Gröbner et al. (2021). The term in Eq. (1) denotes the attenuation by aerosol optical depth. The wavelength dependence of the aerosol optical depth is parameterised linearly, normalised to 340 nm. The term of Eq. (1) accounts for the effect of Rayleigh scattering in the atmosphere, which is parameterised according to Bodhaine et al. (1999) and requires the air surface pressure p. Since the LSF retrieval is insensitive to pressure changes of ±7 hPa in Davos, which results in ±0.014 % in TCO (Egli et al., 2022), p is selected from the pressure climatology in Davos as 820 hPa for Davos. The attenuation by SO2 is also considered in the overall attenuation equation (Eq. 1), even though the amount of SO2 in the atmosphere above Davos is insignificant (Gröbner et al., 2021). Accounting for all four terms of attenuation in the Beer–Lambert atmospheric model, the LSF approach derives the best fit to the unknown parameters of aerosol optical depth (AOD) and TCO. The air mass m, denoting the path length of radiation through the atmosphere, is calculated based on the geometry between the Earth, the atmosphere and the sun for each time stamp when the spectrum was measured. The air mass for the ozone (, aerosol (mAOD), Rayleigh (mR) and SO2 ( is calculated from the Standard US Atmosphere profile for mid-latitudes (NOAA, 1976), as applied in Egli et al. (2022).
2.3 Custom-double-ratio (CDR) technique
A second approach to retrieve TCO from the spectral measurements is to apply the double-ratio technique from four specific wavelengths, as used for the Brewer TCO retrieval (Kerr et al., 1985). This allows Koherent to be calibrated by adjusting the extraterrestrial constant in the same manner as other instruments using the double-ratio technique. In contrast, the LSF retrieval requires calibrated spectra from a spectral reference such as QASUME. Spectral measurements from Koherent allow one to select specific wavelengths from the measured spectrum and to apply the double-ratio technique in the same way as for the Brewer.
Following the notation of Gröbner et al. (2021), who summarised the double-ratio technique for Brewer and Dobson, we present here the principle of the custom-double-ratio (CDR) technique for Koherent.
In analogy to the LSF retrieval, the absorption through the atmosphere is based on the Beer–Lambert law (Eq. 1). The equation can be rewritten for the CDR technique as follows:
where I is the measured spectrum, I0 is the top-of-atmosphere reference spectrum, and τλ is the total optical depth from the different absorption and attenuation terms. Contrary to Eq. (1), where λ indicates each individual wavelength of the measured spectrum, λ denotes one of the four wavelengths for the double-ratio technique. For the CDR, we have selected the four wavelengths [310, 322, 332, 345] nm to obtain a significant sensitivity to ozone absorption. The selection of the wavelength is empirically based on a shift of 5 nm from the nominal wavelengths of the Dobson ( [305.4, 324.9, 317.4, 339.7]). These wavelengths revealed a better performance in terms of offset and seasonal amplitude than other wavelengths within these wavelength ranges. However, all possible combinations of wavelength setting were not tested. Moreover, ICDR(λ) is not the solar irradiance at only one specific wavelength of the measured spectrum; it indicates the integral of the spectrum over defined slit functions si(λ) (Fig. 3 and Eq. 3) with the centre wavelength at .
The index CDR indicates the integral over the slit function si(λ) (Eq. 3), not only of the measured spectrum but, later, also of the solar spectrum, the ozone absorption cross section and the Rayleigh scattering. The slit functions si(λ) for the CDR are rectangular slit functions with the width of 1 nm for the wavelengths 310 and 322 nm (i=1, 2) and the width of 4 nm for the wavelengths 330 and 345 nm (i=3, 4), respectively (see Fig. 3, blue rectangles). The different sizes of the widths for shorter and longer wavelengths are chosen in analogy to the Dobson slits, where the width is about 1 nm at shorter wavelengths and about 4 nm at longer wavelengths.
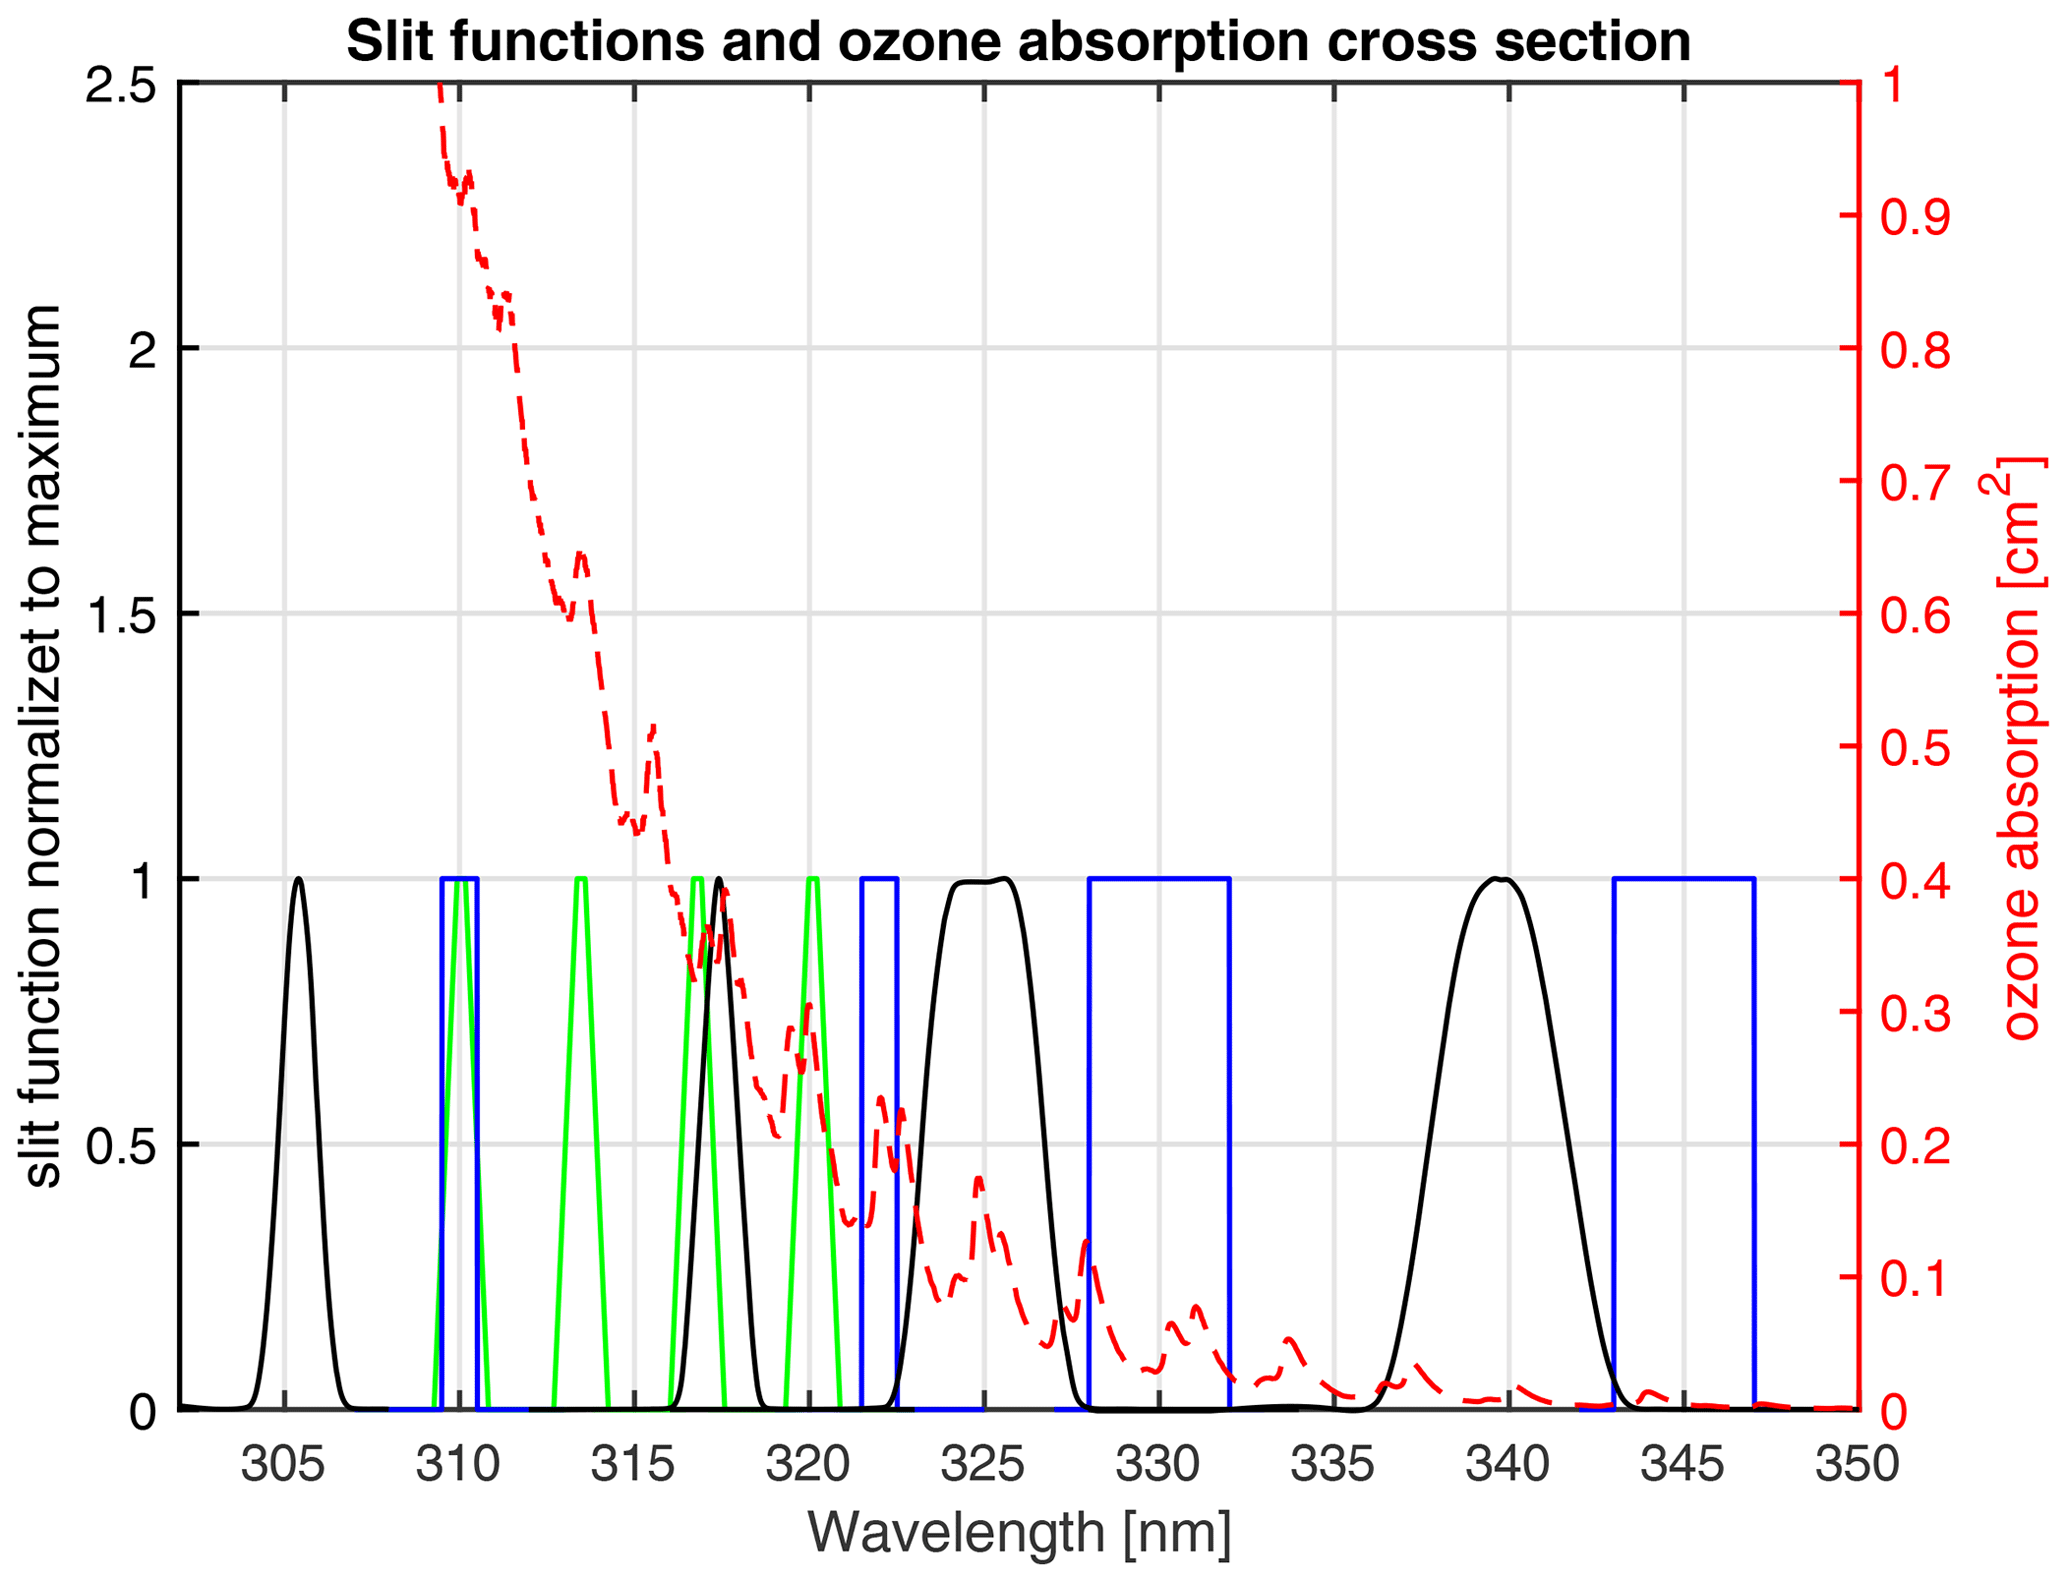
Figure 3Slit functions of the custom-double-ratio technique for Koherent (blue), the trapezoidal slit functions of the Brewer (green) and the measured slit function of Dobson 101 (black). The dashed red line indicates the ozone absorption cross section SG14 at effective temperature of 228 K.
As stated in Gröbner et al. (2021), the effect of sulfur dioxide and nitrogen dioxide can be neglected for the atmosphere in Davos. However, the attenuation from Rayleigh scattering needs to be subtracted from the total optical depth τ to retrieve the optical depth for ozone in the UV band as follows:
where and mR are the effective air mass of ozone and Rayleigh scattering. Gröbner et al. (2021) showed with balloon soundings from Payerne that the effective ozone height can change from 20.2 to 23.8 km (mean = 22.3 km) within a season. For comparability with Brewer 156, we have also chosen here a constant ozone layer of 22 km and the effective molecular-scattering height relevant for Rayleigh scattering of 5 km, which is the nominal operating procedure for Brewers. The difference between the effective ozone height and 22 km results in a maximum uncertainty of 0.3 % of TCO at the highest air mass of 3.9 in Davos. This effect is considered in the overall uncertainty budget of the CDR algorithm (Sect. 3.3). α(λ,T) is the SG14 cross section depending on effective ozone temperature, as described later. The influence of absorption and scattering by aerosols in the atmosphere is minimised by using ratios of measurements at close wavelengths. TCO is then retrieved by a linear combination of the measurements, the solar spectrum and the Rayleigh scattering term from the four specific wavelengths ,
where is the logarithmic sum of the solar irradiance. Accordingly, the terms for the top-of-the-atmosphere solar irradiance are calculated by the weighted sum of the logarithmic solar reference spectrum TSIS (Coddington et al., 2021). For the CDR algorithm used here, the weights are equally chosen in analogy to the Dobson retrieval [+1 −1 −1 +1] to calculate the ratios of measurements for the best performance. Finally, since the absorption cross sections are measured in cm−2, TCO in Eq. (5) was multiplied by the factor 1000 to obtain Dobson units (DU).
The ozone absorption coefficient αi at wavelength λi is derived by the SG14 (Serdyuchenko et al., 2014) cross section SG14(λT), where T is the effective ozone temperature from balloon soundings in Payerne, Switzerland (see Sect. 2.2). The ozone absorption coefficient is calculated for the four wavelengths by the same convolution as that described in Eq. (3), replacing Ii(λ) by SG14(λ,T).
The weighted ozone absorption coefficient Δα for Eq. (5) is then derived by the weighted sum of αi, .
The Rayleigh attenuation term Δβ for Eq. (5) is calculated again based on Eq. 3 and the weighted sum by replacing Ii(λ) with the parameterisation according to Bodhaine et al. (1999), requiring the climatological air surface pressure p=820 hPa in Davos, Switzerland, as input. A sensitivity analysis showed that TCO is 0.09 % sensitive to pressure changes of ±7 hPa in Davos.
The algorithm presented above can also be adapted to apply a double-ratio Brewer retrieval with Koherent spectra when using the trapezoidal slit functions of the Brewer with a full width at half maximum (FWHM) of around 0.55 nm at wavelengths [310.0, 313.5, 316.8, 320.1] nm (Fig. 3, green lines) with weightings of [+1 −0.5 −2.2 +1.7] (Gröbner et al., 2021).
Analogously, the Dobson retrieval can be applied by using the measured slit functions of the automated Dobson D101 (Stübi et al., 2021) derived from a tuneable and portable radiation source (TuPS, Šmíd et al., 2021). The measurement of the slit functions revealed centre wavelengths of [305.4, 324.9, 317.4, 339.7] and FWHM of around 1 nm for the two shorter wavelengths and around 4 nm for the two longer wavelengths (Köhler et al., 2018). The slit functions are shown in Fig. 3 for the Brewers (trapezoidal slit functions), the Dobsons (measured by TuPS) and the CDR technique (rectangular shapes) introduced here. The slit functions, the centre wavelengths and the weightings of the CDR retrieval differ from the Brewer or Dobson wavelengths and are chosen for Koherent for the best performance of the CDR retrieval with Koherent. The performance will be presented and discussed in the following section.
The results of TCO from Koherent are compared with TCO from the Brewer 156 double monochromator operated at PMOD/WRC. Due to the long-term quality assurance and strong stray-light suppression of the Brewer 156, the instrument was chosen to serve as a reference for the 2-year period between 1 October 2019 and 30 September 2021. Additionally, some aspects of Koherent are compared with two single Brewers, 040 and 072, and Dobson 101 from MeteoSwiss operated at PMOD/WRC. Koherent, Brewer 072 and the Dobson 101 were co-located in Davos, Switzerland, during the entire period of comparison. Brewer 040 moved to Davos in February 2021. In contrast to Zuber et al. (2021), who used the standard Brewer TCO with a Bass and Paur cross section (Bass and Paur, 1985), TCO from the Brewer 156 instrument is calculated with the SG14 cross section, as presented in Gröbner et al. (2021). The following graphs show the relative differences of quasi-simultaneous TCO within a 5 min interval in relation to TCO from the Brewer 156 indicated in percent. The missing period of TCO comparisons in the figures is attributed to some testing of Koherent and has been removed from the comparison.
In the following, the comparison is quantified in terms of offset, which indicates the averaged differences between the instruments, and seasonal amplitude, which shows the amount of seasonal effect by displaying a sinusoidal fit to the differences. The slant path dependency is the relation between the relative differences and the ozone slant path column, which is defined as the product of TCO and air mass. To quantify the ozone slant path dependency, the difference between the maximum and the minimum of the quadratic fit in the slant path column between 300 and 1200 DU is calculated.
3.1 LSF retrieval
3.1.1 Wavelength range 305 to 345 nm
Table 1 lists the comparison of TCO between Brewer 156 and Koherent when applying the LSF retrieval and using the spectral range between 305 and 345 nm for the spectral fitting. The results show that, on average, over the entire period, Koherent slightly overestimates TCO with an offset of 0.26 %. However, a significant seasonal amplitude of 1.17 % is observed as well. Zuber et al. (2021) compared Koherent to the double-monochromator Brewer 163 using a first version of the LSF algorithm without taking into account the effective ozone temperature as an input parameter and using the Bass and Paur cross section (Bass and Paur, 1985). Their results show a standard deviation of around 2.72 % with an offset of −1.64 % and a seasonal amplitude of around 2 %. Our result indicates that the inclusion of the effective ozone temperature improves the agreement of the Koherent and Brewer double-monochromator with the SG14 cross section.
Table 1Comparison of the performance of different TCO retrievals for Koherent and other TCO instruments. The double-monochromator Brewer 156 is chosen as the reference instrument for the comparison. LSF stands for least-squares-fit retrieval, and CDR stands for custom-double-ratio technique. The offsets indicate the long-term bias over the entire period of comparison (1 October 2019 to 30 September 2021). The seasonal amplitude indicates the amplitude of a sinusoidal fit of the TCO relative differences over the years (see Fig. 6), and the slant path quantification indicates the difference of the ozone slant path dependency of a quadratic fit of the TCO relative differences (see Figs. 3 and 4).
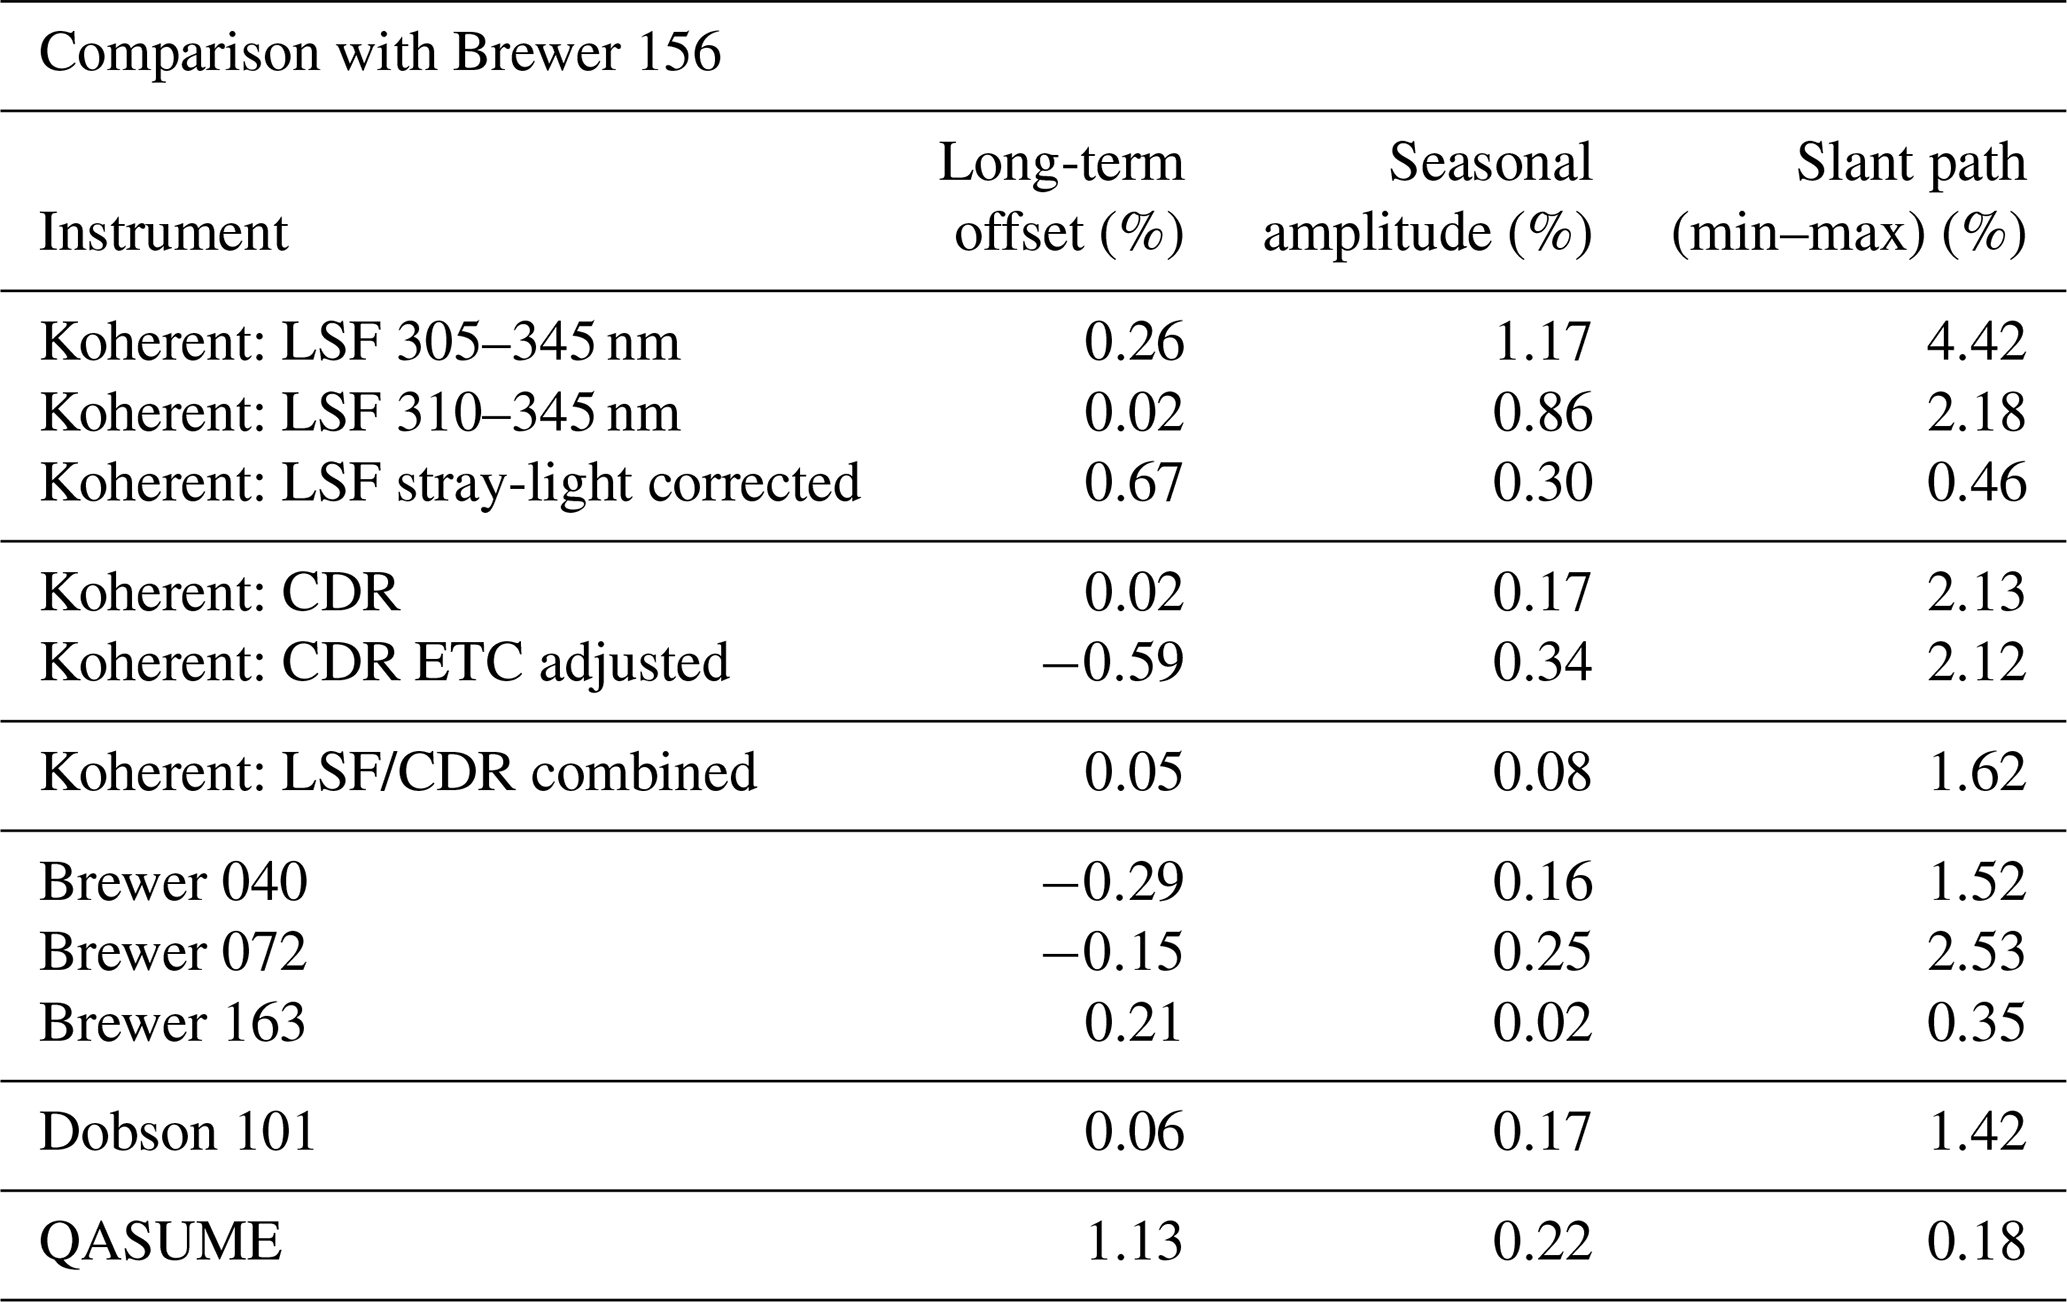
Figure 4 displays the dependency of the relative differences on the ozone slant path column. The circles are averages of the 5 min values between intervals of 100 DU of ozone slant path column. The lines are a quadratic fit of the 5 min values, which are not shown in the figure. The graph shows a strong dependency of the relative TCO differences on an ozone slant column of 4.42 % (Table 1). This figure and the seasonal cycle indicate that the biases are larger at higher air masses or high solar zenith angles. The observed seasonal cycle may be caused by stray light at shorter wavelengths. This hypothesis is supported by the results in Fig. 2 (lower panel), where solar spectra from Koherent deviate more at shorter wavelengths (305 nm) than at wavelengths longer than 310 nm with respect to the QASUME solar reference spectra. In order to further support this hypothesis, the wavelength range of the LSF retrieval was changed to 310 to 345 nm.
3.1.2 Wavelength range 310 to 345 nm
Restricting the wavelength range from 310 to 345 nm, the seasonal cycle can be reduced to 0.86 %, with an offset close to zero (Table 1). Figure 4 also shows a lower ozone slant path dependency of 2.18 % between maximum and minimum than for the 305 to 345 nm wavelength range. As shown in Fig. 2, at low solar zenith angles (SZAs), all wavelength regions are within 0.5 %. At higher SZAs (>60∘), the wavelength region around 305 nm deviates up to 2 % (at SZA 70∘) compared to the other wavelengths. This spectral bias explains the slant path dependency change when restricting the wavelength range to 310 to 345 nm.
As shown in Sect. 2.1, the measuring time for each spectrum can vary from 45 s up to 150 s. The longer measurement time of 150 s at an air mass of 3.5 leads to air mass changes of up to 1.15 % during this time span. This effect may also contribute to the observed slant path dependency but is minor compared to the contribution of stray light.
3.1.3 Stray-light correction
An alternative method to account for the effect of stray light is to apply a correction to the TCO retrieved by LSF. For this purpose, four full clear-sky days between 5 and 15 September 2022 were chosen to parameterise the slant path dependency between the LSF-retrieved TCO of QASUME (Egli et al., 2022) and the LSF-retrieved TCO of Koherent by means of a linear fit. Both LSF retrievals used the wavelength range between 305 and 345 nm. The coefficients of this linear fit were then applied to all LSF retrievals from Koherent for the entire 2-year period. Figure 4 (red line) shows a resulting improved slant path dependency of 0.46 %. For comparison, the slant path dependency between the two double-monochromator instruments Brewer 156 and QASUME is displayed in Fig. 4 (grey line). The maximal difference between the two instruments shown by the grey line in Fig. 4 is 0.18 % (Table 1), which is similar to the slant path dependency between two Brewer double monochromators (Brewer 163 vs. Brewer 156, Table 1) of 0.35 % and is in the range of the stray-light-corrected LSF retrieval. However, the red circles in Fig. 4 show that the slant path dependency of stray-light-corrected Koherent LSF is similar to the QASUME–Brewer-156 comparison, restricted to an ozone slant path between 300 and 900 DU. For an ozone slant path higher than 900 DU, Koherent shows a significant bias, which is not observed between the two double-monochromator Brewers.
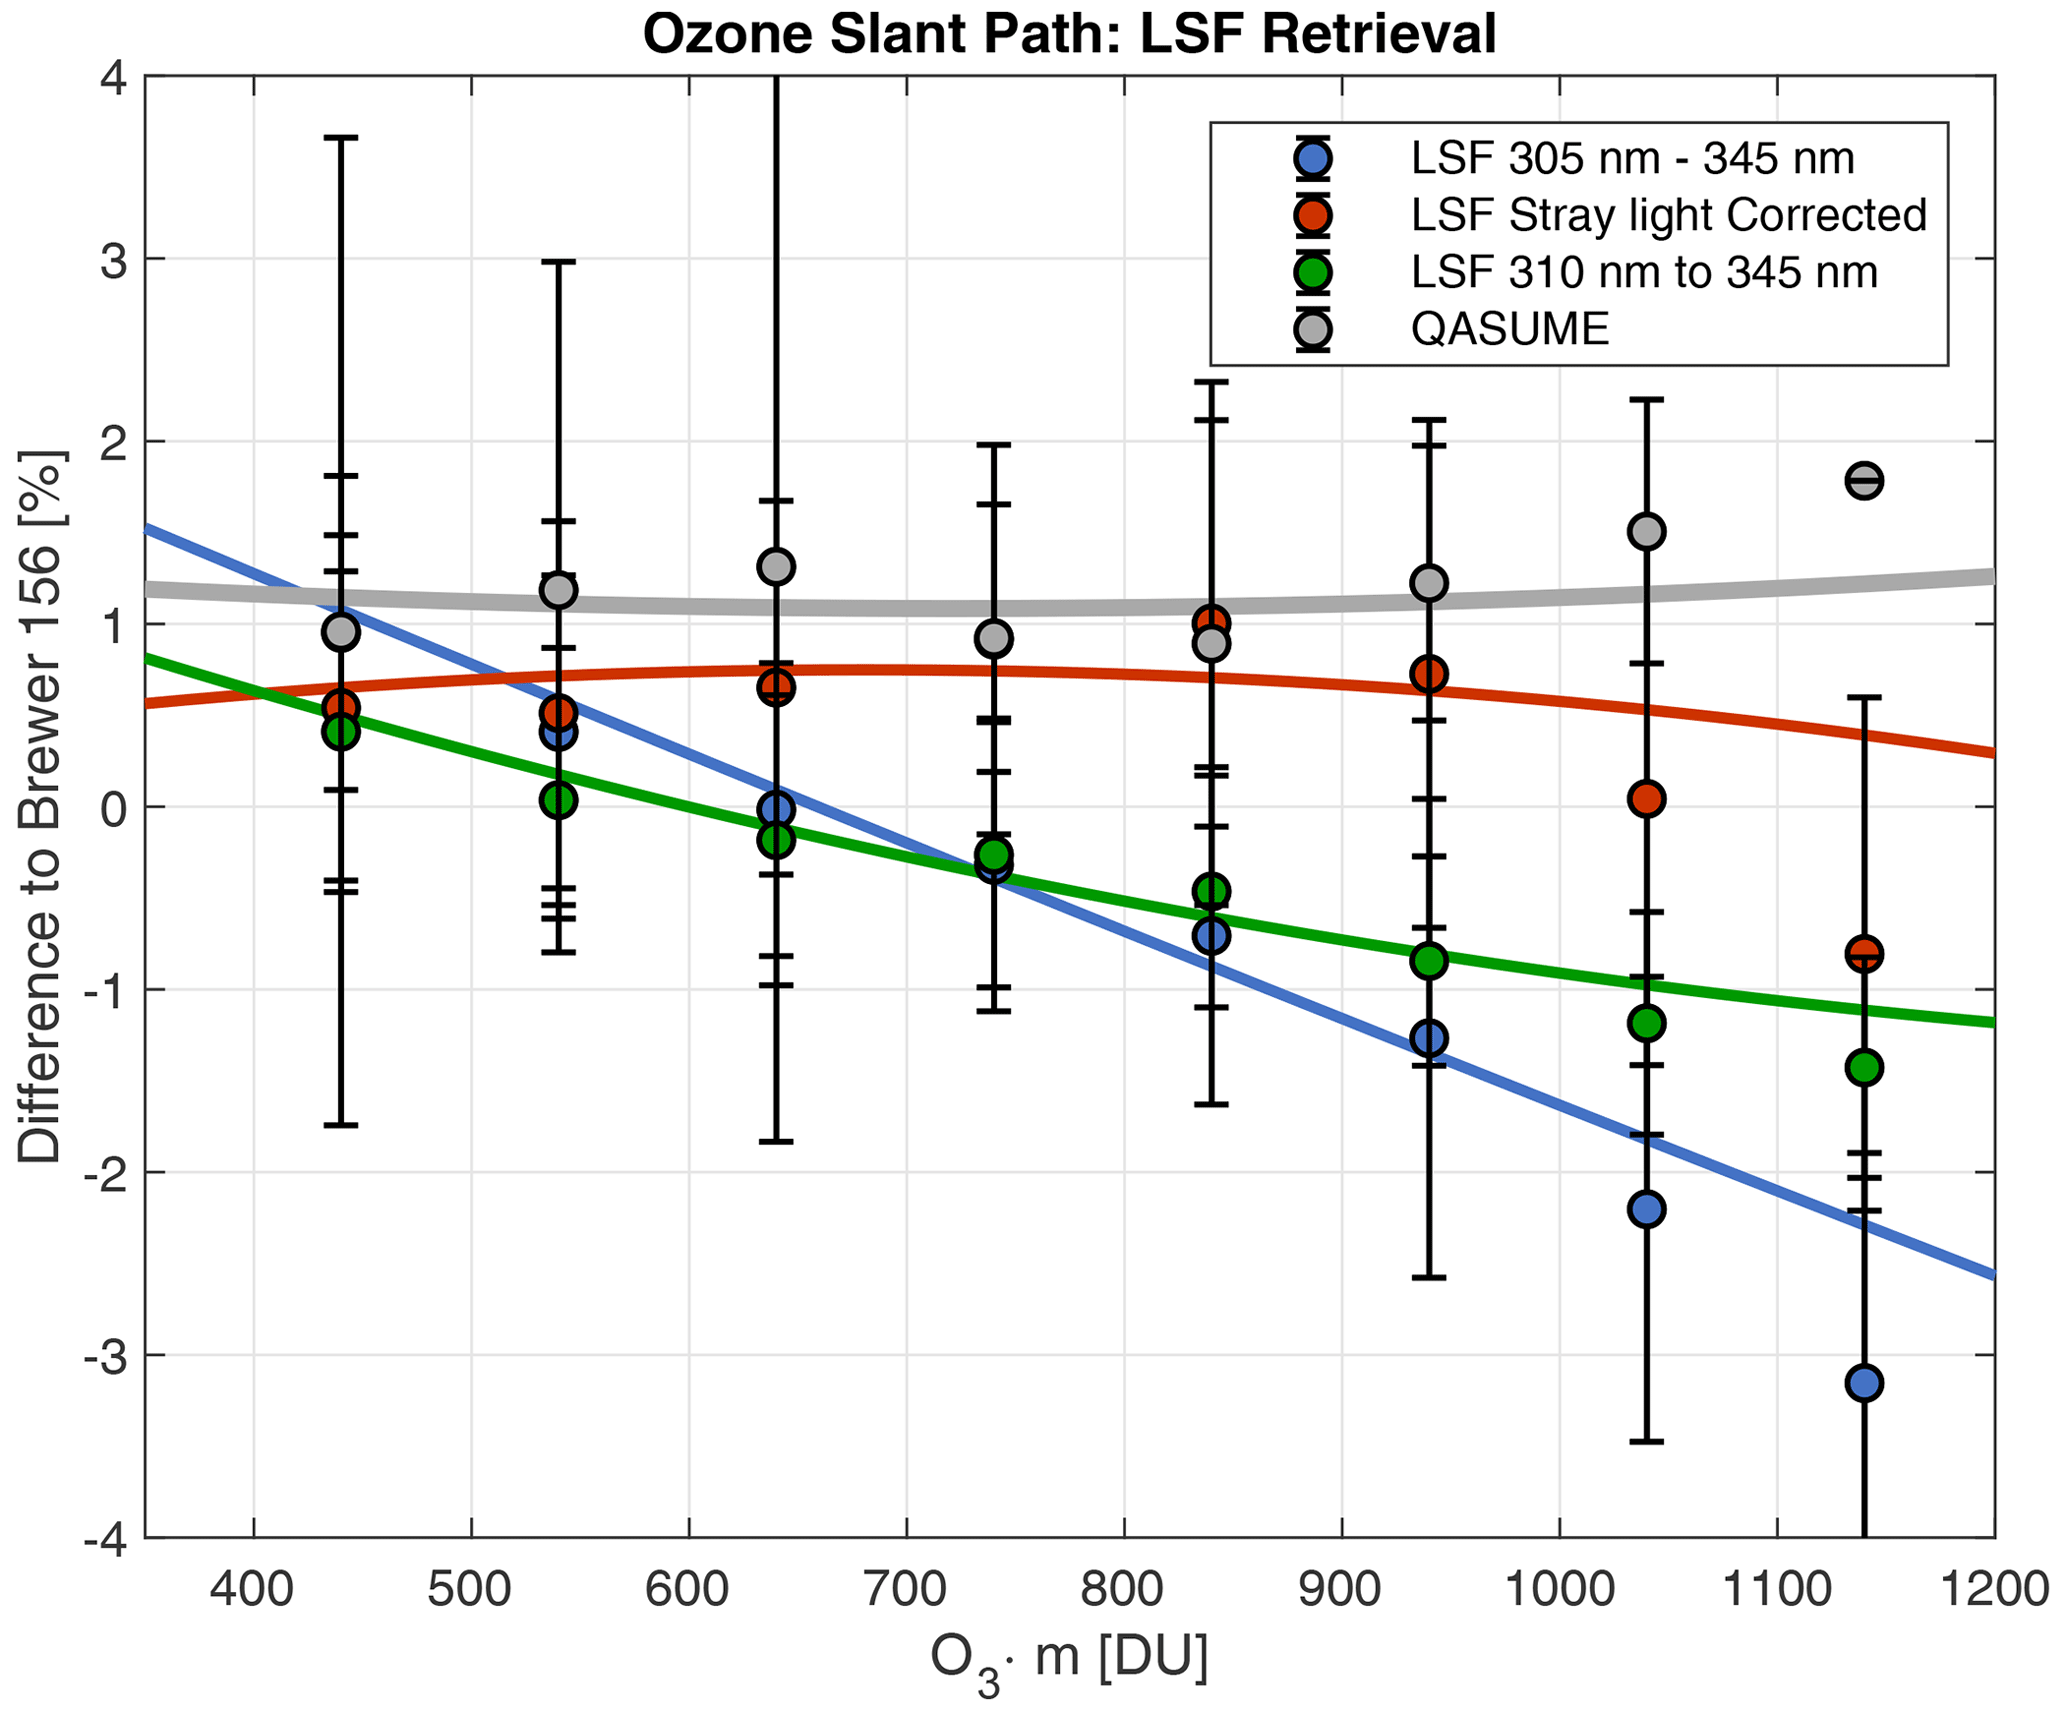
Figure 4Ozone slant path comparison of Koherent LSF retrieval with the double-monochromator Brewer 156 for the retrieval in the wavelength range of 305–345 nm (blue), the retrieval in the wavelength range of 310–345 nm retrieval (green), and the stray-light-corrected retrieval (red). For comparison, the performance of QASUME is indicated in grey. The lines indicate quadratic fits to all measurements, which are not specifically shown. The circles are averages on 100 DU bins.
3.2 Custom-double-ratio technique
3.2.1 CDR from calibrated spectra
As described in Sect. 2.3, TCO can also be retrieved by the CDR technique using the four specific wavelengths and the rectangular slit functions (Fig. 3). Table 1 presents the results of the 2-year comparison of Koherent CDR with the Brewer 156 double monochromator. The amplitude of the seasonal cycle is about 0.17 %, with an offset of 0.02 %. This low amplitude is substantially reduced compared to the LSF retrieval. Figure 5 blue circles and lines show the relative differences between the TCO of Brewer 156 and Koherent depending on the ozone slant path. The minimum-to-maximum dependency of the quadratic fit on the slant path is around 2.1 % (Table 1).
For comparison, Fig. 5 grey circles and lines show the slant path dependency of the relative differences between Brewer 156 and the single-monochromator Brewer 072. The maximum to minimum of the quadratic fit of the data reveals a slant path dependency of 2.53 % (Table 1). Table 1 also lists the slant path dependency of the single-monochromator Brewer 040 on Brewer 156, which is 1.52 %. The performance of Koherent CDR lies between the two single Brewers 040 and 072, which indicates that the TCO retrieval from Koherent CDR performs at least as well as that from a single Brewer monochromator with respect to ozone slant path. This CDR retrieval algorithm does not require any field calibration of TCO by adjusting the extraterrestrial constant (ETC) or the ozone absorption coefficient with a reference instrument, as is required for the standard double-ratio technique with Brewer or Dobson. Instead, this CDR algorithm requires only a one-time vicarious calibration of the spectra with QASUME, the laboratory-measured ozone cross sections (SG14; Serdyuschenko et al. 2014), the Rayleigh-scattering absorption coefficients (Bodhaine et al., 1999) and the space-borne top-of-atmosphere solar reference spectra (Coddington et al., 2021) for the extraterrestrial constant (, Eq. 5).
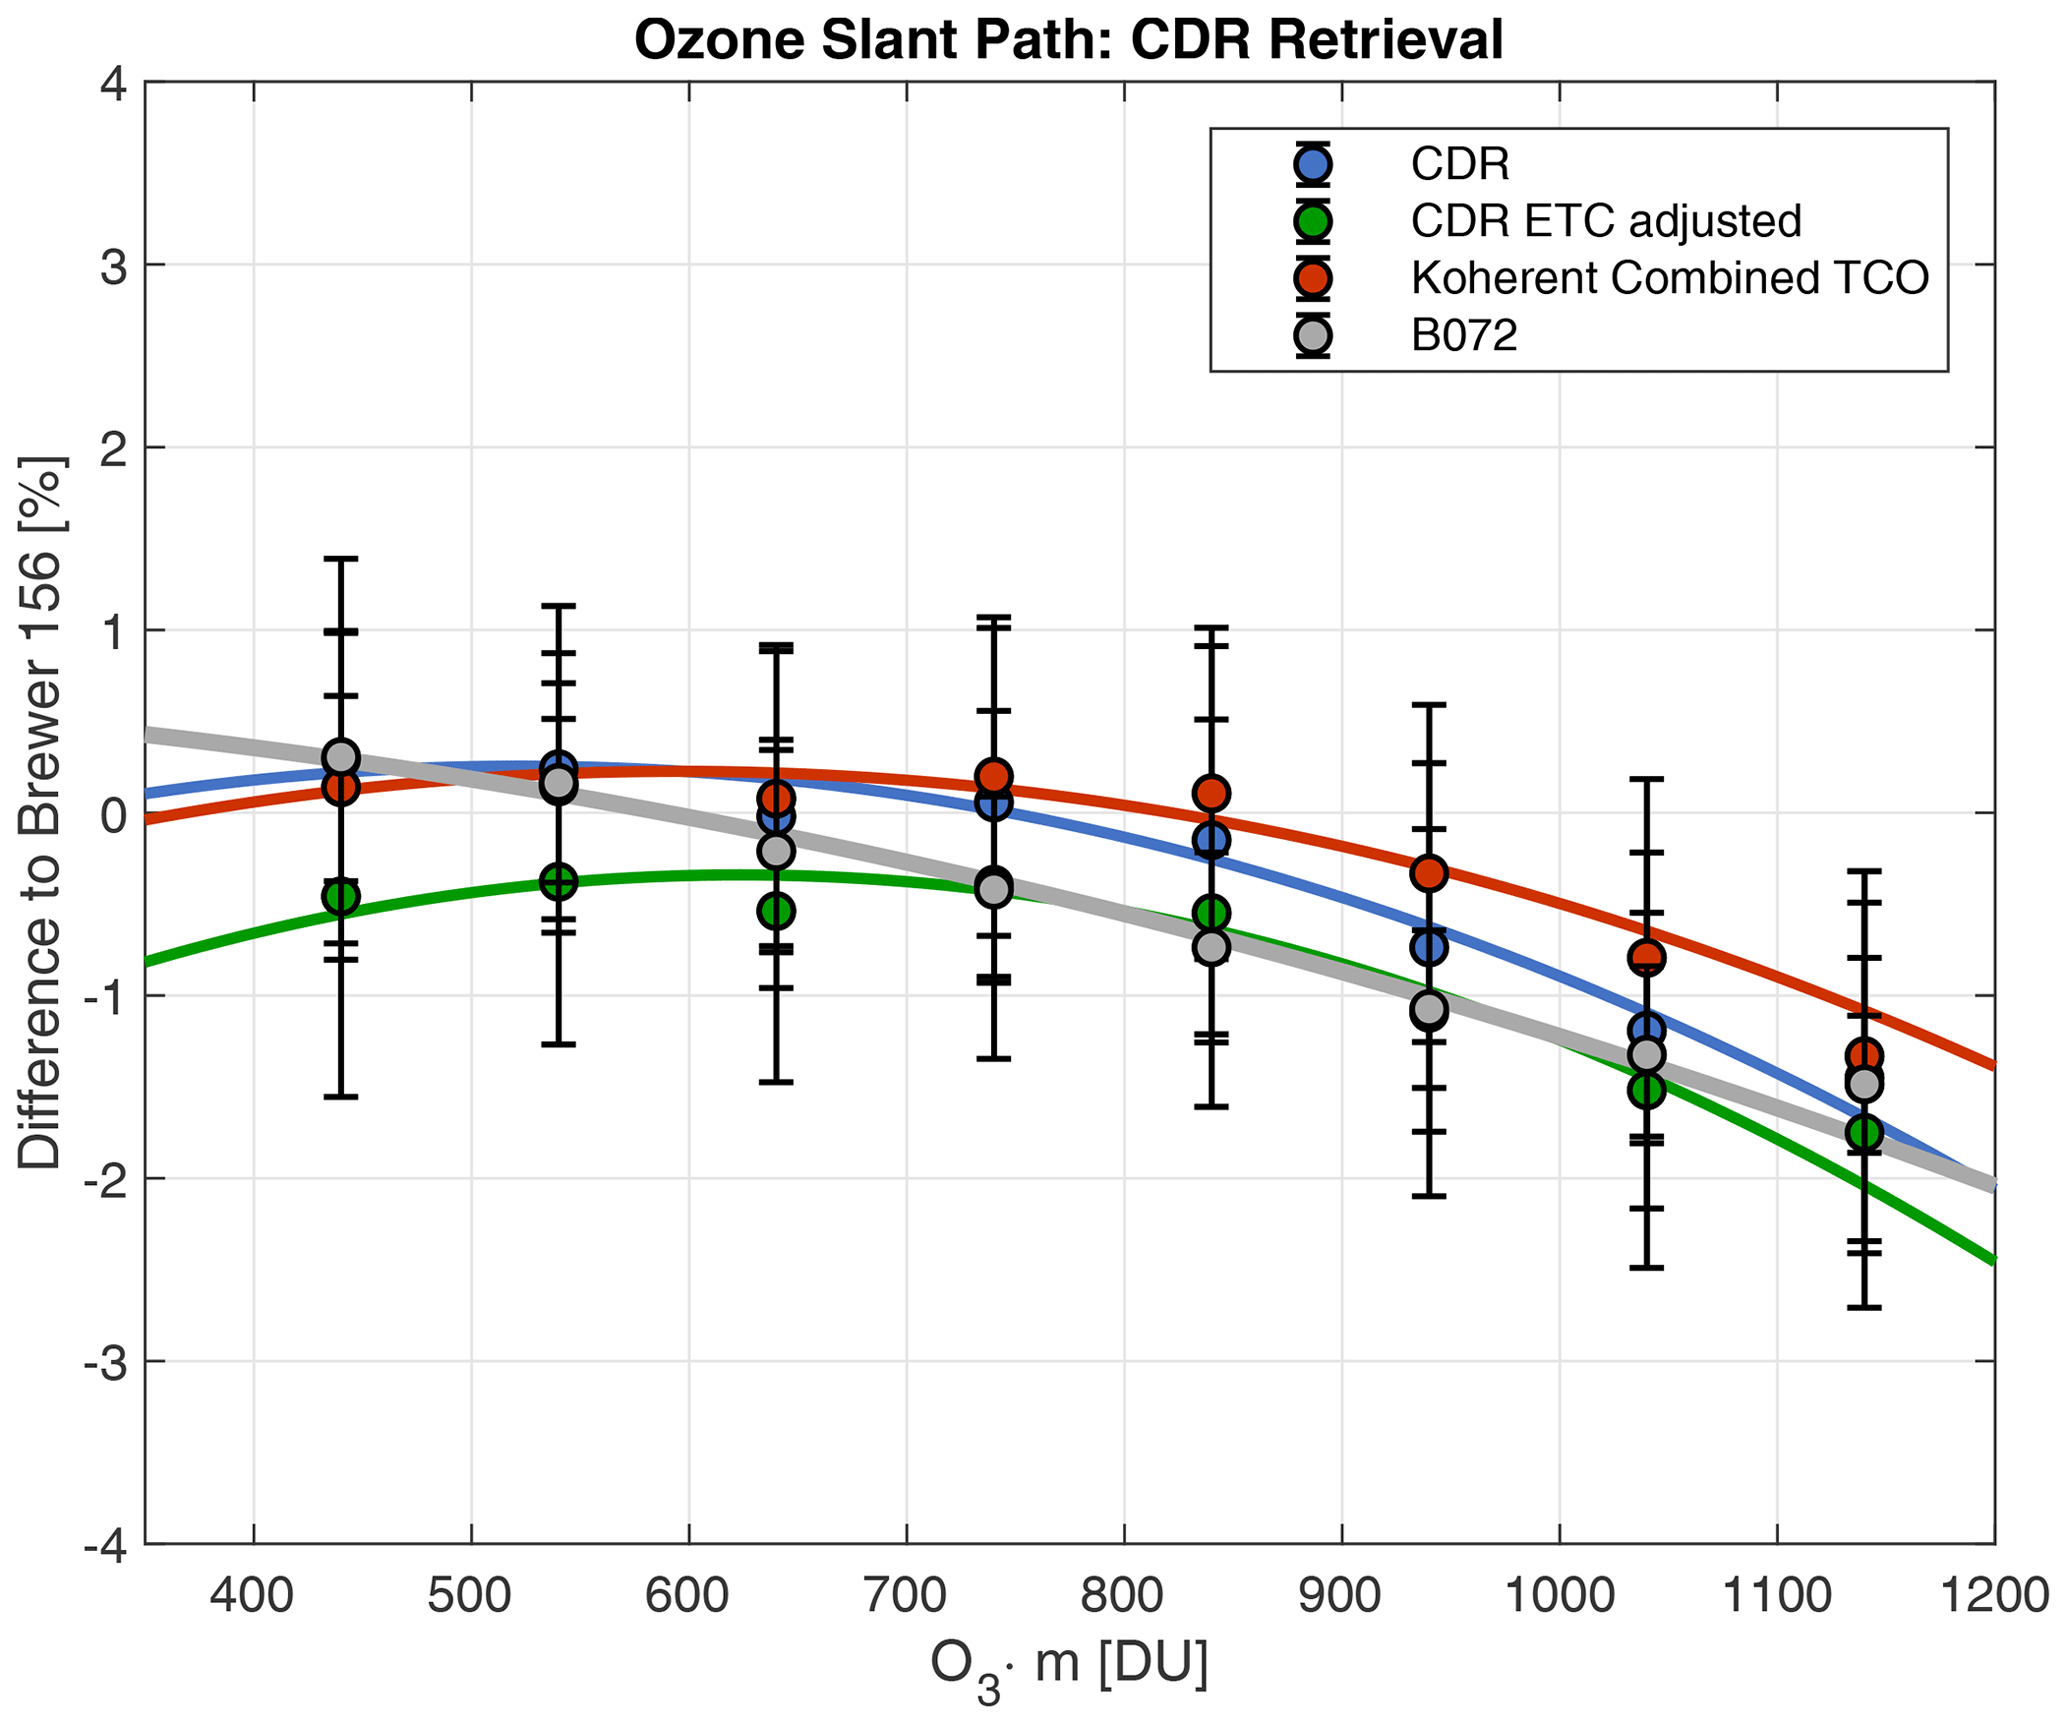
Figure 5Ozone slant path comparison of Koherent CDR retrieval with the double-monochromator Brewer 156 for standard CDR retrieval (blue), ETC-adjusted CDR retrieval (green), and LSF–CDR combined retrieval (red). For comparison, the performance of the single-monochromator Brewer 072 is indicated in grey. The lines indicate quadratic fits to all measurements, which are not specifically shown. The circles are averages on 100 DU bins.
3.2.2 CDR with adjusted ETC
Since CDR is analogous to the Brewer and Dobson retrieval algorithm, which requires the determination of the extraterrestrial constant by comparison with a reference instrument (Redondas et al., 2019; Komhyr, 1989), (Eq. 5) could also be determined by an intercomparison with a reference instrument. For Dobsons, only the ETC is adjusted according to the reference Dobson, since the ozone absorption coefficient is set to a nominal value (Komhyr, 1989), assuming that the slits have been correctly adjusted during calibration of the Dobson. For Brewers, the adjustment of ETC is provided by a dedicated reference Brewer, e.g. from the Regional Brewer Calibration Center Europe (RBCC-E), by periodic in situ intercomparison campaigns (Redondas et al., 2019). Since the reference Brewer is calibrated on an absolute scale and the ozone absorption coefficient may vary specifically for each instrument, not only the ETC but also the absorption coefficient Δα (Eq. 7) can be adjusted in a so-called two-point calibration, where both the ETC and the ozone absorption coefficient are retrieved from the intercomparison with a reference Brewer.
In order to avoid the calibration and validation with the same instrument, we have chosen an alternative approach to determine the ETC for Koherent by using QASUME as a reference and validating the resulting TCO with Brewer 156. Since changes of the ETC affect the ozone slant path dependency, the adjustment of Koherent's ETC is performed by minimising the slope of the dependency between air mass and the relative difference of QASUME and Koherent. Using the laboratory-based calibration of Koherent instead of the QASUME in situ calibration, 4 clear-sky days between 5 and 15 September 2020 have been chosen to adjust the extraterrestrial constant of Koherent in comparison with QASUME. This adjustment displays a relative calibration using the relative differences of QASUME and Koherent only. To avoid the inclusion of absolute TCO of this calibration, we have further chosen the air mass only as a regression parameter instead of the slant path. Finally, to further minimise the effect of stray light from Koherent, an air mass range of less than 2 is used for minimising the slope.
The so-adjusted ETC was used in the CDR algorithm to test the performance of the procedure. The 2-year comparison to Brewer 156 of Koherent TCO retrieved by CDR with the adjusted ETC shows an offset of −0.59 % and a seasonal amplitude of 0.34 % (Table 1) and is therefore well within the performance of the other retrievals (Table 1) or within comparisons of Arosa and Davos Brewers (Stübi et al., 2017a, b). Figure 5 green circles and green lines show the slant path dependency of around 2 % from maximum to minimum, which is similar to that of the CDR retrieval and which is also less than the performance of Brewer 072 (Fig. 5, grey circles and line). The adjustment of the ETC by minimising the slope of the air mass dependency is not a standard method but is used here as an alternative method for determining the ETC with QASUME without any QASUME spectral or absolute TCO calibration. However, as previously mentioned, the CDR algorithm can be calibrated with a well-established calibration procedure if a network reference instrument such as the Brewer from RBCC-E is available (Redondas et al., 2019). This study shows that some calibration days during a field campaign are sufficient to obtain an ETC calibration which is stable over the 2 years.
3.3 Combining LSF and CDR
Since the methods presented in Sect. 2 are different but scientifically valid approaches and since the validation with Brewer 156 showed comparable results, the three methods (LSF, CDR and ETC-adjusted CDR) were merged to obtain a combined dataset of TCO from Koherent by averaging all TCO values from the three methods. This averaged product displays a general estimation of TCO from the different methods, while the individual retrieval can be used for different applications for observing TCO. In order to obtain such a general TCO estimation, we have merged the stray-light-corrected LSF, the CDR and the ETC-adjusted CDR datasets into one combined dataset. Figure 6 shows the entire temporal course between 1 October 2019 and 30 September 2021 of the combined TCO dataset. The small blue points indicate the 5 min measurements, and the light-blue circles show monthly averages. The offset between combined TCO and Brewer 156 is close to zero, with a seasonal amplitude of 0.08 %. Figure 5 red circles and lines and Table 1 additionally highlight that the slant path dependency is comparable to the performance of a single-monochromator Brewer. The averaging of the three different retrieval results allows one to determine the standard deviation of each retrieval. The grey area in Fig. 6 indicates the mean relative standard deviation of the individual retrieval in relation to their average. The resulting 0.88 % can be considered to be the lower level of uncertainty (k=1) of TCO retrieved by Koherent when using different methods and calibration procedures.
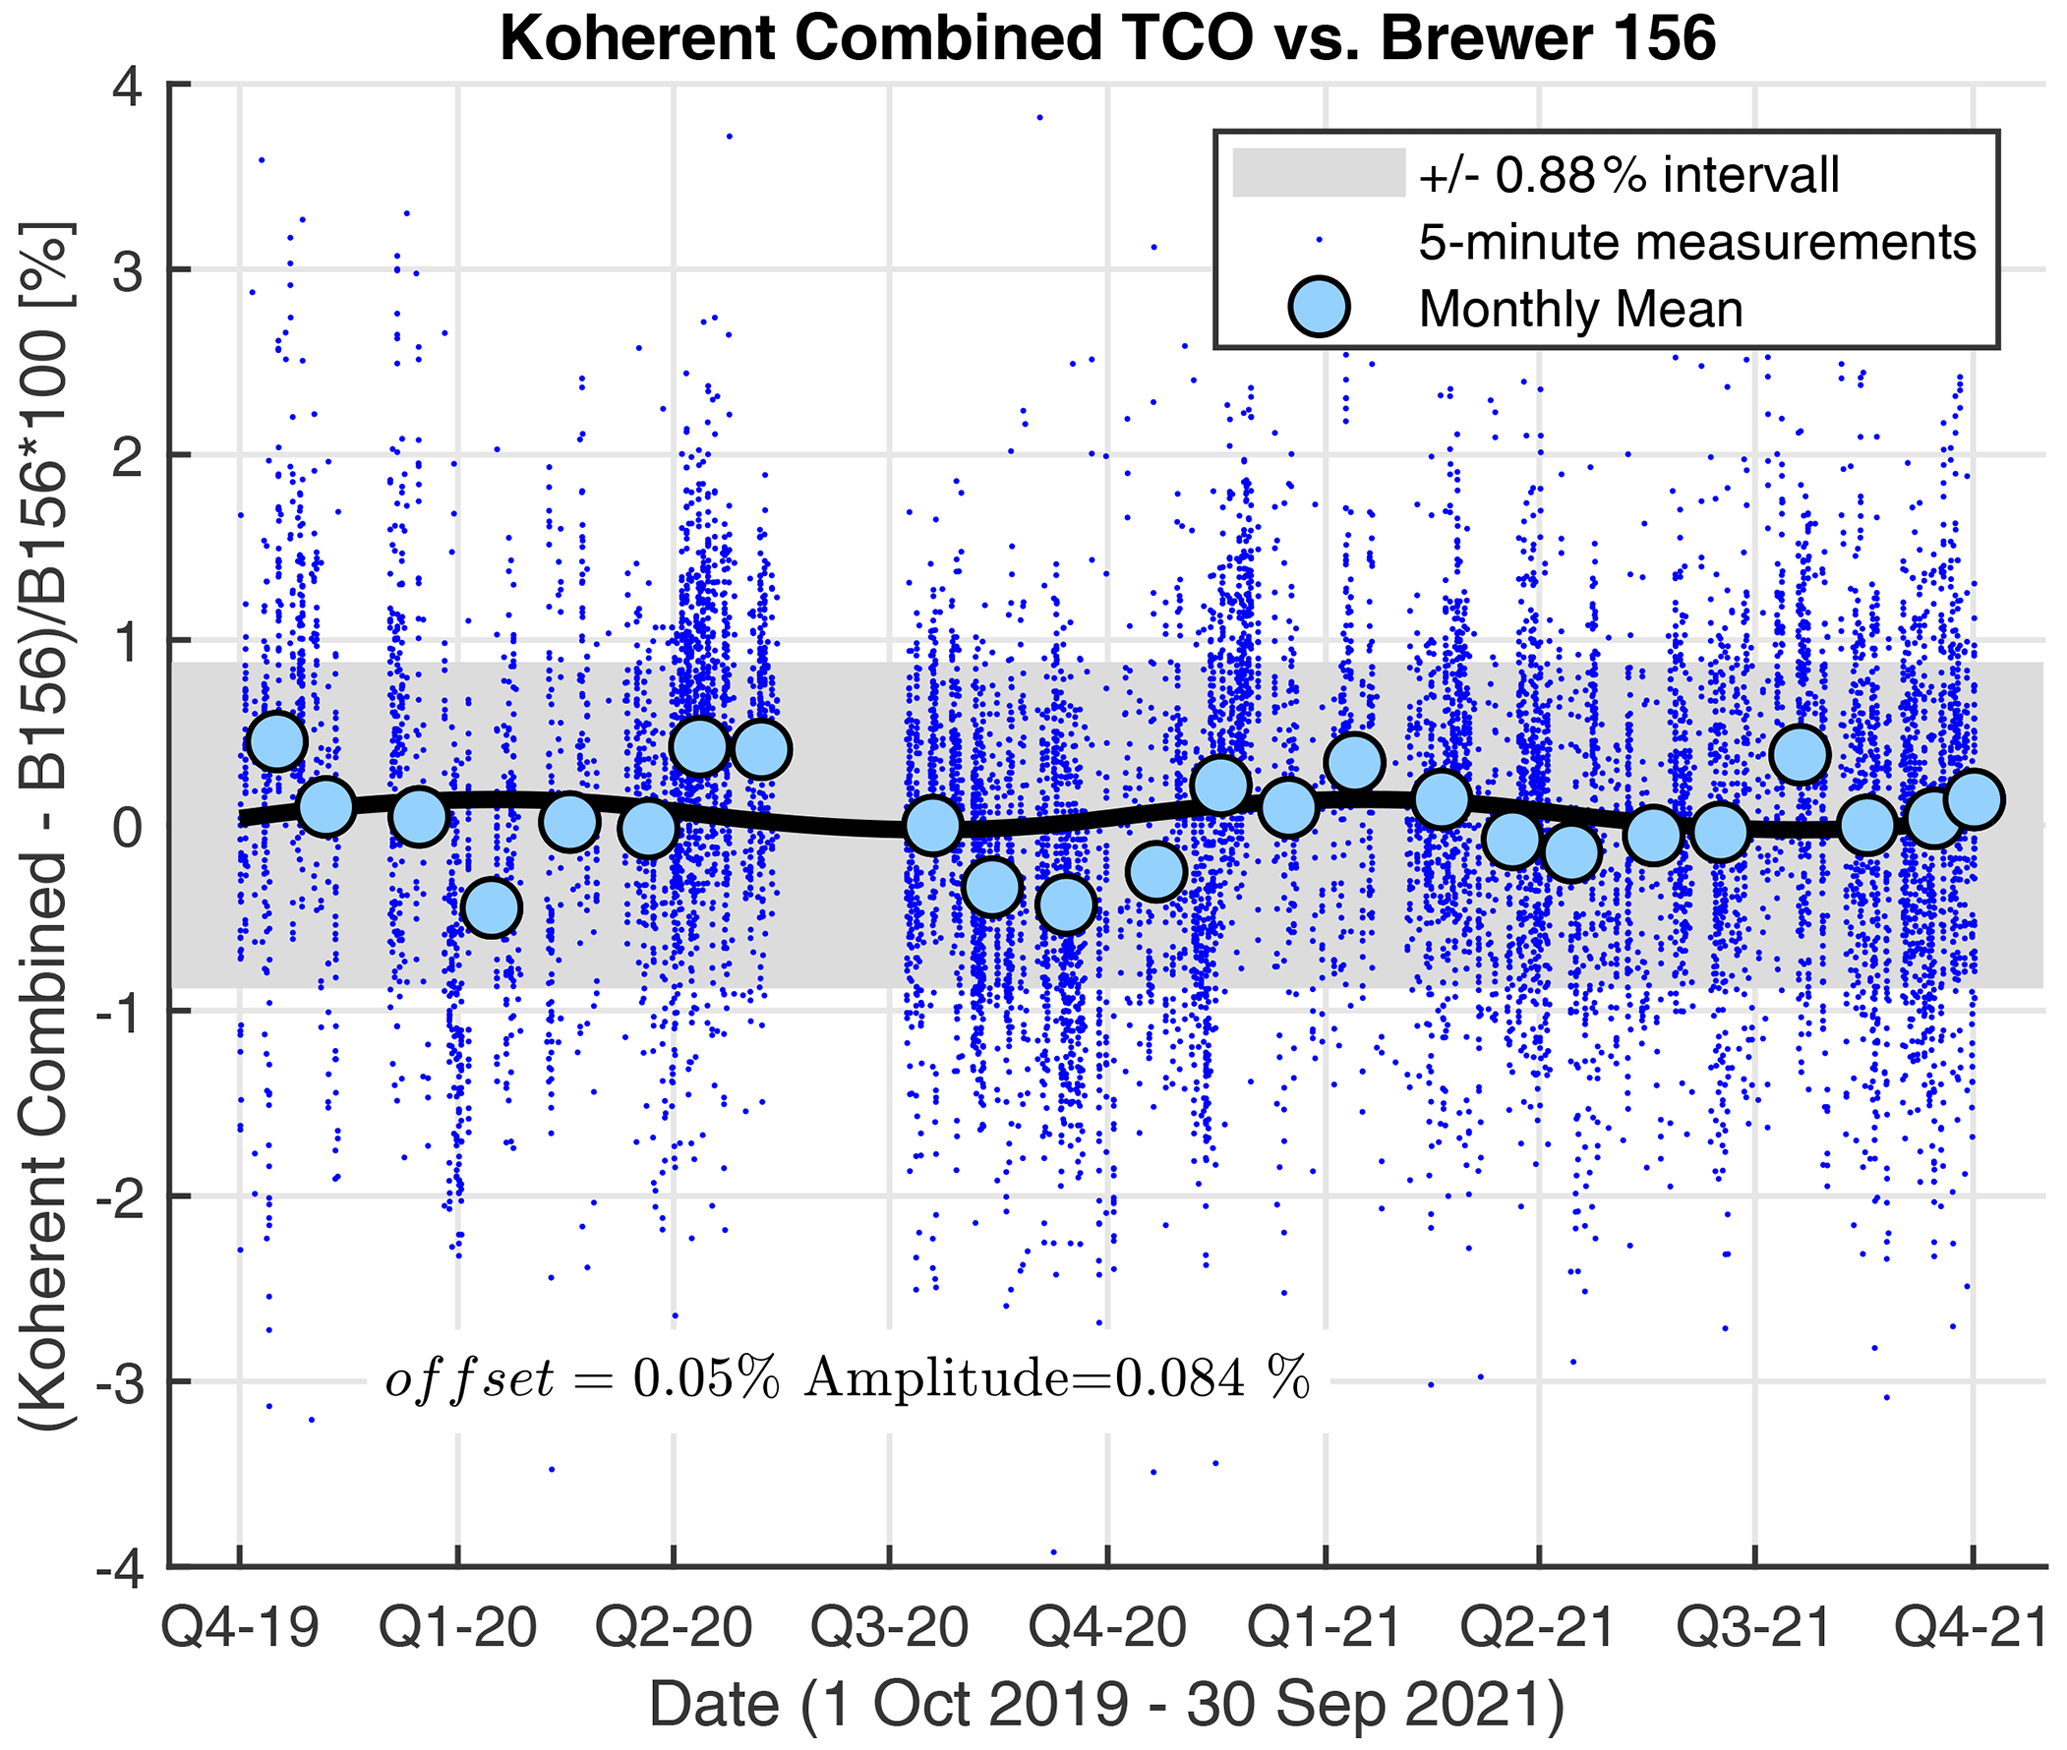
Figure 6Relative difference between Koherent (LSF and CDR combined) and Brewer 156 double monochromator. The small blue points indicate the synchronised measurements in 5 min intervals. The light-blue circles are monthly means. The grey area indicates the standard deviation of the relative differences between the three retrievals used for the combined product. The seasonal amplitude is 0.084 %, with a long-term offset of 0.05 %.
In analogy to Egli et al. (2022) for QASUME, a Monte Carlo uncertainty budget for the Koherent LSF retrieval was calculated by variation of all the input uncertainties of the parameters described in Eq. (1). The measurement uncertainty of Koherent is 1.3 % (see Sect. 2.1). The contribution of the other uncertainties remains the same as in Egli et al. (2022), since the same algorithm with the same input parameters is used for Koherent as for QASUME. The overall uncertainty budget for Koherent derived from Monte Carlo simulations results in an uncertainty of 0.95 %.
For the CDR algorithm, the overall uncertainty budget is also derived by a Monte Carlo simulation. The measurement uncertainty (1.3 %, Sect. 2.1), the uncertainty from the ozone absorption cross section (1.5 %; Serdyuchenko et al., 2014), the extraterrestrial spectrum (1.3 %; Coddington et al., 2021), the ground pressure (7 hPa; Egli et al., 2022), the ozone air mass (0.086 % = 0.3 %/2/√3; Egli et al., 2022), the wavelength shift (0.05 nm from MatSHIC preprocessing) and the effective ozone temperature (2.5 K; Egli et al., 2022) were varied as Gaussian noise in multiple ensemble runs (500). The standard deviation of these runs revealed an overall uncertainty budget of 0.64 %. One may argue that Gaussian noise applied to the entire spectrum may not be an appropriate assumption e.g. for the absorption cross section, the measurement and the extraterrestrial spectrum. An additional Monte Carlo simulation, where all the spectra of the cross section, extraterrestrial spectrum end measurement spectrum were shifted around the input uncertainty, showed an overall uncertainty of 1.57 %. Therefore, we estimate the overall uncertainty from the CDR algorithm to be about 1.6 %.
As described in Sect. 2, the effective ozone temperature is required for all TCO retrievals from Koherent measurements. The dependency on the effective ozone temperature of the LSF retrieval is around 0.1 % K−1, which is in line with the temperature dependency of traceable TCO measurements with QASUME (Egli et al., 2022) or the effective temperature dependency of Dobsons TCO (Redondas et al., 2014). The CDR technique exhibits a slightly larger effective ozone temperature dependency of 0.16 % K−1. In order to account for this temperature dependency, Δα=0.7513 in Eq. (5) needs to be corrected by applying 0.16 % K−1 of the effective ozone temperature measured by balloon soundings (Gröbner et al., 2021) or from ECMWF reanalysis data (https://www.temis.nl/climate/efftemp/overpass.php, last access: 23 November 2022). However, as will be described in the following section, the effective ozone temperature can be directly retrieved by Koherent.
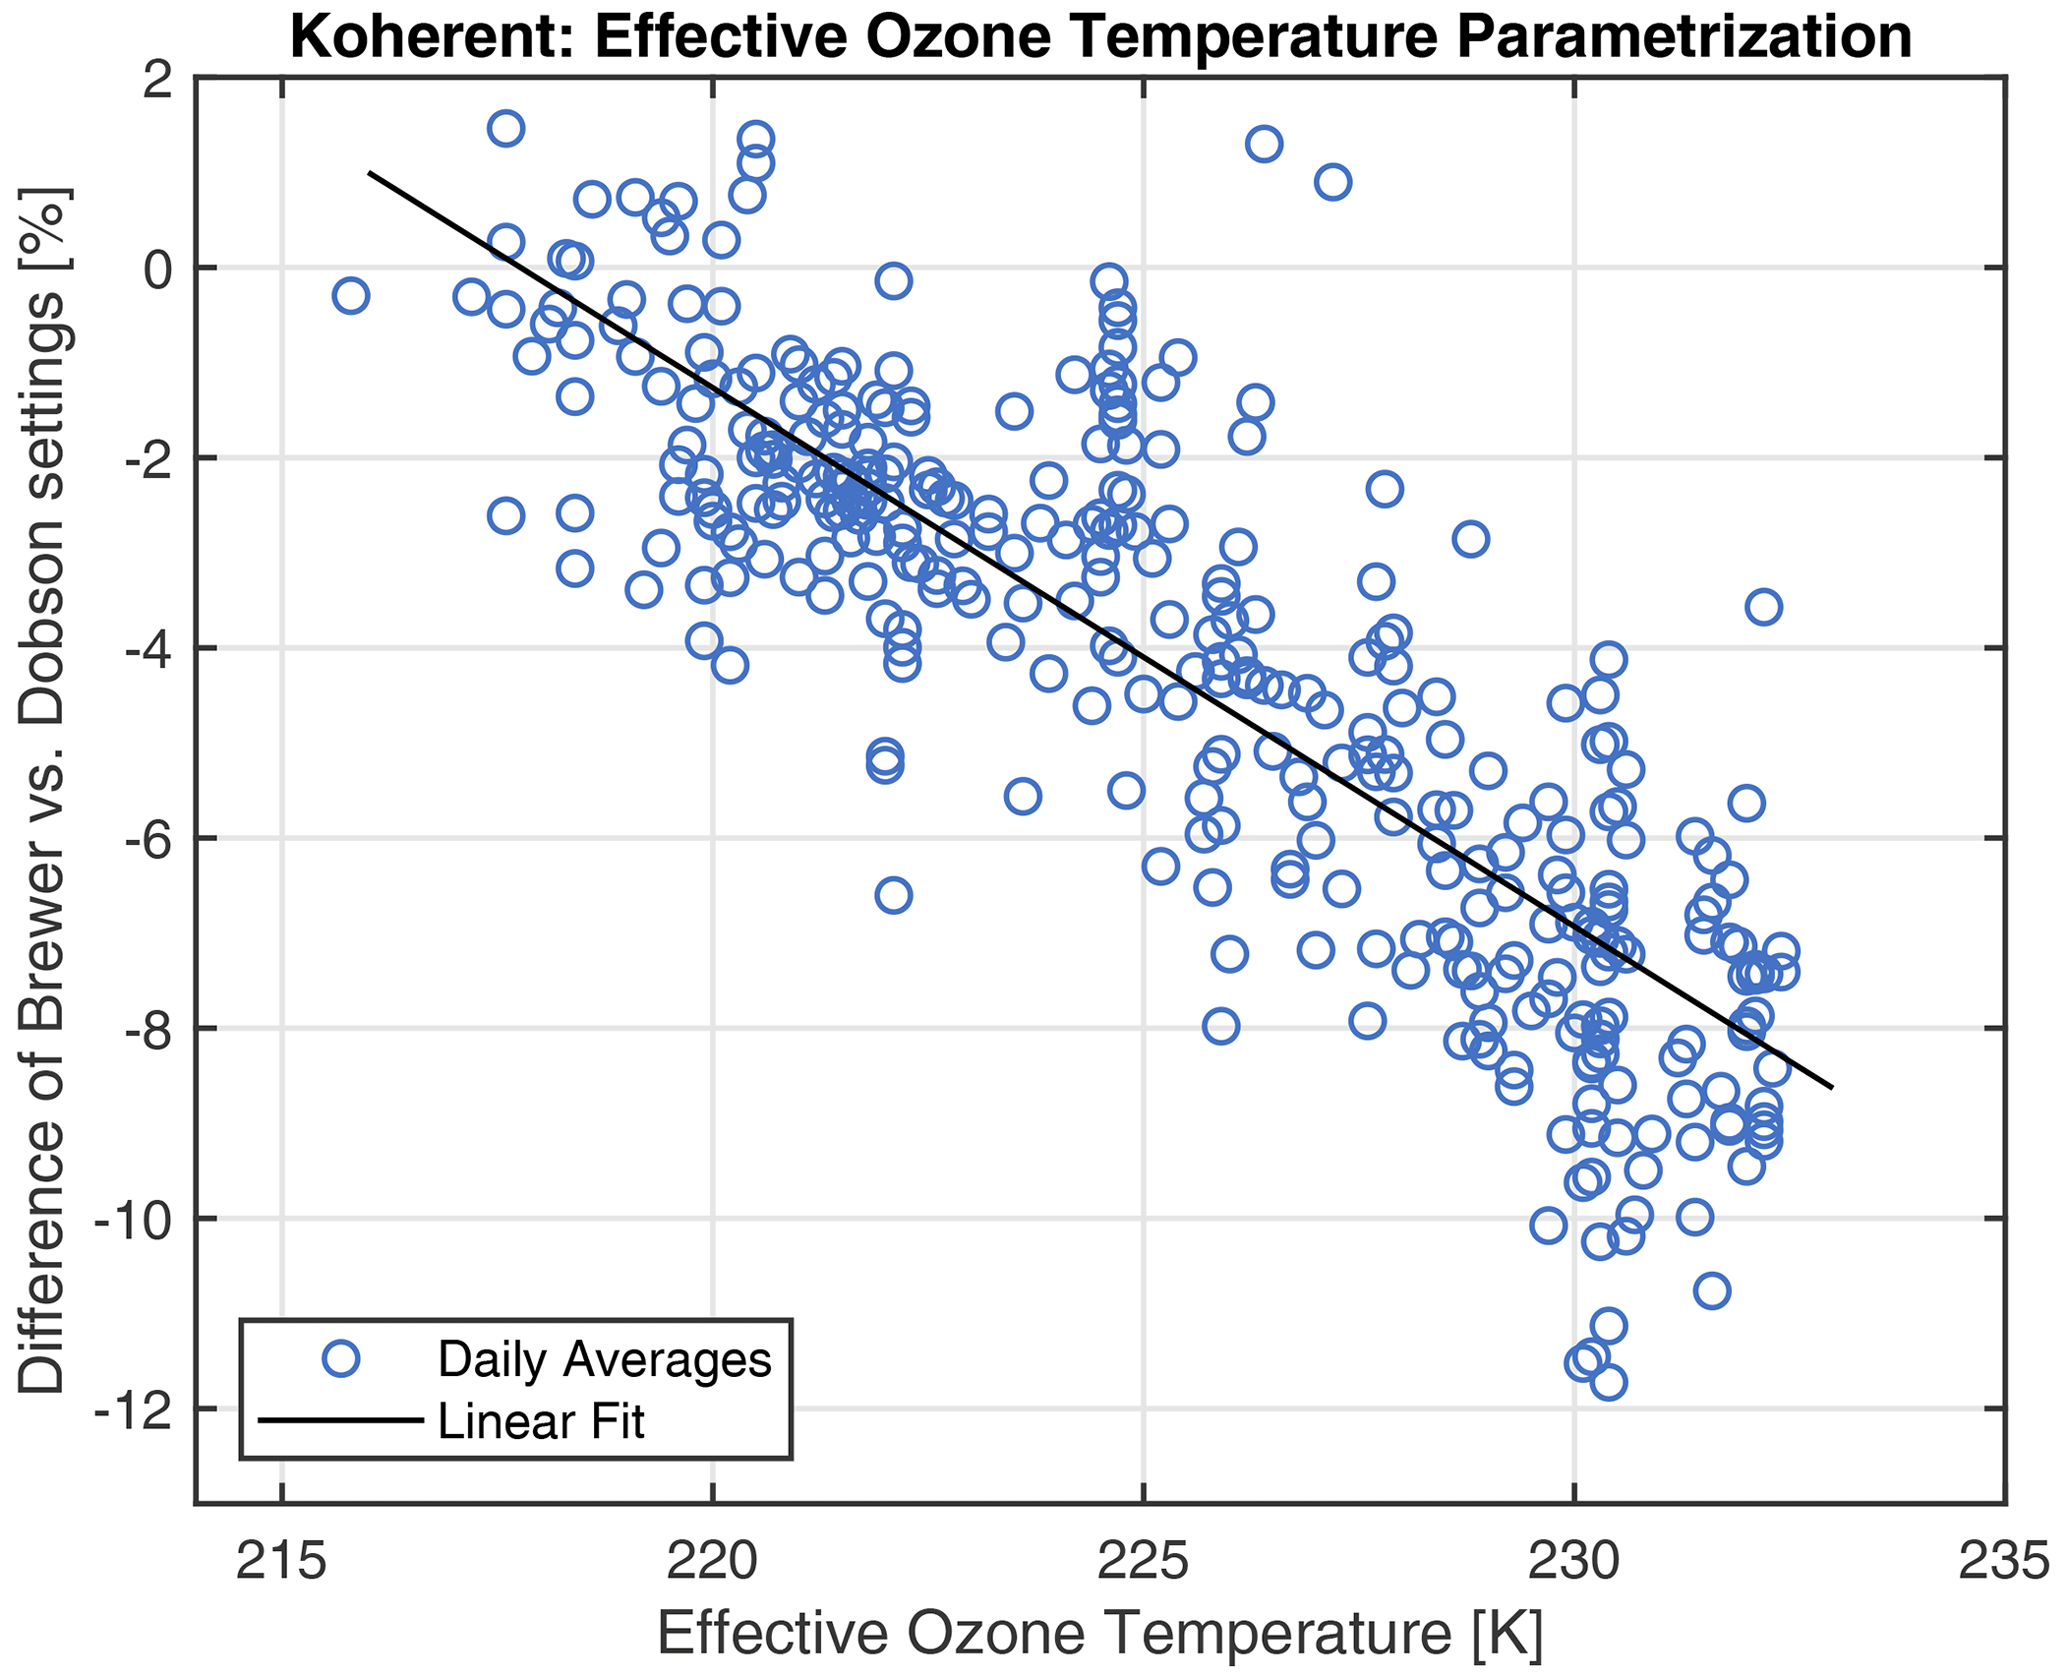
Figure 7Parameterisation of the relative differences between CDR retrieval using the Dobson and Brewer wavelength and slit function settings at 228 K effective ozone temperature, with daily effective ozone temperature from balloon soundings. The linear fit exhibits a slope of 0.5 % K−1, indicating the sensitivity of the differences to effective ozone temperature.
3.4 Correlation with effective ozone temperature
Kerr (2002) reported that the specific wavelength settings and the weighting for the double-ratio technique of the Brewer retrieval led to a low sensitivity of TCO to effective ozone temperature. Kerr (2002) further demonstrated that the effective ozone temperature can be retrieved from Brewer data with the group-scan method, analysing different wavelength settings of the Brewer. Redondas et al. (2014) also showed a sensitivity to effective ozone temperature of about 0.1 % K−1 for the Dobson retrieval. In other words, if TCO is retrieved with a constant effective temperature for Brewer and Dobson, a seasonal cycle depending on the seasonal variation of the effective ozone temperature is observed (Redondas et al., 2014). As mentioned in Sect. 2.3, the CDR technique can also be applied using the different Dobson and Brewer settings in terms of specific wavelengths, slit functions and weightings (Gröbner et al., 2021).
Here, we estimate the differences in TCO by applying the double-ratio technique using the different Brewer and Dobson wavelength and slit function settings on Koherent spectra for a constant effective ozone temperature of 228 K in order to investigate the potential of retrieving effective ozone temperature. The relative differences between TCO from the Brewer and Dobson settings show a strong seasonal cycle of 3.9 % amplitude (not shown). The amplitude of the differences between the Brewer and Dobson settings used in the CDR retrieval correlates with the effective ozone temperature, as shown in Fig. 7. Since effective ozone temperature is commonly given on a daily schedule (e.g. ECMWF reanalysis data or interpolated from balloon soundings in Payerne), the differences in effective ozone temperatures derived from the Brewer and Dobson settings in the CDR retrieval are averaged to daily values to reduce the variability of the individual 5 min values. Figure 7 displays a linear fit to the data. The linear fit gives a sensitivity of the TCO to effective ozone temperature of 0.52 % K−1. Based on the linear parameterisation, the effective ozone temperature can be reconstructed from the differences of the TCO retrieved from Koherent spectra applying the Brewer and Dobson settings for the double-ratio technique. As shown in Fig. 8, the so-determined effective ozone temperature agrees with the balloon sounding within a standard deviation of circa 3 K. For comparison, the effective ozone temperature from ECMWF reanalysis data generally agrees with balloon sounding within 2.5 K (Gröbner et al., 2021). Estimates of the effective ozone temperature with Koherent show a larger day-to-day variation than balloon-sounding measurements or ECMWF reanalysis. However, when averaging the temperature derived from Koherent on a weekly basis, the agreement is within 2.5 K.
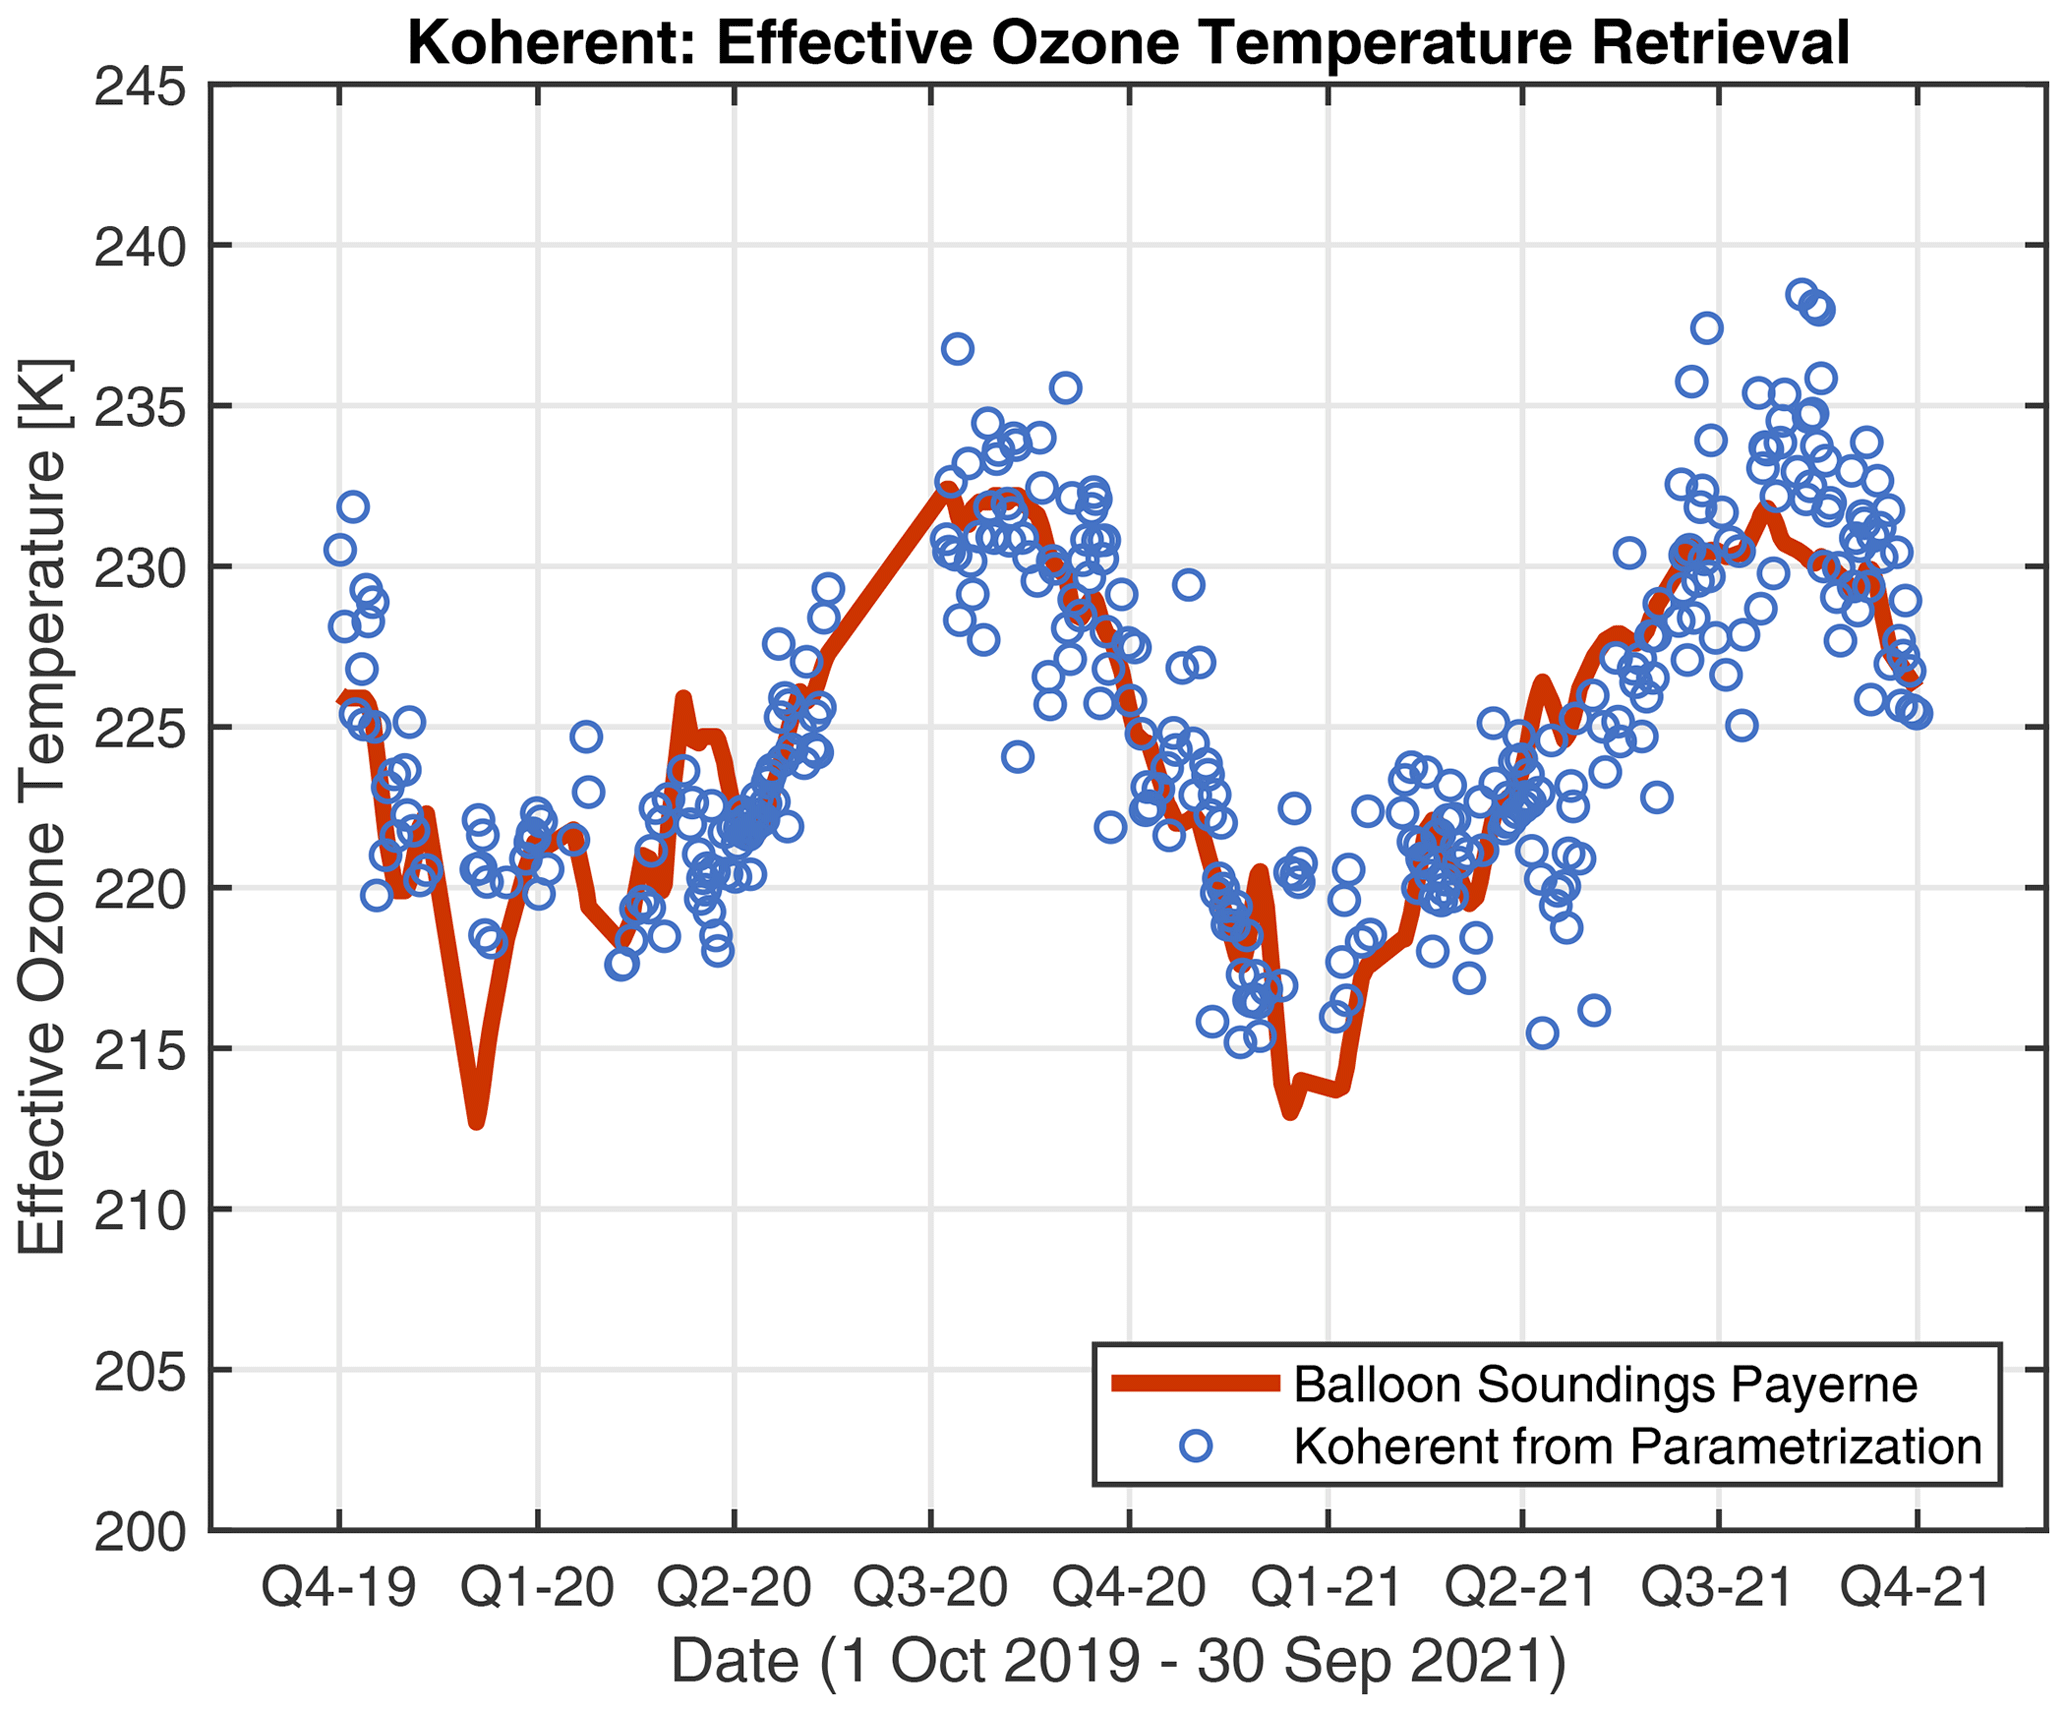
Figure 8Effective ozone temperature derived from the parameterisation of differences between CDR retrieval using Brewer and Dobson wavelength and slit function settings.
For comparison, Kerr (2002) achieved a typical standard deviation of a daily set of measurements of 0.8 K by the group-scan method with Brewers in Toronto, Canada, and Mauna Loa, Hawaii. Differently to Kerr (2002), the retrieval of effective ozone temperature with Koherent is based on a parameterisation with data from the 2-year intercomparison in Davos, Switzerland. It is unclear whether the same parameterisation can be applied for other stations worldwide, but it can at least be applied to determine the effective ozone temperature in Davos within 3 K on a daily basis. This has the significant advantage that the TCO retrieval of Koherent is self sufficient.
In addition to the results already published in Zuber et al. (2021), we have shown that TCO can be retrieved with an improved least-squares-fit retrieval and a new custom-double-ratio retrieval, which allow calibration of the instrument with standard reference instruments in filed campaigns. Both retrievals are based on direct solar-ultraviolet-irradiance spectra measured by an array-spectroradiometer-based system (Koherent), which is a small and cost-effective instrument requiring very little maintenance. The instrument was operated over 2 years with more than 99 % data acquisition reliability. We have investigated three different retrieval methods, namely the linear least-squares fit (LSF), the stray-light-corrected LSF, the custom-double-ratio technique (CDR) and CDR with an adjusted extraterrestrial constant. The stray-light-corrected LSF retrieval shows a slant path dependency, which is comparable to a double monochromator but shows a seasonal amplitude of 0.30 % (Table 1). In contrast, the seasonal amplitude of CDR is around 0.17 % but with a slant path dependency of 2.1 %, which is comparable to the slant path dependency of a single Brewer (Table 1). The overall uncertainty of the LSF retrieval is about 1 %, while the uncertainty budget of the CDR retrieval is about 1.6 %.
We have shown that TCO from Koherent can be retrieved by either an absolute calibration of the Koherent spectra with the portable world reference for ultraviolet radiation QASUME or an adjustment of the ETC. The calibration of the ETC allows the instrument to be calibrated with reference instruments during intercomparison campaigns. Furthermore, absolute TCO can be calibrated with a two-point calibration during such campaigns by additionally changing the absorption coefficient to achieve the best agreement to existing network instruments (Redondas et al., 2019).
The double-ratio technique using the Brewer and Dobson wavelength settings applied to Koherent spectra further allows one to determine the effective ozone temperature within 3 K as a daily average. The retrieval of effective ozone temperature requires a parameterisation of Koherent data with an external effective ozone temperature dataset. Once the parameterisation with effective ozone temperature is provided with e.g. data of 1 year, the parameterisation leads Koherent to serve as a standalone instrument for TCO observation without the need for external supporting data such as daily effective ozone temperature obtained from balloon soundings or other instruments.
The retrieval methods from direct ultraviolet spectra presented here are in good agreement with the performance of other TCO instruments, e.g. Brewer or Dobson. The methods presented in this study may be applied to other array spectroradiometer systems measuring direct solar irradiance (e.g. Pandora or BTS Solar) at other stations. Koherent now serves as an instrument for operational TCO monitoring at PMOD/WRC in addition to the existing TCO instrument park located in Davos.
The TCO retrieval algorithms are available from the main author (LE) on request.
The data are available from the main author (LE) on request.
LE and JG developed the Koherent retrieval algorithm, analysed the data and wrote the paper. HS and EMB were responsible for the Brewer and Dobson measurements used in this study and revised the paper.
The contact author has declared that none of the authors has any competing interests.
Publisher’s note: Copernicus Publications remains neutral with regard to jurisdictional claims in published maps and institutional affiliations.
We thank two anonymous reviewers for their helpful comments, which substantially improved this publication.
This research has been supported by the ESA (project QA4EO, grant no. QA4EO/SER/SUB/09) and by GAWCH MeteoSwiss (project INFO3RS, grant no. 123001926).
This paper was edited by Mark Weber and reviewed by two anonymous referees.
Bass, A. M. and Paur, R. J.: The ultraviolet cross-sections of ozone, I – The measurements, II – Results and temperature dependence, in: Atmospheric Ozone, edited by: Zerefos, C. S. and Ghazi, A., Springer, Dordrecht, The Netherlands, 606–616, https://doi.org/10.1007/978-94-009-5313-0_120, 1985.
Bodhaine, B. A., Wood, N. B., Dutton, E. G., and Slusser, J. S.: On Rayleigh Optical Depth Calculations, J. Atmos. Ocean. Tech., 16, 1854–1861, 1999.
Coddington, O. M., Richard, E. C., Harber, D., Pilewskie, P., Woods, T. N., Chance, K., Liu, X., and Sun, K.: The TSIS-1 Hybrid Solar Reference Spectrum, Geophys. Res. Lett., 48, e2020GL091709. https://doi.org/10.1029/2020GL091709, 2021.
Dobson, G. M. B.: 1968 Forty years research on atmospheric ozone at Oxford – a history, Appl. Opt., 7, 387–405, 1968.
Egli, L., Gröbner, J., Hülsen, G., Bachmann, L., Blumthaler, M., Dubard, J., Khazova, M., Kift, R., Hoogendijk, K., Serrano, A., Smedley, A., and Vilaplana, J.-M.: Quality assessment of solar UV irradiance measured with array spectroradiometers, Atmos. Meas. Tech., 9, 1553–1567, https://doi.org/10.5194/amt-9-1553-2016, 2016.
Egli, L., Gröbner, J., Hülsen, G., Schill, H., and Stübi, R.: Traceable total ozone column retrievals from direct solar spectral irradiance measurements in the ultraviolet, Atmos. Meas. Tech., 15, 1917–1930, https://doi.org/10.5194/amt-15-1917-2022, 2022.
Evans, R. D.: Operations Handbook – Ozone Observations with a Dobson Spectrophotometer – revised version, WMO/GAW Report No., 183, https://library.wmo.int/index.php?lvl=notice_display&id=12630 (last access: 30 May 2023), 2008.
Gkertsi, F., Bais, F. A., Kouremeti, N., Drosoglou, T., Fountoulakis, I., and Fragkos, K.: DOAS-based total column ozone retrieval from Phaethon system, Atmos. Environ., 180, 51–58, https://doi.org/10.1016/j.atmosenv.2018.02.036, 2018.
Gröbner, J. and Sperfeld, P.: Direct traceability of the portable QASUME irradiance scale to the primary irradiance standard of the PTB, Metrologia, 42 134, https://doi.org/10.1088/0026-1394/42/2/008, 2005.
Gröbner, J., Schreder, J., Kazadzis, S., Bais, A. F., Blumthaler, M., Görts, P., Tax, R., Koskela, T., Seckmeyer, G., Webb, A. R., and Rembges, D.: Traveling reference spectroradiometer for routine quality assurance of spectral solar ultraviolet irradiance measurements, Appl. Opt., 44, 5321–5331, 2005.
Gröbner, J., Kröger, I., Egli, L., Hülsen, G., Riechelmann, S., and Sperfeld, P.: The high-resolution extraterrestrial solar spectrum (QASUMEFTS) determined from ground-based solar irradiance measurements, Atmos. Meas. Tech., 10, 3375–3383, https://doi.org/10.5194/amt-10-3375-2017, 2017.
Gröbner, J., Schill, H., Egli, L., and Stübi, R.: Consistency of total column ozone measurements between the Brewer and Dobson spectroradiometers of the LKO Arosa and PMOD/WRC Davos, Atmos. Meas. Tech., 14, 3319–3331, https://doi.org/10.5194/amt-14-3319-2021, 2021.
Herman, J., Evans, R., Cede, A., Abuhassan, N., Petropavlovskikh, I., McConville, G., Miyagawa, K., and Noirot, B.: Ozone comparison between Pandora #34, Dobson #061, OMI, and OMPS in Boulder, Colorado, for the period December 2013–December 2016, Atmos. Meas. Tech., 10, 3539–3545, https://doi.org/10.5194/amt-10-3539-2017, 2017.
Huber, M., Blumthaler, M., Ambach, W., and Staehelin, J.: Total atmospheric ozone determined from spectral measurements of direct solar UV irradiance, Geophys. Res. Lett., 22, 53–56, https://doi.org/10.1029/94gl02836, 1995.
Hülsen, G., Gröbner, J., Nevas, S., Sperfeld, P., Egli, L., Porrovecchio, G., and Smid, M.: Traceability of solar UV measurements using the QASUME reference spectroradiometer, Appl. Opt., 55, 7265–7275, 2016
Kerr, J. B.: New methodology for deriving total ozone and other atmospheric variables from Brewer spectrophotometer direct sun spectra, J. Geophys. Res., 107, 4731, https://doi.org/10.1029/2001JD001227, 2002.
Kerr, J. B., McElroy, C. T., and Olafson, R. A.: Measurements of total ozone with the Brewer spectrophotometer, Proc. Quad. Ozone Symp., 1980, edited by: London, J., Natl. Cent. for Atmos. Res., Boulder CO, 74–79, 4–9 August 1980, 1981.
Kerr, J. B., McElroy, C. T., Wardle, D. I., Olafson, R. A., and Evans, W. F. J.: The automated Brewer Spectrophotometer, Proceed. Quadr. Ozone Symp, edited by: Halkidiki, C. S., Zerefos, Ghazi, and A., D. Reidel, Norwell, Mass., 396–401, 1985.
Kerr, J. B., Asbridge, I. A., and Evans, W. F. J.: Intercomparison of total ozone measured by the Brewer and Dobson Spectrophotometers at Toronto, J. Geophys. Res., 93, 11129– 11140, 1988.
Köhler, U., Nevas, S., McConville, G., Evans, R., Smid, M., Stanek, M., Redondas, A., and Schönenborn, F.: Optical characterisation of three reference Dobsons in the ATMOZ Project – verification of G. M. B. Dobson's original specifications, Atmos. Meas. Tech., 11, 1989–1999, https://doi.org/10.5194/amt-11-1989-2018, 2018.
Komhyr, W. D., Grass, R. D., and Leonard, R. K.: Dobson Spectrophotometer 83: A Standard for Total Ozone Measurements, 1962–1987, J. Geophys. Res., D7, 9847–9861, 1989.
Kouremeti, N., Bais, A., Kazadzis, S., Blumthaler, M., and Schmitt, R.: Charge-coupled device spectrograph for direct solar irradiance and sky radiance measurements, Appl. Opt., 47, 10, 1594–1607, 2008.
Molina, M. J. and Rowland, F. S.: Stratospheric sink for chlorofluoromethanes-Chlorine atom catalyzed destruction of ozone, Nature, 249, 810–812, 1974.
NOAA: National Oceanic and Atmospheric Administration (NOAA), US Standard Atmosphere, NOAA-S/T 76-1562, 1976.
Redondas, A., Evans, R., Stuebi, R., Köhler, U., and Weber, M.: Evaluation of the use of five laboratory-determined ozone absorption cross sections in Brewer and Dobson retrieval algorithms, Atmos. Chem. Phys., 14, 1635–1648, https://doi.org/10.5194/acp-14-1635-2014, 2014.
Redondas, A., León-Luís, S. F., López-Solano, J., Berjón, A.,and Carreño, V.: Thirteenth Intercomparison Campaign of the Regional Brewer Calibration Center Europe, Joint publication of State Meteorological Agency (AEMET), Madrid, Spain and World Meteorological Organization (WMO), Geneva, Switzerland, WMO/GAWReport No. 246, https://doi.org/10.31978/666-20-018-3, 2019.
Scarnato, B., Staehelin, J., Peter, T., Gröbner, J., and Stübi, R.: Temperature and slant path effects in Dobson and Brewer total ozone measurements, J. Geophys. Res., 114, D24303, https://doi.org/10.1029/2009JD012349, 2009.
Šméd, M., Porrovecchio, G., Tesař, J., Burnitt, T., Egli, L., Gröbner, J., Linduška, P., and Staněk, M.: The design and development of a tuneable and portable radiation source for in situ spectrometer characterisation, Atmos. Meas. Tech., 14, 3573–3582, https://doi.org/10.5194/amt-14-3573-2021, 2021.
Staehelin, J., Viatte, P., Stübi, R., Tummon, F., and Peter, T.: Stratospheric ozone measurements at Arosa (Switzerland): history and scientific relevance, Atmos. Chem. Phys., 18, 6567–6584, https://doi.org/10.5194/acp-18-6567-2018, 2018.
Stübi, R., Schill, H., Klausen, J., Vuilleumier, L., and Ruffieux, D. C.: Reproducibility of total ozone column monitoring by the Arosa Brewer spectrophotometer triad, J. Geophys. Res.-Atmos., 122, 4735–4745, https://doi.org/10.1002/2016JD025735, 2017a.
Stübi, R., Schill, H., Klausen, J., Vuilleumier, L., Gröbner, J., Egli, L., and Ruffieux, D.: On the compatibility of Brewer total column ozone measurements in two adjacent valleys (Arosa and Davos) in the Swiss Alps, Atmos. Meas. Tech., 10, 4479–4490, https://doi.org/10.5194/amt-10-4479-2017, 2017b.
Stübi, R., Schill, H., Klausen, J., Maillard Barras, E., and Haefele, A.: A fully automated Dobson sun spectrophotometer for total column ozone and Umkehr measurements, Atmos. Meas. Tech., 14, 5757–5769, https://doi.org/10.5194/amt-14-5757-2021, 2021.
Serdyuchenko, A., Gorshelev, V., Weber, M., Chehade, W., and Burrows, J. P.: High spectral resolution ozone absorption cross-sections – Part 2: Temperature dependence, Atmos. Meas. Tech., 7, 625–636, https://doi.org/10.5194/amt-7-625-2014, 2014.
Solomon, S.: Stratospheric ozone depletion: A review of concepts and history, Rev. Geophys., 37, 275–316, 1999
Vanicek, K.: Differences between ground Dobson, Brewer and satellite TOMS-8, GOME-WFDOAS total ozone observations at Hradec Kralove, Czech, Atmos. Chem. Phys., 6, 5163–5171, https://doi.org/10.5194/acp-6-5163-2006, 2006.
WMO (World Meteorological Organization): Scientific Assessment of Ozone Depletion: 2018, Global Ozone Research and Monitoring Project – Report No. 58, 588 pp., Geneva, Switzerland, https://wedocs.unep.org/20.500.11822/32140 (last access: 30 May 2023), 2018.
Zuber, R., Ribnitzky, M., Tobar, M., Lange, K., Kutscher, D., Schrempf, M., Niedzwiedz, A., and Seckmeyer, G.: Global spectral irradiance array spectroradiometer validation according to WMO, Measurement Science and Technology, https://doi.org/10.1088/1361-6501/aada34, 2018a.
Zuber, R., Sperfeld, P., Riechelmann, S., Nevas, S., Sildoja, M., and Seckmeyer, G.: Adaption of an array spectroradiometer for total ozone column retrieval using direct solar irradiance measurements in the UV spectral range, Atmos. Meas. Tech., 11, 2477–2484, https://doi.org/10.5194/amt-11-2477-2018, 2018b.
Zuber, R., Köhler, U., Egli, L., Ribnitzky, M., Steinbrecht, W., and Gröbner, J.: Total ozone column intercomparison of Brewers, Dobsons, and BTS-Solar at Hohenpeißenberg and Davos in 2019/2020, Atmos. Meas. Tech., 14, 4915–4928, https://doi.org/10.5194/amt-14-4915-2021, 2021.