the Creative Commons Attribution 4.0 License.
the Creative Commons Attribution 4.0 License.
 | 15 Jun 2023
Evaluating the effects of columnar NO2 on the accuracy of aerosol optical properties retrievals
Theano Drosoglou
Ioannis-Panagiotis Raptis
Massimo Valeri
Stefano Casadio
Francesca Barnaba
Marcos Herreras-Giralda
Anton Lopatin
Oleg Dubovik
Gabriele Brizzi
Fabrizio Niro
Monica Campanelli
Stelios Kazadzis
We aim to evaluate the NO2 absorption effect in aerosol columnar properties, namely the aerosol optical depth (AOD), Ångström exponent (AE), and single scattering albedo (SSA), derived from sun–sky radiometers in addition to the possible retrieval algorithm improvements by using more accurate characterization of NO2 optical depth from co-located or satellite-based real-time measurements. For this purpose, we employ multiannual (2017–2022) records of AOD, AE, and SSA collected by sun photometers at an urban and a suburban site in the Rome area (Italy) in the framework of both the Aerosol Robotic Network (AERONET) and SKYNET networks. The uncertainties introduced in the aerosol retrievals by the NO2 absorption are investigated using high-frequency observations of total NO2 derived from co-located Pandora spectroradiometer systems in addition to spaceborne NO2 products from the Tropospheric Monitoring Instrument (TROPOMI). For both AERONET and SKYNET, the standard network products were found to systematically overestimate AOD and AE. The average AOD bias found for Rome is relatively low for AERONET (∼ 0.002 at 440 nm and ∼ 0.003 at 380 nm) compared to the retrieval uncertainties but quite a bit higher for SKYNET (∼ 0.007). On average, an AE bias of ∼ 0.02 and ∼ 0.05 was estimated for AERONET and SKYNET, respectively. In general, the correction seems to be low for areas with low columnar NO2 concentrations, but it is still useful for low AODs (< 0.3), where the majority of observations are found, especially under high NO2 pollution events. For the cases of relatively high NO2 levels (> 0.7 DU), the mean AOD bias was found within the range 0.009–0.012 for AERONET, depending on wavelength and location, and about 0.018 for SKYNET. The analysis does not reveal any significant impact of the NO2 correction on the derived aerosol temporal trends for the very limited data sets used in this study. However, the effect is expected to become more evident for trends derived from larger data sets and in the case of an important NO2 trend. In addition, the comparisons of the NO2-modified ground-based AOD data with satellite retrievals from the Deep Blue (DB) algorithm of the NASA Moderate Resolution Imaging Spectroradiometer (MODIS) resulted in a slight improvement in the agreement of about 0.003 and 0.006 for AERONET and SKYNET, respectively. Finally, the uncertainty in assumptions on NO2 seems to have a non-negligible impact on the retrieved values of SSA at 440 nm leading to an average positive bias of about 0.02 (2 %) in both locations for high NO2 loadings (> 0.7 DU).
- Article
(7169 KB) - Full-text XML
- BibTeX
- EndNote


Atmospheric particles have both direct and indirect effects on Earth's radiation budget and climate (IPCC, 2021). Direct radiative forcing arises from the interaction of aerosols with solar radiation through absorption and scattering processes (Hobbs, 1993). As an indirect impact, aerosols play an important role in cloud formation and properties by acting as cloud condensation nuclei on which water vapor condenses and by influencing the cloud albedo and lifetime (Rosenfeld et al., 2014). Moreover, heterogeneous chemical reactions can take place on the surfaces of atmospheric particles, thus having a crucial effect on atmospheric chemistry and composition. Examples of such aerosol-driven reactions are those that lead to stratospheric ozone depletion in the polar regions (Solomon et al., 1986). In addition to their footprint on radiative forcing and climate, aerosols adversely affect human health and have been associated with a wide variety of health issues such as respiratory and neurological diseases, cancer, diabetes, cardiovascular diseases, and hypertension (e.g., Lelieveld et al., 2015; Molina et al., 2020, and references therein).
The above effects of airborne particulate matter on Earth's climate and human health strongly depend on the intra-annual variations in its loading and properties. The most widely used variable for the estimation of columnar aerosol concentration in the atmosphere is the multiwavelength aerosol optical depth (AOD). Aerosol optical properties are monitored globally by satellite, e.g., the Moderate Resolution Imaging Spectroradiometer (MODIS) and ground-based networks of sun photometers like the Aerosol Robotic Network (AERONET; Holben et al., 1998), SKYNET (Nakajima et al., 2020), or the Global Atmosphere Watch Precision Filter Radiometer (GAW-PFR) network (Kazadzis et al., 2018a). Ground-based remote sensing allows accurate AOD retrievals, i.e., of the order of 0.01–0.02, depending on the AOD wavelength (Kazadzis et al., 2018b), which are in fact widely used as a validation reference for satellite- or model-based AOD products (e.g., Chu et al., 2002; Remer et al., 2005; Green et al., 2009; Levy et al., 2010; Li et al., 2015; Sherman et al., 2016; Gkikas et al., 2021; Di Tomaso et al., 2022) and used as input for various modeling initiatives (e.g., Benedetti et al., 2018).
However, AOD retrieval from sun photometers includes some assumptions in order to take into account all the non-aerosol effects in the retrieval spectral range. In particular, AOD retrievals are sensitive to the assumptions on the concentration of atmospheric trace gases absorbing in the instrument spectral bands considered, among which are ozone (O3) and nitrogen dioxide (NO2). The exact effect of trace gases in the retrieval at a particular bandwidth depends also on their absorption cross section. For the case of NO2, as filter radiometers retrieve the AOD in certain wavelength bands based on their filter responsivity, such retrievals, especially in the standard wavelengths of 380 and 440 nm (AERONET), have to be corrected for the NO2 optical depth. Currently, some AOD retrievals do not take NO2 optical depth into consideration when deriving AOD (e.g., SKYNET; Nakajima et al., 2020; GAW-PFR; Kazadzis et al., 2018a), while others use satellite-based climatological NO2 data sets for estimating it (e.g., AERONET; Giles et al., 2019). In the case of the GAW-PFR network, the error introduced in AOD retrievals by NO2 absorption can be assumed to be negligible due to the low NO2 concentrations observed in the GAW remote stations (the annual mean values of NO2 optical depth are in general < 0.001; Kazadzis et al., 2018a). However, especially over polluted areas, NO2 is characterized by a rather short lifetime and high spatiotemporal variations, due to inhomogeneous local emission patterns and photochemical destruction (e.g., Richter et al., 2005; Boersma et al., 2008; Tzortziou et al., 2014, 2015; Drosoglou et al., 2017; Fan et al., 2021). Although the stratospheric component of NO2 is quite stable spatially, the tropospheric NO2 is highly variable in space and time and can bias the calculation of AOD if neglected (Arola and Koskela, 2004; Boersma et al., 2004). Hence, areas with high tropospheric NO2 emission will tend to have greater proclivity for deviating from climatological mean values, which might not be representative of the actual NO2 loading and spatial distribution in the atmosphere, introducing potential errors in AOD calculations in those spectral regions with a significant NO2 absorption footprint.
Satellite observations with improved spatial and temporal resolution, e.g., the Sentinel-5 Precursor TROPOspheric Monitoring Instrument (S5P/TROPOMI), models, or co-location with surface-based Pandora instruments from the Pandonia Global Network (PGN) spectroradiometers (Cede et al., 2020) measuring the total column of NO2 may assist in reducing the uncertainty in the NO2 optical depth contribution in later versions of AOD retrieval algorithms. In the present study, we aim at evaluating if and how much AOD, in addition to its spectral variability, i.e., the associated Ångström Exponent (AE), and single scattering albedo (SSA) retrievals could be improved by applying a specific correction using synchronous and co-located measurements of the total NO2 column from the Pandonia network spectroradiometers. To this end, we exploit the unique configuration of twin observational sites in the Rome area (Italy), where multiannual (2017–2022) records of both multispectral AOD observations and columnar NO2 measurements are available both in the city center and in a suburban location. High-frequency measurements of total NO2 performed by co-located Pandora spectroradiometer systems were used to evaluate the current uncertainty in the retrievals of aerosol properties. Aerosol retrieval modifications based on Pandora NO2 measurements are proposed for both AERONET and SKYNET. In addition, relatively high spatially resolved NO2 observations from the S5P/TROPOMI satellite sensor were used to demonstrate the possibility of applying the corrections globally. A first attempt to investigate the impact of those corrections on AOD and AE annual trends is also conducted.
2.1 The target area and relevant observational sites
Rome is the capital and the most populous city of Italy with almost 3 million inhabitants and one of the most densely populated cities in the European Union (ISTAT, 2021). It is located about 24 km east of the Tyrrhenian Sea, surrounded by an extensive undulating plain, and crossed by the Tiber and Aniene rivers. The city is part of the Lazio administrative region in the central part of the Italian Peninsula. The economic activities in the metropolitan area are characterized by the absence of heavy industrial facilities and are related mainly to the services and high-technology sectors, as well as commercial activities and tourism. The city air quality is strongly affected by local emission sources, such as transportation and domestic heating, but it is also markedly affected by local circulation and mid- to long-range transport events of sea salt, wildfires, and Saharan dust (e.g., Ciardini et al., 2012; Gobbi et al., 2013; Barnaba et al., 2017; Valentini et al., 2020; Di Bernardino et al., 2021).
Rome's air quality is monitored on a regular basis by standard in situ instrumentation. These measurements are complemented by multiplatform, long-term observations of aerosol and trace gases performed by a variety of ground-based remote sensing instruments such as sun–sky radiometers, Raman and elastic lidars, automated lidar ceilometers, Pandora, Brewer, and differential optical absorption spectroscopy (DOAS) spectrophotometers (e.g., Di Ianni et al., 2018; Iannarelli et al., 2021; Diémoz et al., 2021). In this study, we used remote sensing measurements of columnar NO2 and aerosol properties performed in two stations located in the greater area of Rome. More specifically, observations were obtained from an urban station (APL-SAP hereafter) located at the Atmospheric Physics Laboratory of the Physics Department of the Sapienza University of Rome in the city center (41.90∘ N, 12.52∘ E; altitude 75 m a.s.l. – above sea level) and a suburban site at the southern east edge of the city in the National Research Council (CNR) Institute of Atmospheric Sciences and Climate (ISAC) Rome Atmospheric Supersite (CIRAS) in Tor Vergata, Rome (41.84∘ N, 12.65∘ E; altitude 117 m a.s.l.). These two observational sites, along with the rural station of the CNR Institute of Atmospheric pollution Research (IIA) in Montelibretti, contribute to the Boundary-layer Air Quality-analysis Using Network of Instruments (BAQUNIN) supersite (Iannarelli et al., 2021) and to several national and international observing networks.
2.2 Aerosol data sets
2.2.1 AERONET
The Aerosol Robotic Network (AERONET) is a ground-based passive remote sensing aerosol monitoring network initiated by NASA and expanded by several national and international networks and collaborators (Holben et al., 1998). For more than 2 decades, AERONET has been delivering continuous, long-term data sets of aerosol optical, microphysical, and radiative properties to support aerosol studies and the validation of spaceborne retrievals. The network uses the Cimel CE318-T Sun Sky Lunar multispectral photometers and provides the standardization of instrument calibration and data acquisition, in addition to centralized data processing and distribution. The AERONET public domain database provides retrievals of spectral AOD, inversion products, and precipitable water at a global scale (https://aeronet.gsfc.nasa.gov/, last access: 21 October 2022).
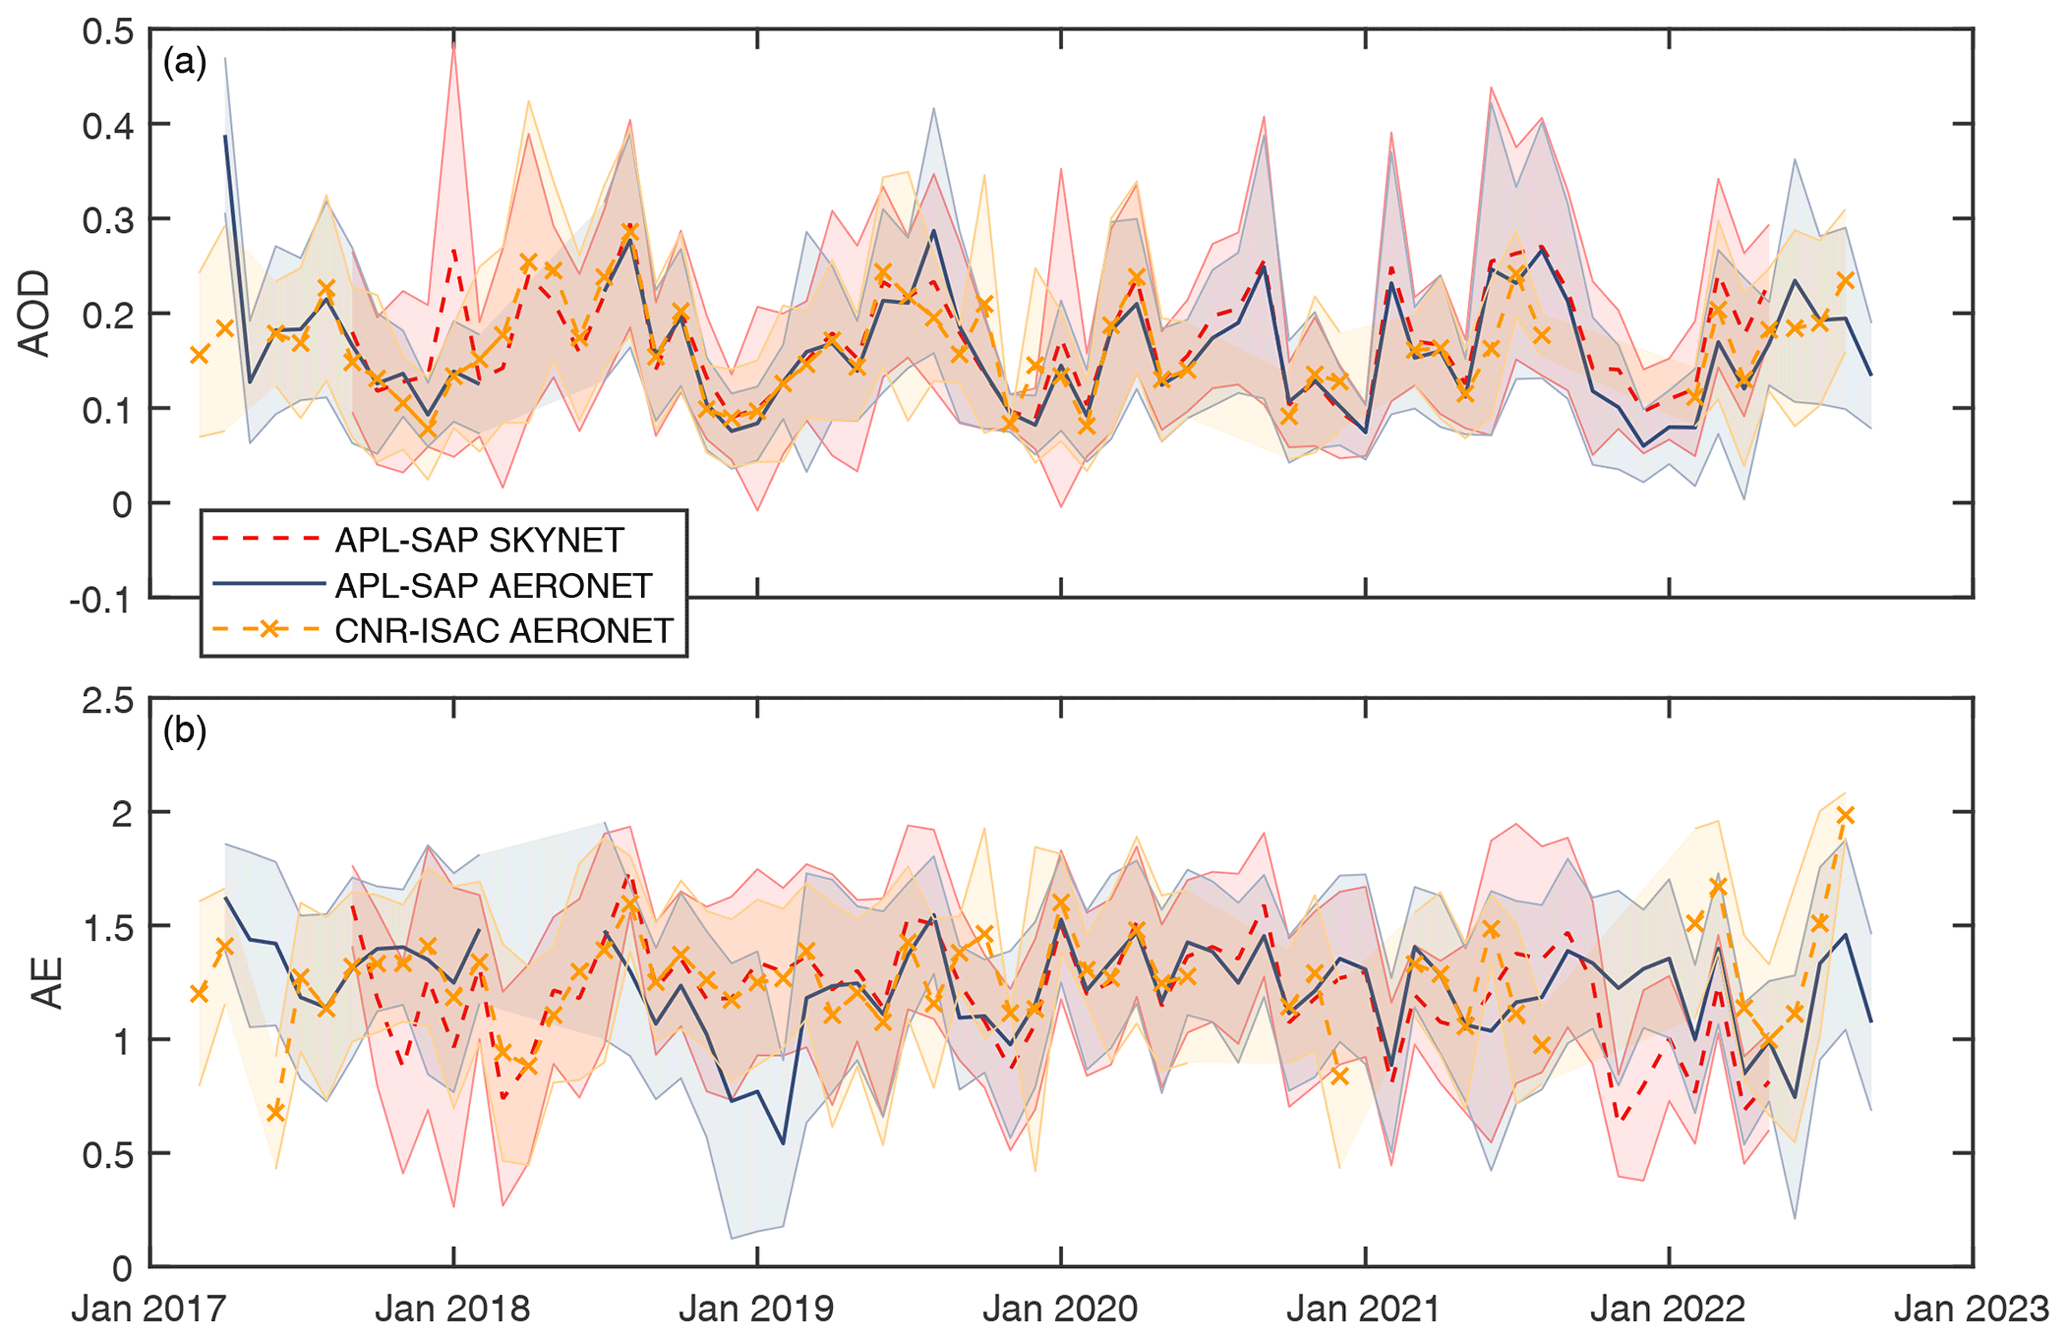
Figure 1Time series of monthly averaged AOD (a) and AE (b) measurements over APL-SAP (AERONET and SKYNET) and CNR-ISAC (AERONET). Note that AERONET AOD and AE correspond to the wavelength channels of 440 and 440–870 nm, respectively, whereas SKYNET AOD and AE refer to 400 and 400–1020 nm, respectively. The shaded areas correspond to the monthly 1σ standard deviation.
In this study, we employed level 1.5 quality-assured retrievals of AOD at 380, 440, 500, 675, and 870 nm, along with AE at 440–870 nm from the version 3 processing algorithm (Giles et al., 2019; Sinyuk et al., 2020). Level 1.5 data are cloud screened and quality assured, but final calibration has not been applied to them. However, they represent a good tradeoff between quality and readiness, considering that our approach aims to perform a near-real-time improvement on aerosol products. In the standard AERONET AOD retrieval, the NO2 optical depth is estimated from monthly climatological values of total NO2 from the Ozone Monitoring Instrument (OMI/Aura) Level-3 retrievals during the 2004–2013 period at 0.25∘ by 0.25∘ spatial resolution and the NO2 absorption coefficients from Burrows et al. (1998). The observations over the CNR-ISAC station used in this work cover the period from March 2017 to mid-August 2022, in which synchronous data from the co-located Pandora instrument are also available. The respective period for APL-SAP is from April 2017 through early September 2022. The aerosol data sets for both locations are presented in Fig. 1. The average AE is 1.23 ± 0.4 and 1.31 ± 0.5 at APL-SAP and CNR-ISAC, respectively, while the average AOD is about 0.18 ± 0.1 at both stations. AOD has a quite marked yearly cycle, with higher AOD values recorded during summer months, i.e., about 0.22 ± 0.1 and 0.21 ± 0.1 at APL-SAP and CNR-ISAC, respectively. AE is also higher during summer, with a mean value of 1.26 ± 0.4 for APL-SAP and 1.38 ± 0.5 for CNR-ISAC.
2.2.2 SKYNET
The SKYNET network, established at the beginning of the 2000s, is a ground-based radiation observation network dedicated to aerosol, cloud, and solar radiation interaction research using the Prede POM sun sky radiometers (Takamura and Nakajima, 2004; Nakajima et al., 2020). It is based on the collaboration and maintenance by several universities and research institutes around the world. This network imposes the standardization of instrument calibration, data acquisition, and data processing and implements two data analysis flows (SR-CEReS and ESR-MRI), mainly based on the SKYRAD.pack, a software package implemented for the POM sky radiometer (e.g., Nakajima et al., 1996; https://www.skynet-isdc.org/methodology.php, last access: 21 October 2022). In contrast to AERONET AOD retrieval methodologies, no correction for NO2 optical depth is applied in the calculation of SKYNET AOD (e.g., Campanelli et al., 2004; Estellés et al., 2012). Here, we used the ESR-MRI/SUNRAD processor version 0.9 level 2 AOD at 400, 500, 675, 870, and 1020 nm and AE at 400–1020 nm data sets over APL-SAP from late September 2017 to May 2022, which are open-access and available online (https://www.skynet-isdc.org/data.php, last access: 9 June 2023). The SKYNET time series used in our analysis is also illustrated in Fig. 1. The calculated mean AOD and AE are 0.18 ± 0.1 and 1.23 ± 0.4, respectively. These values are similar to the AERONET APL-SAP averages mentioned in Sect. 2.2.1, though they correspond to slightly different wavelengths. SKYNET also reports higher values on average during summer, i.e., 0.22 ± 0.1 and 1.38 ± 0.5 for AOD and AE, respectively.
2.2.3 MODIS Deep Blue data
The Moderate Resolution Imaging Spectroradiometer (MODIS) is a key sensor on board the NASA Terra and Aqua satellites flying, respectively, since 2000 and 2002. Terra MODIS (descending node; about 10:30 UTC) and Aqua MODIS (ascending node; about 13:30 UTC) are observing the entire Earth's surface every 1 to 2 d, acquiring data in 36 spectral bands ranging in wavelength from 0.4 to 14.4 µm, with a spatial resolution of 1 km at nadir (except for a few bands with higher spatial resolution).
Inversion of MODIS observations allows retrievals of several geophysical quantities. Here, we used the aerosol AOD products retrieved using the MODIS Deep Blue (DB) algorithm (Hsu et al., 2004, 2006, 2013). The basic principle of DB algorithms is to utilize the precalculated land surface reflectance database in deep blue bands (0.412 µm), where surface reflectance is relatively lower than those in longer bands. In particular, we used the collection 6.1 DB AOD products for both Aqua and Terra satellites. More details about the DB algorithm are in Hsu et al. (2013) and references therein. The spatial resolution of this product is 10 km. Wei et al. (2019) highlighted that the DB algorithm is relatively more stable and less affected by changes in atmospheric and surface conditions with respect to the Dark Target algorithm (Levy et al., 2013), showing better performances in urban areas for slightly polluted cases, such as the area of Rome. They also highlighted that collection 6.1 AOD products perform better than the previous collections, especially in Europe and North America. The MODIS DB products used in this study are available at the Level-1 and Atmosphere Archive and Distribution System Distributed Active Archive Center (LAADS DAAC; http://ladsweb.nascom.nasa.gov, last access: 21 October 2022).
2.3 Total NO2 observations
2.3.1 Pandora spectroradiometers
Pandora instruments are compact spectrometers that perform spectral measurements, with a high temporal resolution, of direct solar irradiance and scattered radiance for the retrieval of total and tropospheric column densities of atmospheric trace gases (e.g., NO2, O3, and HCHO) that affect air quality, in addition to their near-surface concentrations and vertical profiles (e.g., Herman et al., 2009; Tzortziou et al., 2012, 2015). The total NO2 vertical column data sets used in the present study were obtained from the Pandora spectrometer no. 115 that has been operating at CNR-ISAC since March 2017 and the Pandora systems (no. 117 and no. 138) that have both been deployed at APL-SAP since April 2016 and within the period August 2019–October 2020, respectively. The above time series have been affected by the COVID-19 lockdown period during February–May 2020 (Campanelli et al., 2021). The monthly averaged values from both stations are presented in Fig. 2 and intercompared in the scatterplot of Fig. 3. On average, the Pandora total NO2 column over APL-SAP is about 0.07 % higher compared to the CNR-ISAC NO2.
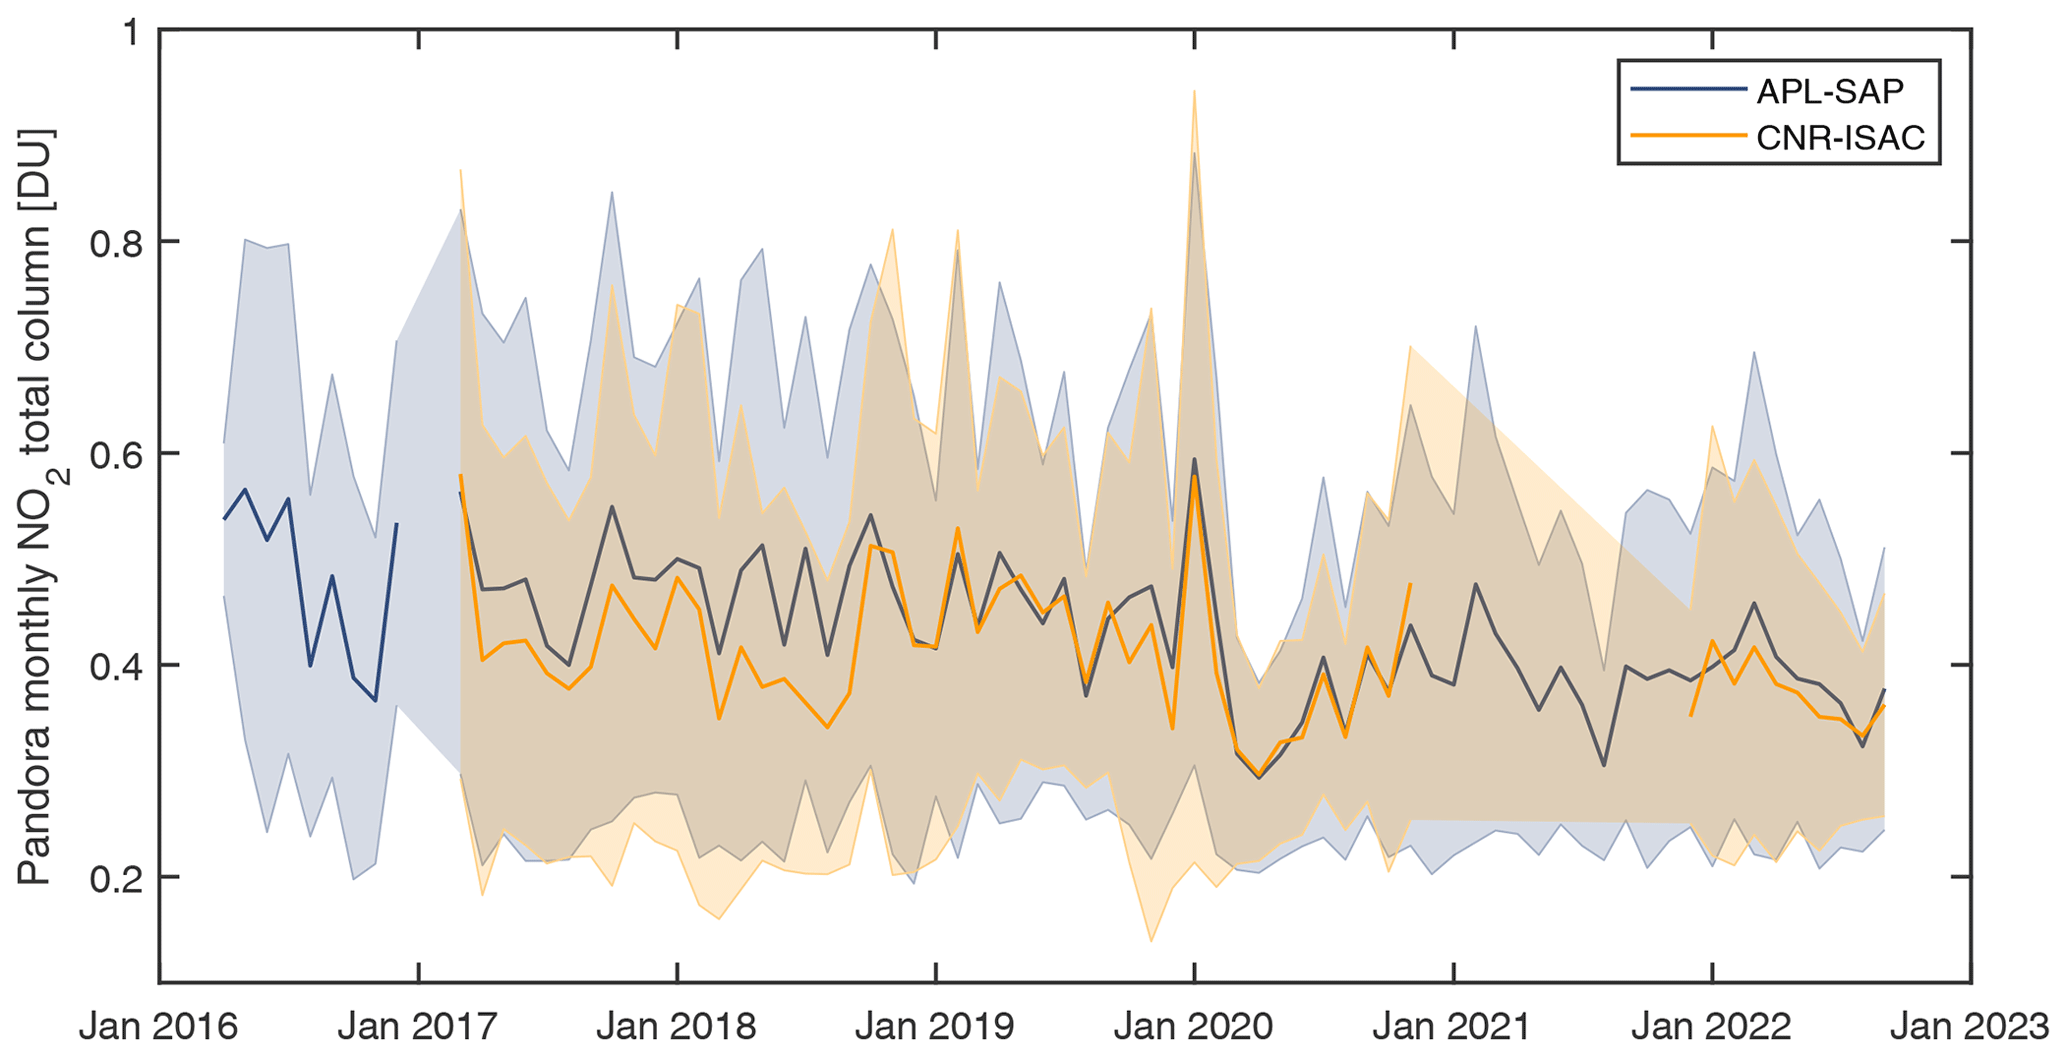
Figure 2Time series of monthly NO2 total column from Pandora instruments over APL-SAP (blue line) and CNR-ISAC (yellow line). The shaded areas correspond to the 1σ standard deviation of the monthly averaged values. The NO2 concentration is clearly affected by the COVID-19 lockdown that took place during February–May 2020.
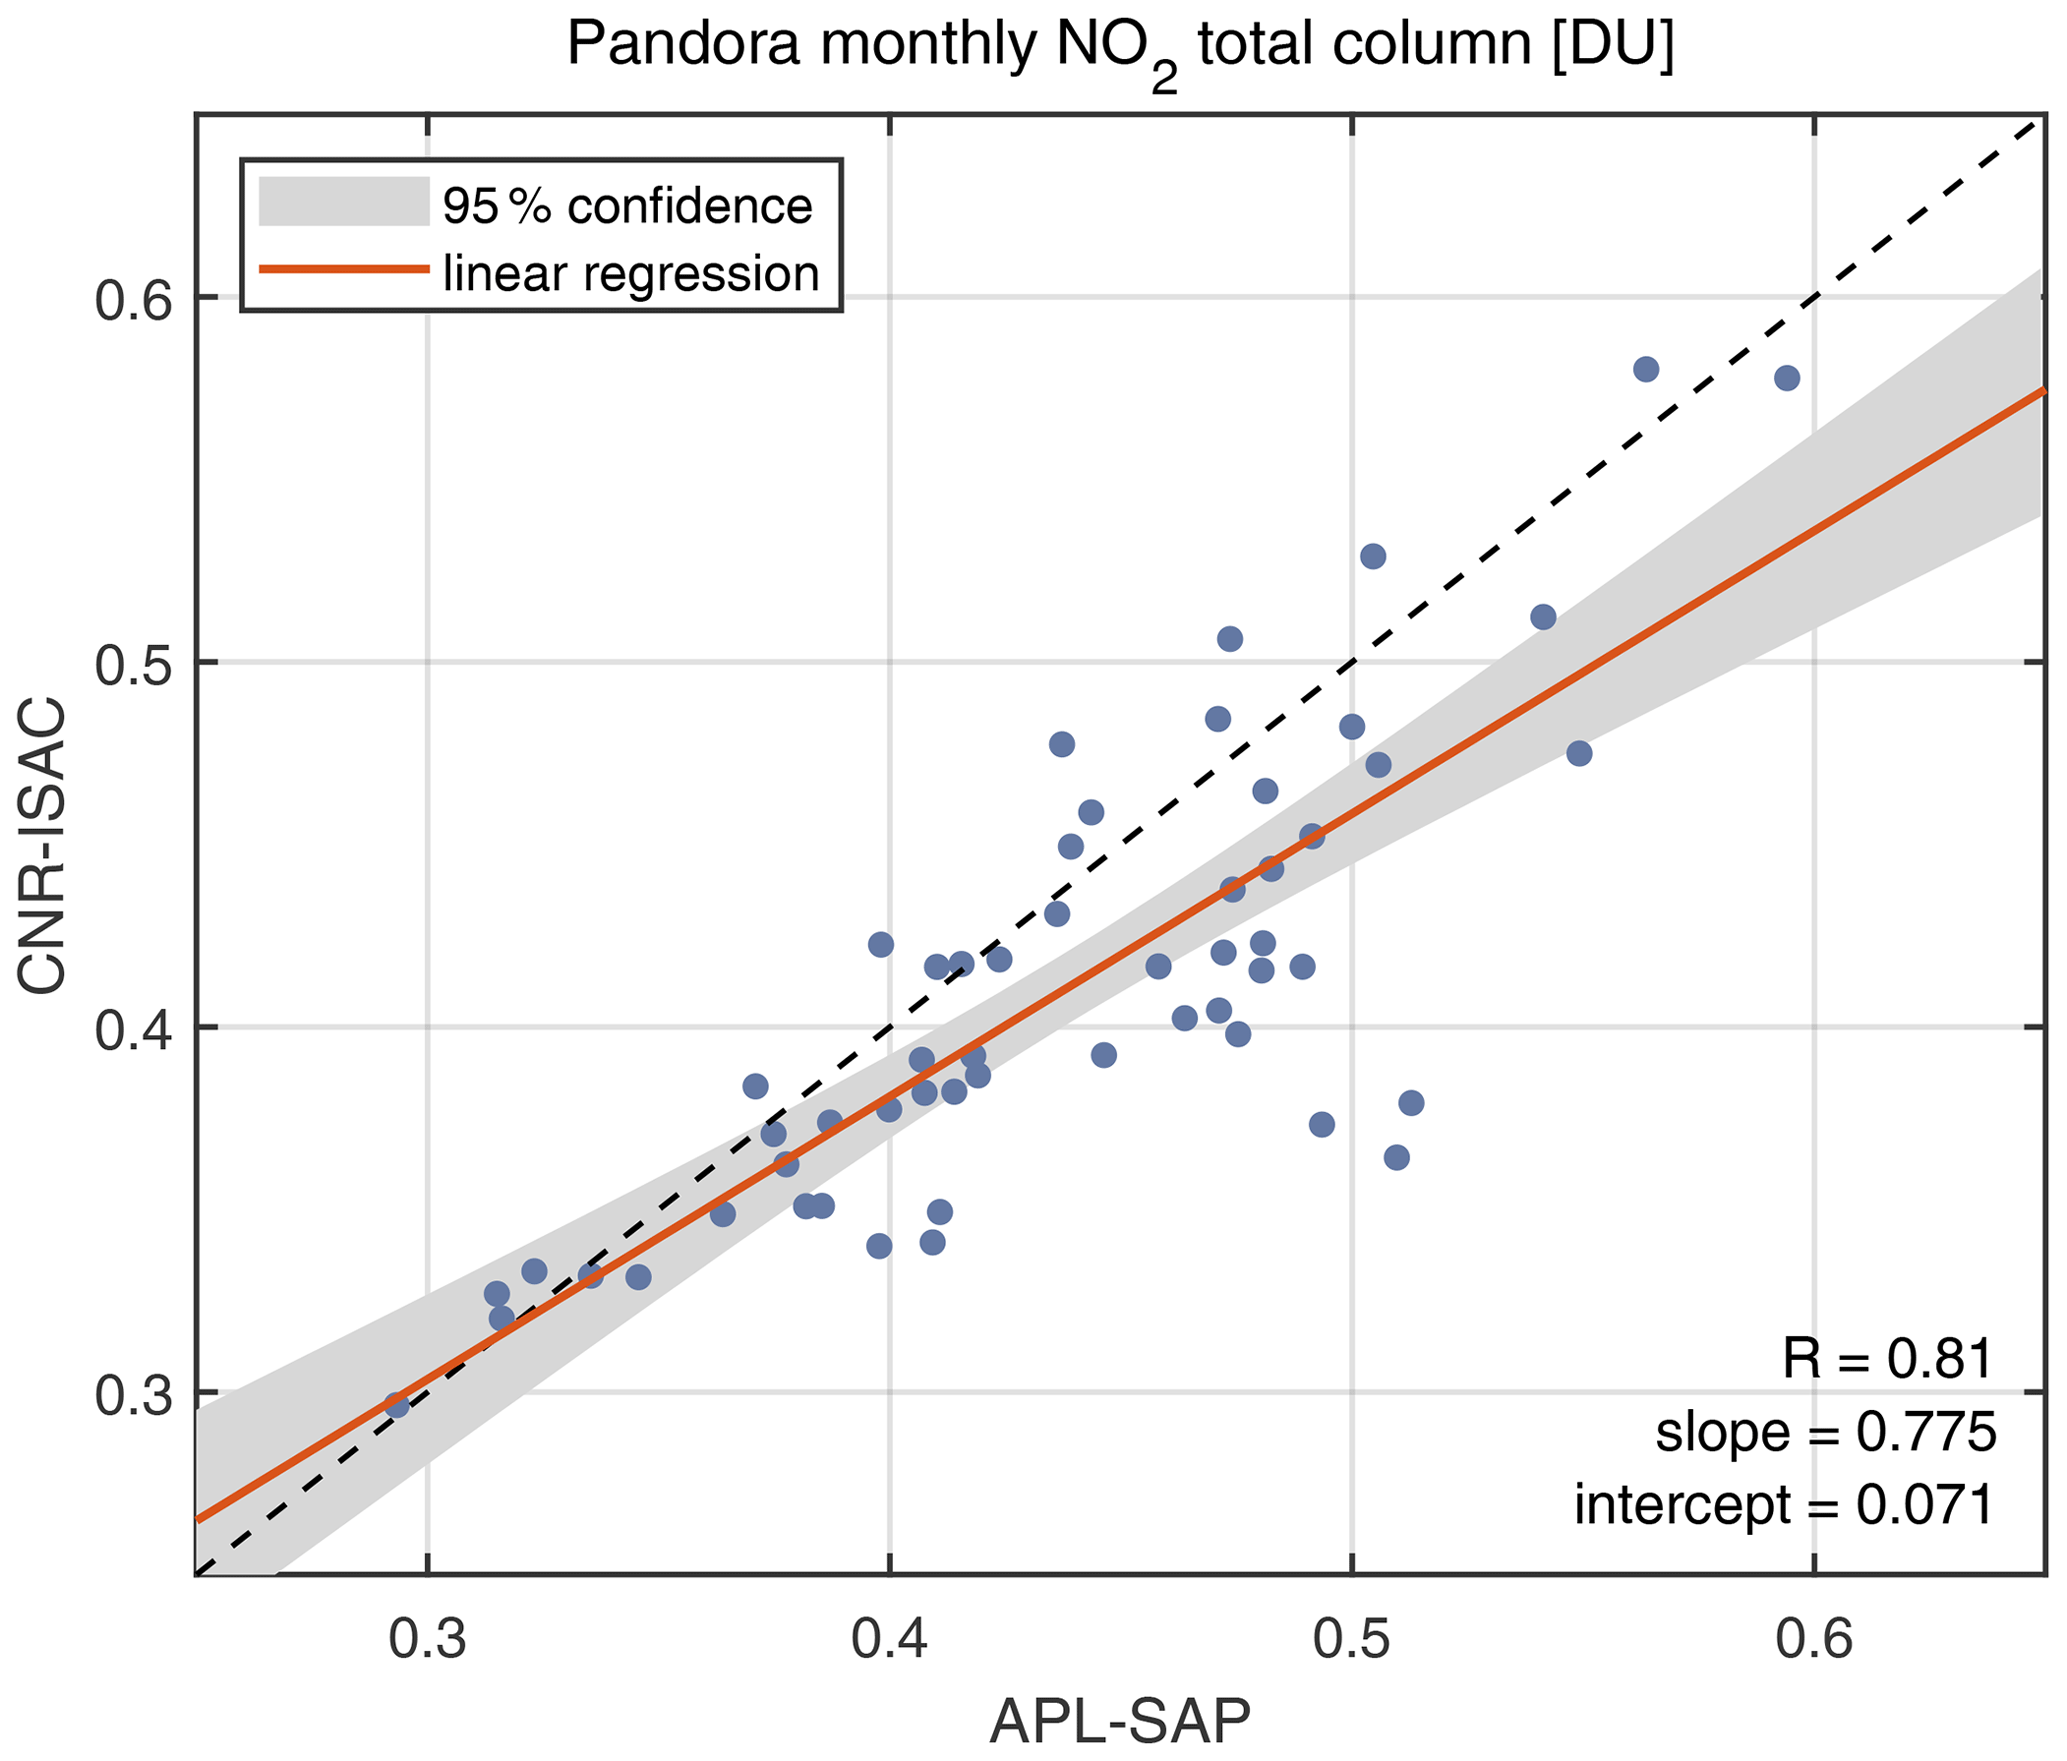
Figure 3Monthly NO2 total column from Pandora over CNR-ISAC against synchronous APL-SAP observations. The gray shaded area corresponds to the 95 % confidence interval of the linear regression fit (red line).
Pandora total NO2 column product is derived from the direct-sun measurements in the UV-VIS spectral range 280–530 nm, with an average resolution of 0.6 nm by means of the Blick software and the algorithm implemented therein, as described by Cede (2021). The data sets employed for this work were obtained with the direct-sun retrieval code “nvs3” and the Blick processor version 1.8. Pandora instruments are part of the Pandonia Global Network (PGN; Cede et al., 2020) and have been fully characterized, following the calibration procedures presented by Müller et al. (2020). The recorded raw spectrally resolved radiation measurements are centrally processed for the retrieval of atmospheric trace gas products, which are all publicly available online (https://www.pandonia-global-network.org/, last access: 21 October 2022). In the current study, high- (flags 0 and 10) and medium-quality (flags 1 and 11) data are employed. Information on the quality control of Pandora products can be found in Cede (2021). Pandora NO2 retrievals have been compared and validated with other ground-based and spaceborne observations during several field campaigns (e.g., Flynn et al., 2014; Martins et al., 2016; Lamsal et al., 2017; Herman et al., 2018; Kreher et al., 2020). Total NO2 data from the Pandora instrument no. 117 located at APL-SAP have been compared with NO2 observations retrieved by the co-located MkIV Brewer spectrophotometer (with serial no. 067), revealing a correlation coefficient above 0.96 and a negligible absolute median bias of 0.002 DU (Diémoz et al., 2021). According to Herman et al. (2009), the Pandora direct-sun total NO2 has a clear-sky precision of 0.01 DU in the slant column and a nominal estimated accuracy of 0.1 DU in the vertical column. In the same study, a systematic difference of less than 1 % was found between the relative slant columns of Pandora and a MultiFunction Differential Optical Absorption Spectroscopy (MFDOAS) instrument.
As already mentioned in Sect. 2.2.1, AERONET uses climatological values from OMI L3 products for the estimation of NO2 optical depth in AOD retrievals. The corresponding OMI total NO2 ranges between about 0.2 and 0.3 DU, with an average value of 0.26 ± 0.02 DU. The time series of the Pandora columnar NO2 differences from the AERONET climatological values for both urban (APL-SAP) and suburban (CNR-ISAC) locations is illustrated in the upper panel of Fig. 4. Pandora NO2 data are time-interpolated to AERONET measurements. The percentage frequency distributions of the absolute Pandora-OMI deviation for both locations are also presented (Fig. 4; lower panel). About 89 % of the APL-SAP and 87 % of the CNR-ISAC data pairs show an OMI climatology systematic underestimation of NO2 (positive deviations in Fig. 4). AERONET aerosol retrievals seem to significantly underestimate the NO2 abundance over urban and suburban locations, with an average absolute difference between the actual Pandora measurements and the estimations from satellite climatology of about 0.15 ± 0.19 DU (61.5 ± 71.5 %) and 0.16 ± 0.18 DU (61.5 ± 67.2 %) for APL-SAP and CNR-ISAC, respectively. This underestimation of the NO2 levels over urban locations, characterized by strong spatial gradients, can be attributed to the fact that OMI climatology cannot capture the temporal and spatial NO2 variability within an urban context (e.g., Drosoglou et al., 2017; Herman et al., 2019). Thus, the derived differences in total NO2 are highly correlated to the Pandora measurements. The majority of PGN-OMI biases lie within 0–0.5 DU, corresponding to Pandora values lower than 1 DU. More specifically, 90 % of the PGN NO2 data over APL-SAP differ within −0.14 DU (−50 %) and 0.44 DU (150 %) from OMI climatology, while the respective deviation ranges between −0.14 and 0.51 DU (−50 %–170 %) for CNR-ISAC. However, there are quite a few cases (∼ 9.5 % and ∼ 8.8 % for APL-SAP and CNR-ISAC, respectively) of higher PGN values (< 2 DU), leading to larger deviations (up to ∼ 1.6 DU for APL-SAP and ∼ 1.5 DU for CNR-ISAC).
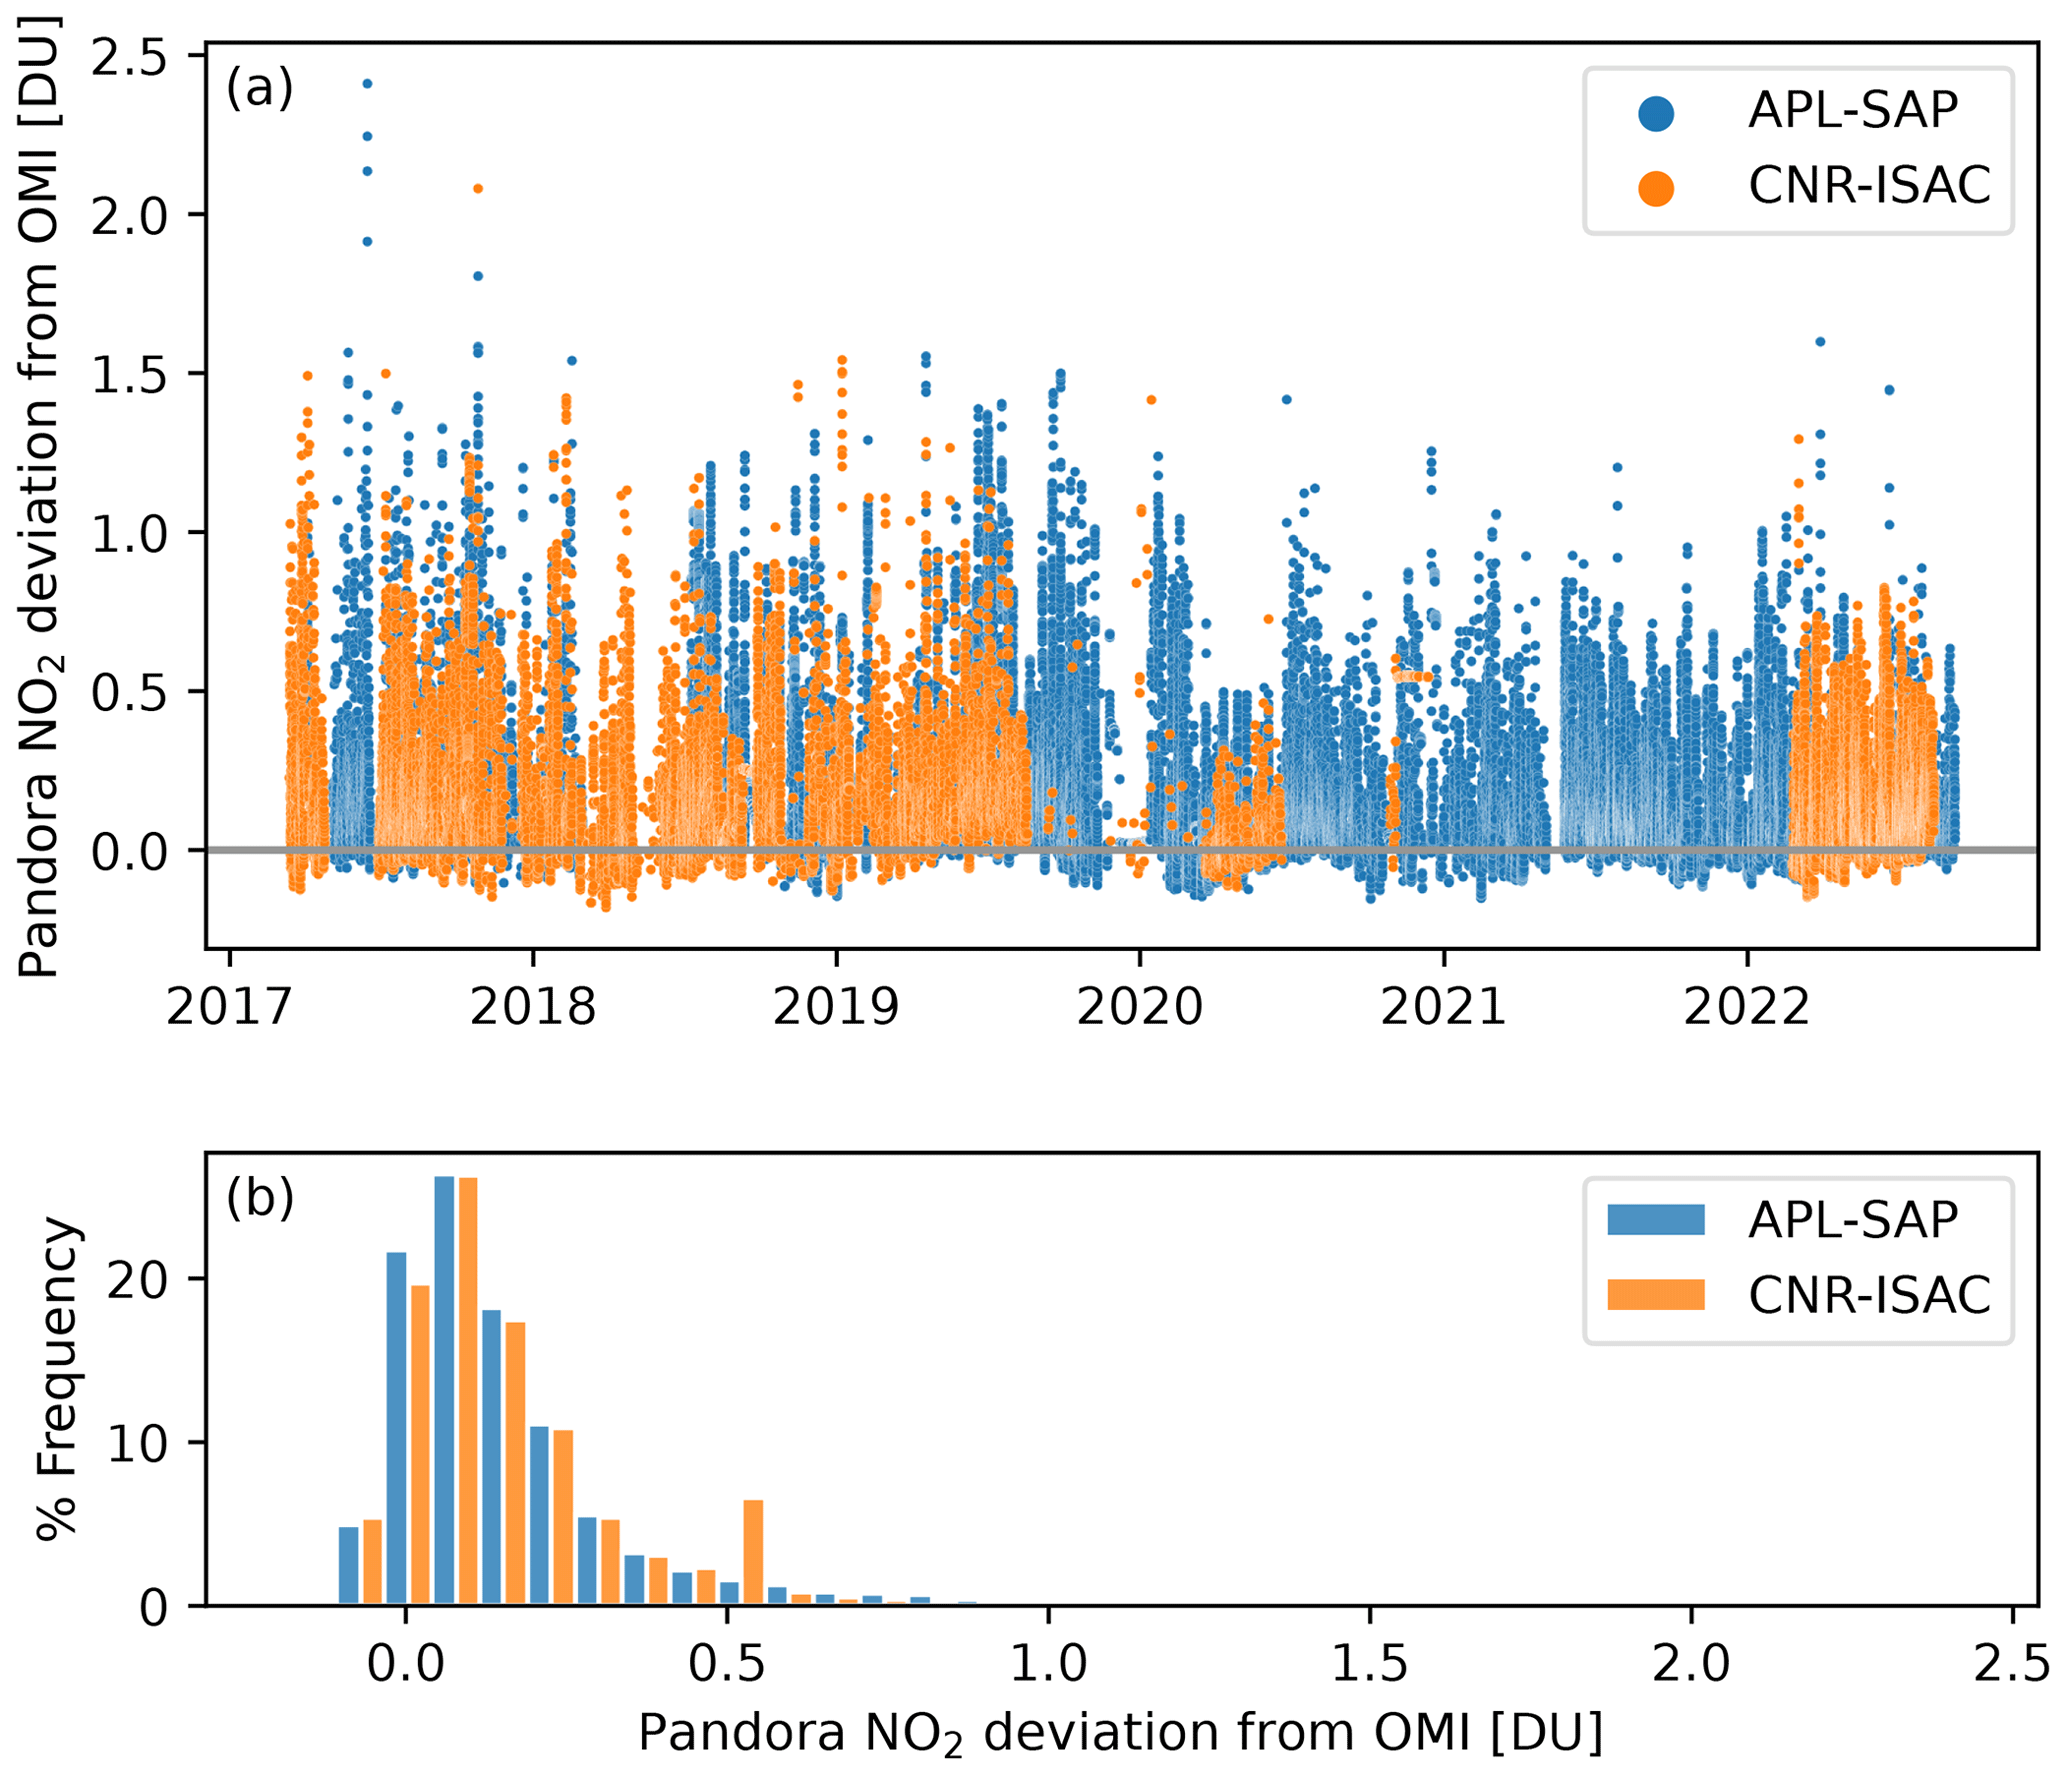
Figure 4(a) Time series of the Pandora total NO2 deviation from AERONET NO2 climatological values (OMI) for both APL-SAP and CNR-ISAC. (b) The corresponding relative frequency distributions of Pandora-OMI deviation for both locations.
2.3.2 TROPOMI
The Tropospheric Monitoring Instrument (TROPOMI) is a nadir-viewing spectrometer on board the Sentinel-5 Precursor (S5P) satellite, which was launched on 13 October 2017. Since August 2019, TROPOMI has a pixel size of 5.5 km × 3.5 km (the initial resolution was 7 km × 3.5 km). NO2 columns are retrieved using the backscatter solar radiation detected in the spectral window of 405–465 nm (van Geffen et al., 2015) by applying the DOAS technique (Platt, 1994; Platt and Stutz, 2008). The operational TROPOMI NO2 products are generated using the algorithm described by van Geffen et al. (2022), which is an improvement of the NO2 DOMINO algorithm (Boersma et al., 2011) developed by the Royal Netherlands Meteorological Institute (KNMI) for the OMI satellite sensor measurements. Both near-real-time (NRTI) and offline (OFFL) NO2 data sets are retrieved using the KNMI standard algorithm (Eskes et al., 2022; Eskes and Eichmann, 2022). NRTI data files are available within 3 h from the measurement, whereas the OFFL data are processed in offline mode, and the respective files are generated a few days after the sensing time (van Geffen et al., 2022).
In this study, the OFFL NO2 retrievals are employed, which are the main S5P/TROPOMI product. The extracted NO2 data set covers the period October 2018–August 2022 and includes observations obtained from several processor versions, beginning with version 01.02.00 before March 2019 and going up to version 02.04.00 after July 2022. The total NO2 column was calculated from the sum of the tropospheric and stratospheric components, which is preferred over the TROPOMI total NO2 product for comparisons with ground-based data because the latter suffers from retrieval uncertainties due to its significant dependence on the ratio of the a priori tropospheric and stratospheric columnar data (van Geffen et al., 2022). Additionally, the satellite pixels have been filtered to keep only those with a QA (quality assurance) value > 0.75, corresponding to cloud radiance fraction < 0.5 (Eskes and Eichmann, 2022). The S5P/TROPOMI NO2 products have been downloaded from the Sentinel-5P Pre-Operations Data Hub of the Copernicus Open Access Hub (https://scihub.copernicus.eu/, last access: 21 October 2022).
For visualization purposes, the averages of the summed NO2 column re-gridded on a 500 m grid are plotted for the greater Rome area (Fig. 5). The data used in Fig. 5 cover the period from 2018 to 2021, excluding the COVID-19 lockdown period (February–May 2020) in order to prevent the average NO2 values from being affected by the low values observed during that period.
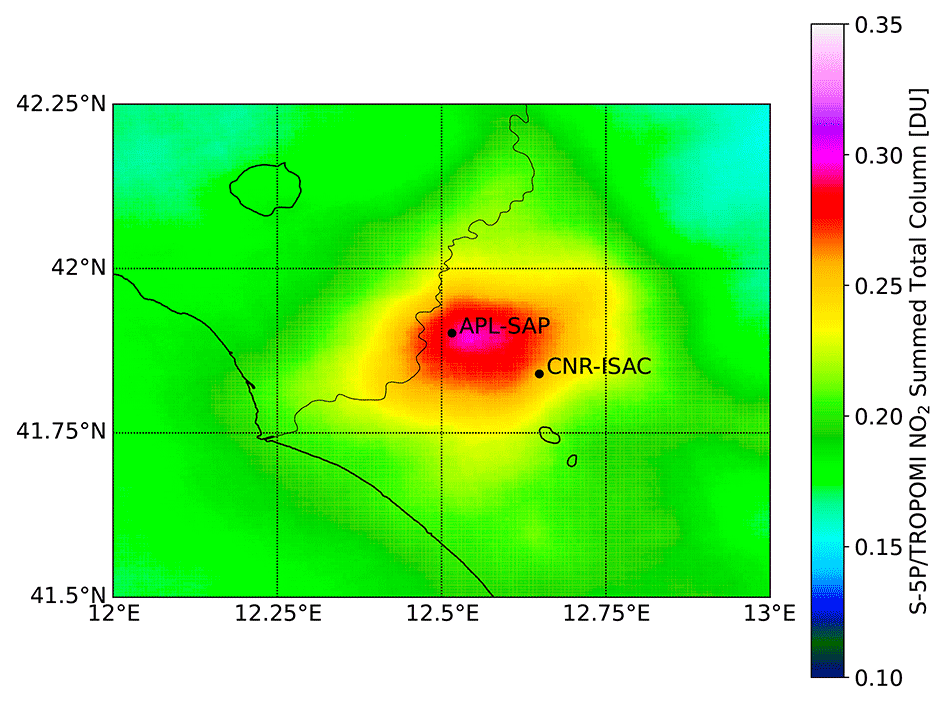
Figure 5S5P/TROPOMI summed the total NO2 column averaged for the period 2018–2021, excluding the COVID-19 lockdown period. The data are gridded on a 500 m grid. The locations of the two observational sites used in this study are also reported for reference.
2.4 AOD and AE corrections for NO2 absorption
2.4.1 AOD retrievals
The methodology to derive AOD (also referred to as τ) from photometric measurements is based on the Lambert–Beer law (Eq. 1), which describes light attenuation by atmospheric components. I0(λ) is the intensity of the incident light and I(λ) denotes the radiation intensity after traversing through the atmosphere at a specific wavelength λ.
The quantities τ and τR describe the optical depth of radiation extinction due to aerosols (Mie scattering) and atmospheric molecules (Rayleigh scattering), whereas mτ and mR are the respective air mass factors. ∑jmjτj represents the sum of the extinction due to absorption from atmospheric gases (Eq. 3), with this depending on the wavelength.
In our study, we investigate the effects of using an independent, direct measurement of rather than the climatological value used in the AERONET inversion in determining the AOD (τ). Thus, by combining Eq. (2) with Eq. (3), assuming that the air mass factor in direct-sun measurements is equal to sec(θ) for both aerosol and NO2, where θ is the solar zenith angle, and absorption from all the other gaseous components stays the same, the difference in AOD due to the different estimation of NO2 optical depth is obtained by Eq. (4):
where is the NO2 absorption optical depth climatology used by AERONET, and is the optical depth calculated from Pandora NO2 measurements. The latter is derived using Eq. (5):
The quantity in Eq. (5) refers to the absorption cross section of NO2 at wavelength λ (Burrows et al., 1998), and is the total NO2 column from Pandora instrument. The modified AOD values (τAER_mod) are obtained from the standard AERONET AOD (τAER) by applying the following equation:
The same approach was also applied to the SKYNET AOD data. However, since the SKYNET retrievals assume , Eqs. (4) and (6) are modified as follows:
where τSKYNET(λ) denotes the standard SKYNET AOD at spectral channel λ, and τSKYNET_mod(λ) is the modified AOD at wavelength λ.
2.4.2 AE retrievals
The spectral variability in AOD is generally expressed as follows:
where α stands for the Ångström exponent (AE).
The AERONET AE product (Eck et al., 1999) is calculated by applying a least squares regression fit on Eq. (10), using the AOD and wavelength logarithms for each non-polarized wavelength channels in different spectral ranges (i.e., 340–440, 380–500, 440–675, 440–870, and 500–870 nm). The negative slope of this linear fit is the Ångström exponent α (Eq. 11).
Here, we also investigate the impact of using synchronous Pandora total NO2 data in an AOD algorithm (as described in Sect. 2.4.1) on AE retrievals. To do this, the AERONET AE product in the range 440–870 nm was used along with the AOD of non-polarized channels included in this range, i.e., 440, 500, 675 and 870 nm. AE was recalculated based on Eq. (11), using the modified AOD at wavelengths 440 and 500 nm obtained from Eq. (6). For the other channels (675 and 870 nm) in which NO2 absorption is negligible, the standard AOD data from AERONET were employed.
For SKYNET, AE is calculated by applying a least squares regression fit on Eq. (10), using the AOD and wavelength logarithms at all wavelengths (400, 500, 675, 870, and 1020 nm). Again, AOD was recalculated using Eq. (8) only at wavelengths 400 and 500 nm, where the impact of the NO2 absorption is significant.
The difference in AE due to the different estimation of NO2 optical depth in AOD retrievals is expressed as follows:
where αmod(λ) represents the modified AE data, and α(λ) denotes the AE standard product from the AERONET or SKYNET network.
2.5 Trend calculations
In this study, we also evaluate the impact of modified AOD and AE retrievals, as described in Sect. 2.4.1 and 2.4.2, on aerosol temporal trends. This is only a first attempt to investigate the possible effect of NO2 absorption on the AOD and AE trends, since the data sets used here are quite short for statistically meaningful calculations.
The annual trends in AOD and AE were estimated by applying the weighted least squares fitting technique introduced by Weatherhead et al. (1998) and previously adopted in several aerosol trend analysis studies from space and the ground (e.g., Zhang and Reid, 2010; Yoon et al., 2012; Logothetis et al., 2021). The applied linear trend model is based on the following formula:
where Yt is the monthly average aerosol property of interest, μ is a constant term representing the linear fit offset at the start of the time series, ω stands for the magnitude of the trend per year, and εt is the monthly average noise not represented by the linear fit. is the decimal number of years since the first month of the time series, t is the month index, T denotes the total number of months, and is the total number of years in the time series.
In order to account for data variability due to severe aerosol events and cloud disturbance, we introduced a monthly weighting factor wt into the linear fitting procedure (Eq. 14; Yoon et al., 2012). This weighting factor is defined as the square root of the number of observations available each month nt divided by the monthly standard deviation σt (Eq. 15).
In order to derive statistically significant monthly mean values, a minimum number of 10 observations in a daily basis was ensured. In addition, qualified monthly averages require the availability of measurements from at least 10 d per month. Data were filtered based on the above criteria, and days and/or months that did not fulfill them were excluded from the data sample used in the trend calculations. It should be noted that the data sets employed in this study are quite short for statistically meaningful aerosol trend analysis. However, this is a first attempt to investigate the impact of modified AOD and AE calculations on the derived temporal trends.
2.6 GRASP algorithm
The Generalized Retrieval of Atmosphere and Surface Properties (GRASP; Dubovik et al., 2021) is a state-of-the-art inversion algorithm based on a statistically optimized multiterm least squares method (LSM) proposed by Dubovik (2004). GRASP has been applied to numerous applications covering a vast variety of instruments and, interestingly, to very different combinations between them. Among the different applications of GRASP, it is possible to find GRASP/POLDER-3 (Chen et al., 2020), GRASP/AOD (Torres et al., 2017), OLCI/GRASP (Chen et al., 2022), the combination of active lidar measurements and ground-based radiometry (Lopatin et al., 2013, 2021; Román et al., 2018; Herreras et al., 2019), the retrieval of all-sky cameras (Román et al., 2017, 2022), or, for example, applications to in situ measurements including polar nephelometers (Espinosa et al., 2017, 2019; Schuster et al., 2019).
The GRASP scientific core was borne from the heritage of the AERONET inversion algorithm (Dubovik and King, 2000; Dubovik et al., 2000; Dubovik, 2004; King and Dubovik, 2013). At the same time, as discussed above and by Dubovik et al. (2011, 2021), the possibilities of GRASP have been extended due to the totally generalized nature of the inversion module and the continuous developments of the forward model.
For this study, GRASP has been used to mimic AERONET standard retrieval in order to understand the effects of the NO2 concentration on the retrieved SSA at 440 nm. In this case, two different approaches were followed for the GRASP algorithm. First of all, GRASP has been used as close as possible to the standard AERONET retrieval, which means that the input measurements of the algorithm are the total optical depth (TOD) and the almucantar sky measurement routine at 440, 675, 870, and 1020 nm. In the first approach (GRASP/AERONET NO2 hereafter), the NO2 absorption is taken into account, using OMI climatology, exactly as done for AERONET. On the other hand, GRASP flexibility allows the use of different assumptions of the gaseous properties. Therefore, in addition to the standard approach, the aerosol retrieval has also been done using the total columnar NO2 concentrations provided by the Pandora spectrometers co-located with AERONET instruments at the two stations selected for this study. This methodology will hereafter be referred to as GRASP/Pandora NO2. Thus, in addition to the standard AERONET retrieval products, GRASP has provided aerosol retrieval using these more accurate NO2 concentrations. The NO2 absorption features were calculated more precisely from those concentrations by using a k-distribution approach or the “kbin” code (Doppler et al., 2014a, b) to speed up the calculations.
3.1 Differences in AOD and AE retrievals using Pandora NO2 data
The differences in AOD (Δτ) at 440 nm and, thus, of its spectral variability through the AE (Δα at 440–870 nm) correcting for measured NO2 effects with respect to the standard AERONET retrievals are illustrated in Fig. 6 for both the Rome CNR-ISAC and APL-SAP stations. The frequency distributions of AOD, Δτ, and Δα are also included in Fig. 6. Δτ is defined as the standard minus the modified AOD (τAER–τAER_mod; see Eqs. 4–6). Similarly, Δα is defined as αAER–αAER_mod (Eq. 12). The derived values are presented versus the AOD at 440 nm and are color coded with respect to the Pandora NO2 retrievals. The dependency of Δτ on NO2 is quite clear. As expected, higher Δτ absolute values are obtained for higher NO2 concentrations, regardless of the initial measured AOD. Also, the absolute percentage of Δτ with respect to the AOD is higher for lower aerosol loadings, which means that the impact of the NO2 correction is more significant on lower AODs. This fact is also clear from Δα, which is higher not only for higher NO2 but also for lower AOD values as well. Interestingly, based on Fig. 6, the highest Pandora NO2 retrievals (reddish colors) are not associated with the highest AOD values, indicating that in Rome the high AOD loadings are not strictly associated with high NO2 pollution events. In fact, high AODs are frequently related to the long-range transport of elevated layers of desert dust, fire plumes, or a combination of both (e.g., Barnaba et al., 2011; Gobbi et al., 2019; Campanelli et al., 2021; Andrés Hernandez et al., 2022). Hence, it might be worth modifying the aerosol retrievals for high NO2 in those pollution-related events with low to medium AOD levels. More about AOD and aerosol type climatology for the Rome area can be found in Di Ianni et al. (2018) and in Campanelli et al. (2022).
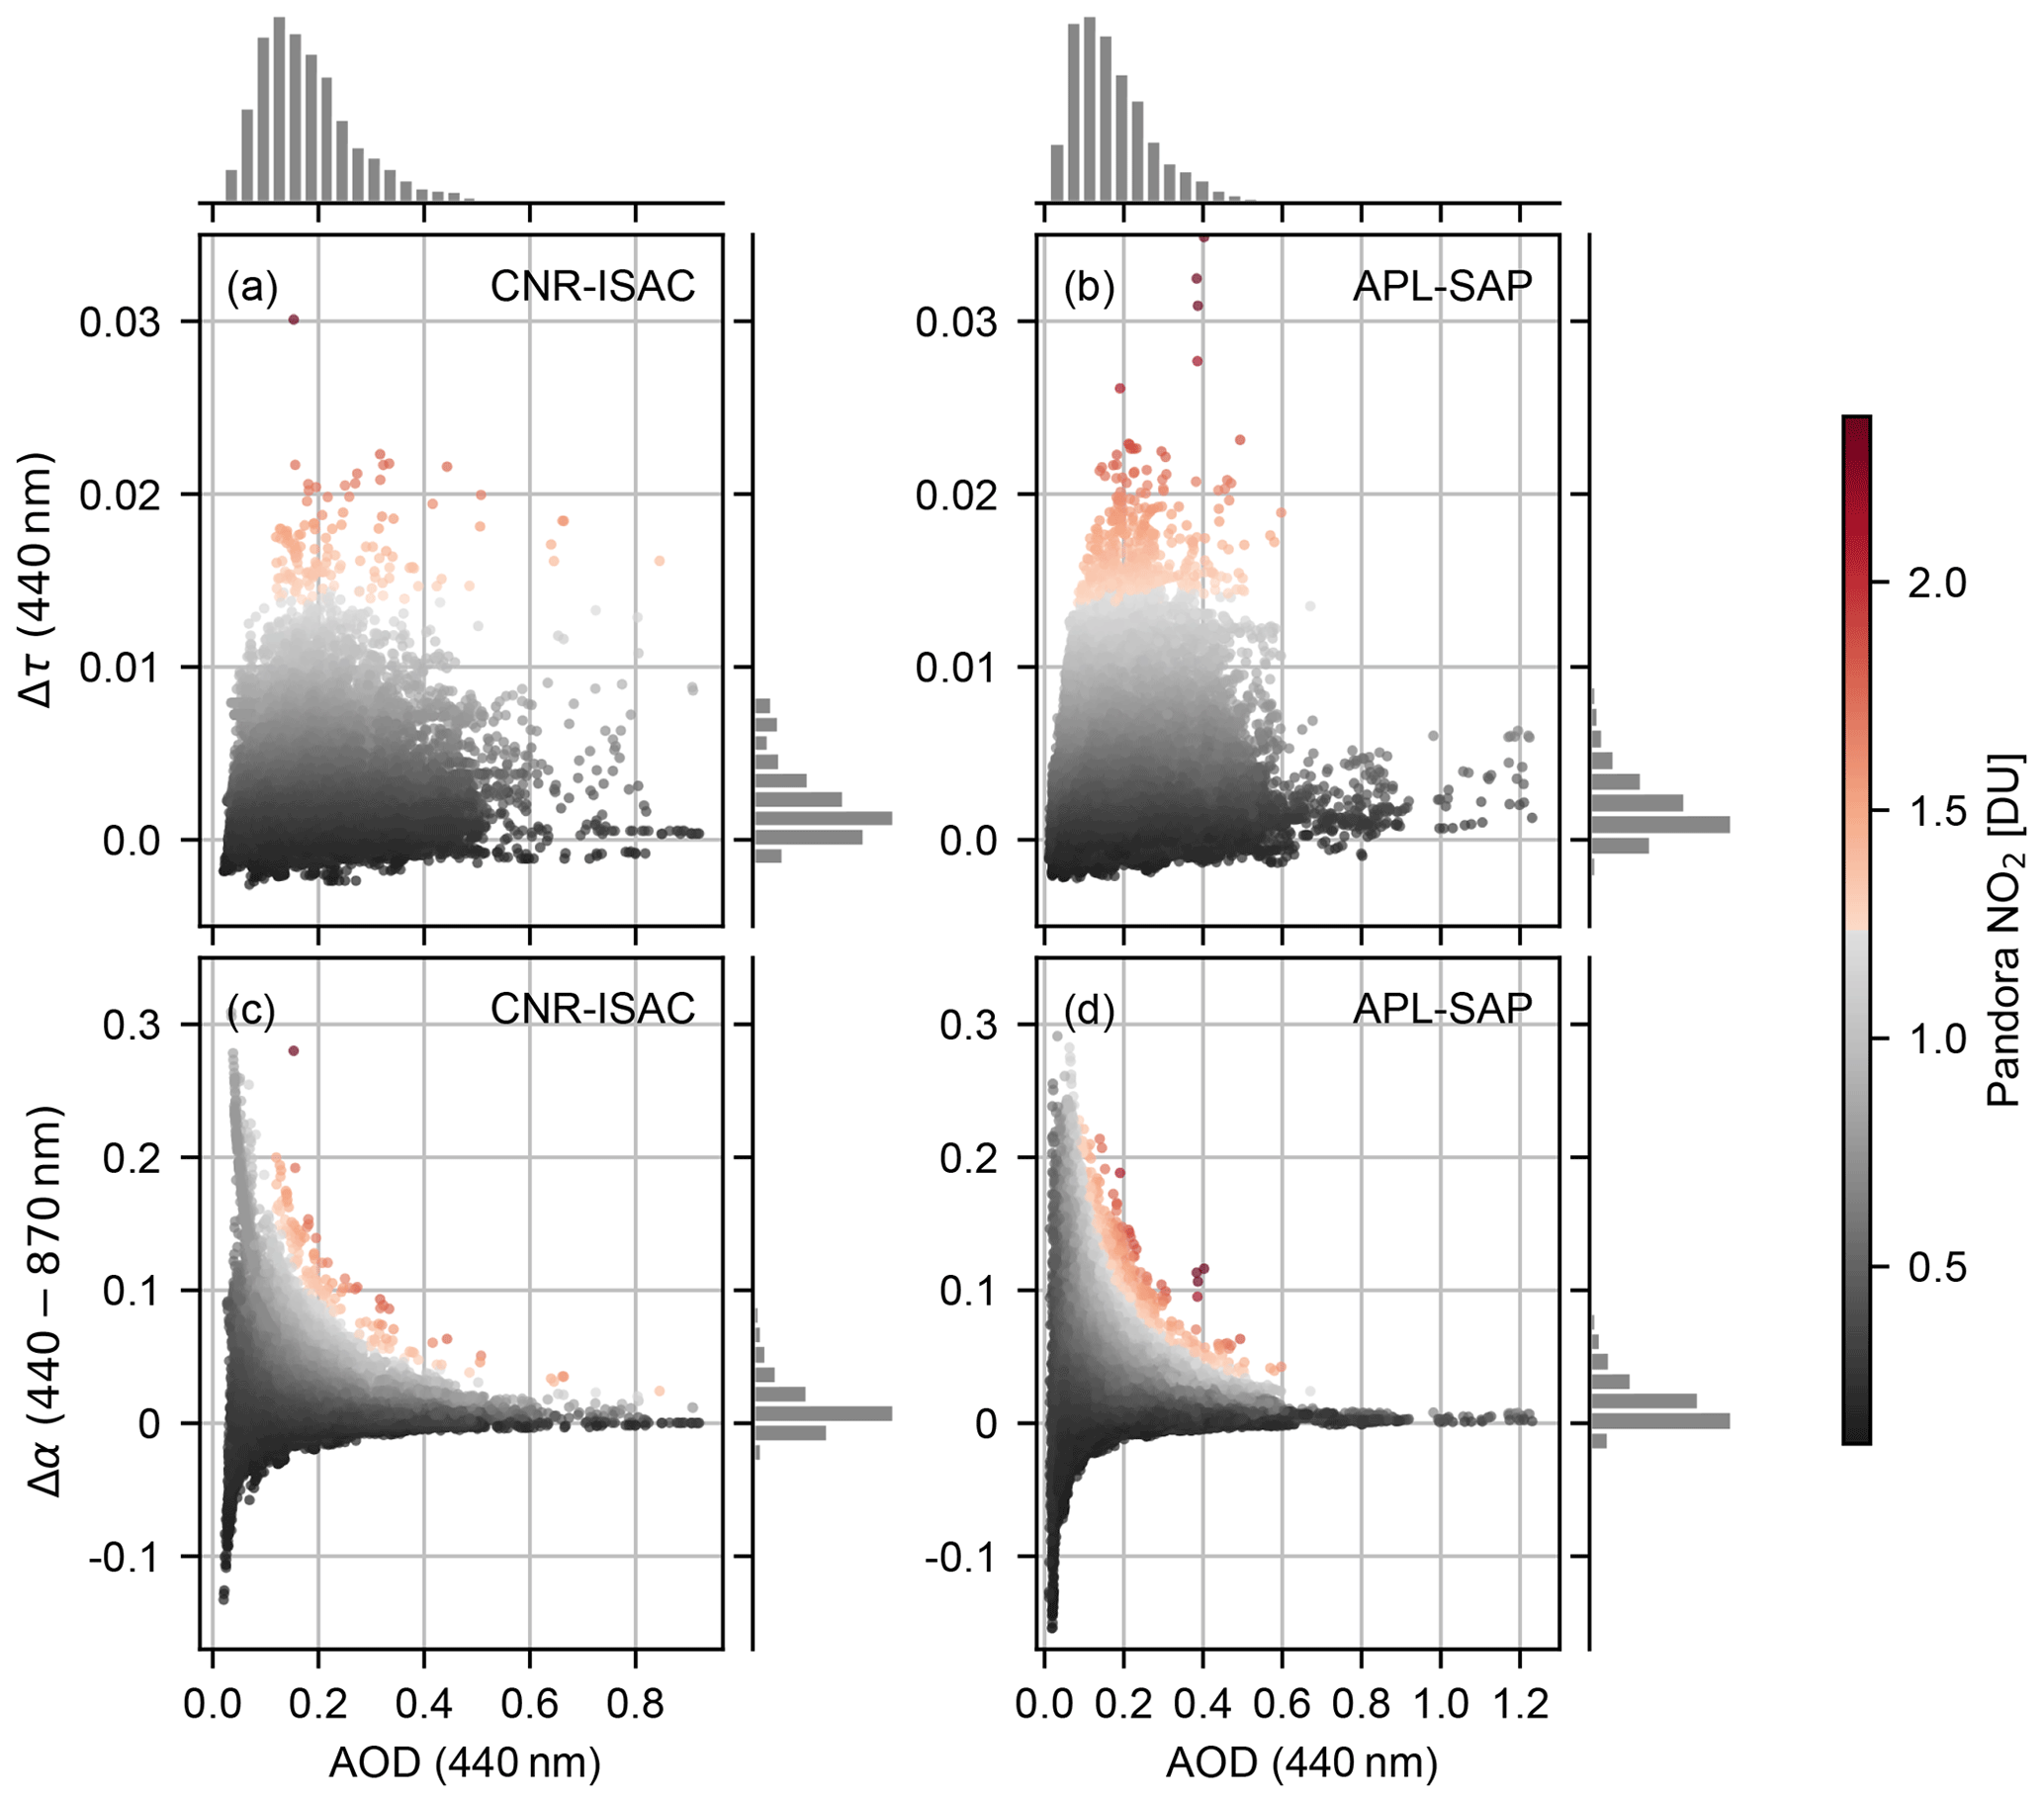
Figure 6The differences in the modified AERONET AOD at 440 nm (a, b) and AE at 440–870 nm (c, d) over CNR-ISAC and APL-SAP from the standard products illustrated with respect to the standard AERONET AOD measurements at 440 nm and the actual NO2 observed by Pandora (color scale). The corresponding distributions of all variables are also included.
In general, considering the climatological value chosen for Rome in AERONET retrievals, the use of actual, coincident NO2 measurements on the calculations of aerosol properties still seems to be useful for AOD < 0.3, while being quite low (less than 10 %) for AOD > 0.5 and almost negligible for AOD > 0.8. In most cases, AERONET retrievals seem to overestimate AOD and AE. However, there are cases of underestimation, especially in AE retrievals, which seems to be higher for lower AODs. Those underestimations correspond to overestimation of NO2 from satellite monthly climatological values used in AERONET retrievals. The estimated AOD and AE deviations are below 0.01 and 0.1, respectively, for the majority of observations, i.e., about 96 %–98 % of occurrences for both CNR-ISAC and APL-SAP (see also distributions in Fig. 6). The average AOD bias is between 0.002 ± 0.003 and 0.003 ± 0.003 (with the higher values observed at 380 nm), while the average AE bias is ∼ 0.02 ± 0.03. Overall, the mean AOD bias is low compared to the estimated uncertainties for the standard AERONET product, i.e., 0.01–0.02 (with the higher errors observed in the UV; Sinyuk et al., 2020). However, the mean AOD bias for the cases of high NO2 levels (> ∼ 0.7 DU) is ∼ 0.011 ± 0.003 at 440 nm and ∼ 0.012 ± 0.003 at 380 nm for APL-SAP and ∼ 0.009 ± 0.003 at 440 nm and ∼ 0.010 ± 0.003 at 380 nm for CNR-ISAC, which is comparable to the AERONET reported uncertainties. The estimated mean bias of AE retrievals for the cases with high NO2 (> ∼ 0.7 DU) is ∼ 0.08 ± 0.04 for both Rome sites. The threshold for NO2 has been selected as being the average Pandora NO2 (∼ 0.4) calculated from the whole data set plus 2 times the standard deviation.
The results for SKYNET observations are similar (Fig. 7), but only positive Δτ and Δα values are derived, indicating the overestimation of the aerosol properties, since the NO2 optical depth is not considered in the standard retrieval processes (see Eqs. 7–8). Δτ is defined as τSKYNET–τSKYNET_mod (see Eqs. 7–8), and Δα stands for αSKYNET–αSKYNET_mod (Eq. 12). In addition, the derived deviations in aerosol properties reach higher values compared to AERONET. Especially AE differences extend up to a value of about 0.7, which is more than double compared to AERONET results. Interestingly, these quite large Δα values (> 0.3) correspond to relatively low NO2 loadings (< 1.2 DU). The differences observed between the two networks can be partly attributed to the different wavelength channels used for AOD and AE retrievals. Similar to AERONET, the derived AOD and AE biases for SKYNET are below 0.01 and 0.1, respectively, for the majority of observations (i.e., about 85 % of occurrences for AOD and about 90 % for AE; see also distributions in Fig. 7). The overall average AOD bias is ∼ 0.007 ± 0.003, which can be assumed to be low, considering that Nakajima et al. (2020) have estimated a root mean square difference (RMSD) of about 0.03 for wavelengths < 500 nm in city areas in AOD comparisons with other networks. However, the mean AOD bias for the cases with high NO2 levels (> ∼ 0.7 DU) is found to be about 0.018 ± 0.003, which is comparable to the RMSD value reported by Nakajima et al. (2020). The overall average AE bias calculated in this study is ∼ 0.05 ± 0.04, whereas the AE bias averaged over the high NO2 cases is about 0.10 ± 0.05.
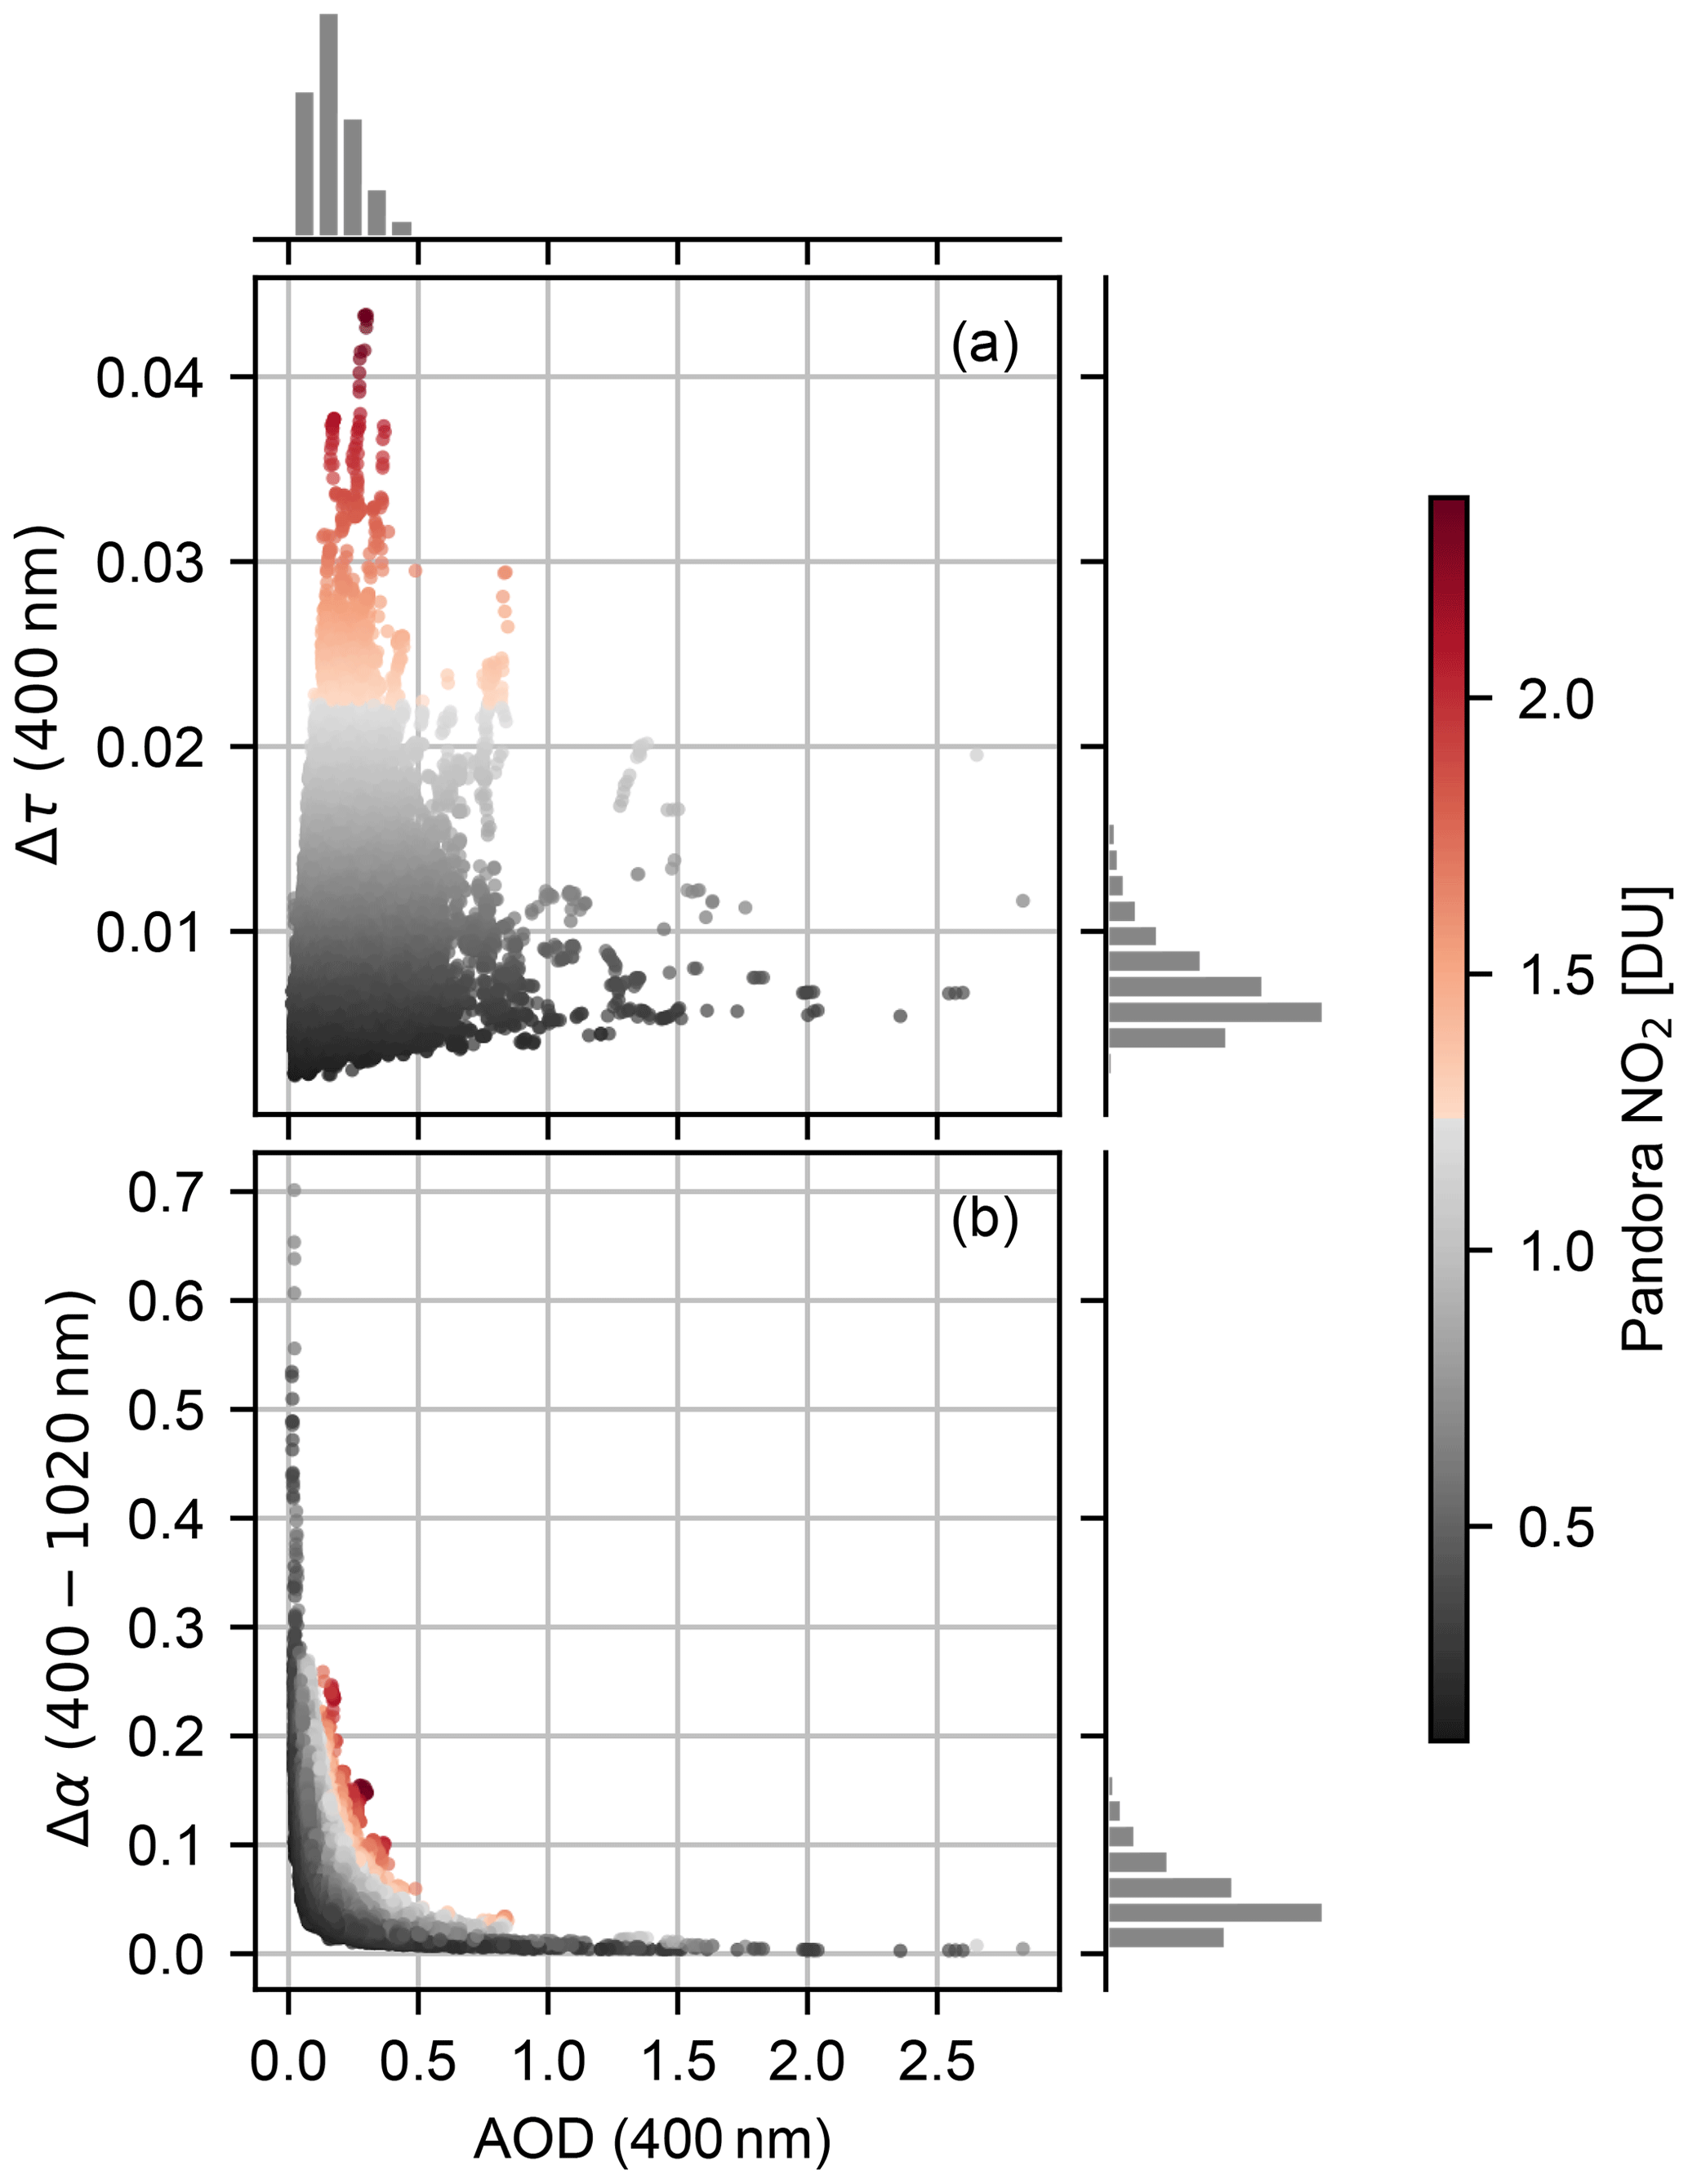
Figure 7The differences in the modified SKYNET AOD at 400 nm (a) and AE at 400–1020 nm (b) over APL-SAP from the standard products illustrated with respect to the standard SKYNET AOD measurements at 400 nm and the actual NO2 observed by Pandora (color scale). The corresponding distributions of all variables are also included. Note that the spectral channels for the retrievals and the axis scales are different compared to AERONET.
The World Meteorological Organization (WMO, 2005) states that, when comparing AOD retrieved from sun photometers, 95 % of the AOD differences should lie within of AOD, where m is the optical air mass. The first term of the equation (0.005) represents the maximum tolerance for the uncertainty due to the atmospheric parameters used for the AOD calculation (additional atmospheric trace gas corrections, i.e., ozone and NO2 and Rayleigh scattering), while the second term () describes the calibration-related relative uncertainties, for which the WMO recommends an upper limit of 1 % (e.g., Cuevas et al., 2019; Kazadzis et al., 2018a). Based on the above, although the average deviations found in this study are low compared to the retrieval uncertainties, they cannot be considered negligible, especially the average systematic underestimation of AOD of about 0.007 from SKYNET, also bearing in mind that there are locations with much higher average NO2 compared to the city of Rome.
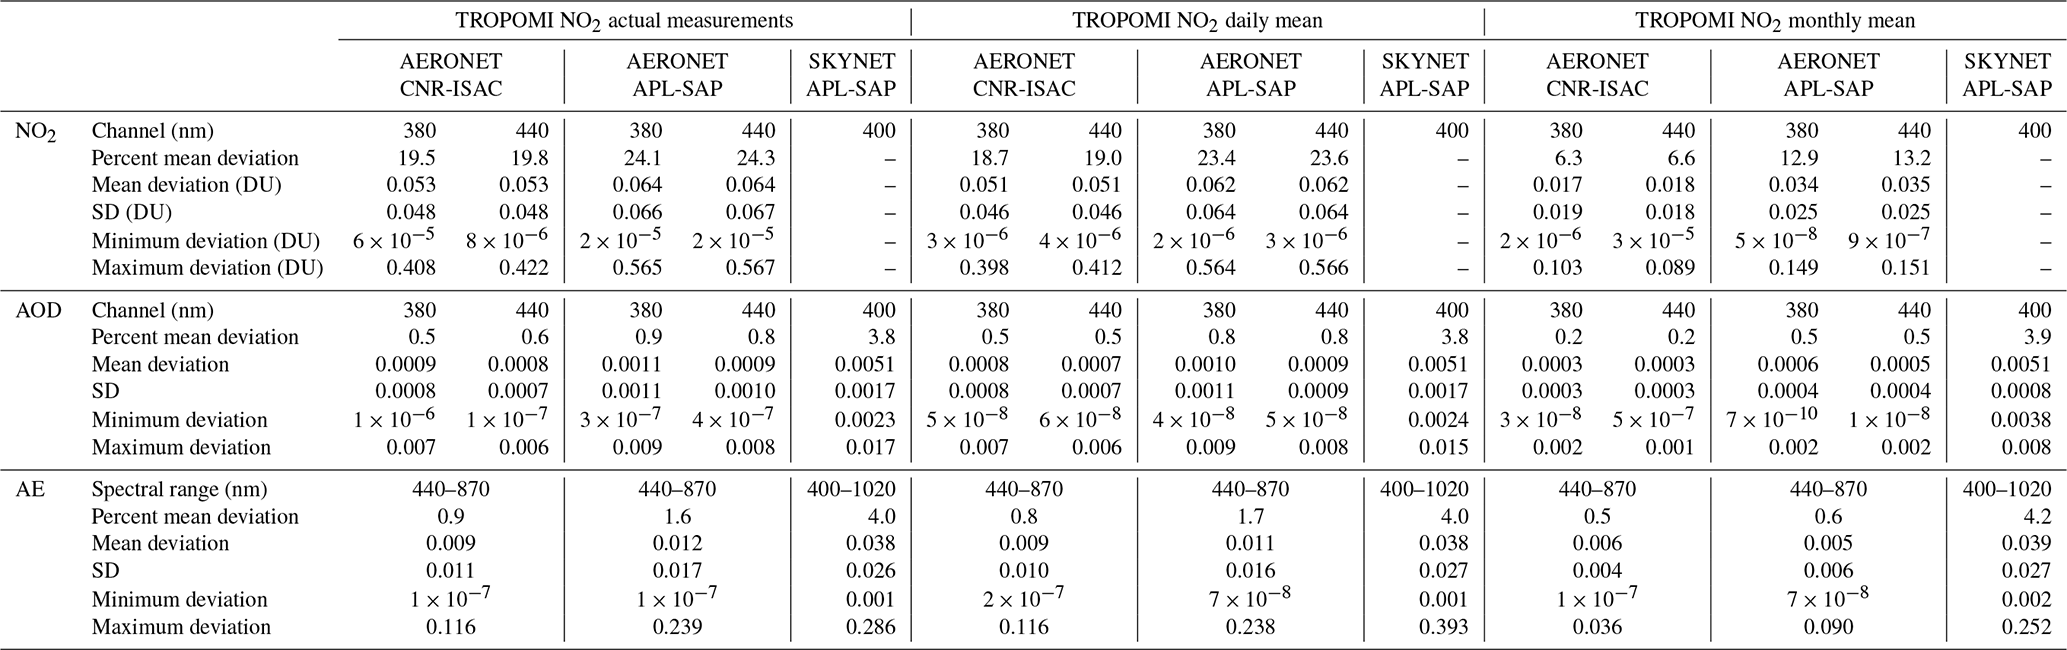
Table 1Deviation of Pandora total NO2 column from satellite climatology used for AERONET retrievals and differences in the modified AERONET and SKYNET AOD and AE from the standard products over CNR-ISAC and APL-SAP calculated using actual Pandora total NO2 observations, as well as daily and monthly averaged values of NO2. Note that the spectral channels used in AERONET retrievals are 380 and 440 nm for AOD and 440–870 nm for AE, whereas for SKYNET the wavelength channels are 400 and 400–1020 nm for AOD and AE, respectively.
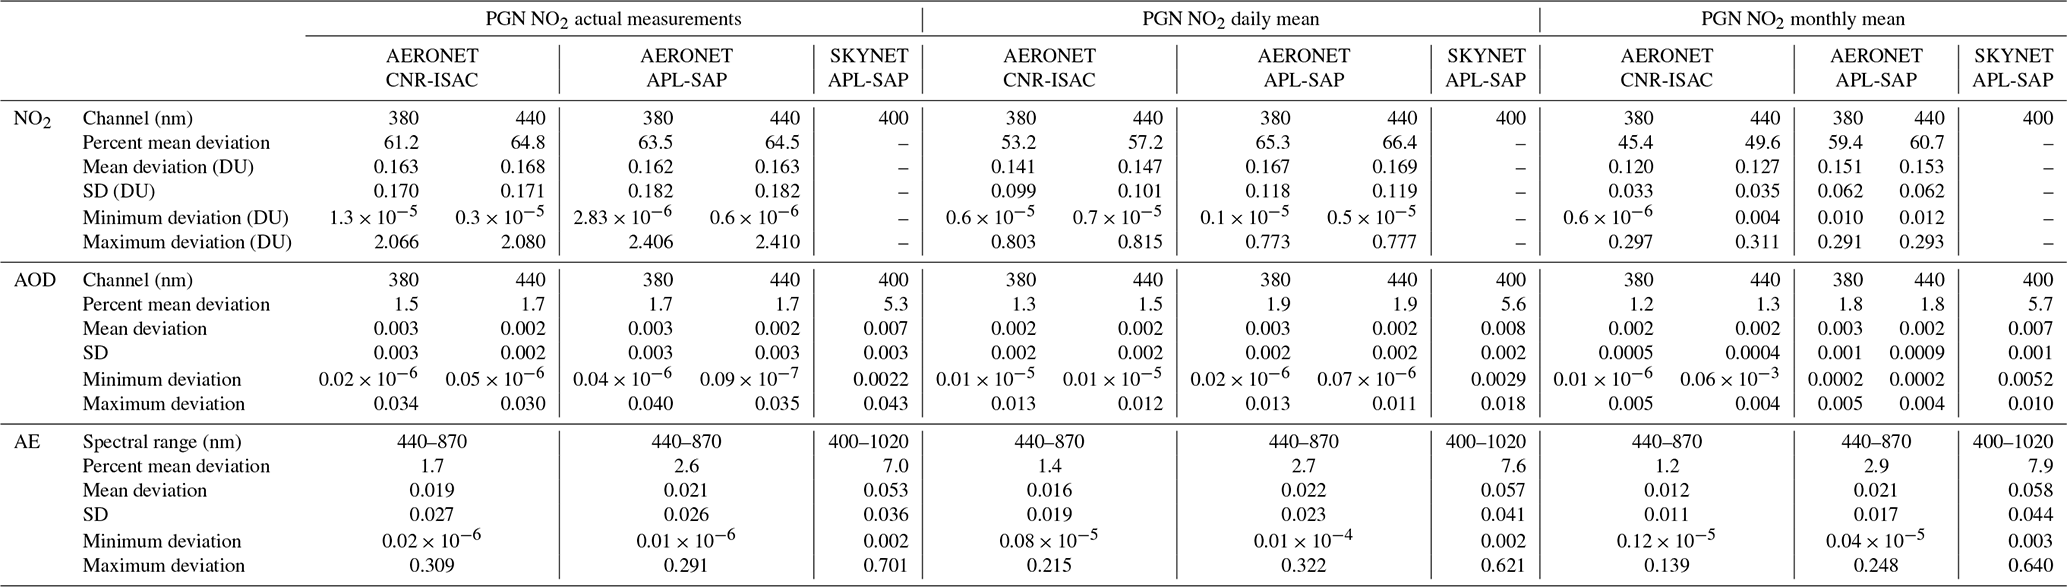
The statistics showing mean differences in AOD and AE AERONET and SKYNET retrievals using actual, coincident NO2 measurements are presented in Table 1. AERONET AOD retrievals at 380 nm are also included in the table. In addition, deviations of AOD and AE using daily or monthly averages of NO2 in AERONET and SKYNET observations are also investigated. Table 1 shows that the average deviations of AOD and AE values do not change significantly, regardless of whether the actual Pandora NO2 measurements or the daily or monthly mean values are used for the retrievals. The percentage differences for AOD lie within the range 1.2 %–1.9 % for AERONET, while they are more than doubled (5.3 %–5.7 %) for SKYNET. For the standard aerosol products of the latter, NO2 optical depth is not considered. The estimated percentage differences for AE are within 1.2 %–1.7 % and 2.6 %–2.9 % for AERONET CNR-ISAC and APL-SAP, respectively, and between 7 %–7.9 % for SKYNET APL-SAP. It should be noted that the spectral channels used in AERONET retrievals are 380 and 440 nm for AOD and 440–870 nm for AE, whereas SKYNET data refer to 400 and 400–1020 nm for AOD and AE, respectively.
3.2 AOD and AE retrievals based on TROPOMI NO2 data
Satellite sensors perform measurements globally and provide information on the air quality, even over regions that lack ground-based observations. However, as already mentioned for OMI in Sect. 2.3.1, the spatial resolution of the satellite retrievals is limited by the pixel size. Co-located S5P/TROPOMI observations, characterized by an improved spatial and temporal resolution compared to previous satellite missions (e.g., OMI), were also employed to investigate whether the ground-based retrievals of aerosol properties could be improved on a global scale. Again, the approach described in Sect. 2.4.1 and 2.4.2 was applied by replacing the Pandora total NO2 () with the corresponding columnar retrievals from TROPOMI. Based on the current satellite footprint (5.5 km × 3.5 km), a radius of 5 km around each ground-based station was selected for the spatial co-location. The TROPOMI NO2 data were time-interpolated to AERONET and SKYNET measurements. Despite the improved spatial resolution of TROPOMI, the NO2 corrections using TROPOMI data are expected to be less accurate than those performed with the Pandora product. For example, Lambert et al. (2021) showed a bias between TROPOMI and Pandora total NO2 column ranging from −23 % over polluted stations to +4.1 % over clean areas, with a median bias of −7.1 %, in the frame of the standard validation process of TROPOMI Level 2 NO2 products. Other studies have concluded similar results. For example, Zhao et al. (2020) showed a negative bias for the standard TROPOMI total NO2 product in the range 23 %–28 % over urban and suburban environments and a positive bias of 8 %–11 % at a rural site, while Park et al. (2022) showed 26 %–29 % negative bias and R2 within 0.73–0.76 over the Seoul metropolitan area in South Korea.
Table 2Similar to Table 1, here we are using TROPOMI measurements instead of Pandora total NO2 for the estimation of NO2 abundance in AERONET and SKYNET aerosol retrievals.
The statistical metrics of the averaged deviations of the modified AERONET and SKYNET AOD and AE retrievals using actual, co-located TROPOMI NO2 measurements from the network standard products are presented in Table 2. Similar to Sect. 3.1 and Table 1, the deviations of AOD and AE retrievals derived by employing daily or monthly mean TROPOMI total NO2 were also investigated. The average deviations of AOD and AE values do not change significantly, regardless of whether the actual TROPOMI NO2 measurements or the daily mean values are used for the retrievals. This behavior is expected, considering that TROPOMI overpasses occur once or twice per day, and hence, they do not capture daily variations in NO2. In the case of the monthly averaged TROPOMI NO2 data, the estimated differences between the standard and modified aerosol products drop notably for AERONET. However, there are still differences compared to OMI NO2 climatology due to the improved spatial resolution of the TROPOMI pixel. The average AOD bias is ∼ 0.001 ± 0.001 (with the higher values observed at 380 nm), while the average AE bias is ∼ 0.01 ± 0.01 for both AERONET stations. For the cases of high NO2 levels (> ∼ 0.7 DU), the mean AOD bias is ∼ 0.004 ± 0.001 at 440 nm and ∼ 0.005 ± 0.002 at 380 nm for APL-SAP and ∼ 0.003 ± 0.001 at both 440 and 380 nm for CNR-ISAC. The estimated mean bias of AE retrievals for the cases with high NO2 (> ∼ 0.7 DU) is ∼ 0.05 ± 0.04 and ∼ 0.02 ± 0.01 for APL-SAP and CNR-ISAC, respectively. In the case of SKYNET, the overall average AOD bias is ∼ 0.005 ± 0.002 for AOD and ∼ 0.04 ± 0.03 for AE. For the high NO2 cases, a mean AOD bias of about 0.011 ± 0.002 and an average AE bias of ∼ 0.07 ± 0.04 were calculated. Interestingly, the deviations of SKYNET retrievals using monthly TROPOMI data are very similar to those derived using the actual overpasses or daily averaged TROPOMI NO2, probably due to the fact that the NO2 optical depth is not included in the standard network AOD retrieval processes.
The percentage differences for AOD lie within the range 0.2 %–0.9 % for AERONET and are about 3.8 %–3.9 % for SKYNET, which are much lower compared to those derived using Pandora NO2 (see Table 1). The estimated percentage differences for AE are ∼ 0.8 %–0.9 % and ∼ 1.6 %–1.7 % for AERONET CNR-ISAC and APL-SAP, respectively, and about 4 % for SKYNET APL-SAP using actual or daily TROPOMI data. It should be noted again that the spectral channels used in AERONET retrievals are 380 and 440 nm for AOD and 440–870 nm for AE, whereas SKYNET data refer to 400 and 400–1020 nm for AOD and AE, respectively.
3.3 Case study: impact of high Pandora NO2 on low AOD
In order to investigate further the impact of high NO2 during pollution events on the retrieval of relatively low levels of AOD, we used measurements performed at APL-SAP on 25 June 2020, the morning of which there was a high NO2 event. In the upper panels of Fig. 8, the total NO2 measured from Pandora during that day is illustrated. For AERONET (left panels of Fig. 8), the satellite climatological values used in the retrieval of standard AOD product and their deviations from Pandora NO2 are also displayed. The standard and NO2-modified AOD and AE data from both AERONET and SKYNET (see also Sect. 2.4.1 and 2.4.2), in addition to the magnitude of the respective differences (Δτ and Δα), are presented in the middle and lower panels of Fig. 8.
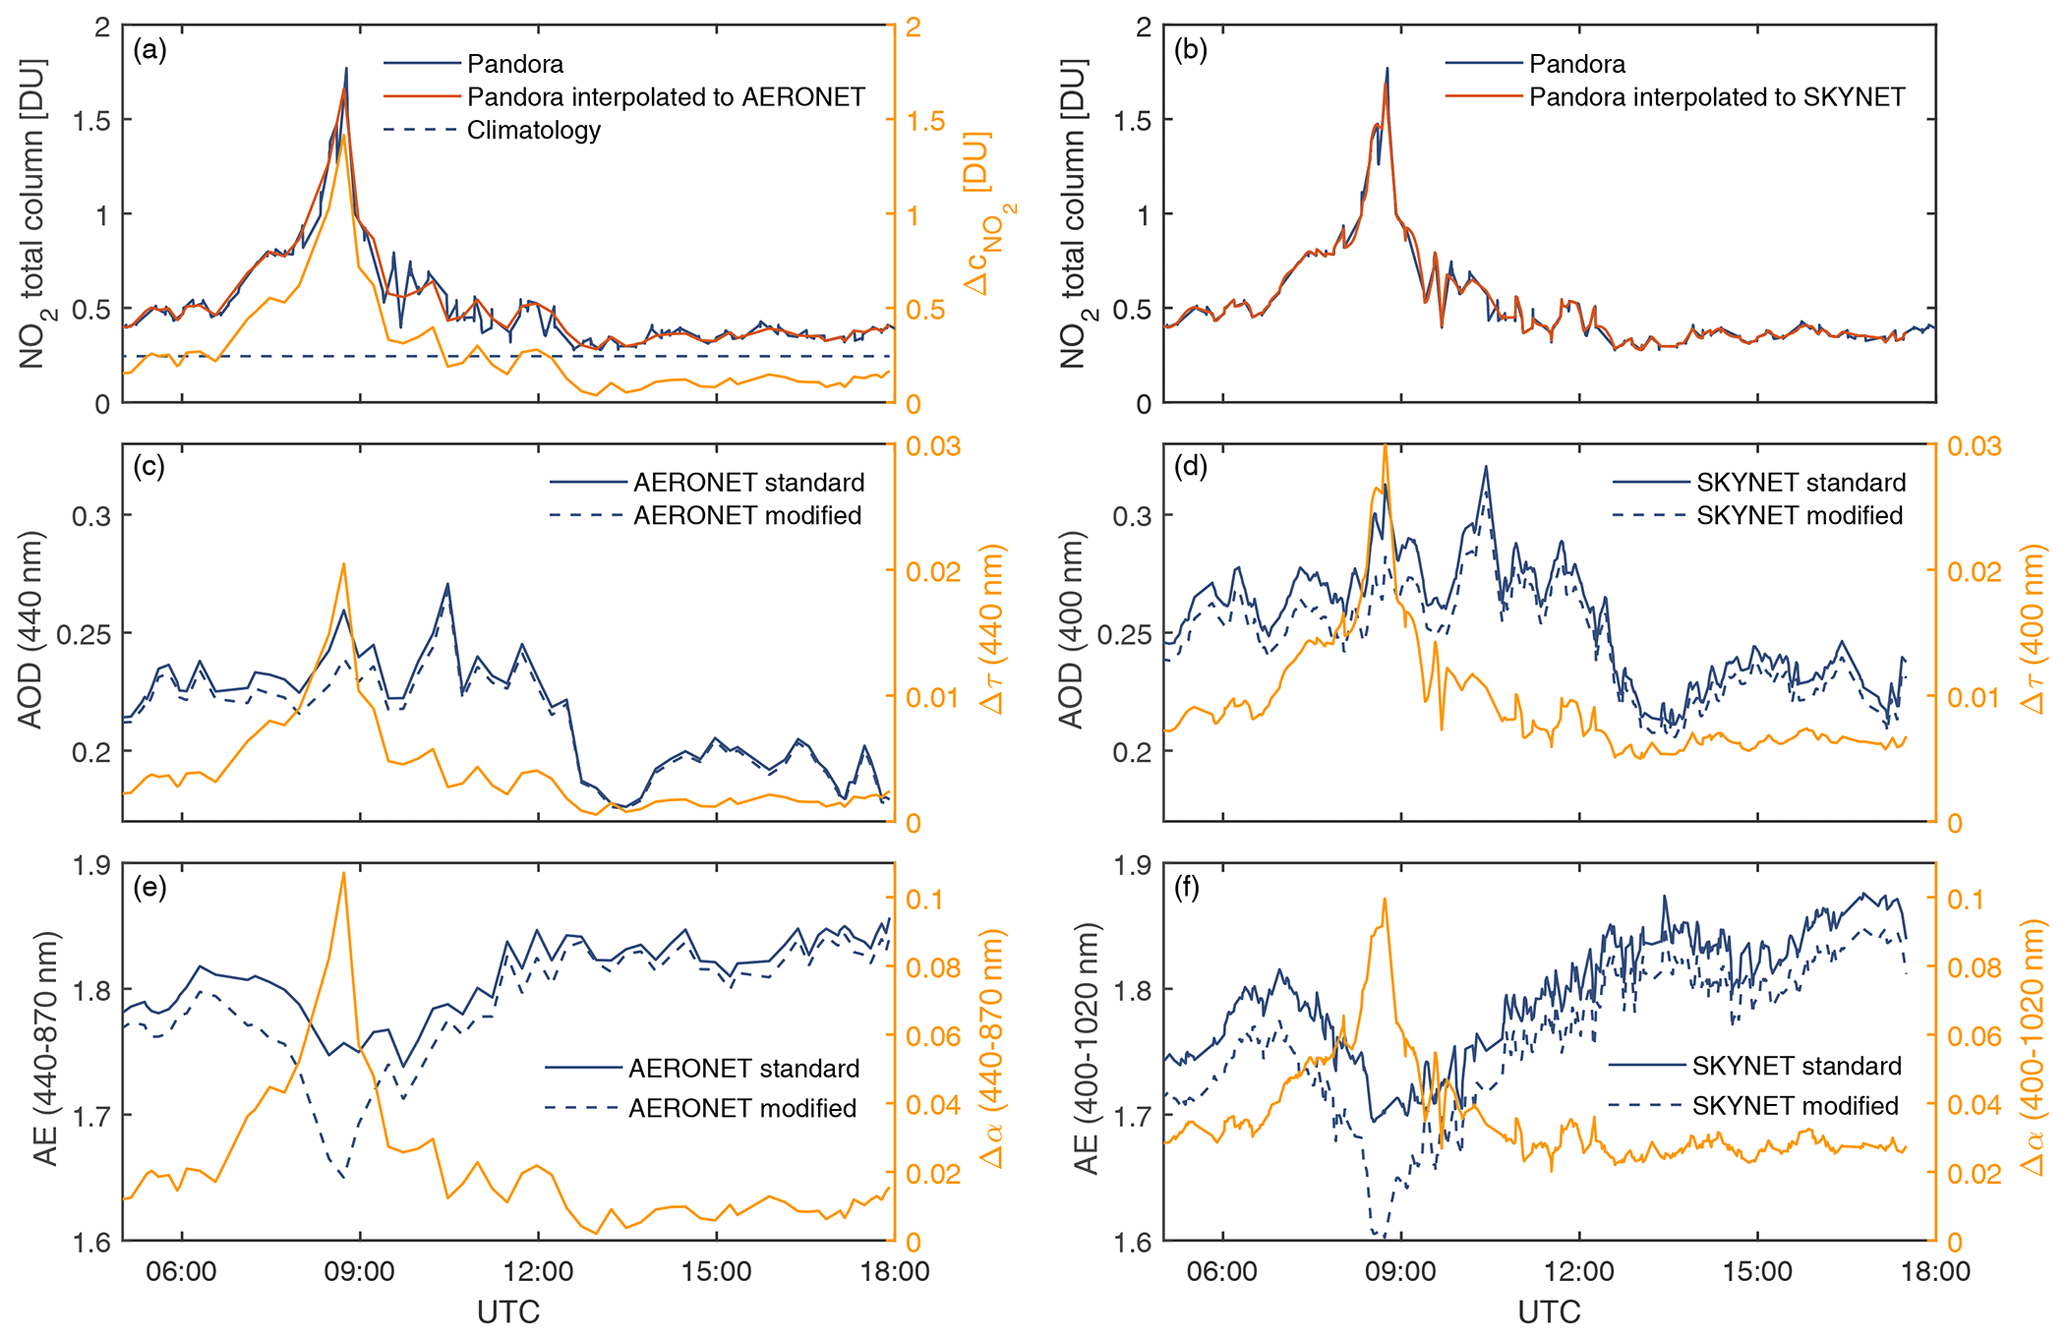
Figure 8Case study over APL-SAP on 25 June 2020 for both AERONET and SKYNET. (a, b) Pandora total NO2 column and its deviation from climatology. (c, d) AOD (solid blue line), its improvement using Pandora NO2 (dashed blue line), and the magnitude of improvement (light orange line and right y axis). (e, f) Similar to panels (c) and (d) but for AE retrievals. Note that the spectral channels for the retrievals are different for the two networks.
The differences in the AOD and AE retrievals from both networks are significant only within a time span of about 3 h around the high NO2 event (∼ 07:00–10:00 UT) and can be assumed to be negligible for the rest of the day when the NO2 levels remain quite low. The median AOD bias for AERONET is about 0.003, with a maximum of about 0.02 at the peak of the event. The median and maximum AE biases are 0.014 and 0.11, respectively. It can be also noted that, in the case of SKYNET, both AOD (median value of ∼ 0.008 with a maximum of ∼ 0.03) and AE deviations (median and maximum values of ∼ 0.03 and 0.10, respectively) are a bit higher compared to the respective AERONET deviations of synchronous data. This can be mainly attributed to the fact that SKYNET standard AOD retrieval processes do not account for the NO2 absorption and can be partly explained by the different channels used in the detectors of the two networks.
3.4 Impact on AOD and AE trends
In this section, a first attempt is made to investigate the effect of the modified AOD and AE retrievals based on the Pandora total NO2 observations on the annual trends of those aerosol properties. The annual trends of AERONET/SKYNET AOD and AE over both APL-SAP and CNR-ISAC sites, calculated by applying the approach described in Sect. 2.5, and their uncertainties (standard errors in the regression slope) are presented in Table 3.
Table 3AOD and AE trends and their uncertainties for both standard and modified AERONET and SKYNET products over CNR-ISAC and APL-SAP. Note that the spectral channels used in AERONET retrievals are 440 nm for AOD and 440–870 nm for AE, whereas those for SKYNET are 400 and 400–1020 nm for AOD and AE, respectively. The trend uncertainties refer to the standard error in the regression slope. The differences are calculated on the absolute trend values.
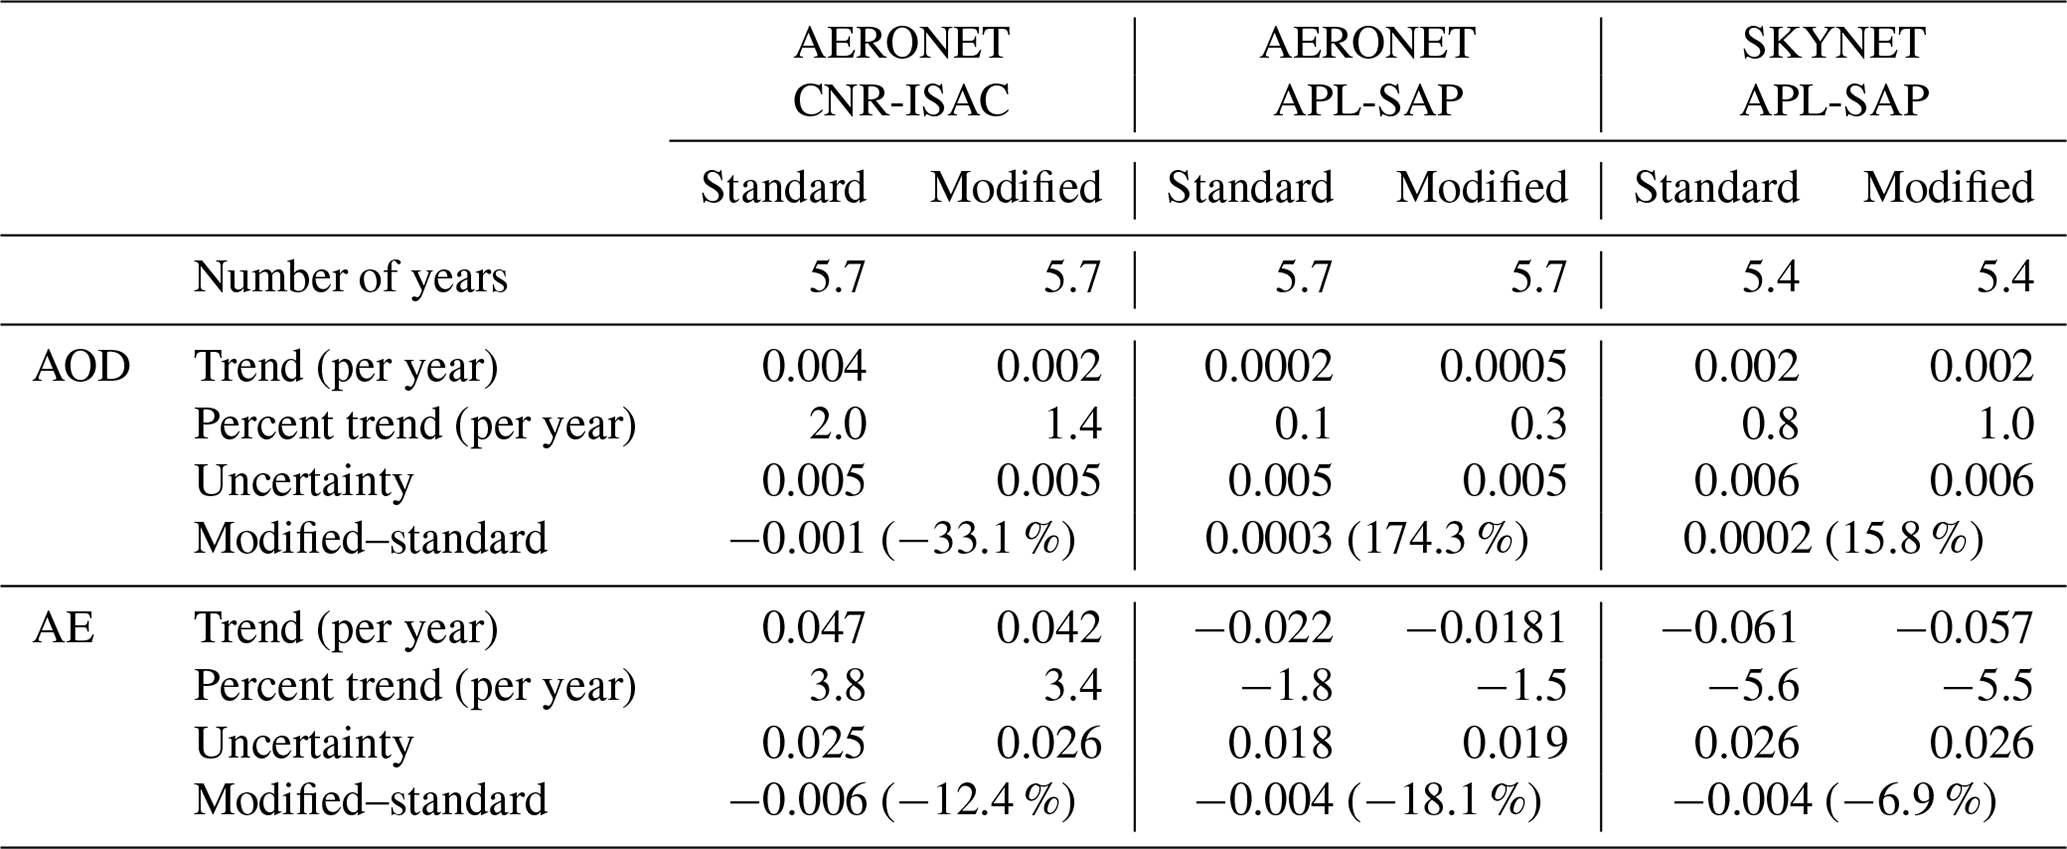
It should be noted here that the aerosol data sets from the two networks correspond to slightly different time periods. In addition, there are significant gaps in the time series from CNR-ISAC due to instrument problems, and the COVID-19 lockdown period (February–May 2020) has been excluded from the data analysis. Therefore, the results in Table 3 are mainly intended to highlight how a different NO2 correction may affect the aerosol trends and should be interpreted separately for each individual site. Interpretation of the trend significance for the Rome area is not possible using only this short period of time (∼ 5.5 years), considering that the estimated trends are quite small and the uncertainties introduced by linear regression are relatively high.
One aspect shown here is that the difference in the AOD and AE trends for the two data sets (original and modified NO2) is comparable with the calculated trends. As expected, AE trends with and without NO2 correction show relatively higher differences, as AE is much more sensitive to spectral AOD changes. However, the linear fitting uncertainty of AE is also high. NO2 effects on AOD trends would be more obvious in the case of a significant NO2 trend during a certain period. A thorough long-term trend analysis is out of the scope of this work and could be the topic for a future study.
3.5 Impact on the intercomparison of ground-based and satellite AOD data
In this section, we have analyzed a potential effect of considered NO2 corrections on the agreement of AERONET and SKYNET AOD products with relevant satellite data. Indeed, it is well known that most satellite retrievals are validated against ground-based measurements of AOD that are considered to be a ground truth. Moreover, most satellite retrieval algorithms are substantially tuned to closely match AERONET observations. For example, all MODIS algorithms, including DB, rely, in one way or another, on AERONET dynamic aerosol models and climatologies of AERONET retrievals. Nonetheless, since MODIS retrievals fundamentally rely on MODIS radiances that are fully independent of AERONET data, some inaccuracies in the assumptions, such as those regarding the NO2 amount, can cause some additional biases between AERONET and MODIS AOD results.
To evaluate the effects of the proposed correction, we have compared AERONET and SKYNET AOD products against MODIS DB AOD products at 470 nm for the 2017–2022 period. In the intercomparison, we considered only MODIS DB AOD products for which the distance between the center of the pixel and the AERONET site location (APL-SAP or CNR-ISAC) does not exceed 5 km. Furthermore, we considered all the AERONET (or SKYNET) AOD data within ±30 min from the MODIS satellite overpasses. In order to guarantee the quality of the data, we used MODIS DB AOD with a QA index ≥ 2, which corresponds to good and very good products (Wei et al., 2019).
The intercomparison has been performed using MODIS DB AOD at 470 nm. Consequently, we computed the AERONET and SKYNET AOD at 470 nm, thus exploiting the AE. The AERONET AOD at 470 nm was calculated using the standard AERONET AOD at 440 nm and AE at 440–870 nm. Similarly, the SKYNET AOD at 470 nm was computed using the standard SKYNET AOD at 400 nm and AE at 400–1020 nm. The NO2-modified AERONET and SKYNET AOD values at 470 nm were also computed with the same approach, and the AOD and AE retrievals have been modified using the Pandora NO2 data.
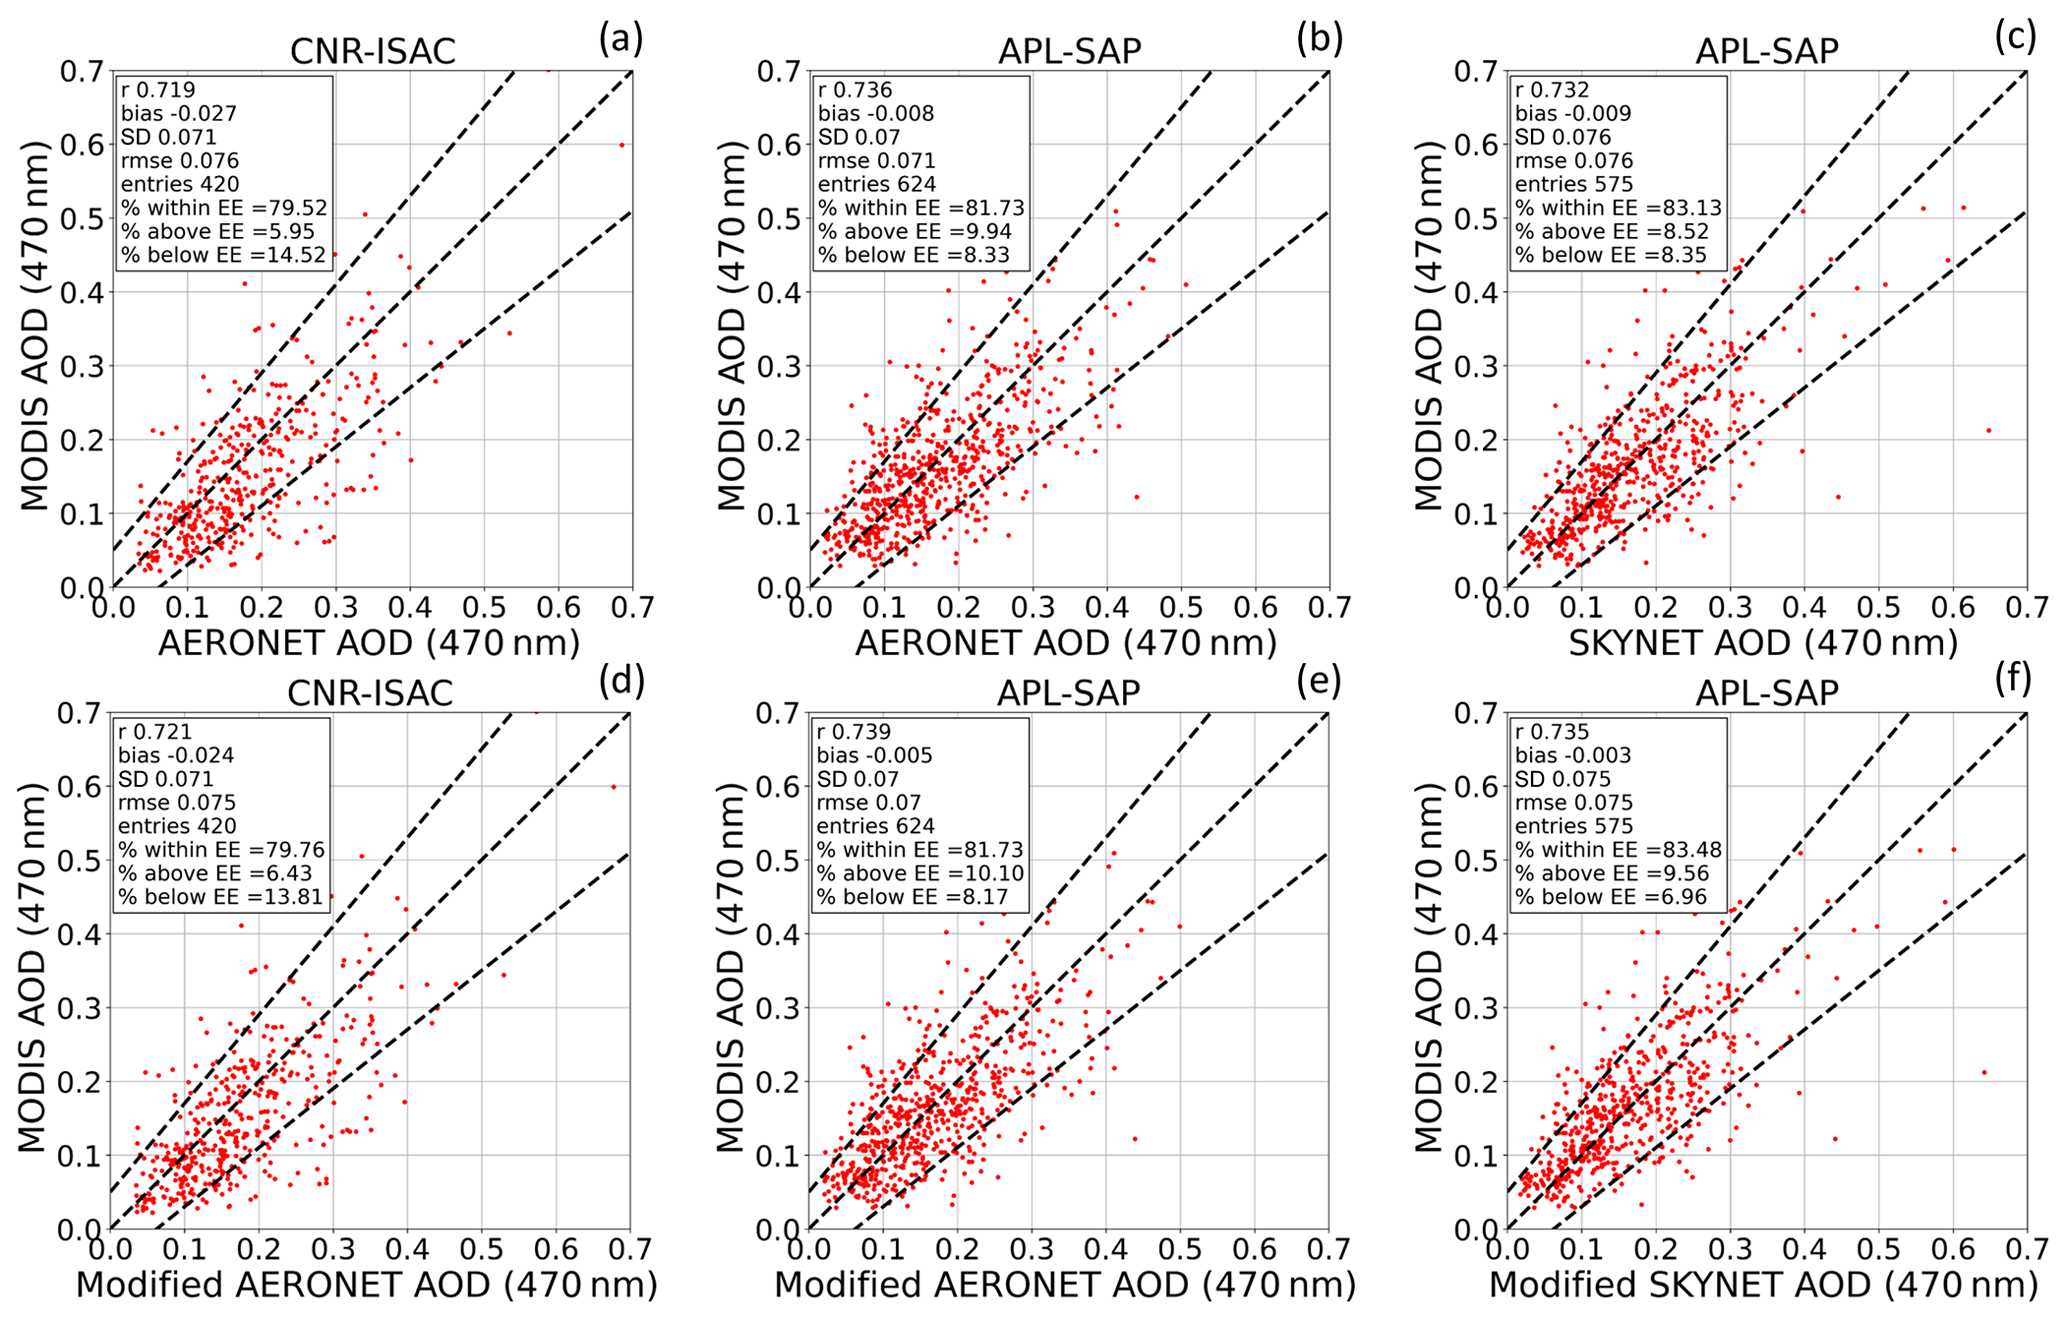
Figure 9Intercomparison of MODIS DB with standard (a–c) and modified (d–f) ground-based AOD at 470 nm for both CNR-ISAC (a, d) and APL-SAP (b, c, e, f) sites against AERONET AOD (a, b, d, e) and SKYNET AOD (c, f). The y = x lines and MODIS DB EE envelopes ±(0.05 + 20 %) are plotted as dashed lines. The intercomparison was performed considering a maximum distance between the center of the MODIS DB pixel and the site location of 5 km and Δtmax (time between MODIS and AERONET/SKYNET observations) of ±30 min.
We observe a generally satisfactory agreement between the ground-based (both AERONET and SKYNET) and MODIS DB AOD data, with a Pearson correlation (r) higher than 0.7. In general, MODIS DB AOD slightly overestimates the AOD observed by the sun photometers. The bias (calculated as satellite minus sun photometer AOD) between MODIS DB and the different ground-based data sets before the correction (upper panels of Fig. 9) varies from −0.009 for SKYNET APL-SAP data (−0.008, considering AERONET) to 0.027 for AERONET CNR-ISAC. AERONET data, available for both sites, highlight a lower agreement for the CNR-ISAC site, with a bias about 3 times larger with respect to the APL-SAP site. The correction introduces a slight change of about 0.003 in the agreement between MODIS DB and AERONET AOD products and of 0.006 between MODIS and SKYNET data (lower panels of Fig. 9). Figure 9 also shows an improvement in the percentage of MODIS AOD data falling within the expected error (EE) of ±(0.05 + 20 %; Hsu et al., 2013) for APL-SAP by adopting the correction for both AERONET and SKYNET.
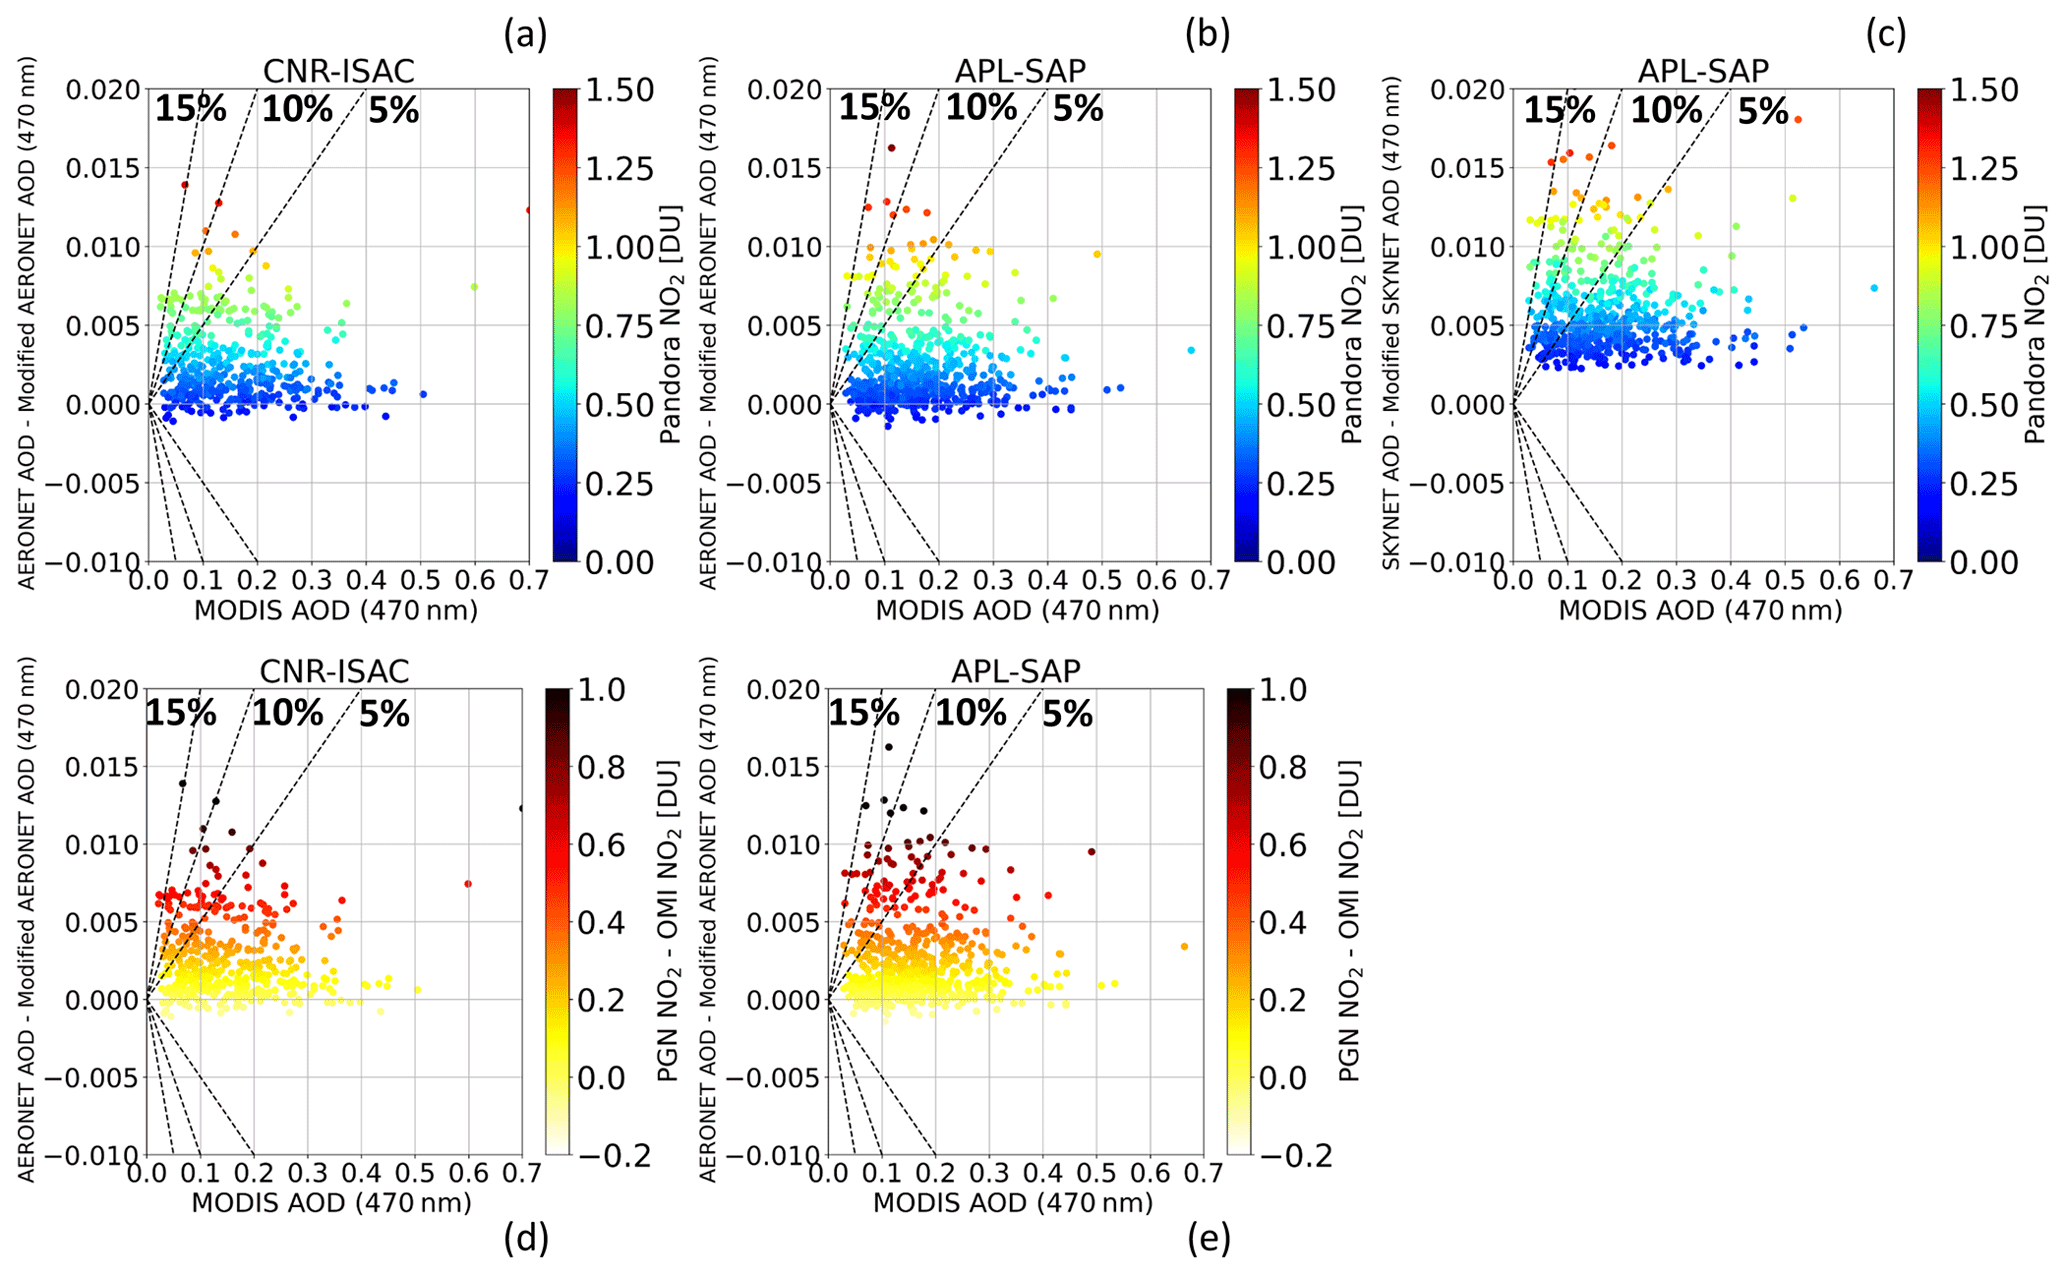
Figure 10(a–c) Absolute correction as a function of the corresponding MODIS DB AOD data and PGN NO2 data (color scale) for both CNR-ISAC and APL-SAP sites using AERONET and SKYNET AOD. The analysis was performed considering a maximum distance between the center of the MODIS DB pixel and the site location of 5 km and Δt_max of ±30 min. (d, e) Absolute correction of the MODIS DB AOD data for both CNR-ISAC and APL-SAP, using AERONET AOD as a function of the corresponding MODIS DB AOD data and the absolute difference between PGN and OMI climatological NO2 (color scale).
In Fig. 10, we show the absolute correction (computed as the difference between original AERONET/SKYNET AOD data at 470 nm and modified ones) as a function of the MODIS DB AOD and the NO2 column retrieved by the Pandora instruments located at APL-SAP and CNR-ISAC sites (upper panels). As already highlighted, we observe that the correction only depends on the NO2 amount and not on the AOD. Figure 10 also highlights that, although the improvement is relatively low on average, the correction can be larger than 10 %/15 % in many cases.
This intercomparison exercise demonstrated that the proposed correction slightly improves the agreement between MODIS DB AOD data and AERONET and SKYNET AOD products, even if, on average, it is not statistically significant. Nevertheless, as shown in Fig. 10, the improvement becomes significant when the differences between the NO2 values observed by Pandora and the OMI NO2 climatology are also significant (lower panels in Fig. 10). Furthermore, since the proposed correction depends on the amount of NO2, the improvement is more evident in the correspondence of high values of NO2 (upper panels in Fig. 10), typical of highly polluted areas such as the urban area of Rome (APL-SAP). Also, a slight improvement is also achieved in the suburban area of Rome (CNR-ISAC). Finally, in the case of SKYNET AOD products, the systematic overestimation, due to neglected NO2 extinction in the official retrieval chain, is eliminated.
3.6 Impact on SSA
One of the main impacts of accurate characterization of the columnar NO2 concentration is certainly expected on the retrieved values of SSA in spectral ranges coinciding with NO2 absorption. In order to quantify this effect, the sensitivity of the AERONET retrieval of SSA at 440 nm has been tested. As previously explained (Sect. 2.6), two different GRASP approaches have been applied to this purpose, namely the GRASP/AERONET NO2 and the GRASP/Pandora NO2. Despite the close methodological basis between GRASP and AERONET retrievals, the divergence in the development of both algorithms has led to some differences in the retrieved products. Thus, in order to ensure that the difference in the retrieved SSA at 440 nm is produced exclusively by the changes in the description of NO2 absorption and to avoid the inclusion of any other sources of discrepancy, the GRASP code has been used in both approaches instead of the standard AERONET SSA product.
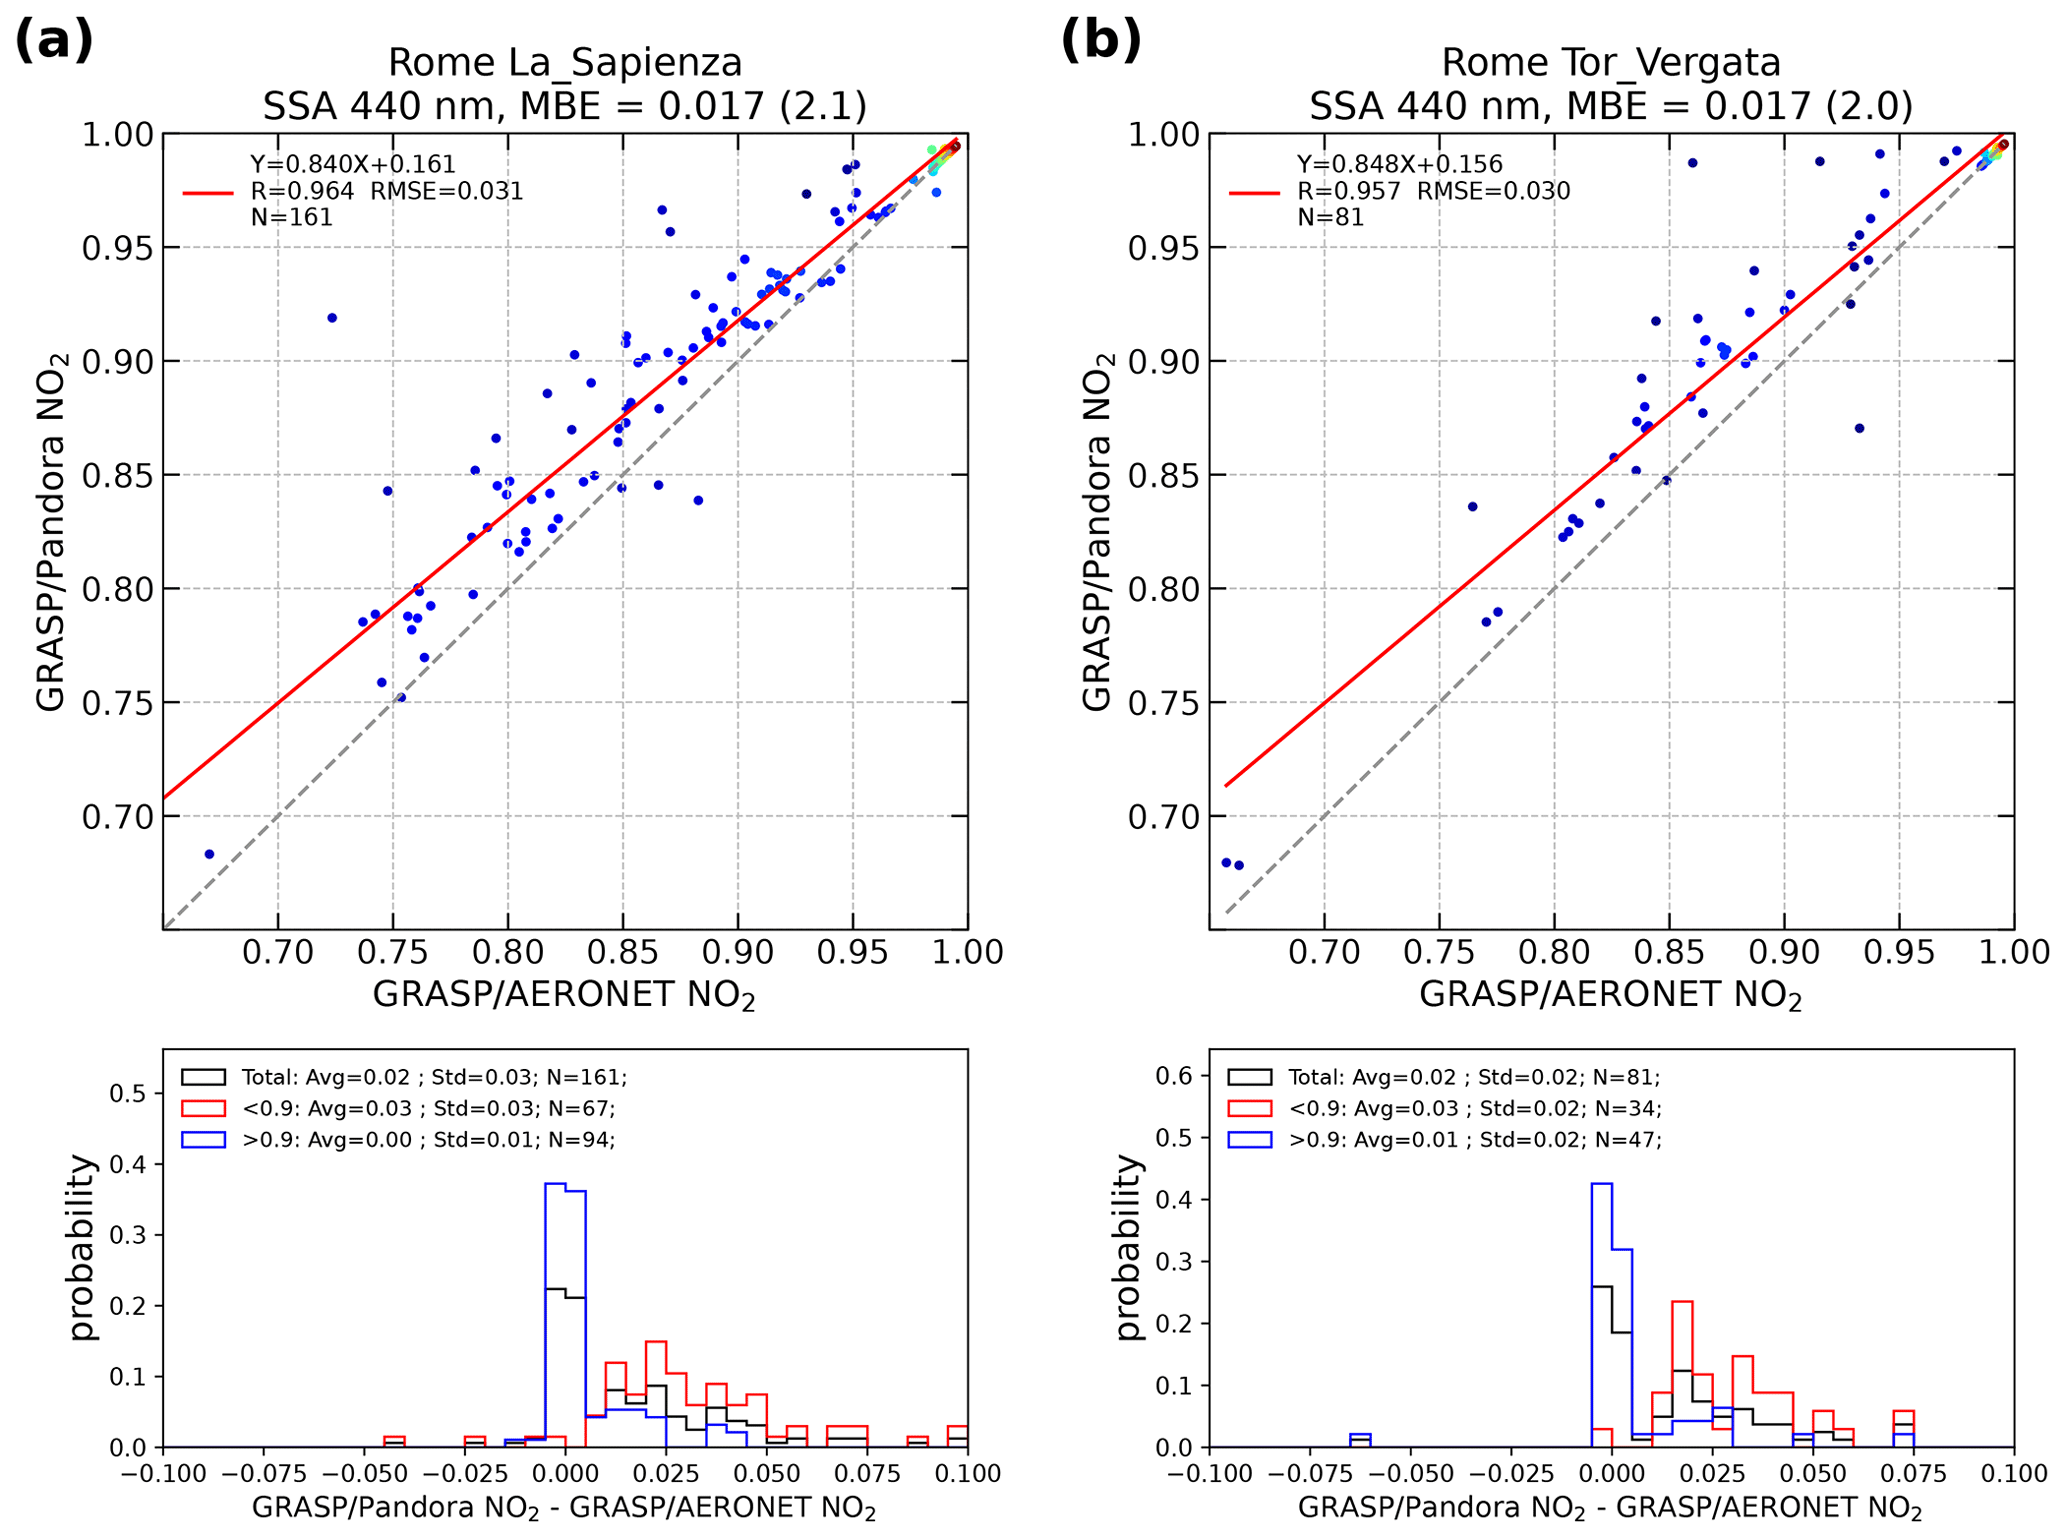
Figure 11Comparisons of SSA at 440 nm obtained with GRASP, following the standard AERONET procedure (x axis), and a similar approach but precisely accounting for NO2 concentration (y axis) from the co-located Pandora instruments in two different stations, namely APL-SAP (a) from March 2017 to November 2020 and CNR-ISAC (b) from April 2017 to September 2021. The data have been filtered to show retrievals corresponding to NO2 concentration higher than 0.7 DU. The color of the circles is an indicator of the density of points; i.e., colors closer to red indicate a higher number of points close together. The absolute mean bias error (MBE; percent in parentheses), the root mean square error (RMSE) and the correlation coefficient of the linear fit are also shown in the figure. The probability density functions of the difference between both methodologies (GRASP/Pandora NO2–GRASP/AERONET NO2) can be found in the lower panels, correspondingly, for each station. The probability density functions for SSA values higher or lower than 0.9 are also included.
The comparisons of the SSA at 440 nm obtained with both methodologies for the two stations for the complete data set (not shown) do not show a clear influence of the change in the NO2 concentration. High correlations (R > 0.98) and a mean bias error (MBE < 0.002) very close to zero are obtained. The mean NO2 column concentration for the retrievals presented here is 0.4 DU. Thus, in general, the analyzed improvements are not expected to produce an important change in the retrieved parameters at 440 nm in conditions with relatively low NO2 absorption. However, in the cases where NO2 concentration is elevated compared to the climatologically expected range, significant changes in the SSA at 440 nm retrievals can be appreciated. Figure 11 shows the comparisons of the SSA at 440 nm obtained with GRASP, following an AERONET-like approach (x axis) and the approach with the new NO2 concentrations provided by Pandora (y axis) and filtered for NO2 concentrations higher than 0.7 DU, which corresponds to the average NO2 plus 2 times the standard deviation. The two stations are correspondingly represented in the left and right panels. As it can be noted, for both stations in conditions of high NO2 concentrations, there is a consistent positive bias of ∼ 0.02 (∼ 2 %). However, a high correlation (R > 0.96) and root mean square errors (RMSE < 0.03) are also observed. Previous studies found SSA retrieval uncertainties in the range of 0.02–0.03 (Eck et al., 2003; Corr et al., 2009; Jethva et al., 2014; Kazadzis et al., 2016), whereas the correction, when high NO2 is recorded, is usually higher. Thus, it is clear that in conditions of high NO2 concentrations an accurate characterization of this gas is necessary in order to avoid noticeable bias in the affected AERONET channel around 440 nm.
The retrievals of aerosol properties from sun photometers may be affected by NO2 absorption in the observed spectral range, and thus, accurate assumptions on NO2 concentrations are highly desirable. Currently, some ground-based aerosol networks, such as SKYNET, do not take NO2 optical depth into consideration in AOD retrieval processes, while others (e.g., AERONET) use satellite-based NO2 climatology for estimating it. However, significant errors could be introduced in the AOD retrievals, especially over urban areas, where NO2 variability can be high and also the occurrence of high NO2 events is more frequent. Such errors may occur only in the cases where NO2 is not taken into account or the used NO2 climatology underestimates such high NO2 events.
Actual co-located surface-based NO2 measurements (e.g., from Pandora instruments) or spaceborne observations with improved spatial and temporal resolution (e.g., S5P/TROPOMI) may be helpful for reducing the uncertainty in the NO2 optical depth contribution in later versions of the AOD retrieval algorithms. In this study, we evaluated the possible improvements of AOD and AE retrievals by applying a specific correction using synchronous and co-located measurements of the total NO2 column from Pandora spectroradiometers and the TROPOMI satellite sensor. For this purpose, we used multiannual (2017–2022) observations from both AERONET and SKYNET multispectral AOD observations co-located with Pandora instruments and collected over two locations in Rome (Italy) with different anthropic pressure (one in the city center and the other in a suburban area).
The deviations of the NO2-modified AOD retrievals from the network standard products were investigated. AERONET-used NO2 climatology was found to systematically underestimate Pandora-measured NO2 over both sites. The impact of the correction is higher in the case of SKYNET, since the NO2 optical depth is not considered at all in the standard retrieval processes of that network. At the same time, the observed differences in the results between the two networks can also be partly explained by the different channels used for the retrievals. For both AERONET and SKYNET, a low but systematic AOD overestimation was found. Although in most of the cases the differences are lower than 0.01 for AOD and lower than 0.1 for AE retrievals, the correction can still be useful for lower AODs (< 0.3) where the majority of observations are found, especially under high NO2 pollution events. The mean AOD bias derived for the high NO2 cases (> ∼ 0.7 DU) is ∼ 0.011 ± 0.003 at 440 nm and ∼ 0.012 ± 0.003 at 380 nm for AERONET APL-SAP and ∼ 0.009 ± 0.003 at 440 nm and ∼ 0.010 ± 0.003 at 380 nm for AERONET CNR-ISAC. The mean AE bias for the high NO2 is ∼ 0.08 ± 0.04 for both Rome AERONET sites. In the case of SKYNET, the mean bias for the cases with high NO2 levels (> ∼ 0.7 DU) is ∼ 0.018 ± 0.003 and ∼ 0.10 ± 0.05 for AOD and AE, respectively. Overall, the average biases in AOD retrievals are systematic but within the reported AOD uncertainties. However, they are important enough to be reported here, as AOD retrieval uncertainties not linked with instrument calibration (e.g., Rayleigh, ozone, and NO2-related optical depths) are considered to have an upper limit of 0.005 as a goal for sun photometers, according to WMO (2005). As expected, the effect of improved NO2 assumption in the retrievals is more evident in both AOD and AE when the actual synchronous ground-based Pandora NO2 measurements are employed, compared to the situations when the used correction was based on daily or monthly averaged Pandora data or TROPOMI NO2 retrievals. The use of TROPOMI NO2 data is a demonstration of the possibility for corrections on a global scale. However, the underestimation of NO2 concentrations by TROPOMI compared to Pandora NO2 data for Rome leads to lower AOD corrections.
In addition, a first attempt to evaluate the impact of those corrections on AOD and AE annual trends was conducted. However, the aerosol data sets employed in this trend analysis are quite short for a robust trend analysis. Here only quantitative comparisons are performed for each individual data set, i.e., corresponding to specific instrument and site, before and after the NO2-based correction. Although the effect of NO2 on the derived trends seems to be insignificant, and the linear fit trend calculations introduce uncertainties similar to or higher than the NO2 effects on AOD, the more pronounced impact may be expected for trends derived from larger data sets and in the case of a significant NO2 trend.
We also investigated the possible effects of the proposed NO2 optical depth correction on the agreement between ground-based and spaceborne AOD retrievals. In particular, we compared MODIS DB AOD retrievals at 470 nm with AERONET and SKYNET AOD products. In general, the agreement between ground-based (both AERONET and SKYNET) and MODIS DB AOD is quite good, revealing a correlation coefficient (r) higher than 0.7. The use of Pandora NO2 in the sun photometer retrievals introduces a slight improvement in the absolute values of ∼ 0.003 in the agreement between MODIS DB and AERONET AOD and an improvement of ∼ 0.006 between MODIS and SKYNET observations. Although the impact on the comparisons between spaceborne and ground-based observations of AOD is quite small, it can be quite useful for eliminating or decreasing possible biases in the intercomparisons of satellite and ground-based data in situations with NO2 concentrations typical of highly polluted areas.
Finally, we investigated the impact of using a precise characterization of the total NO2 concentration on the SSA retrieval at 440 nm from AERONET measurements. For this, the GRASP algorithm was used to evaluate the effect of NO2 correction on AERONET aerosol retrievals obtained by inverting TOD and almucantar radiances at 440, 675, 870, and 1020 nm. GRASP aerosol retrieval, using the actual total NO2 concentration provided by the co-located Pandora over both stations selected for this study, were compared with GRASP retrievals mimicking AERONET operational retrievals. The results showed that, in general, the effect in the retrieved parameters at 440 nm under low NO2 absorption conditions was not significant. At the same time, for the cases with high NO2 loadings (> 0.7 DU), important changes in the retrieved SSA were observed, with an average positive bias of 0.02 (2 %) for both locations.
In general, the effect of NO2 absorption can be relatively important in the retrievals of aerosol properties, especially AE, AOD, and SSA at 440 and 380 nm, when NO2 is not included in the retrieval algorithms or in cases where NO2 absorption is significantly higher than the NO2 climatology used. If NO2 absorption is taken from climatological data, then the accuracy of such approach may not be sufficient at locations where NO2 has high diurnal variability during high NO2 concentration episodes that cannot be captured by the satellite climatology. In such situations, the use of accurate co-located NO2 observations, e.g., by Pandora instruments, is highly desirable. Thus, based on the results of this study, the effect of NO2 correction could be considered relatively small for a large fraction of the observations; nonetheless, the correction has certainly contributed towards lowering the uncertainty in AOD and, especially, aerosol SSA provided by sun photometers.
In future studies, the effect of NO2 correction on the absorption Ångström exponent (AAE) could be explored. AAE is an aerosol optical property that describes the absorption variation with respect to wavelength and is significantly influenced by particle size, shape, and chemical composition used for aerosol characterization and apportionment studies (e.g., Schuster et al., 2006). Since AAE is a function of spectral AOD and SSA, the NO2 correction for certain AOD wavelengths and SSAs, shown in this study, is expected to impact the AAE calculations towards lower values (as the NO2-corrected AOD is systematically lower, and the corrected SSA is higher).
Finally, the improved technology including real-time NO2 monitoring (e.g., the Pandonia network), real-time satellite-based products at high spatial resolution (e.g., TROPOMI), and the more precise NO2 products foreseen (e.g., from Sentinel 4) tend to positively contribute towards improving retrieved aerosol properties in the spectral range (∼ 380–440 nm) affected by NO2 absorption.
The AOD and AE products from the Cimel sun photometer measurements in addition to the NO2 optical depth used in the retrievals are available from the AERONET data server (https://aeronet.gsfc.nasa.gov/cgi-bin/webtool_aod_v3, AERONET, 2023). The SKYNET AOD and AE data sets were downloaded from the international SKYNET data center (https://www.skynet-isdc.org/data.php, SKYNET, 2023). The Pandora total NO2 columns are available from the Pandonia Global Network website (http://data.pandonia-global-network.org/, PGN, 2023). The S5P/TROPOMI NO2 products were obtained from the Sentinel-5P Pre-Operations Data Hub of the Copernicus Open Access Hub (https://doi.org/10.5270/S5P-9bnp8q8, ESA, 2021). The collection 6.1 MODIS DB products are available from the Level-1 and Atmosphere Archive and Distribution System Distributed Active Archive Center (MODIS/Terra: https://doi.org/10.5067/MODIS/MOD04_L2.061, Levy et al., 2017a; MODIS/Aqua: https://doi.org/10.5067/MODIS/MYD04_L2.061, Levy et al., 2017b). The SSA retrievals from the Cimel almucantar measurements can be accessed by contacting the corresponding author.
The paper was prepared by TD, IPR, and MV. TD and IPR developed and implemented the correction algorithm for AOD and AE retrievals and conducted the trend analysis. MV and SC conducted the intercomparison of ground-based AOD with MODIS DB products and performed the S5P/TROPOMI data extraction and visualization. MHG and AL developed the SSA retrieval algorithm and conducted the analysis on SSA results. SC, FB, and MC supervised the maintenance and operation of ground-based instruments in addition to the acquisition and curation of the respective data sets. OD contributed in the discussions on the SSA analysis and the intercomparisons with MODIS DB. IPR, SK, GB, and FN supervised the investigation and contributed towards methodological ideas and their presentation. All authors reviewed and edited the paper.
At least one of the (co-)authors is a member of the editorial board of Atmospheric Measurement Techniques. The peer-review process was guided by an independent editor, and the authors also have no other competing interests to declare.
Publisher’s note: Copernicus Publications remains neutral with regard to jurisdictional claims in published maps and institutional affiliations.
Oleg Dubovik and Stelios Kazadzis acknowledge the European Metrology Program for Innovation and Research (EMPIR) within the joint research project EMPIR MAPP of “Metrology for aerosol optical properties”. The EMPIR is jointly funded by the EMPIR participating countries within EURAMET and the European Union. Stelios Kazadzis would like to acknowledge the ACTRIS Switzerland project funded by the Swiss State Secretariat for Education Research and Innovation.
This research has been mainly supported by the European Space Agency (ESA) in the frame of the Instrument Data quality Evaluation and Assessment Service – Quality Assurance for Earth Observation (IDEAS-QA4EO) project (contract no. QA4EO/SER/SUB/09; TPZ PO no. 600006842-PMOD/WRC). It has also been partly supported by the European Metrology Programme for Innovation and Research (EMPIR) within the joint research project EMPIR MAPP of “Metrology for aerosol optical properties” and the ACTRIS Switzerland project funded by the Swiss State Secretariat for Education Research and Innovation.
This paper was edited by Omar Torres and reviewed by three anonymous referees.
AERONET: AErosol RObotic NETwork (AERONET) Data Download Tool, NASA [data set], https://aeronet.gsfc.nasa.gov/cgi-bin/webtool_aod_v3, last access: 9 June 2023.
Andrés Hernández, M. D., Hilboll, A., Ziereis, H., Förster, E., Krüger, O. O., Kaiser, K., Schneider, J., Barnaba, F., Vrekoussis, M., Schmidt, J., Huntrieser, H., Blechschmidt, A.-M., George, M., Nenakhov, V., Harlass, T., Holanda, B. A., Wolf, J., Eirenschmalz, L., Krebsbach, M., Pöhlker, M. L., Kalisz Hedegaard, A. B., Mei, L., Pfeilsticker, K., Liu, Y., Koppmann, R., Schlager, H., Bohn, B., Schumann, U., Richter, A., Schreiner, B., Sauer, D., Baumann, R., Mertens, M., Jöckel, P., Kilian, M., Stratmann, G., Pöhlker, C., Campanelli, M., Pandolfi, M., Sicard, M., Gómez-Amo, J. L., Pujadas, M., Bigge, K., Kluge, F., Schwarz, A., Daskalakis, N., Walter, D., Zahn, A., Pöschl, U., Bönisch, H., Borrmann, S., Platt, U., and Burrows, J. P.: Overview: On the transport and transformation of pollutants in the outflow of major population centres – observational data from the EMeRGe European intensive operational period in summer 2017, Atmos. Chem. Phys., 22, 5877–5924, https://doi.org/10.5194/acp-22-5877-2022, 2022.
Arola, A. and Koskela, T.: On the sources of bias in aerosol optical depth retrieval in the UV range, J. Geophys. Res., 109, D08209, https://doi.org/10.1029/2003JD004375, 2004.
Barnaba, F., Angelini, F., Curci, G., and Gobbi, G. P.: An important fingerprint of wildfires on the European aerosol load, Atmos. Chem. Phys., 11, 10487–10501, https://doi.org/10.5194/acp-11-10487-2011, 2011.
Barnaba, F., Bolignano, A., Di Liberto, L., Morelli, M., Lucarelli, F., Nava, S., Perrino, C., Canepari, S., Basart, S., Costabile, F., Dionisi, D., Ciampichetti, S., Sozzi, R., and Gobbi, G. P.: Desert dust contribution to PM10 loads in Italy: Methods and recommendations addressing the relevant European Commission Guidelines in support to the Air Quality Directive 2008/50, Atmos. Environ, 161, 288–305, 2017.
Benedetti, A., Reid, J. S., Knippertz, P., Marsham, J. H., Di Giuseppe, F., Rémy, S., Basart, S., Boucher, O., Brooks, I. M., Menut, L., Mona, L., Laj, P., Pappalardo, G., Wiedensohler, A., Baklanov, A., Brooks, M., Colarco, P. R., Cuevas, E., da Silva, A., Escribano, J., Flemming, J., Huneeus, N., Jorba, O., Kazadzis, S., Kinne, S., Popp, T., Quinn, P. K., Sekiyama, T. T., Tanaka, T., and Terradellas, E.: Status and future of numerical atmospheric aerosol prediction with a focus on data requirements, Atmos. Chem. Phys., 18, 10615–10643, https://doi.org/10.5194/acp-18-10615-2018, 2018.
Boersma, K. F., Eskes, H. J., and Brinksma, E. J.: Error analysis for tropospheric NO2 retrieval from space, J. Geophys. Res., 109, D04311, https://doi.org/10.1029/2003JD003962, 2004.
Boersma, K. F., Jacob, D. J., Eskes, H. J., Pinder, R. W., Wang, J., and van der A, R. J.: Inter-comparison of SCIAMACHY and OMI tropospheric NO2 columns: Observing the diurnal evolution of chemistry and emissions from space, J. Geophys. Res., 113, 1–14, https://doi.org/10.1029/2007JD008816, 2008.
Boersma, K. F., Eskes, H. J., Dirksen, R. J., van der A, R. J., Veefkind, J. P., Stammes, P., Huijnen, V., Kleipool, Q. L., Sneep, M., Claas, J., Leitão, J., Richter, A., Zhou, Y., and Brunner, D.: An improved tropospheric NO2 column retrieval algorithm for the Ozone Monitoring Instrument, Atmos. Meas. Tech., 4, 1905–1928, https://doi.org/10.5194/amt-4-1905-2011, 2011.
Burrows, J. P., Dehn, A., Deters, B., Himmelmann, S., Richter, A., Voigt, S., and Orphal, J.: Atmospheric remote-sensing reference data from GOME: Part 1. Temperature-dependent absorption cross-sections of NO2 in the 231–794 nm range, J. Quant. Spectrosc. Ra., 60, 1025–1031, 1998.
Campanelli, M., Nakajima, T., and Olivieri, B.: Determination of the solar calibration constant for a sun-sky radiometer: proposal of an in-situ procedure, Appl. Optics, 43, 651–659, 2004.
Campanelli, M., Iannarelli, A. M., Mevi, G., Casadio, S., Diémoz, H., Finardi, S., Dinoi, A., Castelli, E., di Sarra, A., Di Bernardino, A., Casasanta, G., Bassani, C., Siani, A. M., Cacciani, M., Barnaba, F., Di Liberto, L., and Argentini, S.: A wide-ranging investigation of the COVID-19 lockdown effects on the atmospheric composition in various Italian urban sites (AER – LOCUS), Urban Climate, 39, 100954, https://doi.org/10.1016/j.uclim.2021.100954, 2021.
Campanelli, M., Diémoz, H., Siani, A. M., di Sarra, A., Iannarelli, A. M., Kudo, R., Fasano, G., Casasanta, G., Tofful, L., Cacciani, M., Sanò, P., and Dietrich, S.: Aerosol optical characteristics in the urban area of Rome, Italy, and their impact on the UV index, Atmos. Meas. Tech., 15, 1171–1183, https://doi.org/10.5194/amt-15-1171-2022, 2022.
Cede, A.: Manual for Blick Software Suite 1.8, 10 September 2021, Issue 1.8-4, https://www.pandonia-global-network.org/wp-content/uploads/2021/09/BlickSoftwareSuite_Manual_v1-8-4.pdf (last access: 22 April 2022), 2021.
Cede, A., Tiefengraber, M., Dehn, A., Lefer, B., von Bismarck, J., Casadio, S., Abuhassan, N., Swap, R., and Valin, L.: Operational satellite validation with data from the Pandonia Global Network (PGN), EGU General Assembly 2020, Online, 4–8 May 2020, EGU2020-13850, https://doi.org/10.5194/egusphere-egu2020-13850, 2020.
Chen, C., Dubovik, O., Fuertes, D., Litvinov, P., Lapyonok, T., Lopatin, A., Ducos, F., Derimian, Y., Herman, M., Tanré, D., Remer, L. A., Lyapustin, A., Sayer, A. M., Levy, R. C., Hsu, N. C., Descloitres, J., Li, L., Torres, B., Karol, Y., Herrera, M., Herreras, M., Aspetsberger, M., Wanzenboeck, M., Bindreiter, L., Marth, D., Hangler, A., and Federspiel, C.: Validation of GRASP algorithm product from POLDER/PARASOL data and assessment of multi-angular polarimetry potential for aerosol monitoring, Earth Syst. Sci. Data, 12, 3573–3620, https://doi.org/10.5194/essd-12-3573-2020, 2020.
Chen, C., Dubovik, O., Litvinov, P., Fuertes, D., Lopatin, A., Lapyonok, T., Matar, C., Karol, Y., Fischer, J., Preusker, R., Hangler, A., Aspetsberger, M., Bindreiter, L., Marth, D., Chimot, J., Fougnie, B., Marbach, T., and Bojkov, B.: Properties of aerosol and surface derived from OLCI/Sentinel-3A using GRASP approach: Retrieval development and preliminary validation, Remote Sens. Environ., 280, 113142, https://doi.org/10.1016/j.rse.2022.113142, 2022.
Chu, D., Kaufman, Y. J., Ichoku, C., Remer, L., Tanre, D., and Holben, B. N.: Validation of MODIS aerosol optical depth retrieval over land, Geophy. Res. Lett., 29, 1617, https://doi.org/10.1029/2001GL013205, 2002.
Ciardini, V., Di Iorio, T., Di Liberto, L., Tirelli, C., Casasanta, G., di Sarra, A., Fiocco, G., Fuà, D., and Cacciani, M.: Seasonal variability of tropospheric aerosols in Rome, Atmos. Res., 118, 205–214, https://doi.org/10.1016/j.atmosres.2012.06.026, 2012.
Corr, C. A., Krotkov, N., Madronich, S., Slusser, J. R., Holben, B., Gao, W., Flynn, J., Lefer, B., and Kreidenweis, S. M.: Retrieval of aerosol single scattering albedo at ultraviolet wavelengths at the T1 site during MILAGRO, Atmos. Chem. Phys., 9, 5813–5827, https://doi.org/10.5194/acp-9-5813-2009, 2009.
Cuevas, E., Romero-Campos, P. M., Kouremeti, N., Kazadzis, S., Räisänen, P., García, R. D., Barreto, A., Guirado-Fuentes, C., Ramos, R., Toledano, C., Almansa, F., and Gröbner, J.: Aerosol optical depth comparison between GAW-PFR and AERONET-Cimel radiometers from long-term (2005–2015) 1 min synchronous measurements, Atmos. Meas. Tech., 12, 4309–4337, https://doi.org/10.5194/amt-12-4309-2019, 2019.
Di Bernardino, A., Iannarelli, A. M., Casadio, S., Mevi, G., Campanelli, M., Casasanta, G., Cede, A., Tiefengraber, M., Siani, A. M., Spinei, E., and Cacciani, M.: On the effect of sea breeze regime on aerosols and gases properties in the urban area of Rome, Italy, Urban Climate, 37, 100842, https://doi.org/10.1016/j.uclim.2021.100842, 2021.
Diémoz, H., Siani, A. M., Casadio, S., Iannarelli, A. M., Casale, G. R., Savastiouk, V., Cede, A., Tiefengraber, M., and Müller, M.: Advanced NO2 retrieval technique for the Brewer spectrophotometer applied to the 20-year record in Rome, Italy, Earth Syst. Sci. Data, 13, 4929–4950, https://doi.org/10.5194/essd-13-4929-2021, 2021.
Di Ianni, A., Costabile, F., Barnaba, F., Di Liberto, L., Weinhold, K., Wiedensohler, A., Struckmeier, C., Drewnick, F., and Gobbi, G. P.: Black Carbon Aerosol in Rome (Italy): Inference of a Long-Term (2001–2017) Record and Related Trends from AERONET Sun-Photometry Data, Atmosphere, 9, 81, https://doi.org/10.3390/atmos9030081, 2018.
Di Tomaso, E., Escribano, J., Basart, S., Ginoux, P., Macchia, F., Barnaba, F., Benincasa, F., Bretonnière, P.-A., Buñuel, A., Castrillo, M., Cuevas, E., Formenti, P., Gonçalves, M., Jorba, O., Klose, M., Mona, L., Montané Pinto, G., Mytilinaios, M., Obiso, V., Olid, M., Schutgens, N., Votsis, A., Werner, E., and Pérez García-Pando, C.: The MONARCH high-resolution reanalysis of desert dust aerosol over Northern Africa, the Middle East and Europe (2007–2016), Earth Syst. Sci. Data, 14, 2785–2816, https://doi.org/10.5194/essd-14-2785-2022, 2022.
Doppler, L., Carbajal-Henken, C., Pelon, J., Ravetta, F., and Fischer, J.: Extension of radiative transfer code MOMO, matrix-operator model to the thermal infrared–Clear air validation by comparison to RTTOV and application to CALIPSO-IIR, J. Quant. Spectrosc. Ra., 144, 49–67, 2014a.
Doppler, L., Preusker, R., Bennartz, R., and Fischer, J.: k-bin and k-IR: k-distribution methods without correlation approximation for non-fixed instrument response function and extension to the thermal infrared – Applications to satellite remote sensing, J. Quant. Spectrosc. Ra., 133, 382–395, 2014b.
Drosoglou, T., Bais, A. F., Zyrichidou, I., Kouremeti, N., Poupkou, A., Liora, N., Giannaros, C., Koukouli, M. E., Balis, D., and Melas, D.: Comparisons of ground-based tropospheric NO2 MAX-DOAS measurements to satellite observations with the aid of an air quality model over the Thessaloniki area, Greece, Atmos. Chem. Phys., 17, 5829–5849, https://doi.org/10.5194/acp-17-5829-2017, 2017.
Dubovik, O.: Optimization of Numerical Inversion in Photopolarimetric Remote Sensing, in: Photopolarimetry in Remote Sensing, edited by: Videen, G., Yatskiv, Y., and Mishchenko, M., Kluwer Academic Publishers, Dordrecht, the Netherlands, 65–106, https://doi.org/10.1007/1-4020-2368-5_3, 2004.
Dubovik, O. and King, M. D.: A flexible inversion algorithm for retrieval of aerosol optical properties from Sun and sky radiance measurements, J. Geophys. Res., 105, 20673–20696, 2000.
Dubovik, O., Smirnov, A., Holben, B. N., King, M. D., Kaufman, Y. J., Eck, T. F., and Slutsker, I.: Accuracy assessments of aerosol optical properties retrieved from AERONET Sun and sky-radiance measurements, J. Geophys. Res., 105, 9791–9806, 2000.
Dubovik, O., Herman, M., Holdak, A., Lapyonok, T., Tanré, D., Deuzé, J. L., Ducos, F., Sinyuk, A., and Lopatin, A.: Statistically optimized inversion algorithm for enhanced retrieval of aerosol properties from spectral multi-angle polarimetric satellite observations, Atmos. Meas. Tech., 4, 975–1018, https://doi.org/10.5194/amt-4-975-2011, 2011.
Dubovik, O., Fuertes, D., Litvinov, P., Lopatin, A., Lapyonok, T., Doubovik, I., Xu, F., Ducos, F., Chen, C., Torres, B., Derimian, Y., Li, L., Herreras-Giralda, M., Herrera, M., Karol, Y., Matar, C., Schuster, G. L., Espinosa, R., Puthukkudy, A., Li, Z., Fischer, J., Preusker, R., Cuesta, J., Kreuter, A., Cede, A., Aspetsberger, M., Marth, D.,Bindreiter, L., Hangler, A., Lanzinger, V., Holter, C., and Federspiel, C.: A comprehensive description of multi-term LSM for applying multiple a priori constraints in problems of atmospheric remote sensing: GRASP algorithm, concept, and applications, Front. Remote Sens., 2, 706851, https://doi.org/10.3389/frsen.2021.706851, 2021.
Eck, T. F., Holben, B. N., Reid, J. S., Dubovik, O., Kinne, S., Smirnov, A., O'Neill, N. T., and Slutsker, I.: The wavelength dependence of the optical depth of biomass burning, urban and desert dust aerosols, J. Geophys. Res., 104, 31333–31350, 1999.
Eck, T. F., Holben, B. N., Ward, D. E., Mukelabai, M. M., Dubovik, O., Smirnov, A., Schafer, J. S., Hsu, N. C., Piketh, S. J., Queface, A., and Roux, J. L.: Variability of biomass burning aerosol optical characteristics in southern Africa during the SAFARI 2000 dry season campaign and a comparison of single scattering albedo estimates from radiometric measurements, J. Geophys. Res.-Atmos., 108, 2156–2202, https://doi.org/10.1029/2002JD002321, 2003.
ESA: Copernicus Sentinel-5P (processed by ESA), TROPOMI Level 2 Nitrogen Dioxide total column products, Version 02, European Space Agency [data set], https://doi.org/10.5270/S5P-9bnp8q8, 2021.
Eskes, H. J. and Eichmann, K.-U.: S5P Mission Performance Centre Nitrogen Dioxide [L2__NO2___] Readme, issue 2.2, version 02.04.00, 21 pp., 17 November 2021, https://sentinel.esa.int/documents/247904/3541451/Sentinel-5P-Nitrogen-Dioxide-Level-2-Product-Readme-File (last access: 21 October 2022), 2022.
Eskes, H., van Geffen, J., Boersma, F., Eichmann, K.-U., Apituley, A., Pedergnana, M., Sneep, M., Veefkind, J. P., and Loyola, D.: Sentinel-5 precursor/TROPOMI Level 2 Product User Manual Nitrogendioxide, Tech. Rep. S5PKNMI-L2-0021-MA, Koninklijk Nederlands Meteorologisch Instituut (KNMI), CI-7570-PUM, issue 4.1.0, https://sentinel.esa.int/documents/247904/2474726/Sentinel-5P-Level-2-Product-User-Manual-Nitrogen-Dioxide.pdf (last access: 21 October 2022), 2022.
Espinosa, W. R., Remer, L. A., Dubovik, O., Ziemba, L., Beyersdorf, A., Orozco, D., Schuster, G., Lapyonok, T., Fuertes, D., and Martins, J. V.: Retrievals of aerosol optical and microphysical properties from Imaging Polar Nephelometer scattering measurements, Atmos. Meas. Tech., 10, 811–824, https://doi.org/10.5194/amt-10-811-2017, 2017.
Espinosa, W. R., Martins, J. V., Remer, L. A., Dubovik, O., Lapyonok, T., Fuertes, D., Puthukkudy, A., Orozco, D., Ziemba, L., Thornhill, K. L., and Levy, R.: Retrievals of Aerosol Size Distribution, Spherical Fraction, and Complex Refractive Index from Airborne In Situ Angular Light Scattering and Absorption Measurements, J. Geophys. Res.-Atmos. 124, 7997–8024, https://doi.org/10.1029/2018JD030009, 2019.
Estellés, V., Campanelli, M., Smyth, T. J., Utrillas, M. P., and Martínez-Lozano, J. A.: Evaluation of the new ESR network software for the retrieval of direct sun products from CIMEL CE318 and PREDE POM01 sun-sky radiometers, Atmos. Chem. Phys., 12, 11619–11630, https://doi.org/10.5194/acp-12-11619-2012, 2012.
Fan, C., Li, Z., Li, Y., Dong, J., van der A, R., and de Leeuw, G.: Variability of NO2 concentrations over China and effect on air quality derived from satellite and ground-based observations, Atmos. Chem. Phys., 21, 7723–7748, https://doi.org/10.5194/acp-21-7723-2021, 2021.
Flynn, C. M., Pickering, K. E., Crawford, J. H., Lamsal, L., Krotkov, N., Herman, J., Weinheimer, A., Chen, G., Liu, X., Szykman, J., Tsay, S.-C., Loughner, C., Hains, J., Lee, P., Dickerson, R. R., Stehr, J. W., and Brent, L.: Relationship between column-density and surface mixing ratio: Statistical analysis of O3 and NO2 data from the July 2011 Maryland DISCOVER-AQ mission, Atmos. Environ., 92, 429–441, https://doi.org/10.1016/j.atmosenv.2014.04.041, 2014.
Giles, D. M., Sinyuk, A., Sorokin, M. G., Schafer, J. S., Smirnov, A., Slutsker, I., Eck, T. F., Holben, B. N., Lewis, J. R., Campbell, J. R., Welton, E. J., Korkin, S. V., and Lyapustin, A. I.: Advancements in the Aerosol Robotic Network (AERONET) Version 3 database – automated near-real-time quality control algorithm with improved cloud screening for Sun photometer aerosol optical depth (AOD) measurements, Atmos. Meas. Tech., 12, 169–209, https://doi.org/10.5194/amt-12-169-2019, 2019.
Gkikas, A., Proestakis, E., Amiridis, V., Kazadzis, S., Di Tomaso, E., Tsekeri, A., Marinou, E., Hatzianastassiou, N., and Pérez García-Pando, C.: ModIs Dust AeroSol (MIDAS): a global fine-resolution dust optical depth data set, Atmos. Meas. Tech., 14, 309–334, https://doi.org/10.5194/amt-14-309-2021, 2021.
Gobbi, G. P., Angelini, F., Barnaba, F., Costabile, F., Baldasano, J. M., Basart, S., Sozzi, R., and Bolignano, A.: Changes in particulate matter physical properties during Saharan advections over Rome (Italy): a four-year study, 2001–2004, Atmos. Chem. Phys., 13, 7395–7404, https://doi.org/10.5194/acp-13-7395-2013, 2013.
Gobbi, G. P., Barnaba, F., Di Liberto, L., Bolignano, A., Lucarelli, F., Nava, S., Perrino, C., Pietrodangelo, A., Basart, S., Costabile, F., Dionisi, D., Rizza, U., Canepari, S., Sozzi, R., Morelli, M., Manigrasso, M., Drewnick, F., Struckmeier, C., Poenitz, K., and Wille, H.: An inclusive view of Saharan dust advections to Italy and the Central Mediterranean, Atmos. Environ., 201, 242–256, https://doi.org/10.1016/j.atmosenv.2019.01.002, 2019.
Green, M., Kondragunta, S., Ciren, P., and Xu, C.: Comparison of GOES and MODIS aerosol optical depth (AOD) to aerosol robotic network (AERONET) AOD and IMPROVE PM2.5 mass at Bondville, Illinois, J. Air Waste Manag. Assoc., 59, 1082–1091, https://doi.org/10.3155/1047-3289.59.9.1082, 2009.
Herman, J., Cede, A., Spinei, E., Mount, G., Tzortziou, M., and Abuhassan, N.: NO2 column amounts from ground-based Pandora and MFDOAS spectrometers using the direct-sun DOAS technique: Intercomparisons and application to OMI validation, J. Geophys. Res., 114, D13307, https://doi.org/10.1029/2009JD011848, 2009.
Herman, J., Spinei, E., Fried, A., Kim, J., Kim, J., Kim, W., Cede, A., Abuhassan, N., and Segal-Rozenhaimer, M.: NO2 and HCHO measurements in Korea from 2012 to 2016 from Pandora spectrometer instruments compared with OMI retrievals and with aircraft measurements during the KORUS-AQ campaign, Atmos. Meas. Tech., 11, 4583–4603, https://doi.org/10.5194/amt-11-4583-2018, 2018.
Herman, J., Abuhassan, N., Kim, J., Kim, J., Dubey, M., Raponi, M., and Tzortziou, M.: Underestimation of column NO2 amounts from the OMI satellite compared to diurnally varying ground-based retrievals from multiple PANDORA spectrometer instruments, Atmos. Meas. Tech., 12, 5593–5612, https://doi.org/10.5194/amt-12-5593-2019, 2019.
Herreras, M., Román, R., Cazorla, A., Toledano, C., Lyamani, H., Torres, B., Cachorro, V. E., Olmo, F. J., Alados-Arboledas, L., and de Frutos, A. M.: Evaluation of Retrieved Aerosol Extinction Profiles Using as Reference the Aerosol Optical Depth Differences between Various Heights, Atmos. Res., 230, 104625, https://doi.org/10.1016/j.atmosres.2019.104625, 2019.
Hobbs, P. V.: Chapter 2 Aerosol-Cloud Interactions, Aerosol-Cloud-Climate Interactions, Int. Geophys. Ser., 54, 33–73, https://doi.org/10.1016/S0074-6142(08)60211-9, 1993.
Holben, B. N., Eck, T. F., Slutsker, I. A., Tanre, D., Buis, J. P., Setzer, A., Vermote, E., Reagan, J. A., Kaufman, Y. J., Nakajim, T., Lavenu, F., Jankowiak, I., and Smirnov A.: AERONET – A federated instrument network and data archive for aerosol characterization, Remote Sens. Environ., 66, 1–16, 1998.
Hsu, N. C., Tsay, S.-C., King, M. D., and Herman, J. R.: Aerosol Properties Over Bright-Reflecting Source Regions, IEEE T. Geosci. Remote, 42, 557–569, https://doi.org/10.1109/TGRS.2004.824067, 2004.
Hsu, N. C., Tsay, S.-C., King, M. D., and Herman, J. R.: Deep Blue Retrievals of Asian Aerosol Properties During ACE-Asia, IEEE T. Geosci. Remote, 44, 3180–3195, https://doi.org/10.1109/TGRS.2006.879540, 2006.
Hsu, N. C., Jeong, M.-J., Bettenhausen, C., Sayer, A. M., Hansell, R., Seftor, C. S., Huang, J., and Tsay, S.-C.: Enhanced Deep Blue aerosol retrieval algorithm: The second generation, J. Geophys. Res.-Atmos., 118, 9296–9315, https://doi.org/10.1002/jgrd.50712, 2013.
Iannarelli, A. M., Di Bernardino, A., Casadio, S., Bassani, C., Cacciani, M., Campanelli, M., Casasanta, G., Cadau, E., Diémoz, H., Mevi, G., Siani, A. M., Cardaci, M., Dehn, A., and Goryl, P.: The Boundary Layer Air Quality-Analysis Using Network of Instruments (BAQUNIN) Supersite for Atmospheric Research and Satellite Validation over Rome Area, B. Am. Meteorol. Soc., 103, E599–E618, https://doi.org/10.1175/BAMS-D-21-0099.1, 2021.
IPCC: Climate Change 2021: The Physical Science Basis. Contribution of Working Group I to the Sixth Assessment Report of the Intergovernmental Panel on Climate Change, edited by: Masson-Delmotte, V., Zhai, P., Pirani, A., Connors, S. L., Péan, C., Berger, S., Caud, N., Chen, Y., Goldfarb, L., Gomis, M. I., Huang, M., Leitzell, K., Lonnoy, E., Matthews, J. B. R., Maycock, T. K., Waterfield, T., Yelekçi, O., Yu, R., and Zhou, B., Cambridge University Press, Cambridge, United Kingdom and New York, NY, USA, in press, https://doi.org/10.1017/9781009157896, 2021.
ISTAT: Annual demographic balance 2021, Italian National Institute of Statistics (ISTAT), http://demo.istat.it/bilmens/query.php?anno=2021&lingua=ita&Rip=S3&Reg=R12&Pro=P058&Com=91&submit=Tavola (last access: 21 August 2022), 2021.
Jethva, H., Torres, O., and Ahn, C.: Global assessment of OMI aerosol single-scattering albedo using ground-based AERONET inversion, J. Geophys. Res.-Atmos., 119, 9020–9040, https://doi.org/10.1002/2014JD021672, 2014.
Kazadzis, S., Raptis, P., Kouremeti, N., Amiridis, V., Arola, A., Gerasopoulos, E., and Schuster, G. L.: Aerosol absorption retrieval at ultraviolet wavelengths in a complex environment, Atmos. Meas. Tech., 9, 5997–6011, https://doi.org/10.5194/amt-9-5997-2016, 2016.
Kazadzis, S., Kouremeti, N., Nyeki, S., Gröbner, J., and Wehrli, C.: The World Optical Depth Research and Calibration Center (WORCC) quality assurance and quality control of GAW-PFR AOD measurements, Geosci. Instrum. Method. Data Syst., 7, 39–53, https://doi.org/10.5194/gi-7-39-2018, 2018a.
Kazadzis, S., Kouremeti, N., Diémoz, H., Gröbner, J., Forgan, B. W., Campanelli, M., Estellés, V., Lantz, K., Michalsky, J., Carlund, T., Cuevas, E., Toledano, C., Becker, R., Nyeki, S., Kosmopoulos, P. G., Tatsiankou, V., Vuilleumier, L., Denn, F. M., Ohkawara, N., Ijima, O., Goloub, P., Raptis, P. I., Milner, M., Behrens, K., Barreto, A., Martucci, G., Hall, E., Wendell, J., Fabbri, B. E., and Wehrli, C.: Results from the Fourth WMO Filter Radiometer Comparison for aerosol optical depth measurements, Atmos. Chem. Phys., 18, 3185–3201, https://doi.org/10.5194/acp-18-3185-2018, 2018b.
King, M. D. and Dubovik, O.: Determination of Aerosol Optical Properties from Inverse Methods, Aerosol Remote Sensing, edited by: Lenoble, J., Remer, L., and Tanré, D., Springer, Praxis Publishers, Chischester, UK, 101–136, https://doi.org/10.1007/978-3-642-17725-5_5, 2013.
Kreher, K., Van Roozendael, M., Hendrick, F., Apituley, A., Dimitropoulou, E., Frieß, U., Richter, A., Wagner, T., Lampel, J., Abuhassan, N., Ang, L., Anguas, M., Bais, A., Benavent, N., Bösch, T., Bognar, K., Borovski, A., Bruchkouski, I., Cede, A., Chan, K. L., Donner, S., Drosoglou, T., Fayt, C., Finkenzeller, H., Garcia-Nieto, D., Gielen, C., Gómez-Martín, L., Hao, N., Henzing, B., Herman, J. R., Hermans, C., Hoque, S., Irie, H., Jin, J., Johnston, P., Khayyam Butt, J., Khokhar, F., Koenig, T. K., Kuhn, J., Kumar, V., Liu, C., Ma, J., Merlaud, A., Mishra, A. K., Müller, M., Navarro-Comas, M., Ostendorf, M., Pazmino, A., Peters, E., Pinardi, G., Pinharanda, M., Piters, A., Platt, U., Postylyakov, O., Prados-Roman, C., Puentedura, O., Querel, R., Saiz-Lopez, A., Schönhardt, A., Schreier, S. F., Seyler, A., Sinha, V., Spinei, E., Strong, K., Tack, F., Tian, X., Tiefengraber, M., Tirpitz, J.-L., van Gent, J., Volkamer, R., Vrekoussis, M., Wang, S., Wang, Z., Wenig, M., Wittrock, F., Xie, P. H., Xu, J., Yela, M., Zhang, C., and Zhao, X.: Intercomparison of NO2, O4, O3 and HCHO slant column measurements by MAX-DOAS and zenith-sky UV–visible spectrometers during CINDI-2, Atmos. Meas. Tech., 13, 2169–2208, https://doi.org/10.5194/amt-13-2169-2020, 2020.
Lambert, J.-C., Keppens, A., Compernolle, S., Eichmann, K.-U., de Graaf, M., Hubert, D., Kleipool, Q., Langerock, B., Sha, M. K., Verhoelst, T., Wagner, T., Ahn, C., Argyrouli, A., Balis, D., Chan, K. L., De Smedt, I., Eskes, H., Fjæraa, A. M., Garane, K., Gleason, J. F., Goutail, F., Granville, J., Hedelt, P., Heue, K.-P., Jaross, G., Koukouli, M. L., Landgraf, J., Lutz, R., Nanda, S., Niemeijer, S., Pazmiño, A., Pinardi, G., Pommereau, J.-P., Richter, A., Rozemeijer, N., Sneep, M., Stein Zweers, D., Theys, N., Tilstra, G., Torres, O., Valks, P., van Geffen, J., Vigouroux, C., Wang, P., and Weber, M.: Quarterly Validation Report of the Copernicus Sentinel-5 Precursor Operational Data Products #13: April 2018–December 2021, S5P MPC Routine Operations Consolidated Validation Report series, issue #13, version 13.01.00, 189 pp., 17 December 2021, https://mpc-vdaf.tropomi.eu/ProjectDir/reports//pdf/S5P-MPC-IASB-ROCVR-13.00.10-20211217_signed.pdf (last access: 12 February 2023), 2021.
Lamsal, L. N., Janz, S. J., Krotkov, N. A., Pickering, K. E., Spurr, R. J. D., Kowalewski, M. G., Loughner, C. P., Crawford, J. H., Swartz, W. H., and Herman, J. R.: High-resolution NO2 observations from the Airborne Compact Atmospheric Mapper: Retrieval and validation, J. Geophys. Res., 122, 1953–1970, https://doi.org/10.1002/2016JD025483, 2017.
Lelieveld, J., Evans, J. S., Fnais, M., Giannadaki, D., and Pozzer, A.: The contribution of outdoor air pollution sources to premature mortality on a global scale, Nature, 525, 367–371, https://doi.org/10.1038/nature15371, 2015.
Levy, R., Hsu, C., Sayer, A., Mattoo, S., and Lee, J.: MODIS/Terra, MODIS Atmosphere L2 Aerosol Product, NASA MODIS Adaptive Processing System, Goddard Space Flight Center [data set], https://doi.org/10.5067/MODIS/MOD04_L2.061, 2017a.
Levy, R., Hsu, C., Sayer, A., Mattoo, S., and Lee, J.: MODIS/Aqua, MODIS Atmosphere L2 Aerosol Product, NASA MODIS Adaptive Processing System, Goddard Space Flight Center [data set], https://doi.org/10.5067/MODIS/MYD04_L2.061, 2017b.
Levy, R. C., Remer, L. A., Kleidman, R. G., Mattoo, S., Ichoku, C., Kahn, R., and Eck, T. F.: Global evaluation of the Collection 5 MODIS dark-target aerosol products over land, Atmos. Chem. Phys., 10, 10399–10420, https://doi.org/10.5194/acp-10-10399-2010, 2010.
Levy, R. C., Mattoo, S., Munchak, L. A., Remer, L. A., Sayer, A. M., Patadia, F., and Hsu, N. C.: The Collection 6 MODIS aerosol products over land and ocean, Atmos. Meas. Tech., 6, 2989–3034, https://doi.org/10.5194/amt-6-2989-2013, 2013.
Li, J., Carlson, B. E., and Lacis, A. A.: How well do satellite AOD observations represent the spatial and temporal variability of PM2.5 concentration for the United States?, Atmos. Environ., 102, 260–273, https://doi.org/10.1016/j.atmosenv.2014.12.010, 2015.
Logothetis, S.-A., Salamalikis, V., Gkikas, A., Kazadzis, S., Amiridis, V., and Kazantzidis, A.: 15-year variability of desert dust optical depth on global and regional scales, Atmos. Chem. Phys., 21, 16499–16529, https://doi.org/10.5194/acp-21-16499-2021, 2021.
Lopatin, A., Dubovik, O., Chaikovsky, A., Goloub, P., Lapyonok, T., Tanré, D., and Litvinov, P.: Enhancement of aerosol characterization using synergy of lidar and sun-photometer coincident observations: the GARRLiC algorithm, Atmos. Meas. Tech., 6, 2065–2088, https://doi.org/10.5194/amt-6-2065-2013, 2013.
Lopatin, A., Dubovik, O., Fuertes, D., Stenchikov, G., Lapyonok, T., Veselovskii, I., Wienhold, F. G., Shevchenko, I., Hu, Q., and Parajuli, S.: Synergy processing of diverse ground-based remote sensing and in situ data using the GRASP algorithm: applications to radiometer, lidar and radiosonde observations, Atmos. Meas. Tech., 14, 2575–2614, https://doi.org/10.5194/amt-14-2575-2021, 2021.
Martins, D. K., Najjar, R. G., Tzortziou, M., Abuhassan, N., Thompson, A. M., and Kollonige, D. E.: Spatial and temporal variability of ground and satellite column measurements of NO2 and O3 over the Atlantic Ocean during the Deposition of Atmospheric Nitrogen to Coastal Ecosystems Experiment, J. Geophys. Res., 121, 14175–14187, https://doi.org/10.1002/2016JD024998, 2016.
Molina, C., Toro, A. R., Manzano, C. A., Canepari, S., Massimi, L., and Leiva-Guzmán, M. A.: Airborne Aerosols and Human Health: Leapfrogging from Mass Concentration to Oxidative Potential, Atmosphere, 11, 917, https://doi.org/10.3390/atmos11090917, 2020.
Müller, M., Gebetsberger, M., Tiefengraber, M., and Cede, A.: LuftBlick Report 2019003, Fiducial Reference Measurementsfor Air Quality, Calibration Procedures Document, Tech. rep., LuftBlick, https://www.pandonia-global-network.org/wp-content/uploads/2021/01/LuftBlick_FRM4AQ_CPD_RP_2019003_v4.0.pdf (last access: 22 April 2022), 2020.
Nakajima, T., Tonna, G., Rao, R., Boi, P., Kaufman, Y., and Holben, B.: Use of sky brightness measurements from ground for remote sensing of particlulate polydispersions, Appl. Optics, 35, 2672–2686, 1996.
Nakajima, T., Campanelli, M., Che, H., Estellés, V., Irie, H., Kim, S.-W., Kim, J., Liu, D., Nishizawa, T., Pandithurai, G., Soni, V. K., Thana, B., Tugjsurn, N.-U., Aoki, K., Go, S., Hashimoto, M., Higurashi, A., Kazadzis, S., Khatri, P., Kouremeti, N., Kudo, R., Marenco, F., Momoi, M., Ningombam, S. S., Ryder, C. L., Uchiyama, A., and Yamazaki, A.: An overview of and issues with sky radiometer technology and SKYNET, Atmos. Meas. Tech., 13, 4195–4218, https://doi.org/10.5194/amt-13-4195-2020, 2020.
Park, J.-U., Park, J.-S., Santana Diaz, D., Gebetsberger, M., Müller, M., Shalaby, L., Tiefengraber, M., Kim, H.-J, Park, S.-S., Song, C.-K., and Kim, S.-W.: Spatiotemporal inhomogeneity of total column NO2 in a polluted urban area inferred from TROPOMI and Pandora intercomparisons, GISci. Remote Sens., 59, 354–373, https://doi.org/10.1080/15481603.2022.2026640, 2022.
PGN: Pandonia Global Network (PGN) data archive, PGN [data set], http://data.pandonia-global-network.org/, last access: 9 June 2023.
Platt, U.: Differential optical absorption spectroscopy (DOAS), in: Air Monitoring by Spectroscopic Techniques, Chem. Anal. Ser. 127, John Wiley, New York, 27–84, https://doi.org/10.1002/9780470027318.a0706, 1994.
Platt, U. and Stutz, J.: Differential Optical Absorption Spectroscopy: Principles and Applications, Springer, Germany, Berlin, ISBN 978-3-540-75776-4, 2008.
Remer, L., Kaufman, Y., Tanre, D., Mattoo, S., Chu, D., Martins, J., Li, R.-R., Ichoku, C., Levy, R. C., Kleidman, R. G., Eck, T. F., Vermote, E., and Holben, B. N.: The MODIS aerosol algorithm, products, and validation, J. Atmos. Sci., 62, 947–973, https://doi.org/10.1175/JAS3385.1, 2005.
Richter, A., Burrows, J. P., Nüszlig, H., Granier, C., and Niemeier, U.: Increase in tropospheric nitrogen dioxide over China observed from space (and supplementary discussion on: Error estimates for changes in tropospheric NO2 columns as derived from satellite measurements), Nature, 437, 129–132, https://doi.org/10.1038/nature04092, 2005.
Román, R., Torres, B., Fuertes, D., Cachorro, V., Dubovik, O., Toledano, C., Cazorla, A., Barreto, A., Bosch, J., Lapyonok, T., González, R., Goloub, P., Perrone, M., Olmo, F., de Frutos, A., and Alados-Arboledas, L.: Remote sensing of lunar aureole with a sky camera: Adding information in the nocturnal retrieval of aerosol properties with GRASP code, Remote Sens. Environ., 196, 238–252, https://doi.org/10.1016/j.rse.2017.05.013, 2017.
Román, R., Benavent-Oltra, J. A., Casquero-Vera, J. A., Lopatin, A., Cazorla, A., Lyamani, H., Denjean, C., Fuertes, D., Pérez-Ramírez, D., Torres, B., Toledano, C., Dubovik, O., Cachorro, V. E., de Frutos, A., Olmo, F. J., and Alados-Arboledas, L.: Retrieval of aerosol profiles combining sunphotometer and ceilometer measurements in GRASP code, Atmos. Res., 204, 161–177, 2018.
Román, R., Antuña-Sánchez, J. C., Cachorro, V. E., Toledano, C., Torres, B., Mateos, D., Fuertes, D., López, C., González, R., Lapionok, T., Herreras-Giralda, M., Dubovik, O., and de Frutos, Á. M.: Retrieval of aerosol properties using relative radiance measurements from an all-sky camera, Atmos. Meas. Tech., 15, 407–433, https://doi.org/10.5194/amt-15-407-2022, 2022.
Rosenfeld, D., Andreae, M. O., Asmi, A., Chin, M., de Leeuw, G., Donovan D. P., Kahn, R., Kinne, S., Kivekäs, N., Kulmala, M., Lau, W., Schmidt, K. S., Suni, T., Wagner, T., Wild, M., and Quaas, J.: Global observations of aerosol-cloud-precipitation-climate interactions, Rev. Geophys., 52, 750–808, https://doi.org/10.1002/2013RG000441, 2014.
Schuster, G. L., Espinosa, W. R., Ziemba, L. D., Beyersdorf, A. J., Rocha-Lima, A., Anderson, B. E., Martins, J. V., Dubovik, O., Ducos, F., Fuertes, D., Lapyonok, T., Shook, M., Derimian, Y., and Moore, R. H.: A Laboratory Experiment for the Statistical Evaluation of Aerosol Retrieval (STEAR) Algorithms, Remote Sens., 11, 498, https://doi.org/10.3390/rs11050498, 2019.
Schuster, G. L., Dubovik, O., and Holben, B. N.: Angstrom exponent and bimodal aerosol size distributions, J. Geophys. Res., 111, D07207, https://doi.org/10.1029/2005JD006328, 2006.
Sherman, J. P., Gupta, P., Levy, R. C., and Sherman, P. J.: An Evaluation of MODIS-Retrieved Aerosol Optical Depth over a Mountainous AERONET Site in the Southeastern US, Aerosol Air Qual. Res., 16, 3243–3255, https://doi.org/10.4209/aaqr.2015.09.0568, 2016.
Sinyuk, A., Holben, B. N., Eck, T. F., Giles, D. M., Slutsker, I., Korkin, S., Schafer, J. S., Smirnov, A., Sorokin, M., and Lyapustin, A.: The AERONET Version 3 aerosol retrieval algorithm, associated uncertainties and comparisons to Version 2, Atmos. Meas. Tech., 13, 3375–3411, https://doi.org/10.5194/amt-13-3375-2020, 2020.
SKYNET: Interntaional SKYNET Data Center (ISDC), SKYNET [data set], https://www.skynet-isdc.org/data.php, last access: 9 June 2023.
Solomon, S., Garcia, R. R., Rowland, F. S., and Wuebbles, D. J.: On the depletion of Antarctic ozone, Nature, 321, 755–758, https://doi.org/10.1038/321755a0, 1986.
Takamura T. and Nakajima T., Overview of SKYNET and its activities, Opt. Pura Apl., 37, 3303–3308, 2004.
Torres, B., Dubovik, O., Fuertes, D., Schuster, G., Cachorro, V. E., Lapyonok, T., Goloub, P., Blarel, L., Barreto, A., Mallet, M., Toledano, C., and Tanré, D.: Advanced characterisation of aerosol size properties from measurements of spectral optical depth using the GRASP algorithm, Atmos. Meas. Tech., 10, 3743–3781, https://doi.org/10.5194/amt-10-3743-2017, 2017.
Tzortziou, M., Herman, J. R., Cede, A., and Abuhassan, N.: High precision, absolute total column ozone measurements from the Pandora spectrometer system: Comparisons with data from a Brewer double monochromator and Aura OMI, J. Geophys. Res.-Atmos., 117, D16303, https://doi.org/10.1029/2012JD017814, 2012.
Tzortziou, M., Herman, J. R., Ahmad, Z., Loughner, C. P., Abuhassan, N., and Cede, A.: Atmospheric NO2 dynamics and impact on ocean color retrievals in urban nearshore regions, J. Geophys. Res.-Oceans, 119, 3834–3854, https://doi.org/10.1002/2014JC009803, 2014.
Tzortziou, M., Herman, J. R., Cede, A., Loughner, C. P., Abuhassan, N., and Naik, S.: Spatial and temporal variability of ozone and nitrogen dioxide over a major urban estuarine ecosystem, J. Atmos. Chem., 72, 287–309, https://doi.org/10.1007/s10874-013-9255-8, 2015.
Valentini, S., Barnaba, F., Bernardoni, V., Calzolai, G., Costabile, F., Di Liberto, L., Forello, A. C., Gobbi, G. P., Gualtieri, M., Lucarelli, F., Nava, S., Petralia, E., Valli, G., Wiedensohler, A., and Vecchi, R.: Classifying aerosol particles through the combination of optical and physical-chemical properties: Results from a wintertime campaign in Rome (Italy), Atmos. Res., 235, 104799, https://doi.org/10.1016/j.atmosres.2019.104799, 2020.
van Geffen, J. H. G. M., Boersma, K. F., Van Roozendael, M., Hendrick, F., Mahieu, E., De Smedt, I., Sneep, M., and Veefkind, J. P.: Improved spectral fitting of nitrogen dioxide from OMI in the 405–465 nm window, Atmos. Meas. Tech., 8, 1685–1699, https://doi.org/10.5194/amt-8-1685-2015, 2015.
van Geffen, J. H. G. M., Eskes, H. J., Boersma, K. F., and Veefkind, J. P.: TROPOMI ATBD of the Total and Tropospheric NO2 Data Products, KNMI, S5P-KNMI-L2-0005-RP, CI-7430-ATBD, issue: 2.4.0, https://sentinel.esa.int/documents/247904/2476257/Sentinel-5P-TROPOMI-ATBD-NO2-data-products (last access: 21 October 2022), 2022.
Weatherhead, E. C., Reinsel, G. C., Tiao, G. C., Meng, X.-L., Choi, D., Cheang, W.-K., Keller, T., DeLuisi, J., Wuebbles, D. J., Kerr, J. B., Miller, A. J., Oltmans, S. J., and Frederick, J. E.: Factors affecting the detection of trends: Statistical considerations and applications to environmental data, J. Geophys. Res., 103, 17149–17161, https://doi.org/10.1029/98JD00995, 1998.
Wei, J., Li, Z., Peng, Y., and Sun, L.: MODIS Collection 6.1 aerosol optical depth products over land and ocean: validation and comparison, Atmos. Environ., 201, 428–440, https://doi.org/10.1016/j.atmosenv.2018.12.004, 2019.
WMO: WMO/GAW Experts Workshop on a Global Surface-Based Network for Long Term Observations of Column Aerosol Optical Properties, 8–10 March 2004, Davos, Switzerland, GAW Report No. 162, WMO TD No. 1287, https://library.wmo.int/index.php?lvl=notice_display&id=11094 (last access: 9 June 2023), 2005.
Yoon, J., von Hoyningen-Huene, W., Kokhanovsky, A. A., Vountas, M., and Burrows, J. P.: Trend analysis of aerosol optical thickness and Ångström exponent derived from the global AERONET spectral observations, Atmos. Meas. Tech., 5, 1271–1299, https://doi.org/10.5194/amt-5-1271-2012, 2012.
Zhang, J. and Reid, J. S.: A decadal regional and global trend analysis of the aerosol optical depth using a data-assimilation grade over-water MODIS and Level 2 MISR aerosol products, Atmos. Chem. Phys., 10, 10949–10963, https://doi.org/10.5194/acp-10-10949-2010, 2010.
Zhao, X., Griffin, D., Fioletov, V., McLinden, C., Cede, A., Tiefengraber, M., Müller, M., Bognar, K., Strong, K., Boersma, F., Eskes, H., Davies, J., Ogyu, A., and Lee, S. C.: Assessment of the quality of TROPOMI high-spatial-resolution NO2 data products in the Greater Toronto Area, Atmos. Meas. Tech., 13, 2131–2159, https://doi.org/10.5194/amt-13-2131-2020, 2020.