the Creative Commons Attribution 4.0 License.
the Creative Commons Attribution 4.0 License.
 | 29 Jun 2023
Generalized Kendrick analysis for improved visualization of atmospheric mass spectral data
Mitchell W. Alton
Harald J. Stark
Manjula R. Canagaratna
Eleanor C. Browne
Mass spectrometry is an important analytical technique within the field of atmospheric chemistry. Owing to advances in instrumentation, particularly with regards to mass-resolving power and instrument response factors (sensitivities), hundreds of different mass-to-charge () signals are routinely measured. This large number of detected ions creates challenges for data visualization. Furthermore, assignment of chemical formulas to these ions is time consuming and increases in difficulty at the higher ranges. Here, we describe generalized Kendrick analysis (GKA) to facilitate the visualization and peak identification processes for typical atmospheric organic (and to some extent inorganic) compounds. GKA is closely related to resolution-enhanced Kendrick mass defect analysis (REKMD), which introduces a tunable integer into the Kendrick equation that effectively contracts or expands the mass scale. A characteristic of all Kendrick analysis methods is that these changes maintain the horizontal alignment of ion series related by integer multiples of the chosen base unit. Compared to traditional Kendrick analysis, GKA and REKMD use a tunable parameter (“scaling factor”) to alter the mass defect spacing between different homologue ion series. As a result, the entire mass defect range (−0.5 to 0.5) is more effectively used simplifying data visualization and facilitating chemical formula assignment. We describe the mechanism of this transformation and discuss base unit and scaling factor selections appropriate for compounds typically found in atmospheric measurements. We present an open-source graphical user interface (GUI) for calculating and visualizing GKA results within the Igor Pro environment.
- Article
(3027 KB) - Full-text XML
-
Supplement
(1582 KB) - BibTeX
- EndNote


Recent improvements to the sensitivities, resolving power, and time response of chemical ionization mass spectrometers used frequently in atmospheric measurements has led to a fundamental change in the understanding of atmospheric chemistry and the composition of the Earth's atmosphere. However, these advances have also created challenges in visualizing and interpreting the measurements. For typical resolving powers of time-of-flight mass spectrometers used in atmospheric chemistry, a conventional display of a mass spectrum as intensity versus mass-to-charge ratio can only be used to visually resolve the individual peaks across a narrow mass range. The intensity versus visualization also gives little information about the composition of the ions being measured. To provide more chemical insight, various data visualization methods have been used to identify chemical relationships and trends. Some visualization methods display ions on a plot based on the properties of their elemental composition, such as their H:C versus O:C ratios (van Krevelen plot; Van Krevelen, 1950) or average carbon oxidation state versus number of carbons (Kroll diagram; Kroll et al., 2011) of assigned ions. Other analyses relate compositional variables, such as the number of oxygen atoms, hydrogen atoms, or double bond equivalency of the assigned formula. However, the analyses just mentioned require formula assignments for each of the identified ions.
Analyses that do not rely on the assigned chemical formulas of observed ions are advantageous for aiding in composition assignment and in visualizing data that contain ions of unassigned composition. One such analysis that can be visualized with minimal knowledge of the sample composition is plotting the difference between an ion's exact and integer mass (mass defect) against the integer mass (Kendrick, 1963; Sleno, 2012) or exact mass. Since an ion's exact mass is determined by its elemental composition, the difference between an ion's integer and exact mass retains compositional information. By plotting the mass defect versus exact or nominal IUPAC mass, isobaric ions can be separated along the y axis, thus improving the visualization (as compared to a typical intensity versus mass spectrum) of closely spaced ions, particularly across a wide mass range.
Previous literature has referred to the difference between the integer and exact mass as mass defect (Kendrick, 1963; Craig and Errock, 1959). However, we note that the terminology of “mass defect” in this application is incorrect, as mass defect refers specifically to the difference in mass between the sum of the individual protons and neutrons in an atom and the actual mass of the nucleus due to the atom's binding energy. The difference between a molecule's integer mass and exact mass is due to how the mass scale of atoms is defined, not solely due to the binding energy of the nuclei; therefore, “mass defect” should not be used (Pourshahian, 2017). For example, the mass defect of a 12C atom in mass spectral analysis is 0 amu (atomic mass unit), while in physics it is 0.1 amu. Alternative names such as mass excess could be used in lieu of mass defect, though the previous adaptation of “mass defect” within the mass spectrometry community makes this transition difficult. Therefore, while we keep the term “mass defect” in this work, we have adopted the term generalized Kendrick analysis (GKA) when referring to quantities similar to those previously referred to as Kendrick mass defects. We do this to attempt to move away from incorrect terminology, while also noting that with the use of the round function in Eqs. (2) and (3), the result is not technically a mass.
Kendrick analysis is one way in which mass defect analysis can be adapted to provide easier visualization of composition. In Kendrick analysis, the mass scale is redefined such that the mass of a base unit, R, is set to its nucleon number, i.e., the number of protons and neutrons the molecule has (Kendrick, 1963; Hughey et al., 2001). For our purposes, we assume singly charged ions, as they are most important in real-time atmospheric chemistry measurements. Multiple charges could be included in the future, but non-linearities will arise, as the mass of the additional electrons contribute to its mass defect differently than the sum of individual elements in a molecule, which will need to be accounted for. Originally proposed using CH2 as a base unit, the Kendrick mass transformation has since been generalized to other base units (e.g., O, CH2O, etc.). Equation (1) shows this transformation:
where R is the IUPAC mass of the base unit R, mK is the mass of the molecule after the Kendrick unit conversion, and A is a nucleon number function describing the number of neutrons and protons in the base unit. As the electron involved in ionization changes the actual mass of the ion, the mass-to-charge ratio is not equal to mass even with single charges; therefore, we use mass to charge in this work. The Kendrick mass defect is calculated using Eq. (2).
Note that the order of the terms in Eq. (2) is determined mainly by convention within specific fields; we adopt the convention widely used in atmospheric chemistry. The round (m) functions similarly to the nucleon number function (A) in Eq. (1), as it is the difference between the exact numerical value and its nearest integer, which for the purposes of computation we represent as round. As a result of this transformation, ion series differing by an integer number of R units will have identical Kendrick mass defects. Typically, the result has been visualized in the two-dimensional space of Kendrick mass defect versus integer Kendrick mass; however, integer IUPAC mass or exact IUPAC mass are also acceptable. In these spaces, homologous ion series differing by R will align horizontally. Traditional Kendrick mass defect analysis has proven to be an instrumental tool for visualizing mass spectral information from a variety of fields including petroleomics, proteomics, and atmospheric measurements (Taguchi et al., 2010; Marshall and Rodgers, 2004; Junninen et al., 2010; Sleno, 2012).
Kendrick analysis only requires the exact mass of the identified ion, not the assigned molecular formula, allowing for identification of ion series related by the molecular subunit R. Errors in the assignment of exact masses, particularly for ions with an unassigned elemental composition, will result in a “fuzzy” appearance to the horizontal alignment due to peak-fitting errors. Using traditional Kendrick analysis (Eqs. 1 and 2), the data points tend to only occupy a small fraction of the available Kendrick mass defect space (defined mathematically from −0.5 to +0.5), resulting in congested data visualizations that can make it challenging to identify homologous ion series. The limited range of the Kendrick mass defect space arises because of “dead space” between the masses of common chemical formulas. Particularly for compounds present in complex environmental mixtures, observed ion masses tend to be periodically spaced with ∼1 amu gaps, and the Kendrick transformation maintains this spacing. The existence of the dead space can be explained because environmental molecules are generally made of a limited number of elements (H, C, O, N, S).
Recently, Fouquet and Sato (Fouquet and Sato, 2017c, a, b; Fouquet et al., 2018) have introduced the concept of “resolution-enhanced Kendrick mass defect” (REKMD) analysis to provide improved visualization and analysis of mass spectrometry data, particularly for polymers. REKMD introduces the concept of fractional base units by using integer divisors (X) as shown in Eq. (3):
For integer values of X, ions differing by integer numbers of R will have identical REKMD values. Specific rational values of x can also be used, as shown previously (Fouquet and Sato, 2017b). We will use x to denote rational values and X to denote integer values for the REKMD equations. Appropriate selection of Xor x amplifies mass defect variations, increasing the range of mass defect space occupied by a given data set and improving horizontal alignment of homologous ion series. The REKMD analysis method has been used in polymer chemistry previously (Fouquet and Sato, 2017a, b; Fouquet et al., 2018) but to our knowledge has not been previously applied to atmospheric samples. It should be emphasized that the REKMD transformation has no impact on the mass resolution of the data but rather alters the separation of ions in mass defect space. Through appropriate selection of X or x, the separation in mass defect space can be tuned to enable easier visualization of homologous ion series resulting in an apparent “resolution enhancement.”
In this work, we expand this previously reported analysis tool for use in atmospheric chemistry. We call this analysis generalized Kendrick analysis (GKA), as it is a slight rearrangement of the original Kendrick mass equation and of the REKMD equation. Ultimately, it may be appropriate to drop the term “generalized”, but we maintain the term in this work to distinguish it from the standard Kendrick analysis commonly used in atmospheric chemistry. We then discuss in general terms the principles of the mechanisms by which the mass defect space is expanded. We demonstrate its application for visualization of atmospheric trace gas composition, describe how choices of R and X will affect the visualization, show how the technique can aid in molecular formula assignment to unknown ions, and describe an open-source graphical user interface (GUI) for performing the analysis. In GKA, we refer to X as the scaling factor. We suggest that this analysis not only can be used for understanding ambient atmospheric gas-phase measurements, as shown here, but also could have potential use in aerosol measurements, and more broadly for other types of mass spectrometric data, as has been demonstrated previously (Fouquet and Sato, 2017c; Zheng et al., 2019; Fouquet, 2019).
For illustrating the applications of GKA for atmospheric chemistry, we use measurements from an Aerodyne and TOFWERK Vocus proton transfer mass spectrometer. Details of this instrument are discussed elsewhere (Krechmer et al., 2018). This measurement technique is commonly used in atmospheric chemistry as it can detect and quantify a large number of hydrocarbons (with the exception of small alkanes) as well as oxygen, nitrogen, and sulfur containing organic molecules found in the environment (Sekimoto et al., 2017). The instrument was deployed in Billerica, MA from March to August of 2021, with 1 Hz data averaged to 30 min before analysis. For the purposes of this discussion, we will use the data collected on 9 July 2020, from 04:00 to 23:00 local time (UTC−4). All data were analyzed in Tofware v3.2.5 within the Igor Pro v9.0.0.10 environment (Wavemetrics, Inc., Portland, OR). Only signals above a certain threshold (1 count per second) and which changed more than 30 % between evening and morning were included in the analysis. The reagent ions were also removed from the analysis. This ambient data set is used in Sect. 3 to demonstrate the principles of Kendrick analysis and illustrate how different scaling factors separate mass spectral data. The same data are used in Sect. 4 to present how Kendrick analysis can aid in understanding chemical composition in measured mass spectra. Individual ion signals are also purposefully unassigned and refit to demonstrate the usefulness of this tool for determining unidentified signals.
3.1 Generalized Kendrick analysis
Traditional Kendrick mass defect analysis uses round (R) (or the nucleon number of R, A(R)) as the integer mass for the mass scale transformation (Eq. 1); however, it is mathematically acceptable to use other integer values to maintain horizontal alignment of ion series related by an integer number of R. In fact, one can expand or contract the mass scale by replacing A(R) in Eqs. (1) and (2) with an integer scaling factor X as in Eq. (4) (generalized Kendrick analysis):
with X values less than A(R) contracting the scale and values greater than A(R) expanding the scale. Note that this form of the equation has been demonstrated before in polymer mass spectrometry (Fouquet, 2019). However, its applications and advantages with respect to visualization and ion assignment as used in atmospheric chemistry has yet to be identified and discussed. When inspecting mass spectral data using generalized Kendrick analysis, the main goal is to identify horizontal lines of ions related by integer numbers of R. When X is introduced into the equation and the scale changes, this horizontal alignment is preserved; however, the lines are separated more clearly in the mass defect dimension, allowing for simpler identification of related ions. For the two-dimensional visualizations of generalized Kendrick mass defect versus mass, we find the exact or integer IUPAC mass rather than Kendrick mass to be the most intuitive x axis.
GKA (Eq. 4) is mathematically identical to REKMD (Eq. 3) for integer scaling factors (X), satisfying Eq. (5):
since round will equal 1. This range of X coincides with the recommended range of integer divisors for REKMD analysis (Nakamura et al., 2019). GKA differs from REKMD in that the mass defect expansion is linear in X at values of X≤ round (), unlike the non-linear expansion for REKMD (Fig. S1 in the Supplement). These smaller X values can be useful when analyzing large mass ranges. Additionally, no upper limit on X exists for GKA analysis (Fig. S1), which can be useful in tuning the separation of homologous ion series when larger separation in the y axis is desired, as will be discussed later. The increased expansion or contraction ability of GKA compared to REKMD may not be useful for every set of mass spectrometric data, as the range of X available in REKMD may be sufficient. Though, as will be discussed, the increased expansion may lead to easier visualization of the different ions. As previously mentioned, REKMD can use select rational values of x. To maintain horizontal alignment of homologous series, only rational values of x satisfying x∗ round ( integer are allowed (Fouquet, 2019). Substituting that condition into Eq. (3) results in
showing that all expansions achievable with REKMD using rational values of x can also be achieved with GKA. With GKA, pseudo-continuous expansion becomes possible without introducing extra multiplication factors as is necessary in REKMD (Fouquet, 2019), and thus it is appropriate to consider GKA as a generalization of traditional Kendrick analysis and REKMD.
For both KMD and GKA analysis, ions differing by integer units of R will align horizontally in these spaces. Note that any R can be used, though for the purposes of this work we focus on the divisors when the Kendrick base is 16O.
3.2 Visualization of chemical composition
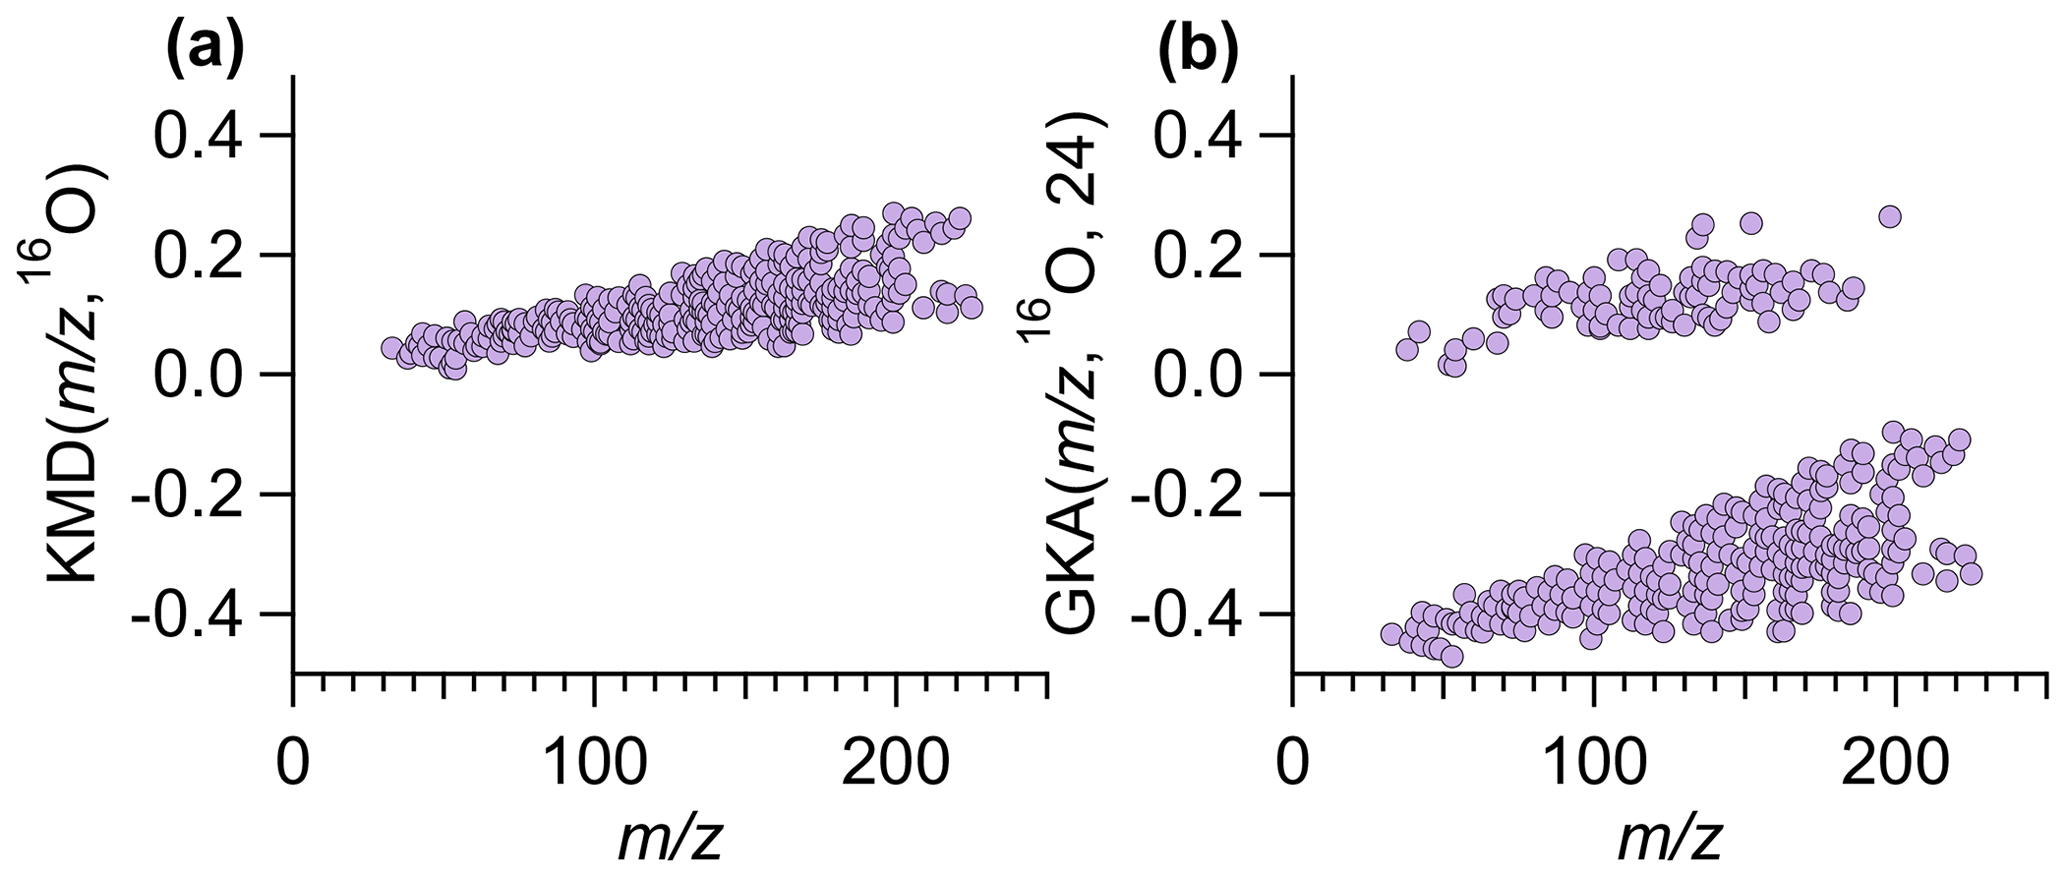
Figure 1Using ambient data collected by Vocus in Billerica, MA, (a) traditional KMD plot using a base of 16O and (b) GKA plot using a base of 16O and X=24, where the two groupings correspond to even (positive GKA values, odd number of nitrogen atoms) and odd (negative GKA values, zero/even number of nitrogen atoms) nominal mass. Figure S2 shows panel (a) zoomed in to illustrate that ion alignment remains blurred even with different y-axis scaling.
The combined choice of R and X impacts the mass scale expansion/contraction and will dictate how GKA aids visualization of the composition and alignment of homologous ion series. Figure 1a and b compare KM (, 16O) and GKA (, 16O, 24). For the GKA (, 16O, 24) analysis, the mass scale is expanded by a factor of (derived from the approximate reduced fraction of or 24/15.995). As a result of this scaling, ions with odd nominal masses in IUPAC mass space will be shifted towards half-integer masses, while even nominal masses in IUPAC space will remain at approximately integer values. Assuming positive mass defects in IUPAC mass space, nominally odd mass ions will typically have negative GKA values and nominally even mass ions will have positive GKA values, leading to the two groupings in Fig. 1b. This transformation of the generalized Kendrick masses is also shown in Fig. 2. Figure 2a and b show how ions in IUPAC or KM space span a narrow mass defect range, whereas Fig. 2c shows that, for the GKA (, 16O, 24), a transformation of , nominally odd mass ions (in IUPAC have a GKA (, 16O, 24) of around −0.5, while the GKA (, 16O, 24) of even mass ions remains around zero.
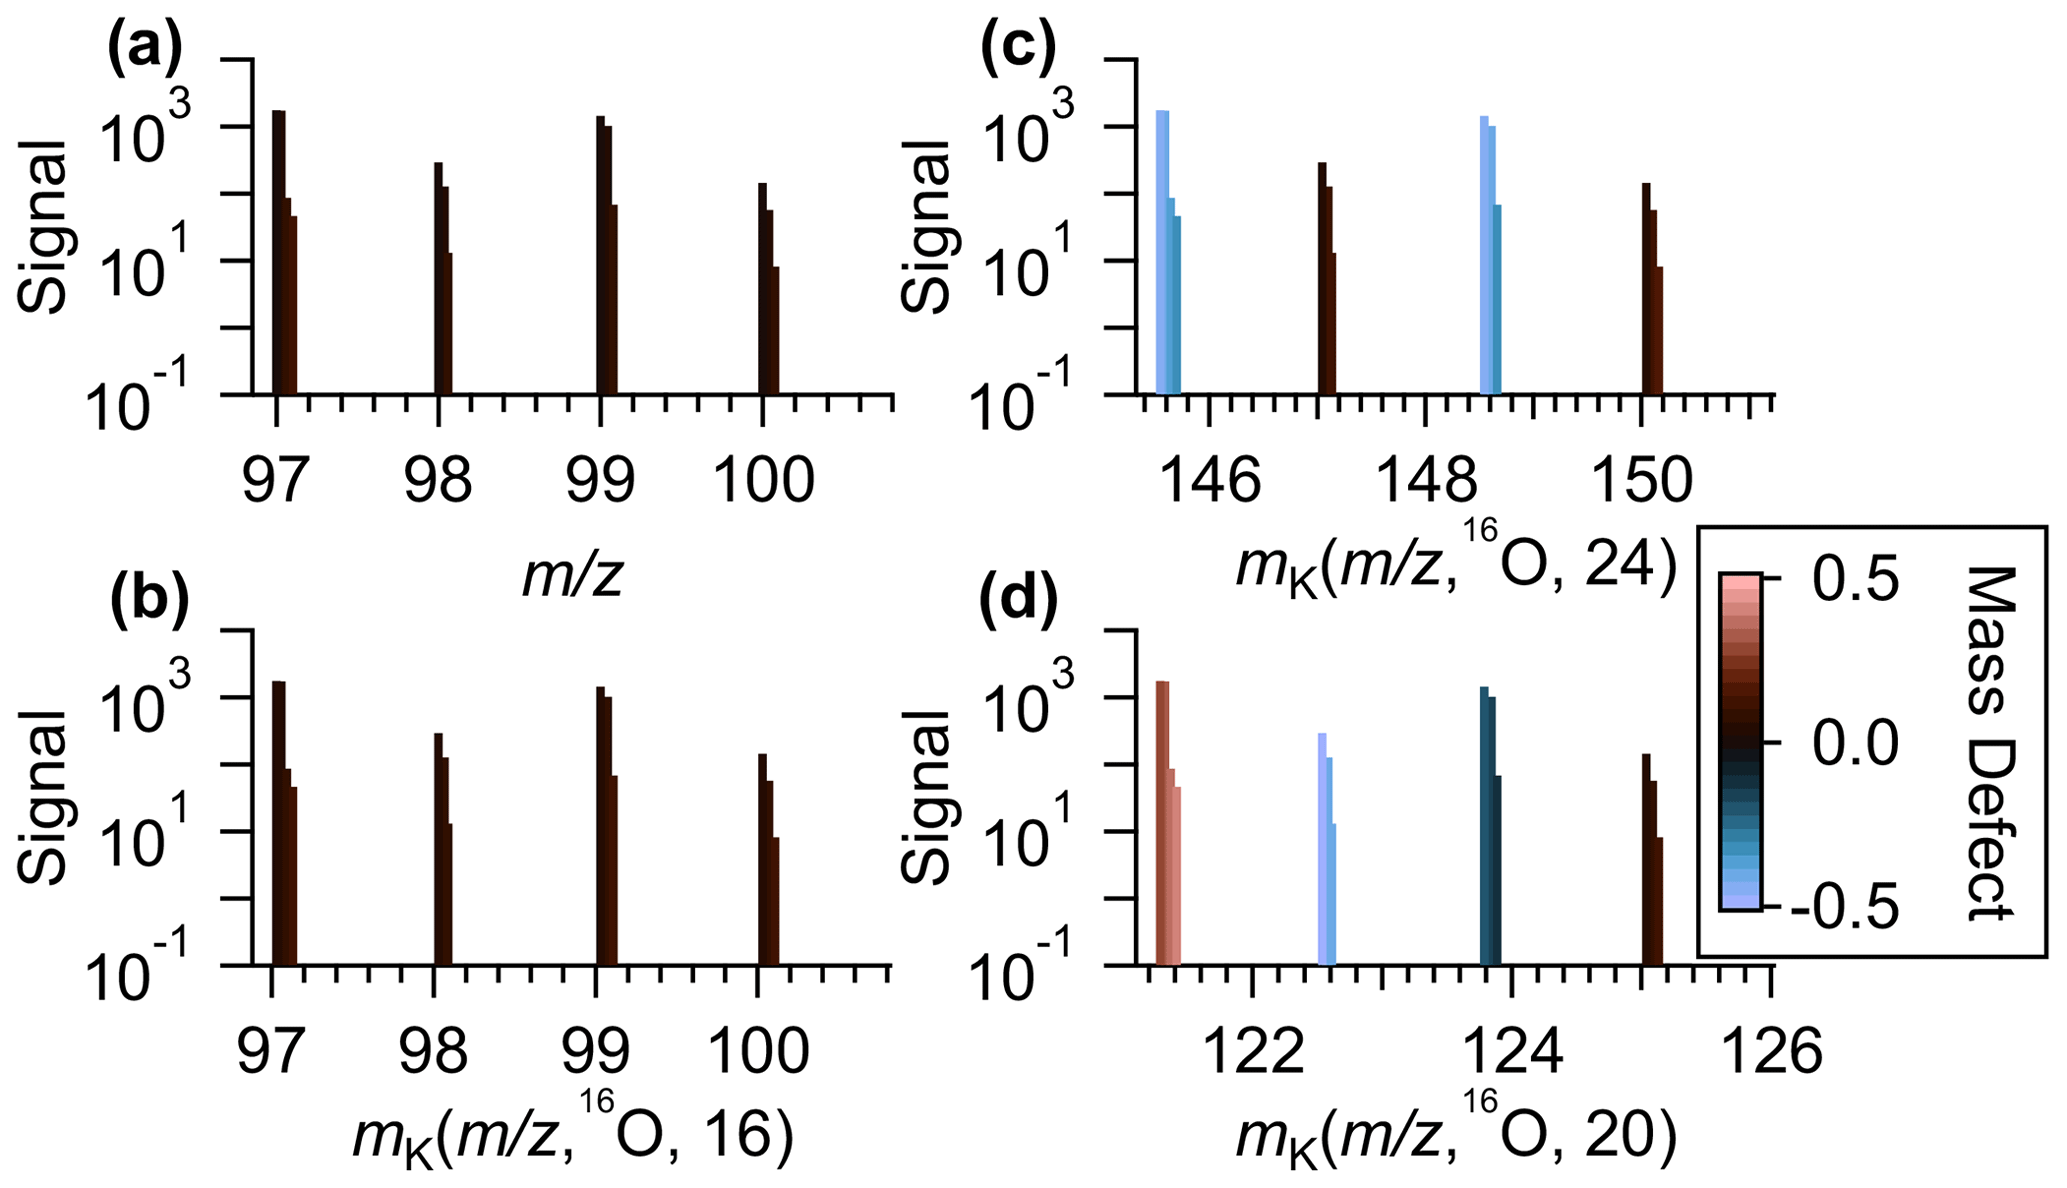
Figure 2(a) An example section of a mass spectra of ambient data measurements plotted against the IUPAC mass-to-charge values. (b) The same series of identified peaks plotted against Kendrick mass with a base unit of 16O and X = A(16O) = 16, (c) generalized Kendrick mass with R=16O and X=24, and (d) generalized Kendrick mass with R=16O and X=20. In all plots, the identified ions are colored by the mass defects after the mass transformation.
By separating even and odd nominal IUPAC masses into different regions, the GKA (, 6O,24) visualization provides information on chemical composition not available with a standard KMD plot. Specifically, for de-isotoped data sets comprised of compounds following the nitrogen rule, the two groups will represent compounds with odd or even/zero nitrogen atoms. For atmospheric chemistry measurements, compounds with two or more nitrogen atoms are usually minor (both in abundance and in number of species) compared to compounds with no nitrogen atoms, and thus the GKA with of provides visual information on nitrogen- versus non-nitrogen-containing compounds. A notable exception would be situations in which organic dinitrates are abundant. In our data, we identified only 15 compounds (3 % of the total number of ions included in analysis) that contained two nitrogen atoms. Although other methods can be used to separate even and odd (masking, making multiple plots, etc.), GKA can separate the even and odd masses on the same plot, making comparisons between the groups of ions simpler.
One can intuit how the choice of R and X affects the degree of expansion through inspection of the approximate reduced fractional value of . The reciprocal of the denominator of the reduced fraction represents the fractional mass intervals IUPAC integer masses are transformed into. As such, the number of groupings from a certain transformation is the numerical value of the denominator. Note that the reduced fractional value of does not determine the amount of contraction or expansion of the mass defects but rather determines the number of individual groupings of related ions. For instance, for R=16O and X=8 or 24, the approximate fractions are and , and thus interval IUPAC masses will be transformed to half-integer and integer GKA masses (Fig. 2c), resulting in two groupings. Figure S3 shows the results of of for other choices of R. For R=16O and X=4, 12, or 20, the approximate reduced fractions are 1/4, 3/4, and 5/4, respectively, and all these choices will transform even IUPAC integer masses to integer or half-integer GKA values and odd IUPAC integer masses to quarter and three-quarter integer values (Fig. 2d). Thus, GKA values will roughly start around 0.0, ±0.25, and ±0.5, and this transformation results in four “groupings” of GKA values (Fig. 3a). Although four groupings will result for X=4, 12, or 20, the exact GKA value of a given ion will depend on X. Likewise, R=16O and X=2, 6, 10, or 14 will result in eight groupings, with the groups representing alternating even and odd integer IUPAC masses. When the denominator of the reduced fraction is large, as would happen for X=17 with R=16O (a reduced fraction of ), the groupings overlap significantly (Fig. 3b). For odd denominators, such as those encountered for R=12CH2 with X=8 (approximate reduced fraction of ), the groups will no longer correspond to even/odd integer IUPAC masses but rather a different metric, and thus the GKA visualizations will provide alternate but complementary information. Despite the limitations in these last two examples, visualization can still be improved compared to a traditional KMD plot, since the homologous series will be separated more clearly into individual horizontal lines, as seen in Fig. 3b. These other scaling factors may be useful when looking at spectra with fewer identified ions, as separating horizontal homologous ion series can be more useful than creating groupings of ions with the same number of nitrogen atoms or other grouping criteria.
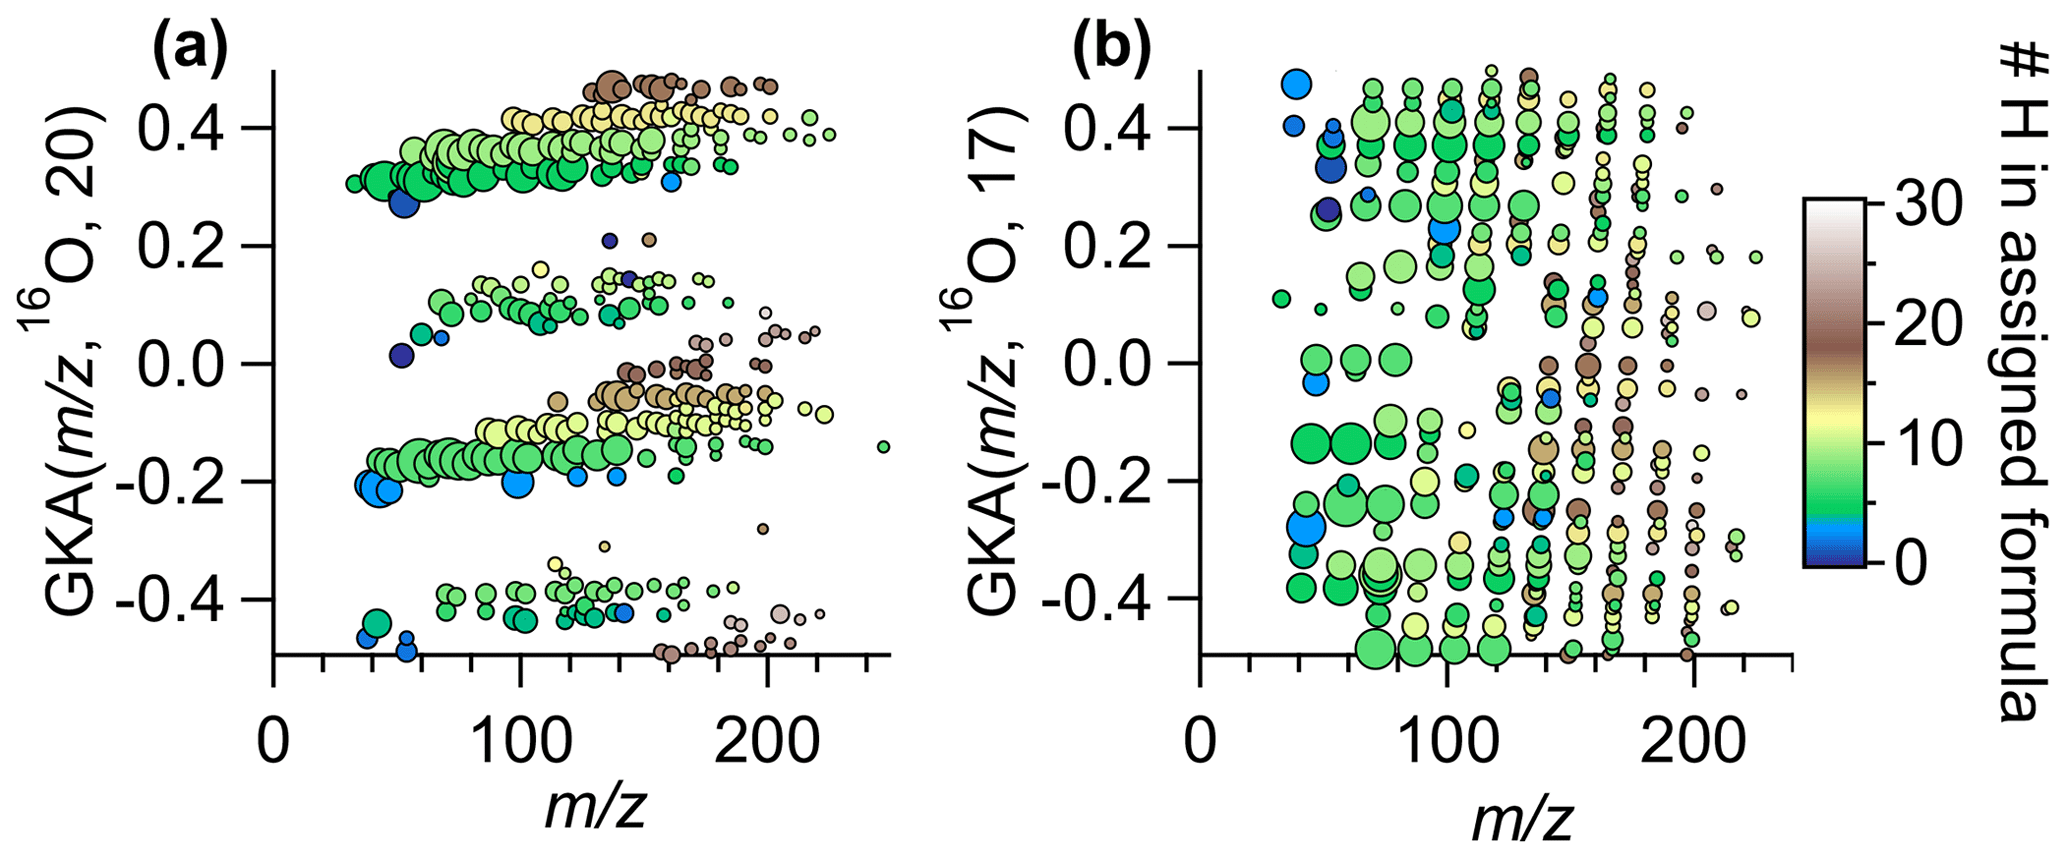
Figure 3GKA plot of data obtained from Vocus ambient measurements (same data as Fig. 1) with a base of 16O and (a) X=20, (b) X=17. The points are colored by the number of hydrogens in the assigned formula and sized by the log of the measured intensity. Figure S4 shows this same transformation but zoomed into a small section to show how the chemical formulas of the ions in a horizontal line are related.
The numerator of the reduced fraction is important for understanding the degree of expansion/contraction of the mass scale. At low numerator values, the mass scale contraction reduces the spread of GKA values around a given nominal IUPAC mass, while higher numerator values increase the spread (Fig. 4). At sufficiently high values of X, “aliasing” or “wrap-around” is introduced (+0.5 is transformed to −0.5), which can be seen in Fig. S5 when X=20 around –250. Aliasing is non-linear with X and is more common when dealing with divisors that give increased numbers of groupings, thus explaining why X=40 (approximate reduced fraction of ) displays negligible aliasing compared to X=20 (approximate reduced fraction of ; Figs. 4 and S5). As aliasing can complicate the interpretation of the data, it is recommended to either manually anti-alias the data (most applicable for small data sets) or select the X that maximally expands the data in the GKA space while also minimizing aliasing. This can be determined by plotting the defect spreads (difference between highest and lowest GKA(, R, X)) as a function of with various values for X.
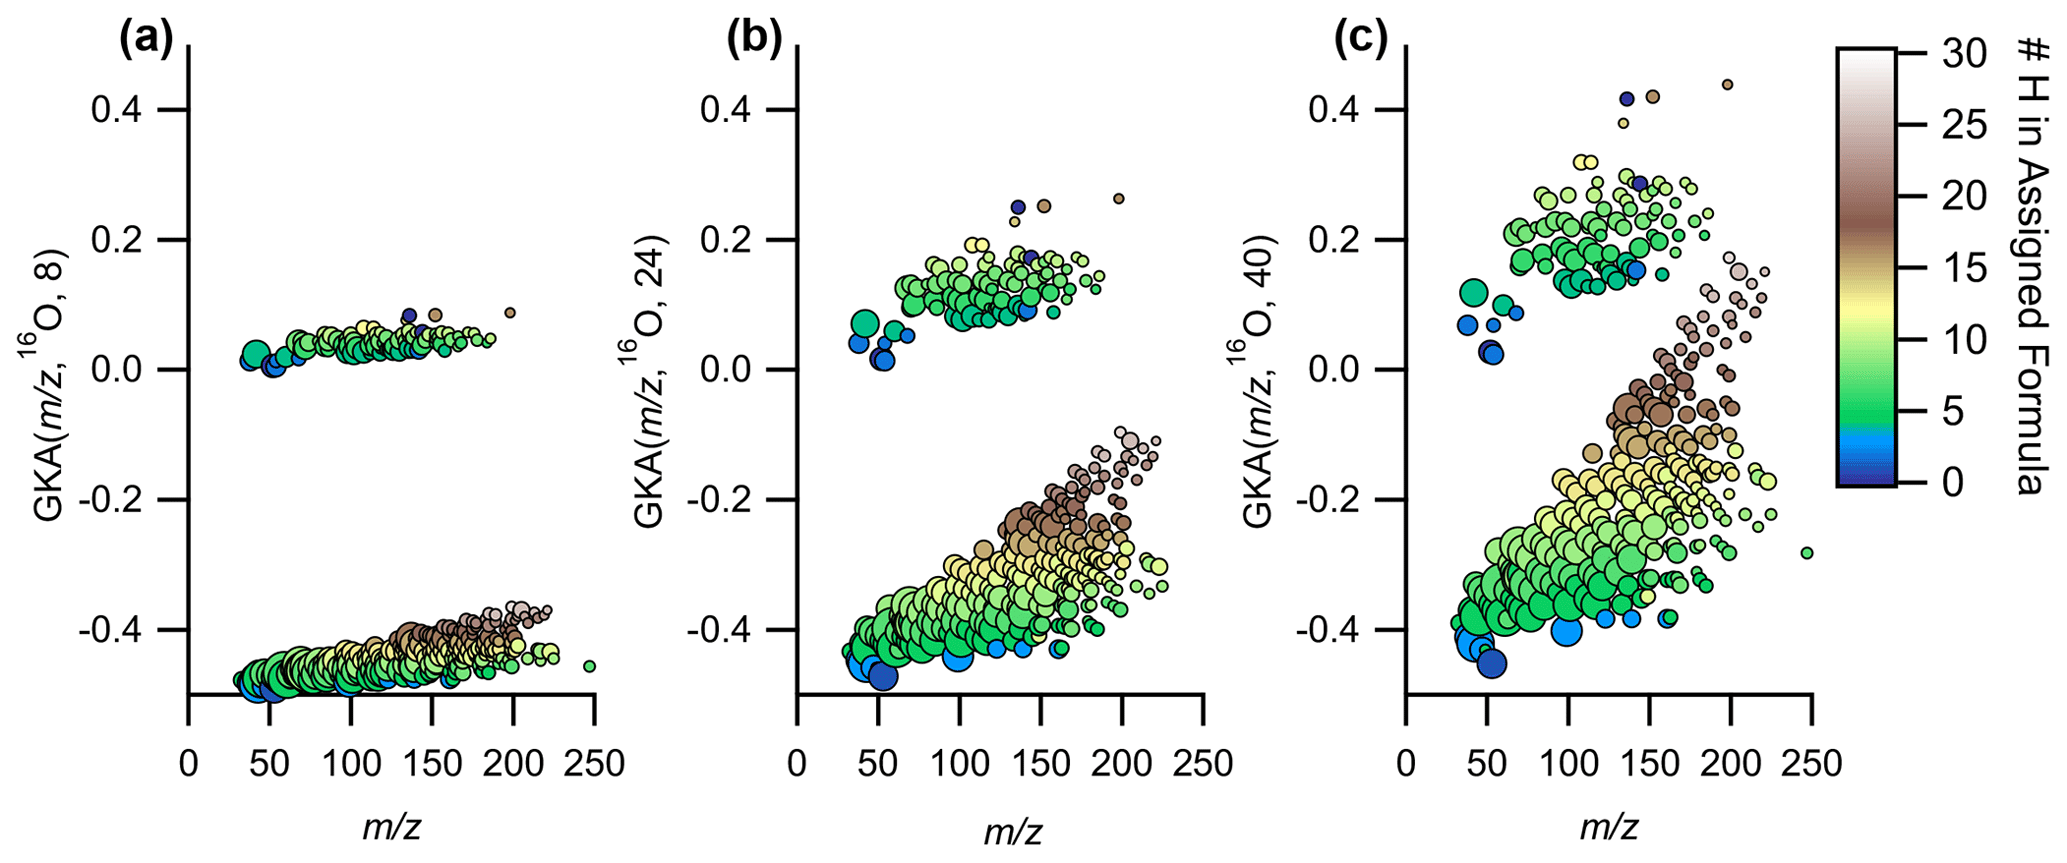
Figure 4Expansion of the same data in GKA space as the values for X are increased, while using 16O as R for (a) X=8, (b) X=24, and (c) X=40. The points are colored by the number of hydrogens in the assigned formula and sized by the log of the measured intensity.
In addition to the even/odd integer IUPAC separation, and corresponding to information on the number of nitrogen atoms discussed earlier, select combinations of X and R provide further information on chemical composition. For instance, for CxHyOzNw compounds for w of 0 and/or 1 and base units of R 16O or 12C, select values of X will lead to grouping of compounds with the same number of hydrogen atoms in the same area of the GKA plot (e.g., Figs. 3a and 4). Moreover, within each grouping of a constant number of hydrogen atoms, each horizontal line will correspond to a constant number of carbon atoms when using a base of 16O or a constant number of oxygen atoms when using a base of 12C. For a base unit of 16O, the number of carbon atoms will increase as one moves towards more positive mass defects, while for the base unit of 12C, the number of oxygen atoms will increase as one moves towards more negative mass defects. The separation by number of hydrogen atoms (and other groupings) is further explained in Sect. S2 and Fig. S6 of the Supplement.
As in traditional KMD analysis, select choices of R provide information on double bond equivalency (DBE), an estimation of the number of double bonds (or degrees of unsaturation, including rings) in an elemental formula shown in Eq. (7):
where c, h, and n are the number of carbon, hydrogen, and nitrogen atoms in the formula, respectively. For R of 16O or 12CH2, horizontal lines correspond to constant DBE, while for 12C, DBE will increase, moving from left to right across a horizontal line.
3.3 Improved visual alignment of homologue ion series
Figure 5a and b show an example of the improved visual alignment of homologue ion series. Both panels contain the same number of points, with ∼50 % of the points identical in both panels. The horizontal alignment of the points is visually clearer with GKA(, 16O, 24) compared to the normal KMD(, 16O). The apparent improvement in alignment results from the increased vertical spacing between the different horizontal lines. This increase in spacing is achieved by increasing the mass defect range occupied by the data and by moving the masses at +1 to a different area of the GKA(, 16O, 24) plot. Once the identified ions are separated into related groupings, using the software tool presented here, a subset of these ions can be easily selected and re-analyzed with a different R and X, as will be discussed in Sect. 3.4, providing more in-depth information about a specific subset of ions.
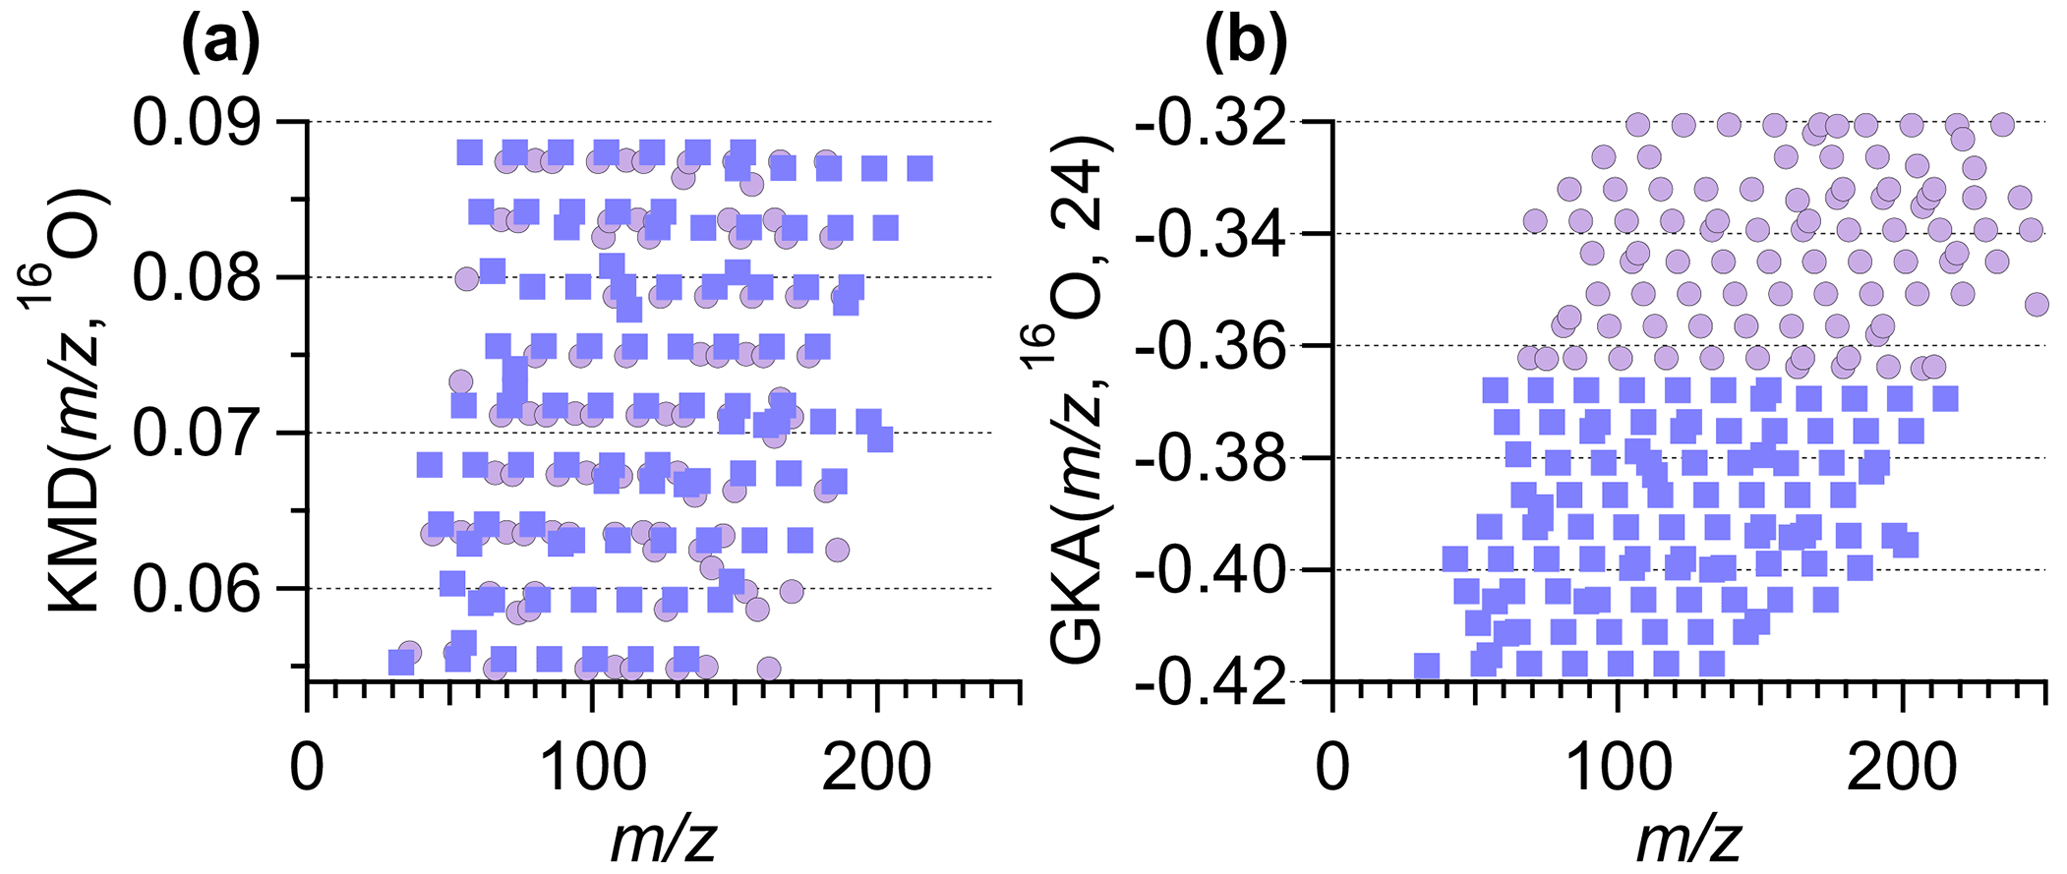
Figure 5A zoomed-in section of the (a) KMD plot from Fig. 1a and (b) the GKA plot from Fig. 1b. Both subpanels contain the same number of total points. The square purple points correspond to the same ions in the subpanels. The circle lilac points represent ions unique to each subpanel. Note the different y-axis range in each subpanel.
3.4 GUI for GKA in Igor Pro environment
The data in this work were analyzed using a graphical user interface (GUI) we built that operates inside the Igor Pro environment (Wavemetrics, Lake Oswego, OR; Igor Pro v9 and above). The GUI allows the user to select a data set to perform GKA analysis with the R and X of their choice. The code currently has 12CH2, 16O, 14N, 12C, and isoprene (C5H8) available to choose from, though other bases can be added to the list by small modifications to the code. The GUI also provides optional inputs for intensity data for sizing and/or coloring of the points made in the GKA plots. The GUI allows interactive point filtering by providing an option for the user to draw a polygon around a set of points and recalculate the GKA plot on just those points, with the option of using a different R or X for the analysis. Filtering options are included to remove the points with the largest and smallest signals for easier visualization. The code for the GUI is available for download as part of the Supplement with any future updates stored on GitHub, with more information in Sect. S3 and Fig. S7 in the Supplement.
4.1 Visualizing composition
To explore the utility of GKA, we delve further into the data collected in Billerica, MA, presented in the previous sections to show how homologous ion series alignments can be used. Ions were assigned based on high-resolution fully constrained peak fitting (Cubison and Jimenez, 2015; Stark et al., 2015), though this analysis technique works without prior knowledge of the molecular formulas, just the exact measured (and mass with knowledge of the charge). High-resolution fully constrained peak fitting can possibly aid in determining if a peak assignment is missing from the measured data; however, this becomes more difficult at higher and with higher complexity samples (Timonen et al., 2016; Cubison and Jimenez, 2015). An example of the peak fitting has been demonstrated previously (Cubison and Jimenez, 2015). In Fig. 6, the GKA plots of the ambient data collected in Billerica, MA, are shown, with points colored by the percent change in intensity of the signal between morning and evening. For this analysis, we focus on early morning and late afternoon as times when emissions, photochemistry, and dynamics are known to be different. The ions plotted are limited to those which satisfy the following conditions: (1) have an average intensity above 1 count per second (cps), (2) change more than 30 % between the morning and evening, and (3) are not the primary reagent ions. The percent difference is calculated as the difference between the morning and evening integrated intensities divided by the intensity in the morning, leading to positive values reflecting an increase in signal in the afternoon compared to the morning. As some ions have intensities of 0 ions s−1 in the morning, the percent change can be undefined; therefore, points with percentage increases greater than 250 %, including undefined increases, are the same color.
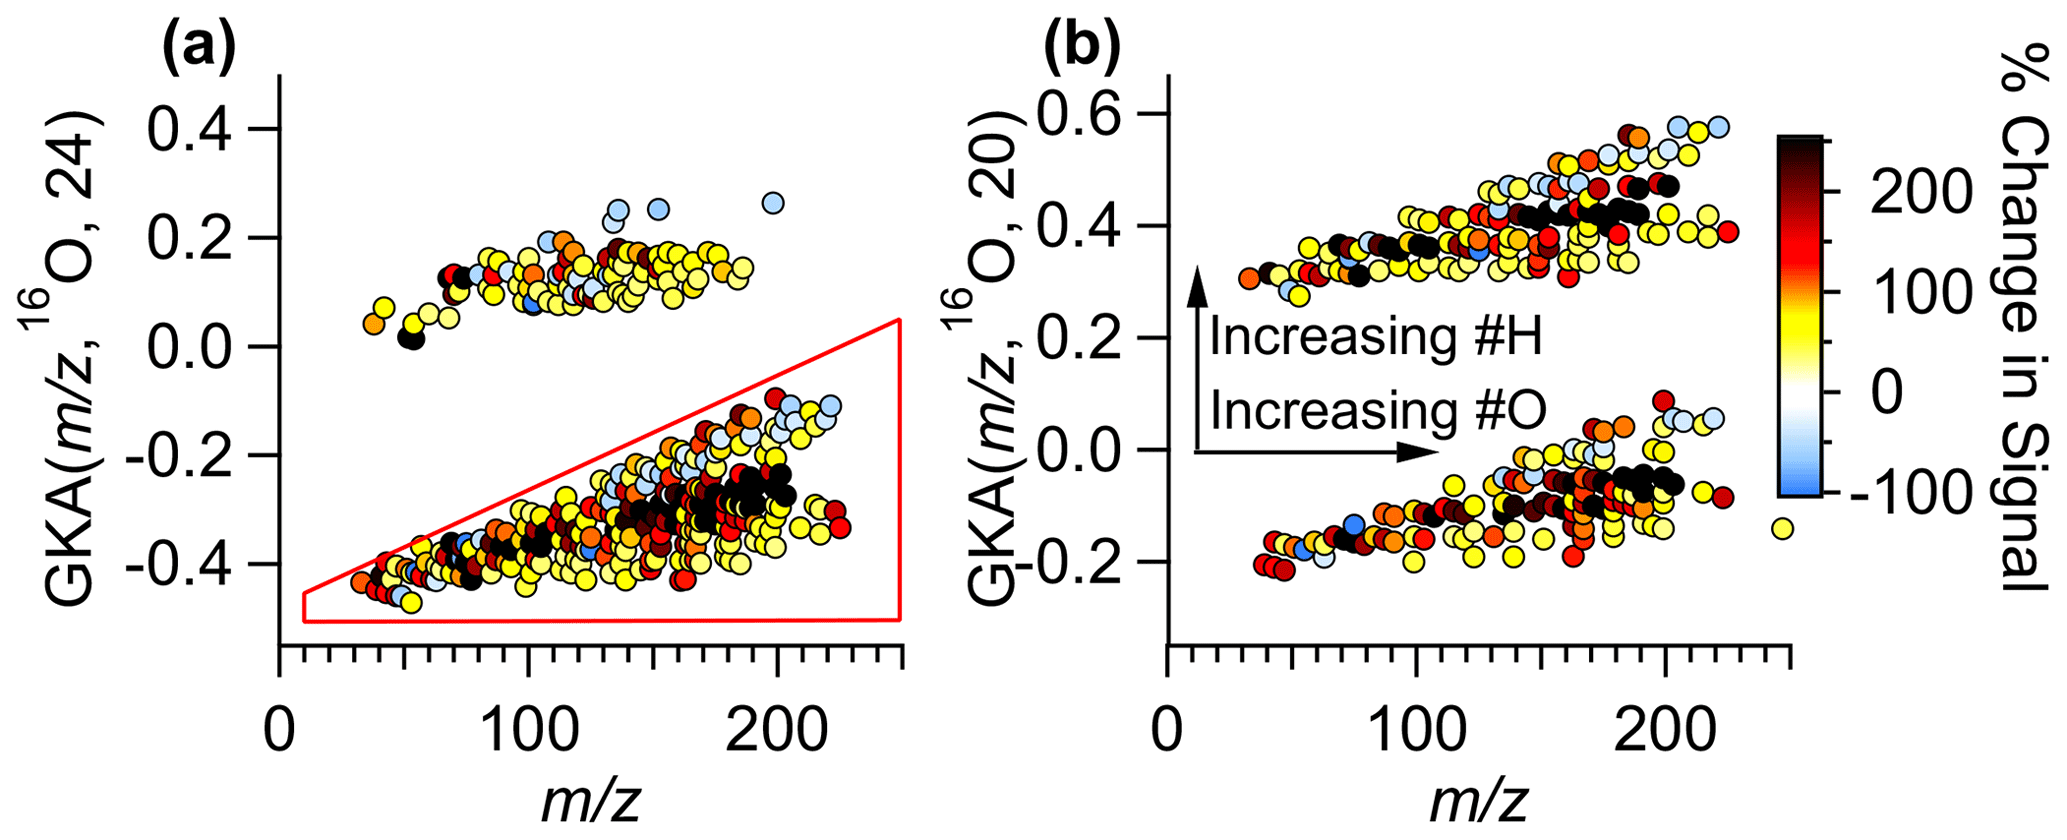
Figure 6(a) GKA plot using X=24 with a 16O base. Points are colored by the percent change in the signal between the morning and evening during 1 d of measurements. (b) Using the points selected with the polygon tool in the GUI, the GKA plot is remade using X=20. The arrows correspond to the changes in an individual grouping. Another split is created when re-calculating GKA with a different X based on the number of hydrogen atoms in the formulas. Note that manual anti-aliasing has been applied in panel (b) to keep related ions together.
Figure 6a shows that the points at the center of each of the groups increase the most (colored black), while those with slightly higher or lower GKA (, 16O, 24) increase less or even decrease. Additionally, as this divisor separates odd and even , this plot also shows that the odd ions, consisting of (CxHyOz)H+ compounds and compounds with an even number of nitrogen atoms (assuming closed electron shell molecules ionized via proton transfer), have the largest fractional increase. Using the polygon selection tool in the GUI, we can re-perform the GKA analysis on just the CxHyOz compounds (and the 15 identified CxHyOzN2w compounds). Figure 6b shows the results of performing the GKA analysis on this subset of data using a different X, in this case, 20. Note that manual anti-aliasing has been applied. With an approximate reduced fraction of , this new transformation would nominally result in four groupings; however, since only ions with odd nominal IUPAC were included, only two groupings are visible. These groupings are separated by ∼ 2 amu in IUPAC space, and, as such, chemical formulas will be related by the addition of two hydrogen atoms. For instance, C7H10O5H+ will be in the lower group, while C7H12O5H+ will be in the higher group, with GKA (, 16O, 20) values of −0.105 and 0.415, respectively. Arrows are included to show the transitions between chemical formulas within the groupings. This plot shows that the most reduced species (those at the top of each grouping) decrease the most between the morning and evening hours. Some of the signals that increase the most have 5, 9, or 10 carbon atoms, suggesting they could be from isoprene or monoterpene oxidation over the course of the day. Some specific formulas (and potential identifications) that increase are (C5H8)H+ (isoprene, an isomer, or an ion fragment), (C5H10O4)H+ (a monosaccharide), (C9H14O4)H+, and (C10H17O4)H+ (possible monoterpene oxidation products). These ion signals could correspond to the emission and oxidation of biogenic compounds, such as terpenes, which are anticipated to increase as biological activity and atmospheric oxidation occurs. Relatedly, the compounds that increased the most have either 9, 11, 13, or 15 hydrogen atoms in the assigned formulas, including the proton from ionization. This analysis can aid in understanding general atmospheric chemistry and how oxidation affects molecular structures and saturation in a bulk method.
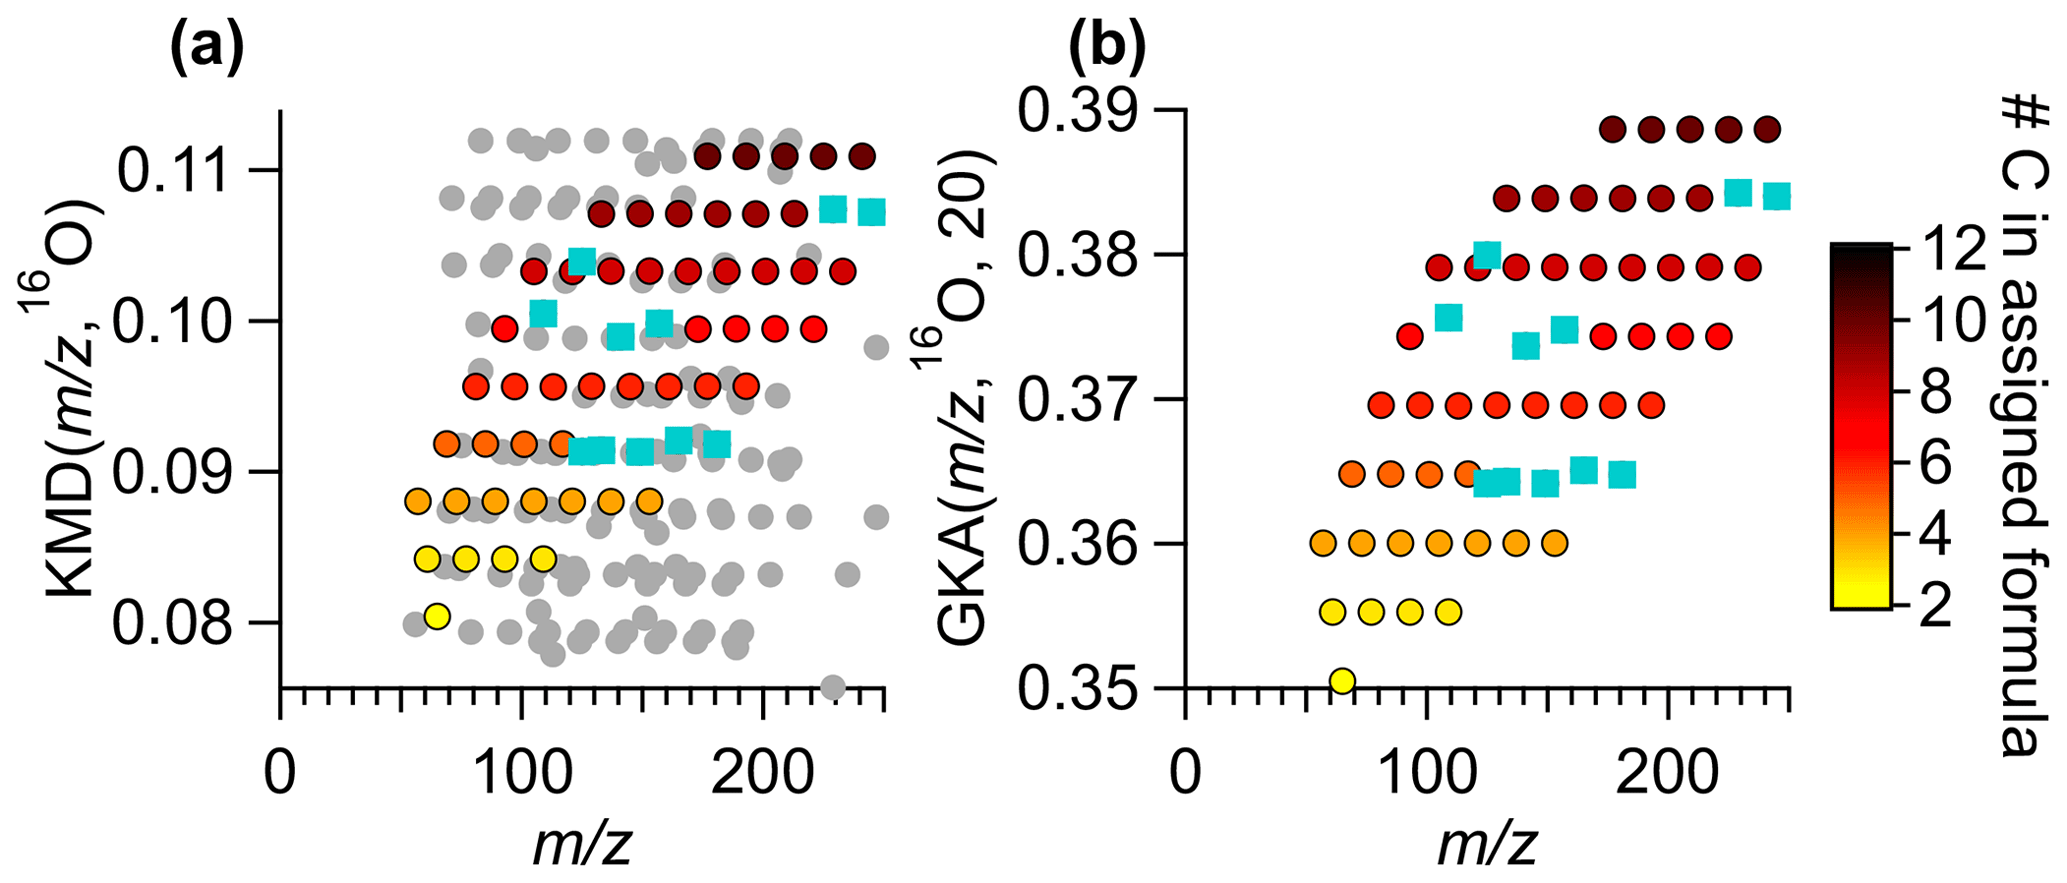
Figure 7A subset of the ambient Vocus data in (a) a KMD plot with base 16O and (b) a GKA plot with base 16O and X=20. Colored points are the same ions in both subpanels, circles are colored by the number of carbon atoms in the formula. Ions that were removed and then re-added using Tofware's built-in peak addition, with no human intervention to improve the fitting, are shown by blue squares. The grey points are points that appear within the field of view in panel (a) are due to the compression of the KMD space a normal analysis uses. The grey points are not removed from panel (b), rather they are shifted to a different GKA outside of the range of view.
4.2 Using GKA for chemical formula assignment
By increasing the separation in mass defect space, GKA can aid in chemical formula assignment, particularly when the extension of homologue series is an appropriate tool for aiding in assignment. GKA can also provide insight into potential ion misassignment. Figure 7a shows a normal KMD plot, KMD (, 16O), while Fig. 7b shows GKA (, 16O, 20). The colored points are the same identified ion signals in both figures. The grey points in Fig. 7a are points that appear within the mass defect space using a traditional KMD analysis but are not visible with GKA (Fig. 7b), since they are shifted to another area of the mass defect space. The points are colored by the number of carbon atoms, and all formulas have nine hydrogen atoms in the assigned formula. The turquoise points are assigned ions that were removed then added back into the peak list as “unknowns” with Tofware's automatic peak fitting procedure. This figure shows that there is significantly more overlap with other ions in a KMD (, 16O, 16) plot than GKA (, 16O, 20). The separation of ions can aid in ion formula identification. As horizontal lines are made for ions with an increasing number of 16O atoms in the formula and the same number of hydrogens and carbon atoms, identifying missing ions is a simple matter of adding or subtracting an O atom from the adjacent formula to find the missing ion. These horizontal relationships can be useful for automatic or semi-automatic ion identification in the future. Note that the homologous ion series are still present in Fig. 7a but are just visually more difficult to see without prior knowledge of the ion identities.
We present GKA as a technique to improve visualization and peak identification in mass spectrometric measurements, particularly for atmospheric measurements. As demonstrated here, this method can aid in the identification of unknown ions and show chemical trends in a clearer manner than traditional Kendrick analysis plots. Additionally, with appropriate selection of X, certain classes of ions can be grouped, such as by the number of hydrogen atoms or the number of nitrogen atoms. Using this separation technique, ions can be more easily characterized and visualized, allowing for easier interpretations and assignments of chemical formulas. This analysis can be used as an initial tool to better understand what ions change more over the course of a measurement, identify which ions are likely misidentified, and facilitate interpretation of the measured chemical composition. We focus on gas-phase atmospheric measurements for our analysis, but GKA can be applied to the mass spectra obtained from aerosol samples, with promise as a tool to understand polymerization products' contributions to aerosol. Additionally, these plots will be beneficial for something like looking at the chemical composition of positive matrix factorization (PMF) factors.
The procedure file containing the code to run the GKA panel in the Igor Pro v9 environment (.ipf) is available at https://github.com/BrowneLab/GeneralizedKendrickAnalysis_Panel (last access: 23 March 2023; Alton et al., 2023a).
The averaged morning and evening mass spectral data used in this manuscript (Alton et al., 2023b) is freely available through the Open Science Foundation website (https://doi.org/10.17605/OSF.IO/WC2KM; OSF, 2023).
The supplement related to this article is available online at: https://doi.org/10.5194/amt-16-3273-2023-supplement.
ECB conceptualized the work. MWA and ECB developed GKA and the applications to atmospheric chemistry data sets. Data were collected by MRC. Code was developed by MWA with guidance from ECB and HJS. All authors have given approval to the final version of the paper. The paper was written by MWA with guidance from ECB.
The contact author has declared that none of the authors has any competing interests.
Publisher’s note: Copernicus Publications remains neutral with regard to jurisdictional claims in published maps and institutional affiliations.
Mitchell W. Alton was supported by the Cooperative Institute for Research in Environmental Sciences Graduate Research Award during this work.
This research has been supported by the Cooperative Institute for Research in Environmental Sciences (graduate fellowship grant).
This paper was edited by Bin Yuan and reviewed by Thierry Fouquet and one anonymous referee.
Alton, M., Stark, H., and Browne, E.: GKA panel, GeneralizedKendrickAnalysis_Panel, GitHub [code], https://github.com/BrowneLab/GeneralizedKendrickAnalysis_Panel (last access: 23 March 2023), 2023a.
Alton, M. W., Stark, H. J., Canagaratna, M. R., Browne, E. C.: GKA Data Availability, Open Science Foundation [data set], https://doi.org/10.17605/OSF.IO/WC2KM, 2023b.
Craig, R. D. and Errock, G. A.: Design and performance of a double-focusing mass spectrometer for analytical work, in: Advances in Mass Spectrometry, edited by: Waldron, J. D., Pergamon, 66–85, https://doi.org/10.1016/B978-0-08-009210-2.50011-0, 1959.
Cubison, M. J. and Jimenez, J. L.: Statistical precision of the intensities retrieved from constrained fitting of overlapping peaks in high-resolution mass spectra, Atmos. Meas. Tech., 8, 2333–2345, https://doi.org/10.5194/amt-8-2333-2015, 2015.
Fouquet, T. N. J.: The Kendrick analysis for polymer mass spectrometry, J. Mass Spectrom, 54, 933–947, https://doi.org/10.1002/jms.4480, 2019.
Fouquet, T. and Sato, H.: Extension of the Kendrick Mass Defect Analysis of Homopolymers to Low Resolution and High Mass Range Mass Spectra Using Fractional Base Units, Anal. Chem., 89, 2682–2686, https://doi.org/10.1021/acs.analchem.6b05136, 2017a.
Fouquet, T. and Sato, H.: How to choose the best fractional base unit for a high-resolution Kendrick mass defect analysis of polymer ions, Rapid Commun. Mass Sp., 31, 1067–1072, https://doi.org/10.1002/rcm.7868, 2017b.
Fouquet, T. and Sato, H.: Improving the Resolution of Kendrick Mass Defect Analysis for Polymer Ions with Fractional Base Units, Mass Spectrom., 6, A0055–A0055, https://doi.org/10.5702/massspectrometry.A0055, 2017c.
Fouquet, T., Satoh, T., and Sato, H.: First Gut Instincts Are Always Right: The Resolution Required for a Mass Defect Analysis of Polymer Ions Can Be as Low as Oligomeric, Anal. Chem., 90, 2404–2408, https://doi.org/10.1021/acs.analchem.7b04518, 2018.
Hughey, C. A., Hendrickson, C. L., Rodgers, R. P., Marshall, A. G., and Qian, K.: Kendrick Mass Defect Spectrum: A Compact Visual Analysis for Ultrahigh-Resolution Broadband Mass Spectra, Anal. Chem., 73, 4676–4681, https://doi.org/10.1021/ac010560w, 2001.
Junninen, H., Ehn, M., Petäjä, T., Luosujärvi, L., Kotiaho, T., Kostiainen, R., Rohner, U., Gonin, M., Fuhrer, K., Kulmala, M., and Worsnop, D. R.: A high-resolution mass spectrometer to measure atmospheric ion composition, Atmos. Meas. Tech., 3, 1039–1053, https://doi.org/10.5194/amt-3-1039-2010, 2010.
Kendrick, E.: A Mass Scale Based on CH2 = 14.0000 for High Resolution Mass Spectrometry of Organic Compounds, Anal. Chem., 35, 2146–2154, https://doi.org/10.1021/ac60206a048, 1963.
Krechmer, J., Lopez-Hilfiker, F., Koss, A., Hutterli, M., Stoermer, C., Deming, B., Kimmel, J., Warneke, C., Holzinger, R., Jayne, J., Worsnop, D., Fuhrer, K., Gonin, M., and De Gouw, J.: Evaluation of a New Reagent-Ion Source and Focusing Ion-Molecule Reactor for Use in Proton-Transfer-Reaction Mass Spectrometry, Anal. Chem., 90, 12011–12018, https://doi.org/10.1021/acs.analchem.8b02641, 2018.
Kroll, J. H., Donahue, N. M., Jimenez, J. L., Kessler, S. H., Canagaratna, M. R., Wilson, K. R., Altieri, K. E., Mazzoleni, L. R., Wozniak, A. S., Bluhm, H., Mysak, E. R., Smith, J. D., Kolb, C. E., and Worsnop, D. R.: Carbon oxidation state as a metric for describing the chemistry of atmospheric organic aerosol, Nat. Chem., 3, 133–139, https://doi.org/10.1038/nchem.948, 2011.
Marshall, A. G. and Rodgers, R. P.: Petroleomics: The Next Grand Challenge for Chemical Analysis, Accounts Chem. Res., 37, 53–59, https://doi.org/10.1021/ar020177t, 2004.
Nakamura, S., Cody, R. B., Sato, H., and Fouquet, T.: Graphical Ranking of Divisors to Get the Most out of a Resolution-Enhanced Kendrick Mass Defect Plot, Anal. Chem., 91, 2004–2012, https://doi.org/10.1021/acs.analchem.8b04371, 2019.
Pourshahian, S.: Mass Defect from Nuclear Physics to Mass Spectral Analysis, J. Am. Soc. Mass Spectrom., 28, 1836–1843, https://doi.org/10.1007/s13361-017-1741-9, 2017.
Sekimoto, K., Li, S.-M., Yuan, B., Koss, A., Coggon, M., Warneke, C., and de Gouw, J.: Calculation of the sensitivity of proton-transfer-reaction mass spectrometry (PTR-MS) for organic trace gases using molecular properties, Int. J. Mass Spectrom., 421, 71–94, https://doi.org/10.1016/j.ijms.2017.04.006, 2017.
Sleno, L.: The use of mass defect in modern mass spectrometry, J. Mass Spectrom., 47, 226–236, https://doi.org/10.1002/jms.2953, 2012.
Stark, H., Yatavelli, R. L. N., Thompson, S. L., Kimmel, J. R., Cubison, M. J., Chhabra, P. S., Canagaratna, M. R., Jayne, J. T., Worsnop, D. R., and Jimenez, J. L.: Methods to extract molecular and bulk chemical information from series of complex mass spectra with limited mass resolution, Int. J. Mass Spectrom., 389, 26–38, https://doi.org/10.1016/j.ijms.2015.08.011, 2015.
Taguchi, V. Y., Nieckarz, R. J., Clement, R. E., Krolik, S., and Williams, R.: Dioxin analysis by gas chromatography-fourier transform ion cyclotron resonance mass spectrometry (GC-FTICRMS), J. Am. Soc. Mass Spectrom., 21, 1918–1921, https://doi.org/10.1016/j.jasms.2010.07.010, 2010.
Timonen, H., Cubison, M., Aurela, M., Brus, D., Lihavainen, H., Hillamo, R., Canagaratna, M., Nekat, B., Weller, R., Worsnop, D., and Saarikoski, S.: Applications and limitations of constrained high-resolution peak fitting on low resolving power mass spectra from the ToF-ACSM, Atmos. Meas. Tech., 9, 3263–3281, https://doi.org/10.5194/amt-9-3263-2016, 2016.
Van Krevelen, D.: Graphical statistical method for the study of structure and reaction processes of coal, Fuel, 29, 269–284, 1950.
Zheng, Q., Morimoto, M., Sato, H., and Fouquet, T.: Resolution-enhanced Kendrick mass defect plots for the data processing of mass spectra from wood and coal hydrothermal extracts, Fuel, 235, 944–953, https://doi.org/10.1016/j.fuel.2018.08.085, 2019.
- Abstract
- Introduction
- Vocus proton transfer mass spectrometer
- Generalized Kendrick analysis – concepts and method
- Example applications of GKA
- Conclusions
- Code availability
- Data availability
- Author contributions
- Competing interests
- Disclaimer
- Acknowledgements
- Financial support
- Review statement
- References
- Supplement