the Creative Commons Attribution 4.0 License.
the Creative Commons Attribution 4.0 License.
 | 21 Jul 2023
Stability assessment of organic sulfur and organosulfate compounds in filter samples for quantification by Fourier- transform infrared spectroscopy
Marife B. Anunciado
Miranda De Boskey
Laura Haines
Katarina Lindskog
Tracy Dombek
Satoshi Takahama
Ann M. Dillner
Organic sulfur and sulfate compounds, which are tracers for sources and atmospheric processes, are not currently measured in national monitoring networks such as the Interagency Monitoring of Protected Visual Environments (IMPROVE). The goal of this paper is to begin to assess the stability of organic sulfur and sulfate-containing compounds on polytetrafluoroethylene (PTFE) filters and the suitability of Fourier-transform infrared (FT-IR) spectroscopy to measure these compounds. Stability assessment is needed because PTFE samples collected by IMPROVE are typically stored 6–9 months prior to analysis. For this study, two organosulfur compounds, methanesulfonic acid (MSA) and hydroxymethanesulfonate ion (HMS), and two organosulfate compounds, methyl sulfate (MS) and 2-methyltetrol sulfate (2-MTS), are collected individually on PTFE filters. Gravimetric mass measurements are used to assess mass stability over time. FT-IR spectra are evaluated to assess the capability of measuring the compound from PTFE filters by assessing the compound stability or chemical changes over time. Ion chromatography (IC) and inductively coupled plasma optical emission spectroscopy (ICP-OES) are used as additional tools to assess stability or chemical changes over time. MS has the highest potential to be measured by FT-IR in IMPROVE samples. For MS, a simple organosulfate, the mass changes are within measurement uncertainty and FT-IR spectra indicate no compositional change over a 4-month period, suggesting that MS can be measured using FT-IR. IC and ICP-OES support the conclusion that MS is stable on the filter. However, for 2-MTS, the other organosulfate measured in this study, spectral changes after a month on the filter suggest that it decomposes into other organosulfates or an inorganic sulfate. MSA in IMPROVE samples can be measured, but only as a lower bound, due to volatility off the filter as indicated by FT-IR and gravimetry. FT-IR and IC both show that MSA does not chemically change over the course of the study. Measurements by all methods indicate that HMS is unstable on the PTFE filter, and IC and FT-IR indicate that it likely converts to inorganic sulfate. Future work includes the evaluation of these compounds in an ambient aerosol sample matrix to determine any differences in stability, identifying interference that could limit quantification, and developing calibrations to measure the compounds or functional groups in ambient samples.
- Article
(4020 KB) - Full-text XML
-
Supplement
(1003 KB) - BibTeX
- EndNote


Organic sulfur compounds exist in particulate form in the atmosphere and can be the result of natural processes (e.g., marine sulfur, volcanic emissions) (Aneja and Cooper, 1989; Bates et al., 1992) or activities of anthropogenic sources (e.g., combustion, sulfur-rich wastewater, smelting) (Grübler, 1998; Smith et al., 2011). Organic sulfur compounds can be categorized as organosulfur compounds such as sulfones (RSO2) and sulfonic acids (RSO having C–S bonds, while organosulfates (ROSO have a C–O–S bond in the structure (Song et al., 2019). Two sulfonic acid compounds, methanesulfonic acid (MSA), a tracer for marine aerosol, and hydroxymethanesulfonate ion (HMS), measured in high haze conditions, along with two organosulfates compounds, methyl sulfate (MS) and 2-methyltetrol sulfate (2-MTS), were selected for evaluation.
Methanesulfonic acid forms from photochemical oxidation of dimethyl sulfide (DMS) (von Glasow and Crutzen, 2004; Kwong et al., 2018a). DMS is a naturally occurring sulfur species produced by marine algae or phytoplankton and is an important precursor of sulfur dioxide, non-sea-salt inorganic sulfate, and organosulfur compounds, including MSA (Barnes et al., 1994; Hoffmann et al., 2016). This makes MSA a tracer for marine aerosol (Allen et al., 1997; Becagli et al., 2013; Saltzman et al., 1986). Ion chromatography (IC) has been used to measure MSA in ambient aerosol collected on PTFE filters (Amore et al., 2022) and nucleopore filters (Allen et al., 2002). MSA has also been measured in water-soluble fractions of ambient aerosol using proton nuclear magnetic resonance (HNMR) (Decesari et al., 2000). Fourier-transform infrared spectroscopy (FT-IR) has been used to characterize liquid and solid MSA in laboratory studies (Lee et al., 2019; Zhong and Parker, 2022; Chackalackal and Stafford, 1966) as has Raman spectroscopy (Zhong and Parker, 2022), but to the best of our knowledge, neither FT-IR nor Raman spectroscopy has been used to measure MSA in complex mixtures like ambient aerosol samples.
Hydroxymethanesulfonate (HMS), formed by sulfite and formaldehyde in the aqueous phase, is a strong acid that is stable at low pH (Seinfeld and Pandis, 2016) and is a tracer for aqueous processes (Chen et al., 2022). During severe winter haze in the North China Plain, HMS was measured using real-time single-particle mass spectrum instruments and filter-based IC methods during periods of high SO2 and HCHO concentrations as well as low oxidant concentrations in particles with high liquid water content (Ma et al., 2020). Very high concentrations of HMS have been measured in Fairbanks, Alaska, during pollution events in a cold, dark, and humid environment (Campbell et al., 2022). In the Interagency Monitoring of Protected Visual Environments (IMPROVE) network, there is evidence of the ubiquitous presence of HMS in ion chromatograms of samples collected at 150 sites in the United States (Moch et al., 2020).
However, HMS can be challenging to measure (Moch et al., 2018). Single-particle mass spectrometry techniques have identified 111 as characteristic for HMS (Chapman et al., 1990; Lee et al., 2003; Song et al., 2019). However, methyl sulfate and other organic sulfur compounds have the same characteristic , which makes quantifying HMS using mass spectrometry challenging (Dovrou et al., 2019; Lee et al., 2003). High-resolution aerosol mass spectrometry (HR-AMS) has been used to measure HMS and organosulfates; however, the majority of compounds mostly fragment into inorganic sulfate and a non-sulfur-containing organic fraction, leading to an underestimation of HMS and overestimation of inorganic sulfate (Dovrou et al., 2019; Song et al., 2019). HMS has been measured in field and laboratory studies by IC (Dovrou et al., 2019; Campbell et al., 2022); however, notable challenges have been documented. HMS and sulfate are not fully resolved in all IC methods (Campbell et al., 2022), leading to poor resolution that can introduce error into the results for both HMS and sulfate (Dovrou et al., 2019; Ma et al., 2020). In IC methods for which HMS and sulfate are well resolved, HMS and sulfite may be unresolved and co-elute with bisulfite (Moch et al., 2018; Wei et al., 2020). Additionally, HMS may degrade to sulfite and formaldehyde at the high-pH eluent used in IC (Moch et al., 2020). Degradation of both HMS and sulfite may occur in aqueous solutions prior to analysis or in the column during analysis, and it is suspected that some of the sulfite oxidizes to sulfate in solution or in the column (Moch et al., 2020). The formation of HMS in the atmosphere occurs at moderate pH, and pH differences between the filter and atmospheric condition (e.g., cloud, fog, pH) can contribute to HMS sample mass loss off the filter, leading to an underestimation of HMS (Moch et al., 2020). With proper columns and eluent composition, IC has been shown to separate HMS and sulfate peaks with only a small underestimation of HMS due to sulfate conversion (Dovrou et al., 2019; Campbell et al., 2022). At least one laboratory study (published in Japanese) has characterized HMS by FT-IR (Sato et al., 1984), but FT-IR has not been used to measure HMS in ambient aerosol samples to the best of our knowledge.
Organosulfates are the most abundant form of organic sulfur compounds in atmospheric particles (Hettiyadura et al., 2015; Stone et al., 2012; Hawkins et al., 2010; Frossard et al., 2011; Olson et al., 2011). Organosulfates are secondary organic aerosols (SOAs) from oxidation of mostly biogenic, but also some anthropogenic volatile organic, compounds in the presence of acidic sulfate (Hettiyadura et al., 2015; Stone et al., 2012; Wang et al., 2021) and have been suggested to be tracers for SOA (Wang et al., 2021; Chen et al., 2021). Organosulfates have been measured in ambient aerosol globally including at four sites in Asia where on average they contribute < 1 % of PM2.5, 2.3 % of organic carbon, and 3.8 % of total sulfate (Stone et al., 2012). In Arctic haze aerosols in the spring, organosulfates contributed to 13 % of organic matter (OM) (Hansen et al., 2014) and contributed to OM at varying levels across the US, with higher levels in summer (Chen et al., 2021). Most studies have used a liquid chromatography method coupled to a mass spectrometer (LC-MS) for measuring organosulfates (Hettiyadura et al., 2015; Wang et al., 2021). FT-IR has been used to measure total organosulfate functional groups (Hawkins et al., 2010), and Raman (Lloyd and Dodgson, 1961; Bondy et al., 2018) and FT-IR (Lloyd et al., 1961) have been utilized to characterize organosulfates in laboratory studies. FT-IR has been used to measure the organosulfate functional group using peak fitting and showed that the organosulfate functional group contributes up to 10 % of organosulfate in the Arctic region, when inorganic sulfate concentrations are considered high (Frossard et al., 2011), and 4 %–8 % of OM in the Pacific marine boundary layer during periods of high organic and sulfate concentrations (Hawkins et al., 2010). Other studies showed few to no organosulfates, likely due to low sulfate concentrations in Mexico City (Liu et al., 2009) and Bakersfield, CA (Liu et al., 2012).
Methyl sulfate is the smallest organosulfate (Kwong et al., 2018b) and measured mostly in trace amounts (Hettiyadura et al., 2017, 2015; Wang et al., 2021). However, it is commercially available and therefore useful for laboratory studies. 2-Methyltetrol sulfates are tracers for secondary organic aerosol (SOA) formation in atmospheric particles derived from isoprene (Surratt et al., 2010; Chen et al., 2020) and one of the most abundant organosulfates measured in ambient aerosol. In the eastern US, 2-MTS accounts for the highest percentage of summertime particulate organosulfate (11 %) (Chen et al., 2021). In Centreville, AL, 2-MTS accounted for more than half of organosulfates during the summer of 2013 (Hettiyadura et al., 2017). In Shanghai, China (summer of 2015–2016, 2018–2019), 2-MTS was the most abundant organosulfate (31 %) of 29 organosulfates (Wang et al., 2021).
The IMPROVE network is a rural particulate matter monitoring network with ∼ 165 sites across the United States (http://vista.cira.colostate.edu/improve/, last access: 7 September 2022). Polytetrafluoroethylene (PTFE), nylon, and quartz filters are used to collect PM2.5 every 1 in 3 d, have a field latency period of up to 7 d, and are analyzed by multiple techniques. PTFE filters are stored at room temperature and analyzed between 3 and 12 months after collection (typically 6 to 9 months) for PM mass, elements, and filter-based light absorption. Recently, FT-IR analysis, a non-destructive method, has been performed on IMPROVE samples to reproduce routinely measured compositional data (Debus et al., 2022) and measure the functional group composition of the organic fraction (Ruthenburg et al., 2014; Kamruzzaman et al., 2018). Organic sulfur compounds and organosulfate functional groups were not measured in these studies. FT-IR analysis has also been conducted on other networks and in chamber and field studies to measure organic functional groups (Boris et al., 2021, 2019; Laurent and Allen, 2004; Ruthenburg et al., 2014; Yazdani et al., 2022; Russell et al., 2011). The extracts of nylon filters have been analyzed by ion chromatography (IC) in the IMPROVE network for more than 3 decades to routinely measure the inorganic ions, sulfate, nitrate, chloride, and nitrite (http://vista.cira.colostate.edu/improve/wp-content/uploads/, last access: 7 September 2022). Although not routinely measured in IMPROVE samples, HMS has been identified in IMPROVE samples using IC (Moch et al., 2020). Organosulfates and MSA have been previously identified in extracts of IMPROVE samples (Chen et al., 2021) using hydrophilic interaction liquid chromatography interfaced to electrospray ionization high-resolution quadrupole time-of-flight mass spectrometry (HILIC-ESI-HR-QTOFMS).
The goal of this paper is to assess the stability of four organic sulfur and sulfate-containing compounds on polytetrafluoroethylene (PTFE) filters and the suitability of Fourier-transform infrared (FT-IR) spectroscopy to measure these compounds in the IMPROVE network. Measuring organic sulfur compounds on a continuous basis across the US would provide a rich data set to evaluate their sources, concentration, seasonality, and trends over time. Four organic sulfur compounds, two organosulfur compounds (methanesulfonic acid and hydroxymethanesulfonate), and two organosulfates (methyl sulfate and 2-methyltetrol sulfate) are evaluated. For these compounds to be measurable in IMPROVE by FT-IR, there must be minimal losses or other changes to the compound during the latency period between collection and analysis (3–12 months), and there must be minimal interference in the spectra. To achieve this goal, each compound was dissolved in solution, aerosolized, and collected on PTFE filters. Collected samples were weighed and analyzed by FT-IR every few days for 2 months or more. Characterization of the FT-IR spectra as well as changes (or lack thereof) in the mass loading and spectra over time indicate the potential for the compounds to be measured by FT-IR in IMPROVE samples. Filter samples, extracted for IC analysis at different time points, indicate stability or chemical changes in the compound on the filter; this assists with interpreting gravimetric mass and FT-IR spectra changes.
Two organic sulfur (C–S) compounds, MSA and HMS, and two organosulfates (C–O–S), MS and 2-MTS, were selected. The four compounds were selected for this study based on the following three criteria. The compound (1) has been measured in atmospheric particulate matter and is of interest to the atmospheric science community, (2) is water-soluble so it can be put into solution for atomization, and (3) is available in high-purity form to minimize uncertainty in mass measurement. Filter samples of the organic sulfur compounds were prepared for FT-IR, gravimetry, IC, and ICP-OES analyses by aerosolizing each compound individually and collecting it on PTFE filters (Pall Corporation, 25 mm diameter). One set of filters was generated for analysis by gravimetry and FT-IR at UC Davis, and another set (or sets depending on what was being evaluated) of filters was generated for analysis by IC and ICP-OES at the Research Triangle Institute (RTI) following gravimetric analysis at UC Davis. Analyses of these laboratory filter samples were performed to characterize the compound within infrared spectra and to determine the stability of these compounds over time.
2.1 Preparation of laboratory filter samples
Three commercially available standards were used for this study: HMS sodium salt (> 97 % purity, TCI America), MSA (100 % purity, Sigma Aldrich), and MS sodium salt (100 % purity, Sigma Aldrich). 2-Methyltetrol sulfate ammonium salt was synthesized following a published method (Cui et al., 2018). Each compound was collected on PTFE filters by first preparing an aqueous solution with a concentration of 0.005 M. For HMS, the solution was acidified with hydrochloric acid (HCl) prior to aerosolization to obtain samples with atmospherically relevant pH (pH 2), as pH plays a role in the stability of HMS. 2 µL of 1 M HCl was added to HMS solution to obtain the final volume of 200 mL for aerosolization. Aerosols were generated using an atomizer (Kamruzzaman et al., 2018; Ruthenburg et al., 2014) and dried with a diffusion dryer (Model 3074B Filtered Air Supply, TSI Inc., St. Paul, MN), which produces a high concentration of polydisperse submicrometer-sized particles allowing for short collection times and adequately representing the expected response from particles of similar size range in the atmosphere. Dry particles were collected on PTFE filters (Pall Corporation, 25 mm diameter) using an IMPROVE sampler with varying collection times (40 to 720 s) at a flow rate of 22.4 L min−1.
2.1.1 Gravimetric mass determination
Filter mass, before and after particle collection, was measured using an ultra-microbalance (XP2U, Mettler-Toledo, Columbus, OH) with 0.1 µg sensitivity. Ionizing cartridges (Staticmaster® model 2U500, Grand Island NY) housed on a flexible stand (Staticmaster® model BF2-1000, Grand Island NY) and Haug strip (Mettler Toledo 11140160, Columbus, OH) were utilized to help eliminate static for more stable, accurate measurements. Prior to particle collection, the mass of a filter was determined by the average of five mass measurements taken on separate days. Only filters that weighed within measurement precision (± 6 µg) for 25 mm filters for the five measurements were used. After particle collection, filters were allowed to achieve equilibrium at room temperature for 24 h. Filters were weighed for 3 consecutive days in the first week, twice per week during the second to fourth weeks, and once in the weeks thereafter. Filters were stored at room temperature (21–27 ∘C) and relative humidity (30 % ± 10 %) to mimic the storage conditions for ambient IMPROVE Teflon filters. The experiment was ended when the weights were stable for a month or more.
2.2 Infrared spectra collection and processing
FT-IR spectra of the filter samples of each compound were collected using a Tensor II FT-IR spectrometer (Bruker Optics, Billerica, MA) with a liquid-nitrogen-cooled mercury–cadmium–telluride (MCT) detector over the spectral range of 4000–400 cm−1. Filters were placed in a house-built sample chamber that is purged of water and CO2 (PureGas) for 4 min before spectra acquisition (Debus et al., 2019). Transmission-mode measurements were made using 512 scans for each filter at 4 cm−1 resolution and ratioed to the most recent (less than 1 h) background spectrum to obtain absorbance spectra using OPUS software (Bruker Optics, Billerica; Debus et al., 2019).
To better visualize functional groups in the organosulfur compounds and minimize the impact of the PTFE scattering and absorption on the spectra, several steps were taken. Spectra were baseline-corrected from 1500 to 500 cm−1 using blank correction and smoothing spline fitting (Kuzmiakova et al., 2016). The spectral region from 4000 to 1500 cm−1 were baselined using an automated version of the Kuzmiakova et al. (2016) smoothing spline process in AirSpec (Reggente et al., 2019). Regions with large PTFE absorption (1300–1100 cm−1, 700–600 cm−1, and 500–420 cm−1) were grayed-out in spectra plots and are not considered for peak identification. A baseline-corrected spectrum of each compound is shown in Fig. S1 in the Supplement.
2.3 IC and ICP-OES sample analysis
PTFE filters of each organic sulfur and organosulfate sulfur compound were generated and weighed at UC Davis prior to shipping the filters cold overnight to the RTI for IC and ICP-OES analysis. On the day the filters arrived at the RTI, the filters were extracted in 50 mL of deionized water (18 MΩ cm−1, Millipore Milli-Q, Darmstadt, Germany), sonicated for 30 min in an ice bath, and placed on a shaker table in a cold room for 8 h prior to analysis. The PTFE filter remained in the extraction vial for the duration of these experiments.
IC analysis was performed on Dionex Thermo Scientific ICS-3000 and ICS-6000 (Sunnyvale, CA) instruments using suppression and conductivity detection. For MSA, extracts were analyzed using the AS19 analytical and AG19 guard columns (anion hydroxide method) for initial extraction efficiency tests and AS28 analytical and AG28 guard columns (hydroxide method) for the subsequent analyses to evaluate changes over time. HMS and MS extracts were analyzed with AS12A analytical and AG12A guard columns (anion carbonate method), which has been shown to provide sufficient separation of HMS and sulfate, but not separation of sulfite–bisulfite and HMS (Dovrou et al., 2019). MS extracts were analyzed with AS12A analytical and AG12A guard columns (anion carbonate method), the same method as for HMS. An IC method for analyzing 2-MTS had not been developed and evaluated prior to this work. Eluent concentrations and flow rates were optimized for best separation of all ions of interest.
ICP-OES, used to measure total sulfur on the filter, was performed on a Thermo Scientific iCAP 7600 duo analyzer (Bremen, Germany). The ICP-OES was run in axial mode using a sprint valve, and data were collected at 180.731 nm. The ICP-OES system was calibrated using the sulfate calibration standards and validated using the sulfate calibration verification solutions described below.
IC and ICP-OES systems were calibrated with calibration standards prepared via serial dilutions of single-source stock standards using a primary source. A secondary source was used to prepare calibration verification solutions to validate the instrument calibration for all compounds except for 2-MTS, for which a second source standard was unavailable.
Primary and secondary sources of National Institute of Standards and Technology (NIST)-traceable solutions were purchased and used to prepare calibration standards and calibration verification solutions, respectively, for sulfate analyses by both IC and ICP-OES. When NIST-traceable solutions were unavailable, salts were used to prepare calibration standards and calibration verification solutions for MSA, HMS, and MS. Vendor information for primary and secondary sources is provided in Table S2. Certified American Chemical Society (ACS)-grade sodium carbonate (Na2CO3) obtained from Fisher Scientific (Fairlawn, NJ) and sodium bicarbonate (NaHCO3) obtained from EMD Sciences (Gibbstown, NJ) were used to prepare IC eluent when using anion carbonate methods for analyses. Potassium hydroxide eluent generator cartridges purchased from Thermo Scientific were used for eluent preparation for analyses conducted with anion hydroxide methods. NIST-traceable, 1000 µg mL−1 stock solutions of yttrium (Y) and cesium (Cs) obtained from High Purity Standards (Charleston, SC) were used to for internal standard and ionization suppression, respectively, for ICP-OES measurements.
3.1 Methanesulfonic acid
3.1.1 Gravimetry
Mass changes, measured by gravimetry, for four methanesulfonic acid filter samples with masses ranging from 64 to 80 µg are shown in Fig. 1. Mass decreases steadily during the first month to approximately 50 % of the initial mass. During the second month of measurements, the mass remains constant (50±6 %).
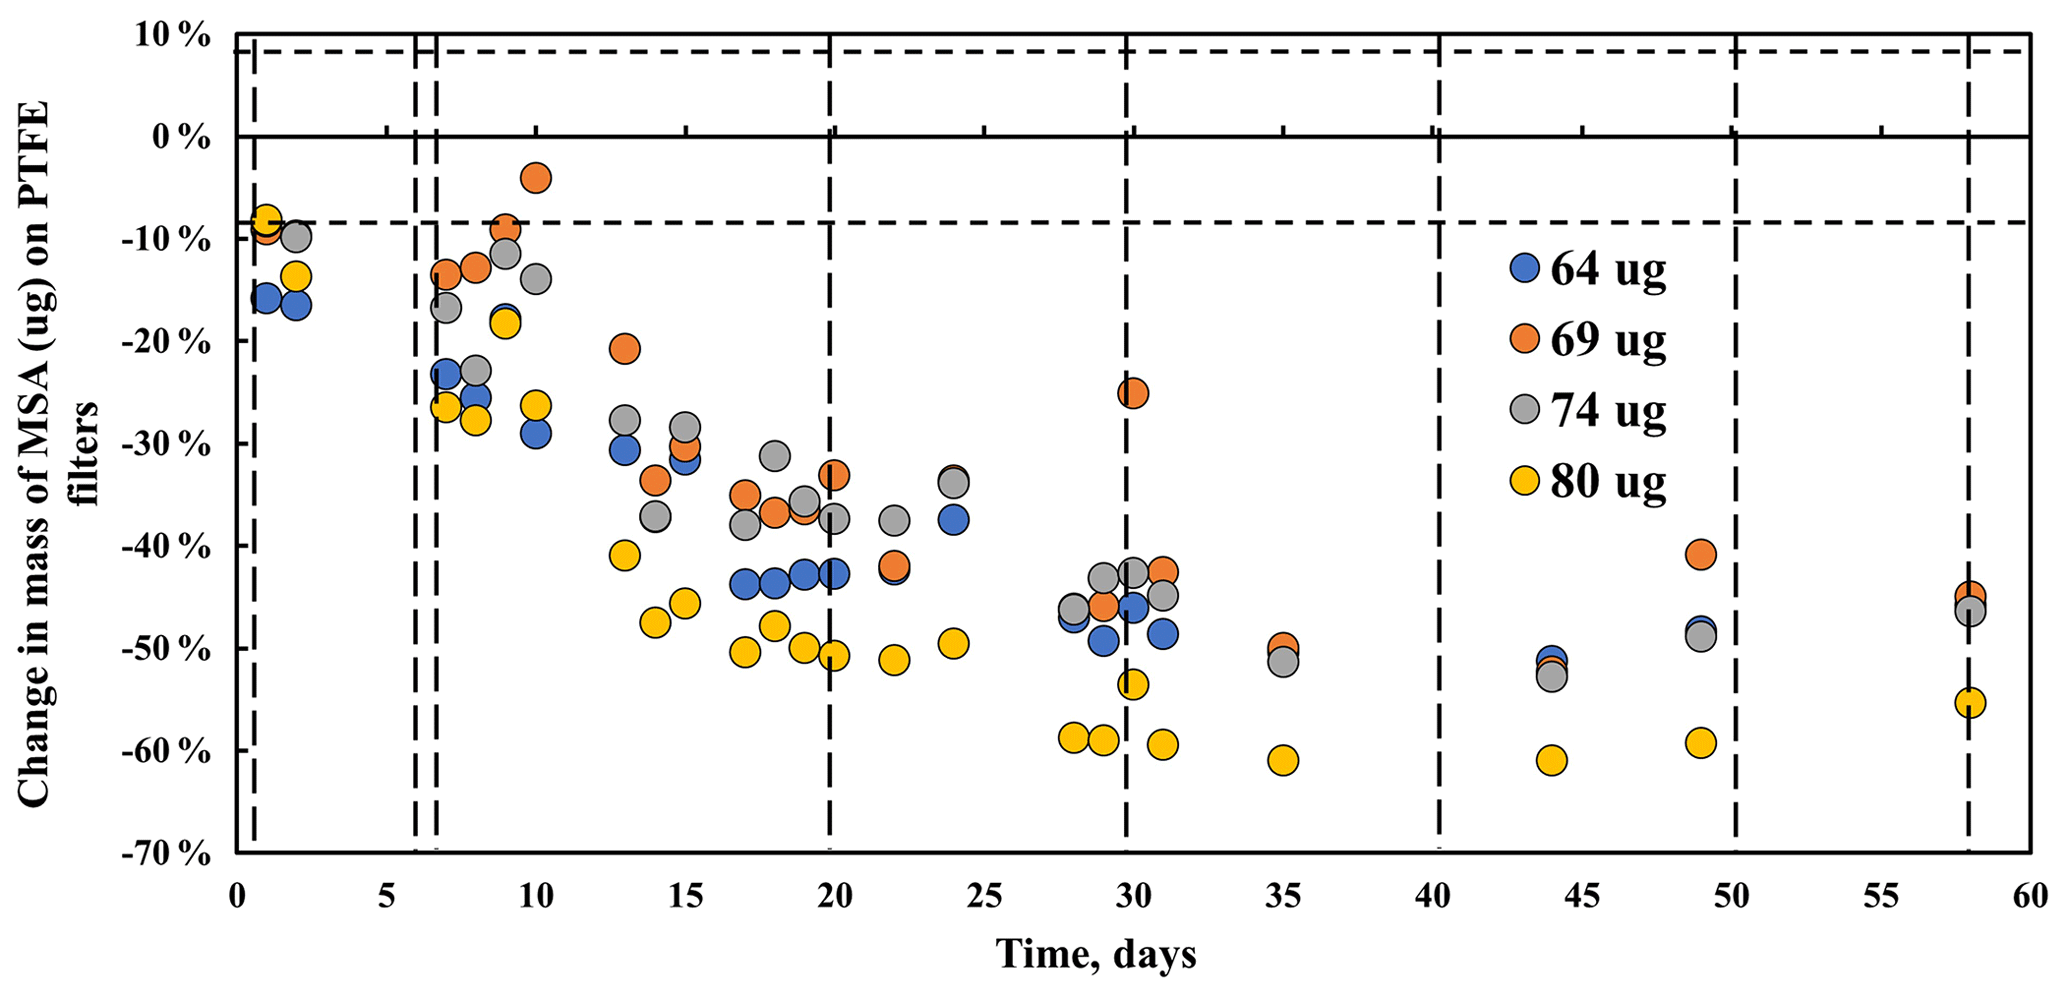
Figure 1Change in mass of methanesulfonic acid (MSA) collected on PTFE filters over a 2-month period under laboratory conditions (24 ∘C). Dotted vertical lines indicate FT-IR analysis. The horizontal broken line indicates mass balance precision. Colors indicate initial masses of samples.
3.2 FT-IR
Methanesulfonic acid (CH3SO3H) is composed of a methyl group attached to a sulfonic acid [S(=O)2–OH] via a C–S bond. Methanesulfonic acid aerosols collected on PTFE filters have peaks associated with CH3, SO3, S–OH, and C–S bonds (Fig. 2). Observed peaks (Fig. 2) can be ascribed to portions of the molecule based on previous FT-IR and Raman work (Lee et al., 2019; Zhong and Parker, 2022; Chackalackal and Stafford, 1966). The peaks at 1342 and 536 cm−1 arise from S = O bonds in MSA and are shifted compared to inorganic peaks at 1130 cm−1 and 620 cm−1 (Larkin, 2018) or organic sulfate SO4 peaks at ∼1380 cm−1 (Larkin, 2018; Lin-Vien et al., 1991). The peak at 895 cm−1 is attributable to S–OH (Zhong and Parker, 2022) and the peak at 766 cm−1 is attributable to C–S (Lee et al., 2019). C–H peaks are observed at 3039, 2951, 1414, and 987 cm−1 (Chackalackal and Stafford, 1966). The broad peak at 3248 cm−1 is suggested to be water as Zeng et al. (2014) showed that this peak in MSA infrared spectra increases with increasing RH. These peaks, particularly strong peaks, were similar to spectral absorbance of MSA from reference spectra (Spectral Database for Organic Compounds, SDBS, 2022), and Table S1 in the Supplement compares the observed and reference peaks.
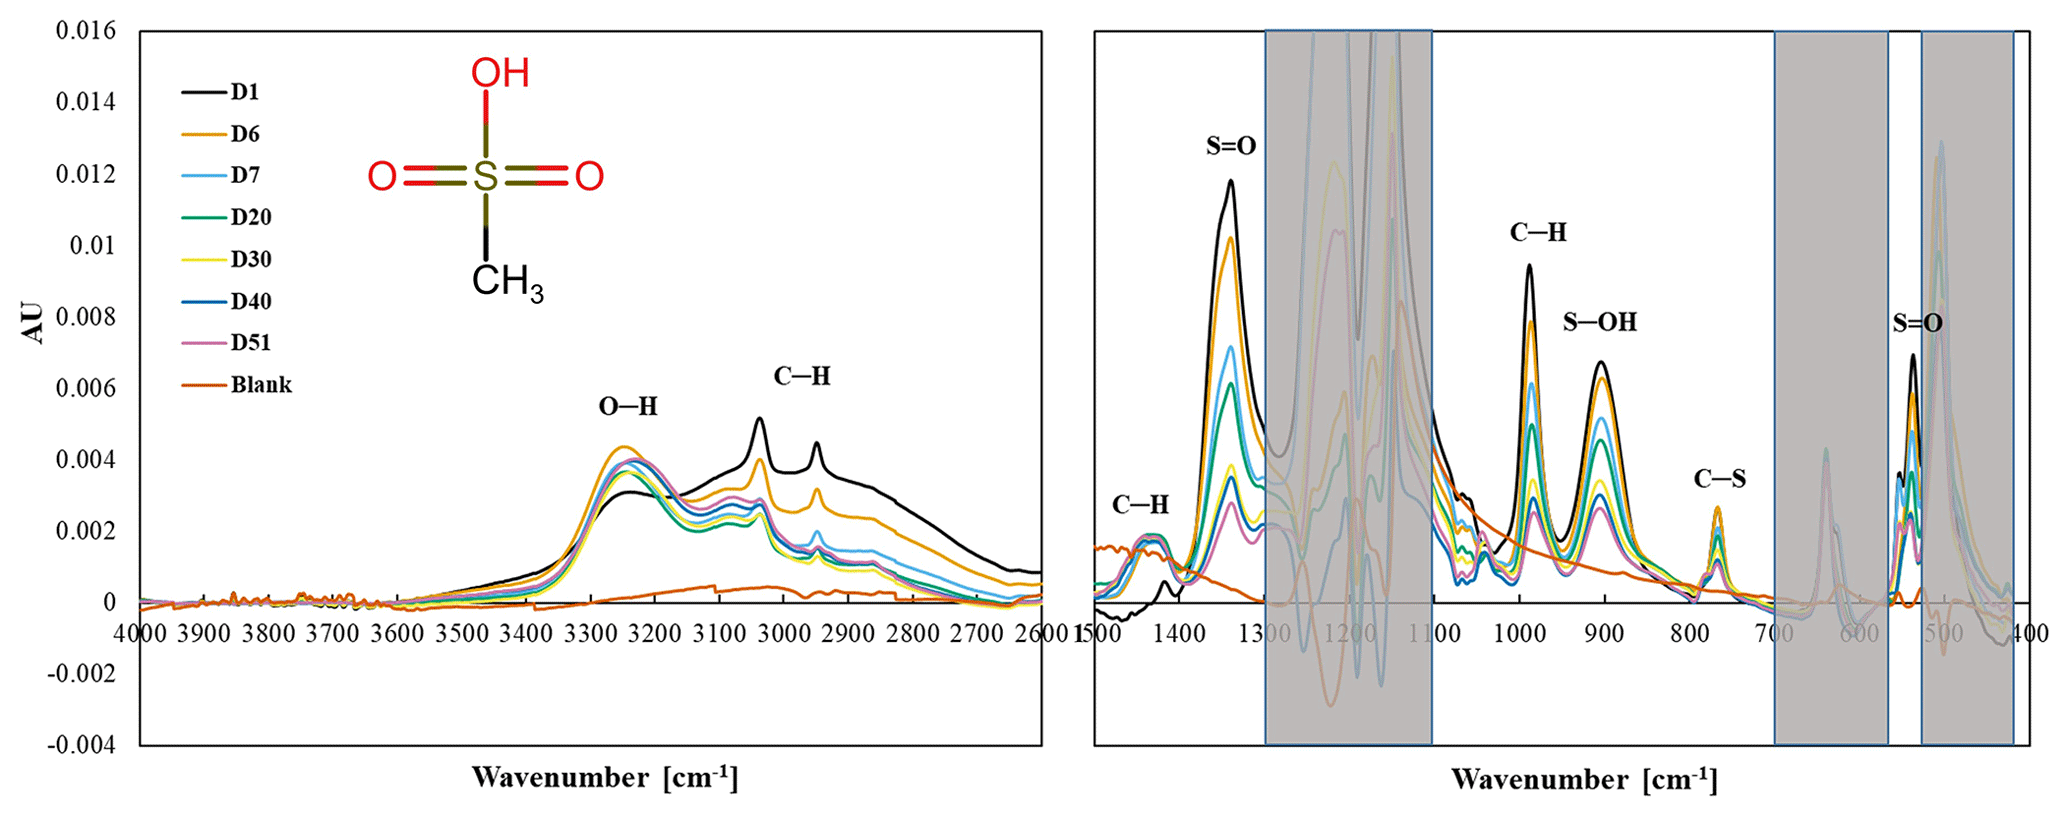
Figure 2Changes in the spectra of MSA over a 2-month period, denoted by the number of elapsed days. The shaded area indicates the absorbance regions of the PTFE filter.
The MSA infrared peaks of SO3 (1342 cm−1), C–H (987 cm−1), S–OH (895 cm−1), C–S (766 cm−1), and S = O (536 cm−1) decrease rapidly in the first 30 d, consistent with the decline in mass during that time. The spectra suggest that MSA is volatilizing off the filter, even though this is inconsistent with the low vapor pressure of MSA (Knovel, 2022), 0.00022 mmHg at 20 ∘C). The three spectra obtained on days 30, 41, and 51 show only small decreases, which is mostly consistent with the lack of mass changes during those days.
Not all peaks show consistent loss during the first month and little change during the second month. The C–H peaks at 3039 and 2942 cm−1 behave slightly differently, reaching stability (with some minor random variability) earlier (day 20) than most other peaks. The weak peak at 1414 cm−1 (ascribed to CH3) increased and broadened to 1445–1400 cm−1 after the initial spectra were collected and remained fairly stable for the duration of the experiment. The peak at 3250 cm−1 increased rapidly, followed by fluctuations, and then varies somewhat but remained fairly consistent for the duration of the experiment, not unlike the behavior of the 1414 cm−1 peak. One possible cause of these changes in the spectra is water vapor condensing on the particles after collection. MSA is hygroscopic, and although it effloresces at about RH = 50 % (Peng and Chan, 2001; Tang, 2020; Zeng et al., 2014), Zeng et al. (2014) show that there is some water associated with the particles below 50 % RH, which is consistent with the FT-IR spectra (Fig. 3), particularly the 3248 cm−1 peak. If water is indeed the cause, the change in the 3248 cm−1 peak can be explained by a very low RH in the particle generation and collection system (lower initial peak) and a higher RH (RH = 30 + 10 %) in the lab (increase in peak). The change in the 1414 cm−1 peak above 1400 cm−1 behaves similarly and can be associated with OH, suggesting uptake of water after the initial FT-IR spectra were collected.
Figure 3Mass behavior of hydroxymethanesulfonate (HMS) over 125 d under laboratory conditions (∼ 24 ∘C). Dotted vertical lines indicate FT-IR analysis. The horizontal broken line indicates mass balance precision.
Another possibility is that ammonia is absorbing onto the MSA. Ammonium absorbs in both the 3250 cm−1 and 1500–1400 cm−1 regions (Boer et al., 2007; Zawadowicz et al., 2015), and when comparing MSA spectra to ammonium sulfate spectra, they show very similar peak absorbance and shapes in these two regions. This suggests that the cause of these peaks is ammonium (Fig. S2 in the Supplement).
A third possible cause of these changes is that MSA may be fragmenting into formaldehyde (CH2O), which partitions into the gas phase, and sulfite (SO3) (Kwong et al., 2018a). However, this would show a decrease in CHC–H peaks and a shift in the SOS = O peaks, neither of which is observed in the spectra. The rapid decrease in peak height during the first month and then little decrease or no trend during the second month suggest that MSA is volatilizing off the filter initially but then has a slow decline, offset by increases in water or ammonium.
3.2.1 IC and ICP-OES
A total of 20 PTFE filters with MSA (14–32 µg; 60–144 µg) were shipped to the RTI for extraction and analysis by IC and ICP-OES. Each extract was analyzed by both IC and ICP-OES. Recoveries of MSA from PTFE filters was 55±5 % for IC and 51±5 % for ICP-OES. Calibration verification solution recoveries were 96±5 % for IC and 101+3 % for ICP-OES analyses, suggesting that the lower recoveries from the PTFE filter are due to incomplete extraction and/or losses occurring during shipment. To evaluate losses during shipping, six samples were collected, weighed, and analyzed by FT-IR, shipped to the RTI, and then sent back to UC Davis and analyzed with gravimetric and FT-IR analysis 9 d after initial measurements. The mass loss (19±7 %) during this period was similar to mass loss for filters that remained in the UC Davis laboratory for ∼ 8 d (22±6 %). Spectral changes in shipped filters were similar to changes in spectra that occurred during the first week for filters that remained at UC Davis. To evaluate changes in mass and composition on PTFE filters over time, six filters (42–63 µg) were shipped to the RTI and extracted on days 0, 30, and 61. These filters had consistent recoveries over time of 57±6 % for IC and 55±6 % for ICP-OES. The IC results indicate that MSA did not change chemically during this time period, supporting the FT-IR spectral results. The mass and spectral data indicate that the lower extraction efficiency was not due to loss of MSA off the filter during shipping and suggest that the limitation is extraction efficiency. Despite low extraction efficiencies and differences in behavior over time from FT-IR measurement, the FT-IR, gravimetry, and IC results suggest that a lower bound of MSA can be measured on PTFE filters in IMPROVE by FT-IR.
3.3 Hydroxymethanesulfonate
3.3.1 Gravimetry
Mass changes in three hydroxymethanesulfonate sodium salt (HOCH2SO3Na) filter samples with mass loadings of ∼62 µg per filter are shown (Fig. 3). Mass decreases steadily for 1.3 months to a maximum loss of 38 % and then remains constant (38±3 %) for the rest of the experiment (4.1 months). Similar results were obtained for filters weighing approximately 30 µg per filter of HMS.
3.3.2 FT-IR
HMS (HOCH2SO3H) is a sulfonic acid compound with a C–S bond, for which the S bond is part of a sulfonic acid group [S(=O)2−OH], and the carbon is attached to an –OH functional group, similar to MSA except with the –OH functional group attached to the carbon. The chemical used in our study has a sodium cation on the sulfonic acid group. HMS aerosols collected on PTFE filters have three infrared peaks (1094, 1041, and 611 cm−1) between 1500 and 500 cm−1, although the peak at 611 cm−1 is obscured by PTFE absorption, and –OH and C–H peaks between 4000 and 1500 cm−1 (Fig. 4).
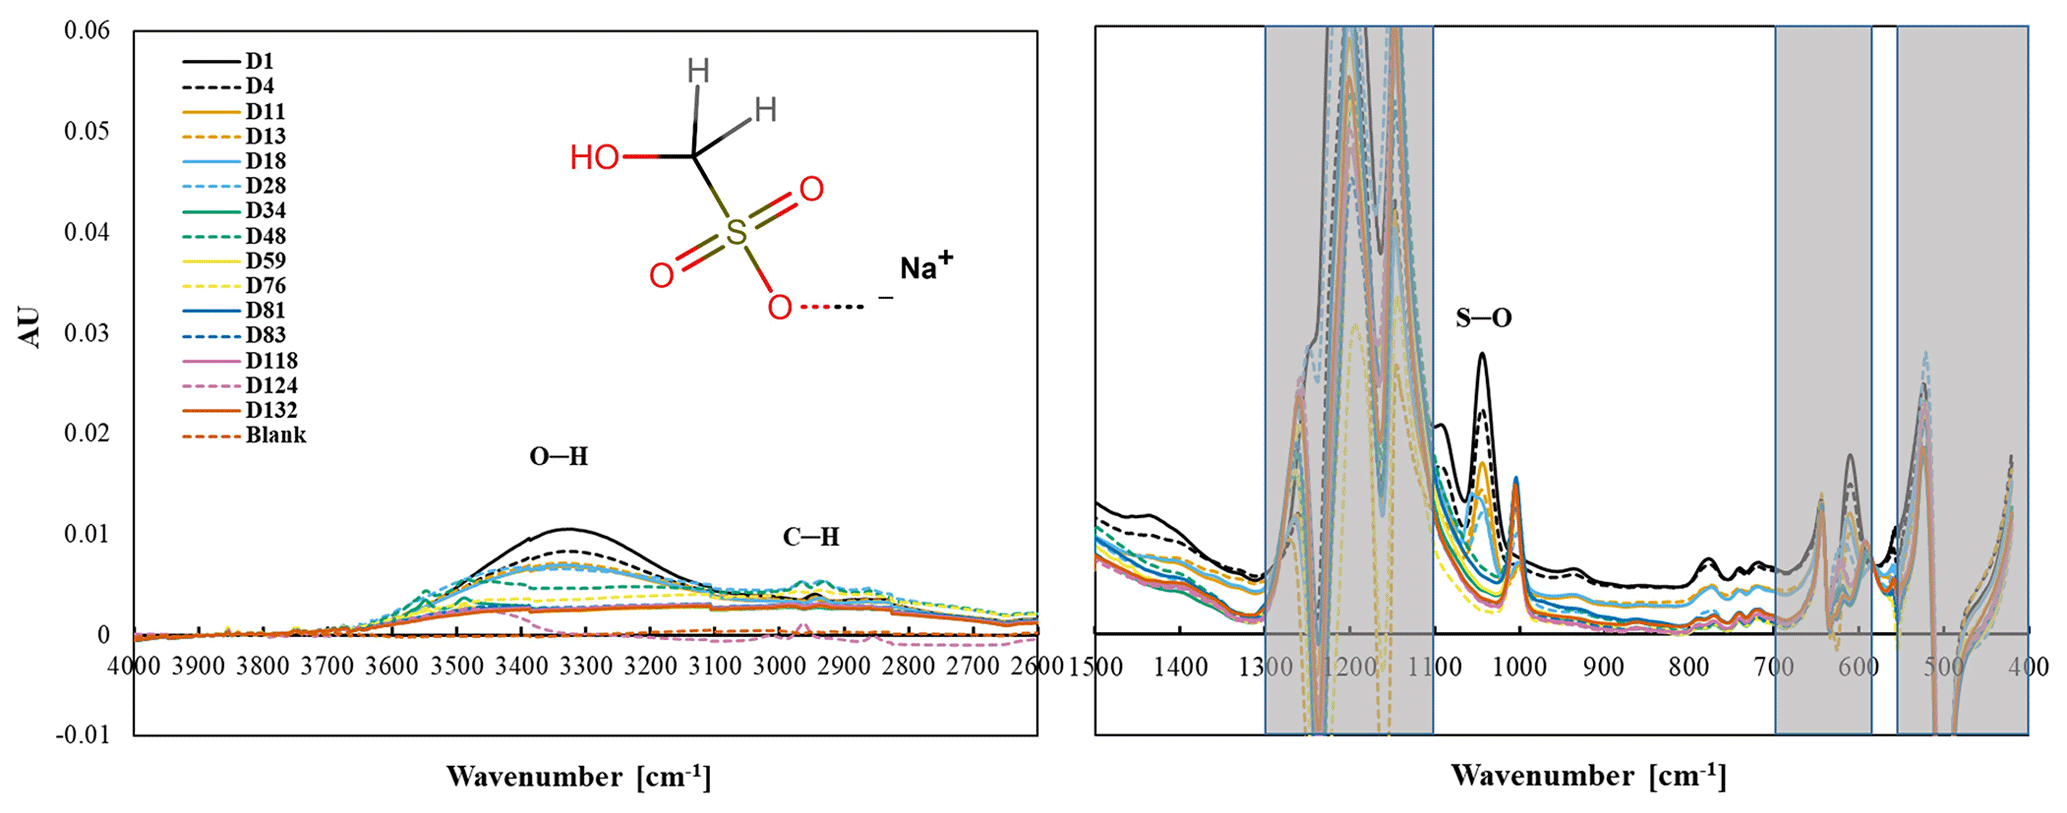
Figure 4Changes in the functional group frequency region of hydroxymethanesulfonate (HMS) over 4.1 months.
Observed peaks at 1094 and 1041 cm−1 are similar to the 1080 and 1040 cm−1 peaks identified as S–O or S = O bonds in FT-IR spectra of Na HMS (Sato et al., 1984) and of HMS (Larkin, 2018; Shurvell, 2006). A weak band at 611 cm−1 is like due to C–S (Lin-Vien et al., 1991; Sato et al., 1984) or S–O (Sato et al., 1984) but is obscured by PTFE absorbance. Above 1500 cm−1 and similar to many aliphatic organic molecules, –OH (broad peak centered near 3300 cm−1) and C–H (below 3000 cm−1) peaks were observed (Pavia et al., 2008; Shurvell, 2006). Observed peaks are similar to spectral absorbance, although not all peaks in the reference spectra (AIST: SDBS, 2022, see Table S1) are observed in the measured spectra. HMS has a very low vapor pressure (0.00000073 mmHg) (U.S. EPA, 2022), indicating that HMS should not volatilize off the filter.
All peaks below 1500 cm−1 decrease and are no longer visible by day 34, consistent with the decline but not the extent of decline in mass as the HMS peaks are completely gone and the mass has only decreased by 40 %. This behavior is most clearly observed in the peak at 1041 cm−1,but also observed in the 1094 cm−1 peak (Fig. 4). Similar to the S–O and S = O peaks, C–H peaks decline during the first 34 d and then completely disappear. The O–H peak, centered around 3300 cm−1, disappears more slowly, but like the S–O and C–H peaks, is gone by the end of the experiment. Counterbalancing the loss of mass, a new peak becomes visible at 1003 cm−1 after 11 d and increases for the rest of the study. The peak at 1003 cm−1 is tentatively identified as bisulfate (Boer et al., 2007; Krost and McClenny, 1994). The small peak centered around 3450 cm−1 becomes evident as the O–H peak disappears and may indicate the presence of condensed water (Boer et al., 2007).
3.3.3 IC and ICP-OES
A total of 16 HMS PTFE filters were analyzed by IC with recoveries of 65 %±4 % and calibration verification solution recoveries of 94 %±5 %. ICP-OES analysis was not performed on these filters. Eight additional HMS filters (65–100 µg) were shipped to the RTI, and two filters were extracted and analyzed by IC and ICP-OES on each of the following days: 0, 30, 61, and 101. The sulfur mass loss in IC (Fig. S3) over the 101 d is ∼ 60 % loss from the initial weighed mass or about 39 % loss assuming a constant extraction efficiency of 65 % for all samples and is in agreement with the 38 % decrease in mass on the filter measured by gravimetry. Similar results were obtained for ICP-OES. IC analysis (Fig. 5) confirms that the samples are mostly HMS on day 0, but over time the HMS is converted to sulfate (sulfate and bisulfate are indistinguishable in IC), supporting assignment of the 1003 cm−1 infrared peak to inorganic bisulfate. A small amount of the HMS may be converting to sulfate in solution or the column, but the measured changes are much larger than what is expected due to that mechanism alone. The small amount of HMS that is measured by IC on days 60 and 101 is near the detection limits for IC, which corroborates the absence of HMS in the FT-IR spectra after 2 months. The IC and FT-IR results both show a conversion of HMS into sulfate, indicating that HMS is not stable and cannot be quantified reliably on PTFE filters in IMPROVE by either FT-IR or IC. In Moch et al. (2020), HMS did not degrade over time under cold-storage conditions on nylon filters from IMPROVE, suggesting that storage or perhaps filter type may play an important role in HMS degradation on filters.
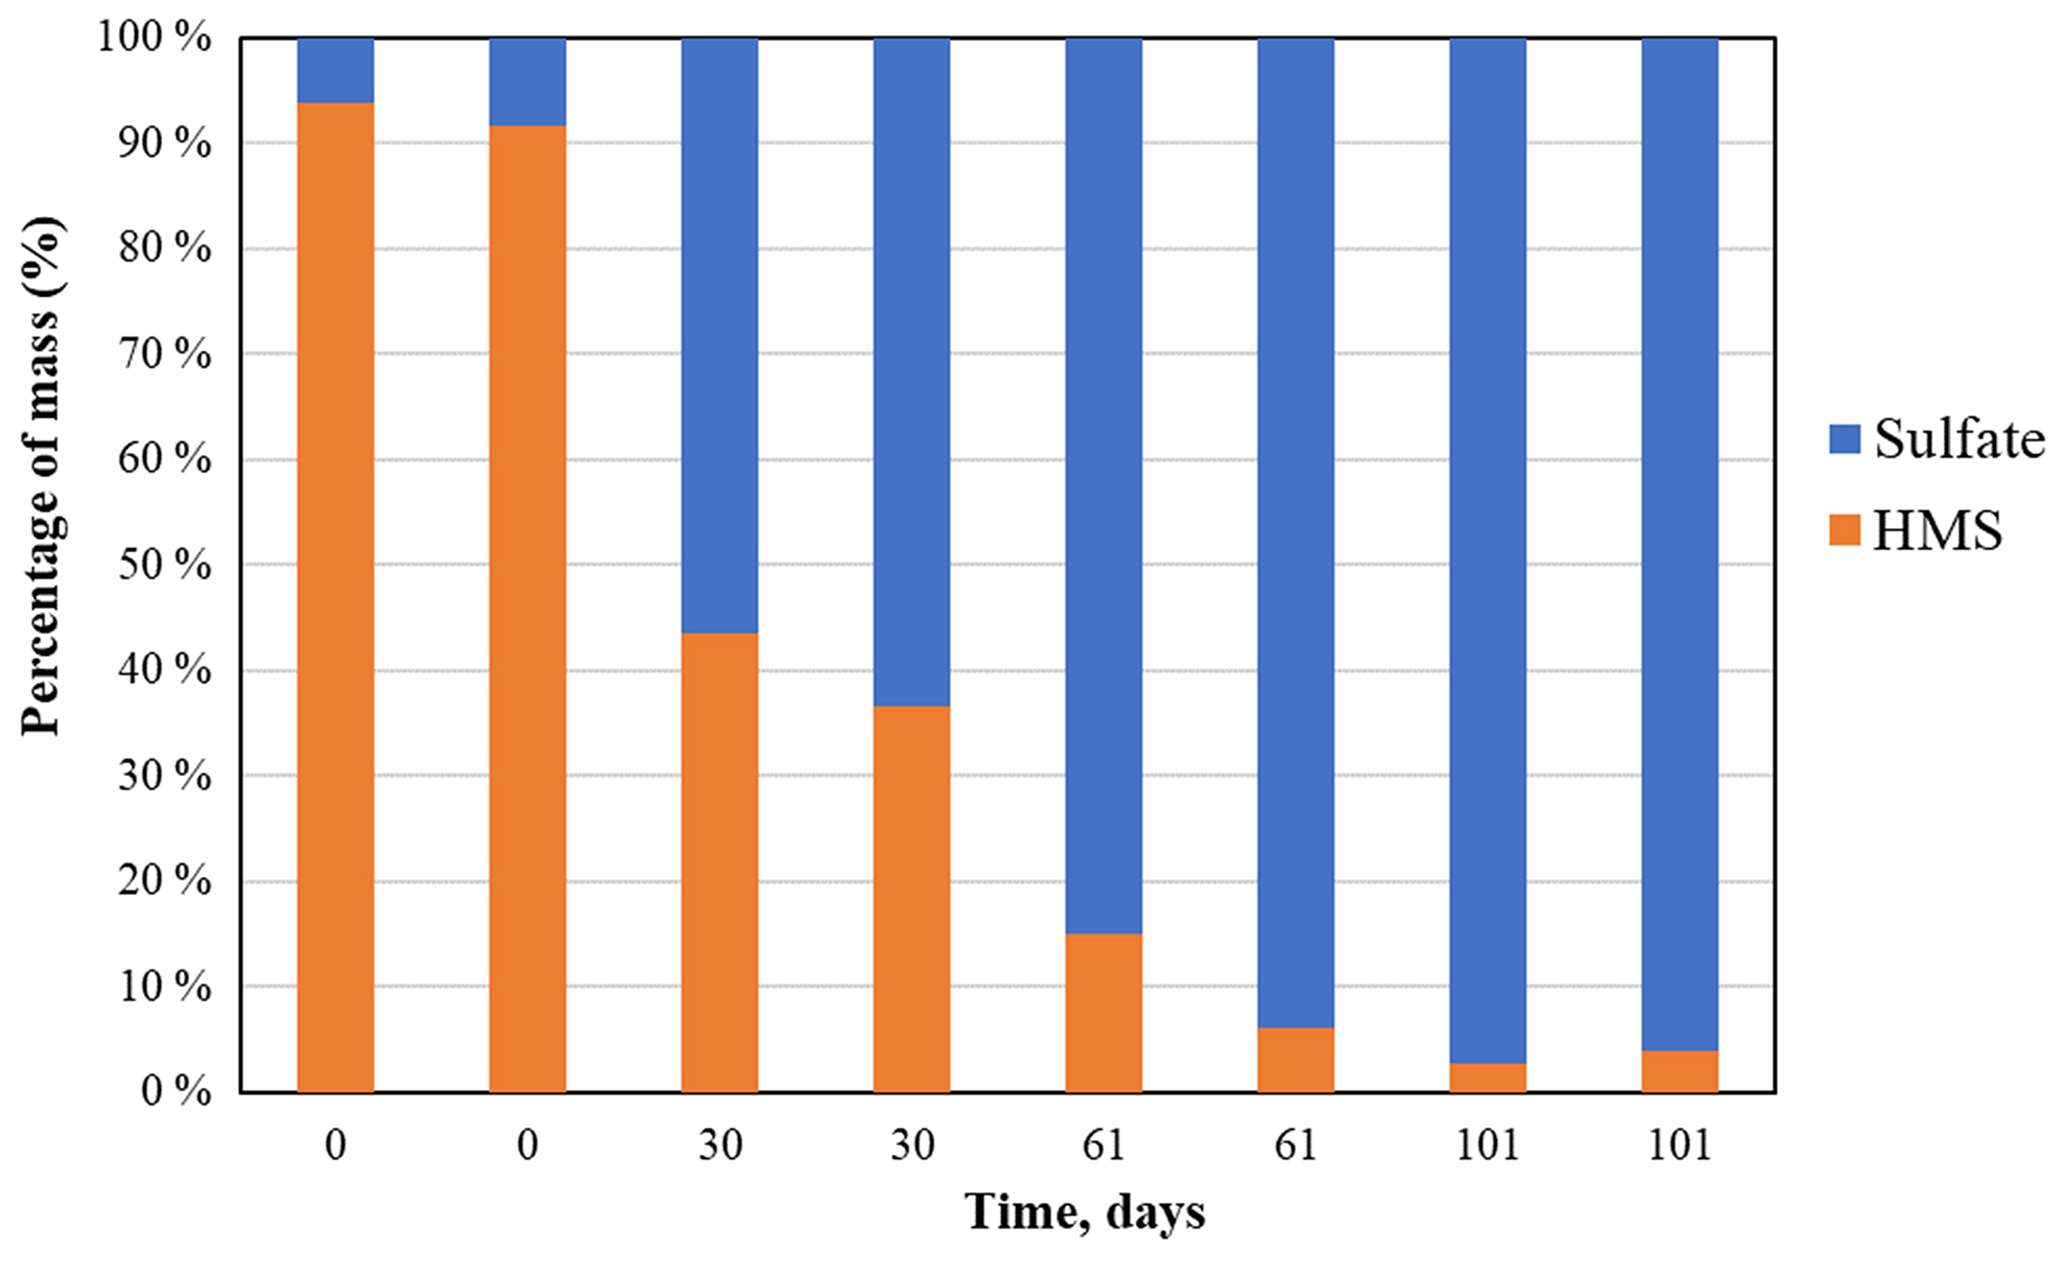
Figure 5Percentage of HMS and sulfate measured by IC. Eight PTFE filters were extracted and analyzed in pairs over 101 d.
3.4 Methyl sulfate
3.4.1 Gravimetry
Mass measurements of methyl sulfate salt over a 4-month period were within measurement uncertainty for the three filters loaded with approximately 30 µg of methyl sulfate (the change over time was indistinguishable from zero). For the 60 µg filters (Fig. 6), the first 2 months and the last 2 weeks of mass change were within measurement uncertainty (± 6 µg). However, for about a month, between days 70 and 100, many of the data (except day 91) are outside the measurement uncertainty, indicating mass loss of between 10 % and 20 %. During this period only one spectrum (day 79) was collected, and it does not support mass loss. On day 100 spectra and all spectra collected through the end of the study, for all three 60 µg loadings, filter samples confirm no changes in the MS compound. Mass and spectral data indicate mostly stable MS on filters under ambient laboratory condition (24 ∘C).
3.4.2 FT-IR
Methyl sulfate (CH3SO4H) is composed of a methyl (CH3) group attached to a sulfate (SO4) group with a C–O–S bond. The chemical used in this study is sodium methyl sulfate (CH3SO4Na). Methyl sulfate aerosol collected on PTFE filters has two peaks between 4000 and 2000 cm−1 and eight peaks between 1500 and 500 cm−1 (Fig. 7), similar to reference spectra in Table S1 (Spectral Database for Organic Compounds, SDBS, 2022). The doublets observed at 1020 and 1000 cm−1 and the nearly overlapping peaks at 795 and 784 cm−1 are identified as S–O–C by both FT-IR (Chihara, 1958; Lloyd et al., 1961; Lloyd and Dodgson, 1961; Segneanu et al., 2012; Shurvell, 2006) and Raman (Okabayashi et al., 1974). The S–O peaks from sulfate are observed around 1073 and 591 cm−1 in the spectra, similar to the previous study wherein peaks from 591 to 593 cm−1 and at 1063 cm−1 (solid) and 1081 cm−1 (solution) were ascribed to sulfate in potassium methyl sulfate (Chihara, 1958). There is a weak S = O peak at 1458 cm−1 (Segneanu et al., 2012). The O–H group (assuming the Na ion was replaced by H for some of the molecules) at 3500 cm−1 is also fairly weak. All collected spectra for one sample are shown, with the exception of day 91 data, which appeared to be anomalous (Supplement, Fig. S4 all spectra including day 91).
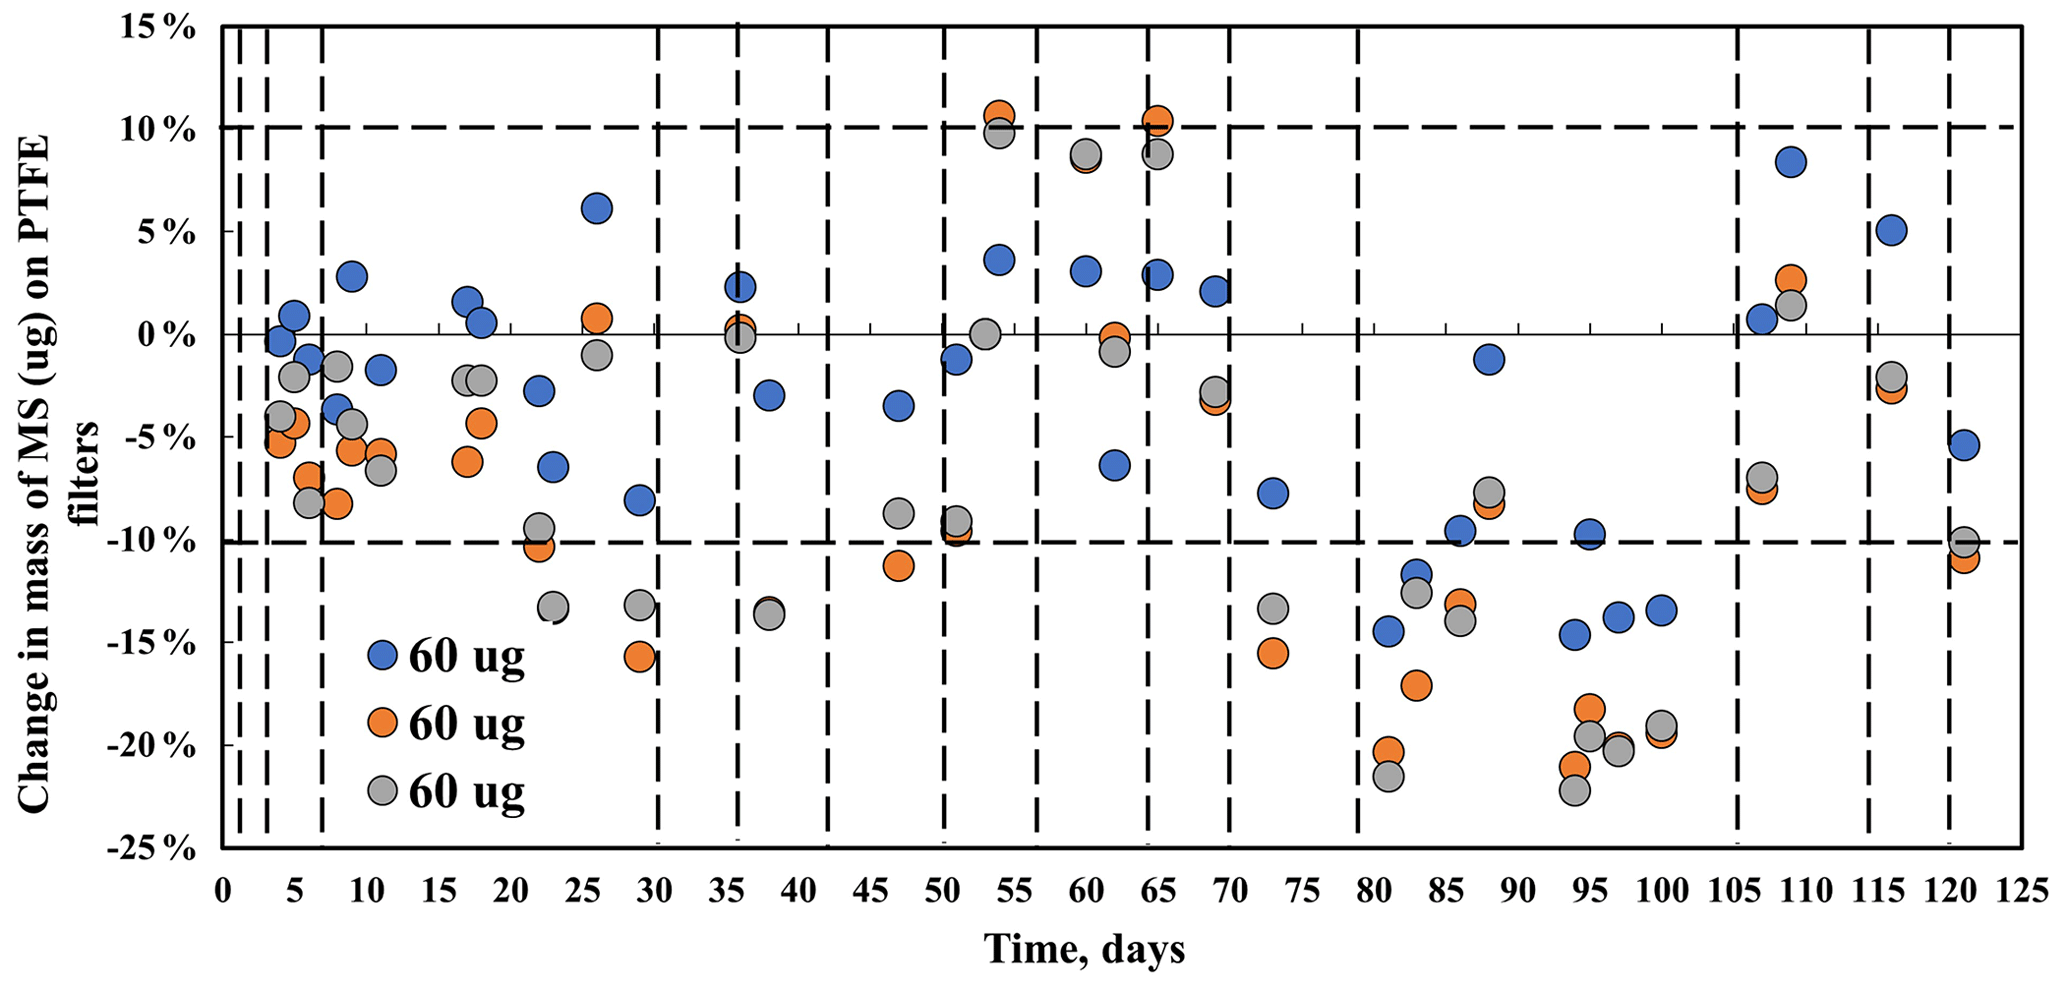
Figure 6Mass behavior of methyl sulfate (MS) standard over 4 months. Dotted vertical lines indicate FT-IR analysis. The horizontal broken line indicates mass balance precision for PTFE 25 mm diameter filters.
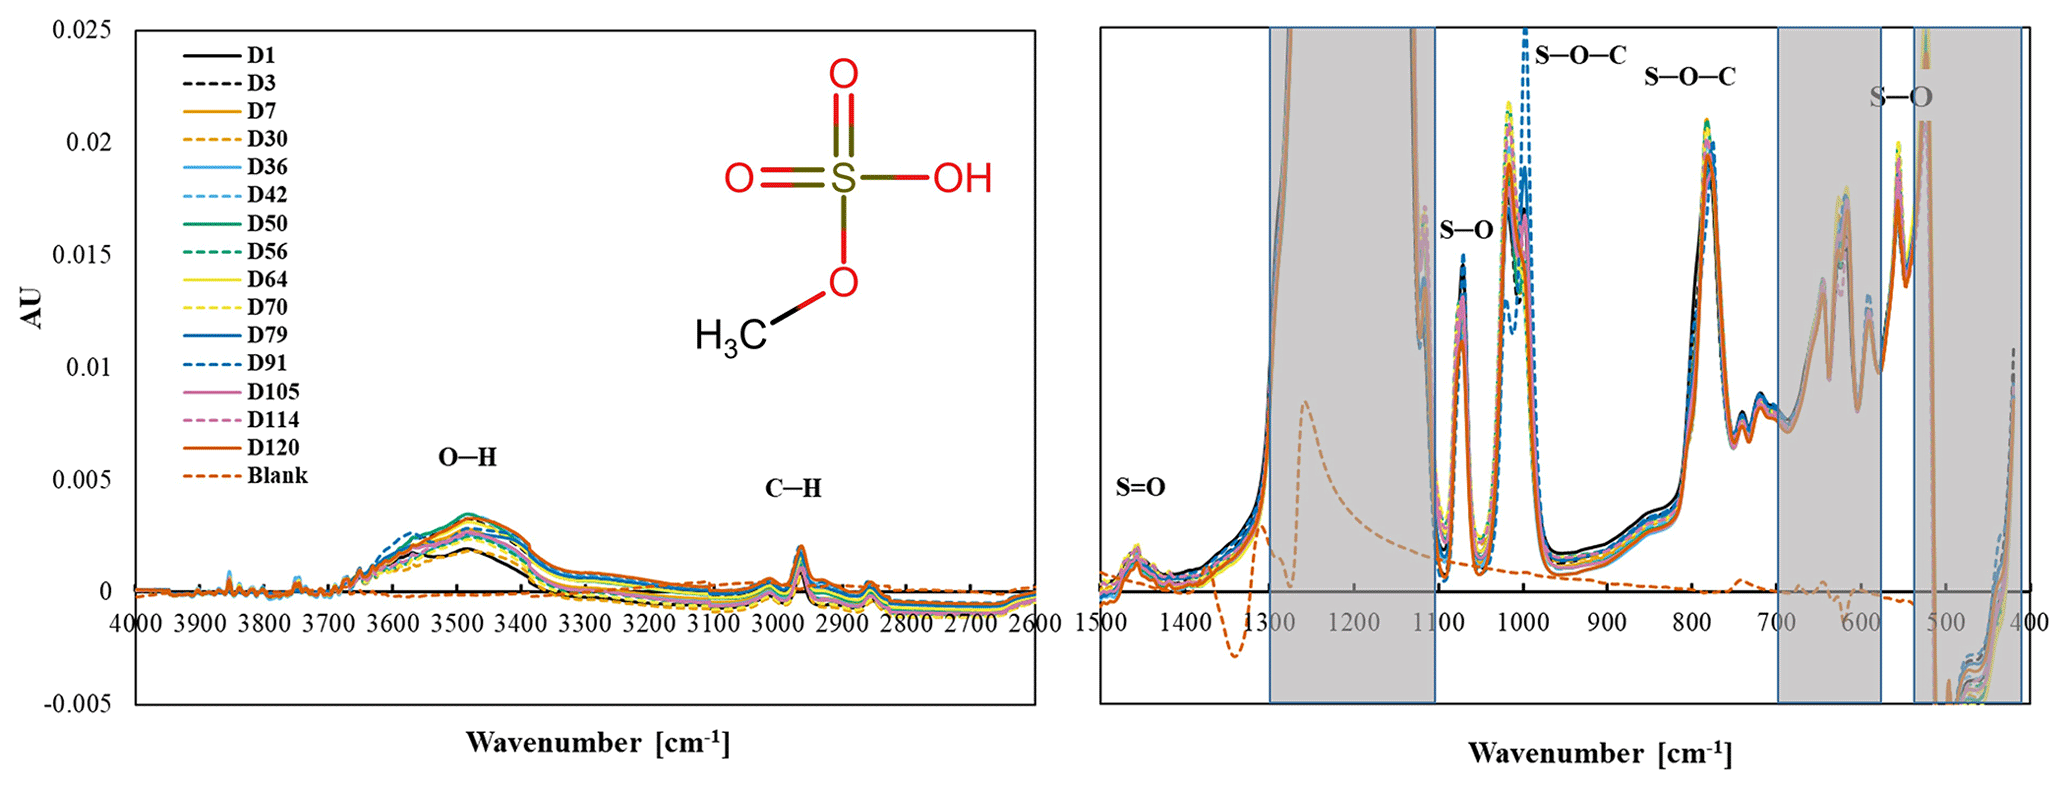
Figure 7Changes in the spectra of MS over a 4-month period. The shaded area indicates the absorbance regions of the PTFE filter.
The stability of the spectra over 4 months suggests that MS is stable when collected on a PTFE filter. There were no major or consistent changes in peaks associated with S–O–C, S–O, Na–O, and C–H.
The pattern of change in the peak height of the 3500 cm−1 peak does not correlate with the change in mass. Day 1 and day 30 spectra have smaller –OH peak intensities prior to mass decline, and the –OH peak in the spectrum from day 79, when mass had decreased and the mass is low, is higher than both. No consistent difference in the FT-IR spectra was observed on day 79 (low gravimetric mass day) or the following days (days 105–120), suggesting that the mass loss seen in the gravimetric data is erroneous. The high melting and boiling points of MS are 96 and 298 ∘C, respectively, with the low vapor pressure of 0.0038 mmHg (U.S. EPA, Comptox Chemicals Dashboard, 2022), indicating that MS is not volatilizing off the filter.
3.4.3 IC and ICP-OES
A total of 16 PTFE samples, 8 with mass loadings between 38 and 57 µg and 8 with higher mass loadings between 98 and 118 µg, were prepared for IC and ICP-OES analysis. Eight PTFE filters were extracted on day 0, and recoveries were 60±1 % for IC and 87±3 % for ICP-OES analyses. Recoveries of calibration verification solutions were 100±1 % for IC and 97±6 % for ICP-OES. Additional filters extracted on days 39 and 61 showed recoveries consistent with recoveries measured during the initial extracts: 59±2 % for IC and 86±4 % for ICP-OES. The overall lower mass recovery is an indication that not all MS is extracted from the filter, and the lower recoveries by IC compared to ICP-OES suggest that MS is converting to another sulfur compound in solution. The consistency in recoveries over time indicates stability of MS on PTFE over this time period, which is in agreement with the mass stability as shown by gravimetry over the course of the experiment. Unfortunately, filters were not extracted during the time period when the gravimetric results show a small deviation from stability.
MS is stable on a PTFE filter as indicated by gravimetry, FT-IR, and IC, suggesting that at least some atmospherically relevant organosulfates can be measured on PTFE filters in IMPROVE by FT-IR.
3.5 2-Methyltetrol sulfate
3.5.1 Gravimetry
Mass changes in three 2-methyltetrol sulfate (C5H11SO7) filter samples with concentrations from 55 to 57 µg are shown in Fig. 8. Mass decreases during the first 23 d to 73 % of the initial mass (25 % ± 2 %). No additional mass loss was observed after 25 d. Mass behavior indicates a loss of 2-MTS on filters under ambient laboratory conditions (24 ∘C). Similar results were obtained for filters weighing approximately 40 µg.
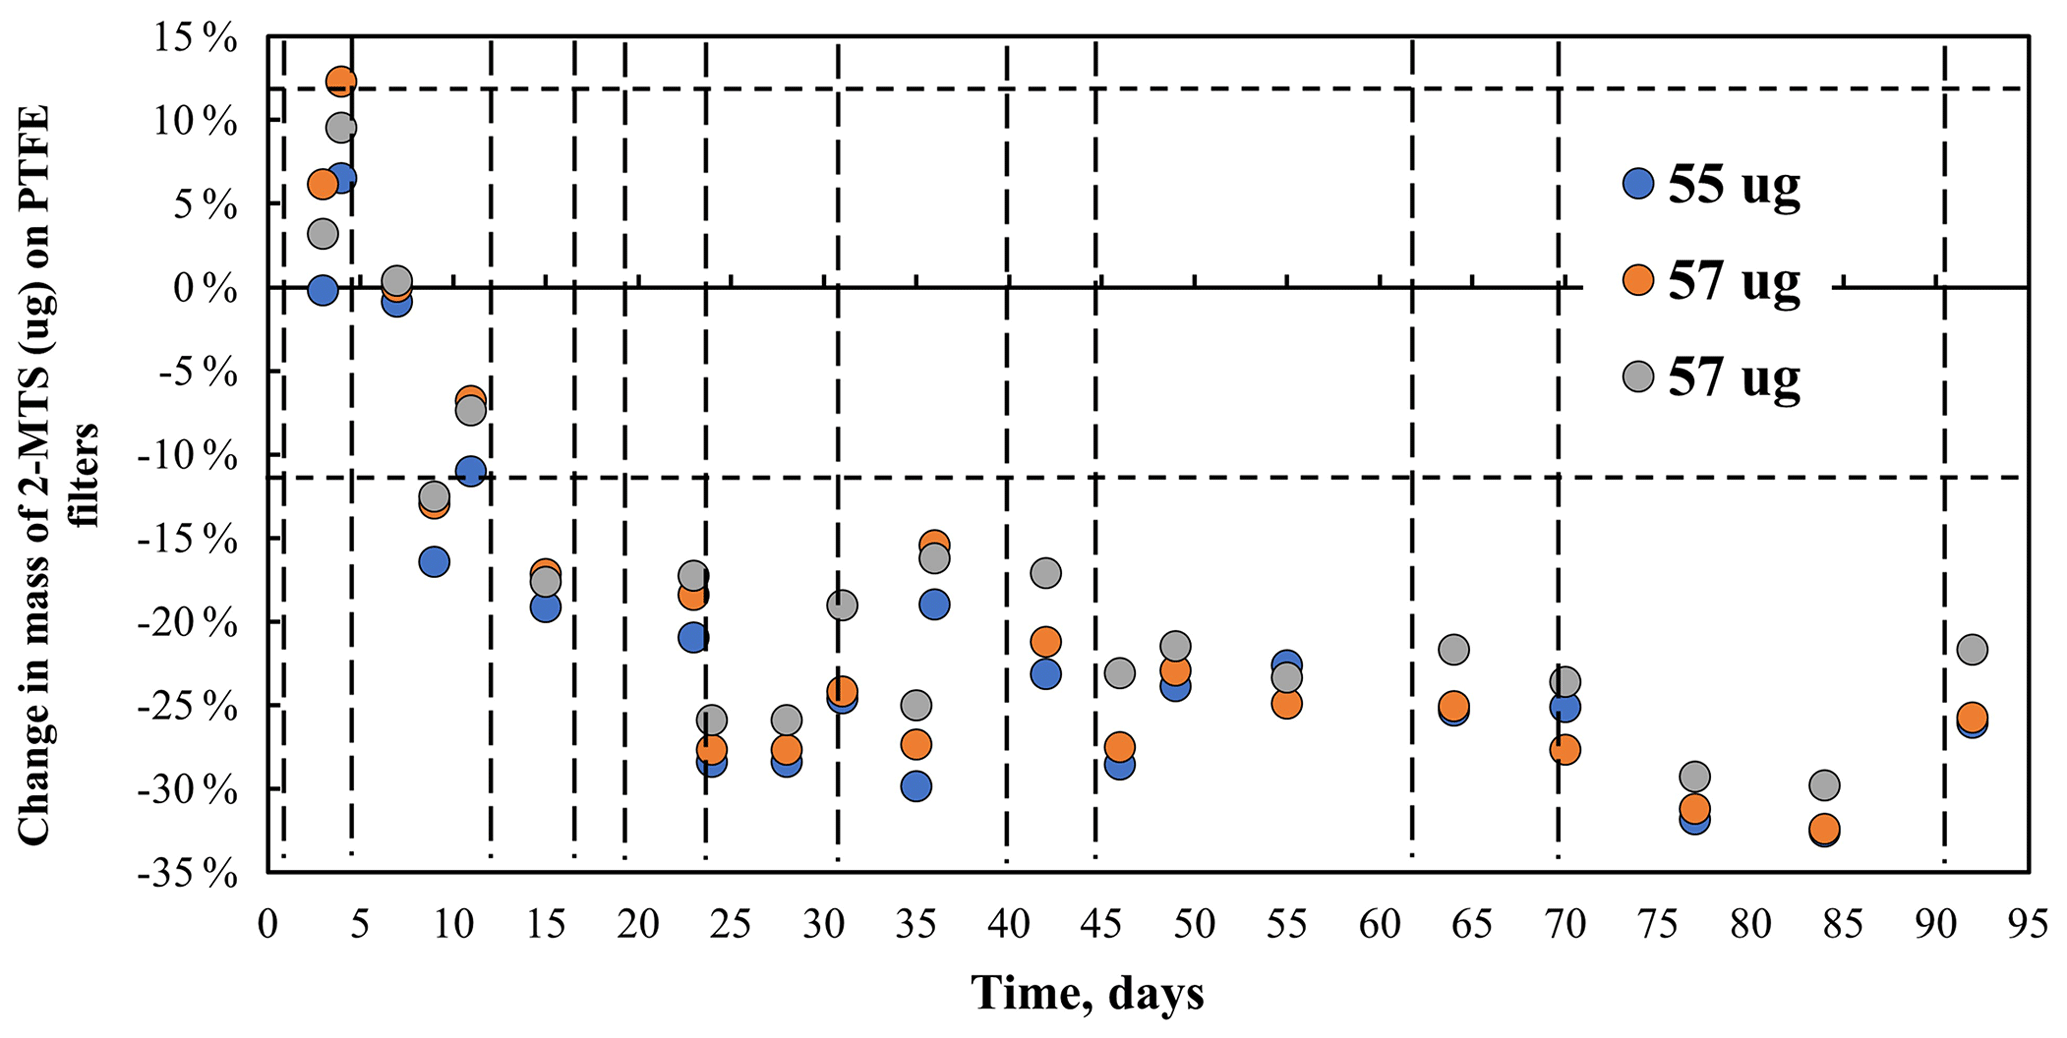
Figure 8Change in mass of 2-MTS collected on PTFE filters over a 3-month period under laboratory conditions. Dotted vertical lines indicate FT-IR analysis. The horizontal broken red line indicates mass balance precision.
3.5.2 FT-IR
2-Methyltetrol sulfate (C5H11SO7) is a branched compound with three units of –OH, one methyl group, and a sulfate group. Like methyl sulfate, 2-methyltetrol sulfate is an organosulfate and has a C–O–S bond. 2-MTS collected on PTFE filters has broad, organic-related peaks between 4000 and 2500 cm−1 and four peaks between 1500 and 500 cm−1 (Fig. 9). Observed peaks can be ascribed to functional groups with the molecule based on previous FT-IR and Raman work (Lloyd et al., 1961; Lloyd and Dodgson, 1961; Bondy et al., 2018; Fankhauser et al., 2022).
Figure 9Changes in the spectra of 2-MTS over a 3-month period. The shaded area indicates the absorbance regions of the PTFE filter.
The observed peak at 1041 cm−1 is ascribed to S–O stretch (Bondy et al., 2018; Fankhauser et al., 2022), as it is similar to the peak of MS at 1050 cm−1 (Lloyd et al., 1961; Lloyd and Dodgson, 1961). The doublet at 908 and 898 cm−1 corresponds to symmetric and asymmetric stretch of S–O of 2-MTS (Fankhauser et al., 2022). The weak peak at 827 cm−1 is tentatively assigned to C–O–S stretch based on Raman spectra of 3-MTS (Bondy et al., 2018). The peak at 1446 cm−1 is tentatively assigned to asymmetric S = O stretch based on density functional theory of FT-IR spectra of 2-MTS (Fankhauser et al., 2022), and the assignment of S = O is to the peak at 1448 cm−1 in methyl sulfate (Bondy et al., 2018). However, this peak was suggested to be due to C–H using density functional theory of Raman spectra of 2-methyltetrol sulfates (Bondy et al., 2018) and commonly ascribed to CH2 in organic molecules at ∼ 1465 cm−1 (Pavia et al., 2008). We decided to assign this to S = O because the sulfate-related peaks are strong and the C–H peaks are very weak in this molecule. In the higher-frequency region, the very subtle peak at 2879 cm−1 is ascribed to C–H stretch, and the large broad peaks at 3065 and 3210 cm−1 as well as the shoulder at 3426 cm−1 may be attributable to –OH stretch (Larkin, 2018; Shurvell, 2006; Bondy et al., 2018; Fankhauser et al., 2022) or inorganic −NH stretch (Boer et al., 2007; Larkin, 2018). Our tentative peak assignments of ammonium at 3210 and 3065 cm−1 and OH at 3426 cm−1 are based on changes in spectra discussed below.
Most of the 2-MTS infrared peaks decreased and disappeared over time, consistent with the decline in mass. The S–O peaks at 1041, 908, and 898 cm−1 decreased and were gone by day 40. The weak C–O–S peak at 827 cm−1 disappeared by day 26. The C–H region at 3000–2800 cm−1 decreased, similar to the changes in S–O–C peaks. However, some peaks shifted or new peaks formed. New peaks (or the doublet at 1041 and 908 cm−1 shifts to 1066 and 908 cm−1) at 1066 cm−1 and at 987 cm−1 appear on day 40 and then increase slightly over time. The S = O peak at 1446 cm−1 behaves differently from other 2-MTS peaks and increased slightly until day 33 when the peak height increased significantly and shifted to 1420 cm−1, where it continued to increase over time. Two peaks at 3210 and 3065 cm−1 increased, whereas the region around 3450–3550 cm−1 decreased, indicating that the shoulder at 3450 cm−1 arises from a different bond than the peaks at 3210 and 3065 cm−1.
The changes in the spectra indicate a change in the chemical composition on the filter. 2-MTS is no longer present midway through the experiment as evidenced by the disappearance of S–O, C–O–S, C–H, and O–H peaks. This result is supported by a study of ambient 2-MTS that showed that the atmospheric lifetime of 2-MTS is about 16 d (Chen et al., 2020). Intermediate oxidation products of 2-MTS transformation include other organosulfates such as 2-methylglyceric acid organosulfate (C4H7SO7, MGOS) and glycolic acid organosulfate (C2H3SO6, GAS) (Zhao et al., 2020; Wei et al., 2020), and the final product is likely inorganic (NH4)2SO4 (Harrill, 2020; Zhao et al., 2020). Raman spectra of MGOS (Bondy et al., 2018) indicate that the spectra at the end of the experiment could be 2-MGOS. The increased peak at 3210 cm−1 and 3065 cm−1 could be associated with –OH stretch and CH3 asymmetric stretch of 2-MGOS, and the 1420 cm−1 (C–H), 1066 cm−1 (S–O), and 987 cm−1 (SO42−) peaks match the final spectra well. The carbonyl group in 2-MGOS is very weak in the Raman spectra and indistinguishable from a blank filter in the final FT-IR spectra in this project. Alternatively, the final spectra could be ammonium sulfate as indicated by peaks at 3210, 3065, and 1420 cm−1, which are indicative of ammonium; however, the 1066 and 987 cm−1 peaks are lower than typically observed for inorganic ammonium sulfate (Boer et al., 2007; Zawadowicz et al., 2015), suggesting that this is not inorganic sulfate. There are limited FT-IR or Raman spectra of the many oxidation products of 2-MTS, so definitive identification is not possible and it is likely that there is a mixture of oxidation products present on the filter.
To further evaluate the possible compounds on the filter at the end of the experiment, mass loss calculations were performed using the molecular weight of 2-MTS and each product (MGOS, GAS, and ammonium sulfate). If 2-MTS is converted completely to MGOS, the mass loss would only be 7 %. If 2-MTS is converted completely to GAS, the mass loss would be 28 %, and if 2-MTS is converted completely to ammonium sulfate, the mass loss would be 39 %. These values span the observed mass loss at 25 %, which suggests that the compounds on the filter are of an intermediate type and still in the organosulfate form, not inorganic ammonium sulfate.
3.5.3 IC and ICP-OES
A total of 16 PTFE samples, 8 with mass loading between 11 and 28 µg and 8 with higher mass loadings between 37 and 46 µg, were extracted immediately upon receipt at the RTI. The IC showed low sensitivity to 2-MTS detection and results are not reported, so no additional information was available about what compounds the 2-MTS may have changed into. Given that ICP-OES measures sulfur and not individual compounds, the results from this method do not provide insight into chemical conversions on the filter but are briefly discussed in the Supplement (Fig. S5).
The stability and therefore potential for FT-IR to measure organosulfur and organosulfates collected on PTFE filters vary by compound. MS has the highest potential to be measured on PTFE filters in IMPROVE samples by FT-IR due to its minimal mass change and no spectral changes. Consistent recoveries by IC and ICP-OES over multiple months of analysis support the conclusion that MS is stable on the filters. Consistent results from analysis at UC Davis and the RTI suggest robustness to storage, shipping, and handling conditions. MS is one of many organosulfates observed in the atmosphere and not necessarily representative of organosulfates in general as indicated by 2-MTS. Gravimetric mass suggests some (30 %) mass loss from 2-MTS samples on the PTFE filter over a 3-month period. FT-IR suggests that 2-MTS is unstable on the PTFE filter and changes into different compound(s), likely still an organosulfate. FT-IR and gravimetry show that MSA can be measured from PTFE filters, but due to volatility off the filters a lower bound of MSA is measured (i.e., less than the amount of MSA in the atmosphere). IC further confirmed that MSA did not chemically change while on the filter. Infrared peaks in HMS spectra midway through the experiment indicate that HMS is not stable on PTFE filters and likely converts to bisulfate. IC indicates that HMS changes to (bi)sulfate over time. Further investigations of measurements by FT-IR on PTFE of other organosulfates are warranted to evaluate the extent to which the organosulfate functional group can be quantified from IMPROVE PTFE filters. Further work to determine the stability and ability to measure these compounds in aerosol mixtures as found in ambient samples is needed before confidently using FT-IR on IMPROVE samples to measure organic sulfur compounds.
Data are available at https://doi.org/10.25338/B8BH14 (Anunciado et al., 2023).
The supplement related to this article is available online at: https://doi.org/10.5194/amt-16-3515-2023-supplement.
Conceptualization: AMD, TD. Formal analysis: MBA, TD, ST, AMD. Funding: AMD, TD. Investigation: MBA, MDeB, LH, KL. Project administration: AMD. Supervision: AMD, TD. Writing first draft: MBA, TD. Writing revisions and editing: MBA, ST, TD, MDeB, LH, KL, AMD. Software: ST, MA. Visualization: MA.
The contact author has declared that none of the authors has any competing interests.
Publisher's note: Copernicus Publications remains neutral with regard to jurisdictional claims in published maps and institutional affiliations.
The authors would like to acknowledge Jason Surratt and his team for providing the 2-MTS compound used in this study.
This research was support by the Research Triangle Institute (agreement no. 62977) and the Interagency Monitoring of Protected Visual Environments (agreement no. P21AC11294).
This paper was edited by Yoshiteru Iinuma and reviewed by two anonymous referees.
Allen, A. G., Dick, A. L., and Davison, B. M.: Sources of atmospheric methanesulphonate, non-sea-salt sulphate, nitrate and related species over the temperate South Pacific, Atmos. Environ., 31, 191–205, https://doi.org/10.1016/1352-2310(96)00194-X, 1997.
Allen, A. G., Davison, B. M., James, J. D., Robertson, L., Harrison, R. M., and Hewitt, C. N.: Influence of Transport over a Mountain Ridge on the Chemical Composition of Marine Aerosols during the ACE-2 Hillcloud Experiment, J. Atmos. Chem., 41, 83–107, https://doi.org/10.1023/A:1013868729960, 2002.
Amore, A., Giardi, F., Becagli, S., Caiazzo, L., Mazzola, M., Severi, M., and Traversi, R.: Source apportionment of sulphate in the High Arctic by a 10 yr-long record from Gruvebadet Observatory (Ny-Ålesund, Svalbard Islands), Atmos. Environ., 270, 118890, https://doi.org/10.1016/j.atmosenv.2021.118890, 2022.
Aneja, V. P. and Cooper, W. J.: Biogenic Sulfur Emissions, in: Biogenic Sulfur in the Environment, vol. 393, Am. Chem. Soc., 2–13, https://doi.org/10.1021/bk-1989-0393.ch001, 1989.
Anunciado, M. B., De Boskey, M., Haines, L., Lindskog, K., Dombek, T., Takahama, S., and Dillner, A. M.: Data from “Stability assessment of organic sulfur and organosulfate compounds in filter samples for quantification by Fourier Transform-Infrared Spectroscopy and Ion Chromatography”, Dryad [data set], https://doi.org/10.25338/B8BH14, 2023.
Barnes, I., Becker, K. H., and Mihalopoulos, N.: An FTIR product study of the photooxidation of dimethyl disulfide, J. Atmos. Chem., 18, 267–289, https://doi.org/10.1007/BF00696783, 1994.
Bates, T. S., Lamb, B. K., Guenther, A., Dignon, J., and Stoiber, R. E.: Sulfur emissions to the atmosphere from natural sources, J. Atmos. Chem., 14, 315–337, https://doi.org/10.1007/BF00115242, 1992.
Becagli, S., Lazzara, L., Fani, F., Marchese, C., Traversi, R., Severi, M., di Sarra, A., Sferlazzo, D., Piacentino, S., Bommarito, C., Dayan, U., and Udisti, R.: Relationship between methanesulfonate (MS-) in atmospheric particulate and remotely sensed phytoplankton activity in oligo-mesotrophic central Mediterranean Sea, Atmos. Environ., 79, 681–688, https://doi.org/10.1016/j.atmosenv.2013.07.032, 2013.
Boer, G. J., Sokolik, I. N., and Martin, S. T.: Infrared optical constants of aqueous sulfate–nitrate–ammonium multi-component tropospheric aerosols from attenuated total reflectance measurements—Part I: Results and analysis of spectral absorbing features, J. Quant. Spectrosc. Ra., 108, 17–38, https://doi.org/10.1016/j.jqsrt.2007.02.017, 2007.
Bondy, A. L., Craig, R. L., Zhang, Z., Gold, A., Surratt, J. D., and Ault, A. P.: Isoprene-Derived Organosulfates: Vibrational Mode Analysis by Raman Spectroscopy, Acidity-Dependent Spectral Modes, and Observation in Individual Atmospheric Particles, The J. Phys. Chem. A, 122, 303–315, https://doi.org/10.1021/acs.jpca.7b10587, 2018.
Boris, A. J., Takahama, S., Weakley, A. T., Debus, B. M., Fredrickson, C. D., Esparza-Sanchez, M., Burki, C., Reggente, M., Shaw, S. L., Edgerton, E. S., and Dillner, A. M.: Quantifying organic matter and functional groups in particulate matter filter samples from the southeastern United States – Part 1: Methods, Atmos. Meas. Tech., 12, 5391–5415, https://doi.org/10.5194/amt-12-5391-2019, 2019.
Boris, A. J., Takahama, S., Weakley, A. T., Debus, B. M., Shaw, S. L., Edgerton, E. S., Joo, T., Ng, N. L., and Dillner, A. M.: Quantifying organic matter and functional groups in particulate matter filter samples from the southeastern United States – Part 2: Spatiotemporal trends, Atmos. Meas. Tech., 14, 4355–4374, https://doi.org/10.5194/amt-14-4355-2021, 2021.
Campbell, J. R., Battaglia, M. Jr., Dingilian, K., Cesler-Maloney, M., St Clair, J. M., Hanisco, T. F., Robinson, E., DeCarlo, P., Simpson, W., Nenes, A., Weber, R. J., and Mao, J.: Source and Chemistry of Hydroxymethanesulfonate (HMS) in Fairbanks, Alaska, Environ. Sci. Technol., 56, 7657–7667, https://doi.org/10.1021/acs.est.2c00410, 2022.
Chackalackal, S. M. and Stafford, F. E.: Infrared Spectra of Methane-, Fluoro-, and Chlorosulfonic Acids, J. Am. Chem. Soc., 88, 4815–4819, https://doi.org/10.1021/ja00973a010, 1966.
Chapman, E. G., Barinaga, C. J., Udseth, H. R., and Smith, R. D.: Confirmation and quantitation of hydroxymethanesulfonate in precipitation by electrospray ionization-tandem mass spectrometry, Atmos. Environ., A, 24, 2951–2957, https://doi.org/10.1016/0960-1686(90)90475-3, 1990.
Chen, C., Zhang, Z., Wei, L., Qiu, Y., Xu, W., Song, S., Sun, J., Li, Z., Chen, Y., Ma, N., Xu, W., Pan, X., Fu, P., and Sun, Y.: The importance of hydroxymethanesulfonate (HMS) in winter haze episodes in North China Plain, Environ. Res., 211, 113093, https://doi.org/10.1016/j.envres.2022.113093, 2022.
Chen, Y., Zhang, Y., Lambe, A. T., Xu, R., Lei, Z., Olson, N. E., Zhang, Z., Szalkowski, T., Cui, T., Vizuete, W., Gold, A., Turpin, B. J., Ault, A. P., Chan, M. N., and Surratt, J. D.: Heterogeneous Hydroxyl Radical Oxidation of Isoprene-Epoxydiol-Derived Methyltetrol Sulfates: Plausible Formation Mechanisms of Previously Unexplained Organosulfates in Ambient Fine Aerosols, Environ. Sci. Technol. Lett., 7, 460–468, https://doi.org/10.1021/acs.estlett.0c00276, 2020.
Chen, Y., Dombek, T., Hand, J., Zhang, Z., Gold, A., Ault, A. P., Levine, K. E., and Surratt, J. D.: Seasonal Contribution of Isoprene-Derived Organosulfates to Total Water-Soluble Fine Particulate Organic Sulfur in the United States, ACS Earth Space Chem., 5, 2419–2432, https://doi.org/10.1021/acsearthspacechem.1c00102, 2021.
Chihara, G.: Measurement of Infrared Absorption Spectra by Absorption on Japanese Hand-made Paper and Its Application to Paper Chromatography, Chem. Pharm. Bull., 6, 143–147, https://doi.org/10.1248/cpb.6.143, 1958.
Cui, T., Zeng, Z., Santos, E. O. dos, Zhang, Z., Chen, Y., Zhang, Y., Rose, C. A., Budisulistiorini, S. H., Collins, L. B., Bodnar, W. M., Souza, R. A. F. de, Martin, S. T., Machado, C. M. D., Turpin, B. J., Gold, A., Ault, A. P., and Surratt, J. D.: Development of a hydrophilic interaction liquid chromatography (HILIC) method for the chemical characterization of water-soluble isoprene epoxydiol (IEPOX)-derived secondary organic aerosol, Environ. Sci.: Processes Impacts, 20, 1524–1536, https://doi.org/10.1039/C8EM00308D, 2018.
Debus, B., Takahama, S., Weakley, A. T., Seibert, K., and Dillner, A. M.: Long-Term Strategy for Assessing Carbonaceous Particulate Matter Concentrations from Multiple Fourier Transform Infrared (FT-IR) Instruments: Influence of Spectral Dissimilarities on Multivariate Calibration Performance, Appl. Spectrosc., 73, 271–283, https://doi.org/10.1177/0003702818804574, 2019.
Debus, B., Weakley, A. T., Takahama, S., George, K. M., Amiri-Farahani, A., Schichtel, B., Copeland, S., Wexler, A. S., and Dillner, A. M.: Quantification of major particulate matter species from a single filter type using infrared spectroscopy – application to a large-scale monitoring network, Atmos. Meas. Tech., 15, 2685–2702, https://doi.org/10.5194/amt-15-2685-2022, 2022.
Decesari, S., Facchini, M. C., Fuzzi, S., and Tagliavini, E.: Characterization of water-soluble organic compounds in atmospheric aerosol: A new approach, J. Geophys. Res.-Atmos., 105, 1481–1489, https://doi.org/10.1029/1999JD900950, 2000.
Dovrou, E., Lim, C. Y., Canagaratna, M. R., Kroll, J. H., Worsnop, D. R., and Keutsch, F. N.: Measurement techniques for identifying and quantifying hydroxymethanesulfonate (HMS) in an aqueous matrix and particulate matter using aerosol mass spectrometry and ion chromatography, Atmos. Meas. Tech., 12, 5303–5315, https://doi.org/10.5194/amt-12-5303-2019, 2019.
Fankhauser, A. M., Lei, Z., Daley, K. R., Xiao, Y., Zhang, Z., Gold, A., Ault, B. S., Surratt, J. D., and Ault, A. P.: Acidity-Dependent Atmospheric Organosulfate Structures and Spectra: Exploration of Protonation State Effects via Raman and Infrared Spectroscopies Combined with Density Functional Theory, The J. Phys. Chem. A, 126, 5974–5984, https://doi.org/10.1021/acs.jpca.2c04548, 2022.
Frossard, A. A., Shaw, P. M., Russell, L. M., Kroll, J. H., Canagaratna, M. R., Worsnop, D. R., Quinn, P. K., and Bates, T. S.: Springtime Arctic haze contributions of submicron organic particles from European and Asian combustion sources, J. Geophys. Res.-Atmos., 116, D5, https://doi.org/10.1029/2010JD015178, 2011.
von Glasow, R. and Crutzen, P. J.: Model study of multiphase DMS oxidation with a focus on halogens, Atmos. Chem. Phys., 4, 589–608, https://doi.org/10.5194/acp-4-589-2004, 2004.
Grübler, A.: A Review of Global and Regional Sulfur Emission Scenarios, Mitig. Adapt. Strat. Gl., 3, 383–418, https://doi.org/10.1023/A:1009651624257, 1998.
Hansen, A. M. K., Kristensen, K., Nguyen, Q. T., Zare, A., Cozzi, F., Nøjgaard, J. K., Skov, H., Brandt, J., Christensen, J. H., Ström, J., Tunved, P., Krejci, R., and Glasius, M.: Organosulfates and organic acids in Arctic aerosols: speciation, annual variation and concentration levels, Atmos. Chem. Phys., 14, 7807–7823, https://doi.org/10.5194/acp-14-7807-2014, 2014.
Harrill, A. J.: Aqueous-Phase Processing of 2-Methyltetrol Sulfates by Hydroxyl Radical Oxidation in Fog and Cloud Water Mimics: Implications for Isoprene-Derived Secondary Organic Aerosol, https://cdr.lib.unc.edu/concern/parent/5999nc07f/file_sets/7p88cq83j (last access: 7 September 2022), 2020.
Hawkins, L. N., Russell, L. M., Covert, D. S., Quinn, P. K., and Bates, T. S.: Carboxylic acids, sulfates, and organosulfates in processed continental organic aerosol over the southeast Pacific Ocean during VOCALS-REx 2008, J. Geophys. Res.-Atmos., 115, D13, https://doi.org/10.1029/2009JD013276, 2010.
Hettiyadura, A. P. S., Stone, E. A., Kundu, S., Baker, Z., Geddes, E., Richards, K., and Humphry, T.: Determination of atmospheric organosulfates using HILIC chromatography with MS detection, Atmos. Meas. Tech., 8, 2347–2358, https://doi.org/10.5194/amt-8-2347-2015, 2015.
Hettiyadura, A. P. S., Jayarathne, T., Baumann, K., Goldstein, A. H., de Gouw, J. A., Koss, A., Keutsch, F. N., Skog, K., and Stone, E. A.: Qualitative and quantitative analysis of atmospheric organosulfates in Centreville, Alabama, Atmos. Chem. Phys., 17, 1343–1359, https://doi.org/10.5194/acp-17-1343-2017, 2017.
Hoffmann, E. H., Tilgner, A., Schrödner, R., Bräuer, P., Wolke, R., and Herrmann, H.: An advanced modeling study on the impacts and atmospheric implications of multiphase dimethyl sulfide chemistry, P. Natl. Acad. Sci. USA, 113, 11776–11781, 2016.
Kamruzzaman, M., Takahama, S., and Dillner, A. M.: Quantification of amine functional groups and their influence on OM/OC in the IMPROVE network, Atmos. Environ., 172, 124–132, https://doi.org/10.1016/j.atmosenv.2017.10.053, 2018.
Knovel: Yaws' Critical Property Data for Chemical Engineers and Chemists – Table 12. Vapor Pressure – Organic Compounds, log P = A - B/(T + C): https://app.knovel.com/kn/resources/kt009ZN2S3/kpYCPDCECD/eptble/itable?b-=&columns=1,2,3,6,4,5,10,11,13,14,12,7,8,9, last access: 7 September 2022.
Krost, K. J. and McClenny, W. A.: FT-IR Transmission Spectroscopy for Quantitation of Ammonium Bisulfate in Fine-Particulate Matter Collected on Teflon® Filters, Appl. Spectrosc., 48, 702–705, 1994.
Kuzmiakova, A., Dillner, A. M., and Takahama, S.: An automated baseline correction protocol for infrared spectra of atmospheric aerosols collected on polytetrafluoroethylene (Teflon) filters, Atmos. Meas. Tech., 9, 2615–2631, https://doi.org/10.5194/amt-9-2615-2016, 2016.
Kwong, K. C., Chim, M. M., Hoffmann, E. H., Tilgner, A., Herrmann, H., Davies, J. F., Wilson, K. R., and Chan, M. N.: Chemical Transformation of Methanesulfonic Acid and Sodium Methanesulfonate through Heterogeneous OH Oxidation, ACS Earth Space Chem., 2, 895–903, https://doi.org/10.1021/acsearthspacechem.8b00072, 2018a.
Kwong, K. C., Chim, M. M., Davies, J. F., Wilson, K. R., and Chan, M. N.: Importance of sulfate radical anion formation and chemistry in heterogeneous OH oxidation of sodium methyl sulfate, the smallest organosulfate, Atmos. Chem. Phys., 18, 2809–2820, https://doi.org/10.5194/acp-18-2809-2018, 2018b.
Larkin, P. J.: Chapter 6 – IR and Raman Spectra–Structure Correlations: Characteristic Group Frequencies, in: Infrared and Raman Spectroscopy (Second Edition), edited by: Larkin, P. J., Elsevier, 85–134, https://doi.org/10.1016/B978-0-12-804162-8.00006-9, 2018.
Laurent, J.-P. and Allen, D. T.: Size Distributions of Organic Functional Groups in Ambient Aerosol Collected in Houston, Texas Special Issue of Aerosol Science and Technology on Findings from the Fine Particulate Matter Supersites Program, Aerosol Sci. Technol., 38, 82–91, https://doi.org/10.1080/02786820390229561, 2004.
Lee, J.-K., Lee, J.-S., Ahn, Y.-S., and Kang, G.-H.: Restoring the Reactivity of Organic Acid Solution Used for Silver Recovery from Solar Cells by Fractional Distillation, Sustainability, 11, 3659, https://doi.org/10.3390/su11133659, 2019.
Lee, S.-H., Murphy, D. M., Thomson, D. S., and Middlebrook, A. M.: Nitrate and oxidized organic ions in single particle mass spectra during the 1999 Atlanta Supersite Project, J. Geophys. Res.-Atmos., 108, SOS 5-1–SOS 5-8, https://doi.org/10.1029/2001JD001455, 2003.
Lin-Vien, D., Colthup, N. B., Fateley, W. G., and Grasselli, J. G.: CHAPTER 14 – Organic Sulfur Compounds, in: The Handbook of Infrared and Raman Characteristic Frequencies of Organic Molecules, edited by: Lin-Vien, D., Colthup, N. B., Fateley, W. G., and Grasselli, J. G., Academic Press, San Diego, 225–250, https://doi.org/10.1016/B978-0-08-057116-4.50020-1, 1991.
Liu, S., Takahama, S., Russell, L. M., Gilardoni, S., and Baumgardner, D.: Oxygenated organic functional groups and their sources in single and submicron organic particles in MILAGRO 2006 campaign, Atmos. Chem. Phys., 9, 6849–6863, https://doi.org/10.5194/acp-9-6849-2009, 2009.
Liu, S., Ahlm, L., Day, D. A., Russell, L. M., Zhao, Y., Gentner, D. R., Weber, R. J., Goldstein, A. H., Jaoui, M., Offenberg, J. H., Kleindienst, T. E., Rubitschun, C., Surratt, J. D., Sheesley, R. J., and Scheller, S.: Secondary organic aerosol formation from fossil fuel sources contribute majority of summertime organic mass at Bakersfield, J. Geophys. Res.-Atmos., 117, D24, https://doi.org/10.1029/2012JD018170, 2012.
Lloyd, A. G. and Dodgson, K. S.: Infrared studies on sulphate esters. II. Monosaccharide sulphates, Biochim. Biophys. Acta, 46, 116–120, https://doi.org/10.1016/0006-3002(61)90653-9, 1961.
Lloyd, A. G., Dodgson, K. S., Price, R. G., and Rose, F. A.: Infrared studies on sulphate esters. I. Polysaccharide sulphates, Biochim. Biophys. Acta, 46, 108–115, https://doi.org/10.1016/0006-3002(61)90652-7, 1961.
Ma, T., Furutani, H., Duan, F., Kimoto, T., Jiang, J., Zhang, Q., Xu, X., Wang, Y., Gao, J., Geng, G., Li, M., Song, S., Ma, Y., Che, F., Wang, J., Zhu, L., Huang, T., Toyoda, M., and He, K.: Contribution of hydroxymethanesulfonate (HMS) to severe winter haze in the North China Plain, Atmos. Chem. Phys., 20, 5887–5897, https://doi.org/10.5194/acp-20-5887-2020, 2020.
Moch, J. M., Dovrou, E., Mickley, L. J., Keutsch, F. N., Cheng, Y., Jacob, D. J., Jiang, J., Li, M., Munger, J. W., Qiao, X., and Zhang, Q.: Contribution of Hydroxymethane Sulfonate to Ambient Particulate Matter: A Potential Explanation for High Particulate Sulfur During Severe Winter Haze in Beijing, Geophys. Res. Lett., 45, 11969–11979, https://doi.org/10.1029/2018GL079309, 2018.
Moch, J. M., Dovrou, E., Mickley, L. J., Keutsch, F. N., Liu, Z., Wang, Y., Dombek, T. L., Kuwata, M., Budisulistiorini, S. H., Yang, L., Decesari, S., Paglione, M., Alexander, B., Shao, J., Munger, J. W., and Jacob, D. J.: Global Importance of Hydroxymethanesulfonate in Ambient Particulate Matter: Implications for Air Quality, J. Geophys. Res.-Atmos., 125, e2020JD032706, https://doi.org/10.1029/2020JD032706, 2020.
Okabayashi, H., Okuyama, M., Kitagawa, T., and Miyazawa, T.: The Raman Spectra and Molecular Conformations of Surfactants in Aqueous Solution and Crystalline States, Bull. Chem. Soc. JPN, 47, 1075–1077, https://doi.org/10.1246/bcsj.47.1075, 1974.
Olson, C. N., Galloway, M. M., Yu, G., Hedman, C. J., Lockett, M. R., Yoon, T., Stone, E. A., Smith, L. M., and Keutsch, F. N.: Hydroxycarboxylic Acid-Derived Organosulfates: Synthesis, Stability, and Quantification in Ambient Aerosol, Environ. Sci. Technol., 45, 6468–6474, https://doi.org/10.1021/es201039p, 2011.
Pavia, D. L., Lampman, G. M., Kriz, G. S., and Vyvyan, J. A.: Introduction to Spectroscopy, Cengage Learning, 745 pp., 4th Edn., Cengage Learning, Library of Congress Control Number: 2007943966, 15–104, 2008.
Peng, C. and Chan, C. K.: The water cycles of water-soluble organic salts of atmospheric importance, Atmos. Environ., 35, 1183–1192, https://doi.org/10.1016/S1352-2310(00)00426-X, 2001.
Reggente, M., Höhn, R., and Takahama, S.: An open platform for Aerosol InfraRed Spectroscopy analysis – AIRSpec, Atmos. Meas. Tech., 12, 2313–2329, https://doi.org/10.5194/amt-12-2313-2019, 2019.
Russell, L. M., Bahadur, R., and Ziemann, P. J.: Identifying organic aerosol sources by comparing functional group composition in chamber and atmospheric particles, P. Natl. Acad. Sci. USA, 108, 3516–3521, https://doi.org/10.1073/pnas.1006461108, 2011.
Ruthenburg, T. C., Perlin, P. C., Liu, V., McDade, C. E., and Dillner, A. M.: Determination of organic matter and organic matter to organic carbon ratios by infrared spectroscopy with application to selected sites in the IMPROVE network, Atmos. Environ., 86, 47–57, https://doi.org/10.1016/j.atmosenv.2013.12.034, 2014.
Saltzman, E. S., Savoie, D. L., Prospero, J. M., and Zika, R. G.: Methanesulfonic acid and non-sea-salt sulfate in pacific air: Regional and seasonal variations, J. Atmos. Chem., 4, 227–240, https://doi.org/10.1007/BF00052002, 1986.
Sato, S., Higuchi, S., and Tanaka, S.: Structural Examinations of “Sodium FormaldehydeSulfoxylate” by Infrared and Raman Spectroscopy, Nippon Kagaku Kaishi, 1984, 1151–1157, https://doi.org/10.1246/nikkashi.1984.1151, 1984.
Segneanu, A. E., Gozescu, I., Dabici, A., Sfirloaga, P., and Szabadai, Z.: Organic Compounds FT-IR Spectroscopy, IntechOpen, https://doi.org/10.5772/50183, 2012.
Seinfeld, J. H. and Pandis, S. N.: Atmospheric Chemistry and Physics: From Air Pollution to Climate Change, Wiley, John Wiley & Sons, Inc., Hoboken, New Jersey, 3rd Edn., ISBN 9781118947401, 2016.
Shurvell, H. F.: Spectra – Structure Correlations in the Mid- and Far-Infrared, in: Handbook of Vibrational Spectroscopy, American Cancer Society, https://doi.org/10.1002/0470027320.s4101, 2006.
Smith, S. J., van Aardenne, J., Klimont, Z., Andres, R. J., Volke, A., and Delgado Arias, S.: Anthropogenic sulfur dioxide emissions: 1850–2005, Atmos. Chem. Phys., 11, 1101–1116, https://doi.org/10.5194/acp-11-1101-2011, 2011.
Song, S., Gao, M., Xu, W., Sun, Y., Worsnop, D. R., Jayne, J. T., Zhang, Y., Zhu, L., Li, M., Zhou, Z., Cheng, C., Lv, Y., Wang, Y., Peng, W., Xu, X., Lin, N., Wang, Y., Wang, S., Munger, J. W., Jacob, D. J., and McElroy, M. B.: Possible heterogeneous chemistry of hydroxymethanesulfonate (HMS) in northern China winter haze, Atmos. Chem. Phys., 19, 1357–1371, https://doi.org/10.5194/acp-19-1357-2019, 2019.
Spectral Database for Organic Compounds,SDBS: https://sdbs.db.aist.go.jp/sdbs/cgi-bin/direct_frame_top.cgi, last access: 22 February 2022.
Stone, E. A., Yang, L., Yu, L. E., and Rupakheti, M.: Characterization of organosulfates in atmospheric aerosols at Four Asian locations, Atmos. Environ., 47, 323–329, https://doi.org/10.1016/j.atmosenv.2011.10.058, 2012.
Surratt, J. D., Chan, A. W. H., Eddingsaas, N. C., Chan, M., Loza, C. L., Kwan, A. J., Hersey, S. P., Flagan, R. C., Wennberg, P. O., and Seinfeld, J. H.: Reactive intermediates revealed in secondary organic aerosol formation from isoprene, P. Natl. Acad. Sci. USA, 107, 6640–6645, https://doi.org/10.1073/pnas.0911114107, 2010.
Tang, K.: Chemical Diversity and Biochemical Transformation of Biogenic Organic Sulfur in the Ocean, Front. Mar. Sci., 7, 68, https://doi.org/10.3389/fmars.2020.00068, 2020.
U.S. EPA: Comptox Chemicals Dashboard, https://comptox.epa.gov/dashboard/chemical/details/DTXSID80805075 (last access: 14 November 2022), Methyl 10,10-diethoxydec-2-ene-4,6,8-triynoate, 2022.
Wang, Y., Zhao, Y., Wang, Y., Yu, J.-Z., Shao, J., Liu, P., Zhu, W., Cheng, Z., Li, Z., Yan, N., and Xiao, H.: Organosulfates in atmospheric aerosols in Shanghai, China: seasonal and interannual variability, origin, and formation mechanisms, Atmos. Chem. Phys., 21, 2959–2980, https://doi.org/10.5194/acp-21-2959-2021, 2021.
Wei, L., Fu, P., Chen, X., An, N., Yue, S., Ren, H., Zhao, W., Xie, Q., Sun, Y., Zhu, Q.-F., Wang, Z., and Feng, Y.-Q.: Quantitative Determination of Hydroxymethanesulfonate (HMS) Using Ion Chromatography and UHPLC-LTQ-Orbitrap Mass Spectrometry: A Missing Source of Sulfur during Haze Episodes in Beijing, Environ. Sci. Technol. Lett., 7, 701–707, https://doi.org/10.1021/acs.estlett.0c00528, 2020.
Yazdani, A., Dudani, N., Takahama, S., Bertrand, A., Prévôt, A. S. H., El Haddad, I., and Dillner, A. M.: Fragment ion–functional group relationships in organic aerosols using aerosol mass spectrometry and mid-infrared spectroscopy, Atmos. Meas. Tech., 15, 2857–2874, https://doi.org/10.5194/amt-15-2857-2022, 2022.
Zawadowicz, M. A., Proud, S. R., Seppalainen, S. S., and Cziczo, D. J.: Hygroscopic and phase separation properties of ammonium sulfate/organics/water ternary solutions, Atmos. Chem. Phys., 15, 8975–8986, https://doi.org/10.5194/acp-15-8975-2015, 2015.
Zeng, G., Kelley, J., Kish, J. D., and Liu, Y.: Temperature-Dependent Deliquescent and Efflorescent Properties of Methanesulfonate Sodium Studied by ATR-FTIR Spectroscopy, The J. Phys. Chem. A, 118, 583–591, https://doi.org/10.1021/jp405896y, 2014.
Zhao, X., Shi, X., Ma, X., Zuo, C., Wang, H., Xu, F., Sun, Y., and Zhang, Q.: 2-Methyltetrol sulfate ester-initiated nucleation mechanism enhanced by common nucleation precursors: A theory study, Sci. Total Environ., 723, 137987, https://doi.org/10.1016/j.scitotenv.2020.137987, 2020.
Zhong, L. and Parker, S. F.: Structure and vibrational spectroscopy of methanesulfonic acid, Roy. Soc. Open Sci., 5, 181363, https://doi.org/10.1098/rsos.181363, 2022.