the Creative Commons Attribution 4.0 License.
the Creative Commons Attribution 4.0 License.
 | 09 Aug 2023
Optimal estimation retrieval of tropospheric ammonia from the Geostationary Interferometric Infrared Sounder on board FengYun-4B
Chengli Qi
Lieven Clarisse
Martin Van Damme
Atmospheric ammonia (NH3) is a reactive nitrogen compound that pollutes our environment and threatens public health. Monitoring the spatial and temporal variations is important for quantifying its emissions and depositions and evaluating the strategies for managing anthropogenic sources of NH3. In this study, we present an NH3 retrieval algorithm based on the optimal estimation method for the Geostationary Interferometric Infrared Sounder (GIIRS) on board China's FengYun-4B satellite (FY-4B/GIIRS). In particular, we examine the information content based on the degree of freedom for signal (DOFS) in retrieving the diurnal NH3 in East Asia, with a focus on two source regions including the North China Plain and North India. Our retrieval is based on the FengYun Geostationary satellite Atmospheric Infrared Retrieval (FY-GeoAIR) algorithm and exploits the strong NH3 absorption window of 955–975 cm−1. Retrieval results using FY-4B/GIIRS spectra from July to December 2022 show that the DOFS for the majority ranges from 0 to 1.0, mainly depending on the thermal contrast (TC) defined as the temperature difference between the surface and the lowest atmospheric layer. Consistent with retrievals from low-Earth-orbit (LEO) infrared sounders, the detection sensitivity, as quantified by the averaging kernel (AK) matrix, peaks in the lowest 2 km atmospheric layers. The DOFS and TC are highly correlated, resulting in a typical “butterfly” shape. That is, the DOFS increases when TC becomes either more positive or more negative. The NH3 columns from FY-4B/GIIRS exhibit significant diurnal cycles that are consistent with the day–night gradient from the collocated IASI retrievals in the North China Plain and North India for the averages in July–August, September–October, and November–December, respectively. A collocated point-by-point intercomparison with the IASI NH3 dataset shows generally good agreement with a small systematic difference in the summer months that may be attributed to the slight difference in a priori profiles. This study demonstrates the capability of FY-4B/GIIRS in capturing the diurnal NH3 changes in East Asia, which will have the potential to improve regional and global air quality and climate research.
- Article
(10853 KB) - Full-text XML
-
Supplement
(1858 KB) - BibTeX
- EndNote


Atmospheric ammonia (NH3) is a reactive nitrogen compound that plays an important role in the global nitrogen cycle (Galloway et al., 2004). Its emissions to the atmosphere are destined to increase in the coming decades primarily driven by agriculture emissions coming from the excess use of nitrogen fertilizers (Fowler et al., 2013). Changes in NH3 emissions have many negative environmental impacts, including the loss of biodiversity (Erisman et al., 2013), the eutrophication of water bodies and the acidification of terrestrial ecosystems (Paerl et al., 2014), and the change in radiative forcing that affect global and local climate (Abbatt et al., 2006; Isaksen et al., 2009). In addition, ammonia reacts with acids (e.g., H2SO4, HNO3) and produces ammonium-containing aerosols that degrade air quality (Seinfeld and Pandis, 2006). Monitoring the spatial distribution and temporal variations of atmospheric NH3 is therefore important for quantifying NH3's emissions and depositions and evaluating the strategies for managing anthropogenic sources of NH3.
Over the past decade, spaceborne observations of NH3 have provided measurements with daily global coverage that greatly improve our understanding of the sources, depositions, and variabilities of NH3 (e.g., Zhu et al., 2015; Warner et al., 2017; Van Damme et al., 2018, 2021). The capability of using an infrared hyperspectral sounder to detect NH3 was first demonstrated using observations from the Tropospheric Emission Spectrometer (TES; Beer et al., 2008; Shephard et al., 2011) and the Infrared Atmospheric Sounding Interferometer (IASI; Clarisse et al., 2009, 2010; Coheur et al., 2009). In addition, NH3 has been detected in the Asian summer monsoon upper troposphere using the emission spectra from the infrared limb sounder Michelson Interferometer for Passive Atmospheric Sounding (MIPAS; Höpfner et al., 2016). Currently, long-term measurements of NH3 are available from IASI (Van Damme et al., 2021), the Cross-track Infrared Sounder (CrIS; Shephard et al., 2020), the Atmospheric Infrared Sounder (AIRS; Warner et al., 2016), and the Thermal and Near-infrared Spectrometer for Observation-Fourier Transform Spectrometer (TANSO-FTS; Someya et al., 2020). However, the above-mentioned polar-orbiting satellites can only make up to two overpass measurements each day over the same location. The diurnal cycle of NH3 is therefore under-constrained from polar-orbit observations. Since NH3 is a highly reactive compound, it has a relatively short lifetime, ranging from a few hours to days (Aneja et al., 2001). As a result, NH3 presents a large spatial heterogeneity and temporal variability. The important information on the diurnal cycle is therefore critical to constrain the emission, deposition, and transport processes of NH3 and the role of meteorological conditions in driving these processes.
The Geostationary Interferometric Infrared Sounder (GIIRS) on board the FengYun-4B satellite (FY-4A/GIIRS) was launched in 2021 with improved sensitivity over its predecessor FY-4A/GIIRS launched in 2016 (Yang et al., 2017; Li et al., 2022). GIIRS was designed to probe the three-dimensional water vapor and temperature profiles for weather forecast purposes. With its high spectral resolution (0.625 cm−1) and sensitivity comparable to current low-Earth-orbit (LEO) satellites, FY-4B/GIIRS is suited for detecting the changes of various atmospheric trace gases (e.g., Zeng et al., 2023). The strength of using FY-4B/GIIRS lies in its capability to scan East Asia every 2 h with a spatial resolution of 12 km, offering a unique opportunity to constrain the diurnal cycles of critical atmospheric composition at high spatial resolution. The application of GIIRS in detecting NH3 has been successfully demonstrated using spectra collected by FY-4A based on an IASI retrieval method (Clarisse et al., 2021). The study showed that the unprecedented temporal sampling of GIIRS enables the measurement of diurnal and nocturnal variations of NH3. Since the retrieval method used in Clarisse et al. (2021) is based on a hyperspectral radiance index (HRI) and a trained neural network that relates the HRI to NH3 columns (Whitburn et al., 2016), the information content analysis for the GIIRS spectra was not fully investigated.
The optimal estimation method (Rodgers, 2000) that enables information content analysis has been applied in previous studies on retrieving NH3 from space (Clarisse et al., 2009, 2010; Shephard et al., 2011; Warner et al., 2016; Shephard et al., 2015; Someya et al., 2020). It was found that the information available from the infrared sounder spectra for quantifying NH3, especially its abundance in the planetary boundary layer (PBL), strongly depends on the thermal contrast (TC), which is defined as the temperature difference between the surface skin and the lowest atmospheric layer. Because of its short lifetime, NH3 is mostly concentrated in the PBL, and the peak sensitivity of NH3 detection from an infrared sounder is also found to be close to the surface. Previous studies (e.g., Clarisse et al., 2010) concluded that the TC and its abundance are two important factors that determine the intensity of the NH3 spectral signature and hence the NH3 information content. In general, higher NH3 concentrations and larger TC result in a more accurate estimate of NH3 from spaceborne measurements.
In this study, we applied the FY-GeoAIR retrieval algorithm developed by Zeng et al. (2023), based on the optimal estimation theory to retrieve NH3 from FY-4B/GIIRS. The primary goals are to quantify the information content of FY-4B/GIIRS observations in constraining the diurnal cycle of NH3 columns and to assess the impact of TC on the retrieval accuracy. The retrieval algorithm uses the absorption features of NH3's v2 rotational–vibrational band centered around 10.5 µm (∼ 950 cm−1). Our retrieval is implemented using the absorption microwindow (955–975 cm−1) that contains the strongest NH3 absorption feature. A similar microwindow has been used to retrieve NH3 using IASI (Clarisse et al., 2010) and GOSAT (Someya et al., 2020), while neural-network-based studies using the hyperspectral radiance index (HRI) adopted a much wider window (e.g., Whitburn et al., 2016). The remainder of the paper is organized as follows. The FY-4B/GIIRS observation mode and the collected spectra are introduced in Sect. 2. In Sect. 3, the FY-GeoAIR algorithm for NH3 retrieval is described. The retrieval results, information content analysis, intercomparison with IASI NH3 dataset, and related discussion are presented in Sect. 4, followed by conclusions in Sect. 5.
FY-4B/GIIRS is an infrared Fourier transform spectrometer based on a Michelson interferometer located at an altitude of 35 786 km above the Equator at 133∘ E. The primary goal is to probe the three-dimensional atmospheric structure of temperature and water vapor over East Asia for improving numerical weather forecast. Figure 1a shows the coverage of FY-4B/GIIRS over East Asia and part of South Asia and Southeast Asia in one measurement cycle which lasts 2 h. In each cycle, GIIRS makes 12 horizontal scans from north to south. Each scan sequence consists of 27 fields of regard (FORs) from west to east that collects upwelling infrared radiation of Earth scenes (ESs), followed by one deep space (DS) and one internal calibration target (ICT) measurement for ES radiometric calibration. For each FOR, a 2-dimensional infrared plane array detector, containing 16 × 8 pixels with a sparse arrangement, conducts the measurement over the target region. The starting hours for the 12 measurement cycles in a day were 00:00, 02:00, 04:00,…, 22:00 UTC, respectively, and were changed to 01:00, 03:00, 05:00,…, 23:00 UTC, respectively, after 6 September 2022. The observation domain, as shown in Fig. 1a, covers the two important NH3 emission source regions in Asia: the North China Plain and North India, as indicated by the bottom-up inventory map in Fig. 1b. The FY-4B/GIIRS observed spectra include a longwave infrared band from 680 to 1130 cm−1 and a mid-wave infrared band from 1650 to 2250 cm−1 with a uniform spectral resolution of 0.625 cm−1. With low instrument noise and a high spectral resolution similar to current LEO infrared sounders, GIIRS is in principle capable of measuring trace gases, including NH3 and carbon monoxide (Zeng et al., 2023), and providing full day–night diurnal cycle observations. The spatial footprint size of each pixel on the Earth's surface is about 12 km at Nadir, which is an improvement over FY-4A/GIIRS (16 km). Figure 1c shows an example of GIIRS spectra in the longwave band. Post-launch assessment of the radiometric performances of FY-4B/GIIRS using a series of blackbody calibration experiments showed that the noise-equivalent differential radiance (NedR) on average in the longwave infrared 900–1000 cm−1 bands, covering the NH3 absorption channel, is about 0.1 mW (m2 sr cm−1)−1 The corresponding noise-equivalent differential temperature (NedT) on average is about 0.1 K at 280 K blackbody. The low instrument noise for FY-4B/GIIRS, comparable to existing infrared sounders (e.g., ∼ 0.2 K at 280 K for IASI and ∼ 0.04 K at 280 K for CrIS; Van Damme et al., 2014; Shephard et al., 2020), makes it possible to accurately retrieve NH3 over East Asia.
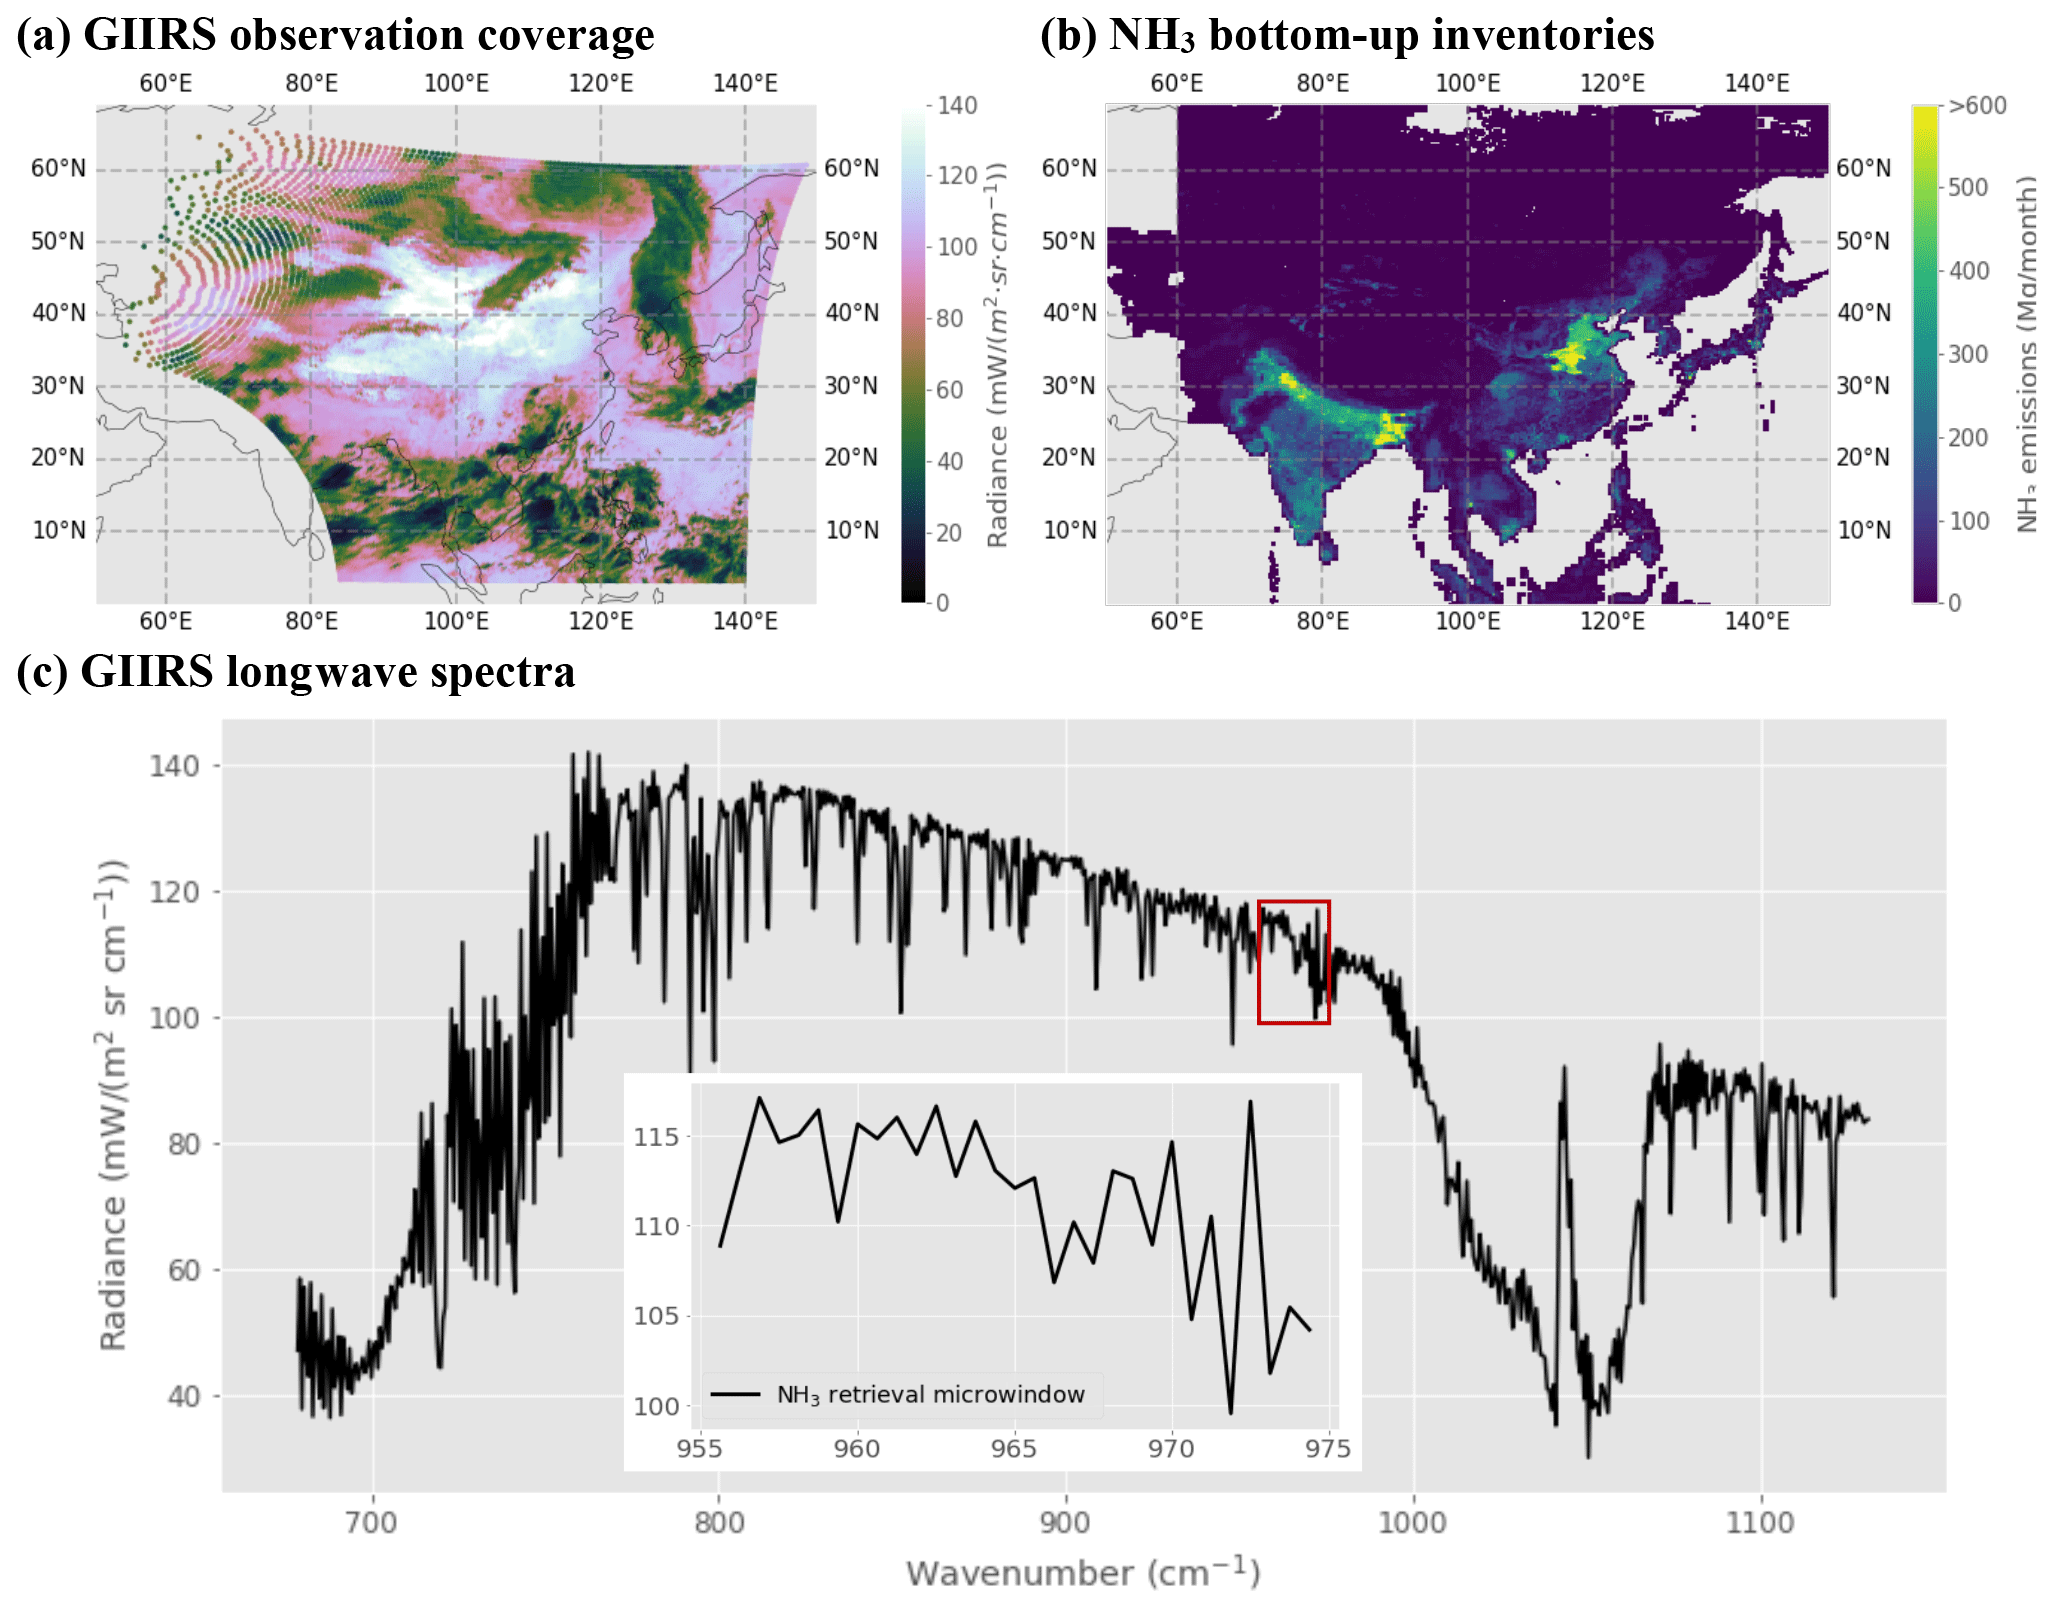
Figure 1(a) GIIRS observation coverage color-shaded using the observed radiance at 900 cm−1 from FY-4B/GIIRS measurements at 12:00–13:00 Beijing time (BJT) on 7 July 2022. (b) Bottom-up NH3 inventory emissions averaged from July to December 2010. These are the total amount combining emissions from agricultural, industrial, power plant, residential, and transportation sectors. This emission inventory is adopted from the MIX dataset (Li et al., 2017). (c) Example of FY-4B/GIIRS-measured longwave spectra, which cover the NH3 absorption band centered around 950 cm−1. The microwindow for NH3 retrieval is also shown by the red rectangle and as an inset. The NH3 absorption features are shown in Fig. 2.
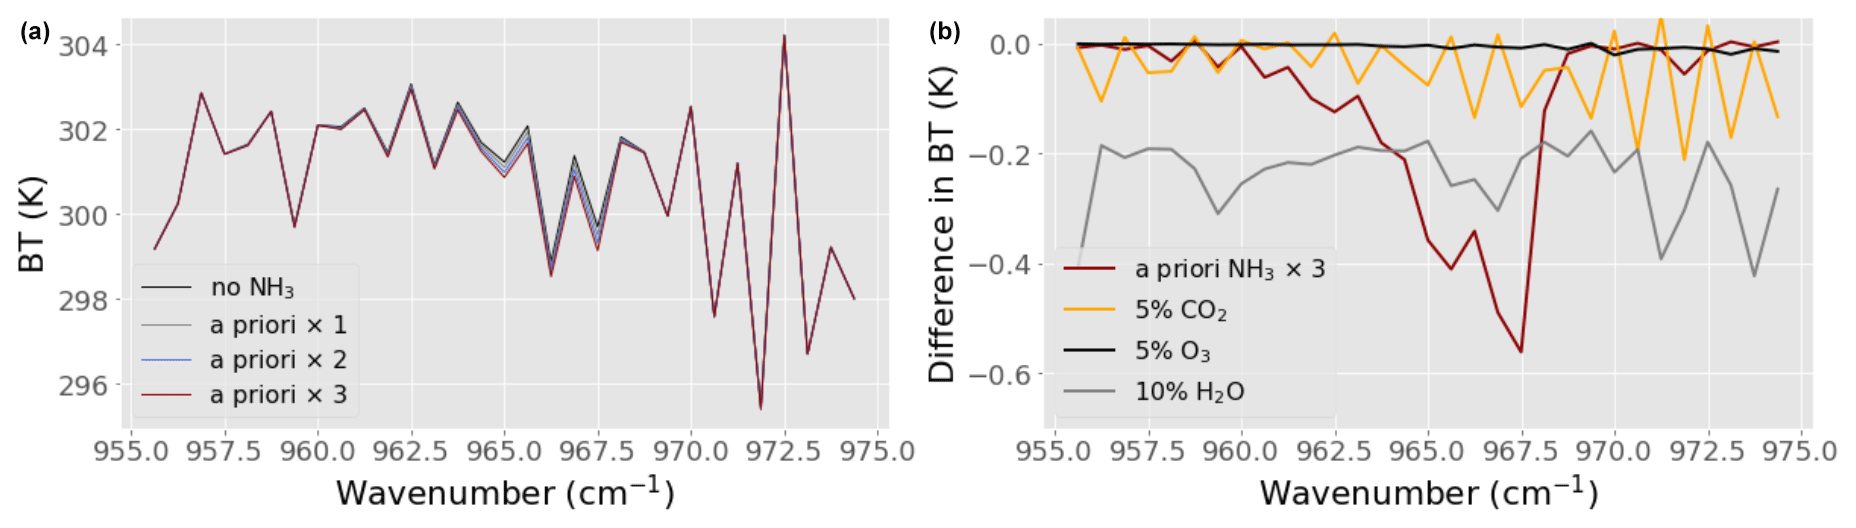
Figure 2Sensitivity experiment comparing absorptions of NH3, CO2, O3, and H2O in the 955–975 cm−1 microwindow used for FY-4B/GIIRS NH3 retrieval. The microwindow covers the strong absorption features of the NH3 v2 vibrational–rotational band. (a) The comparison of simulated spectra using the forward model with three different NH3 concentrations based on the a priori NH3 profiles shown in Fig. 3. (b) The absorption difference between NH3 and important interference gases including CO2, O3, and H2O that have been perturbed by a certain factor.
All cloud-screened FY-4B/GIIRS spectra acquired over land with a viewing zenith angle less than 70∘ are used in the retrieval. To filter out cloudy pixels, we use the higher-resolution (4 km) level-2 cloud mask (CLM) data product from the Advanced Geostationary Radiation Imager (AGRI) on board FY-4B. When at least 7 of the 9 collocating AGRI pixels are either clear or probably clear, the GIIRS pixel is labeled as clear.
The FengYun Geostationary satellite Atmospheric Infrared Retrieval (FY-GeoAIR) algorithm was originally developed for retrieving carbon monoxide from FY-4B/GIIRS spectra. The algorithm combines a forward radiative transfer model to simulate upwelling thermal radiation and an optimal estimation-based inverse model to retrieve trace gases and auxiliary parameters from the observed spectra. Here, a brief introduction to FY-GeoAIR is given with descriptions of changes needed to adapt it to NH3 retrieval. More details about the FY-GeoAIR retrieval algorithm can be found in Zeng et al. (2023).
3.1 The forward radiative transfer model for simulating observed spectra
An accurate radiative transfer (RT) model is an important component in the inversion system for simulating upwelling thermal radiation that would be observed by FY-4B/GIIRS when given the relevant atmospheric, surface, and instrumental parameters as inputs. The upwelling spectral radiance is computed following the radiative transfer theory for thermal radiation that has been described in Clough et al. (2006) and Hurtmans et al. (2012). Under clear-sky conditions, scattering by clouds and aerosols can be ignored. The upwelling radiance received by FY-4B/GIIRS can be accurately approximated by the sum of four main components, including the upwelling surface emission, the upwelling atmospheric emission integrated from the bottom to the top of the atmosphere, the surface-reflected downwelling atmospheric emission, and the surface-reflected solar radiation. Although the last component is very small in the longwave band, it is added here for completeness. The absorption microwindow (955–975 cm−1) used for retrieval is shown in Fig. 2a. The microwindow contains strong NH3 absorption features that are distinguishable from important interference gases (CO2, O3 and H2O) in the absorption window, as demonstrated in Fig. 2 from a sensitivity experiment that compares absorptions of NH3 and perturbed interference gases.
The atmospheric, surface, and instrumental parameters used to drive the forward model are adopted from various sources. These parameters are the atmospheric state such as the profiles of temperature, water vapor, and atmospheric composition; the surface parameters such as the surface emissivity; and the instrumental specifications such as instrument spectral response function and observing geometries. Specifically, the atmospheric temperature, H2O, and O3 data are extracted from European Centre for Medium-Range Weather Forecasts (ECMWF) Reanalysis v5 (ERA5) data (Hersbach et al., 2020), and CO2 is extracted from ECMWF Copernicus Atmosphere Monitoring Service (CAMS) global inversion-optimized greenhouse gas fluxes and concentrations (ECMWF, 2022). For the surface land data, we used the global infrared land surface emissivity database from the University of Wisconsin-Madison (UOW-M) (Seemann et al., 2008). The emissivity values at 925 and 1075 cm−1 are used to estimate the a priori emissivity for the retrieval microwindow. Two factors (slope and curvature) are used in the state vector to scale the wavelength-dependent emissivity values; surface skin temperature and surface pressure are extracted from ERA5 hourly data on a single level (Hersbach et al., 2020). The absorption coefficient lookup tables for calculating gas absorption are built using the extensively validated Line-By-Line Radiative Transfer Model (LBLRTM v12.11; Clough et al., 2005).
Since the NH3 is short-lived and highly concentrated in the PBL, we therefore only retrieve the layers below 200 hPa. The forward model uses fixed vertical grids with equally separated layers with similar thickness (about 1 km for layers below 200 hPa and about 5 km for layers above), which is close to the grid settings in Hurtmans et al. (2012) and Clough et al. (2005). The thickness of the bottom layer is variable and determined by the surface pressure of a specific location. The number of layers below 200 hPa ranges from 7 (for high-altitude regions such as the Tibet Plateau) to 11 layers (for low-altitude regions such as the ocean).
3.2 The retrieval algorithm in FY-GeoAIR based on optimal estimation theory
The goal of the retrieval algorithm for retrieving NH3 from FY-4B/GIIRS based on optimal estimation theory is to find a solution for the state vector, which consists of NH3 profile and auxiliary parameters, such that the simulated spectra from the RT forward model best fit the measured spectra. The auxiliary parameters include the H2O profile, scale factors for the columns of the remaining interference gases, the surface skin temperature, and scale factors for the atmospheric temperature profile. The solution from the retrieval algorithm is the state vector which minimizes the spectral fitting error. The Levenberg–Marquardt modification of the Gauss–Newton method is used to search the solution. The optimal estimation method has been described thoroughly in Rodgers (2000) and applied in several previous studies by the group (Zeng et al., 2017, 2021; Natraj et al., 2022; Zeng et al., 2023). The parameters in the state vector to be retrieved from the algorithm are listed in Table 1. Vertical profiles of NH3 and H2O are retrieved, while for minor interference gases, total columns are retrieved by scaling an a priori profile. Other parameters to be retrieved include the surface skin temperature, a scaling factor for the atmospheric temperature profile, and the slope and curve for the surface emissivity. We only retrieve the layers below 200 hPa and use the a priori profile for layers above to compute total columns.
Table 1Parameters in the state vector to be retrieved from the retrieval algorithm.
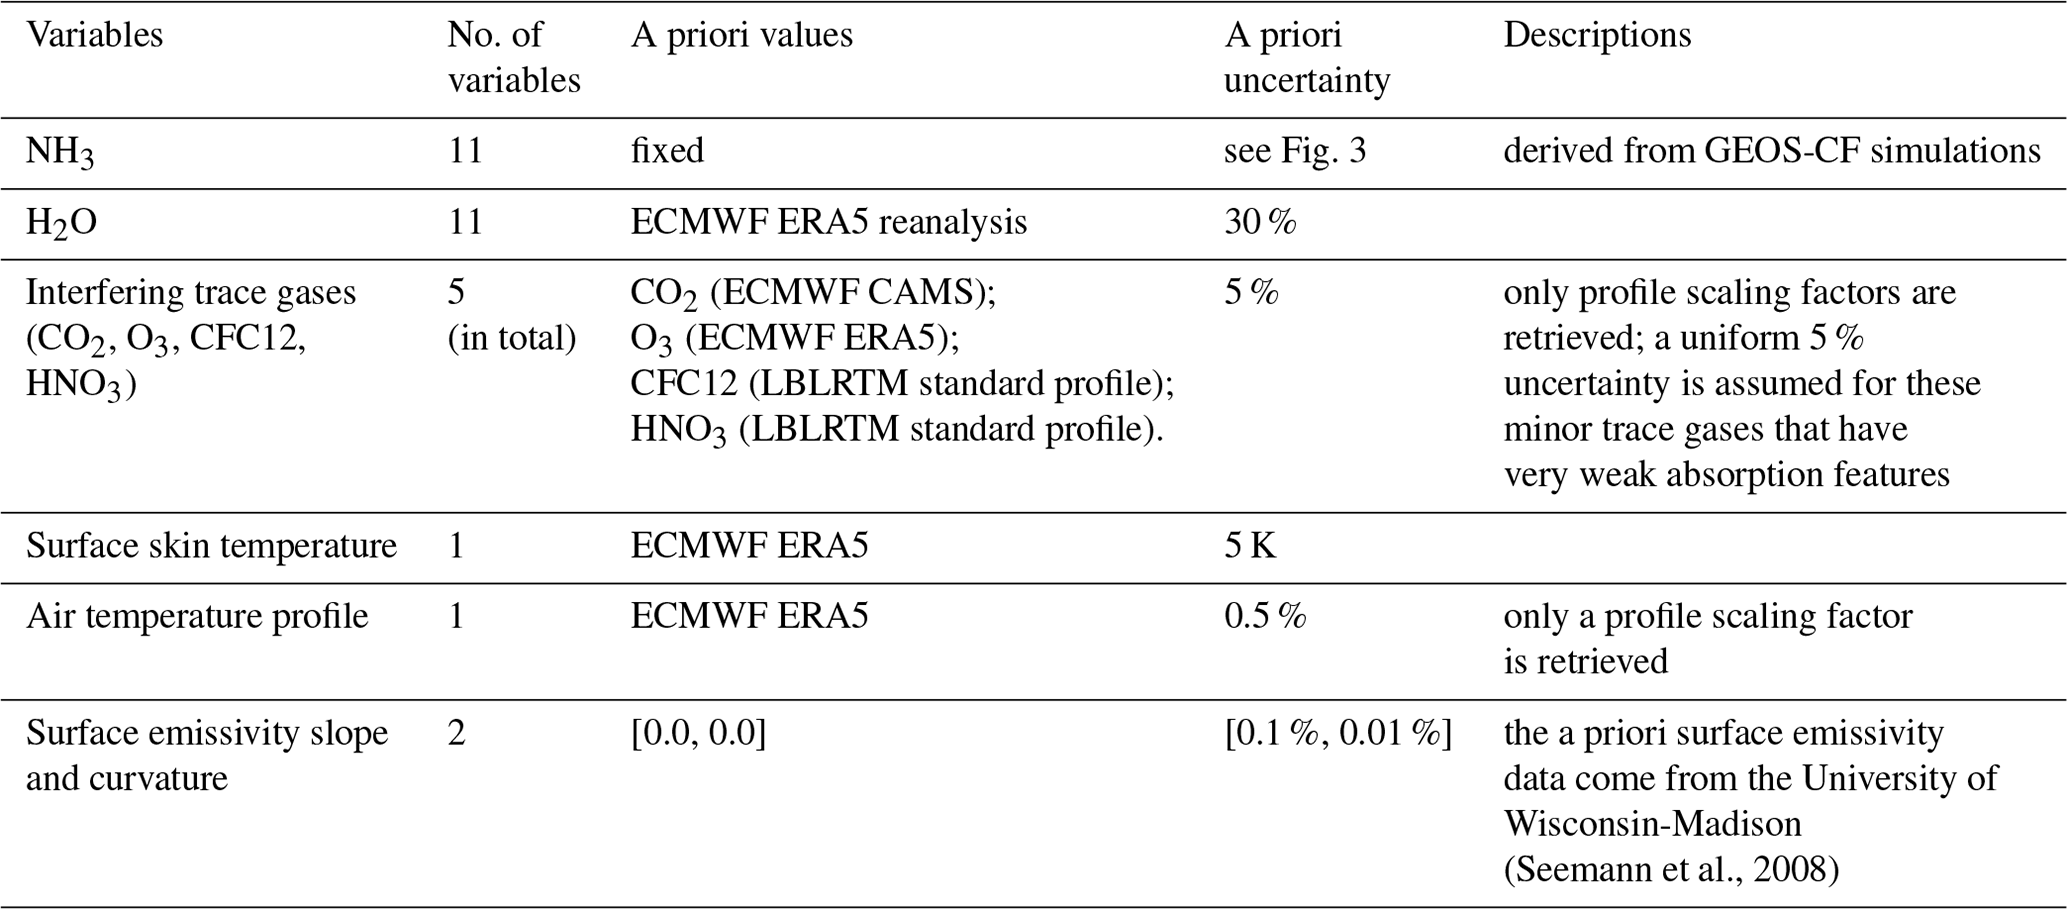
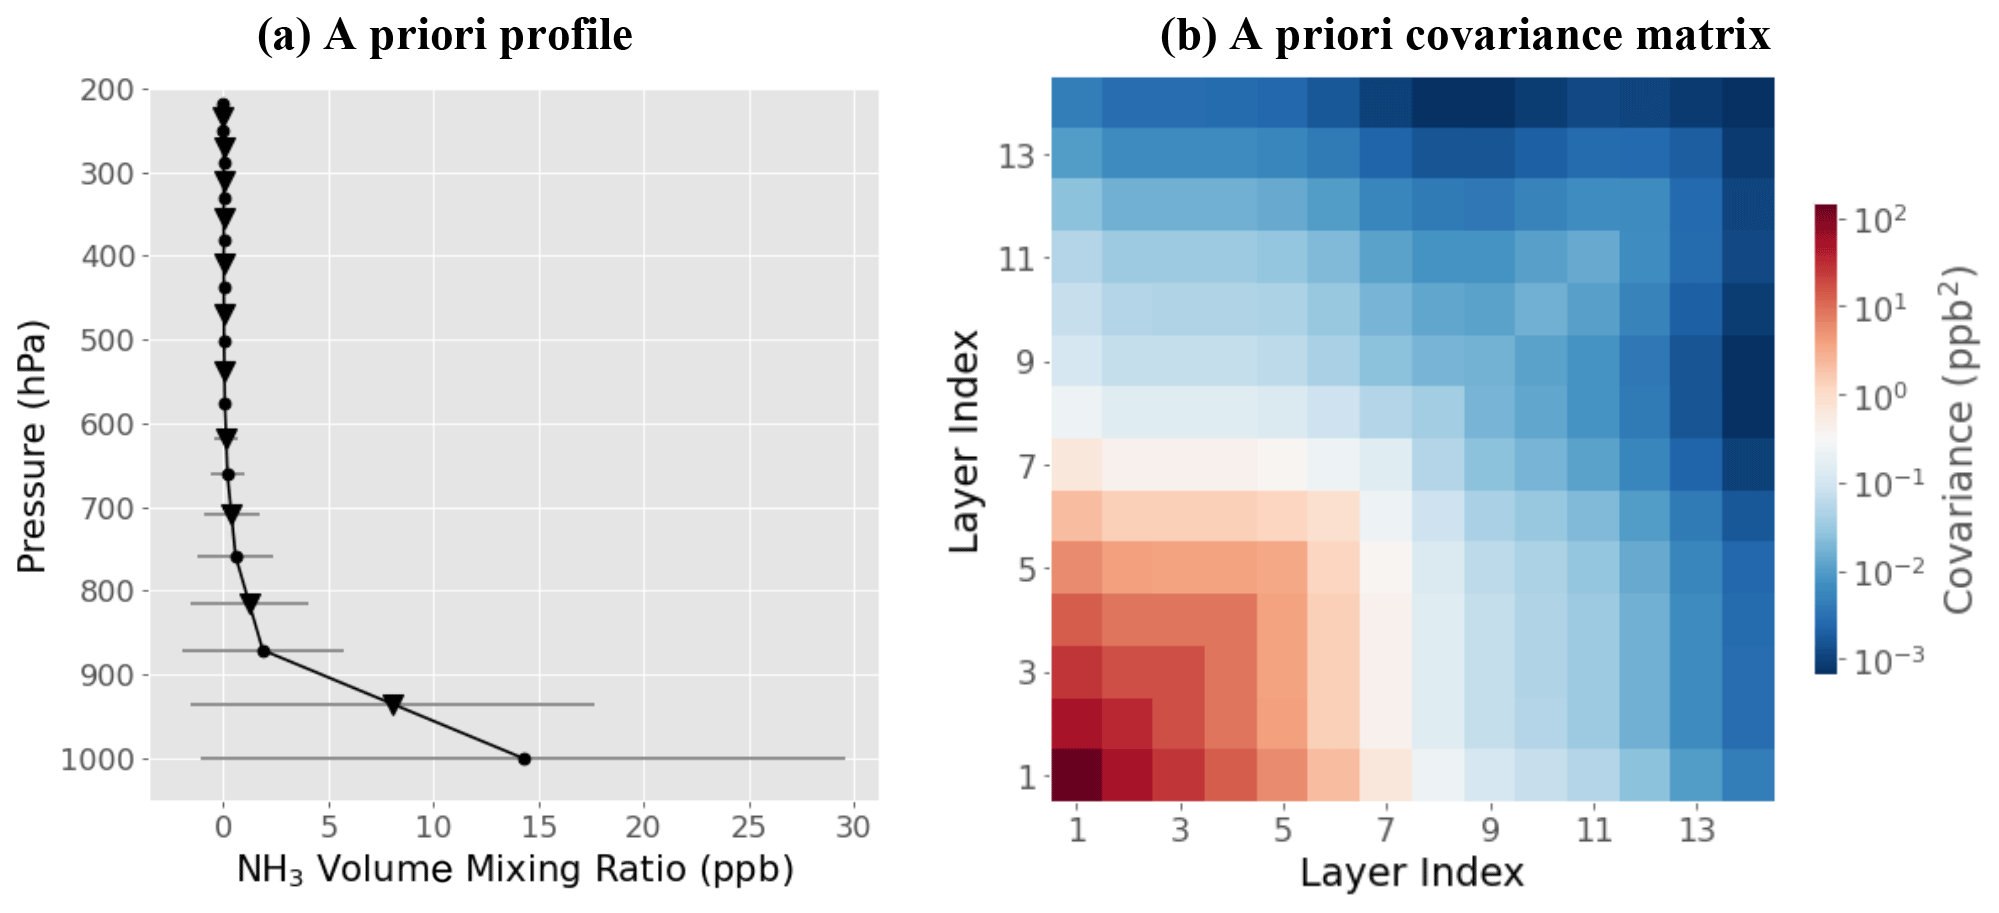
Figure 3(a) The a priori NH3 profile used for retrievals of NH3 in the FY-GeoAIR algorithm for FY-4B/GIIRS. This profile is computed from the GEOS-CF NH3 simulations (Keller et al., 2021) in 2022 in representative land regions in East Asia (20–60∘ N, 110–120∘ E) and South Asia (20–40∘ N, 70–100∘ E). The error bars represent 1 standard deviation for different layers from all NH3 profiles. (b) The a priori covariance matrix is constructed from the error estimate in the a priori profile and the correlation matrix with a correlation length of 3 km. See text for details.
Two important metrics from the optical estimation method for interpreting the retrieval results are the DOFS and averaging kernel (AK) matrix. The AK matrix is a metric that quantifies the sensitivity of the retrieval to the true state by the observing system. The full AK matrix (m×m) is given by
where each element Aij of A represents the derivative of the NH3 retrieval at level i with respect to the NH3 truth at level j. The matrix dimension m is the number of atmospheric layers; K is the Jacobian matrix, which is the first derivative of the forward model with respect to the state vector; Sa is the a priori covariance matrix for the state vector; and Sε is the measurement error covariance matrix, which is assumed to be a diagonal matrix constructed using the spectra noise estimates. Note that similar to the CO retrieval algorithm (Zeng et al., 2023), we have enlarged the spectra noise by a factor of 2.0 such that the averaged reduced χ2 value from the optimal estimation NH3 retrieval is close to 1.0. This extra noise represents the unaccounted uncertainty from the forward model and absorption spectroscopy by the original instrument noise alone.
A “perfect” observing system, which has sufficiently good sensitivity to each element in the retrieval vector, would have an AK matrix close to an identity matrix by theory. In reality, the detectivity is limited by various factors including the spectral noise, a priori uncertainty, and the sensitivity of the spectra to the geophysical variables in the state vector. As a result, the AK can be very different from an identity matrix. In general, the information from the true state is smoothed vertically over different layers by the retrieval algorithm. In this case, the rows of AK represent the smoothing functions. As described in Rodgers (2000), the trace of the AK matrix is defined as the DOFS, which represents the number of independent elements of information extracted from the spectra by the retrieval algorithm for constraining NH3. The DOFS is an important metric that quantifies the vertical resolution of the retrieval profile. For example, a DOFS of 1.0 means that, given the assumed Sa, at least one independent piece of information can be retrieved from the spectral measurement to constrain the vertical distribution of NH3. Note that the DOFS is highly dependent on the magnitude of the assume Sa, an indicator of the a priori knowledge. If Sa characterizes a weaker constraint, indicating less a priori knowledge, the DOFS will be higher as relatively more information will be taken from the measurement.
3.3 The a priori NH3 profile and covariance matrix
A fixed a priori profile is preferred for the purpose of this study for two reasons: (1) a fixed a priori profile eases the interpretation of the results compared to a time-varying a priori profile. Any changes seen in the spatial and temporal patterns in NH3 relative to the a priori profile reflect the information gained from the FY-4B/GIIRS spectra. (2) It is not applicable to get a reasonable a priori estimate for all hours in a day from just the spectra (e.g., using channel brightness temperature difference as in Shephard et al., 2011, and Warner et al., 2016) without relying on model simulations because the diurnal change of TC that affects geostationary (GEO) satellite observation is much more complex than that in the two overpasses for LEO satellite each day. The single a priori NH3 profile, as shown in Fig. 3a, for all retrievals in the retrieval algorithm is derived from NH3 simulations from the Goddard Earth Observing System composition forecast (GEOS-CF; Keller et al., 2021) model developed by NASA's Global Modeling and Assimilation Office (GMAO). A year of simulation in 2022 is used to get the mean and standard deviation of NH3 vertical distribution. To avoid oversampling of the background regions, only simulations in the representative land regions in East Asia (20–60∘ N, 110–120∘ E) and South Asia (20–40∘ N, 70–100∘ E) are used. The negative value toward the lower end of the error bar does not have physical meaning; it is caused by the large standard deviation derived from model simulations that do not strictly follow a normal distribution. The a priori total NH3 column is about 1.5×10¹⁶ molec. cm−2. To construct the correlation matrix, we used a correlation length of 3 km based on our analysis of the GEOS-CF reanalysis. Most of the layers show correlation lengths between 1 to 3 km, and we use an upper bound (3 km) to increase the stability of the retrieval system. The covariance matrix calculated based on the a priori error and the correlation matrix is shown in Fig. 3b.
3.4 Post-filtering of NH3 retrievals
After cloud screening, there are 11.7 million clear-sky data points in total for the 6 months from July to December 2022. In the post-processing, multiple filters are applied to ensure good retrieval quality. First, retrievals that fail to converge after 10 iterations are excluded. Second, retrievals with a goodness of fit, quantified by reduced χ2, of less than 1.5 are excluded. Lastly, retrievals with a RMSE of the fitting residual larger than 0.25 K are excluded. After post-filtering, about 10.5 million data points pass the filters. The histograms of the reduced χ2 and spectral fitting residual are shown in Fig. S1 in the Supplement (after filtering) and Fig. S2 (before filtering). The average reduced χ2 after post-filtering is 0.76, suggesting a satisfactory goodness of fit. In the following analysis, an extra filter based on DOFS may apply to exclude data with low DOFS and, therefore, low information content extracted from the observed spectra.
3.5 Retrieval experiments for quantifying retrieval error
A synthetic experiment is carried out by (1) generating simulated synthetic spectra based on pre-determined NH3 profiles which can be regarded as the “truth”, (2) adding assumed noise according to the spectra noise of FY-4B/GIIRS, and (3) applying the FY-GeoAIR algorithm to retrieve NH3. By comparing the retrieval to the “truth”, we can evaluate the performance of the retrieval algorithm and its relationship with relevant driving factors. In this experiment, the “truth” NH3 profiles are extracted from the GEOS-CF model simulations on 6 representative days: 7 July, 5 August, 6 September, 10 October, 15 November, and 18 December 2022, when the available number of clear-sky observations is among the largest in the specific month. By randomly sampling 500 data points for each observation cycle from the FY-4B/GIIRS clear-sky observations, we carried out 36 000 simulations in total. The retrieved NH3 columns are finally compared with the “truth” and correlated with the DOFS, as shown in Fig. 4. Simulations with a DOFS less than 0.3 are not shown due to their high uncertainty and low information content extracted from the spectra measurement. The scatter plot suggests that the consistency between the retrieval and the “truth” increases when the DOFS becomes larger. For retrievals with a low DOFS, the retrieval values are close to the a priori value, which is about 1.5×10¹⁶ molec. cm−2. For the several outliers that have a high DOFS but with poor retrieval, it is likely because the “truth” NH3 profile structure is far away from the a priori profile structure. For a DOFS >0.5, the RMSE of the retrieval is about 1.67×10¹⁶ molec. cm−2, while for DOFS >0.7, the RMSE reduces to 1.37×10¹⁶ molec. cm−2, representing error for a single retrieval. Since the retrieved NH3 columns have a monthly mean between 2.0×10¹⁶ and 6.0×10¹⁶ molec. cm−2 (as shown in Sect. 4.2), this synthetic experiment results indicate that the retrieval error is on average between 23 % and 68 % for a single retrieval when the DOFS >0.7. On the other hand, when an ensemble mean (e.g., monthly mean) of NH3 columns is derived, the resulting error for the mean can be much smaller (reduced by a factor of , where N is the number of observations) when a large number of observations is available.
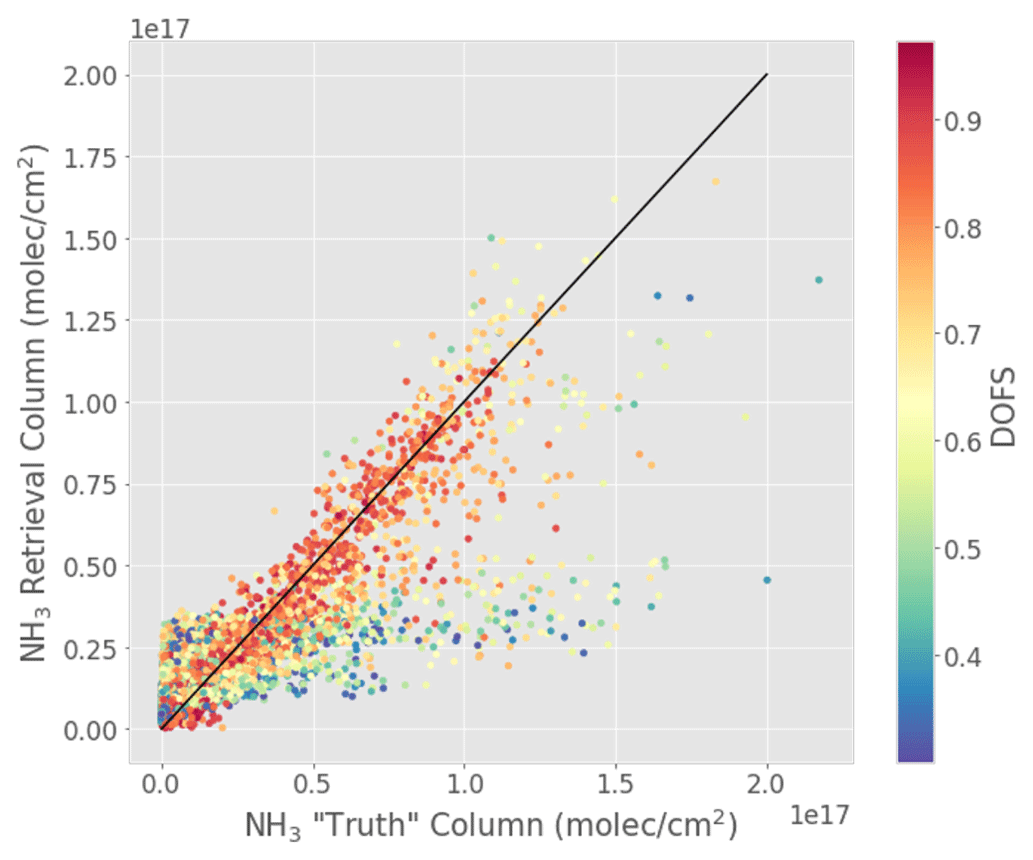
Figure 4Comparison of retrieval and the “truth” NH3 columns from the synthetic experiment. The retrieved NH3 columns are based on simulated spectra generated based on pre-determined NH3 profiles (“truth”). The data points have been filtered by DOFS >0.3 and are color-coded by the corresponding DOFS value. The RMSE of the retrieved NH3 columns relative to the “truth” is about 1.67×10¹⁶ molec. cm−2 for DOFS >0.5 and 1.37×10¹⁶ molec. cm−2 for DOFS >0.7.
In addition, two more experiments have been carried out to (1) compare the difference in retrievals from a different microwindow (920–940 cm−1) to investigate the possible impact of spectral noise and (2) investigate the impact of the a priori NH3 vertical shape on the retrievals. The details are described in Sects. S1 and S2 in the Supplement, respectively. The results show that the DOFS values show high consistencies, with a correlation coefficient of 0.97, suggesting the two microwindows contain similar information in capturing the NH3 variabilities. The correlation coefficient between the two retrieved NH3 column datasets is 0.81, with a root mean square error of 3.2×10¹⁵ molec. cm−2, suggesting the spectral noise is not causing large bias. The results show that the mean and standard deviation of the fractional error are 1.0 % and 9.65 %, respectively, for the reduced PBL excess profile, and 0.9 % and 7.6 %, respectively, for the enhanced PBL excess profile. Fortunately, there is no large systematic bias, and the averaged error is within 10 % in our cases where profiles differ by a factor of 2.
4.1 Information content analysis based on the DOFS and the AK matrix
This section conducted information content analysis by investigating the spatial and diurnal changes of DOFS from NH3 retrievals and how the DOFS changes are related to TC. In addition, we examine the diurnal changes of the vertical sensitivity as quantified by AK matrix. In particular, we focus on three representative regions including source regions in the North China Plain, North India, and a background region in Mongolia.
The spatial maps of DOFS, as shown in Fig. 5, for different times in a day clearly show the spatial gradient and diurnal change. In July and October, the DOFS values in the afternoon are usually the highest and those in the evening the lowest. In December, nighttime DOFS are significantly higher than other seasons. Previous studies by Clarisse et al. (2010, 2021) and Bauduin et al. (2017) using IASI observations have shown that the DOFS is primarily driven by the TC. When thermal contrast is close to zero, measurement sensitivity is low, and the DOFS values are close to zero. Large positive TC increases sensitivity and results in NH3 spectral signatures that are seen in absorption. Large negative TC also allows for sensitive measurements, this time allowing NH3 spectral signatures to be seen in emission. Negative TC corresponds to the situation where the atmosphere is warmer than the surface, allowing to decorrelate the surface layer with the rest of the lower troposphere. In addition, higher concentration of target gases provides stronger detectivity than lower concentration. The relationships between TC and the DOFS are illustrated in Fig. 6 for the three representative regions, including (1) the North China Plain, which represents industrialized and agricultural regions with persistently high NH3 emissions; (2) North India, which represents another important NH3 source region in Asia; and (3) Mongolia, which represents a NH3 background region. A typical “butterfly” shape can be seen in almost all cases, except for North India in July when there are much fewer observations due to clouds. In general, the DOFS increases when the TC becomes either more positive or more negative, consistent with results from Clarisse et al. (2010) and Bauduin et al. (2017) based on polar-orbiting satellites. In NH3 source regions (e.g., the North China Plain and North India), the DOFS values are higher for the same TC compared with non-source region (e.g., Mongolia), suggesting the contribution from higher NH3 concentration to the total information content.
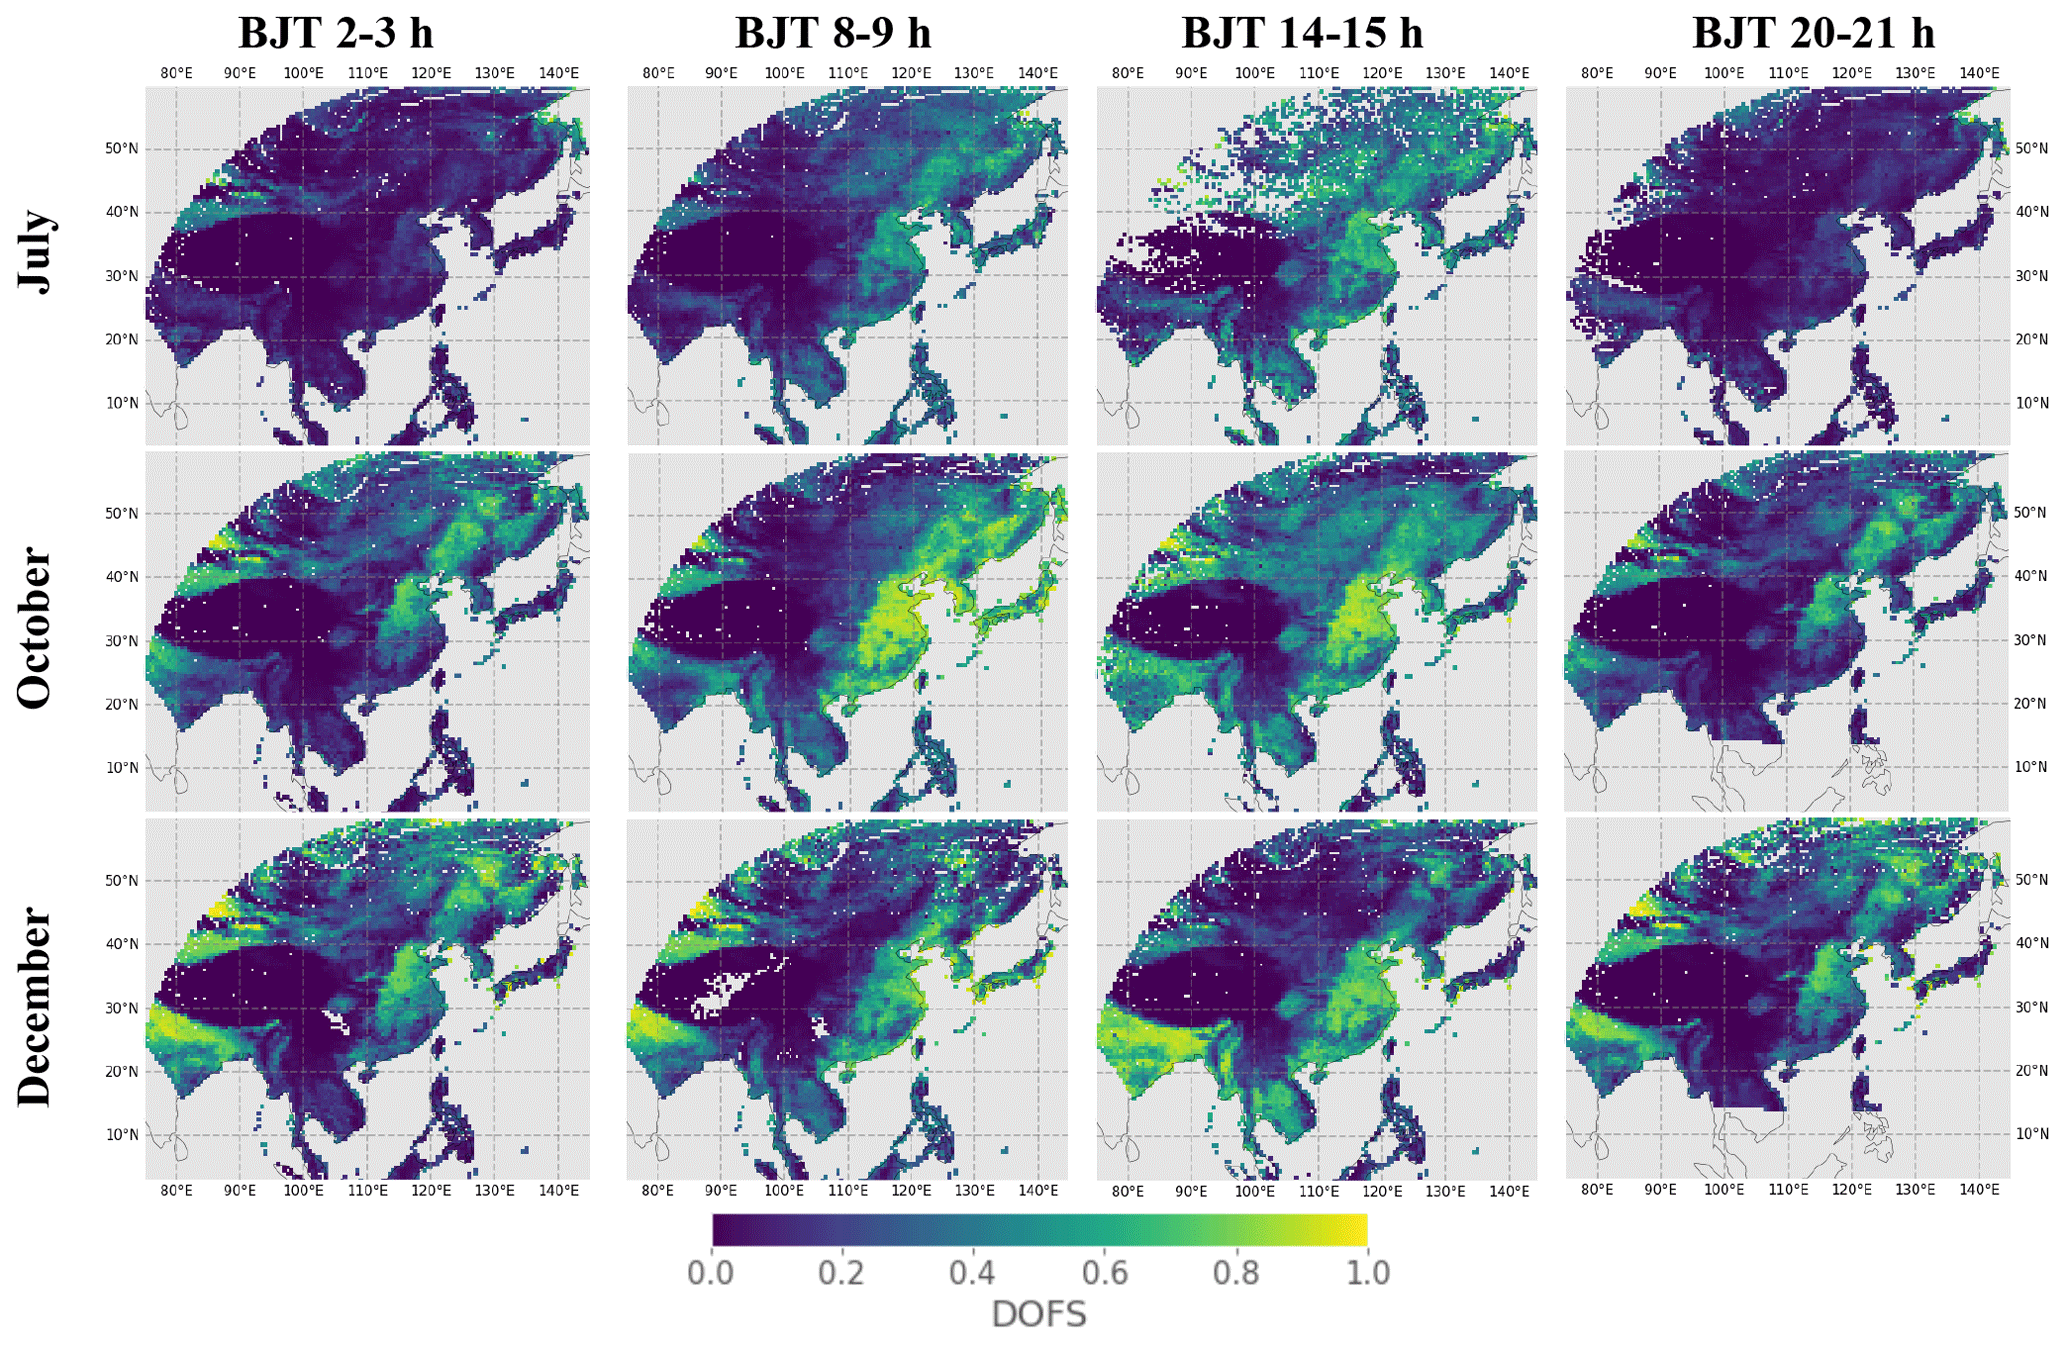
Figure 5Distributions of the DOFS averaged for July (summer), October (autumn), and December (winter), respectively, at 02:00–03:00, 08:00–09:00, 14:00–15:00, and 20:00–21:00 BJT to represent midnight, early morning, afternoon, and early evening, respectively. The corresponding maps for TC are presented in Fig. S3.
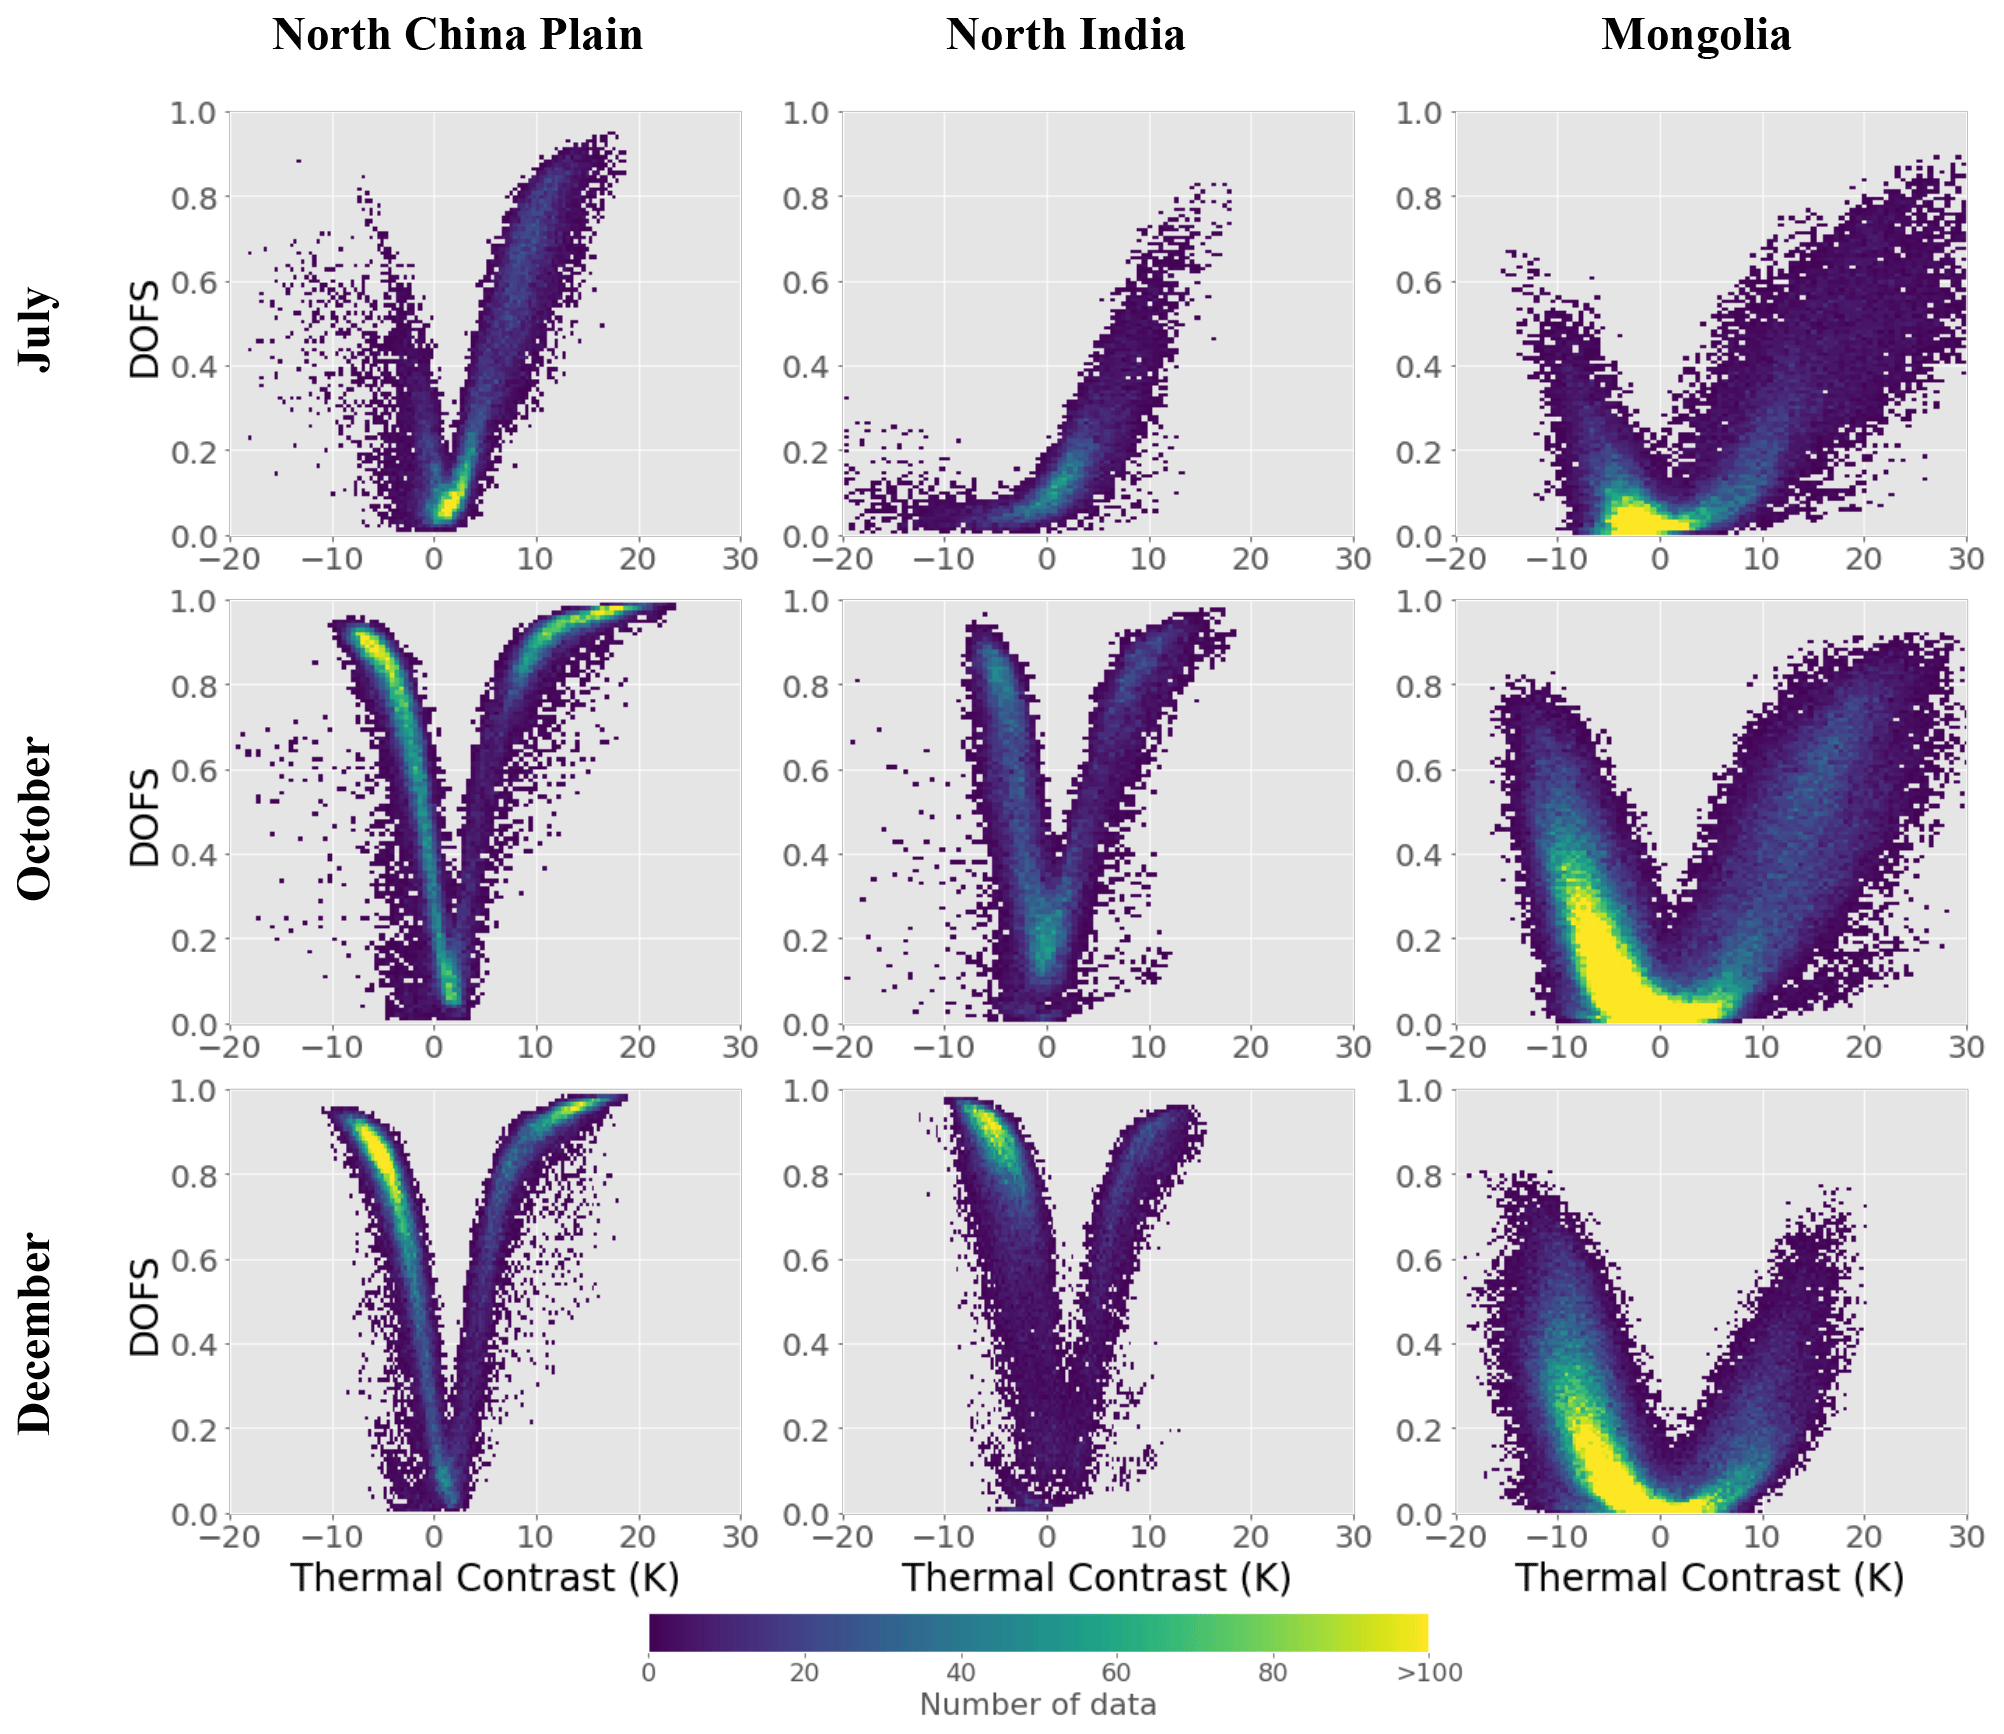
Figure 6Scatter plots between TC and DOFS from NH3 retrievals in the North China Plain, North India, and Mongolia, respectively, for July (summer), October (autumn), and December (winter). The coverages of the three representative regions are 32–40∘ N, 115–120∘ E for the North China Plain; 22–27∘ N, 77–87∘ E for North India; and 40–50∘ N, 100–110∘ E for Mongolia.
This strong correlation between DOFS and TC or NH3 abundance is also reflected in the spatial maps of DOFS values in Fig. 5 when analyzed with the corresponding TC maps in Fig. S2. The source regions in the North China Plain and North India have higher DOFS values than other non-source regions, such as the Tibetan Plateau, although it has large TC. For the same region (e.g., the North China Plain), the higher DOFS is driven by the more positive TC in the afternoon in July, while at nighttime the TC is closer to zero, which leads to a much lower DOFS. As it approaches the winter season, from October to December, the diurnal cycle of TC, which shifts from positive in the daytime to negative in the nighttime, gradually become stronger. The changes are basically driven by the faster warming or cooling properties of the land compared to the atmosphere. Fortunately, both situations favor the detection of NH3 using thermal infrared and lead to the high DOFS values in both the daytime and nighttime in both October and December.
As mentioned above, measurement sensitivity of NH3 is driven by TC and the NH3 abundance (Clarisse et al., 2010). This is also illustrated in the Appendix Fig. A1a and b for a large positive and negative TC. As described above, while a positive TC leads to stronger absorption features, a negative TC causes spectral emission features, allowing the detection of NH3 also during the night (see also the example GIIRS spectra shown in Clarisse et al., 2021). In both cases we see that the averaging kernels peak at the surface, and the posteriori uncertainty in the retrievals of the surface layer are largely reduced compared to the a priori uncertainties. However, when the TC is small, as in the Appendix Fig. A1c, the DOFS values become smaller, and the AK peaks higher up in the atmosphere (in this case, in the second layer). The retrieved value remains close to the a priori value, and the posteriori error is almost the same as the a priori error, indicating low information content of the measurement. These examples illustrate the importance of TC for infrared sounding of boundary layer NH3. An important advantage of GEO compared to LEO IR sounders is that they make observations throughout the day, such that optimal measurement conditions (large TC) can be found more readily. The diel variations of TC and DOFS are illustrated in the Appendix Fig. A2 for the North China Plain and North India. LEO IR sounders like IASI with Equator crossing times at 09:30 and 21:30 LT in general do not measure at the time when measurement sensitivity (or DOFS) is largest. The optimal time is found around noon.
The short lifetime of NH3 of hours to days means that the NH3 concentration is highly concentrated in the planetary boundary layer (PBL) around the source region. This is also illustrated by the significant higher concentration below 800 hPa in the a priori NH3 profiles (Fig. 3). As a result, thermal infrared observation of NH3 has high sensitivity closer to the surface compared to relatively longer-lived air pollutant such as carbon monoxide. The vertical sensitivities of FY-GeoAIR NH3 retrievals are shown in Fig. 7 for the three representative regions using the corresponding averaging kernel diagonal vectors, which are measures of the DOFS for each vertical layer. We can see the diurnal AK values peak at the surface layer for the North China Plain for all months, especially for October and December, due to the high NH3 concentration and favorable TC changes. In July, the nighttime sensitivity is significantly reduced in the surface layers. In North India, the bottom layers' sensitivity is at its highest at midnight in October and December due to highly negative TC. In July, the TC close to zero leads to much lower AK values in North India. In Mongolia, the low background NH3 concentration means the AK values are low over all vertical layers. The small changes in DOFS are primarily driven by the diurnal change of TC in this case. Overall, the NH3 retrievals using FY-GeoAIR algorithm from FY-4B/GIIRS observations show high detectivity in the surface layer, especially for source regions in the North China Plain and North India.
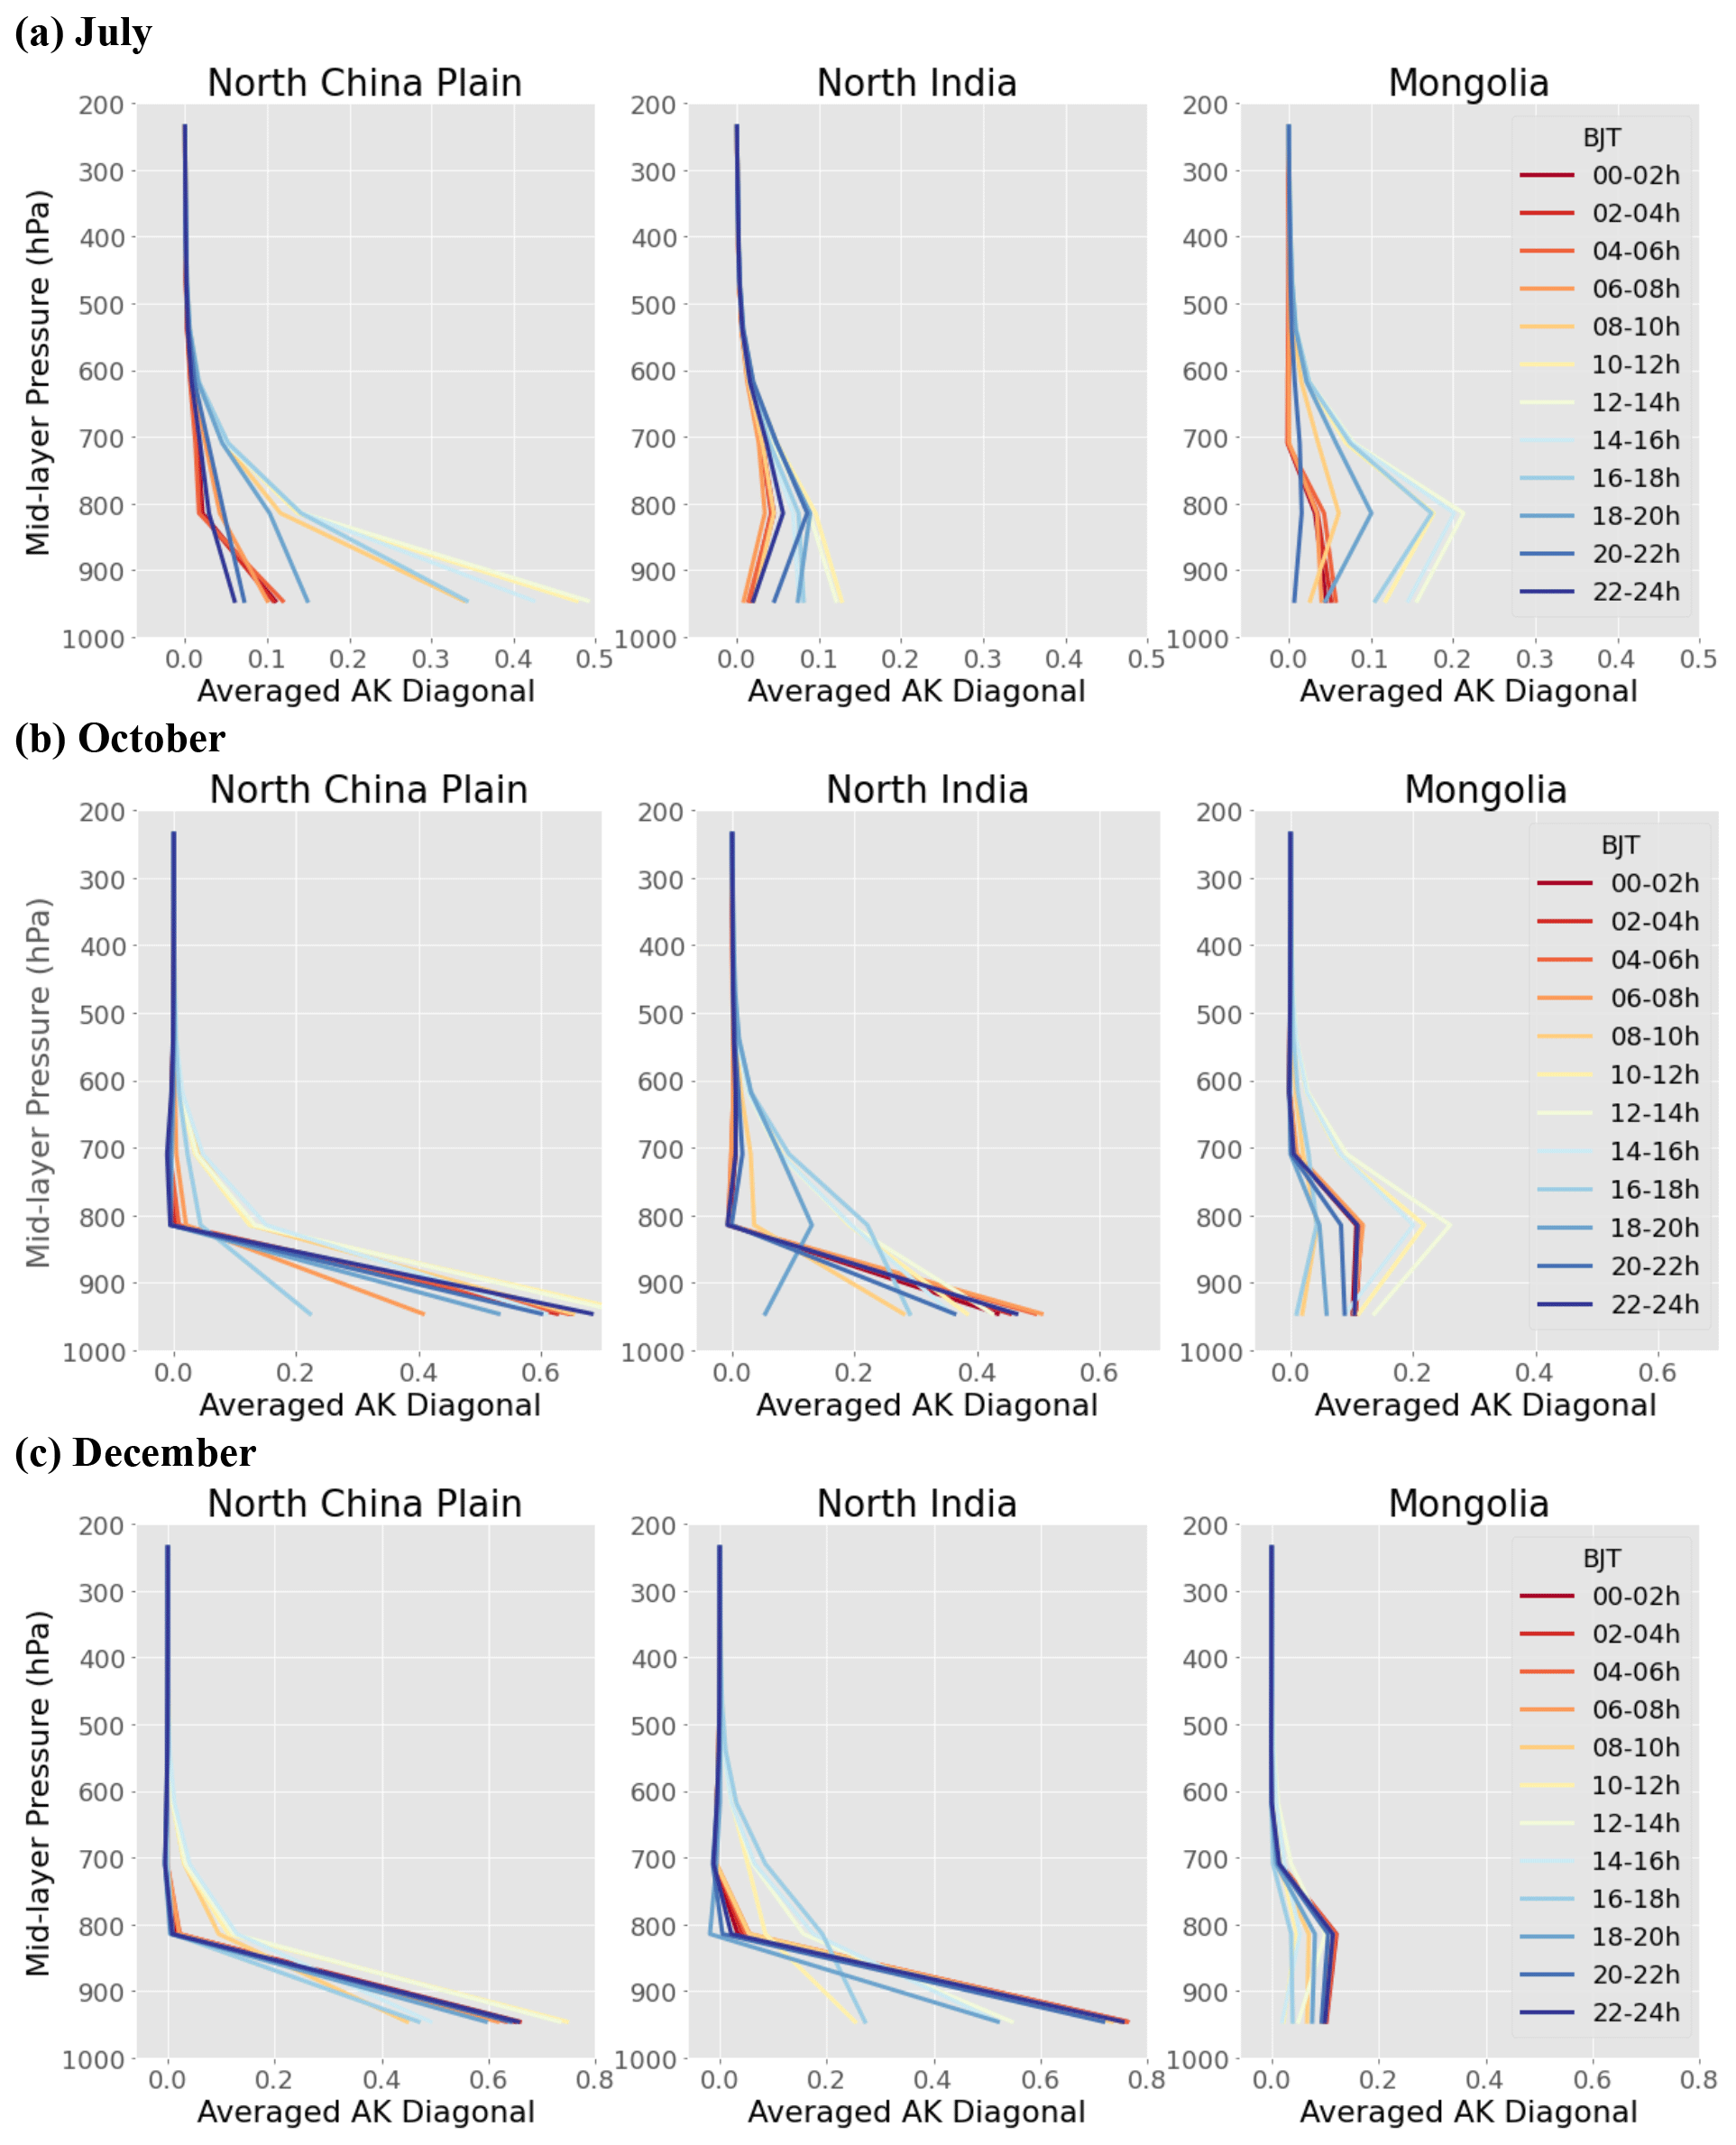
Figure 7Averaged averaging kernel diagonal vectors for the three representative regions in the North China Plain, North India, and Mongolia for July (summer, a), October (autumn, b), and December (winter, c). The averaging kernel rows are averaged for the 2 h duration in each measurement cycle. The coverages of the three representative regions are the same as in Fig. 6.
4.2 Spatial distribution and diurnal change of NH3 column from FY-4B/GIIRS retrievals
Spatial distribution maps of NH3 columns are averaged for every 4 h period in a day and re-gridded into 0.5∘ × 0.5∘ for every 2 months: July–August, September–October, and November–December. Before the aggregation, the post-filtered NH3 retrievals are further screened by the criteria of DOFS >0.5. The screened NH3 retrievals from the two microwindows are further averaged for the mapping. The results are shown in Figs. 8 and 9. The data gaps, especially in the Tibet Plateau, result from data filtering due to the low DOFS. The cloud filtering has considerably impacted data availability, in particular in North India in July–August during the monsoon season. The nighttime data in summer have been mostly filtered due to their low TC and as a result low DOFS. From these maps, obvious diurnal cycle of NH3 columns can be seen from all months. The North China Plain and North India, which are two agriculturally intensive regions with irrigated crops and a high density of livestock, show the highest values over the region. As explained in Wang et al. (2020), the causes of high NH3 loading in North India are due to the weak chemical loss and weak horizontal diffusion in North India, which are slightly different from those in the North China Plain.
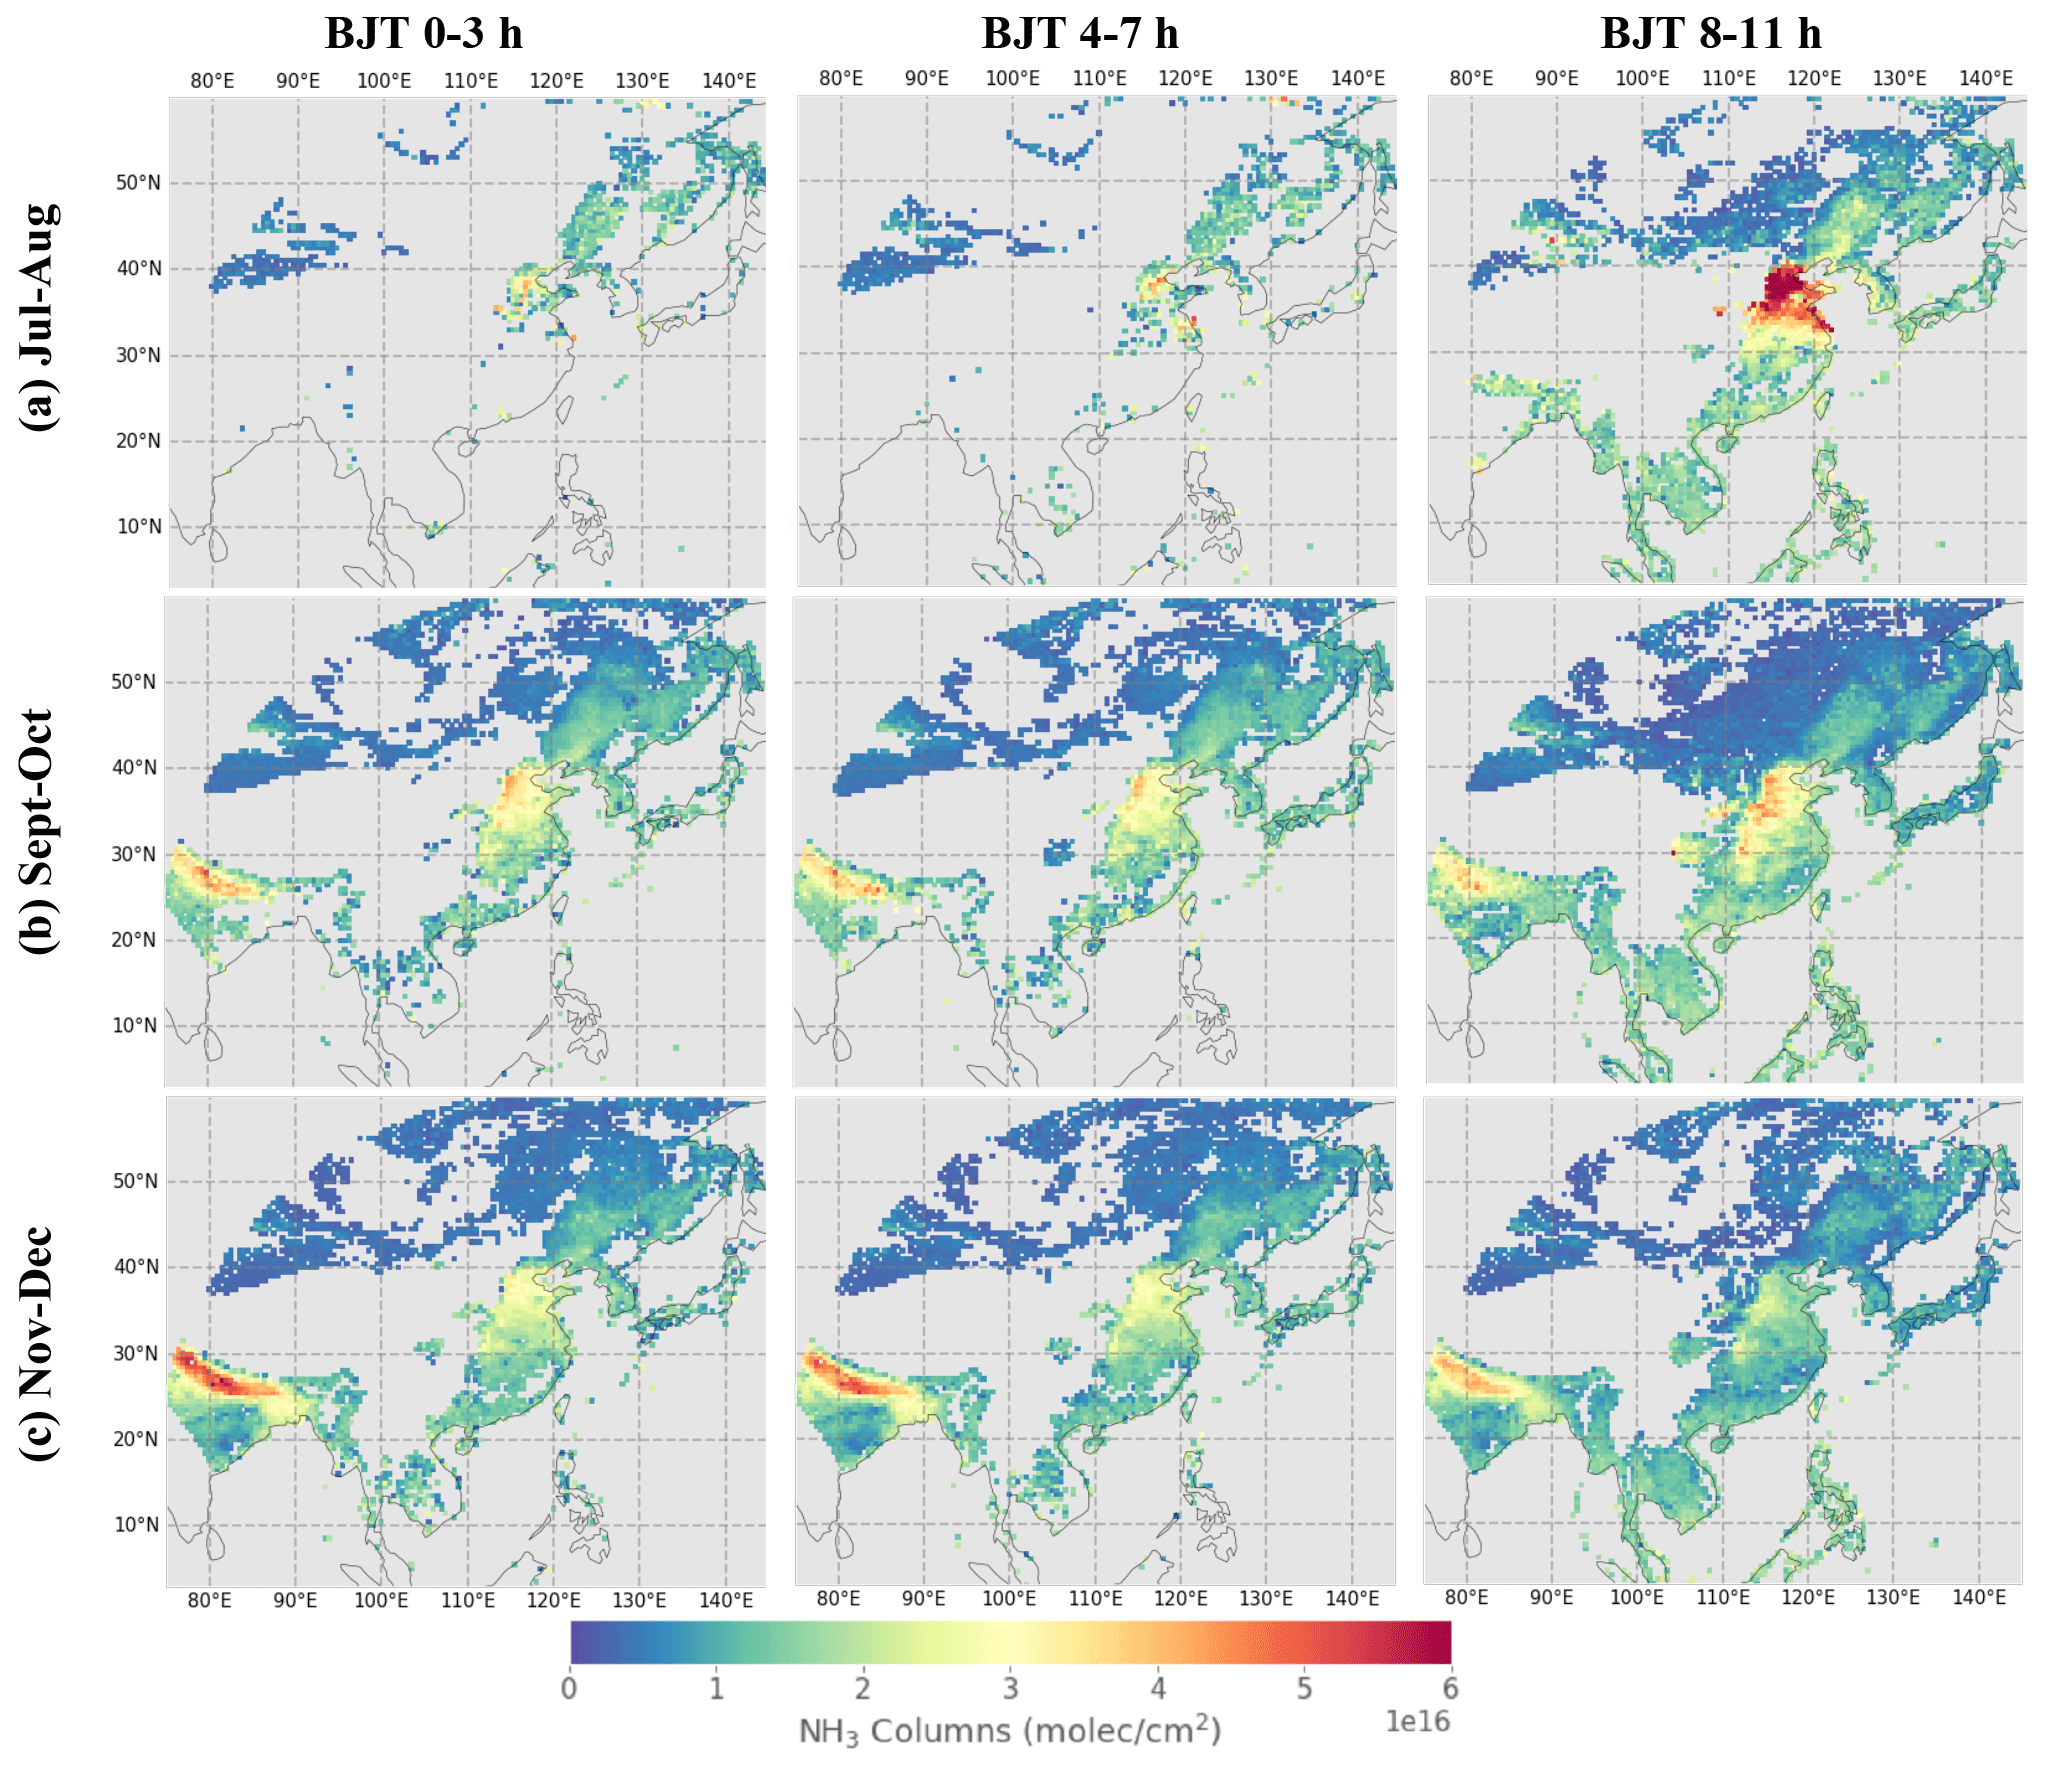
Figure 8Monthly maps of NH3 columns averaged for every 4 h (00:00–03:00, 04:00–07:00, and 08:00–11:00 BJT) and 2 months for July–August, September–October, and November–December of 2022. These NH3 retrievals are further filtered by DOFS >0.5 and then re-gridded into 0.5∘ × 0.5∘.
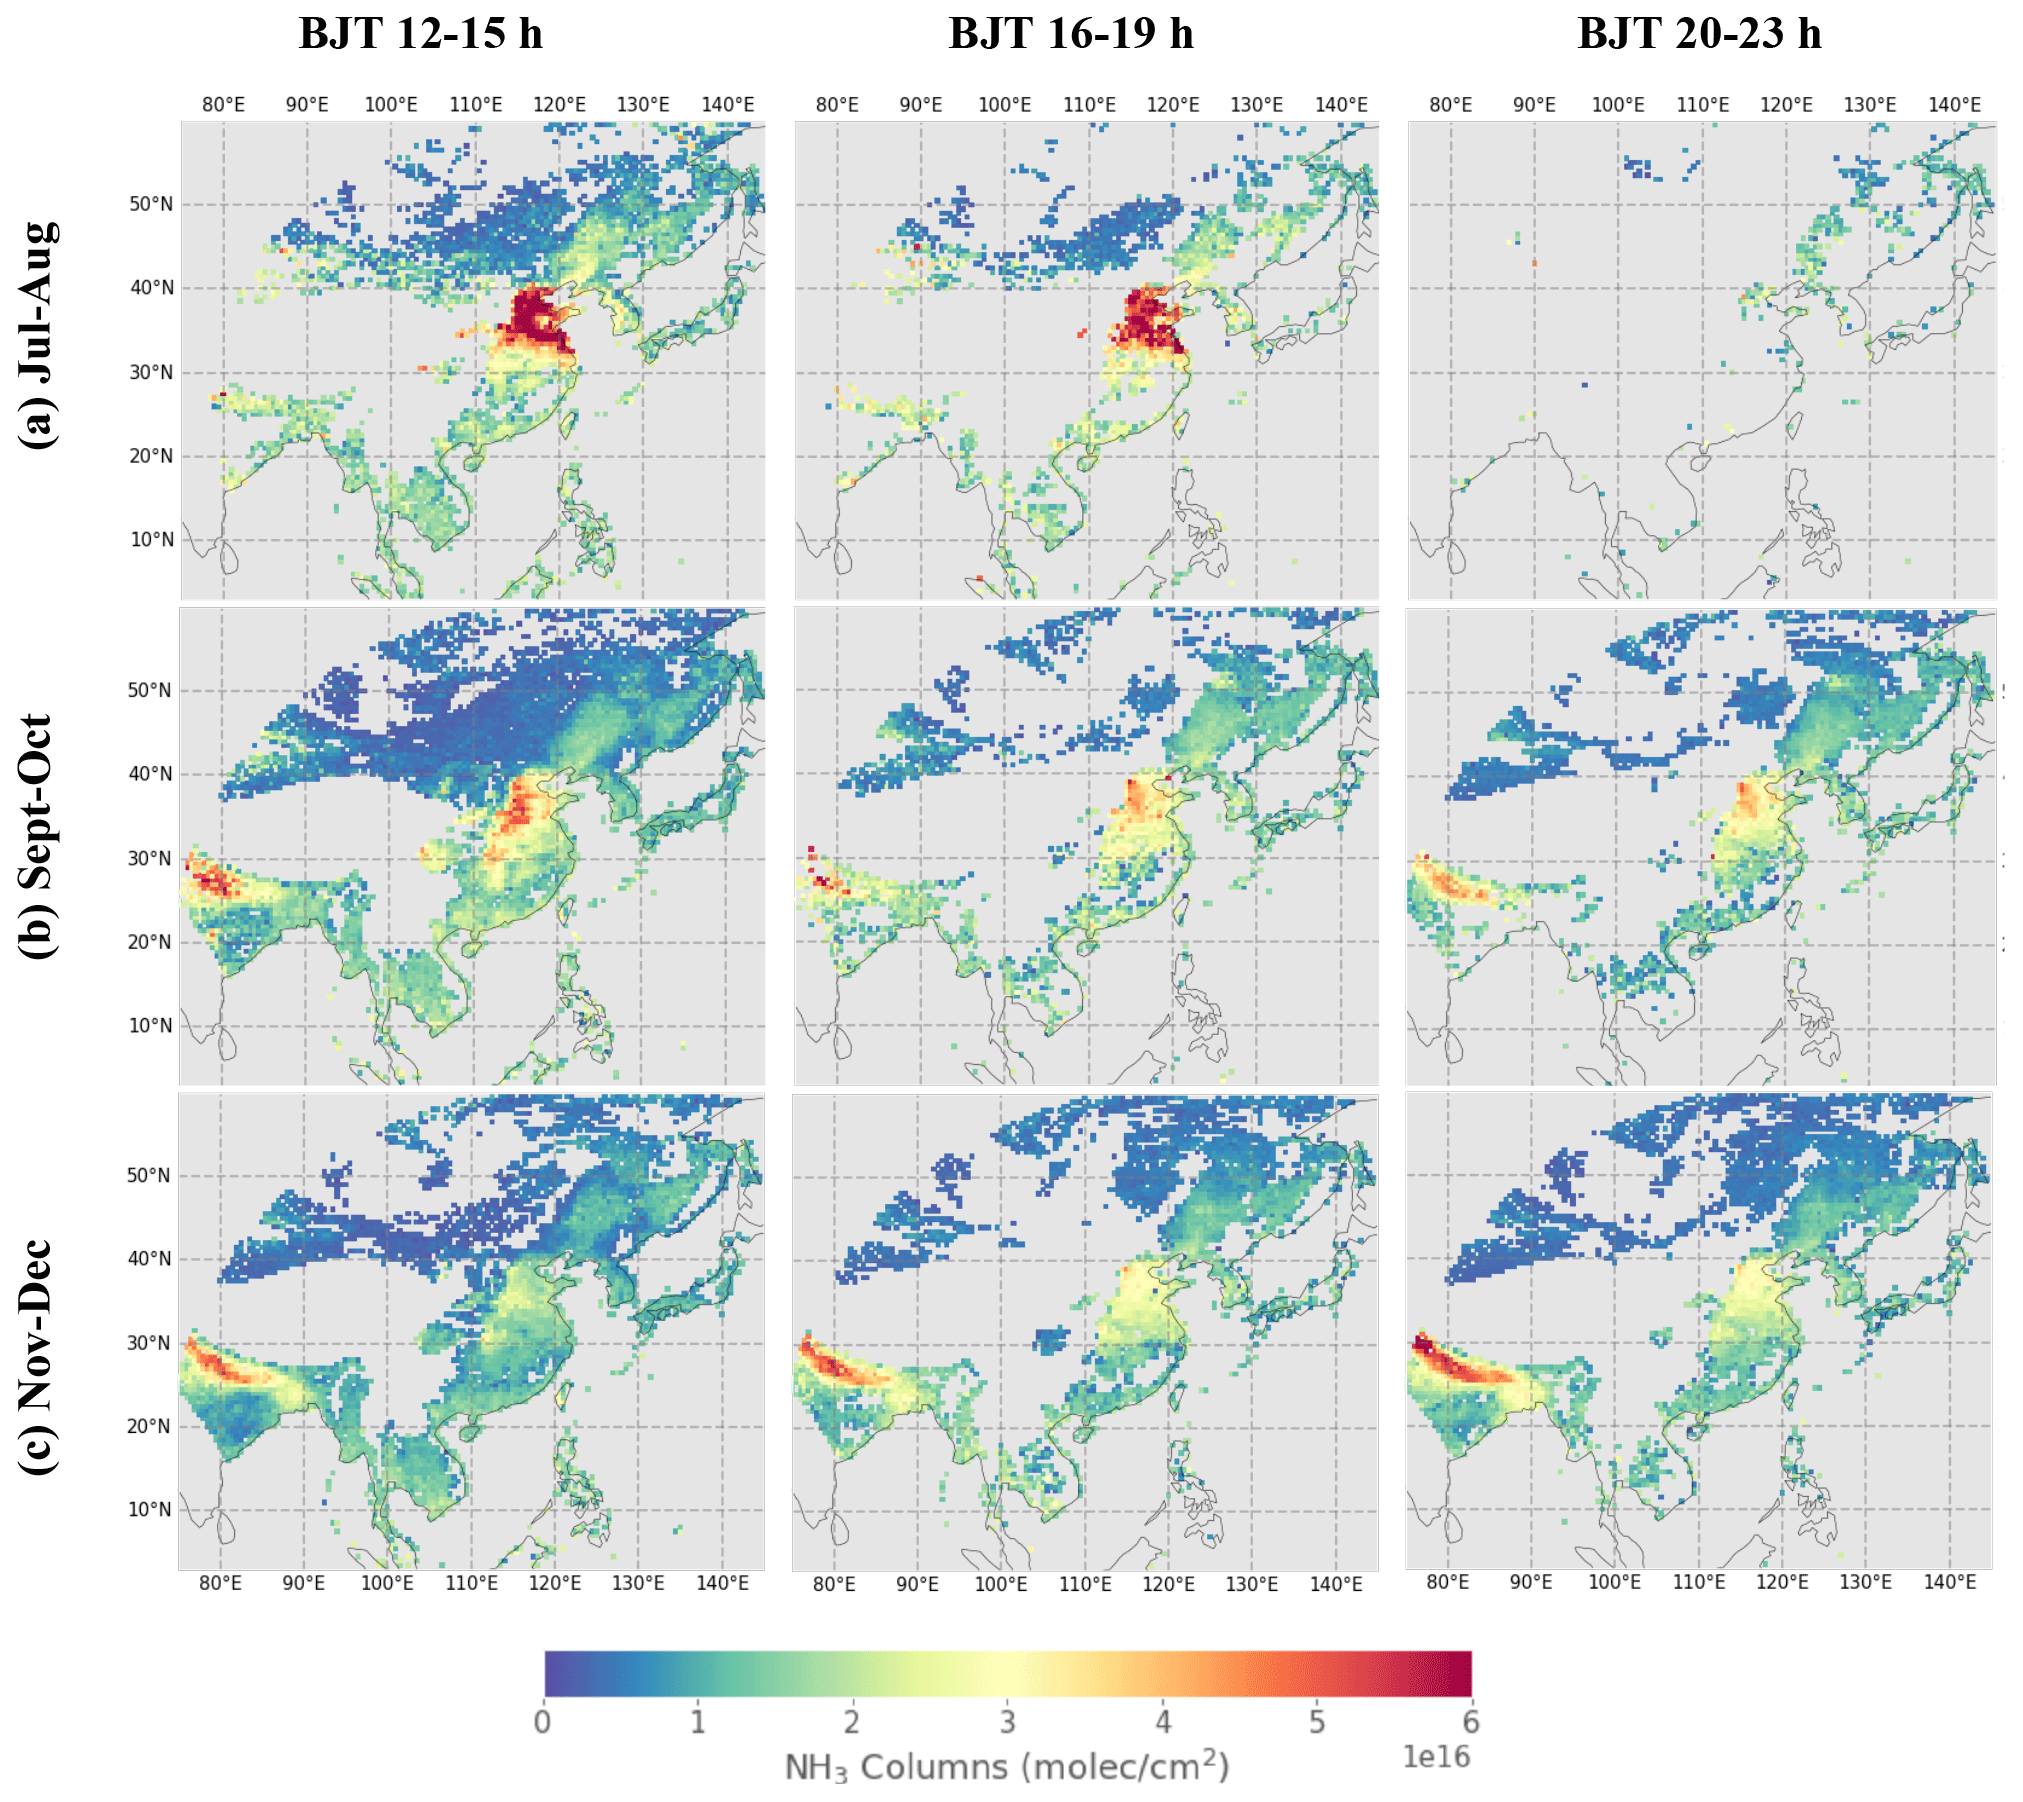
Figure 9Same as Fig. 8 but for 12:00–15:00, 16:00–19:00, and 20:00–23:00 BJT.
The general diurnal cycle of NH3 columns can be primarily explained by three possible driving factors, as concluded in the summary in Clarisse et al. (2021), including the day–night difference in agriculture activities as a major source of NH3, the temperature dependence of NH3 emissions driven by diurnal and seasonal temperature changes, and the conversion between NH3 gas and particulate driven by the day–night change of meteorological conditions. These can be used to interpret the quantitative analysis of the diurnal cycle as shown in Fig. 10 for the North China Plain and North India. The corresponding diurnal changes of TC and DOFS are shown in the Appendix Fig. A2. The day–night contrast of NH3 columns from IASI on board Metop-B is also indicated to check if the day–night gradients between IASI and GIIRS are consistent. Specifically, the more significant diurnal cycle in summer (July–August) in the North China Plain, captured by both GIIRS retrievals, can be explained by the higher temperature-related emissions from plants and soils and stronger daytime emissions from agricultural activities (Meng et al., 2018). In addition, the relatively low temperature and higher humidity in the nighttime, relative to the daytime, contribute to the conversion from NH3 to particulates, which leads to a lower NH3 concentration. In North India, unfortunately, insufficient data are available in July–August after post-filtering. In September–October and November–December, the diurnal cycles become less significant compared to the summer months as the main driving factors become less important. Interestingly, the winter diurnal cycle in the North China Plain and North India show an opposite pattern to the diurnal cycle in summer. The slight increase in NH3 columns in the nighttime, captured by both GIIRS and IASI retrievals, may be due to the shallower nocturnal boundary layer that traps the surface emissions (Tevlin et al., 2017; Clarisse et al., 2021). To ensure the diurnal change is not affected greatly by data quality, we also compare the GIIRS results using data with a DOFS larger than 0.5 and 0.7, respectively, two thresholds that are high enough to ensure the quality of the retrievals. We can see that the difference in the diurnal cycle of NH3 columns from FY-4B/GIIRS retrievals is not significant, and therefore different data filters do not affect the general patterns of NH3 diurnal cycle. Note that the variability of NH3 columns within the region is large as shown by the error bars (1 standard deviation). This large variability is a result of NH3's short lifetime and the spatial heterogeneity of its emissions. Moreover, when compared with the averaged uncertainty of a single retrieval (1.37×10¹⁶ to 1.67×10¹⁶ molec. cm−2 as derived from the retrieval experiment in Sect. 3.5), the day–night contrast of the averaged diurnal variations of NH3 columns as shown in Fig. 10 may not be significant for the North China Plain in September–October and the North India in November–December.
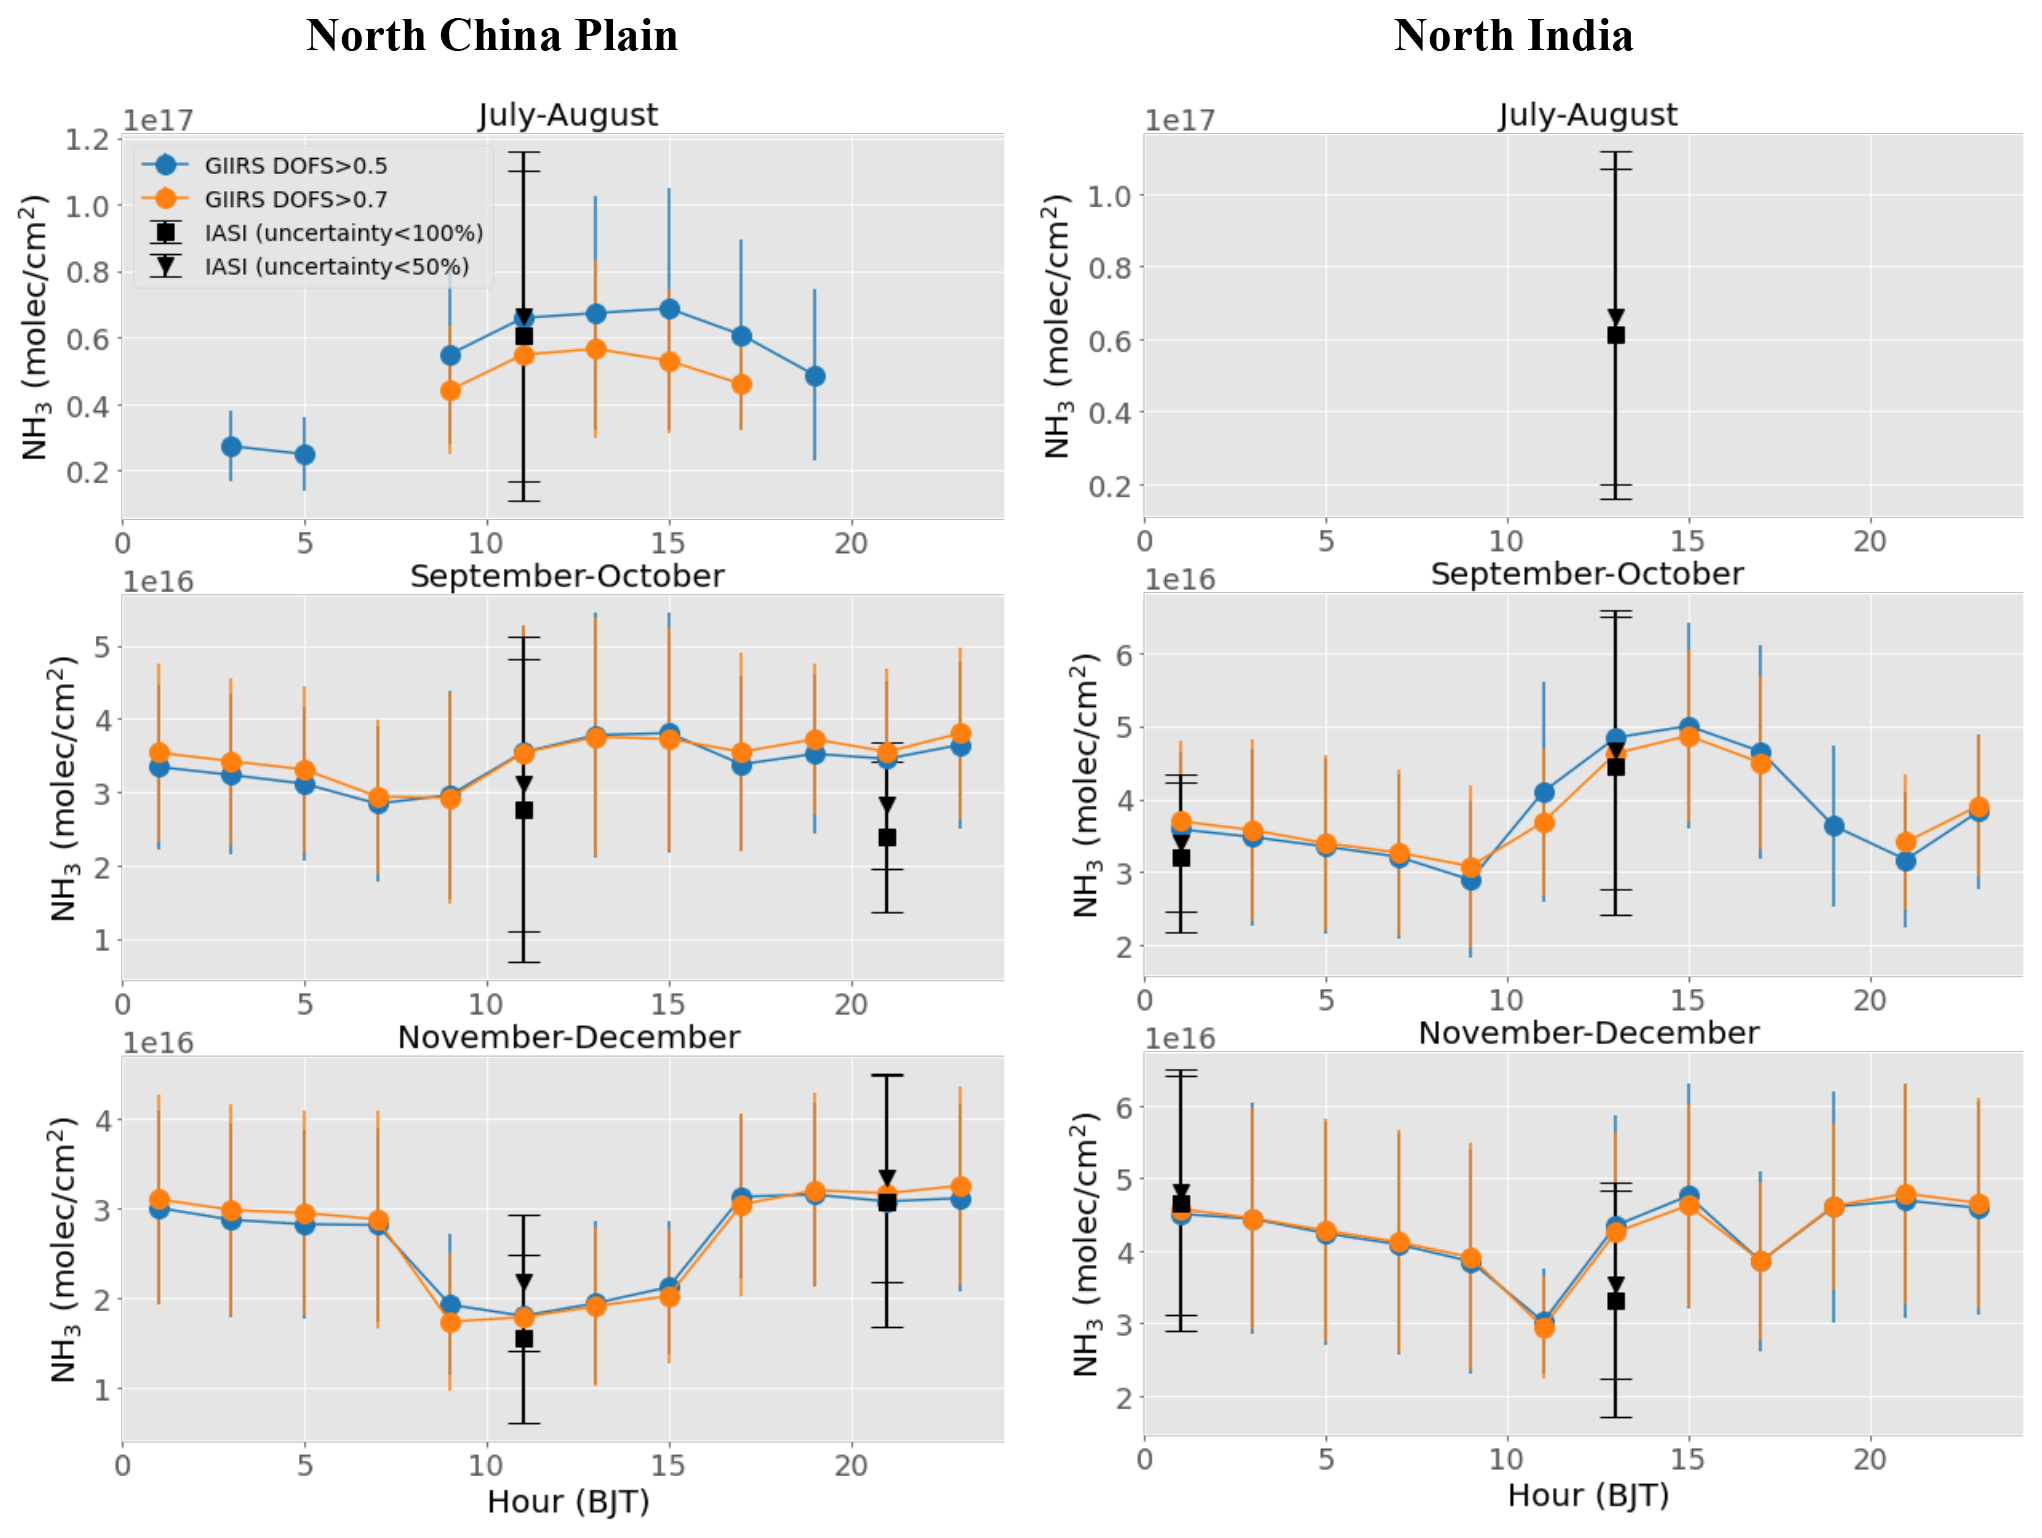
Figure 10Diurnal cycle of NH3 columns from FY-4B/GIIRS retrievals. The NH3 columns are from retrievals using the microwindows of 955–975 cm−1 for the 2 h duration in each measurement cycle when at least 30 data points are available. The error bar represents 1 standard deviation. Diurnal cycles based on two different filtering criteria (DOFS >0.5 and DOFS >0.7) are shown simultaneously. The IASI NH3 column retrievals (two overpass times a day) are averaged values in the corresponding months. IASI NH3 retrievals with uncertainty larger than 50 % are not used. Data are averaged in 2-month periods, when at least 10 data points are available. Note that the coverages of the North China Plain (36–38∘ N, 116–118∘ E) and North India (26–28∘ N, 78–80∘ E) are smaller than in Fig. 6 to focus on the central source regions.
4.3 Comparison with IASI NH3 retrievals
IASI on board Metop-B measures NH3 two times a day at 09:30 and 21:30 LT (Equator crossing times), respectively, in the morning and evening. The NH3 data from IASI are retrieved based on the hyperspectral radiance index (HRI) and a trained neural network that relates the HRI to NH3 distributions (Whitburn et al., 2016). Subsequent improvements to the algorithm and data product are outlined in Van Damme et al. (2017, 2021). For the comparison, the latest version 4 (Clarisse et al., 2023) of the IASI is used, with data originating from IASI/Metop-B from July to December 2022. We filtered out the data with cloud cover larger than 20 %. Note that the a priori vertical profile of NH3 in IASI is different from the a priori profiles for the FY-4B/GIIRS retrievals. The a priori NH3 in IASI algorithm assumes a Gaussian shape, with a peak altitude set at the surface over land. The width of the Gaussian shape is equal to the boundary layer height. Two different comparisons are carried out, as follows.
4.3.1 Comparison of spatial distribution on representative days
We first take a look at the spatial distribution of NH3 columns on 2 representative days: 7 July 2022 (summer, local daytime), when there was mostly positive TC, and 18 December 2022 (winter, local nighttime), when there was mostly negative TC. The retrievals are resampled on a 0.5∘ × 0.5∘ grid. The daily mean value for each grid cell is computed when at least three points are available. Only GIIRS retrievals with a DOFS >0.2 and IASI retrievals with a relative uncertainty below 50 % are used. The results are shown in Fig. 11. A good agreement is found in general with fitted slopes close to unity, with a larger scatter for the summer case. The IASI NH3 tends to be higher than the GIIRS retrievals, especially for high values.
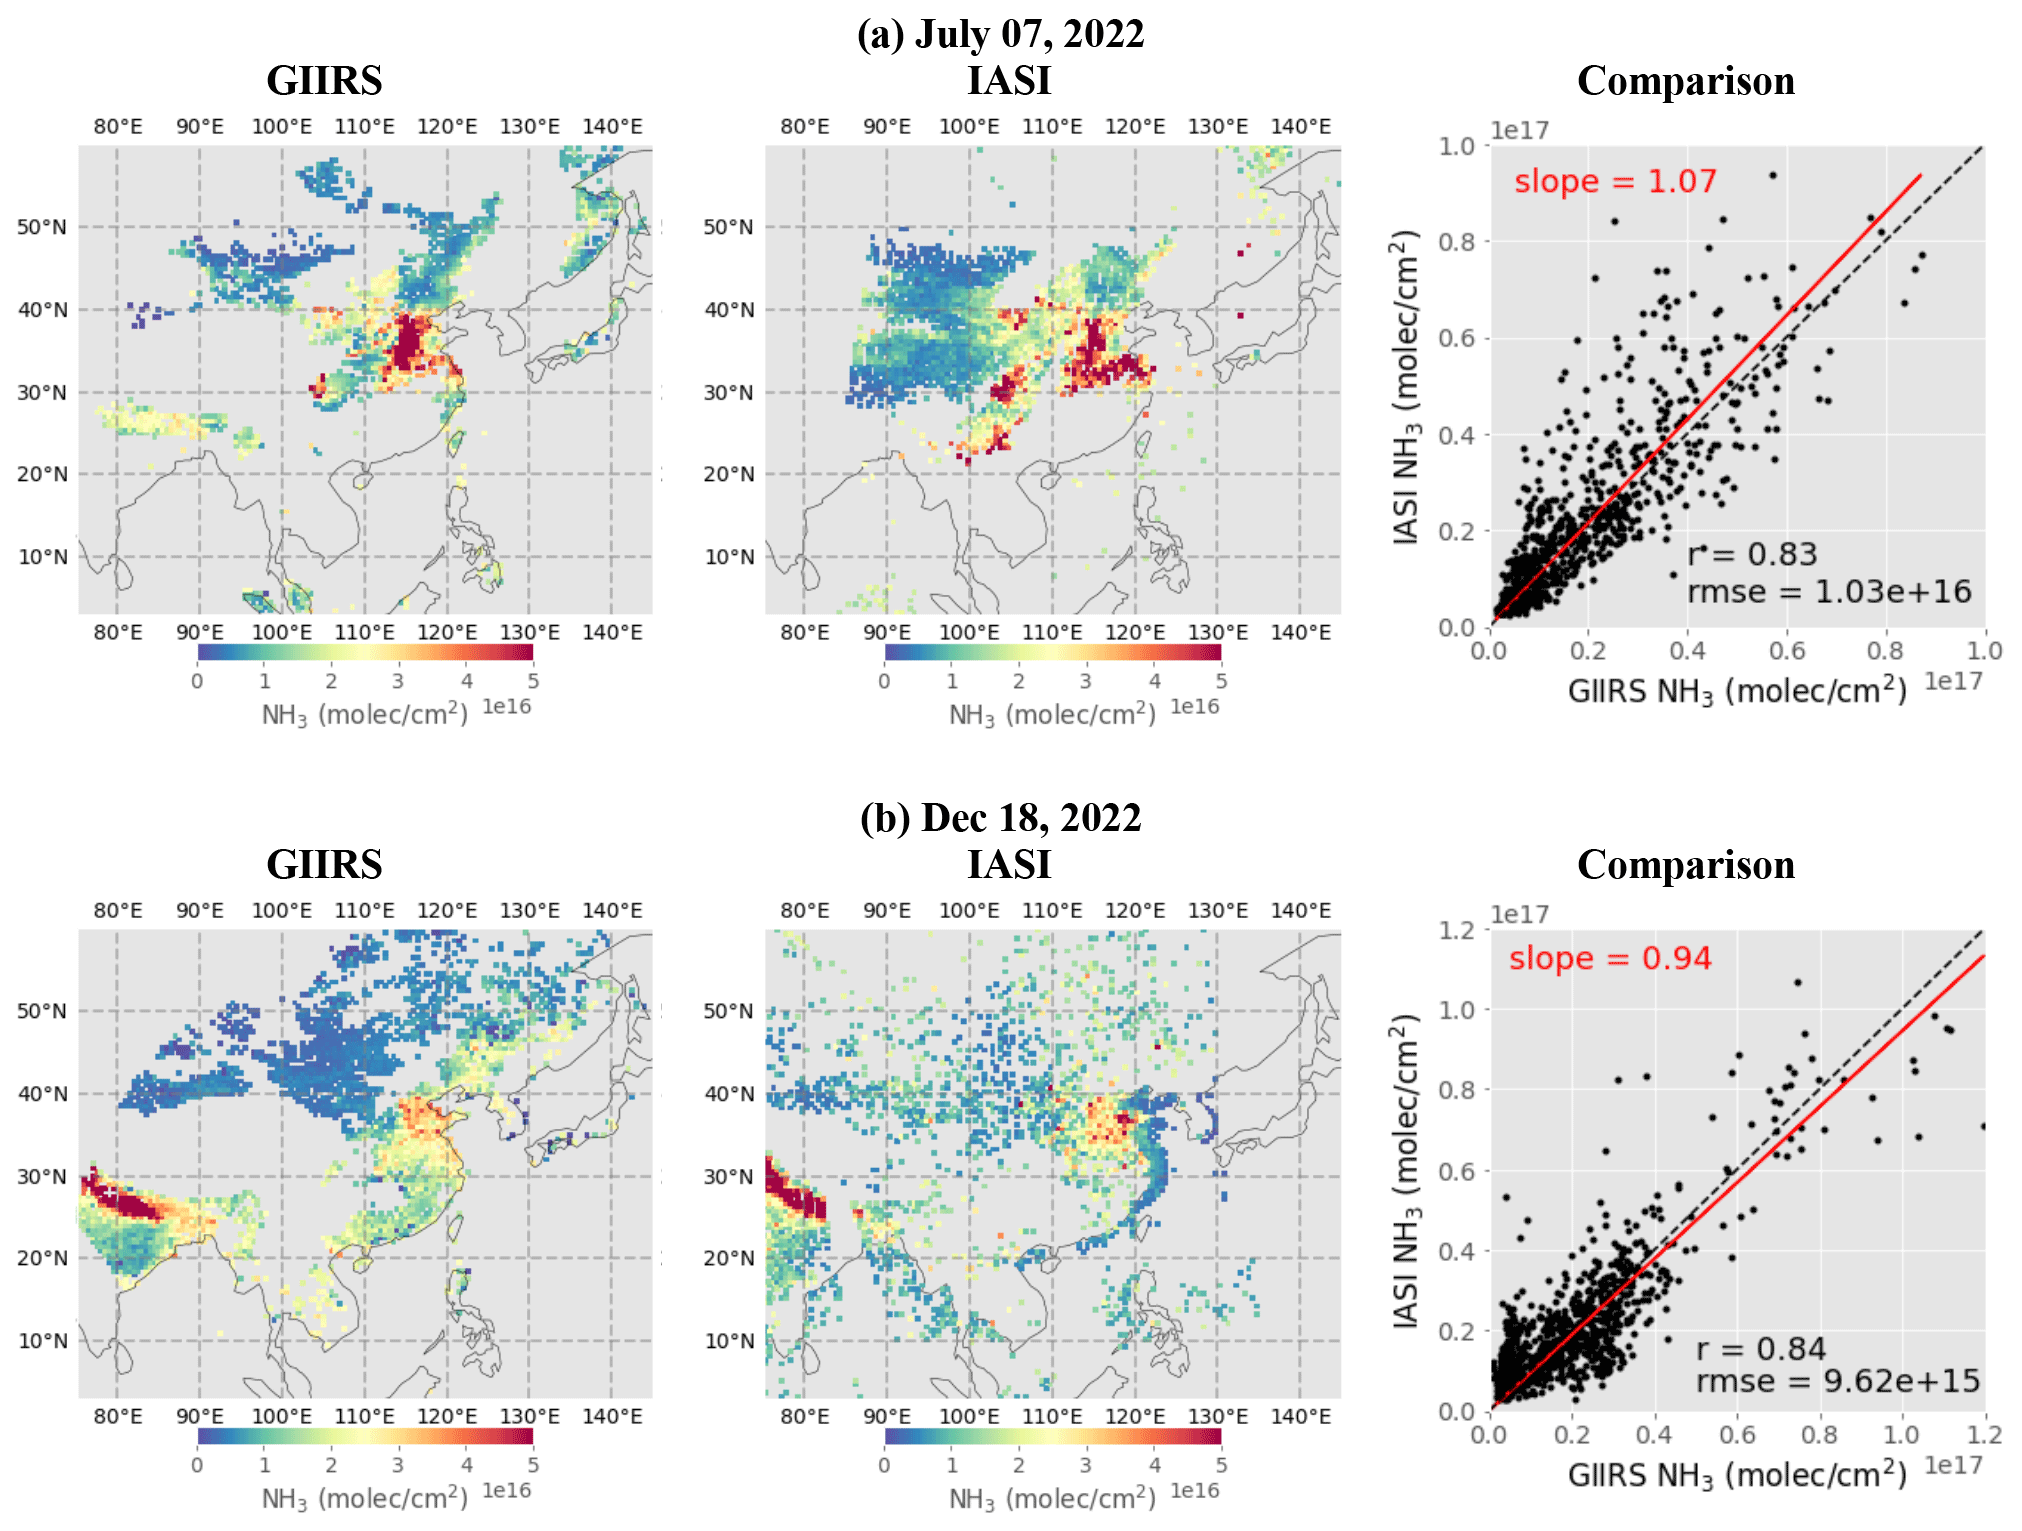
Figure 11Gridded intercomparison between NH3 column retrievals from GIIRS (first column) and IASI (second column) on two representative observations, 7 July 2022 daytime (upper panel, a) and 18 December 2022 nighttime (lower panel, b) retrievals. The observation hours of GIIRS are selected to be close to those of IASI; the observation hours are shown in Fig. S7. The scatter plots (third column) show the comparison of collocated GIIRS- and IASI-averaged column data in each grid. The retrievals are re-gridded into 0.5∘ × 0.5∘ grids in the region. The daily mean value for each region is computed when at least three grid points are available.
4.3.2 Collocated point-by-point comparison
We further conduct a spatially and temporally collocated point-by-point comparison between FY-4B/GIIRS and IASI NH3 retrievals. The results are shown in Figs. 12 and A3. Again, only GIIRS retrievals with a DOFS >0.2 and IASI retrievals with a relative uncertainty below 50 % are used. We consider observations to be collocated when the distance between the centers of the pixels is less than 6 km (half of the FY-4B/GIIRS footprint size) and the observation time difference less than 1 h. All data points that meet these criteria are used for the comparison. The correlation coefficient (r), root mean square error (RMSE) and the fitting slope are also indicated. We can see the comparison shows good agreement with a high correlation coefficient. The retrievals are highly consistent, especially for winter months. The nighttime data in July have mostly been screened due to the low DOFS. Except for the daytime data in summer (July and August), both retrievals agree within the estimated error as quantified by RMSE in Sect. 3.5. The systematic bias in the daytime in July and August is probably due to the different a priori value of NH3 used in the algorithms. Since the IASI a priori profile changes with boundary layer height, the a priori profiles have different vertical structure depending on the time of the year, compared to the GIIRS a priori value which uses a fixed average across the year. To test this hypothesis, we carry out an experiment to generate a new set of GIIRS NH3 retrievals in July daytime that use the Gaussian shape a priori profiles following IASI algorithm (Clarisse et al., 2023). We keep the total column for the new a priori profile unchanged. The results are shown in the Appendix Fig. A4. It shows that the agreement in NH3 total column between IASI and GIIRS has largely improved, especially for the retrievals that have a DOFS >0.5. The bias has significantly reduced. This result demonstrates that the systematic bias between GIIRS and IASI is caused by the difference in their a priori profile structure.
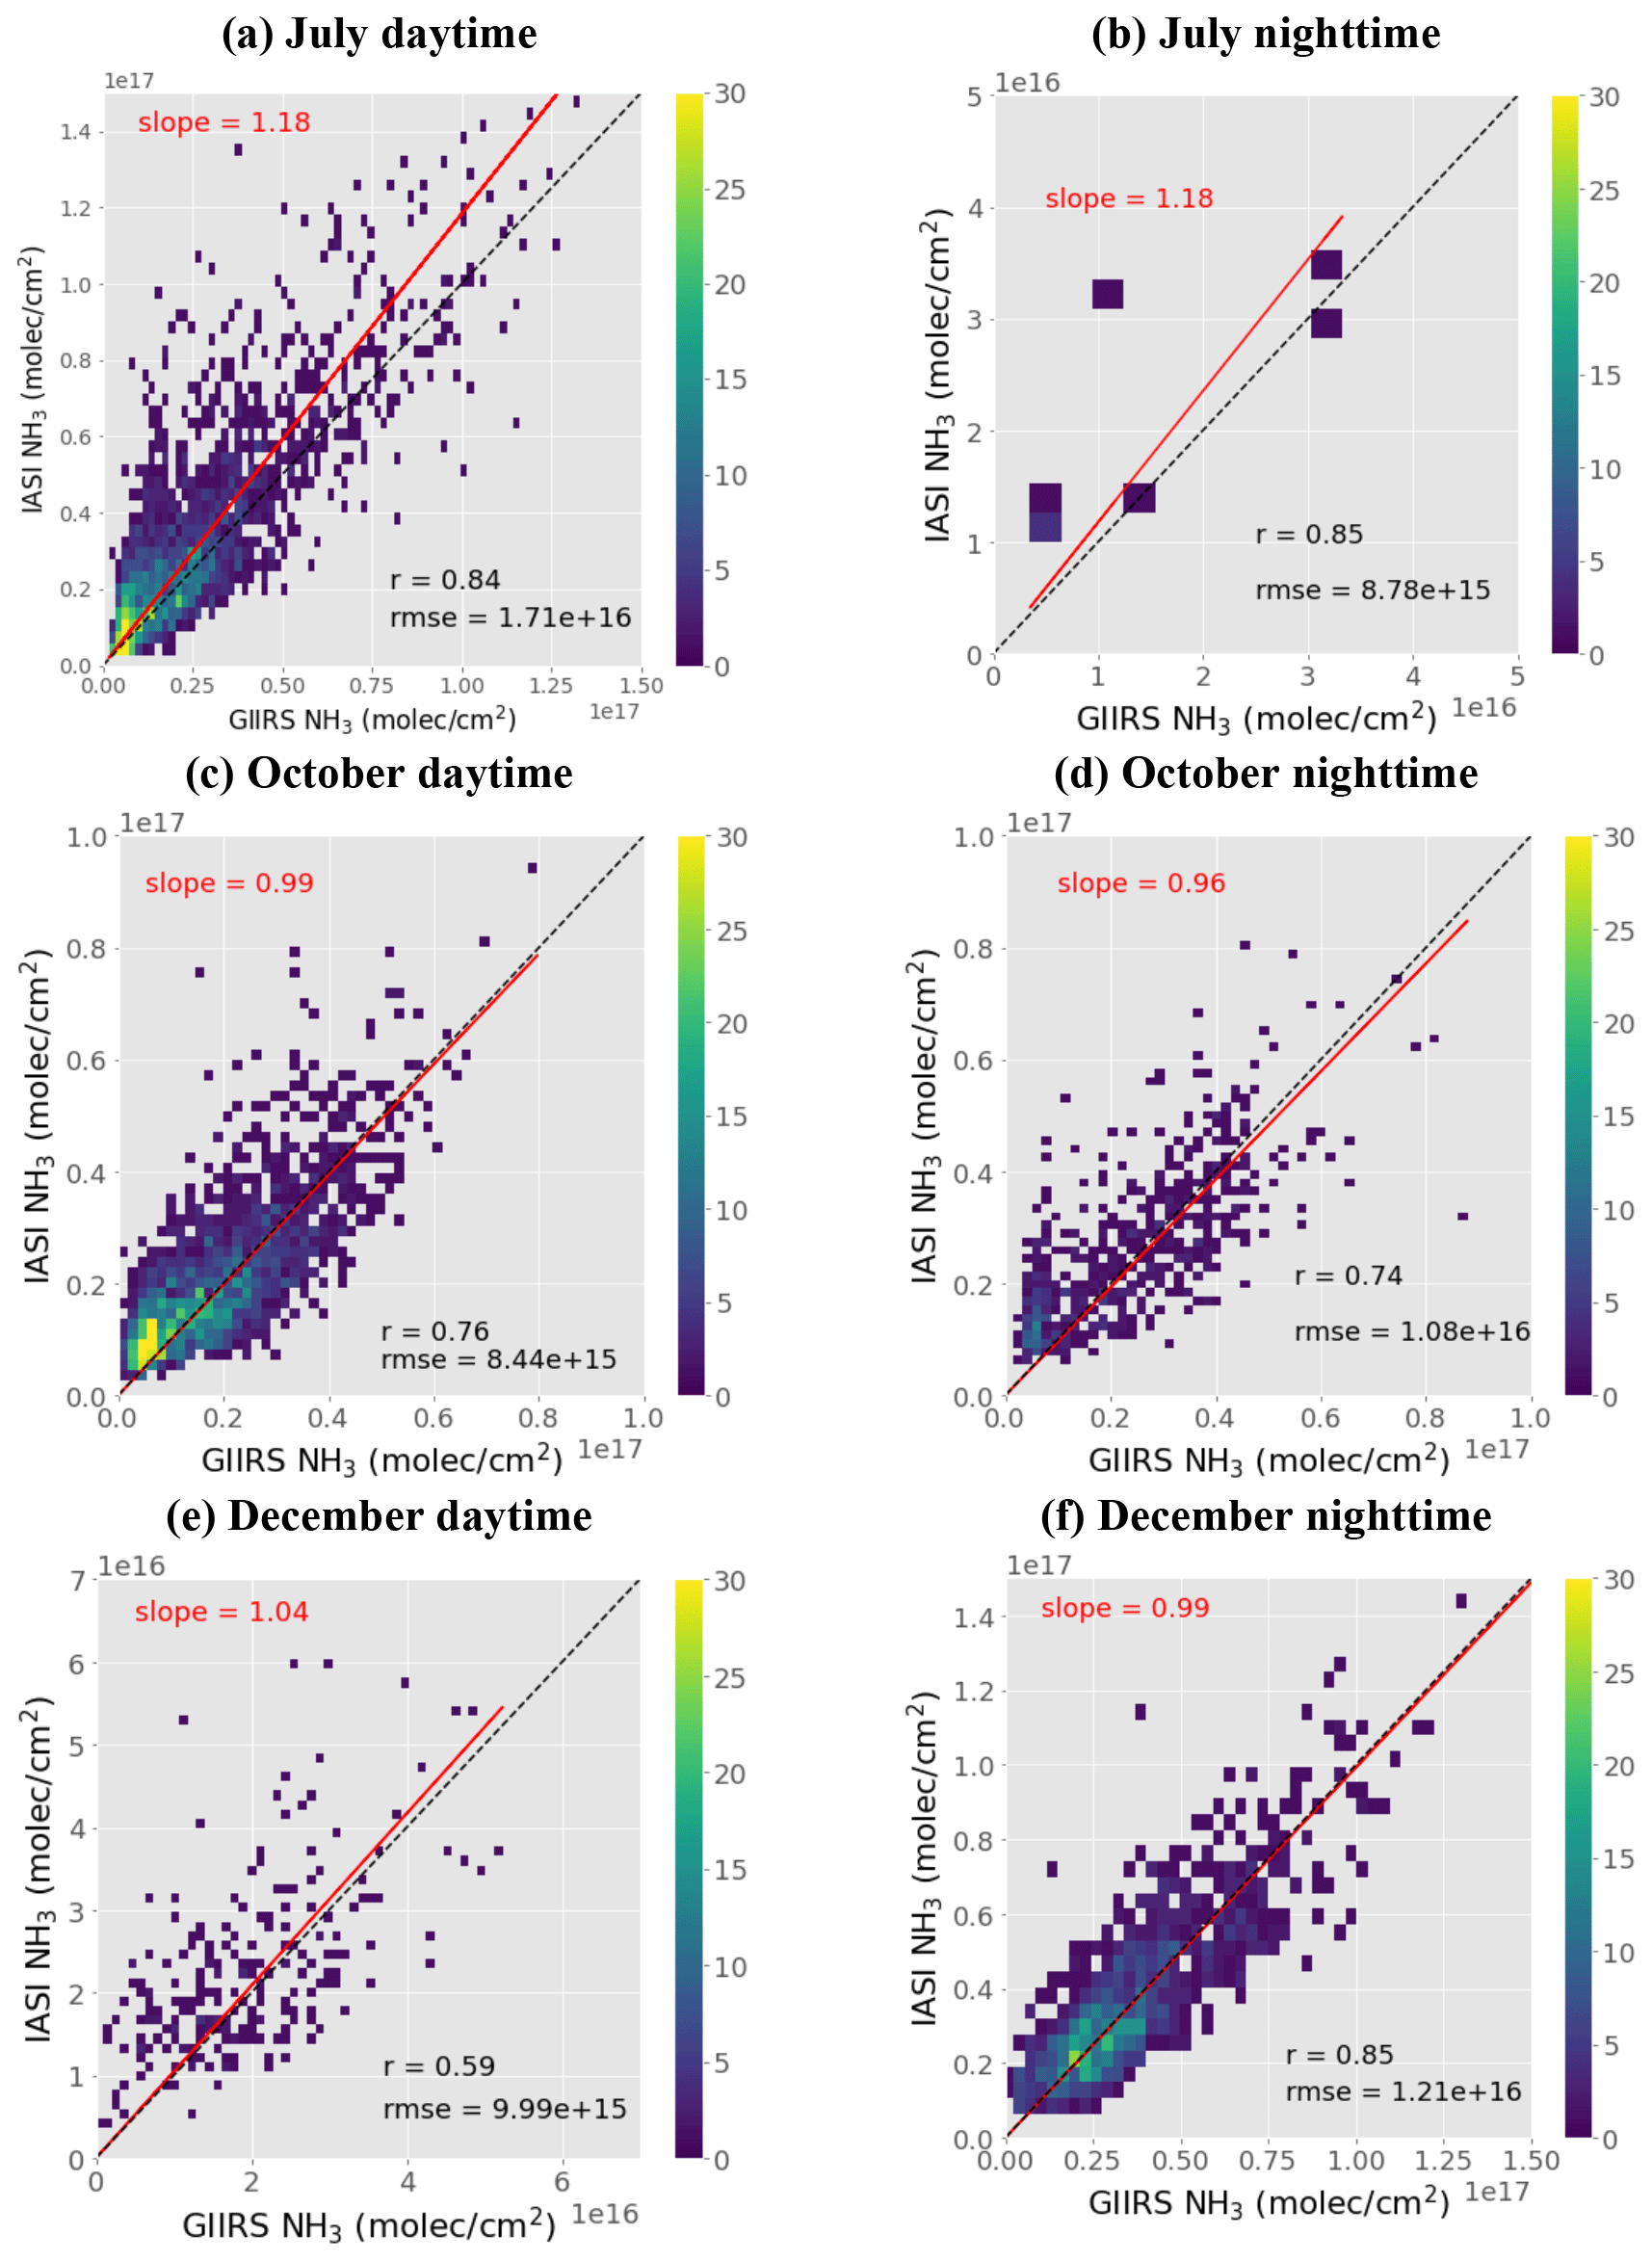
Figure 12Intercomparison of collocated GIIRS and IASI NH3 columns for July, October, and December. Observations are considered to be collocated when they are observed within 6 km and the time difference is smaller than 1 h. The correlation coefficient (r), root mean square error (RMSE), and fitting slope are also indicated. Similar results for August, September, and November are shown in Appendix A.
In this study, we present an NH3 retrieval algorithm based on the optimal estimation method for FY-4B/GIIRS. The DOFS and AK matrix produced from the retrieval algorithm are examined to evaluate the information content and vertical sensitivities in constraining the diurnal cycle of NH3 in East Asia. Our retrievals are carried out using the NH3 microwindow (955–975 cm−1). Retrieval results using FY-4B/GIIRS spectra from July to December 2022 show that (1) the detection sensitivity, as quantified by the AK matrix, peaks in the lowest 2 km atmospheric layers, which facilitates the observation of emission sources in the PBL; (2) the DOFS and TC are highly correlated, resulting in a typical “butterfly” shape, showing that the DOFS increases when the TC becomes either more positive or more negative; (3) the diurnal cycle of NH3 columns from FY-4B/GIIRS shows a significant diurnal cycle in summer (July–August) in the North China Plain, in good agreement with the day–night gradient from the collocated IASI retrievals. The weak and moderate diurnal cycles in two important source regions of the North China Plain and North India in September–October and November–December are also presented from both FY-4B/GIIRS and IASI retrievals. This study demonstrates the capability of GIIRS in observing the diurnal NH3 changes in East Asia, making it a unique dataset for quantifying NH3 emissions and depositions and evaluating strategies for managing anthropogenic sources of NH3 in Asia.
As the world's first geostationary infrared sounder, GIIRS instruments on board FY-4A and FY-4B provide unique hyperspectral thermal infrared observations to quantify the diurnal change of atmospheric composition in East Asia. Other existing geostationary missions and those in planning include South Korea's Geostationary Environment Monitoring Spectrometer (GEMS) launched in February 2020 to measure air quality in Asia using ultraviolet and visible bands (Kim et al., 2020), ESA's Sentinel-4 mission on board the Meteosat Third Generation Sounder platform that consists of the thermal Infrared Sounder (IRS) that will measure profiles of temperature, humidity, and atmospheric composition, and the ultraviolet–visible–near-infrared (UVN) spectrometer that will monitor air quality trace gases and aerosols in Europe (Ingmann et al., 2012; Holmlund et al., 2021), and NASA's Tropospheric Emissions: Monitoring of Pollution (TEMPO) that will observe air quality in North America (Zoogman et al., 2017). These GEO missions form a global network that enables diurnal observation to cover global important emission sources, which will significantly enhance local and global air quality and climate research.
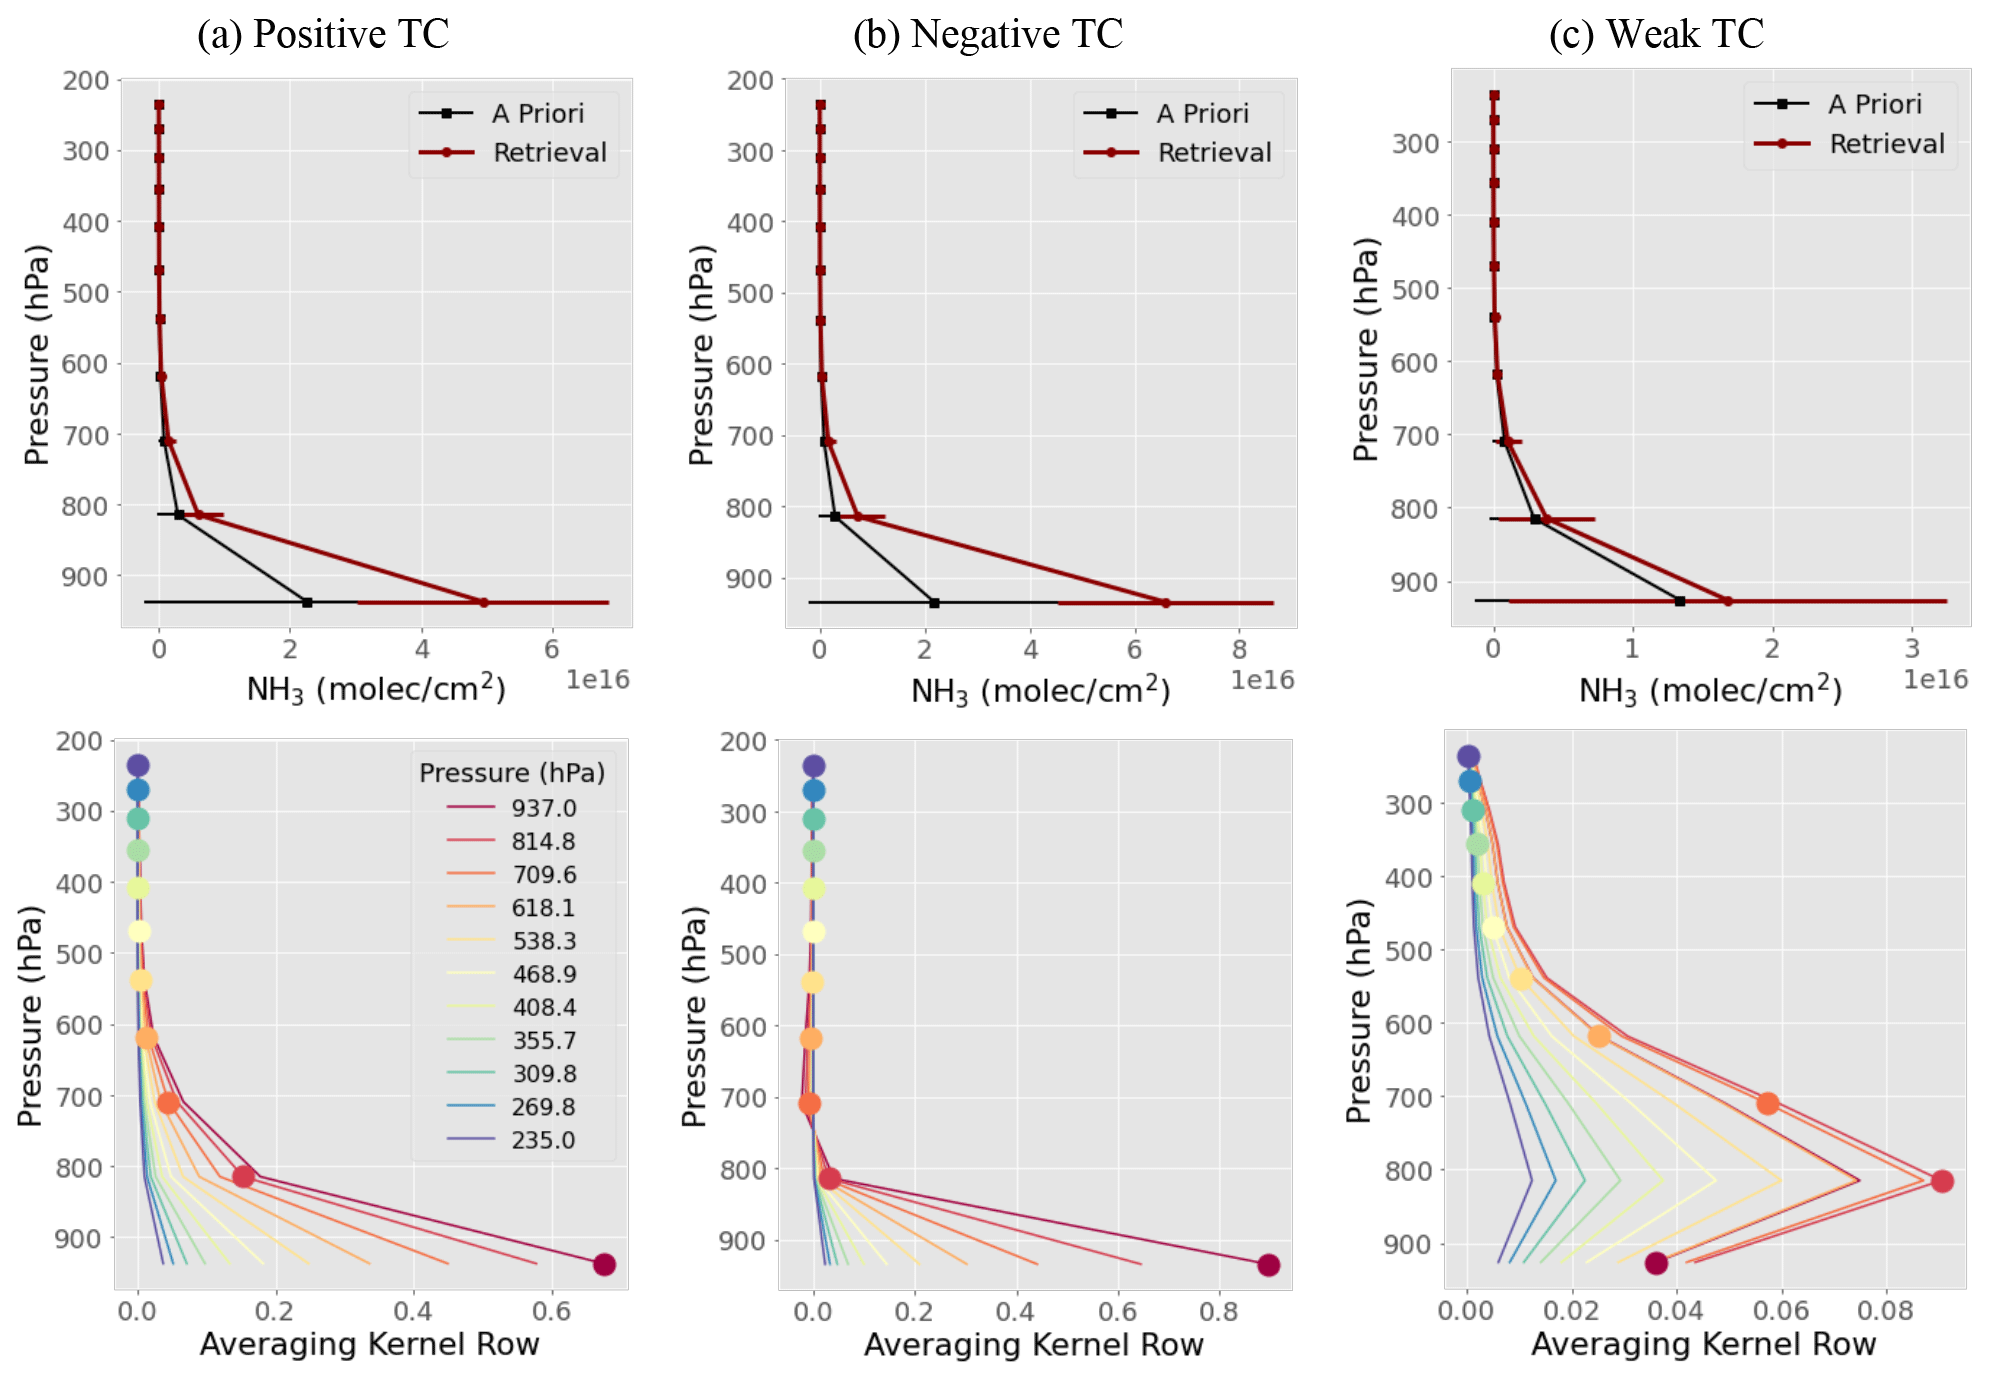
Figure A1Examples of the a priori and retrieval NH3 profiles (upper panel) and the corresponding AK row vectors (second panel) for (a) positive TC with TC =13.37 K and DOFS =0.89 from daytime measurement on 7 July 2022, (b) negative TC with TC K and DOFS =0.91 from nighttime measurement on 18 December 2022, and (c) weak TC with TC =3.39 K and DOFS =0.23 from early evening measurement on 6 July 2022.
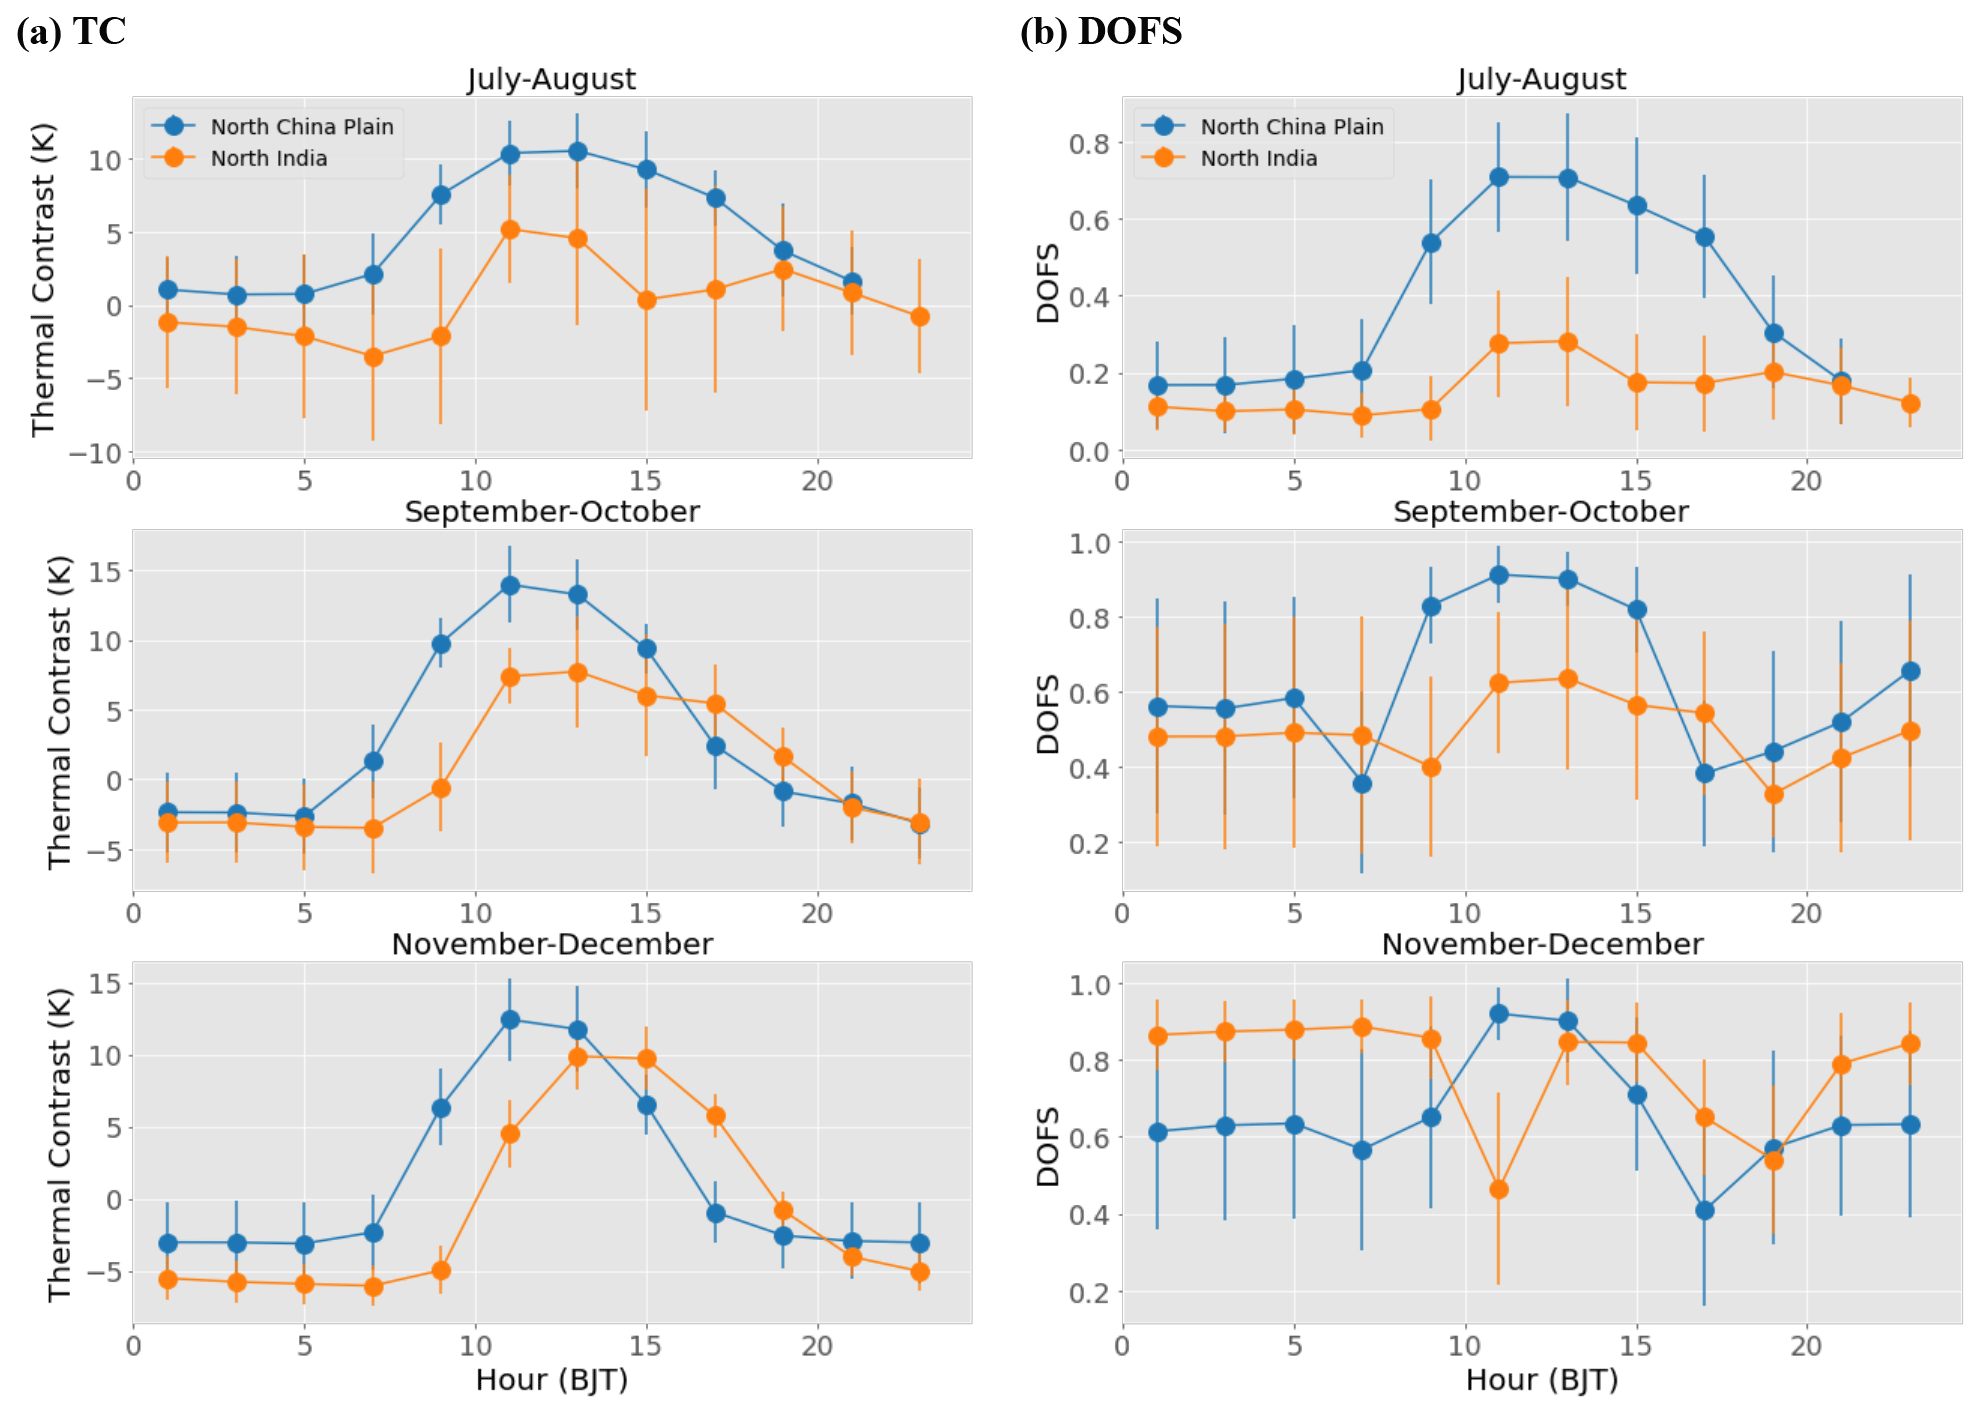
Figure A2Associated figure for Fig. 10 on the diurnal change of TC and the DOFS for the North China Plain and North India. Different from Fig. 10, no extra filters have been applied.
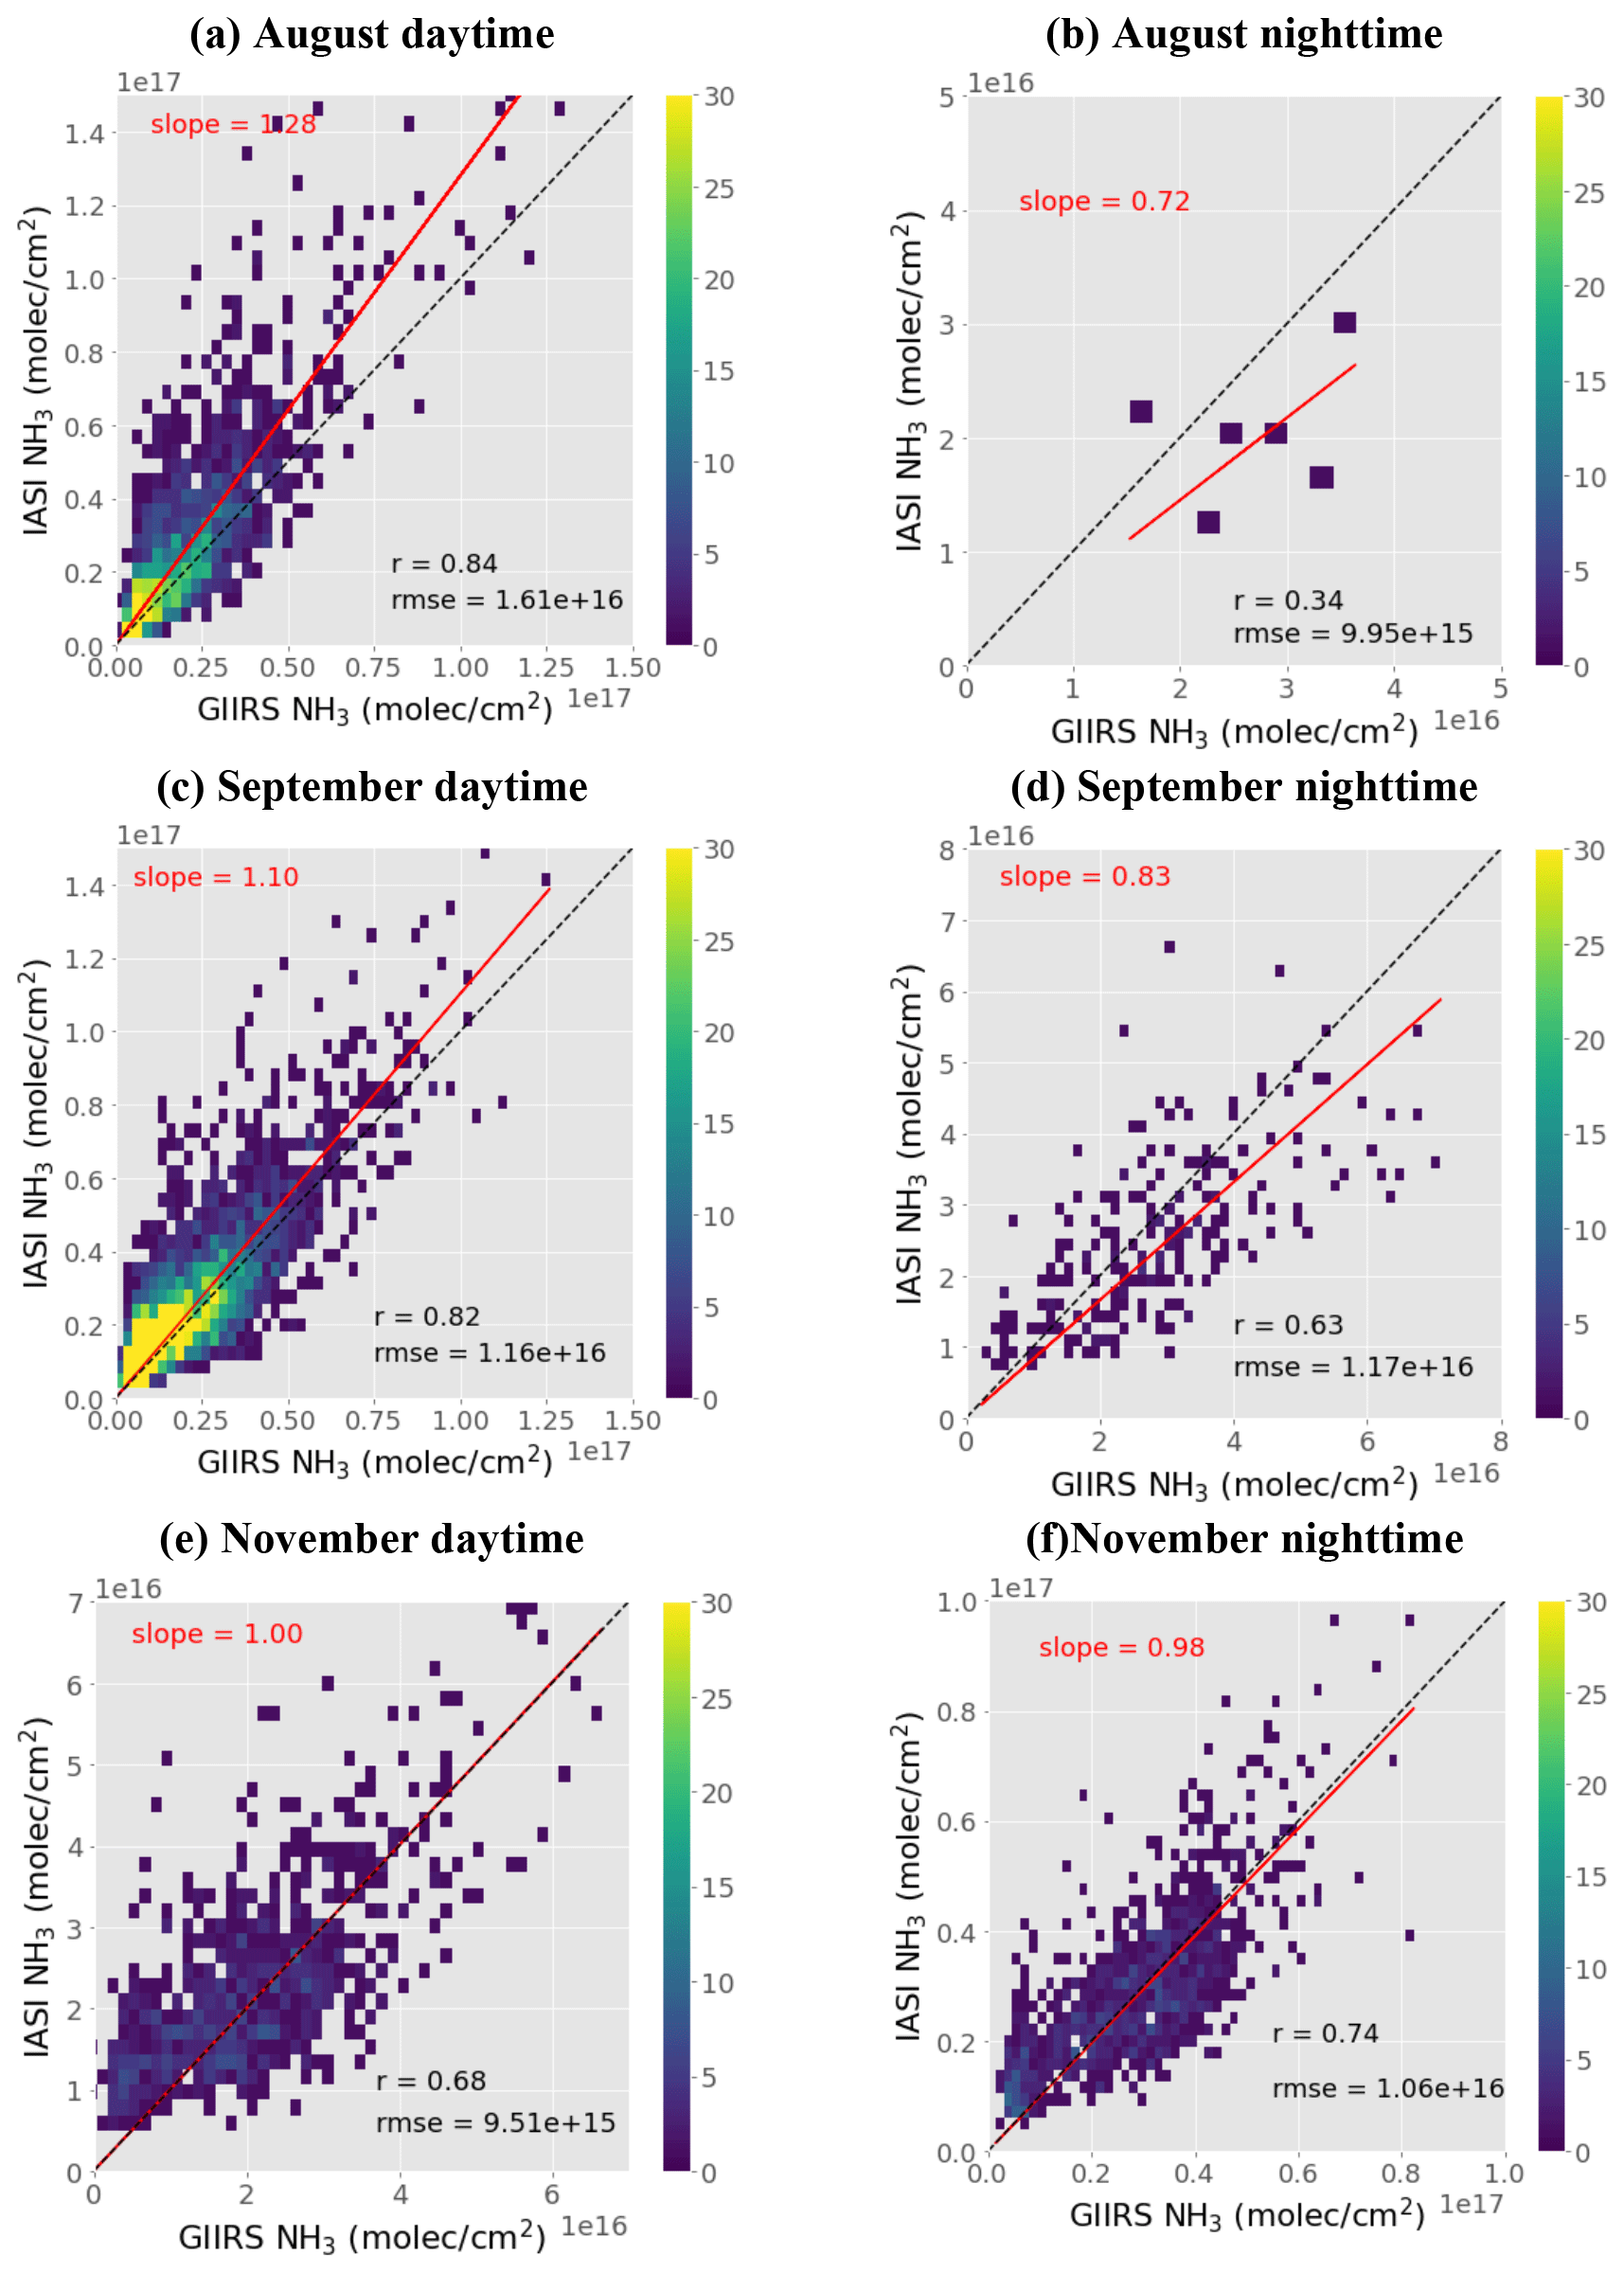
Figure A3Collocation intercomparison of NH3 columns between GIIRS- and IASI-NH3-retrieved columns, similar to Fig. 12 but for August, September, and November.
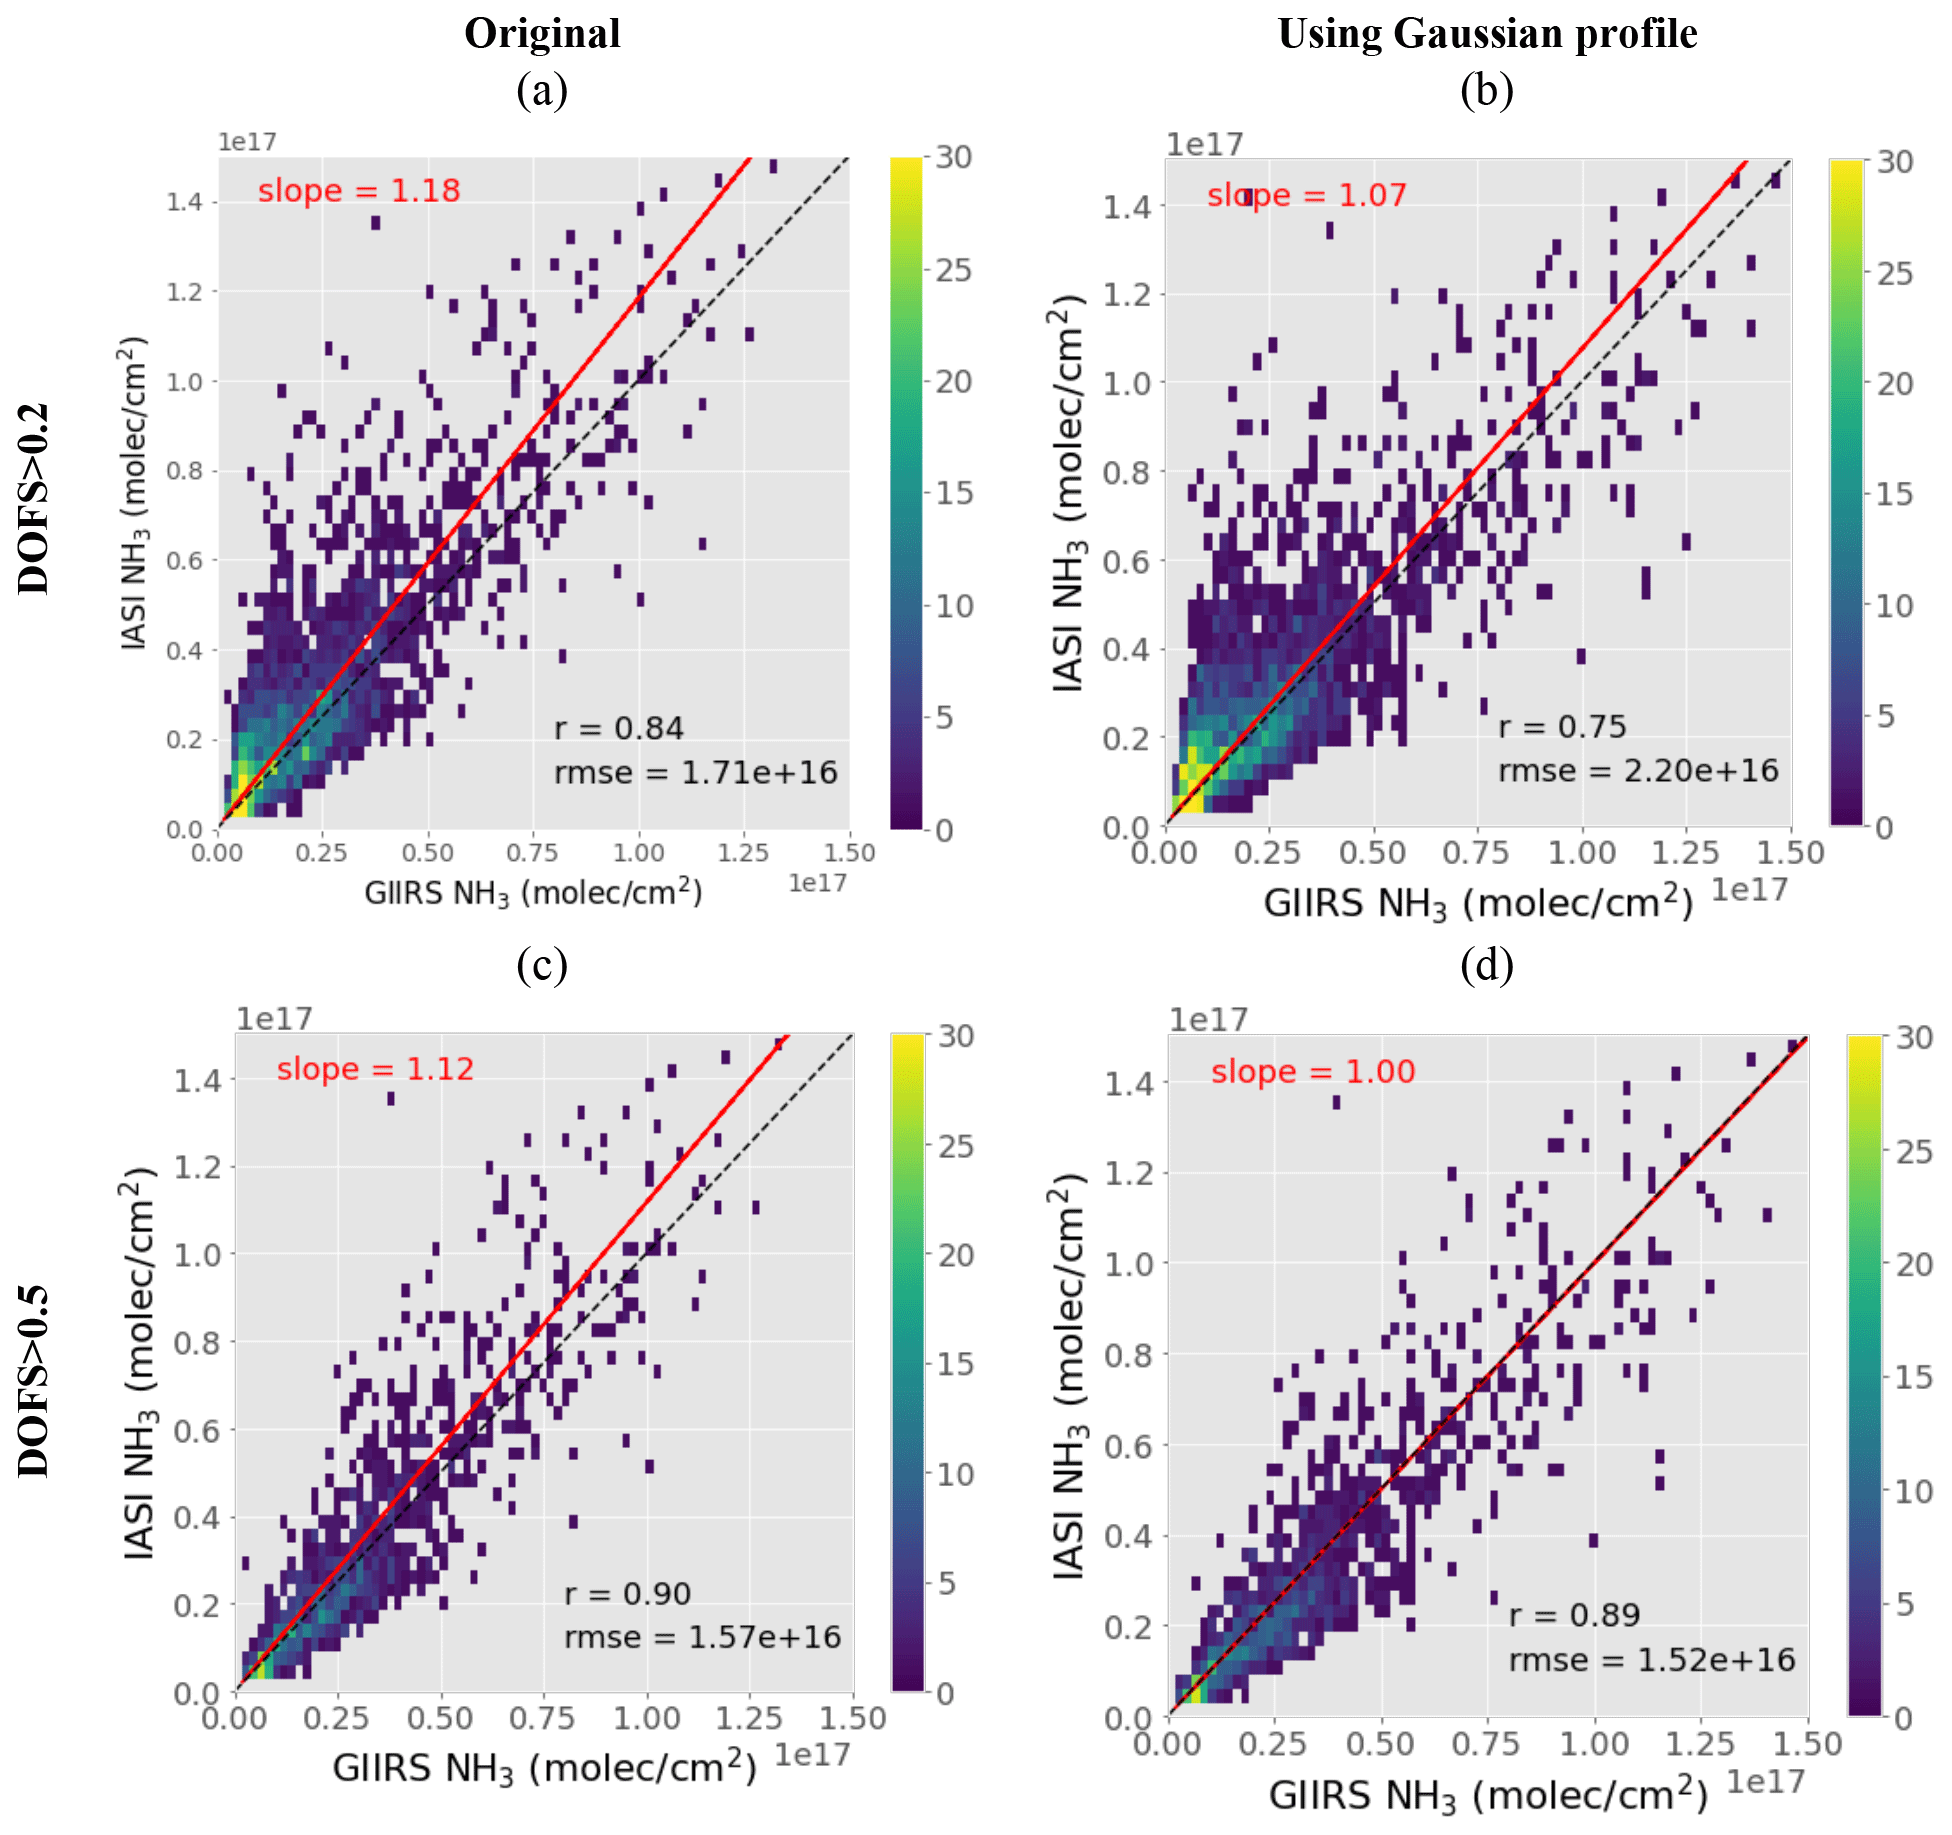
Figure A4Intercomparison of collocated GIIRS and IASI NH3 columns for July daytime, similar to Fig. 12 but for a new set of GIIRS NH3 retrievals that use the Gaussian shape a priori profiles following the IASI v4 algorithm (Clarisse et al., 2023), while keeping the total column for the new a priori profile unchanged. The first and the second columns are the comparisons using the original and the new set of GIIRS NH3 retrievals, respectively. The comparisons by two data filtering criteria based on DOFS >0.2 and DOFS >0.5 are shown in the first and second row, respectively.
The sample NH3 retrieval data from FY-4B/GIIRS in this study are publicly available from the Peking University Open Research Data Platform at https://doi.org/10.18170/DVN/VJ4MLO (Zeng, 2023). The full retrieval dataset (total data size larger than 15 GB) is available from the corresponding author upon request. The data can be previewed at http://fengyun.pku.edu.cn/ (FengYun Atmospheric Composition Data Portal, 2023). FY-4B/GIIRS Level 1 data are publicly available at http://satellite.nsmc.org.cn/portalsite/default.aspx (FengYun Satellite Data Center, 2023). The surface emissivity datasets can be downloaded from the Global Infrared Land Surface Emissivity: https://cimss.ssec.wisc.edu/iremis/ (UW-Madison Baseline Fit Emissivity Database, 2023). The ECMWF ERA5 reanalysis datasets are available at https://cds.climate.copernicus.eu/ (Copernicus Climate Data Store, 2023). The ECMWF atmospheric composition datasets are available at https://ads.atmosphere.copernicus.eu/ (Copernicus Atmosphere Data Store, 2023). NH3 simulation data from GEOS-CF can be downloaded from https://gmao.gsfc.nasa.gov/weather_prediction/GEOS-CF/data_access/ (Global Modeling and Assimilation Office, 2023). IASI is a joint mission of EUMETSAT and the Centre National d'Etudes Spatiales (CNES; France). The IASI NH3 product is available from https://iasi.aeris-data.fr/nh3/ (IASI AERIS database portal, 2023).
The supplement related to this article is available online at: https://doi.org/10.5194/amt-16-3693-2023-supplement.
ZCZ designed the study, developed the forward model and retrieval codes, carried out the experiments and result analysis, and prepared the manuscript. LL and CQ provided guidance on using the FY-4B/GIIRS L1 spectra data and carried out experiments related to spectra uncertainty analysis. LC and MVD provided IASI NH3 v4 data and guidance on comparing GIIRS and IASI data. All authors reviewed and proofread the manuscript.
The contact author has declared that none of the authors has any competing interests.
Publisher’s note: Copernicus Publications remains neutral with regard to jurisdictional claims in published maps and institutional affiliations.
Zhao-Cheng Zeng acknowledges funding from the National Natural Science Foundation of China, the National Key R&D Program of China, and the Fundamental Research Funds for the Central Universities at Peking University. This work was also supported by the High-Performance Computing Platform of Peking University. The authors also acknowledge the financial support of the National Satellite Meteorological Center (NSMC) of the China Meteorological Administration (CMA). Research in Belgium was co-funded by the Belgian State Federal Office for Scientific, Technical and Cultural Affairs (Prodex HIRS), the Air Liquide Foundation (TAPIR project), and ESA (CCI project focusing on short-lived greenhouse gases). This work is also partly supported by the FED-tWIN project ARENBERG (“Assessing the Reactive Nitrogen Budget and Emissions at Regional and Global Scales”), funded via the Belgian Science Policy Office (BELSPO). Lieven Clarisse is Research Associate supported by the Belgian F.R.S.–FNRS.
Zhao-Cheng Zeng has been supported by the funding from the National Natural Science Foundation of China (grant nos. 42275142 and 12292981), the National Key R&D Program of China (grant no. 2022YFA1003801), and the Fundamental Research Funds for the Central Universities at Peking University (grant no. 7101302981). Research at the National Satellite Meteorological Center (NSMC) was funded by NSMC of China Meteorological Administration (CMA) under the program of Calibration Technology Development and Level-1 Data Production for the Hyperspectral Imaging and Sounding Instruments on board FY-3E and FY-4B Satellites (project no. FY-APP-2021.0507). Research in Belgium was co-funded by the Belgian State Federal Office for Scientific, Technical and Cultural Affairs (Prodex HIRS), the Air Liquide Foundation (TAPIR project), and ESA (Short-lived greenhouse gases CCI project). This work is also partly supported by the FED-tWIN project ARENBERG (“Assessing the Reactive Nitrogen Budget and Emissions at Regional and Global Scales”), funded via the Belgian Science Policy Office (BELSPO).
This paper was edited by Thomas von Clarmann and reviewed by two anonymous referees.
Abbatt, J. P. D., Benz, S., Cziczo, D. J., Kanji, Z., Lohmann, U., and Mohler, O.: Solid ammonium sulfate aerosols as ice nuclei: A pathway for cirrus cloud formation, Science, 313, 1770–1773, https://doi.org/10.1126/science.1129726, 2006.
Aneja, V. P., Roelle, P. A., Murray, G. C., Southerland, J., Erisman, J. W., Fowler, D., Asman, W. A. H., and Patni, N.: Atmospheric nitrogen compounds: II. Emissions, transport, transformation, deposition and assessment, Atmos. Environ., 35, 1903–1911, 2001.
Bauduin, S., Clarisse, L., Theunissen, M., George, M., Hurtmans, D., Clerbaux, C., and Coheur, P.-F.: IASI's sensitivity to near-surface carbon monoxide (CO): Theoretical analyses and retrievals on test cases, J. Quant. Spectrosc. Ra., 189, 428–440, https://doi.org/10.1016/j.jqsrt.2016.12.022, 2017.
Beer, R., Shephard, M. W., Kulawik, S. S., Clough, S. A., Eldering, A., Bowman, K. W., Sander, S. P., Fisher, B. M., Payne, V. H., Luo, M., Osterman, G. B., and Worden, J. R.: First satellite observations of lower tropospheric ammonia and methanol, Geophys. Res. Lett., 35, L09801, https://doi.org/10.1029/2008GL033642, 2008.
Clarisse, L., Clerbaux, C., Dentener, F., Hurtmans, D., and Coheur, P.-F.: Global ammonia distribution derived from infrared satellite observations, Nat. Geosci., 2, 479–483, https://doi.org/10.1038/ngeo551, 2009.
Clarisse, L., Shephard, M., Dentener, F., Hurtmans, D., Cady-Pereira, K., Karagulian, F., Van Damme, M., Clerbaux, C., and Coheur, P.-F.: Satellite monitoring of ammonia: A case study of the San Joaquin Valley, J. Geophys. Res., 115, D13302, https://doi.org/10.1029/2009JD013291, 2010.
Clarisse, L., Van Damme, M., Hurtmans, D., Franco, B., Clerbaux, C., and Coheur, P. F.: The diel cycle of NH3 observed from the FY-4A Geostationary Interferometric Infrared Sounder (GIIRS), Geophys. Res. Lett., 48, e2021GL093010, https://doi.org/10.1029/2021GL093010, 2021.
Clarisse, L., Franco, B., Van Damme, M., Di Gioacchino, T., Hadji-Lazaro, J., Whitburn, S., Noppen, L., Hurtmans, D., Clerbaux, C., and Coheur, P.: The IASI NH3 version 4 product: averaging kernels and improved consistency, Atmos. Meas. Tech. Discuss. [preprint], https://doi.org/10.5194/amt-2023-48, in review, 2023.
Clough, S. A., Shephard, M. W., Mlawer, E. J., Delamere, J. S., Iacono, M. J., Cady-Pereira, K., Boukabara, S., and Brown, P. D.: Atmospheric radiative transfer modeling: a summary of the AER codes, Short Communication, J. Quant. Spectrosc. Ra., 91, 233–244, 2005.
Clough, S. A., Shephard, M. W., Worden, J., Brown, P. D., Worden, H. M., Luo, M., Rodgers, C. D., Rinsland, C. P., Goldman, A., and Brown, L.: Forward model and Jacobians for tropospheric emission spectrometer retrievals, IEEE T. Geosci. Remote, 44, 1308–1323, 2006.
Coheur, P.-F., Clarisse, L., Turquety, S., Hurtmans, D., and Clerbaux, C.: IASI measurements of reactive trace species in biomass burning plumes, Atmos. Chem. Phys., 9, 5655–5667, https://doi.org/10.5194/acp-9-5655-2009, 2009.
Copernicus Atmosphere Data Store: https://ads.atmosphere.copernicus.eu/, last access: 1 May 2023.
Copernicus Climate Data Store: https://cds.climate.copernicus.eu/, last access: 1 May 2023.
ECMWF: CAMS global inversion-optimised greenhouse gas fluxes and concentrations, ECMWF [data set], https://ads.atmosphere.copernicus.eu/cdsapp#!/dataset/cams-global-greenhouse-gas-inversion (last access: 1 May 2023), 2022.
Erisman, J. W., Galloway, J. N., Seitzinger, S., Bleeker, A., Dise, N. B., Petrescu, A. M. R., Leach, A. M., and de Vries, W.: Consequences of human modification of the global nitrogen cycle, Philos. T. R. Soc. B, 368, 20130116, https://doi.org/10.1098/rstb.2013.0116, 2013.
FengYun Atmospheric Composition Data Portal: http://fengyun.pku.edu.cn/, last access: 1 August 2023.
FengYun Satellite Data Center: http://satellite.nsmc.org.cn/portalsite/default.aspx, last access: 1 May 2023.
Fowler, D., Coyle, M., Skiba, U., Sutton, M. A., Cape, J. N., Reis, S., Sheppard, L. J., Jenkins, A., Grizzetti, B., Galloway, J. N., Vitousek, P., Leach, A., Bouwman, A. F., Butterbach-Bahl, K., Dentener, F., Stevenson, D., Amann, M., and Voss, M.: The global nitrogen cycle in the twenty-first century, Philos. T. R. Soc. B, 368, 20130164, https://doi.org/10.1098/rstb.2013.0164, 2013.
Galloway, J. N., Dentener, F. J., Capone, D. G., Boyer, E. W., Howarth, R. W., Seitzinger, S. P., Asner, G. P., Cleveland, C. C., Green, P. A., and Holland, E. A.: Nitrogen cycles: past, present, and future, Biogeochemistry, 70, 153–226, 2004.
Global Modeling and Assimilation Office (GMAO): GEOS Composition Forecasts (GEOS-CF), https://gmao.gsfc.nasa.gov/weather_prediction/GEOS-CF/data_access/, last access: 1 May 2023.
Hersbach, H., Bell, B., Berrisford, P., Hirahara, S., Horányi, A., Muñoz-Sabater, J., Nicolas, J., Peubey, C., Radu, R., Schepers, D., Simmons, A., Soci, C., Abdalla, S., Abellan, X., Balsamo, G., Bechtold, P., Biavati, G., Bidlot, J., Bonavita, M., De Chiara, G., Dahlgren, P., Dee, D., Diamantakis, M., Dragani, R., Flemming, J., Forbes, R., Fuentes, M., Geer, A., Haimberger, L., Healy, S., Hogan, R. J., Hólm, E., Janisková, M., Keeley, S., Laloyaux, P., Lopez, P., Lupu, C., Radnoti, G., de Rosnay, P., Rozum, I., Vamborg, F., Villaume, S., and Thépaut, J.-N.: The ERA5 global reanalysis, Q. J. Roy. Meteor. Soc., 146, 1999–2049, https://doi.org/10.1002/qj.3803, 2020.
Holmlund, K., Grandell, J., Schmetz, J., Stuhlmann, R., Bojkov, B., Munro, R., Lekouara, M., Coppens, D., Viticchie, B., August, T., Theodore, B., Watts, P., Dobber, M., Fowler, G., Bojinski, S., Schmid, A., Salonen, K., Tjemkes, S., Aminou, D., and Blythe, P.: Meteosat Third Generation (MTG): Continuation and innovation of observations from geostationary orbit, B. Am. Meteorol. Soc., 102, E990–E1015, https://doi.org/10.1175/BAMS-D-19-0304.1, 2021.
Höpfner, M., Volkamer, R., Grabowski, U., Grutter, M., Orphal, J., Stiller, G., von Clarmann, T., and Wetzel, G.: First detection of ammonia (NH3) in the Asian summer monsoon upper troposphere, Atmos. Chem. Phys., 16, 14357–14369, https://doi.org/10.5194/acp-16-14357-2016, 2016.
Hurtmans, D., Coheur, P.-F., Wespes, C., Clarisse, L., Scharf, O., Clerbaux, C., Hadji-Lazaro, J., George, M., and Turquety, S.: FORLI radiative transfer and retrieval code for IASI, J. Quant. Spectrosc. Ra., 113, 1391–1408, https://doi.org/10.1016/j.jqsrt.2012.02.036, 2012.
IASI AERIS database portal: https://iasi.aeris-data.fr/nh3/, last access: 1 May 2023.
Ingmann, P., Veihelmann, B., Langen, J., Lamarre, D., Stark, H., and Courrèges- Lacoste, G. B.: Requirements for the GMES atmosphere service and ESA's implementation concept: Sentinels-4/-5 and -5p, Remote Sens. Environ., 120, 58–69, https://doi.org/10.1016/j.rse.2012.01.023, 2012.
Isaksen, I. S. A., Granier, C., Myhre, G., Berntsen, T. K., Dalsoren, S. B., Gauss, M., Klimont, Z., Benestad, R., Bousquet, P., Collins, W., Cox, T., Eyring, V., Fowler, D., Fuzzi, S., Jockel, P., Laj, P., Lohmann, U., Maione, M., Monks, P., Prevot, A. S. H., Raes, F., Richter, A., Rognerud, B., Schulz, M., Shindell, D., Stevenson, D. S., Storelvmo, T., Wang, W. C., van Weele, M., Wild, M., and Wuebbles, D.: Atmospheric composition change: Climate-Chemistry interactions, Atmos. Environ., 43, 5138–5192, https://doi.org/10.1016/j.atmosenv.2009.08.003, 2009.
Keller, C. A., Knowland, K. E., Duncan, B. N., Liu, J., Anderson, D. C., Das, S., Lucchesi, R. A., Lundgren, E. W., Nicely, J. M., Nielsen, E., Ott, L. E., Saunders, E., Strode, S. A., Wales, P. A., Jacob, D. J., and Pawson, S.: Description of the NASA GEOS Composition Forecast Modeling System GEOS-CF v1.0, J. Adv. Model. Earth Sy., 13, e2020MS002413, https://doi.org/10.1029/2020MS002413, 2021.
Kim, J., Jeong, U., Ahn, M. H., Kim, J. H., Park, R. J., Lee, H., Song, C. H., Choi, Y. S., Lee, K. H., Yoo, J. M., Jeong, M. J., Park, S. K., Lee, K. M., Song, C. K., Kim, S. W., Kim, Y. J., Kim, S. W., Kim, M., Go, S., Liu, X., Chance, K., Miller, C. C., Al-Saadi, J., Veihelmann, B., Bhartia, P. K., Torres, O., Abad, G. G., Haffner, D. P., Ko, D. H., Lee, S. H., Woo, J. H., Chong, H., Park, S. S., Nicks, D., Choi, W. J., Moon, K. J., Cho, A., Yoon, J., Kim, S. kyun, Hong, H., Lee, K., Lee, H., Lee, S., Choi, M., Veefkind, P., Levelt, P. F., Edwards, D. P., Kang, M., Eo, M., Bak, J., Baek, K., Kwon, H. A., Yang, J., Park, J., Han, K. M., Kim, B. R., Shin, H. W., Choi, H., Lee, E., Chong, J., Cha, Y., Koo, J. H., Irie, H., Hayashida, S., Kasai, Y., Kanaya, Y., Liu, C., Lin, J., Crawford, J. H., Carmichael, G. R., Newchurch, M. J., Lefer, B. L., Herman, J. R., Swap, R. J., Lau, A. K. H., Kurosu, T. P., Jaross, G., Ahlers, B., Dobber, M., McElroy, C. T. and Choi, Y.: New era of air quality monitoring from space: Geostationary environment monitoring spectrometer (GEMS), B. Am. Meteorol. Soc., 101, E1–E22, https://doi.org/10.1175/BAMS-D-18-0013.1, 2020.
Li, J., Menzel, W. P., Schmit, T. J., and Schmetz, J.: Applications of Geostationary Hyperspectral Infrared Sounder Observations: Progress, Challenges, and Future Perspectives, B. Am. Meteorol. Soc., 103, E2733–E2755, https://doi.org/10.1175/BAMS-D-21-0328.1, 2022.
Li, M., Zhang, Q., Kurokawa, J.-I., Woo, J.-H., He, K., Lu, Z., Ohara, T., Song, Y., Streets, D. G., Carmichael, G. R., Cheng, Y., Hong, C., Huo, H., Jiang, X., Kang, S., Liu, F., Su, H., and Zheng, B.: MIX: a mosaic Asian anthropogenic emission inventory under the international collaboration framework of the MICS-Asia and HTAP, Atmos. Chem. Phys., 17, 935–963, https://doi.org/10.5194/acp-17-935-2017, 2017.
Meng, Z., Xu, X., Lin, W., Ge, B., Xie, Y., Song, B., Jia, S., Zhang, R., Peng, W., Wang, Y., Cheng, H., Yang, W., and Zhao, H.: Role of ambient ammonia in particulate ammonium formation at a rural site in the North China Plain, Atmos. Chem. Phys., 18, 167–184, https://doi.org/10.5194/acp-18-167-2018, 2018.
Natraj, V., Luo, M., Blavier, J.-F., Payne, V. H., Posselt, D. J., Sander, S. P., Zeng, Z.-C., Neu, J. L., Tremblay, D., Wu, L., Roman, J. A., Wu, Y.-H., and Dorsky, L. I.: Simulated multispectral temperature and atmospheric composition retrievals for the JPL GEO-IR Sounder, Atmos. Meas. Tech., 15, 1251–1267, https://doi.org/10.5194/amt-15-1251-2022, 2022.
Paerl, H. W., Gardner, W. S., McCarthy, M. J., Peierls, B. L., and Wilhelm, S. W.: Algal blooms: Noteworthy nitrogen, Science, 346, 175–175, https://doi.org/10.1126/science.346.6206.175-a, 2014.
Rodgers, C. D.: Inverse Methods for Atmospheric Sounding: Theory and Practice, World Scientific, Singapore, ISBN: 978-98102-2740-1, 2000.
Seemann, S. W., Borbas, E. E., Knuteson, R. O., Stephenson, G. R., and Huang, H.-L.: Development of a Global Infrared Land Surface Emissivity Database for Application to Clear Sky Sounding Retrievals from Multi-spectral Satellite Radiance Measurements, J. Appl. Meteorol. Clim., 47, 108–123, https://doi.org/10.1175/2007JAMC1590.1, 2008.
Seinfeld, J. H. and Pandis, S. N.: Atmospheric Chemistry and Physics: From Air Pollution to Climate Change, John Wiley, New York, ISBN: 978-1-118-94740-1, 2006.
Shephard, M. W. and Cady-Pereira, K. E.: Cross-track Infrared Sounder (CrIS) satellite observations of tropospheric ammonia, Atmos. Meas. Tech., 8, 1323–1336, https://doi.org/10.5194/amt-8-1323-2015, 2015.
Shephard, M. W., Cady-Pereira, K. E., Luo, M., Henze, D. K., Pinder, R. W., Walker, J. T., Rinsland, C. P., Bash, J. O., Zhu, L., Payne, V. H., and Clarisse, L.: TES ammonia retrieval strategy and global observations of the spatial and seasonal variability of ammonia, Atmos. Chem. Phys., 11, 10743–10763, https://doi.org/10.5194/acp-11-10743-2011, 2011.
Shephard, M. W., Dammers, E., Cady-Pereira, K. E., Kharol, S. K., Thompson, J., Gainariu-Matz, Y., Zhang, J., McLinden, C. A., Kovachik, A., Moran, M., Bittman, S., Sioris, C. E., Griffin, D., Alvarado, M. J., Lonsdale, C., Savic-Jovcic, V., and Zheng, Q.: Ammonia measurements from space with the Cross-track Infrared Sounder: characteristics and applications, Atmos. Chem. Phys., 20, 2277–2302, https://doi.org/10.5194/acp-20-2277-2020, 2020.
Someya, Y., Imasu, R., Shiomi, K., and Saitoh, N.: Atmospheric ammonia retrieval from the TANSO-FTS/GOSAT thermal infrared sounder, Atmos. Meas. Tech., 13, 309–321, https://doi.org/10.5194/amt-13-309-2020, 2020.
Tevlin, A. G., Li, Y., Collett, J. L., McDuffie, E. E., Fischer, E. V., and Murphy, J. G.: Tall Tower Vertical Profiles and Diurnal Trends of Ammonia in the Colorado Front Range, J. Geophys. Res.-Atmos., 122, 12468–12487, https://doi.org/10.1002/2017JD026534, 2017.
UW-Madison Baseline Fit Emissivity Database: https://cimss.ssec.wisc.edu/iremis/, last access: 1 May 2023.
Van Damme, M., Clarisse, L., Heald, C. L., Hurtmans, D., Ngadi, Y., Clerbaux, C., Dolman, A. J., Erisman, J. W., and Coheur, P. F.: Global distributions, time series and error characterization of atmospheric ammonia (NH3) from IASI satellite observations, Atmos. Chem. Phys., 14, 2905–2922, https://doi.org/10.5194/acp-14-2905-2014, 2014.
Van Damme, M., Whitburn, S., Clarisse, L., Clerbaux, C., Hurtmans, D., and Coheur, P.-F.: Version 2 of the IASI NH3 neural network retrieval algorithm: near-real-time and reanalysed datasets, Atmos. Meas. Tech., 10, 4905–4914, https://doi.org/10.5194/amt-10-4905-2017, 2017.
Van Damme, M., Clarisse, L., Whitburn, S., Hadji-Lazaro, J., Hurtmans, D., Clerbaux, C., and Coheur, P.-F.: Industrial and agricultural ammonia point sources exposed, Nature, 564, 99–103, https://doi.org/10.1038/s41586-018-0747-1, 2018.
Van Damme, M., Clarisse, L., Franco, B., Sutton, M. A., Erisman, J. W., Kruit, R. J. W., van Zanten, M., Whitburn, S., Hadji-Lazaro, J., Hurtmans, D., Clerbaux, C., and Coheur, P. F.: Global, regional and national trends of atmospheric ammonia derived from a decadal (2008–2018) satellite record, Environ. Res. Lett., 16, 055017, https://doi.org/10.1088/1748-9326/abd5e0, 2021.
Wang, T., Song, Y., Xu, Z., Liu, M., Xu, T., Liao, W., Yin, L., Cai, X., Kang, L., Zhang, H., and Zhu, T.: Why is the Indo-Gangetic Plain the region with the largest NH3 column in the globe during pre-monsoon and monsoon seasons?, Atmos. Chem. Phys., 20, 8727–8736, https://doi.org/10.5194/acp-20-8727-2020, 2020.
Warner, J. X., Wei, Z., Strow, L. L., Dickerson, R. R., and Nowak, J. B.: The global tropospheric ammonia distribution as seen in the 13-year AIRS measurement record, Atmos. Chem. Phys., 16, 5467–5479, https://doi.org/10.5194/acp-16-5467-2016, 2016.
Warner, J. X., Dickerson, R. R., Wei, Z., Strow, L. L., Wang, Y., and Liang, Q.: Increased atmospheric ammonia over the world's major agricultural areas detected from space, Geophys. Res. Lett., 44, 2875–2884, https://doi.org/10.1002/2016gl072305, 2017.
Whitburn, S., Van Damme, M., Clarisse, L., Bauduin, S., Heald, C. L., Hadji-Lazaro, J., Hurtmans, D., Zondlo, M. A., Clerbaux, C., and Coheur, P.-F.: A flexible and robust neural network IASI-NH3 retrieval algorithm, J. Geophys. Res.-Atmos., 121, 6581–6599, https://doi.org/10.1002/2016jd024828, 2016.
Yang, J., Zhang, Z., Wei, C., Lu, F., and Guo, Q.: Introducing the new generation of Chinese geostationary weather satellites, Fengyun-4, B. Am. Meteorol. Soc., 98, 1637–1658, https://doi.org/10.1175/BAMS-D-16-0065.1, 2017.
Zeng, Z.-C.: Updated Ammonia (NH3) retrievals from GIIRS onboard FY-4B, Version V3, Peking University Open Research Data Platform [data set], https://doi.org/10.18170/DVN/VJ4MLO, 2023.
Zeng, Z.-C., Zhang, Q., Natraj, V., Margolis, J. S., Shia, R.-L., Newman, S., Fu, D., Pongetti, T. J., Wong, K. W., Sander, S. P., Wennberg, P. O., and Yung, Y. L.: Aerosol scattering effects on water vapor retrievals over the Los Angeles Basin, Atmos. Chem. Phys., 17, 2495–2508, https://doi.org/10.5194/acp-17-2495-2017, 2017.
Zeng, Z.-C., Natraj, V., Xu, F., Chen, S., Gong, F.-Y., Pongetti, T. J., Sung, K., Toon, G., Sander, S. P., and Yung, Y. L.: GFIT3: a full physics retrieval algorithm for remote sensing of greenhouse gases in the presence of aerosols, Atmos. Meas. Tech., 14, 6483–6507, https://doi.org/10.5194/amt-14-6483-2021, 2021.
Zeng, Z.-C., Lee, L., and Qi, C.: Diurnal carbon monoxide observed from a geostationary infrared hyperspectral sounder: first result from GIIRS on board FengYun-4B, Atmos. Meas. Tech., 16, 3059–3083, https://doi.org/10.5194/amt-16-3059-2023, 2023.
Zhu, L., Henze, D., Bash, J., Jeong, G.-R., Cady-Pereira, K., Shephard, M., Luo, M., Paulot, F., and Capps, S.: Global evaluation of ammonia bidirectional exchange and livestock diurnal variation schemes, Atmos. Chem. Phys., 15, 12823–12843, https://doi.org/10.5194/acp-15-12823-2015, 2015.
Zoogman, P., Liu, X., Suleiman, R., Pennington, W., Flittner, D., Al-Saadi, J., Hilton, B., Nicks, D., Newchurch, M., Carr, J., Janz, S., Andraschko, M., Arola, A., Baker, B., Canova, B., Miller, C. C., Cohen, R., Davis, J., Dussault, M., Edwards, D., Fishman, J., Ghulam, A., Abad, G. G., Grutter, M., Herman, J., Houck, J., Jacob, D., Joiner, J., Kerridge, B., Kim, J., Krotkov, N., Lamsal, L., Li, C., Lindfors, A., Martin, R., McElroy, C., McLinden, C., Natraj, V., Neil, D., Nowlan, C., O'Sullivan, E., Palmer, P., Pierce, R., Pippin, M., Saiz-Lopez, A., Spurr, R., Szykman, J., Torres, O., Veefkind, J., Veihelmann, B., Wang, H., Wang, J., and Chance, K.: Tropospheric emissions: Monitoring of pollution (TEMPO), J. Quant. Spectrosc. Ra., 186, 17–39, https://doi.org/10.1016/j.jqsrt.2016.05.008, 2017.