the Creative Commons Attribution 4.0 License.
the Creative Commons Attribution 4.0 License.
 | 18 Aug 2023
A blended TROPOMI+GOSAT satellite data product for atmospheric methane using machine learning to correct retrieval biases
Nicholas Balasus
Daniel J. Jacob
Alba Lorente
Joannes D. Maasakkers
Robert J. Parker
Hartmut Boesch
Zichong Chen
Makoto M. Kelp
Hannah Nesser
Daniel J. Varon
Satellite observations of dry-column methane mixing ratios (XCH4) from shortwave infrared (SWIR) solar backscatter radiation provide a powerful resource to quantify methane emissions in service of climate action. The TROPOspheric Monitoring Instrument (TROPOMI), launched in October 2017, provides global daily coverage at a 5.5 × 7 km2 (nadir) pixel resolution, but its methane retrievals can suffer from biases associated with SWIR surface albedo, scattering from aerosols and cirrus clouds, and across-track variability (striping). The Greenhouse gases Observing SATellite (GOSAT) instrument, launched in 2009, has better spectral characteristics and its methane retrieval is much less subject to biases, but its data density is 250 times sparser than TROPOMI. Here, we present a blended TROPOMI+GOSAT methane product obtained by training a machine learning (ML) model to predict the difference between TROPOMI and GOSAT co-located measurements, using only predictor variables included in the TROPOMI retrieval, and then applying the correction to the complete TROPOMI record from April 2018 to present. We find that the largest corrections are associated with coarse aerosol particles, high SWIR surface albedo, and across-track pixel index. Our blended product corrects a systematic difference between TROPOMI and GOSAT over water, and it features corrections exceeding 10 ppb over arid land, persistently cloudy regions, and high northern latitudes. It reduces the TROPOMI spatially variable bias over land (referenced to GOSAT data) from 14.3 to 10.4 ppb at a 0.25∘ × 0.3125∘ resolution. Validation with Total Carbon Column Observing Network (TCCON) ground-based column measurements shows reductions in variable bias compared with the original TROPOMI data from 4.7 to 4.4 ppb and in single-retrieval precision from 14.5 to 11.9 ppb. TCCON data are all in locations with a SWIR surface albedo below 0.4 (where TROPOMI biases tend to be relatively low), but they confirm the dependence of TROPOMI biases on SWIR surface albedo and coarse aerosol particles, as well as the reduction of these biases in the blended product. Fine-scale inspection of the Arabian Peninsula shows that a number of hotspots in the original TROPOMI data are removed as artifacts in the blended product. The blended product also corrects striping and aerosol/cloud biases in single-orbit TROPOMI data, enabling better detection and quantification of ultra-emitters. Residual coastal biases can be removed by applying additional filters. The ML method presented here can be applied more generally to validate and correct data from any new satellite instrument by reference to a more established instrument.
- Article
(14346 KB) - Full-text XML
- BibTeX
- EndNote


Methane is a strong greenhouse gas that is responsible for a third of the increase in the global mean surface air temperature from 1750 to 2019 (Szopa et al., 2021). Its high global warming potential and short atmospheric lifetime of only 9 years (Prather et al., 2012) make it an attractive mitigation target to address near-term climate change (Nisbet et al., 2020). Monitoring progress in methane mitigation requires knowledge of worldwide emissions, but these are still highly uncertain (Saunois et al., 2020). Global satellite observations of atmospheric methane provide important top-down information to improve emission inventories by inversion of chemical transport models (CTMs) to relate concentrations to emissions (Palmer et al., 2021). The Greenhouse gases Observing SATellite (GOSAT) has been in space since 2009 and provides mature and accurate retrievals, but they are relatively sparse (Parker et al., 2020). The TROPOspheric Monitoring Instrument (TROPOMI) was launched in 2017 and provides global daily coverage, but it is more subject to biases than GOSAT because it uses a different spectral viewing window, has a coarser spectral resolution, and relies on an array of detectors (Jacob et al., 2022). Here, we apply machine learning (ML) to produce a blended TROPOMI+GOSAT product that uses GOSAT to correct biases in the TROPOMI data and enables more reliable application of these TROPOMI data for the global inference of methane emissions.
Methane can be observed from space by nadir measurement of the spectrum of backscattered sunlight in the shortwave infrared (SWIR) spectral range. There are strong methane absorption features at 1.65 and 2.3 µm, enabling retrieval of the atmospheric methane column with near vertically uniform sensitivity from the top of the atmosphere down to the surface under clear-sky conditions (Frankenberg et al., 2005). Normalization of this methane column to the dry air mass yields a dry total column-averaged mixing ratio of methane (XCH4) as the standard retrieved quantity (Jacob et al., 2016). Retrievals can be biased when spectral structure in the surface albedo is misinterpreted as methane absorption (Jongaramrungruang et al., 2021). Poorly resolved, optically thin scatterers, including aerosols and cirrus clouds, as well as stray light from adjacent reflective surfaces can also bias methane retrievals (Aben et al., 2007; Butz et al., 2010; Schepers et al., 2012).
The susceptibility of methane retrievals to surface and atmospheric scattering effects depends on several factors, including the spectral resolution of the instrument and the choice of SWIR band. GOSAT measures in the 1.65 µm band with a 0.06 nm spectral resolution, enabling accurate retrieval of methane using the proxy approach that takes advantage of CO2 absorption in that same band (Parker et al., 2011). The CO2 proxy approach multiplies the ratio retrieved without consideration of atmospheric scattering by a local XCO2 value from a CTM calibrated with observations. This takes advantage of the much smaller variability in XCO2 than in XCH4 and largely cancels surface and atmospheric artifacts. A limitation of the proxy approach is the assumption of accurate prior XCO2, which can introduce biases when CO2 and methane are co-emitted from a flare, for example. The proxy approach has demonstrated accuracy (Buchwitz et al., 2015), and the GOSAT retrievals are mature. GOSAT utilizes a Fourier transform spectrometer with mechanical cross-track pointing, providing a uniform spectral response for its observations and consistent high-quality data from 2009 to present (Kuze et al., 2016). The main limitation of GOSAT is that its observations are sparse, taken in 10.5 km diameter pixels spaced about 270 km apart with a return time of 3 d. The GOSAT data have been used extensively for inversions of methane emissions on global and continental scales with a 100–500 km resolution (Turner et al., 2015; Maasakkers et al., 2019; Janardanan et al., 2020; Western et al., 2021; Maasakkers et al., 2021; Qu et al., 2021; Worden et al., 2022; Feng et al., 2022), but they cannot effectively access finer scales.
TROPOMI provides global daily coverage in continuous 5.5 × 7 km2 (nadir) pixels, increasing the data density relative to GOSAT by more than 2 orders of magnitude through the use of an imaging grating spectrometer. It measures in the 2.3 µm band, where the CO2 proxy approach is not possible, with a spectral resolution of 0.25 nm. Retrieval of XCH4 by TROPOMI employs a full-physics approach in which surface albedo and atmospheric scattering properties are retrieved together with XCH4, utilizing additional information from the near-infrared (NIR) band of TROPOMI (Butz et al., 2012). Aliasing between these parameters in the retrieval can produce artifacts that bias the inference of methane emissions (Barré et al., 2021; Qu et al., 2021; Jacob et al., 2022). Recent improvements to the operational retrieval produced by the Netherlands Institute for Space Research (SRON) have reduced some of these biases (Lorente et al., 2021, 2023). An independent TROPOMI retrieval by the University of Bremen (Schneising et al., 2019, 2023) applied an ML correction to a methane climatology to remove retrieval biases, but this may bias the product if the correction to climatology is not appropriate.
Our blended TROPOMI+GOSAT methane product aims to eliminate biases from the TROPOMI data by using co-located GOSAT methane retrievals from 4 years of observations (2018–2021) to train an ML model for predicting the TROPOMI − GOSAT XCH4 difference, relying only on predictor variables included in the TROPOMI methane product. This allows us to apply the TROPOMI − GOSAT correction to the complete TROPOMI dataset (2018–present) to form the blended product. The ML model also identifies the main sources of bias in the TROPOMI data to guide further improvements in the retrieval. The methods presented here are not specific to TROPOMI and GOSAT and could be applied to any other satellite instrument pairs.
Table 1 summarizes the GOSAT and TROPOMI data used in the construction of our blended TROPOMI+GOSAT product, including the GOSAT v9.0 proxy retrieval from Parker et al. (2020) (quality flag of 0) and the TROPOMI v02.04.00 operational product based on Lorente et al. (2023) (quality assurance value of 1, albedo bias correction applied). It is standard practice to evaluate satellite methane products with ground-based XCH4 observations from the Total Carbon Column Observing Network (TCCON) (Wunch et al., 2011). We do so here for the GOSAT and TROPOMI retrievals using the 24 TCCON sites available in the GGG2020 version of the data during 2018–2021, adjusting all retrievals to common vertical profiles and averaging kernel sensitivities as described in Appendix A. Details of the evaluation with TCCON data are given in Appendix B, and results are given in Table 1. All of the TCCON sites are over land and most are at northern midlatitudes. We calibrate GOSAT to have a global mean bias of 0 ppb relative to GGG2020 TCCON data, subtracting 9.2 ppb from all retrievals. This follows Parker et al. (2020) but updates the TCCON data version that is calibrated against from GGG2014 to GGG2020. TROPOMI has a global mean bias of 6.0 ppb relative to TCCON. The standard deviation of the satellite − TCCON difference for individual retrievals gives a measure of retrieval precision and is 14.9 ppb for GOSAT and 14.5 ppb for TROPOMI. Most critical for inversions is the spatially variable bias, which reflects artifact data features that inversions could interpret as emissions. Variable bias is commonly diagnosed with TCCON data as the standard deviation of the temporally averaged satellite − TCCON differences for individual stations. Table 1 gives variable biases relative to TCCON of 5.2 ppb for GOSAT and 4.7 ppb for TROPOMI, which are lower than the 10 ppb threshold defined by Buchwitz et al. (2015) for successful regional inversions. However, the spatial coverage of TCCON stations for estimating this variable bias is very limited, as the stations are mainly located in regions of moderate SWIR surface albedo where retrieval biases tend to be low (Lorente et al., 2021). A full global diagnostic of variable bias based on TROPOMI − GOSAT differences shows much larger values depending on region (Qu et al., 2021; Jacob et al., 2022).
Table 1TROPOMI and GOSAT data used for the blended TROPOMI+GOSAT product.
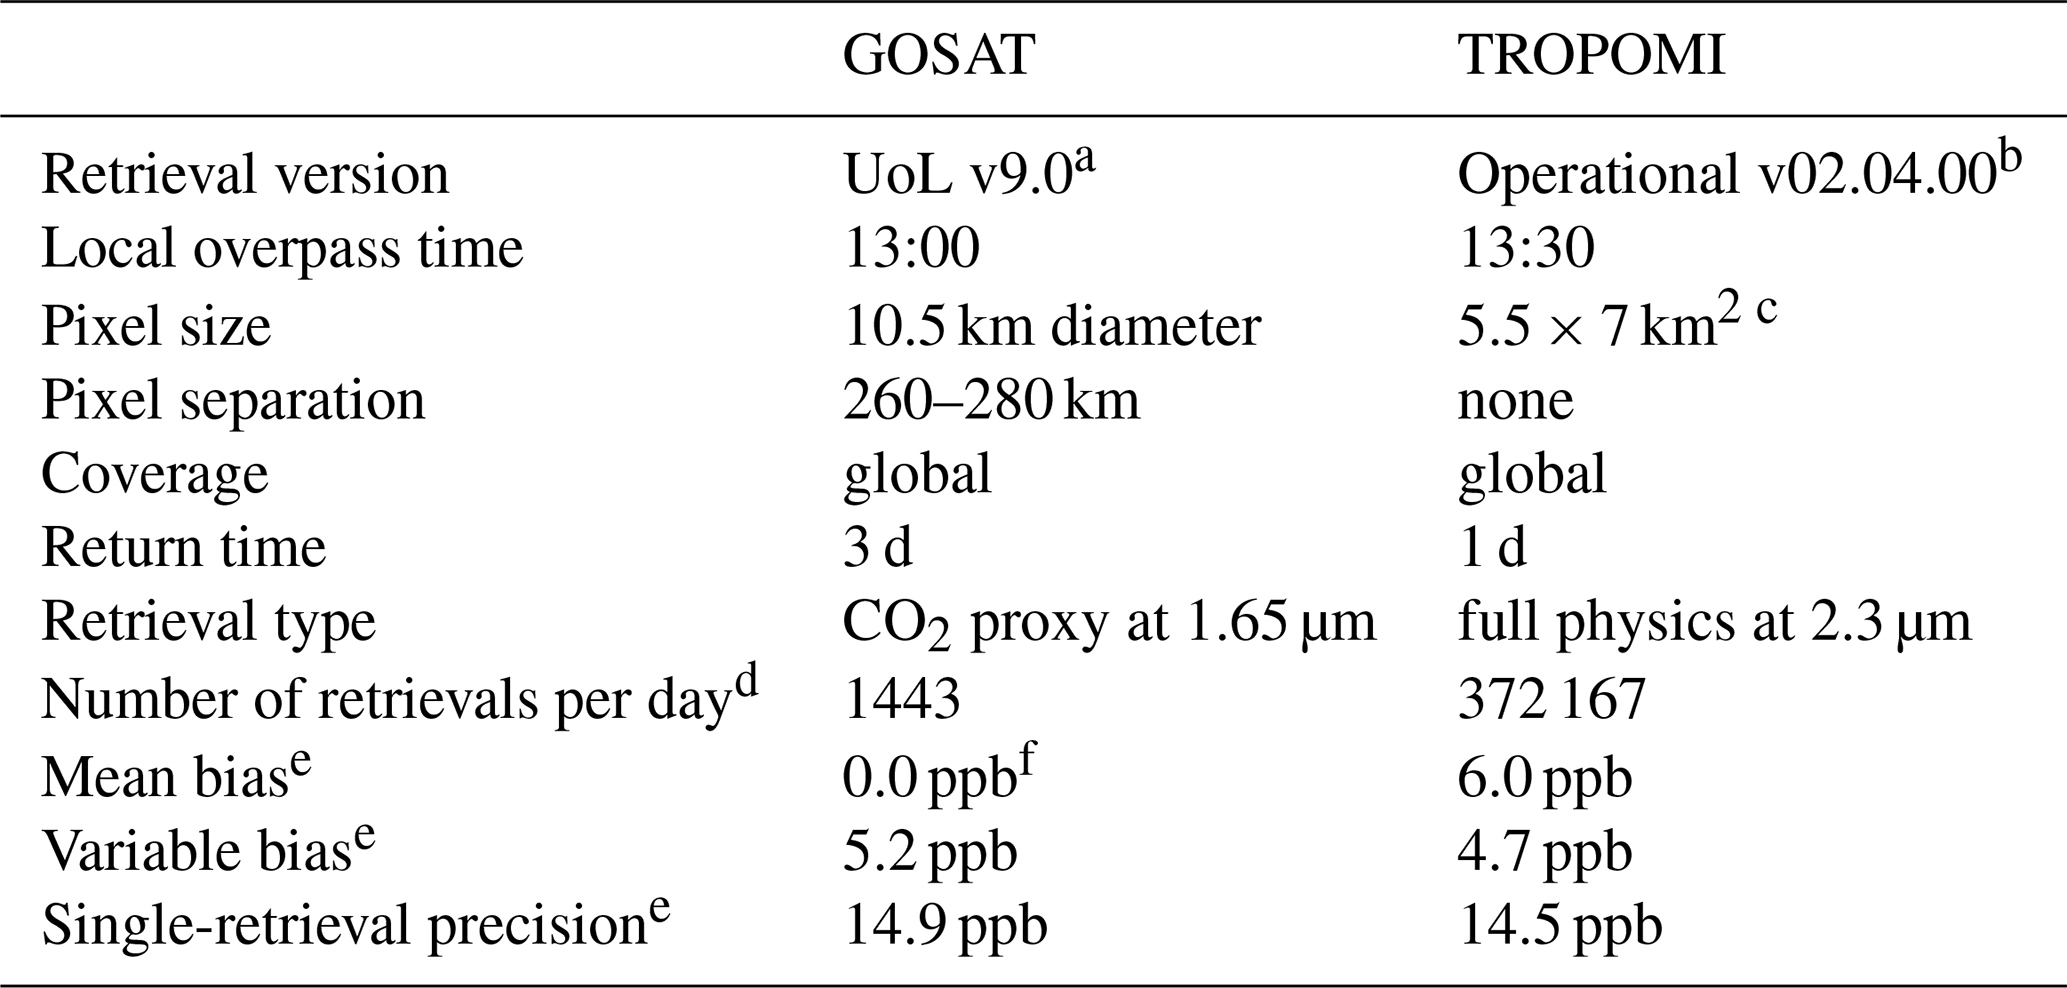
a Parker et al. (2020). Only observations with a quality flag of 0 are used. b Lorente et al. (2023). Only observations with a quality assurance value of 1 are used. Albedo bias-corrected data (“methane-mixing_ratio_bias_corrected”) is used. c At nadir; 7 × 7 km2 before 6 August 2019. d Average for 30 April 2018–31 December 2021. e Based on differences with TCCON data (version GGG2020) as derived in this work. See Appendix B for details. Variable bias is the spatial standard deviation of the temporally averaged differences for individual TCCON stations. Retrieval precision is the standard deviation of the differences for individual retrievals. f In this work, we calibrate the UoL v9.0 product to zero global mean bias relative to TCCON (version GGG2020), subtracting 9.2 ppb from all retrievals.
We compute TROPOMI − GOSAT differences Δ(TROPOMI − GOSAT) for all co-located individual retrievals from 30 April 2018 to 31 December 2021, adjusting all retrievals to common prior vertical profiles and averaging kernel sensitivities as described in Appendix A. Co-location is defined by pixel centers ≤5 km apart and retrieval times ≤1 h apart, resulting in 170 576 pairs for the 4 years including 156 939 pairs over land and 13 637 over water. Data are much sparser over the oceans, and they are limited to lower latitudes because of the requirement for specular reflectance in the glint retrieval. The standard deviation of the difference for individual data pairs is 17.4 ppb.
Figure 1 shows the average difference Δ(TROPOMI − GOSAT) for 2018–2021, plotted on a 2∘ × 2.5∘ grid for visualization purposes. The global mean bias of TROPOMI relative to GOSAT taken as reference is 3.6 ppb over land and 12.0 ppb over water. Despite the low global mean bias over land, there are large areas with differences of over 20 ppb, including over bright surfaces (North Africa), persistently cloudy areas (Amazon, Congo, and Southeast Asia), and snow-covered surfaces (high northern latitudes).
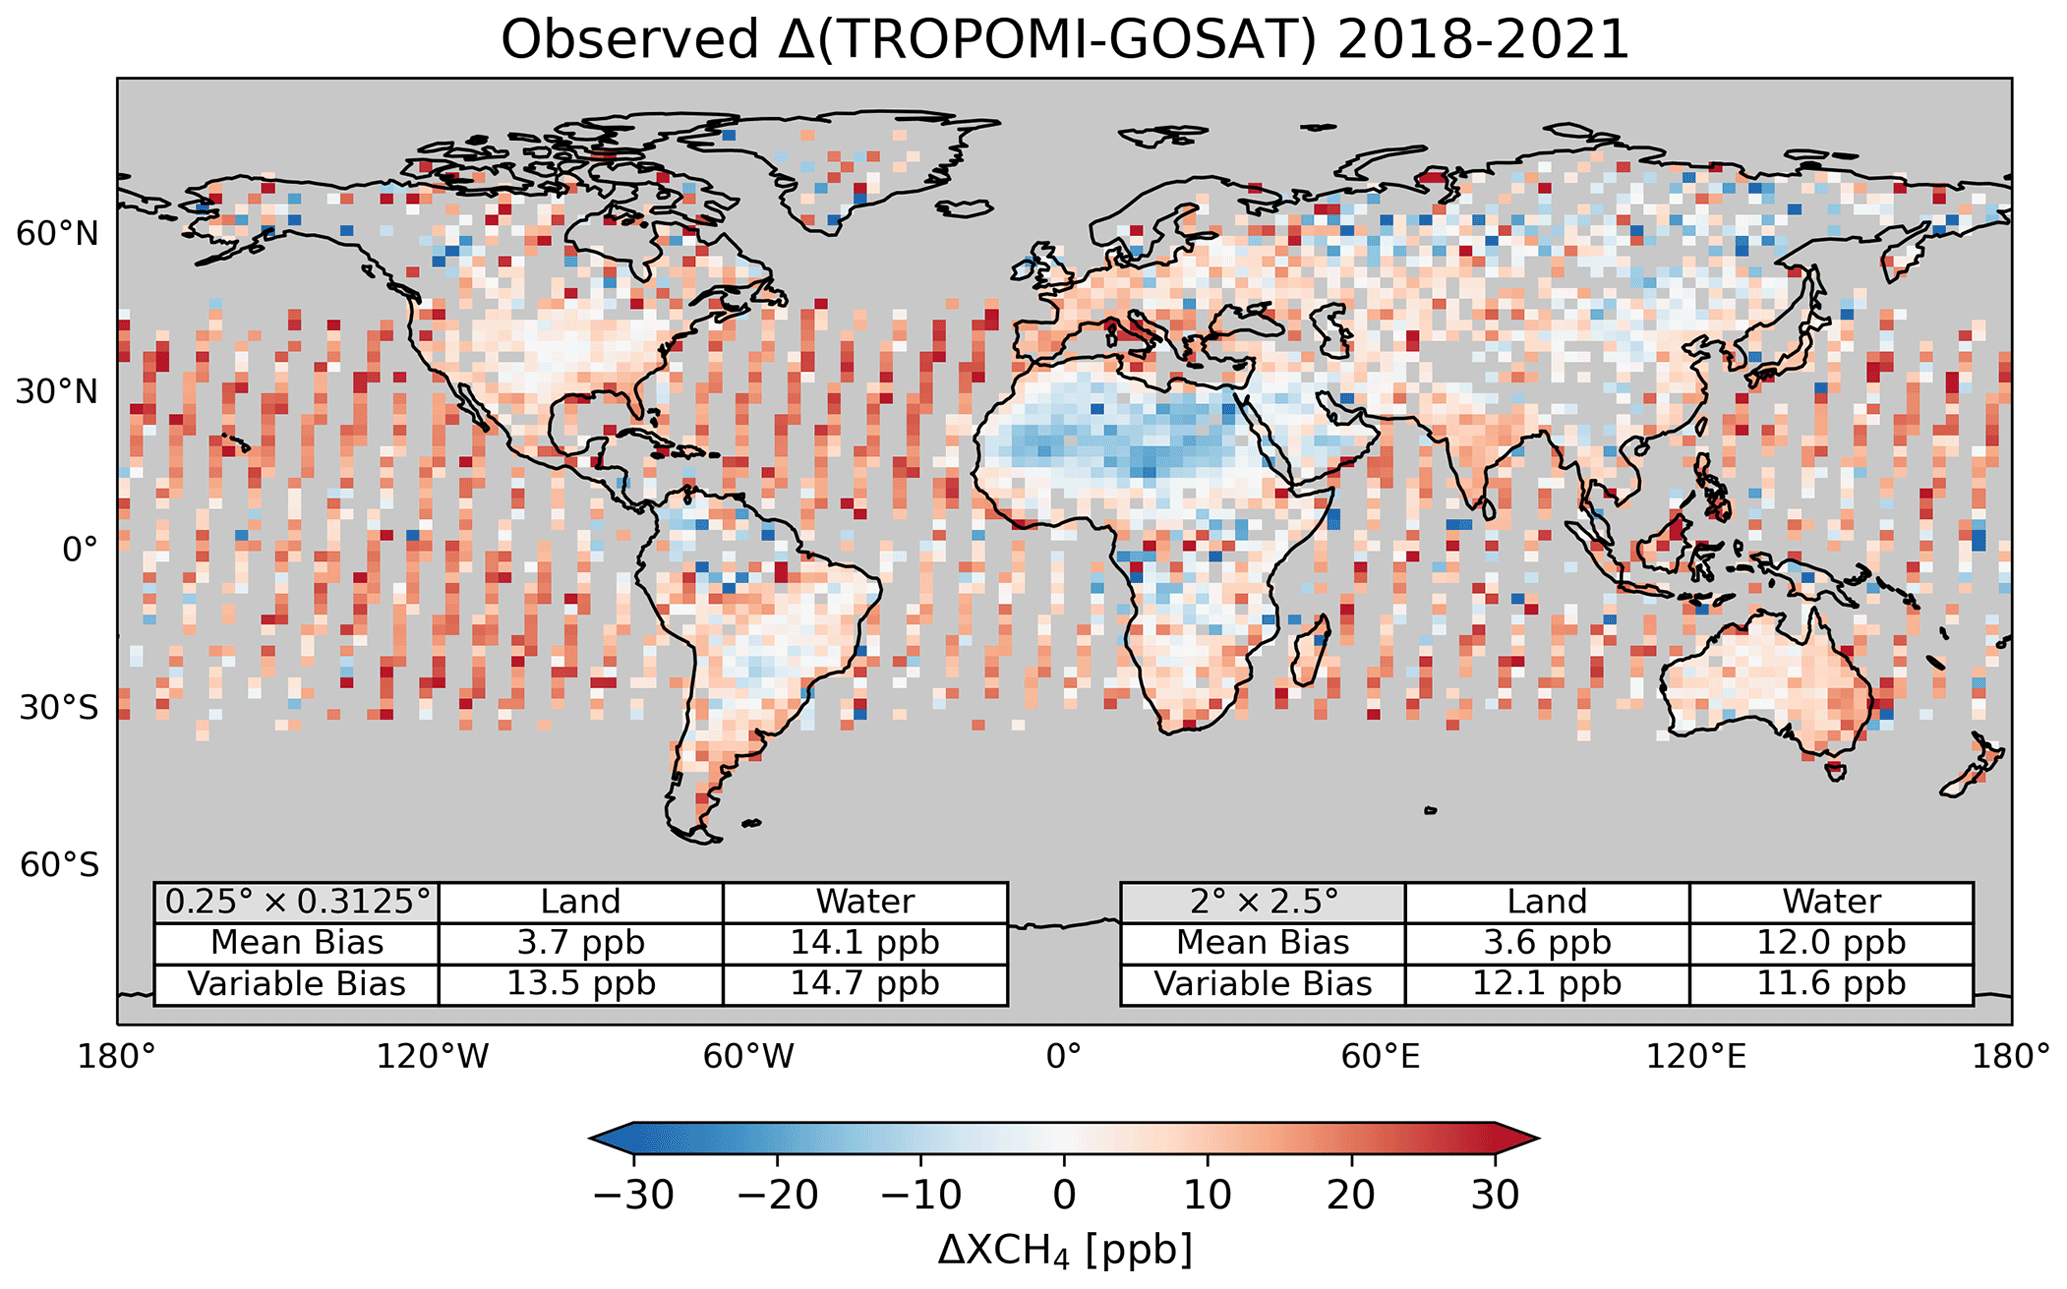
Figure 1Average difference Δ(TROPOMI − GOSAT) between co-located GOSAT and TROPOMI observations for 2018–2021, plotted on a 2∘ × 2.5∘ grid for visibility. Co-location criteria are observation times within 1 h and pixel centers within 5 km. The GOSAT and TROPOMI observations have been adjusted to common prior estimates and averaging kernel sensitivities to enable meaningful computation of differences (Appendix A). Mean bias and variable bias of TROPOMI relative to GOSAT are shown inset separately over land and water (data over water are from the glint product). Mean bias and variable bias are calculated as the respective spatial average and standard deviation of the temporally averaged Δ(TROPOMI − GOSAT) data on the specified grid (0.25∘ × 0.3125∘ or 2∘ × 2.5∘).
We quantify a spatially variable bias for TROPOMI relative to GOSAT using the same definition as used for TCCON (spatial standard deviation of the temporally averaged differences). We do this for spatial resolutions of 0.25∘ × 0.3125∘ and 2∘ × 2.5∘, typical of regional and global inversions, respectively. We separate land and water because users conducting inversions may choose not to use the glint data over water. At a 0.25∘ × 0.3125∘ resolution, we find variable biases of 13.5 ppb over land and 14.7 ppb over water, whereas we find variable biases of 12.1 ppb over land and 11.6 ppb over water at a 2∘ × 2.5∘ resolution. These variable biases imply that inversions using GOSAT or TROPOMI would produce significantly different results. Variable biases do not decrease much in going from 0.25∘ × 0.3125∘ to 2∘ × 2.5∘, suggesting that most of the biases are large-scale regional features.
We use the co-located GOSAT and TROPOMI data for 2018–2021 to develop a predictive ML model for Δ(TROPOMI − GOSAT) that can be applied to correct the TROPOMI data with reference to the GOSAT data. The model uses the 30 predictor variables listed in Table 2, which are all TROPOMI retrieval parameters included with the individual XCH4 observations, so that the correction can then be applied to the full TROPOMI dataset as a function of those parameters. We split the 170 576 co-located data pairs into two sets. The pairs for 2018–2020 are used to train the predictive model (training dataset). The training minimizes a loss function of the mean-squared error that describes the difference between predicted and true Δ(TROPOMI − GOSAT) values. The pairs for 2021 are used for independent evaluation of the predictive model (test dataset).
Table 2TROPOMI retrieval parameters used to predict Δ(TROPOMI − GOSAT).a
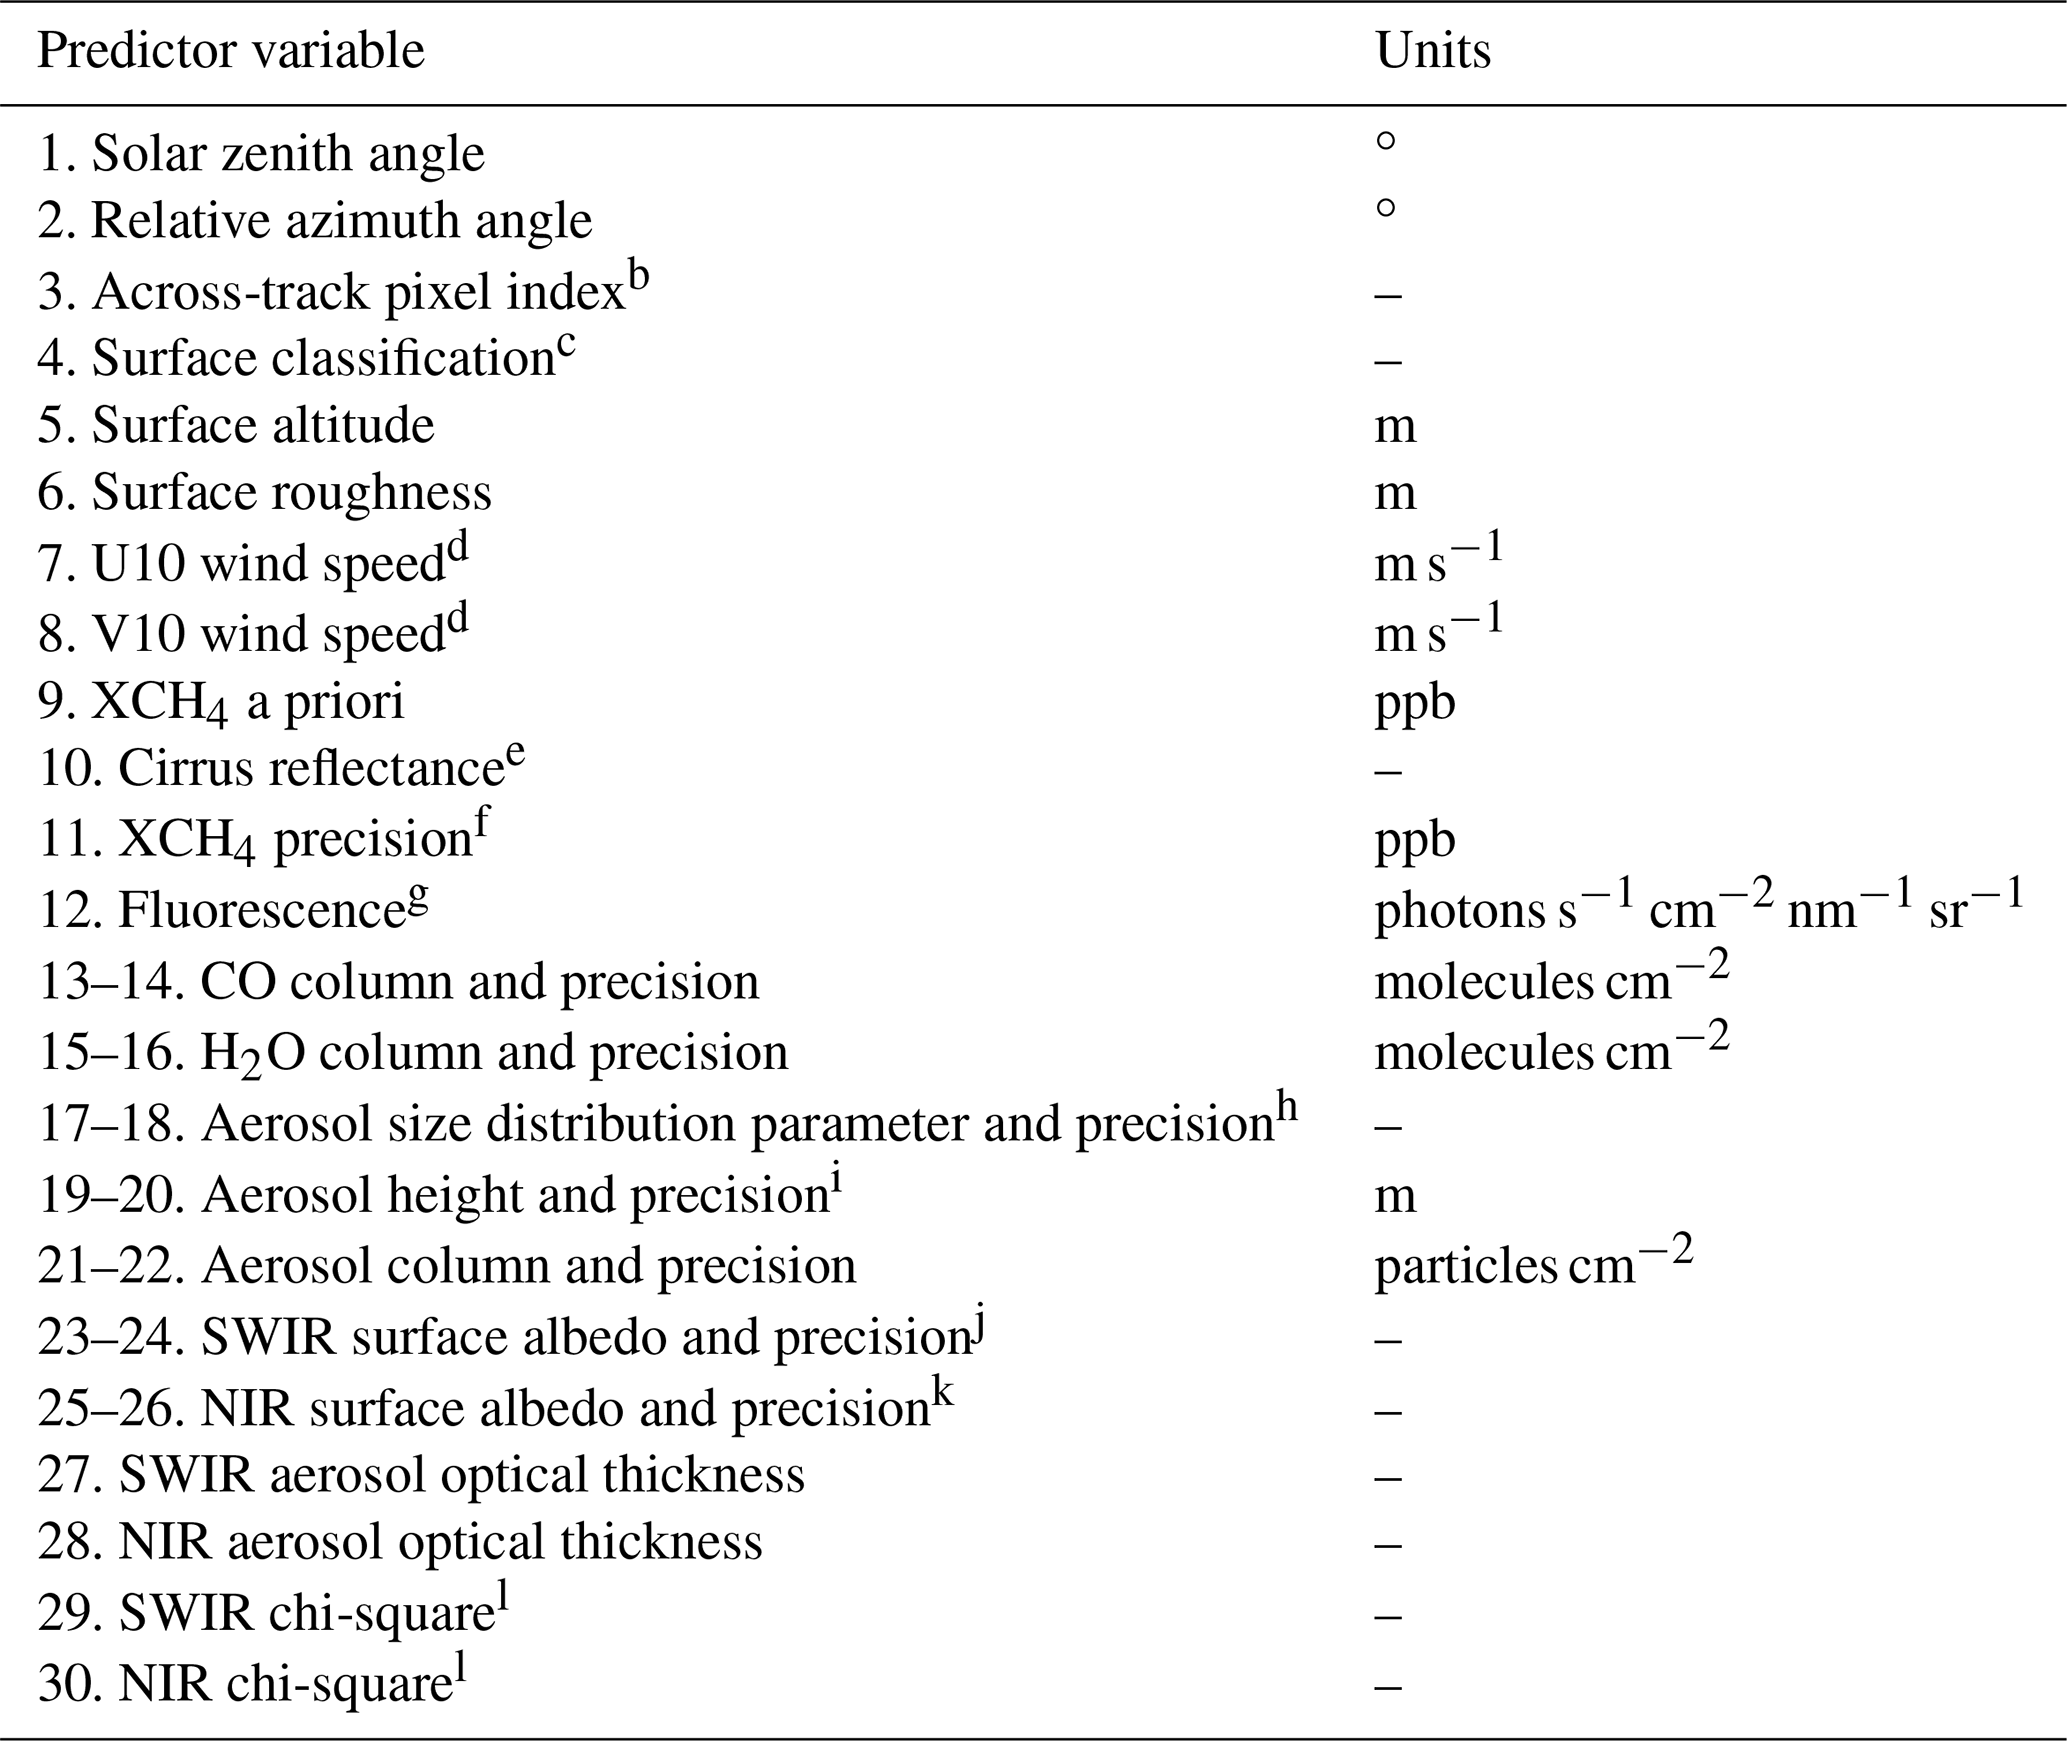
a All 30 parameters in this table are provided together with XCH4 as part of the individual operational v02.04.00 TROPOMI methane retrievals. They are used in the LightGBM machine learning (ML) algorithm to predict Δ(TROPOMI − GOSAT) for individual TROPOMI retrievals. b The retrieval also provides satellite viewing angle, but this is redundant with the across-track pixel index. c Surface classification for land is from the 1 km resolution Global Land Cover Characteristics Data Base Version 2.0 (USGS, 2018) and for water from the 250 m resolution data from Carroll et al. (2009) as explained by Apituley et al. (2022). We use the information from bit 0 and 1, giving this parameter four possible values: 0 – land, 1 – water, 2 – mostly land (with some water), and 3 – mostly water (with some land). d Zonal and meridional wind speeds at 10 m altitude. e From the Visible Infrared Imaging Radiometer Suite (VIIRS). f Precision as given in the TROPOMI retrieval product only includes the effect of noise in the measured radiance and is much smaller than the retrieval precision given in Table 1 from validation with TCCON data (Lorente et al., 2021). g Fluorescence emission at 755 nm. h Negative power law exponent (α) for the aerosol size distribution represented as , where n is the number size distribution function and r is particle radius (Hasekamp et al., 2022). Larger values of α correspond to a finer aerosol. i Central height of the Gaussian aerosol altitude distribution (Hasekamp et al., 2022). j Shortwave infrared (SWIR) at 2305–2385 nm. k Near-infrared (NIR) at 757–774 nm. l Quantifies goodness of fit for the retrieval in the SWIR or NIR spectral band.
We considered three candidate ML methods (Random Forest, LightGBM, and XGBoost) that rely on ensembles of decision trees (Kingsford and Salzberg, 2008). Random Forest grows an ensemble of decision trees using a bootstrapped sample of training data and subset of features for each decision tree. The averaged predictions from the forest of trees form the model prediction (Breiman, 2001). LightGBM and XGBoost are different implementations of gradient-boosted decision tree algorithms in which decision trees are grown sequentially with each iteration predicting the residual between the observation and the sum of all previous decision trees (Ke et al., 2017; Chen and Guestrin, 2016). It is not necessary to normalize the predictor variables from Table 2 for any of these methods. To choose the best predictive model, we used their implementation in Microsoft's Fast and Lightweight AutoML Library (FLAML) (Wang et al., 2021). FLAML is designed to select the ML model (both method and hyperparameters) that would perform best on the test data. To keep the test data independent, FLAML evaluates models with 10-fold cross validation on the training data (with the 10 folds determined by dividing the data sequentially). LightGBM performed the best, XGBoost was a close second, and Random Forest displayed the worst performance by a significant margin. We perform a Z-score transform on model predictions to account for systematic bias in ensemble-tree-based approaches at extreme values, as was done by Ouyang et al. (2023) and is explained by Belitz and Stackelberg (2021).
We applied the SHapley Additive exPlanations (SHAP) approach to determine the contributions of the individual variables in Table 2 to the prediction of Δ(TROPOMI − GOSAT). SHAP analysis partitions individual model predictions to the different predictor variables, giving each a SHAP value (in units of ppb) that add up to the deviation of the model prediction from the average prediction across a given dataset. We use the TreeExplainer method for our SHAP analysis (Lundberg et al., 2020). The SHAP values for the predictor variables can be used to understand individual predictions or can be aggregated across a larger set of data. They do not fully resolve correlation across predictor variables, which can complicate interpretability (Aas et al., 2021; Silva et al., 2022).
Figure 2 ranks the predictor variables of Table 2 by their average absolute SHAP values across the training dataset. The most important predictors of Δ(TROPOMI − GOSAT) are the aerosol size distribution parameter (given by the negative power law exponent), the across-track pixel index, the CO column precision, and the SWIR surface albedo. SWIR aerosol optical thickness is strongly correlated with the aerosol size distribution parameter (R2=0.72), but the SHAP analysis does not resolve this correlation. Similarly, CO column precision is driven by the underlying SWIR surface albedo (R2=0.68) which we view as the actual cause of Δ(TROPOMI − GOSAT). Although one might expect arid surfaces to generate large dust particles, we find that SWIR surface albedo is not correlated with the aerosol size distribution parameter (R2=0.04). The importance of the across-track pixel index reflects the striping patterns present in TROPOMI retrievals, which change from orbit to orbit (Borsdorff et al., 2018, 2019). Additionally, the across-track pixel index provides information about the viewing geometry of TROPOMI. Cirrus reflectance does not rank among the top 10 predictors of Δ(TROPOMI − GOSAT) in Fig. 2 but can be important for individual scenes, as will be shown later.
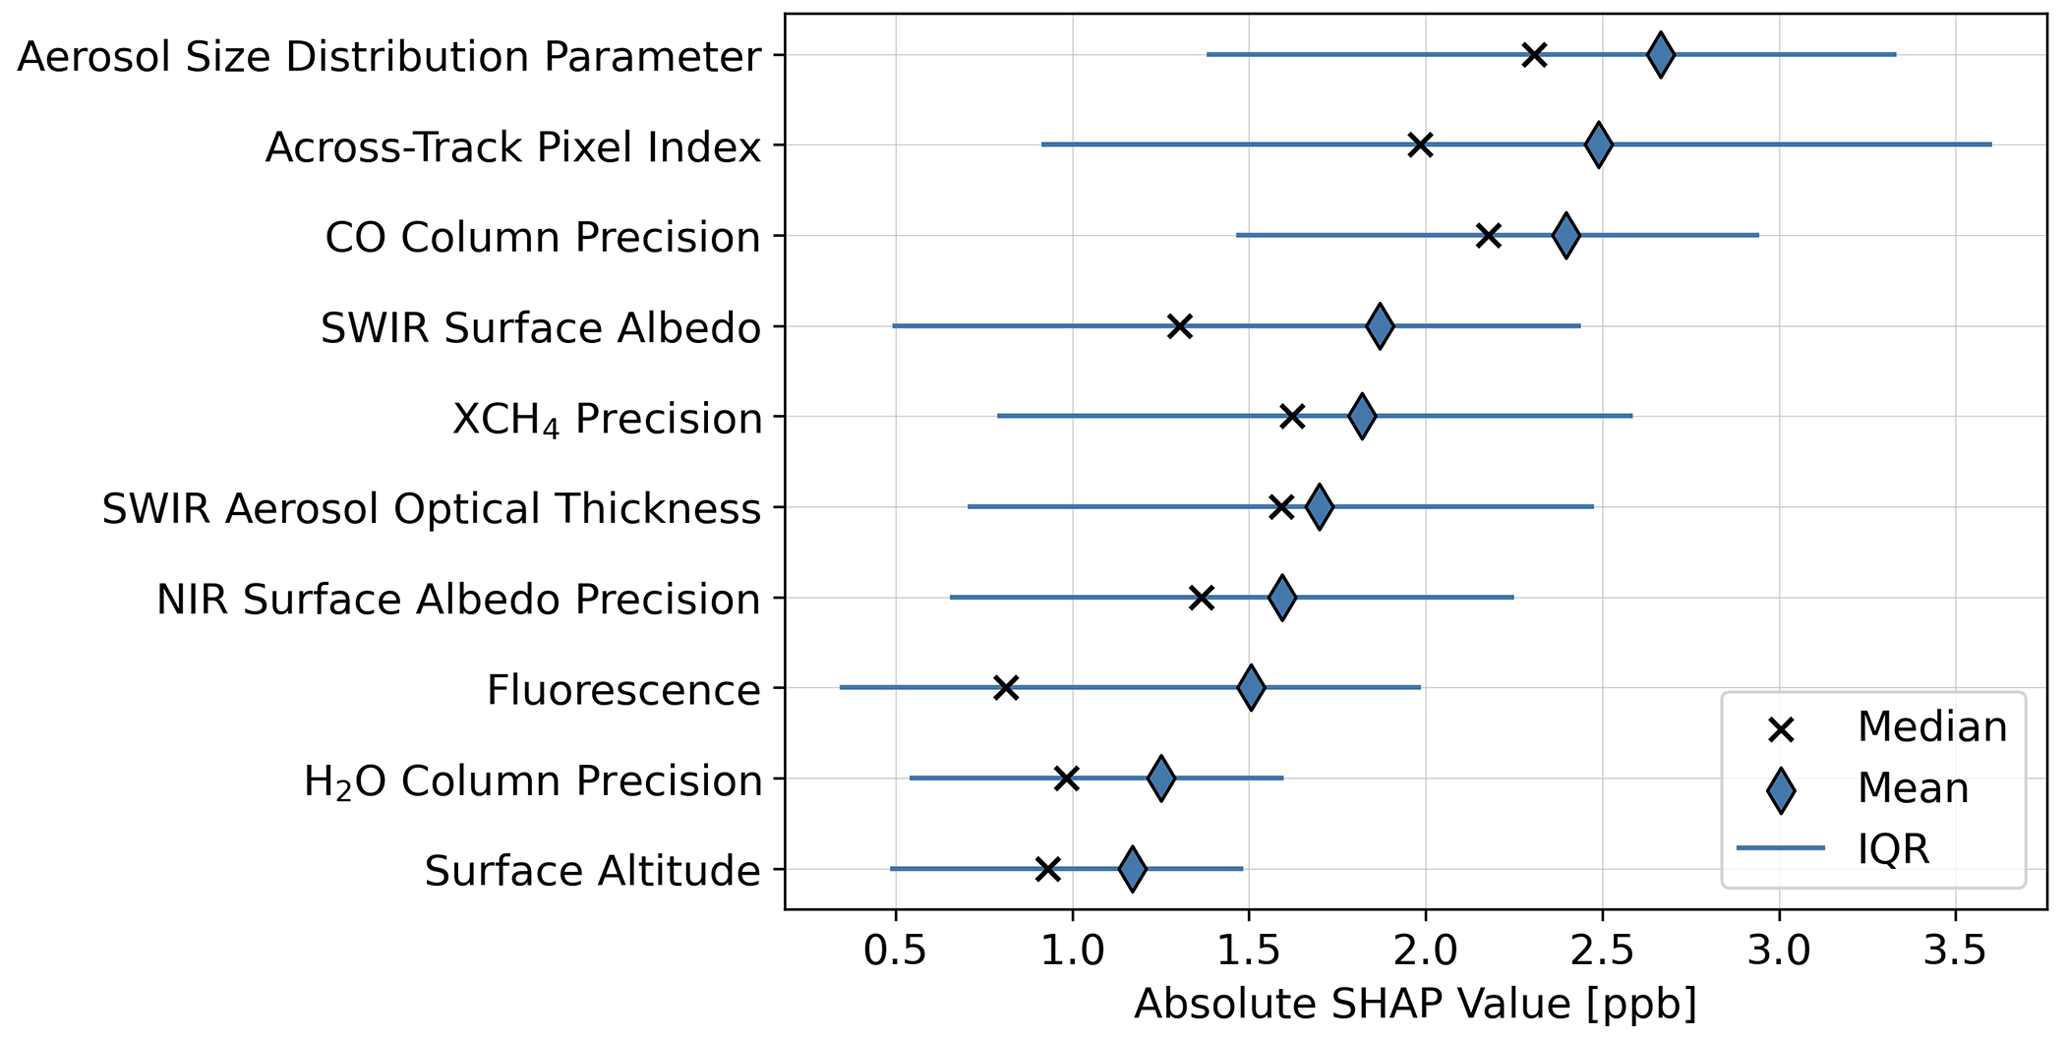
Figure 2Predictors of Δ(TROPOMI − GOSAT) ranked in order of importance. The figure shows the top 10 predictor variables for the ML model of Δ(TROPOMI − GOSAT) among all predictor variables included in the TROPOMI retrieval dataset (Table 2). The contributions of individual variables are defined by their mean absolute SHAP values (in units of ppb) and are shown here as global mean absolute values along with medians and the interquartile range (IQR) for the training data of 2018–2020.
Figure 3 further examines the SHAP values for the aerosol size distribution parameter (with smaller values indicating larger particles) and SWIR surface albedo. TROPOMI data appear to be biased low with respect to GOSAT when particles are large, which is a recognized source of error for full-physics retrievals (Butz et al., 2010; Schepers et al., 2012). Despite already undergoing a bias correction with respect to albedo (Lorente et al., 2021), TROPOMI data are biased low relative to GOSAT at high SWIR surface albedo.
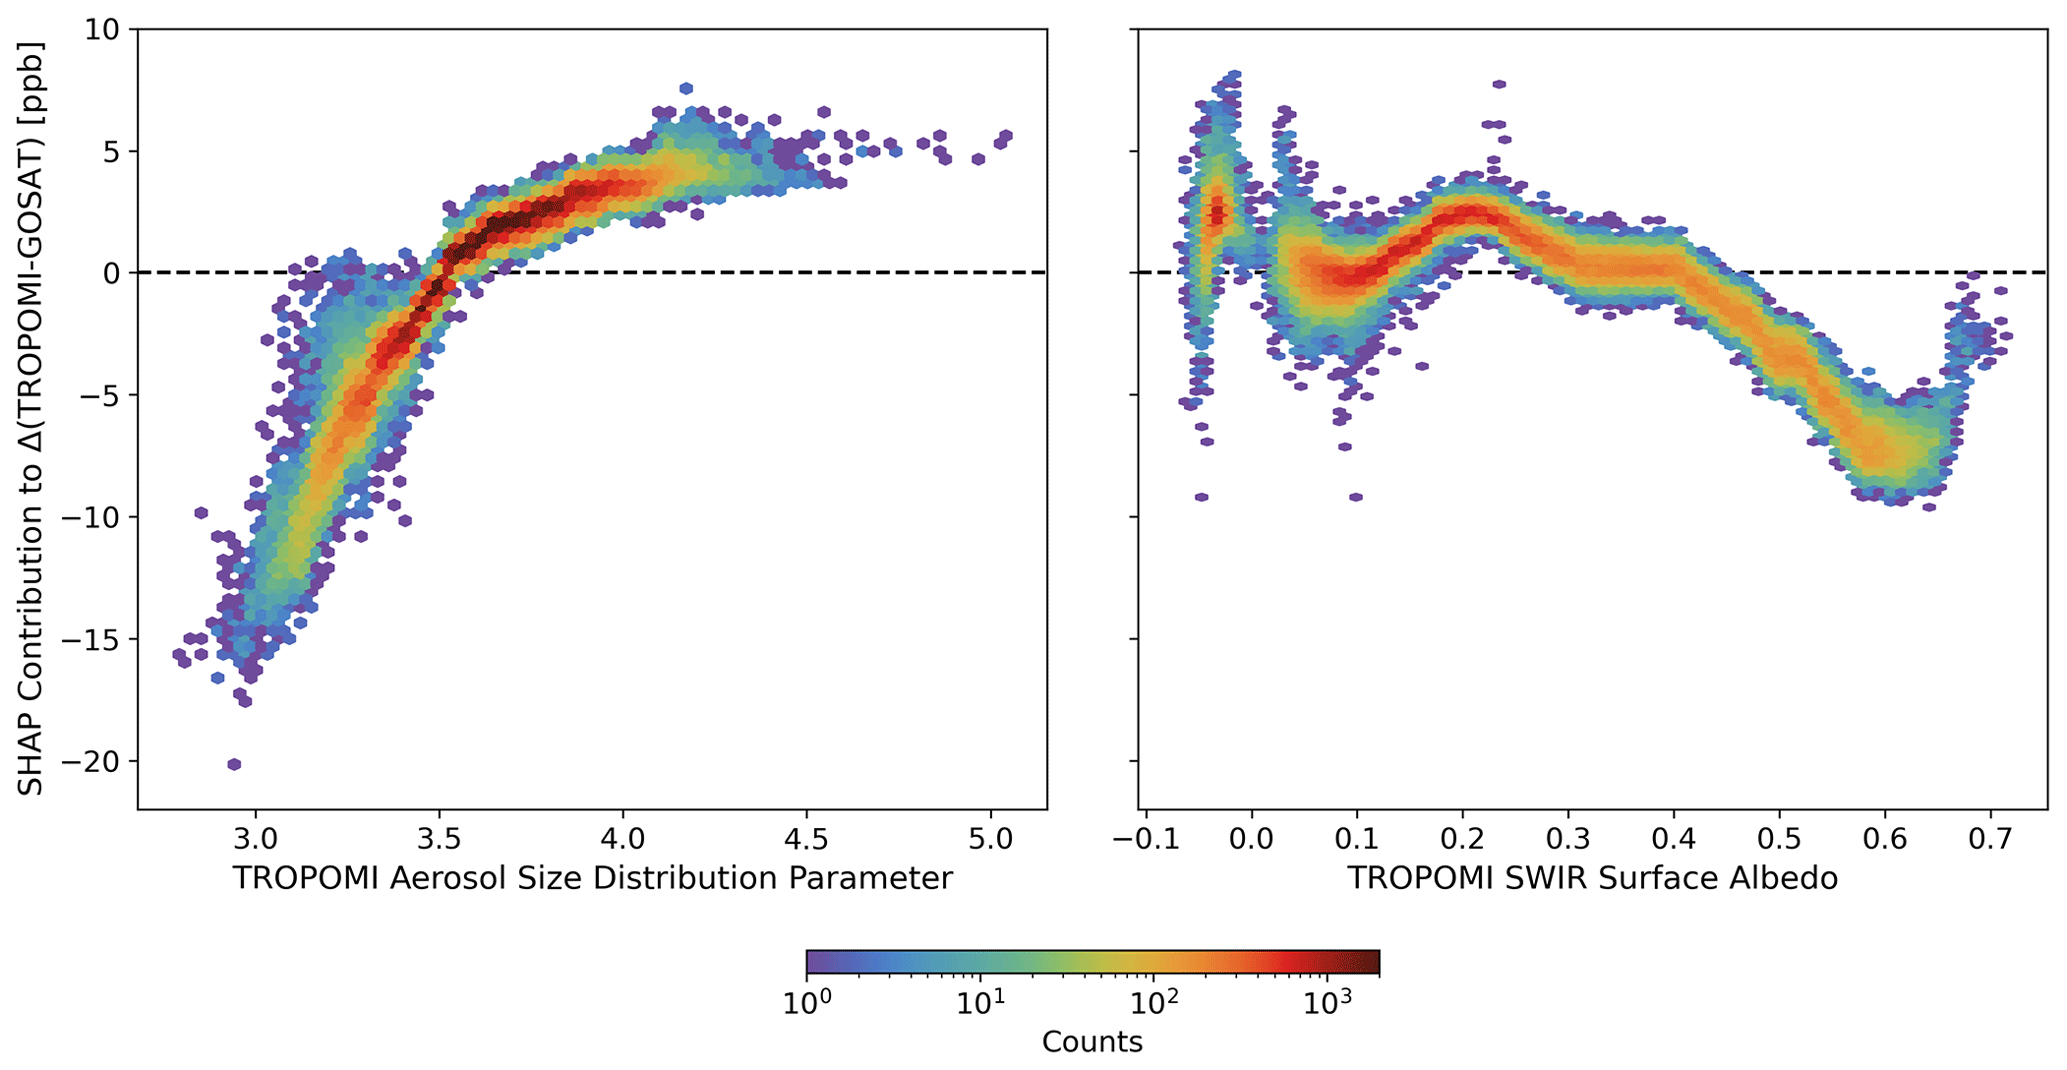
Figure 3Contributions to Δ(TROPOMI − GOSAT) from the aerosol size distribution parameter and the SWIR surface albedo in the TROPOMI retrievals. The aerosol size distribution parameter is the negative exponent of the assumed power law aerosol size distribution in the TROPOMI retrieval (Table 2) and decreases as the contribution from large particles increases. The SWIR surface albedo is for the 2305–2385 nm wavelength range. Negative values are for water scenes where the SWIR surface albedo is calculated differently in the retrieval (Lorente et al., 2022). The figure shows the SHAP-inferred contributions of the two parameters to the predicted Δ(TROPOMI − GOSAT) values for individual data pairs (counts) in the 2018–2020 training dataset of the ML model.
Figure 4 shows the ability of the ML model to predict Δ(TROPOMI − GOSAT) for the 2021 testing data that the model was not trained on. The correction is successful overall, with a coefficient of determination (R2) of 0.53 and a root-mean-square-error (RMSE) of 12.4 ppb. Random noise necessarily limits the quality of the fit for individual pairs. The RMSE is smaller than would be expected from the precision of Δ(TROPOMI − GOSAT) derived by adding the precisions of the individual TROPOMI (14.5 ppb) and GOSAT (14.9 ppb) retrievals relative to TCCON in quadrature (20.8 ppb; Table 1). This implies that the TROPOMI and GOSAT retrieval precisions derived from TCCON are not fully random but are partly predictable on the basis of the TROPOMI retrieval parameters.
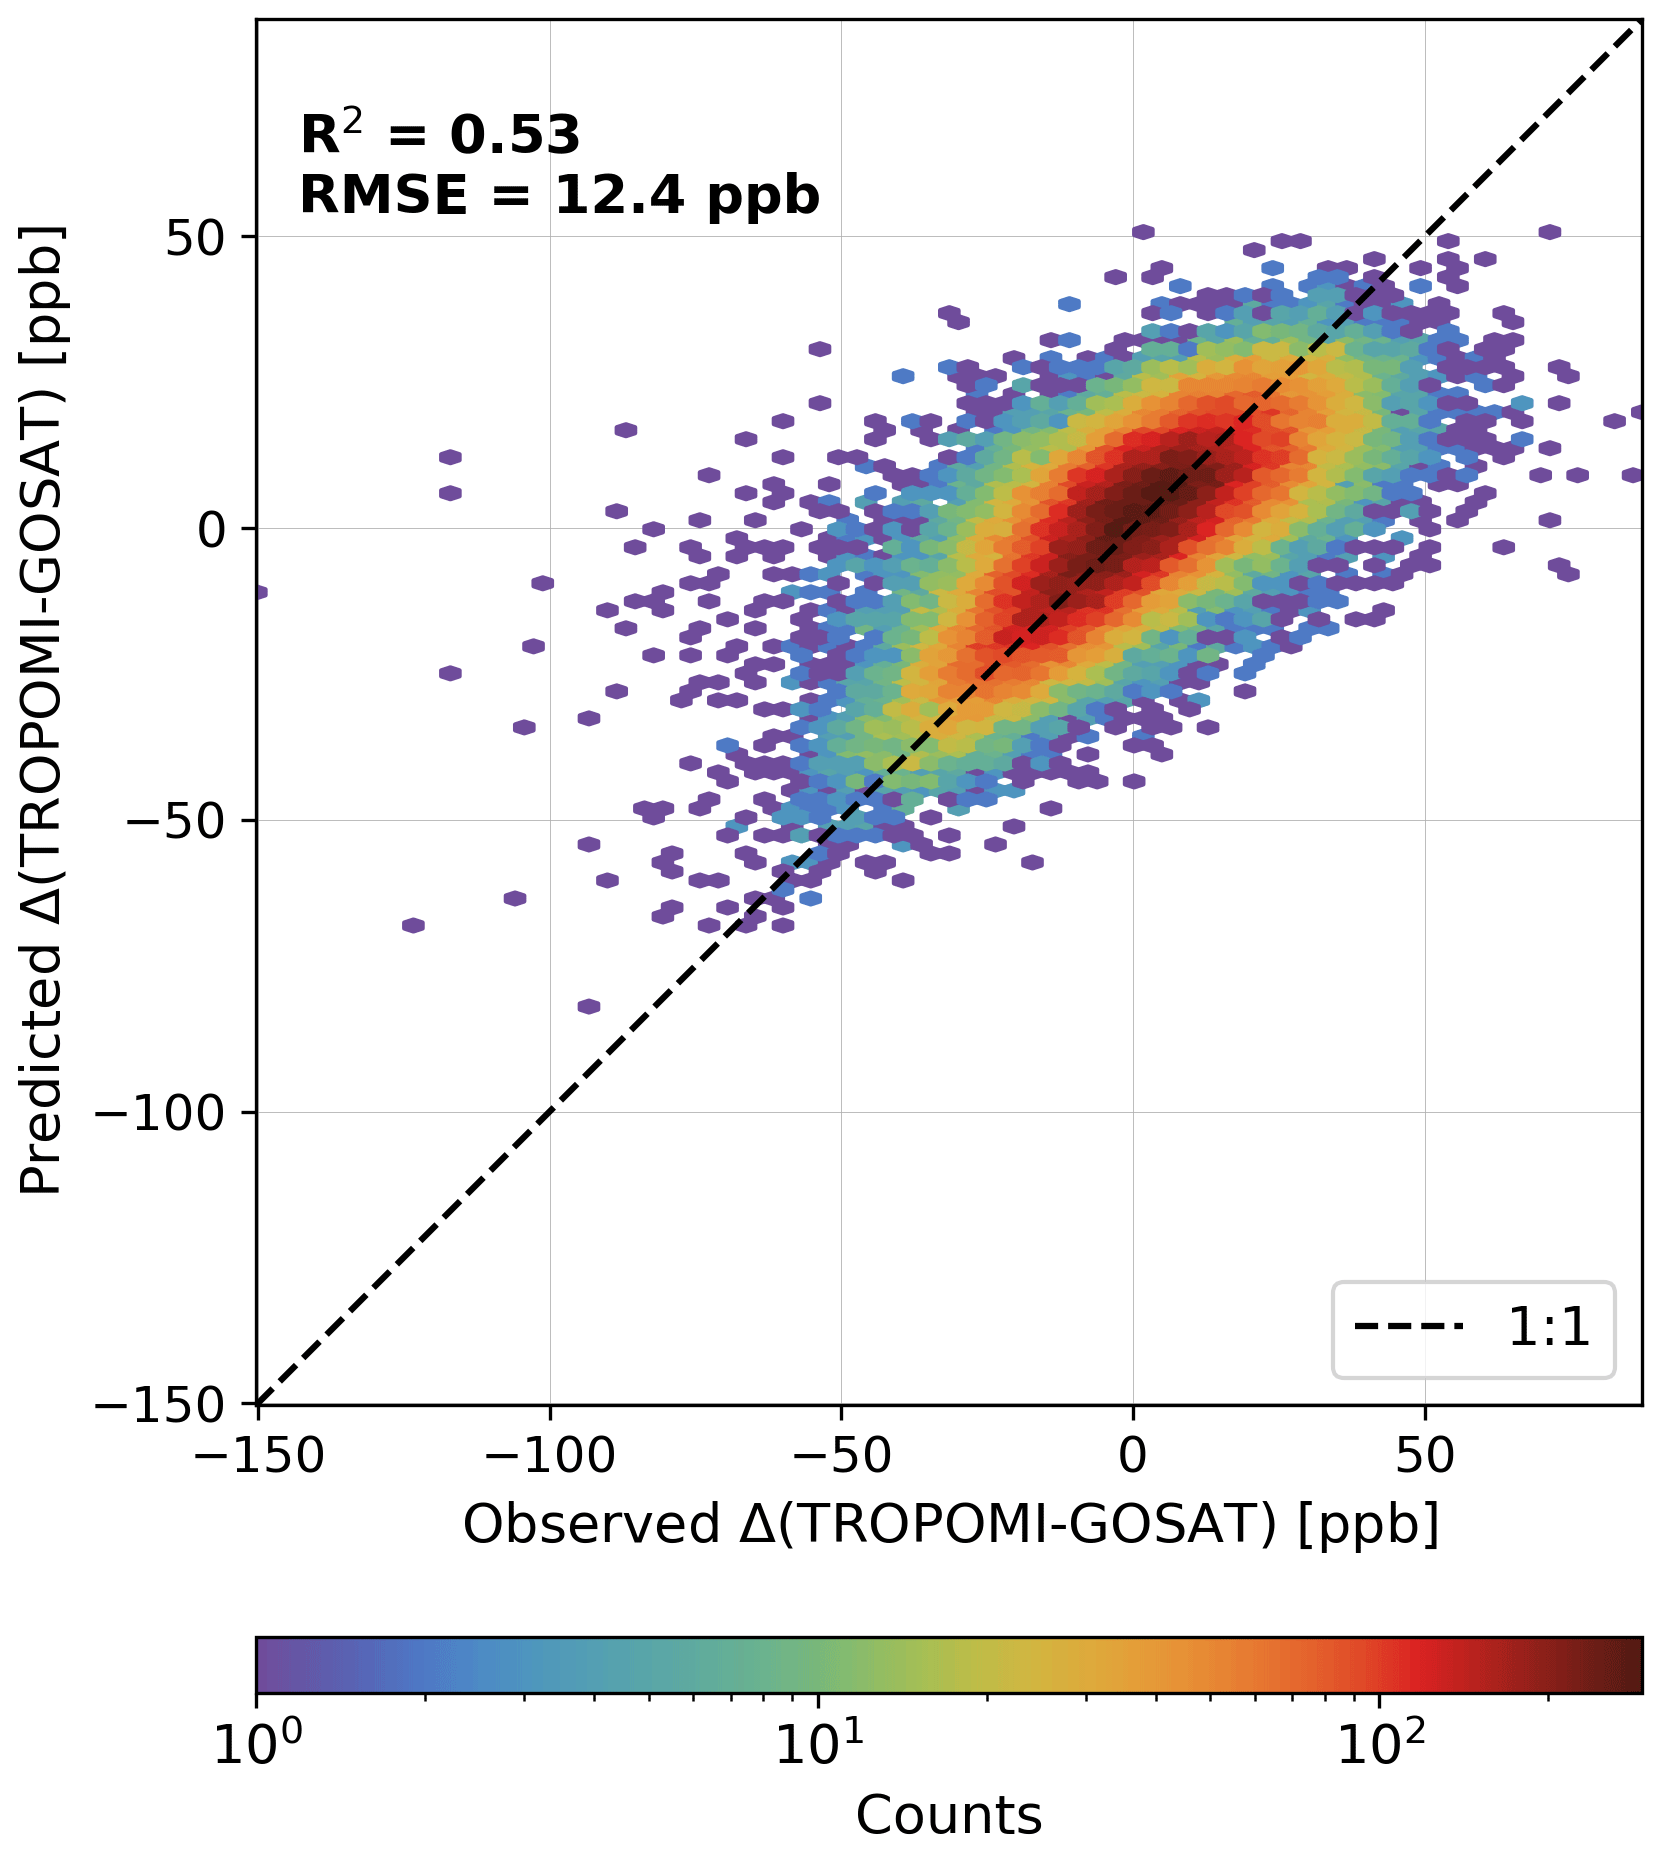
Figure 4Ability of the ML model to predict Δ(TROPOMI − GOSAT) on the test data from 2021. The coefficient of determination (R2) and root-mean-square error (RMSE) are shown inset.
Despite the bias correction applied by the Z-score transform from Belitz and Stackelberg (2021), we see (from Fig. 4) a tendency for the ML model to underestimate the high tail of the observed distribution and overestimate the low tail. This is a recognized problem in ML algorithms that aim to provide a good model of the mean (Zhang and Lu, 2012).
Figure 5 displays the observed global distribution of Δ(TROPOMI − GOSAT) for the 2021 test data and the residual distribution (observed − predicted) after correction with the ML model. As the model was not trained on these data, the data can be used for an independent global evaluation of the reduction in the mean and variable bias of TROPOMI relative to GOSAT. Much of the original regional structure in the TROPOMI bias has disappeared or is greatly reduced. The variable bias over land decreases from 14.3 to 10.4 ppb at a 0.25∘ × 0.3125∘ resolution and from 13.1 to 9.1 ppb at a 2∘ × 2.5∘ resolution. The mean bias is reduced over water, going from 13.7 to −2.7 ppb at a 0.25∘ × 0.3125∘ resolution and from 11.9 to −3.2 ppb at a 2∘ × 2.5∘ resolution.
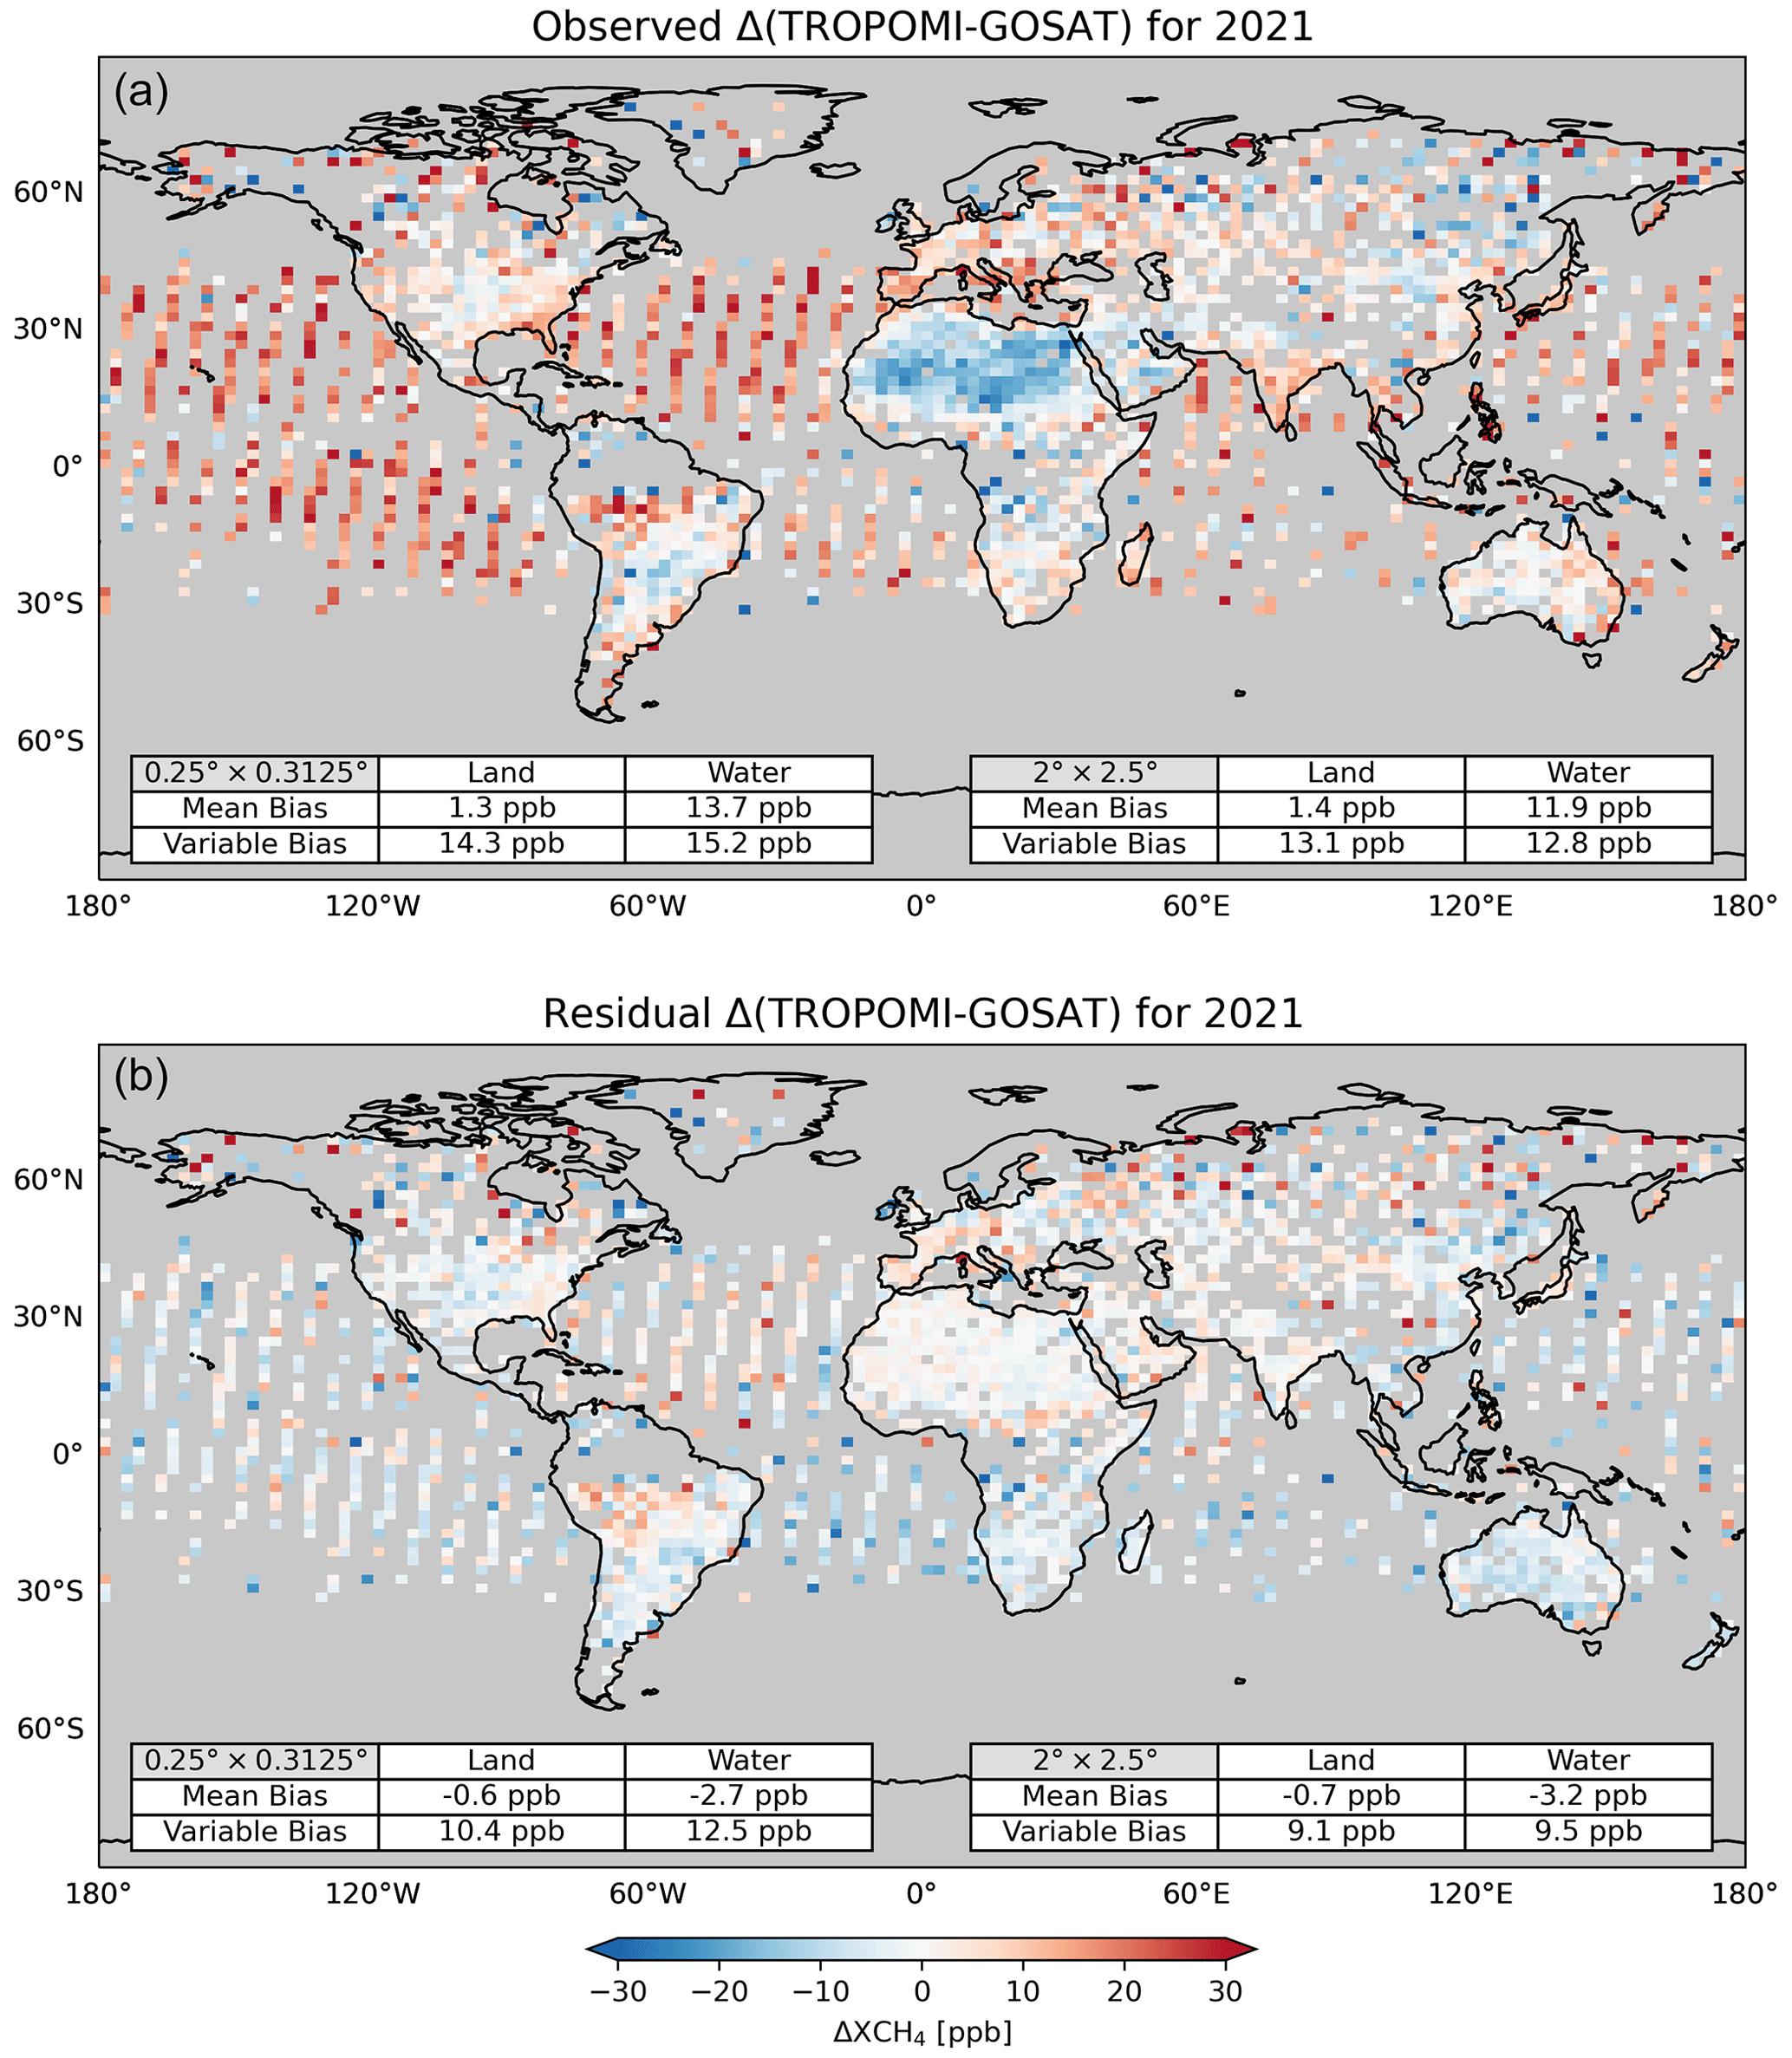
Figure 5TROPOMI − GOSAT XCH4 differences (Δ(TROPOMI − GOSAT)) for co-located data in 2021, plotted on a 2∘ × 2.5∘ grid for visibility. Values are annual means. The 2021 observations (a) are used as test data for the ML model trained to predict Δ(TROPOMI − GOSAT) from 2018–2020 data. Panel (b) shows the residual Δ(TROPOMI − GOSAT) after removing the predicted values from the observations. Panel (b) is equivalent to Δ(blended − GOSAT). Mean bias and variable bias are calculated as described in Fig. 1.
After forming the full blended TROPOMI+GOSAT product for the 2018–2021 period (described below), we perform an independent evaluation with the TCCON data for that period covering 24 sites (Fig. 6). The evaluation procedure is described in Appendix B. This allows us to carry out a comparison to the evaluations of the original TROPOMI and GOSAT retrievals with the same TCCON data. We find that the retrieval precision is improved from 14.5 ppb in the TROPOMI data to 11.9 ppb in the blended TROPOMI+GOSAT product, both surpassing GOSAT's precision of 14.9 ppb. The variable bias is slightly reduced from 4.7 ppb in the TROPOMI data to 4.4 ppb for the blended TROPOMI+GOSAT product. The mean bias decreases from 6.0 to −2.9 ppb. Individual station comparisons are shown in Table B2. All stations except for two see a reduction in the standard deviation of Δ(satellite − TCCON).
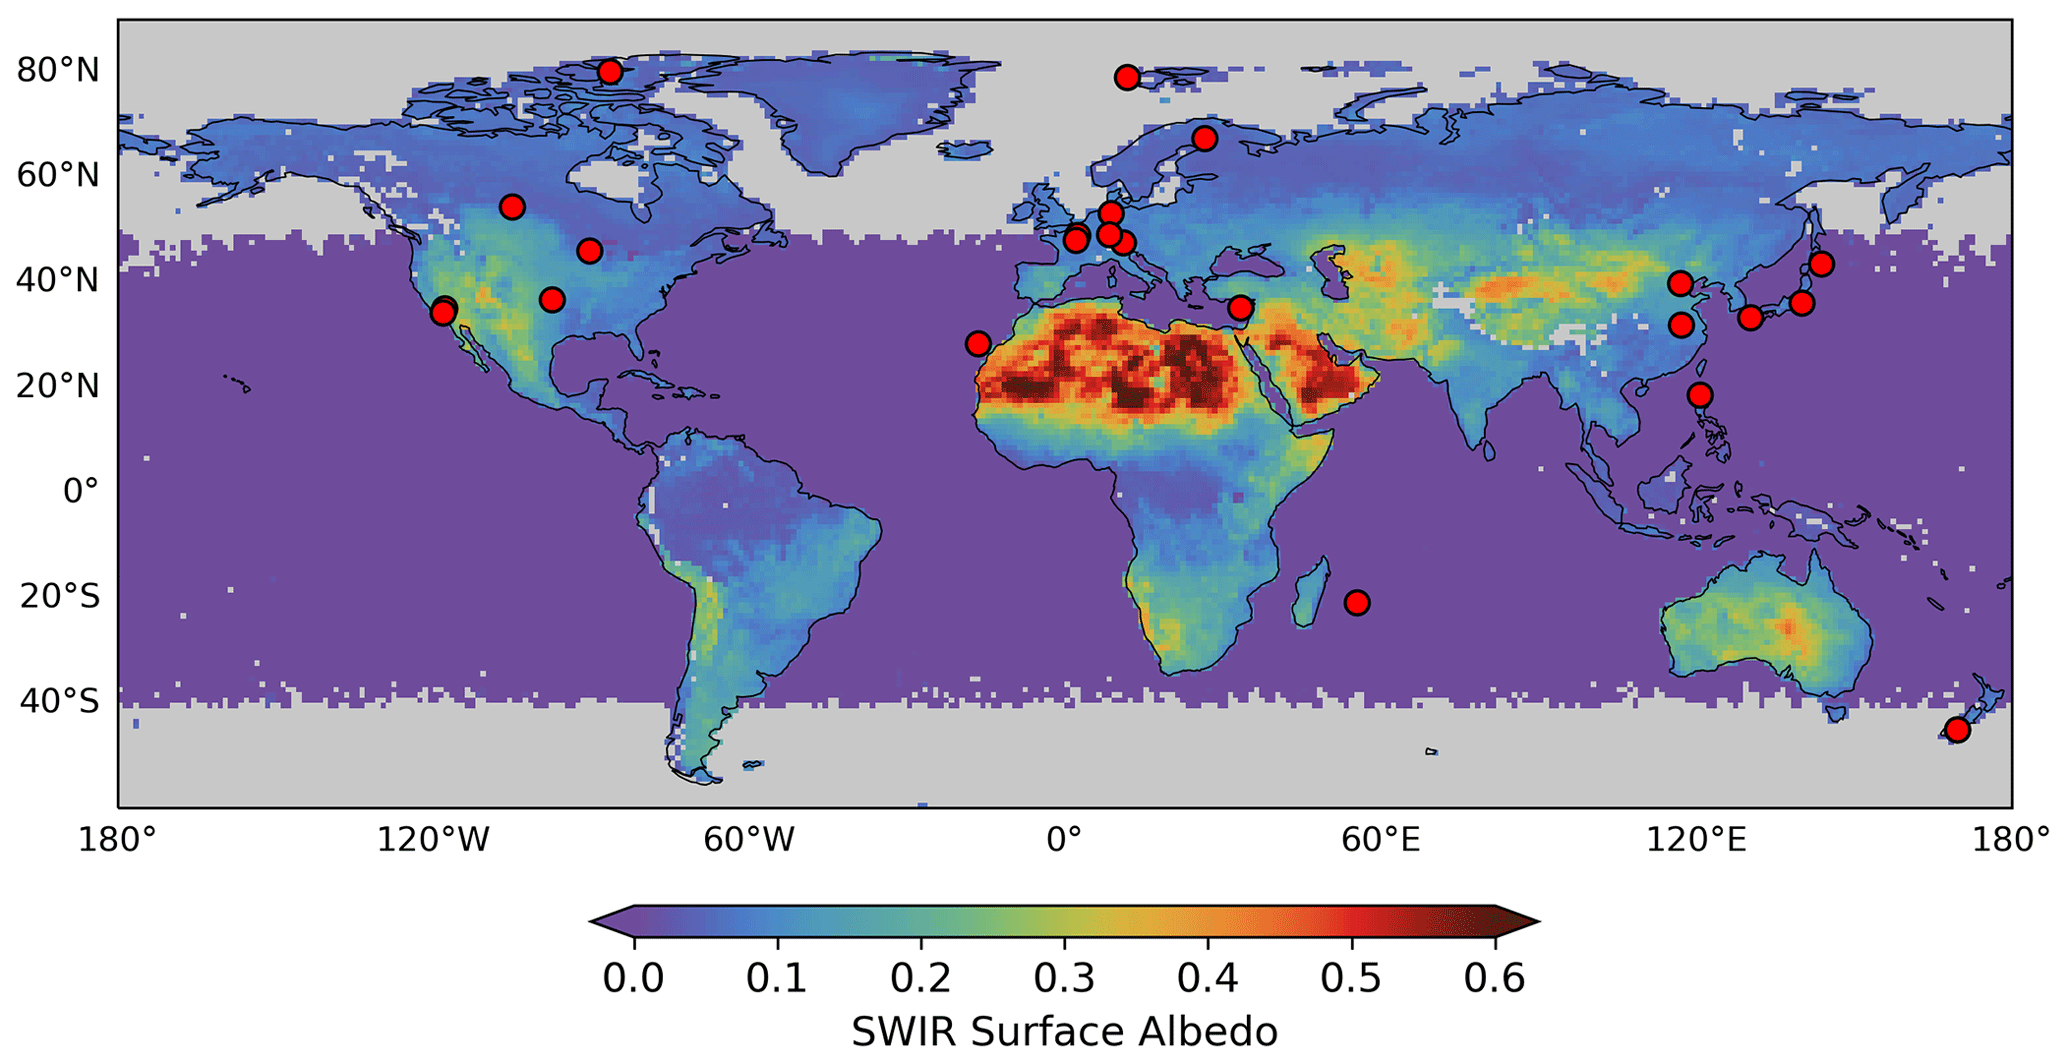
Figure 6TCCON stations with 2018–2021 data mapped on the mean TROPOMI SWIR surface albedo for 2021. The TROPOMI data are annual means and are plotted on a 1∘ × 1∘ grid with data south of 60∘ S cropped for visualization purposes. Gray areas have no TROPOMI data. Site locations are listed in Table B1.
The blended TROPOMI+GOSAT product shows only a modest improvement in error statistics at TCCON sites, but this is because these sites are all in locations with a SWIR surface albedo lower than 0.4. As shown in Fig. 3, the largest TROPOMI biases are for SWIR surface albedos higher than 0.4 (15 % of all TROPOMI data). Beyond the simple evaluation, the TCCON data allow us to test our previously derived relationships of TROPOMI retrieval biases to retrieval parameters, including the SWIR surface albedo and aerosol size parameter found to be important (Figs. 2, 3). In Fig. 7, we show the standard deviation of satellite − TCCON differences as a function of these two parameters. For both parameters, the spread of the satellite − TCCON difference is lower at all parameter values. Consistent with Fig. 3, the largest improvements are for large aerosols (small values of the aerosol size parameters) and away from moderate SWIR albedo.
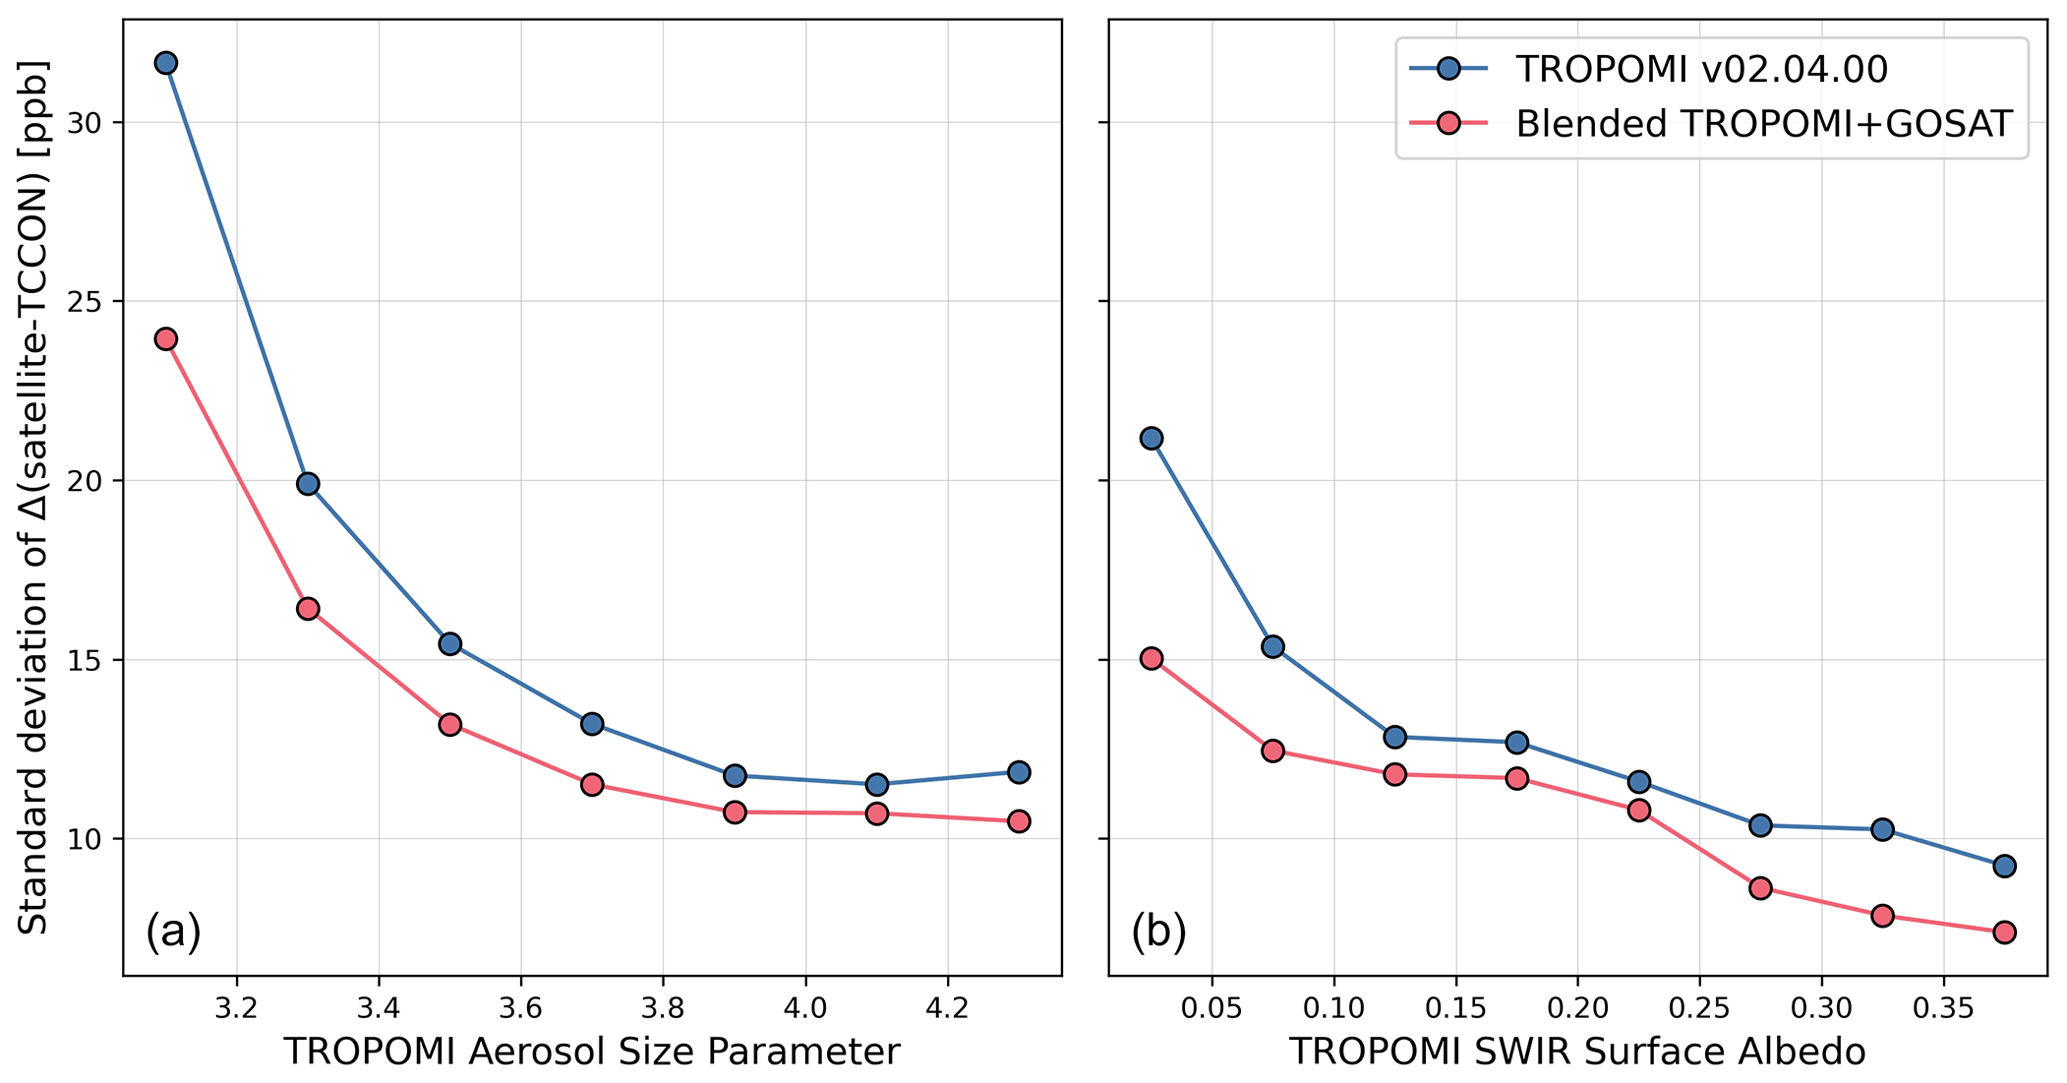
Figure 7Application of TCCON data to evaluate satellite XCH4 retrieval biases in relation to retrieval parameters. The figure shows the standard deviations of satellite − TCCON differences for different bins of the TROPOMI retrieval parameters found to be important causes of retrieval bias (Fig. 2): aerosol size parameter (a, 0.2 bins) and SWIR surface albedo (b, 0.05 bins). Results are for the 2018–2021 period at the 24 TCCON sites in Fig. 6 (excluded sites are explained in Appendix B) and compare the TROPOMI operational v02.04.00 retrieval and the blended TROPOMI+GOSAT product.
Table 3 summarizes the error statistics of the blended TROPOMI+GOSAT product referenced to the GOSAT dataset for 2021 (separately for land and water, 0.25∘ × 0.3125∘ and 2∘ × 2.5∘) and the TCCON dataset for 2018–2021. Mean biases are low. Variable bias relative to TCCON is low (4.4 ppb), but this reflects the favorable locations of the TCCON stations as discussed above. Variable bias relative to GOSAT is about 10 ppb. This is sufficiently low that inversions of the blended TROPOMI+GOSAT product to infer methane emissions should be consistent with inversions of GOSAT data (Buchwitz et al., 2015). The blended TROPOMI+GOSAT product benefits from the TROPOMI coverage to produce a data density 250 times higher than GOSAT.
Table 3Summary of error statistics for the blended TROPOMI+GOSAT product.*
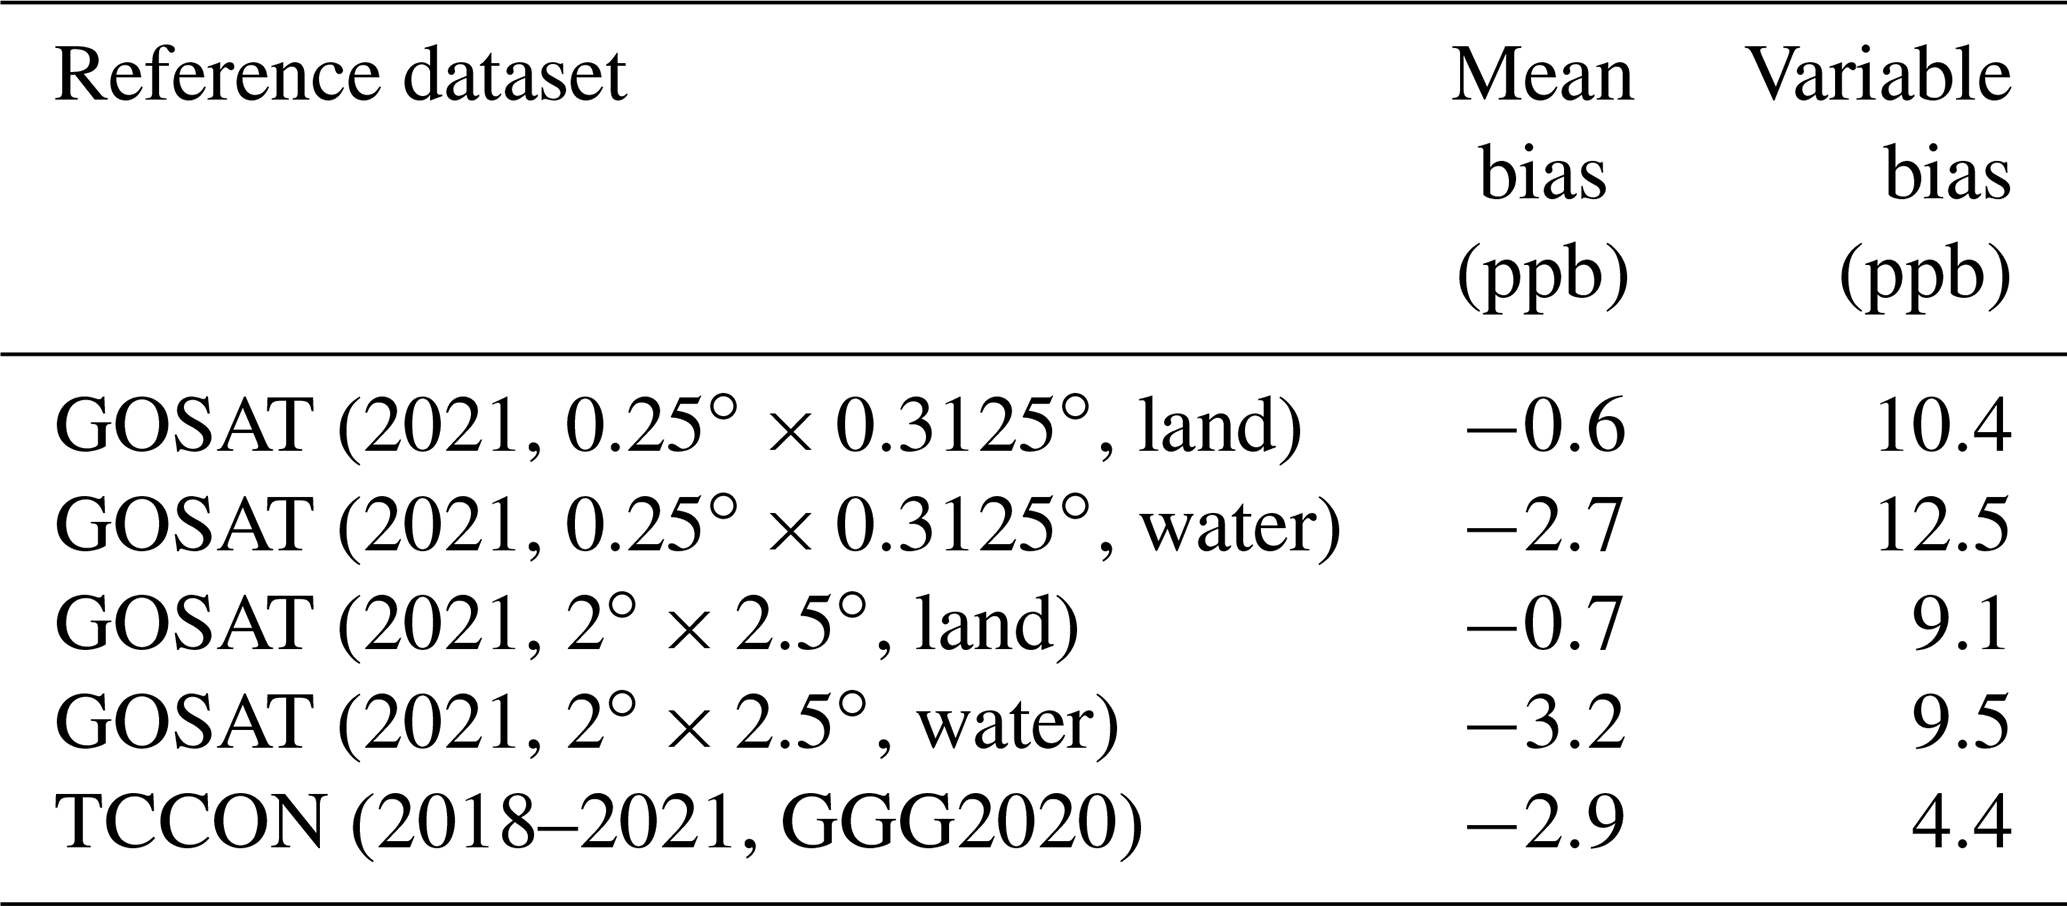
* Error statistics are for the differences between the blended TROPOMI+GOSAT product and the reference dataset.
We produced a blended TROPOMI+GOSAT product by applying the predictive model for Δ(TROPOMI − GOSAT) to the complete operational v02.04.00 TROPOMI data product. The correction is implemented as Δ(TROPOMI − GOSAT) subtracted from the TROPOMI data. The blended product contains all successful TROPOMI retrievals from April 2018 to present. Figure 8 shows the global distribution of the blended product for 2021 and the corrections to the TROPOMI retrieval. We see a systematic downward correction over the oceans ( ppb) except in persistently cloudy regions near the Equator. Over land, the correction averages ppb. It is highest over bright arid surfaces, which are known to be difficult for TROPOMI retrievals (Lorente et al., 2021; Schneising et al., 2019). We also see large corrections at high northern latitudes that are seasonally driven (see below) and over tropical wetlands (Amazon, central Africa) where TROPOMI data are particularly sparse (Qu et al., 2021). Data south of 60∘ S (where the correction averages ppb) are excluded from these statistics and visualizations because of a lack of GOSAT data for evaluation. However, they are included in the blended TROPOMI+GOSAT data available for download.
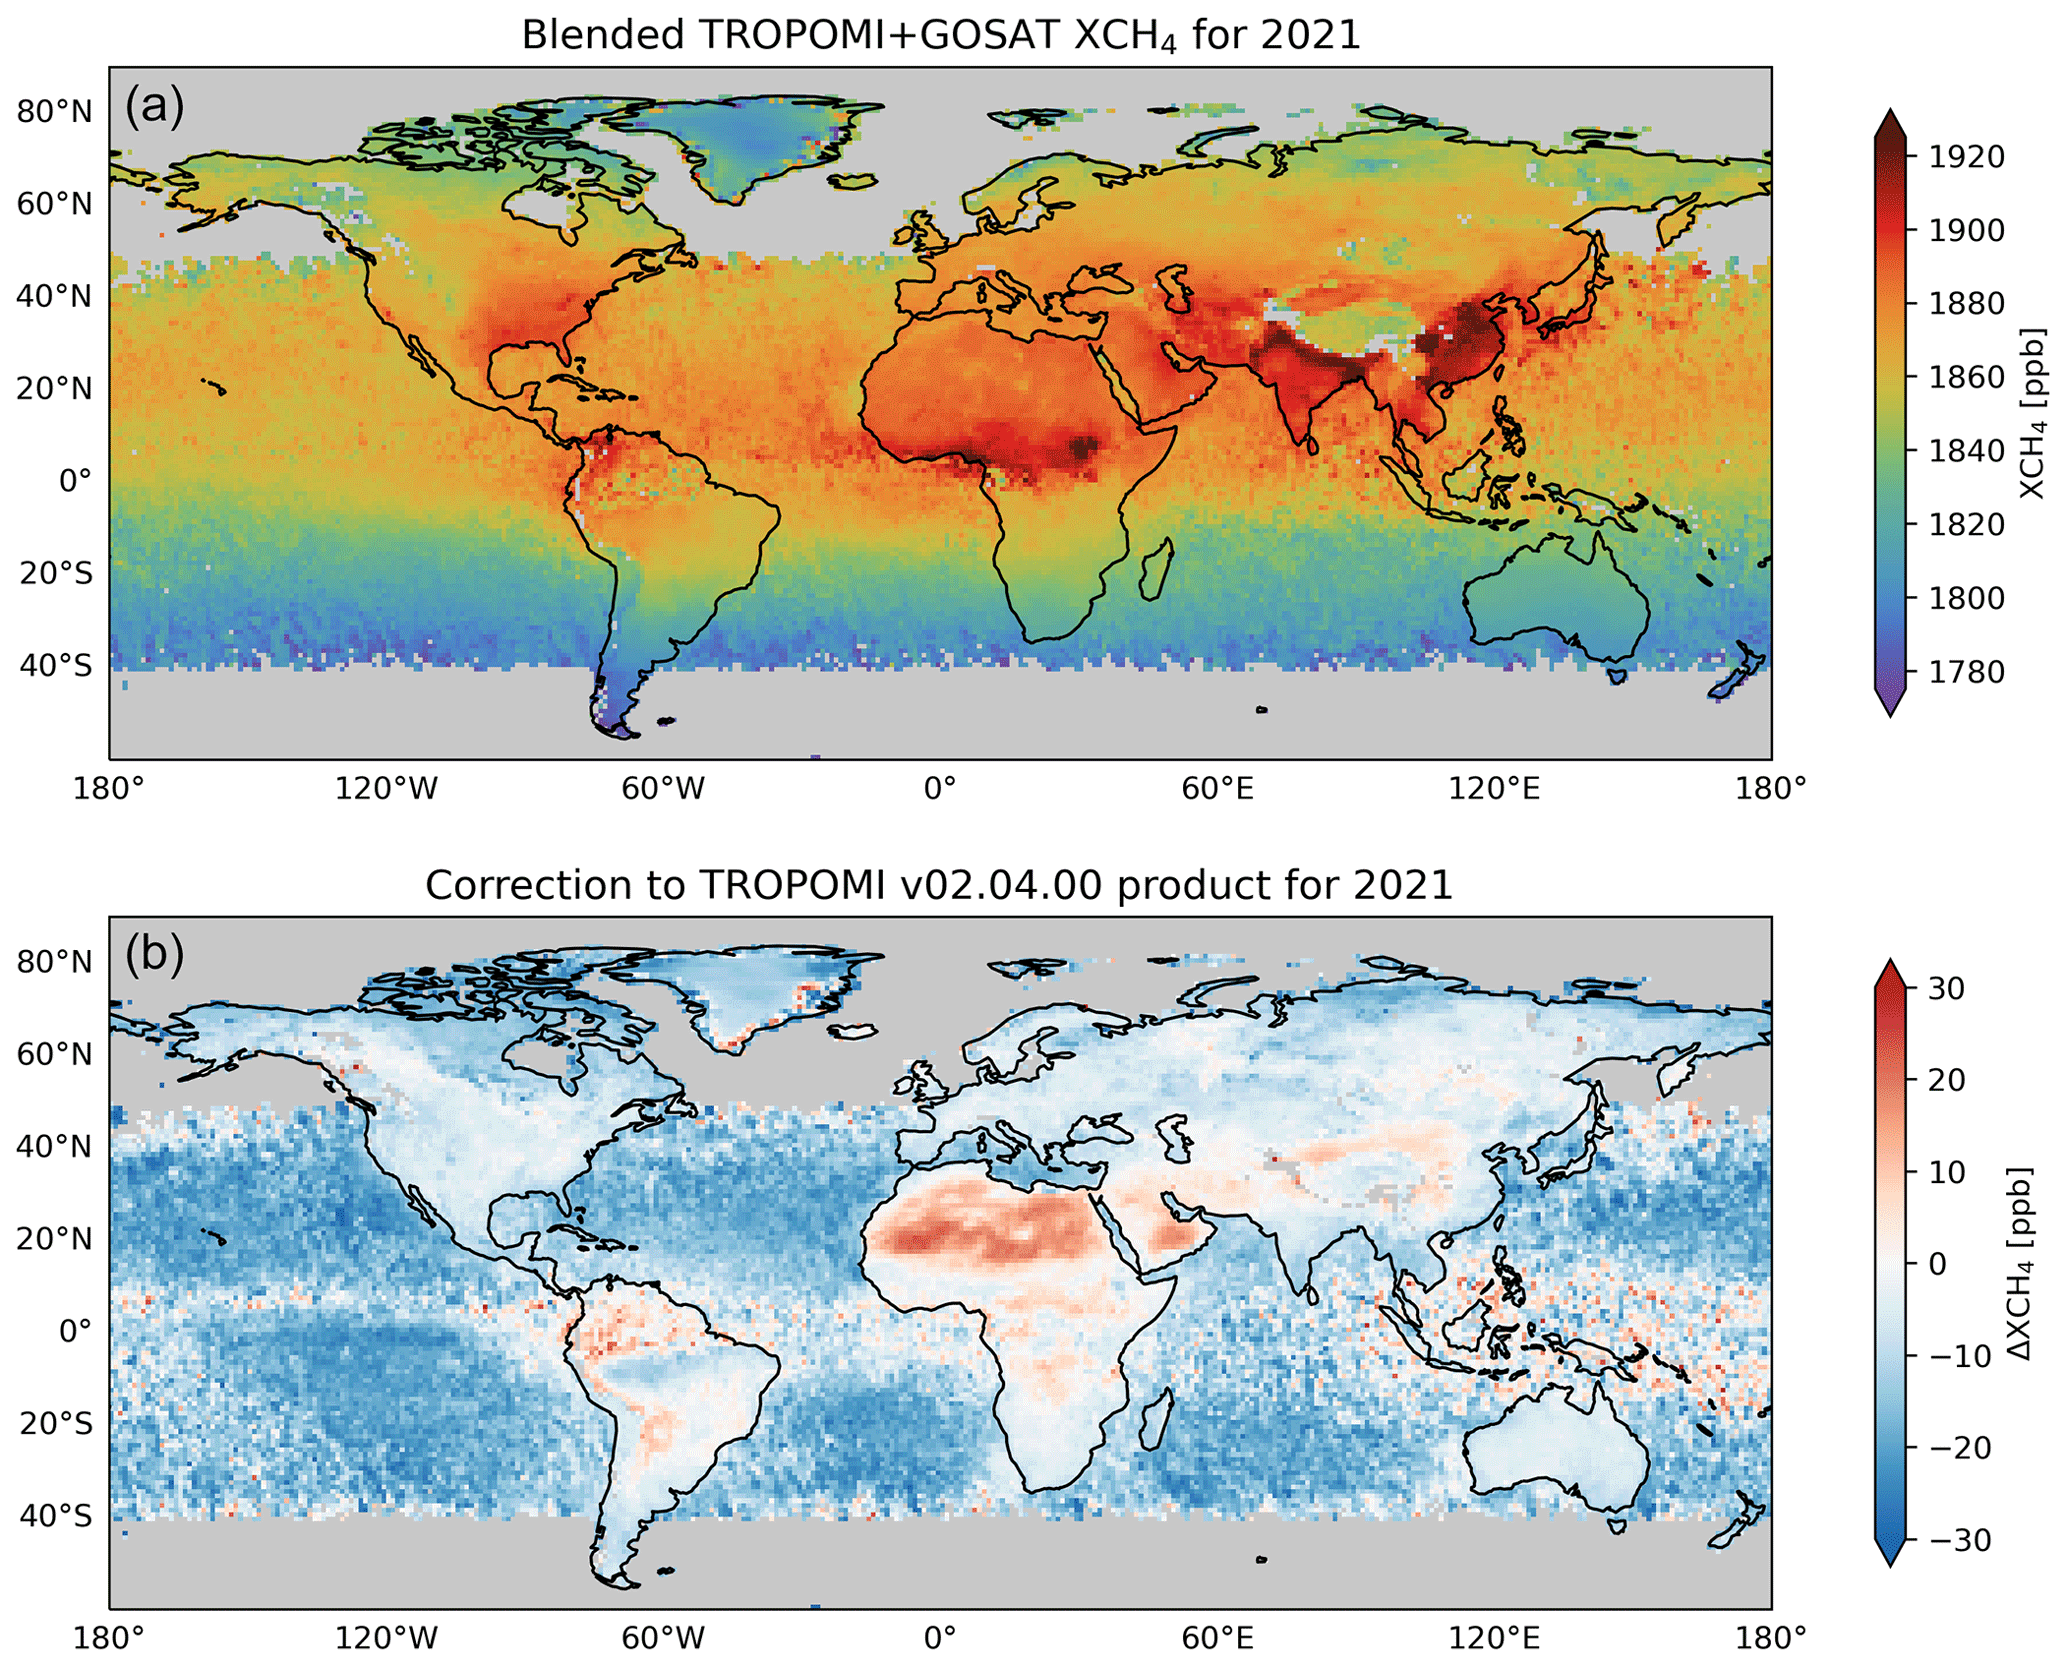
Figure 8Blended TROPOMI+GOSAT product for 2021 (a) and correction to the TROPOMI operational v02.04.00 product (b). The data are annual means and are plotted on a 1∘ × 1∘ grid with data south of 60∘ S cropped for visualization purposes. Gray areas have no TROPOMI data. The color bar in the bottom panel saturates at ±30 ppb, but there are outliers ranging from −48.1 ppb (East Siberian Sea) to +44.5 ppb (over the equatorial western Pacific).
Our correction is built on top of the TROPOMI operational v02.04.00 data that have already been bias-corrected with respect to SWIR surface albedo (Lorente et al., 2021). We compare these corrections in Appendix C.
Figure 9 shows the seasonal variation in the correction for 2021. Upward correction over arid surfaces due to SWIR surface albedo is consistent across seasons, but there is still seasonality in the correction over these regions driven by dust emission (and thus the aerosol size parameter). As a result, the correction over North Africa is largest in the boreal spring–summer, and the correction over the East Asian deserts is largest in late boreal winter, reflecting the seasonality in dust emission (Shao and Dong, 2006; Senghor et al., 2017). There is large seasonal variation in the correction at high northern latitudes because of the low SWIR albedo of snow- and ice-covered surfaces.
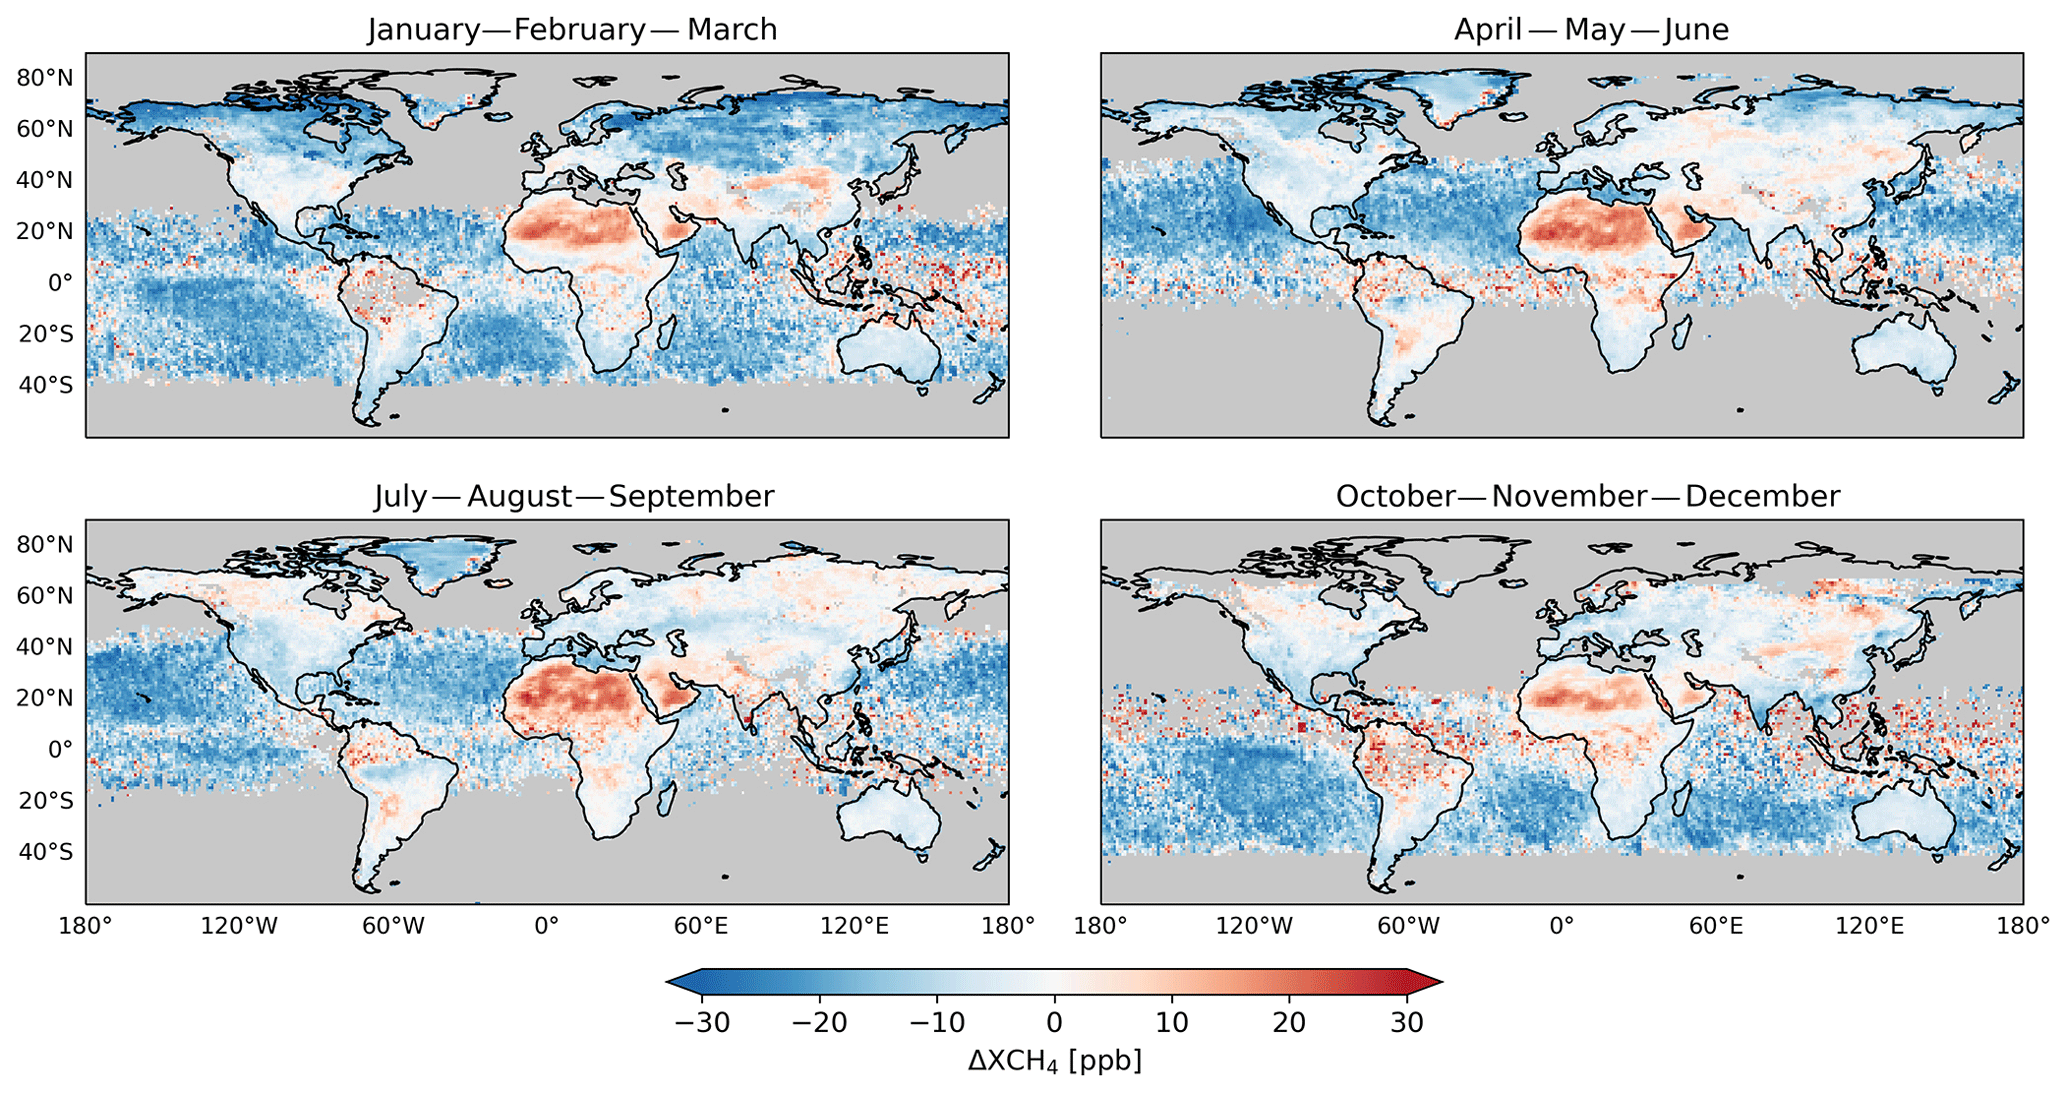
Figure 9Seasonal correction to the TROPOMI data in the blended TROPOMI+GOSAT product. The figure shows the differences with the TROPOMI operational v02.04.00 product averaged for each season in 2021. Data are plotted on a 1∘ × 1∘ grid with data south of 60∘ S cropped for visualization purposes.
Figure 10 illustrates the correction over the Arabian Peninsula with annual mean oversampled data on a 0.01∘ × 0.01∘ grid. The TROPOMI operational v02.04.00 XCH4 data show patterns that correlate with SWIR surface albedo, such as the XCH4 gradients across Sudan and Saudi Arabia. These are removed in the blended product. The original data also show a number of hotspots over Iraq and Saudi Arabia that are removed in the blended product. These artifact enhancements tend to be related to the TROPOMI aerosol size distribution parameter, but they are more persistent than would be expected from aerosol plumes, suggesting that surface features might be aliasing into the aerosol retrieval. Other hotspots, such as those over Iran, are intensified in the blended product due to the high albedo in the region.
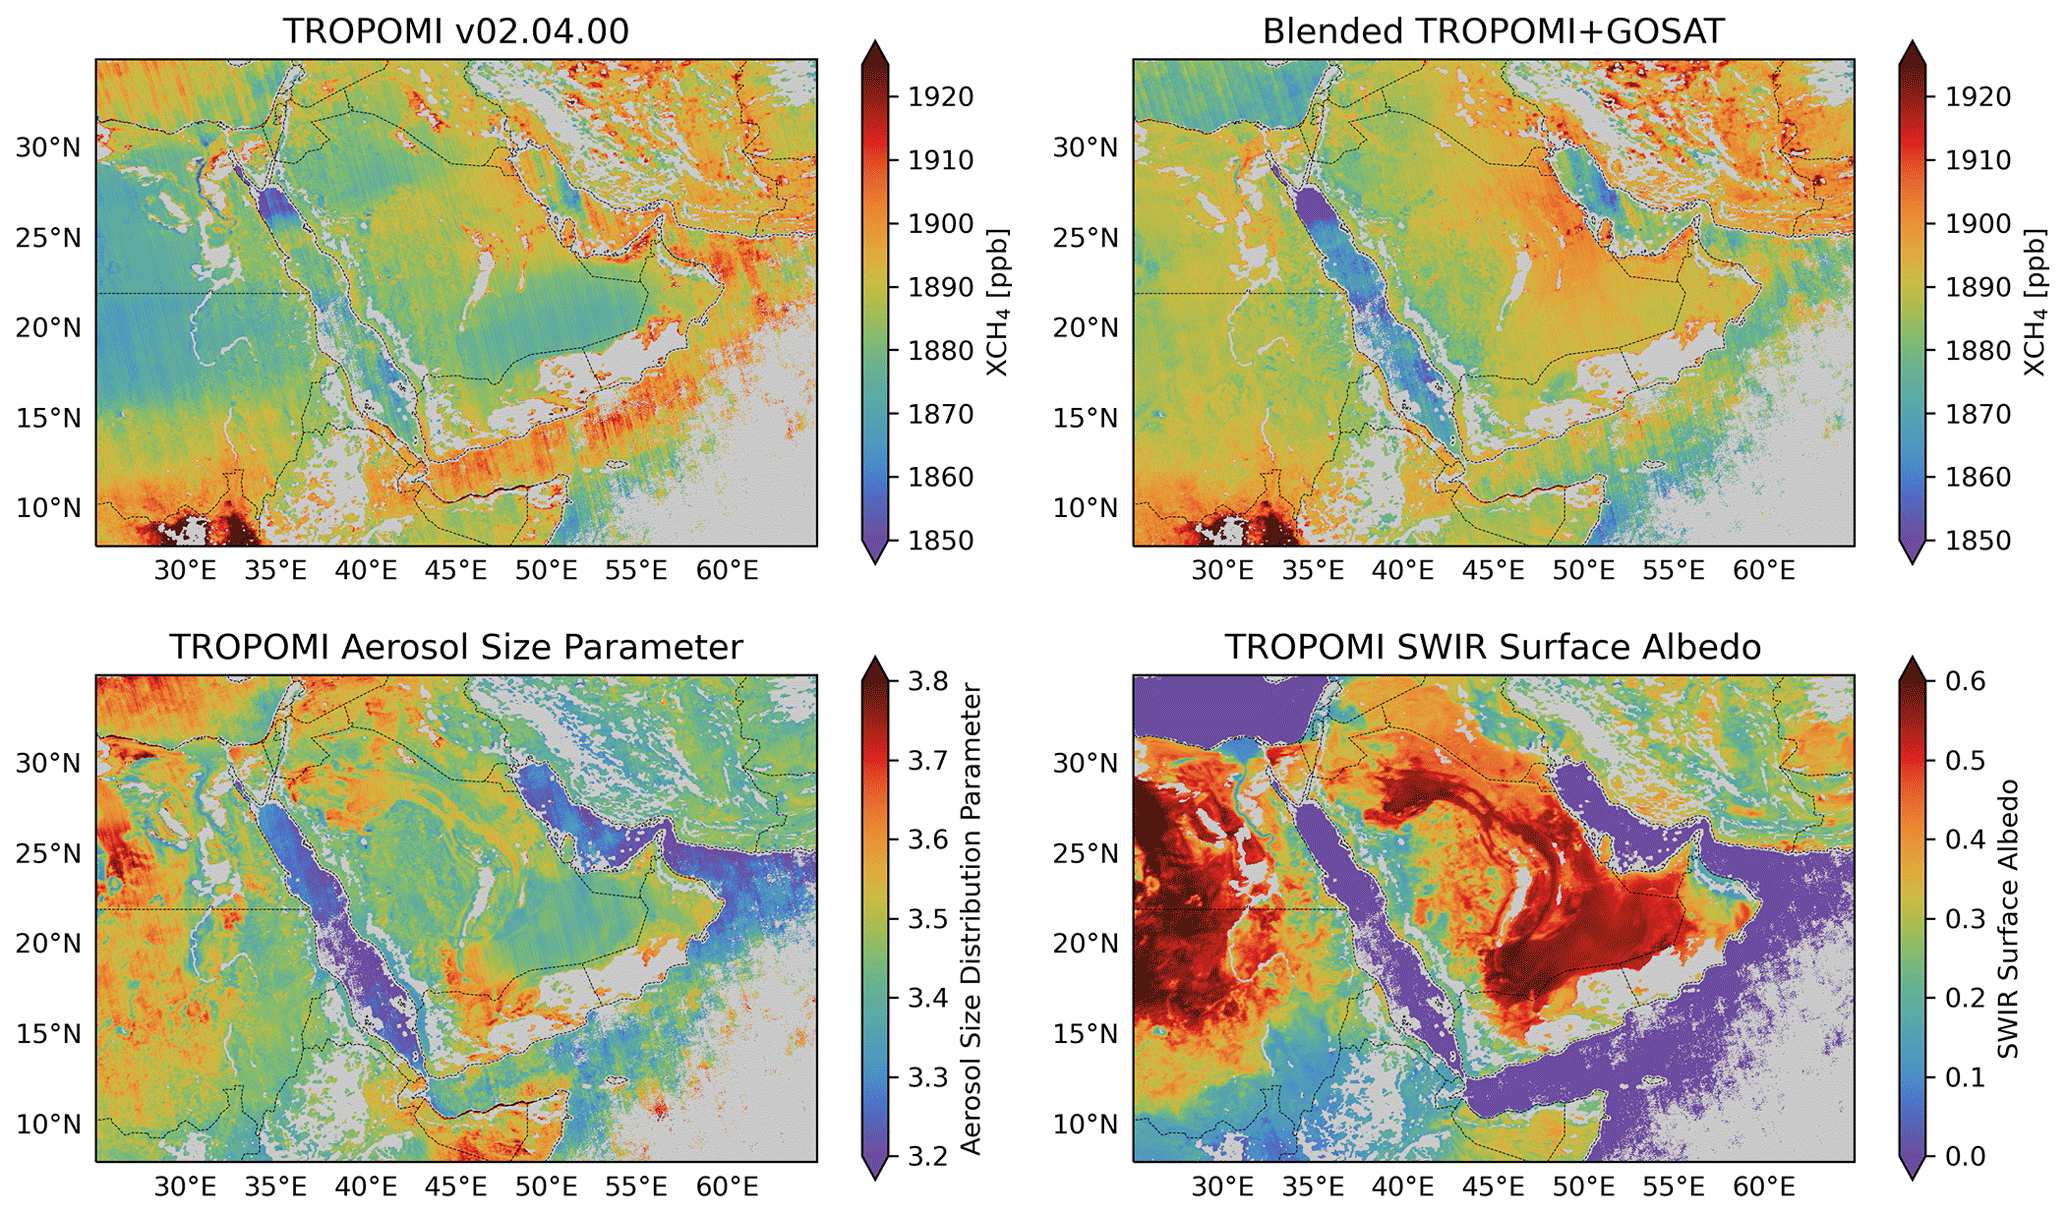
Figure 10Blended TROPOMI+GOSAT and TROPOMI operational v02.04.00 data oversampled to a 0.01∘ × 0.01∘ grid over the Arabian Peninsula. Values are 2021 annual means. Also shown are the aerosol size distribution parameter and the SWIR surface albedo from the TROPOMI operational v02.04.00 retrieval. Oversampling to increase spatial resolution was done with the tessellation method following Zhu et al. (2017). Gray areas have less than 10 individual satellite observations contributing to the average.
The TROPOMI operational v02.04.00 data show some coastal artifacts that are apparent in Fig. 10 and that are not always fully corrected in the blended TROPOMI+GOSAT product. Coastal scenes are difficult to retrieve in full-physics algorithms because of the subpixel albedo contrast between dark water and bright land. Despite our correction, Fig. 10 shows that some coastal areas have persistent biases, most evidently along the southern coast of the Gulf of Aden. The ability of the ML model to correct coastal biases may be limited by the diversity of coastal conditions and the small number of TROPOMI and GOSAT coastal data pairs available for training. Data users can choose to mitigate coastal bias by filtering out a subset of TROPOMI scenes that contain both land and water (Appendix D).
Our blended product also corrects transient biases from striping and atmospheric scattering that may affect single-scene observations of hotspots and plumes. This is illustrated in Fig. 11 with a single-orbit scene (no temporal or spatial averaging) over Algeria on 15 December 2019 featuring a plume from an oil/gas ultra-emitting facility previously identified in the TROPOMI data by Lauvaux et al. (2022). There is strong striping along the orbit track in the original single-orbit data from TROPOMI (Liu et al., 2021; Schneising et al., 2023), and this is substantially reduced in our product. The plume, shown in the center of Fig. 11, was partially overlain by cirrus clouds (observed by VIIRS) that were not filtered out in the TROPOMI retrieval and caused a low bias in the retrieved XCH4. Our blended product corrects this cloud bias, enabling a better characterization of the plume to infer the source rate.
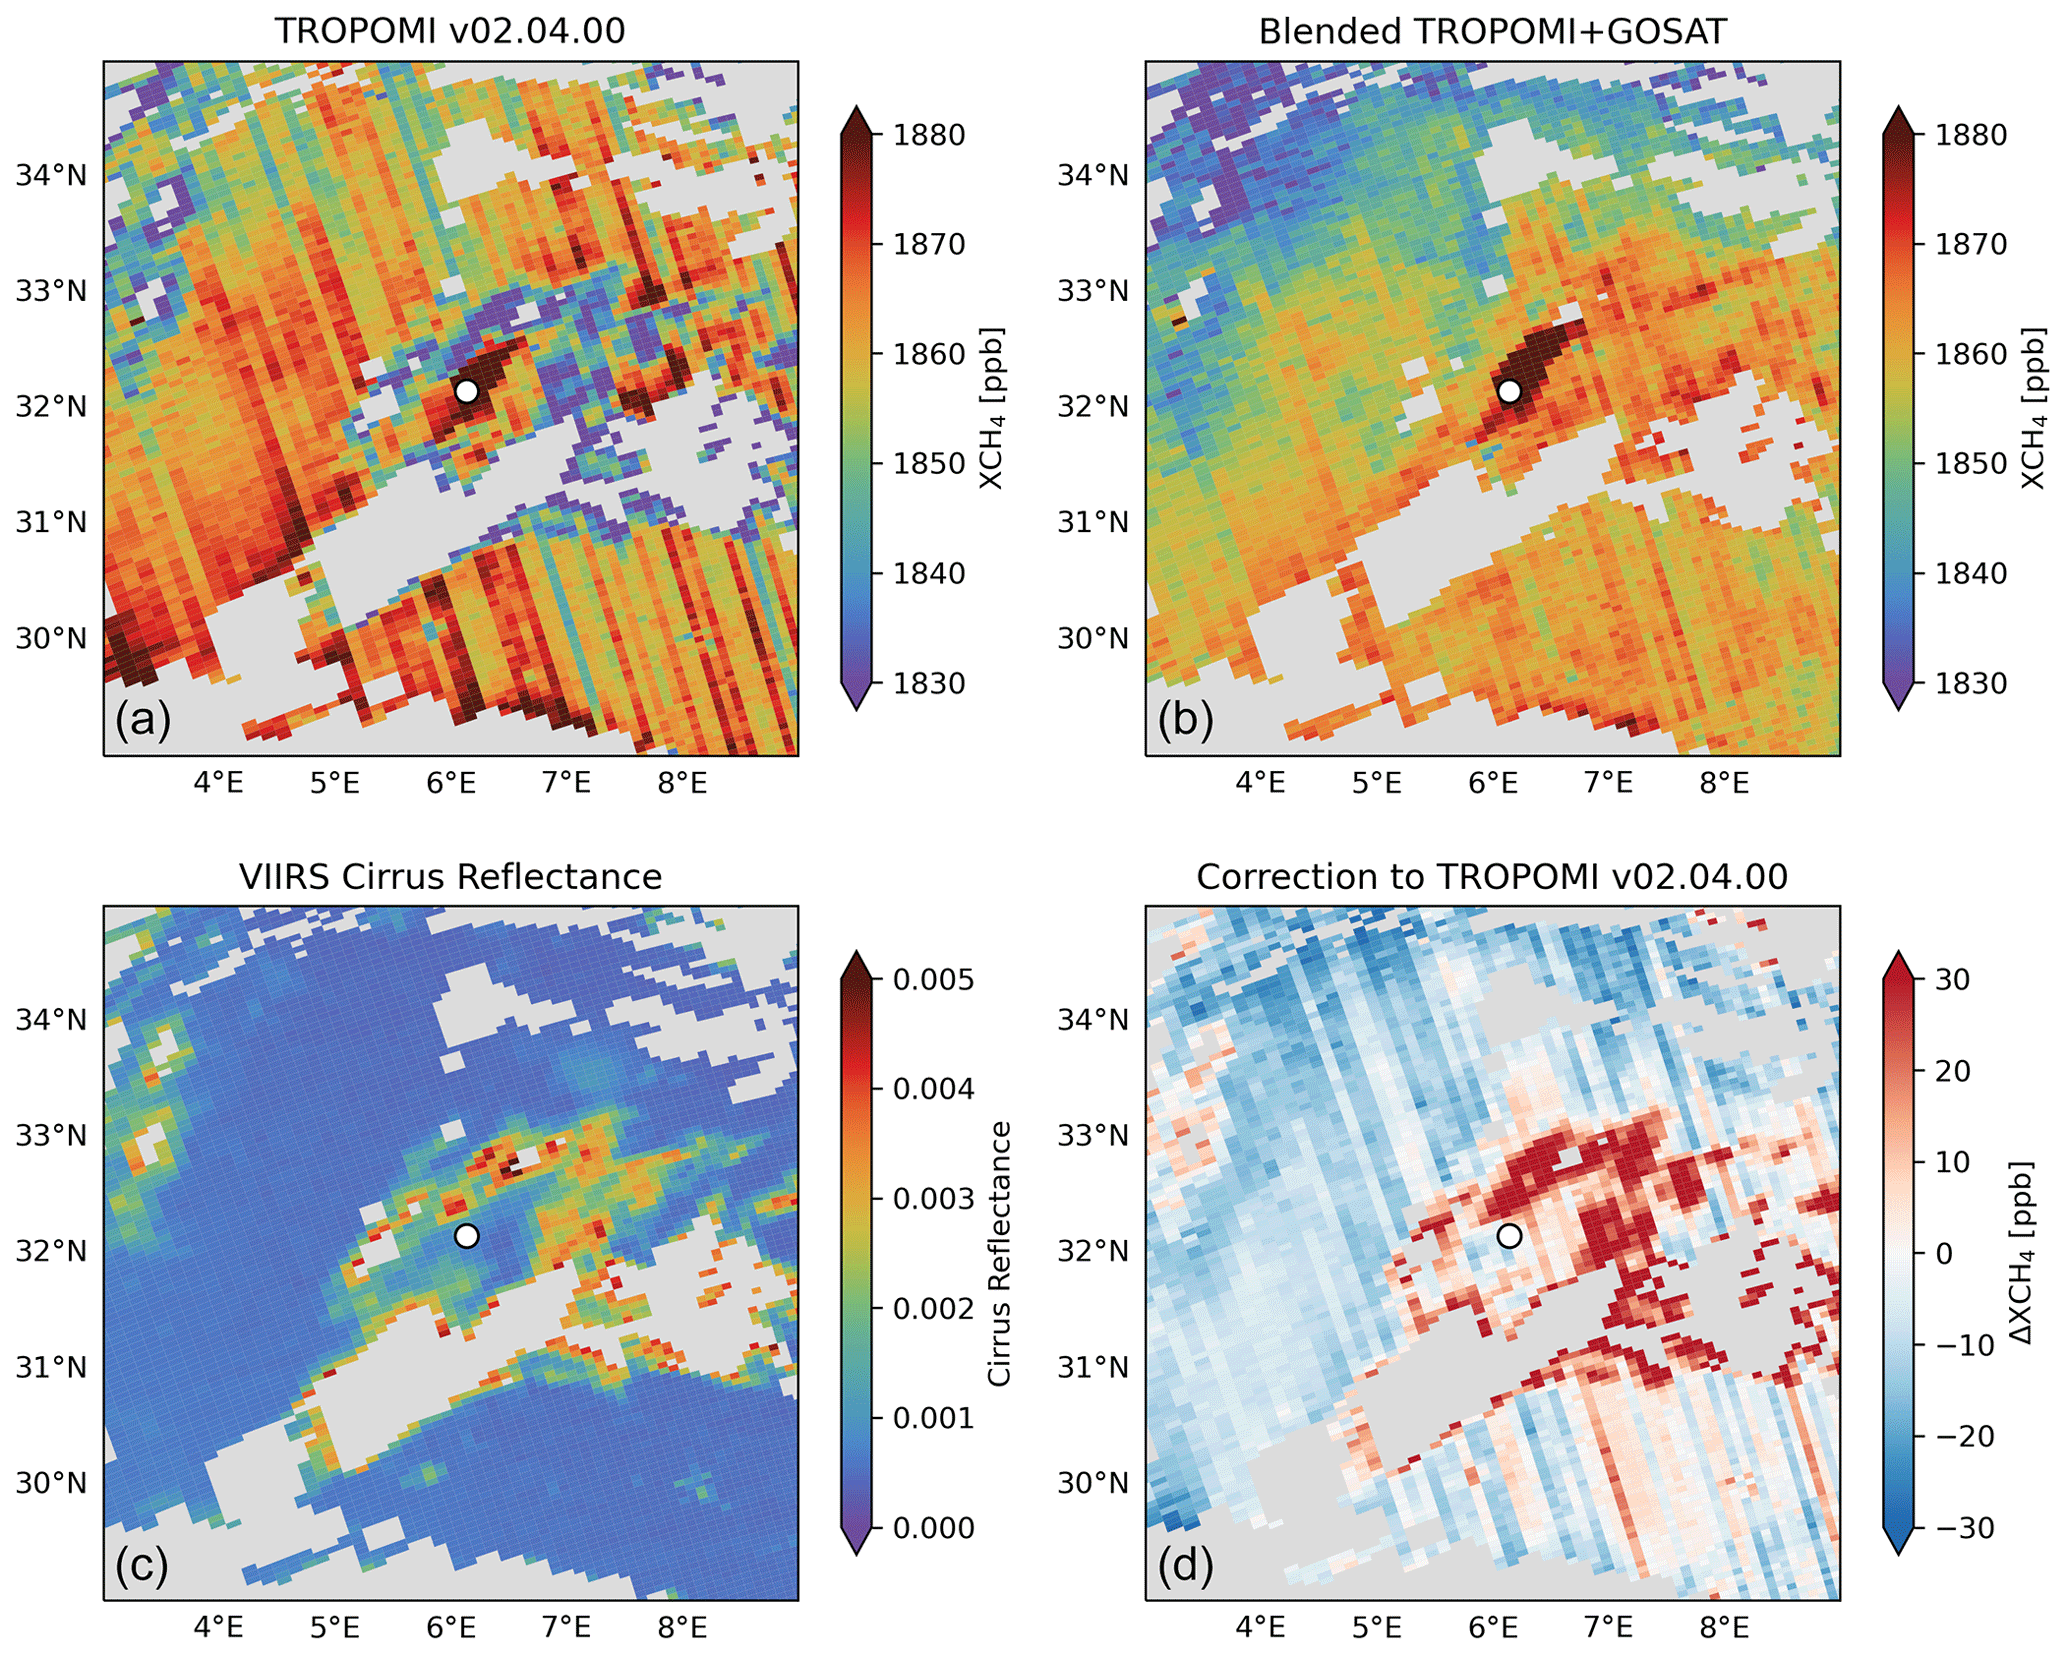
Figure 11Methane ultra-emitter plume detection in single-orbit TROPOMI data. The figure shows a scene over Algeria sampled by orbit number 11252 on 15 December 2019. Missing data are shown in gray. The enhancement in the center of the image was identified by Lauvaux et al. (2022) from TROPOMI data as a plume from an ultra-emitting oil/gas facility with an approximate location at the white circle marker. The TROPOMI operational v02.04.00 retrieval (a) shows extensive striping and low values surrounding the plume that are biases from cirrus cloud reflectance (c). This is effectively corrected in the blended TROPOMI+GOSAT product (b, d).
We presented a new blended TROPOMI+GOSAT methane product that corrects spatially variable biases and artifacts in the TROPOMI satellite instrument observations of atmospheric methane (XCH4) by using high-quality GOSAT observations as a reference. Our blended product improves the reliability of inversions of TROPOMI data to infer methane emissions and identify methane super-emitters in single-orbit and time-averaged observations. It includes the full dataset of TROPOMI retrievals from April 2018 to present and is available for download (see the “Data availability” section).
The blended product was generated by training a machine learning (ML) model (LightGBM) to predict the difference Δ(TROPOMI − GOSAT) between co-located GOSAT and TROPOMI methane retrievals for 2018–2020, using TROPOMI retrieval parameters as the sole predictor variables. This enabled subsequent application of the ML model to compute Δ(TROPOMI − GOSAT) for the full ensemble of TROPOMI data. The most important predictors of Δ(TROPOMI − GOSAT) were found to be aerosol size, SWIR surface albedo, and across-track pixel index. The corrections are largest for observations with high albedos and coarse particles. Systematic downward correction averaging 12.9 ppb was found over water where the GOSAT XCH4 glint retrievals are lower than TROPOMI.
Evaluation with independent ground-based TCCON XCH4 data shows that our blended TROPOMI+GOSAT product reduces the global mean bias in the TROPOMI data from 6.0 to −2.9 ppb, the variable bias from 4.7 to 4.4 ppb, and the single-retrieval precision from 14.5 to 11.9 ppb. However, the TCCON data are spatially limited and, in particular, do not sample regions with SWIR surface albedos larger than 0.4 where the largest TROPOMI biases relative to GOSAT are found. Nevertheless, evaluation with the TCCON data confirms that TROPOMI retrieval biases are related to the SWIR surface albedo and aerosol size parameter and that the blended TROPOMI+GOSAT product successfully reduces these biases. Global evaluation of the blended TROPOMI+GOSAT product relative to GOSAT for 2021 as an independent test dataset shows a reduction in variable bias over land from 14.3 to 10.4 ppb on a 0.25∘ × 0.3125∘ grid (as might be used for regional inversions) and from 13.1 to 9.1 ppb on a 2∘ × 2.5∘ grid (as might be used for global inversions).
Annual mean corrections in the blended product relative to the TROPOMI operational v02.04.00 data exceed 10 ppb over the oceans, desert regions (notably North Africa), persistently cloudy regions (notably tropical wetlands), and seasonally snow-covered regions (notably high northern latitudes). Large-scale corrections are mostly driven by SWIR surface albedo. Fine-scale inspection of the Arabian Peninsula reveals a number of annual mean hotspots in the original TROPOMI data that are removed in the blended product as artifacts. Some coastal artifacts remain in the blended product that can be filtered out at the discretion of the user.
The blended product also increases the quality of the single-orbit TROPOMI data by reducing striping and removing transient biases from aerosol plumes and cirrus clouds. This can increase confidence in the identification of ultra-emitters from TROPOMI hotspots and the quantitative interpretation of plume observations to infer point-source rates.
Our correction will be applicable to all past and future operational TROPOMI v02.04.00 data (as well as v02.05.00, as it features no changes relative to v02.04.00). Users can download our blended TROPOMI+GOSAT product for 2018–present (see the “Data availability” section) or apply the correction themselves to the operational product. A new version of the TROPOMI retrieval would require the ML algorithm to be retrained.
The ML framework presented here can be extended to any pair of satellite instruments in which one instrument provides a dense dataset while the other provides a more accurate but sparser dataset for the same variable. This situation often arises with a new satellite launch, as retrievals take time to mature, and an older, more established instrument may have been previously validated. Application of our approach to identify biases with the new instrument provides a far more spatially extensive evaluation than the traditional approach using surface sites or aircraft profiles. It also enables the identification of the critical retrieval parameters that should be improved in the new instrument. Finally, it generates a blended product that corrects data from the new instrument.
Unbiased intercomparison of XCH4 values retrieved from TROPOMI, GOSAT, and TCCON requires adjustments for the different averaging kernel vertical sensitivities and prior vertical CH4 concentration profiles used in the retrievals and reported as part of the retrieval products. We follow Schneising et al. (2019) and Buchwitz et al. (2022) to make these adjustments.
The following notation will be used. Column-averaged dry-air mixing ratios of methane (XCH4) are denoted as c (with units of ppb). Vertical profiles of CH4 subcolumn mixing ratios for pressure levels indexed by l are denoted as xl and are either retrieved () or prior estimates () (with units of ppb). Vertical profiles of averaging kernels describing sensitivity are denoted by Al and are dimensionless. Pressure weights that map vertical profiles xl to XCH4 are denoted as h and are dimensionless. Subscripts G, T, and F denote GOSAT, TROPOMI, and TCCON, respectively. Δ denotes the XCH4 differences between pairs of instruments after adjustment to the same vertical sensitivities and prior estimates.
The GOSAT retrieval has more vertical pressure levels (19 or 20 depending on the retrieval) than TROPOMI (12, denoted pressure layers). It is, therefore, better to interpolate xl from GOSAT to TROPOMI, following the principle of using the coarser vertical grid when comparing two different satellite retrievals (Rodgers and Connor, 2003). To calculate Δ(TROPOMI − GOSAT), we first calculate what value TROPOMI would have retrieved with GOSAT's prior profile.
Next, we calculate what value GOSAT would have retrieved with TROPOMI's vertical sensitivity.
Because the retrieved vertical profile of CH4 is not reported for GOSAT, we estimate it here by scaling the prior profile by the ratio of retrieved to prior XCH4 values.
Equations (A1) and (A2) require GOSAT's prior profile to be on the same pressure grid as TROPOMI. Interpolation is conducted from the 19 or 20 GOSAT pressure levels to the 12 TROPOMI pressure layers for this purpose. Equations (A1), (A2), and (A3) are then used to calculate Δ(TROPOMI − GOSAT).
The same procedure is used to calculate Δ(GOSAT − TCCON) and Δ(TROPOMI − TCCON). TCCON uses 51 pressure levels for its retrieval. For Δ(GOSAT − TCCON), we use TCCON's prior profile and GOSAT's averaging kernel sensitivities. For Δ(TROPOMI − TCCON), we use TCCON's prior profile and TROPOMI's averaging kernel sensitivities. An equation analogous to Eq. (A3) is used to estimate the retrieved TCCON CH4 profile. Thus, Eqs. (A5) and (A6) calculate Δ(GOSAT − TCCON) and Δ(TROPOMI − TCCON).
We evaluated the GOSAT, TROPOMI, and blended TROPOMI+GOSAT products with the independent TCCON data for 30 April 2018–31 December 2021, correcting for retrieval differences in prior information and vertical sensitivities (Appendix A). We use the TCCON GGG2020 data version (https://tccondata.org, last access: 18 March 2023) and consider all 24 stations that have reported measurements covering our study period (Fig. 6, Table B1).
The general evaluation framework is to identify co-located satellite and TCCON XCH4 retrievals and compare these pairs. When evaluating TROPOMI or the blended TROPOMI+GOSAT product, satellite and TCCON pairs are defined to be those within 1 h and 100 km of each other and a surface elevation difference of no more than 250 m (some of the TCCON stations are on mountaintops). When evaluating the GOSAT product, satellite and TCCON pairs are defined to be those within 2 h and 500 km of each other and a surface elevation difference of no more than 250 m. For all comparisons, a reduced radius of 50 km is used for the Edwards station (Schneising et al., 2019). We find 632 683 TROPOMI–TCCON data pairs and 31 093 GOSAT–TCCON data pairs. The TROPOMI–TCCON data pairs are also used to evaluate the blended TROPOMI+GOSAT product.
For each station, we take the mean and standard deviation of all values of Δ(satellite − TCCON) to yield a station bias and station precision. The mean bias is the average of the station biases. The variable bias is the standard deviation of the station biases. The retrieval precision is the average of the station precisions. These metrics are calculated for 2018–2021 and for all TCCON stations listed in Table B1 and mapped in Fig. 6. Using a threshold of 100 satellite and TCCON pairs for a station to be used, Izaña, JPL, Ny-Ålesund, and Réunion Island are excluded from the TROPOMI and blended TROPOMI+GOSAT analyses, while Izaña, JPL, and Ny-Ålesund are excluded from the GOSAT analysis. The station biases and precisions by station are shown in Table B2.
Table B1TCCON stations used for evaluation of the satellite data.
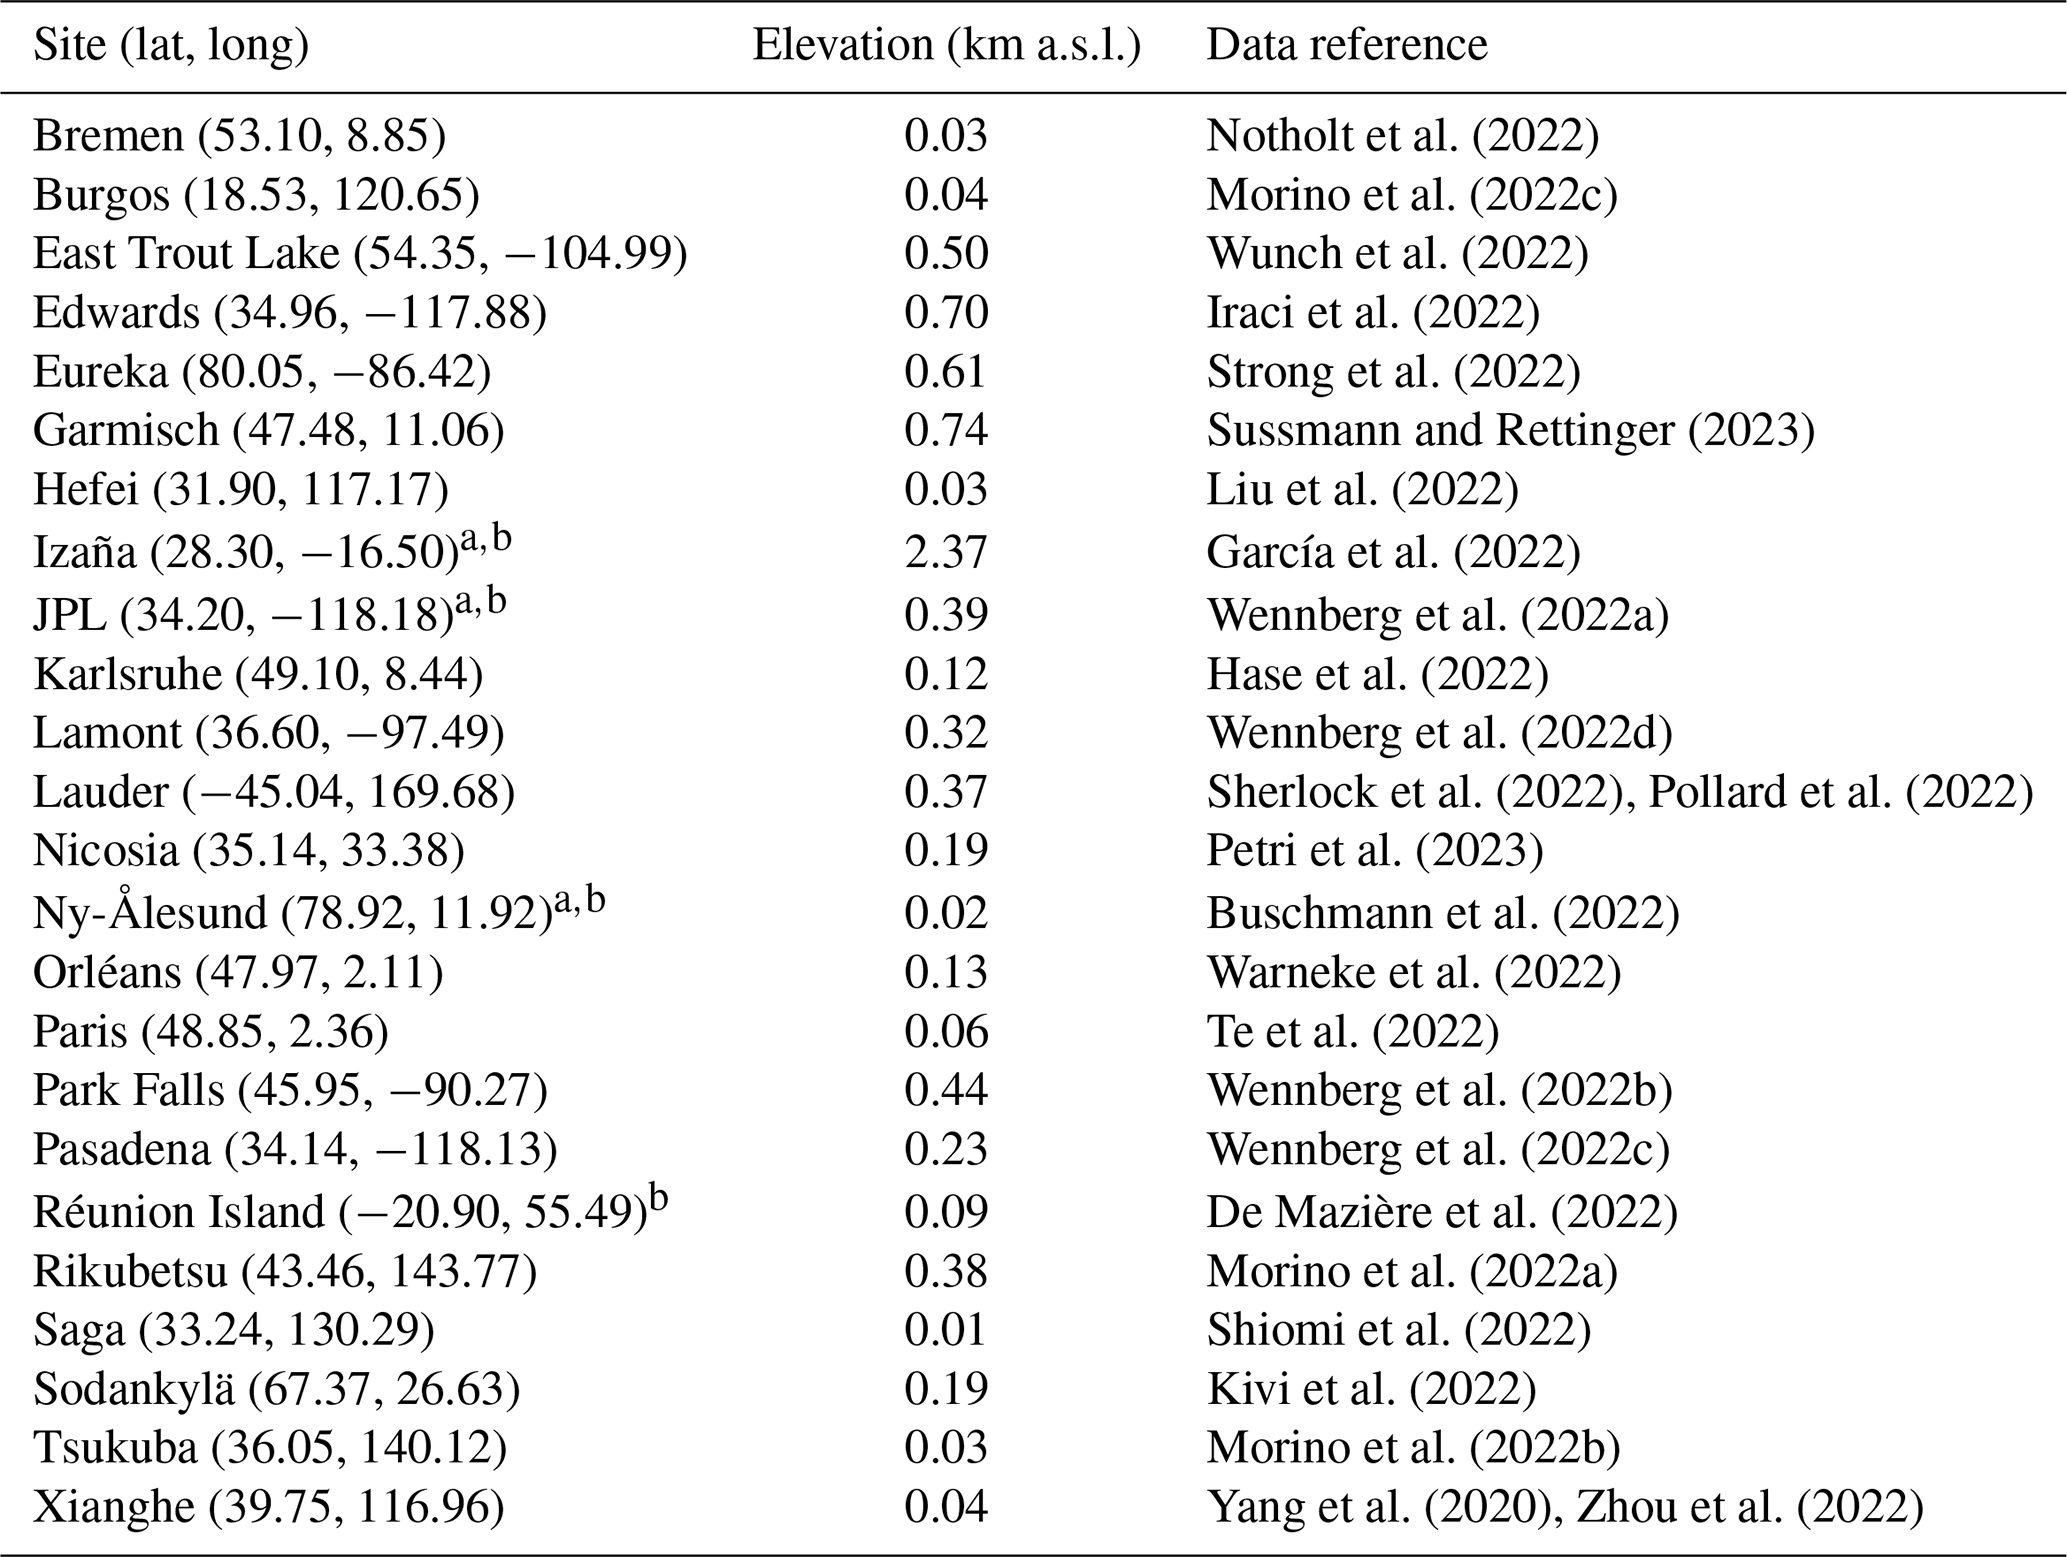
a Excluded from the GOSAT evaluation due to a low number of pairs for comparison. b Excluded from the TROPOMI and blended TROPOMI+GOSAT evaluations due to a low number of pairs for comparison.
Table B2Comparison of satellite products with XCH4 measured at TCCON stations.*
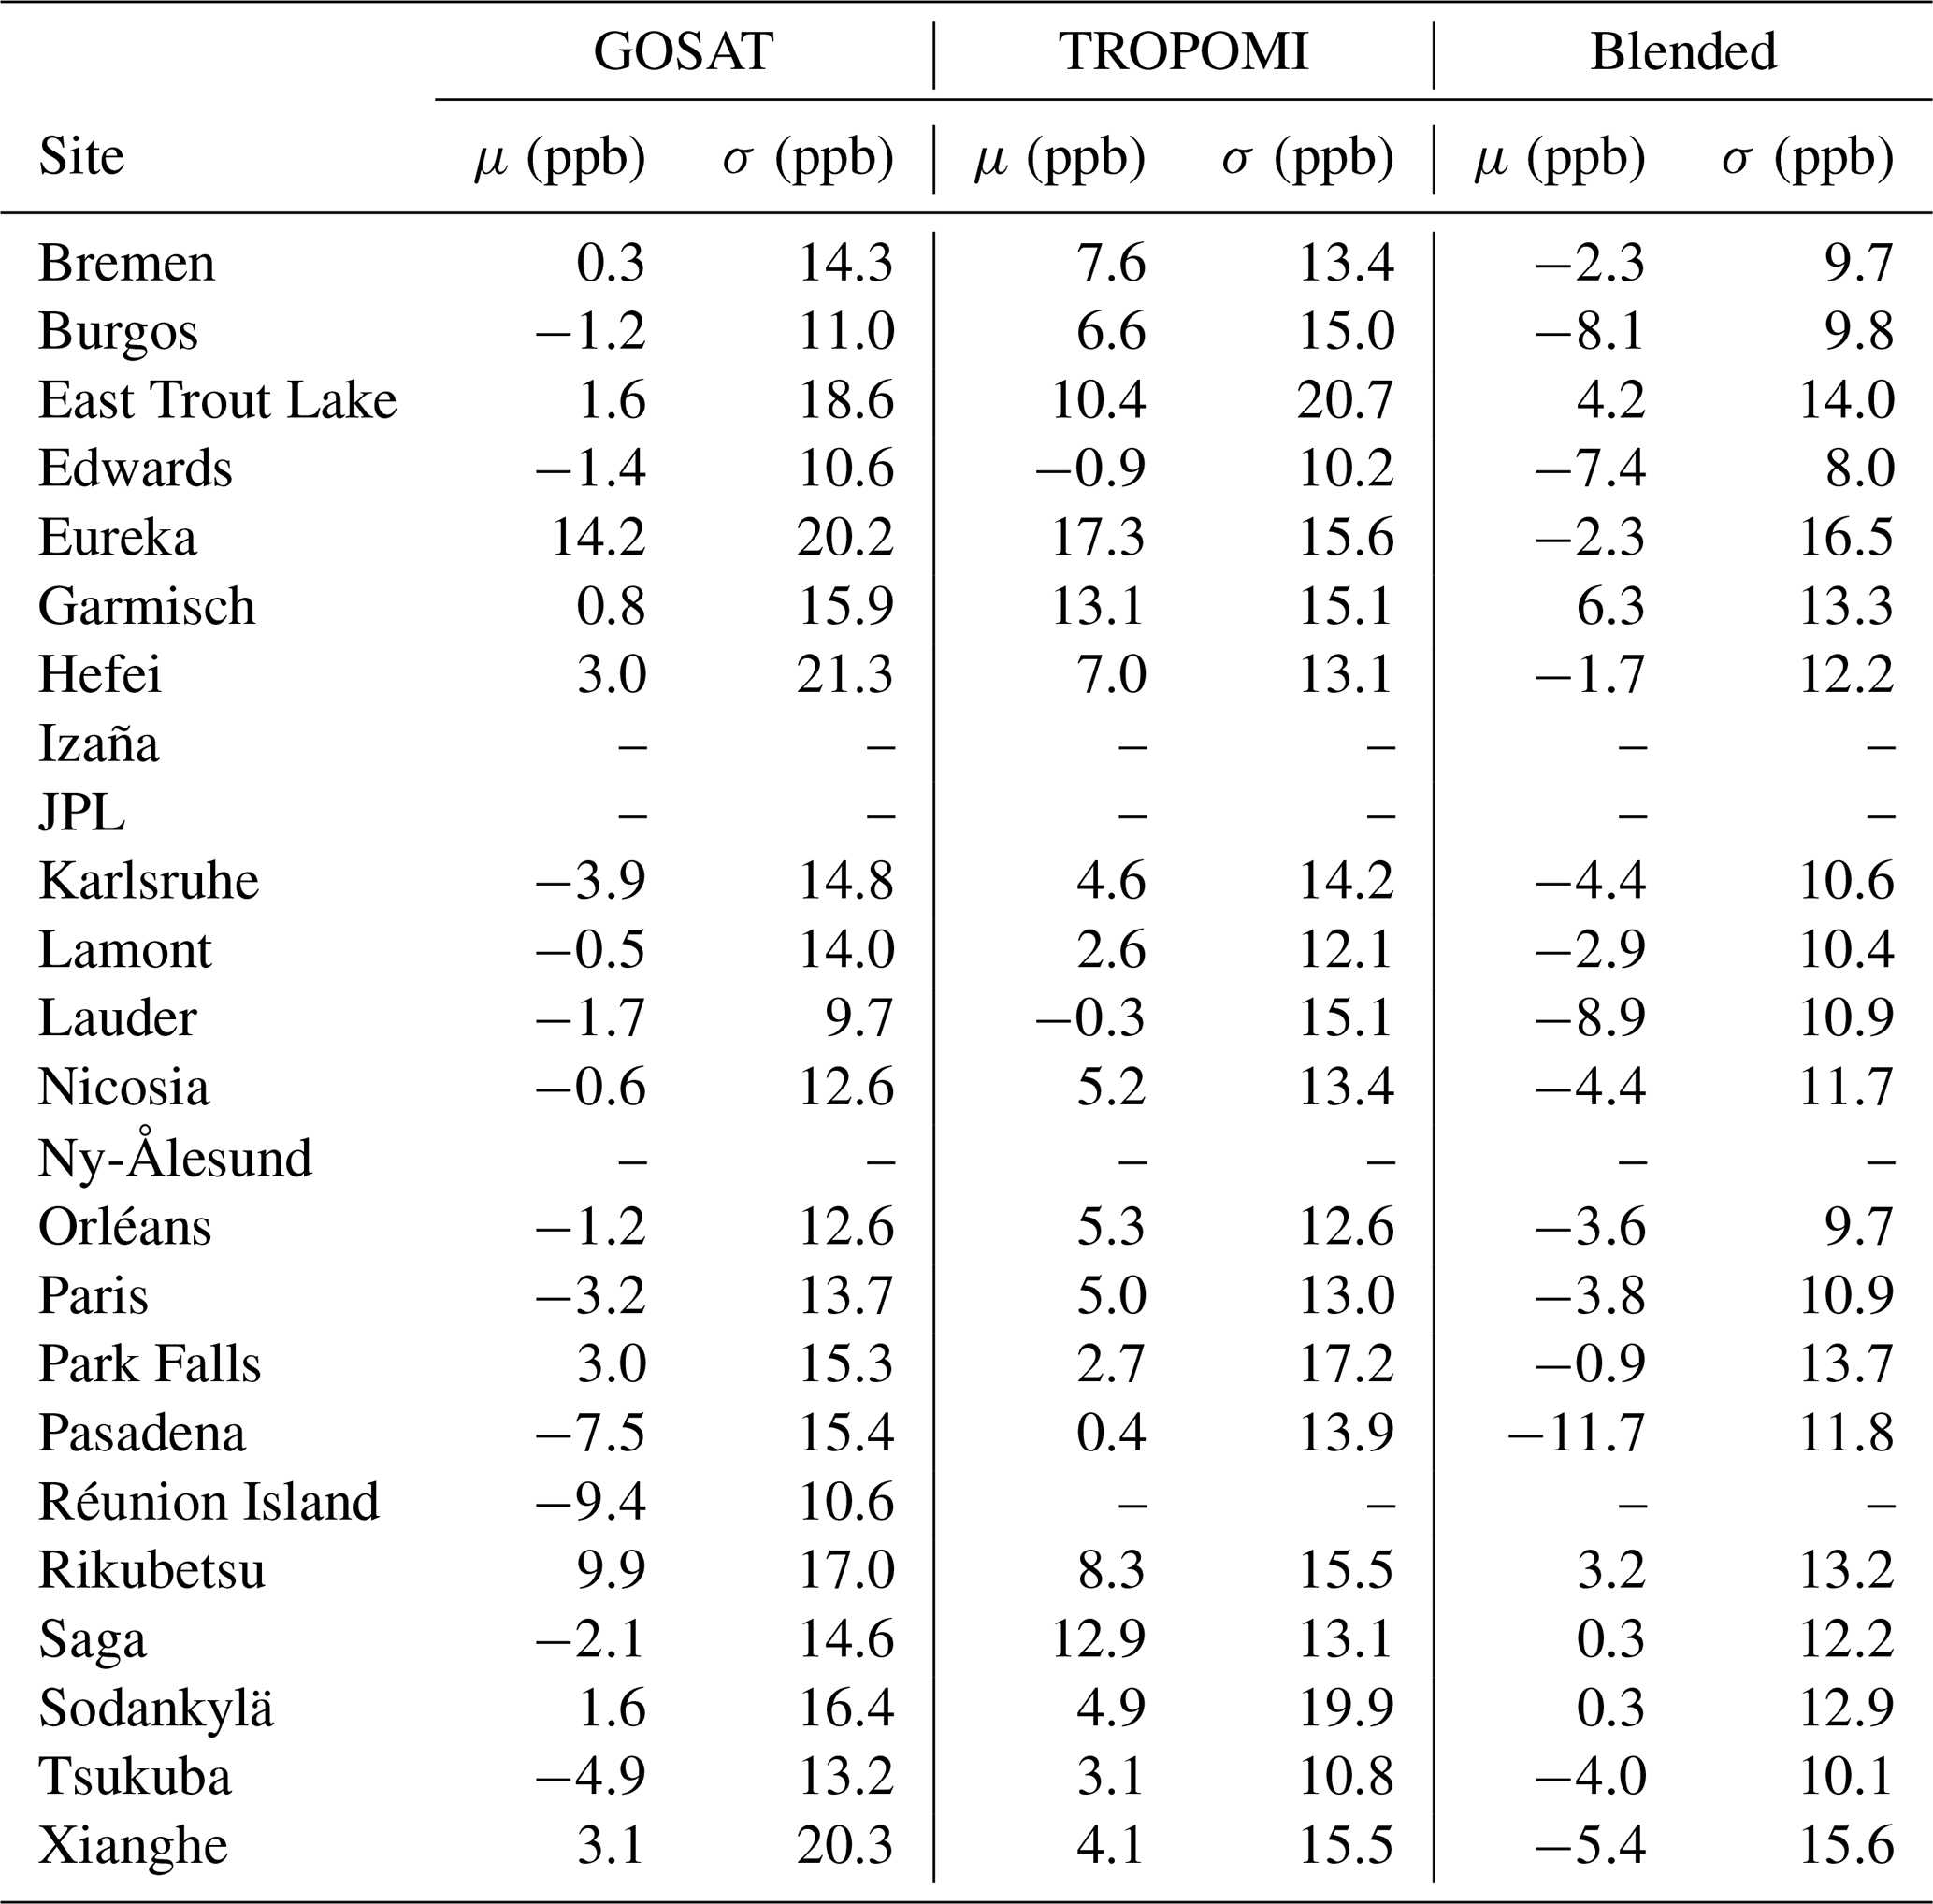
* Mean (μ) and standard deviation (σ) of the satellite − TCCON difference in XCH4 for co-located data over the 2018–2021 period. Station locations are listed in Table B1 and shown in Fig. 6. Satellite and TCCON data have been corrected to the same prior estimates and averaging kernel sensitivities (Appendix A). Dashes indicate insufficient co-located data (see text).
As described in Lorente et al. (2021), the operational v02.04.00 TROPOMI data include a bias correction for SWIR surface albedo. In our study, we have used these data as our starting point for the computation of Δ(TROPOMI − GOSAT). This adds a bias correction on top of a previous bias correction. It is of interest to examine the extent to which the previous bias correction was insufficient.
The operational SWIR surface albedo correction is derived using the “small area approximation”, in which a few regions are selected around the globe where variation in SWIR surface albedo is observed but variation in XCH4 is not expected. Referencing Aben et al. (2007), an albedo of 0.2 is selected as the best conditions for the retrieval, and the correction is derived so that all retrievals in these regions match the retrieval at a SWIR surface albedo of 0.2.
Figure C1 shows the TROPOMI data before the operational albedo bias correction as well as the magnitude of this correction. The sum of the two figures gives the TROPOMI operational v02.04.00 data used in this study. Comparing the operational albedo bias correction to Fig. 6 suggests that it is pushing values of XCH4 to be too low over bright surface (North Africa and the Arabian Peninsula) and to be too high over dark surfaces (snow-covered scenes).
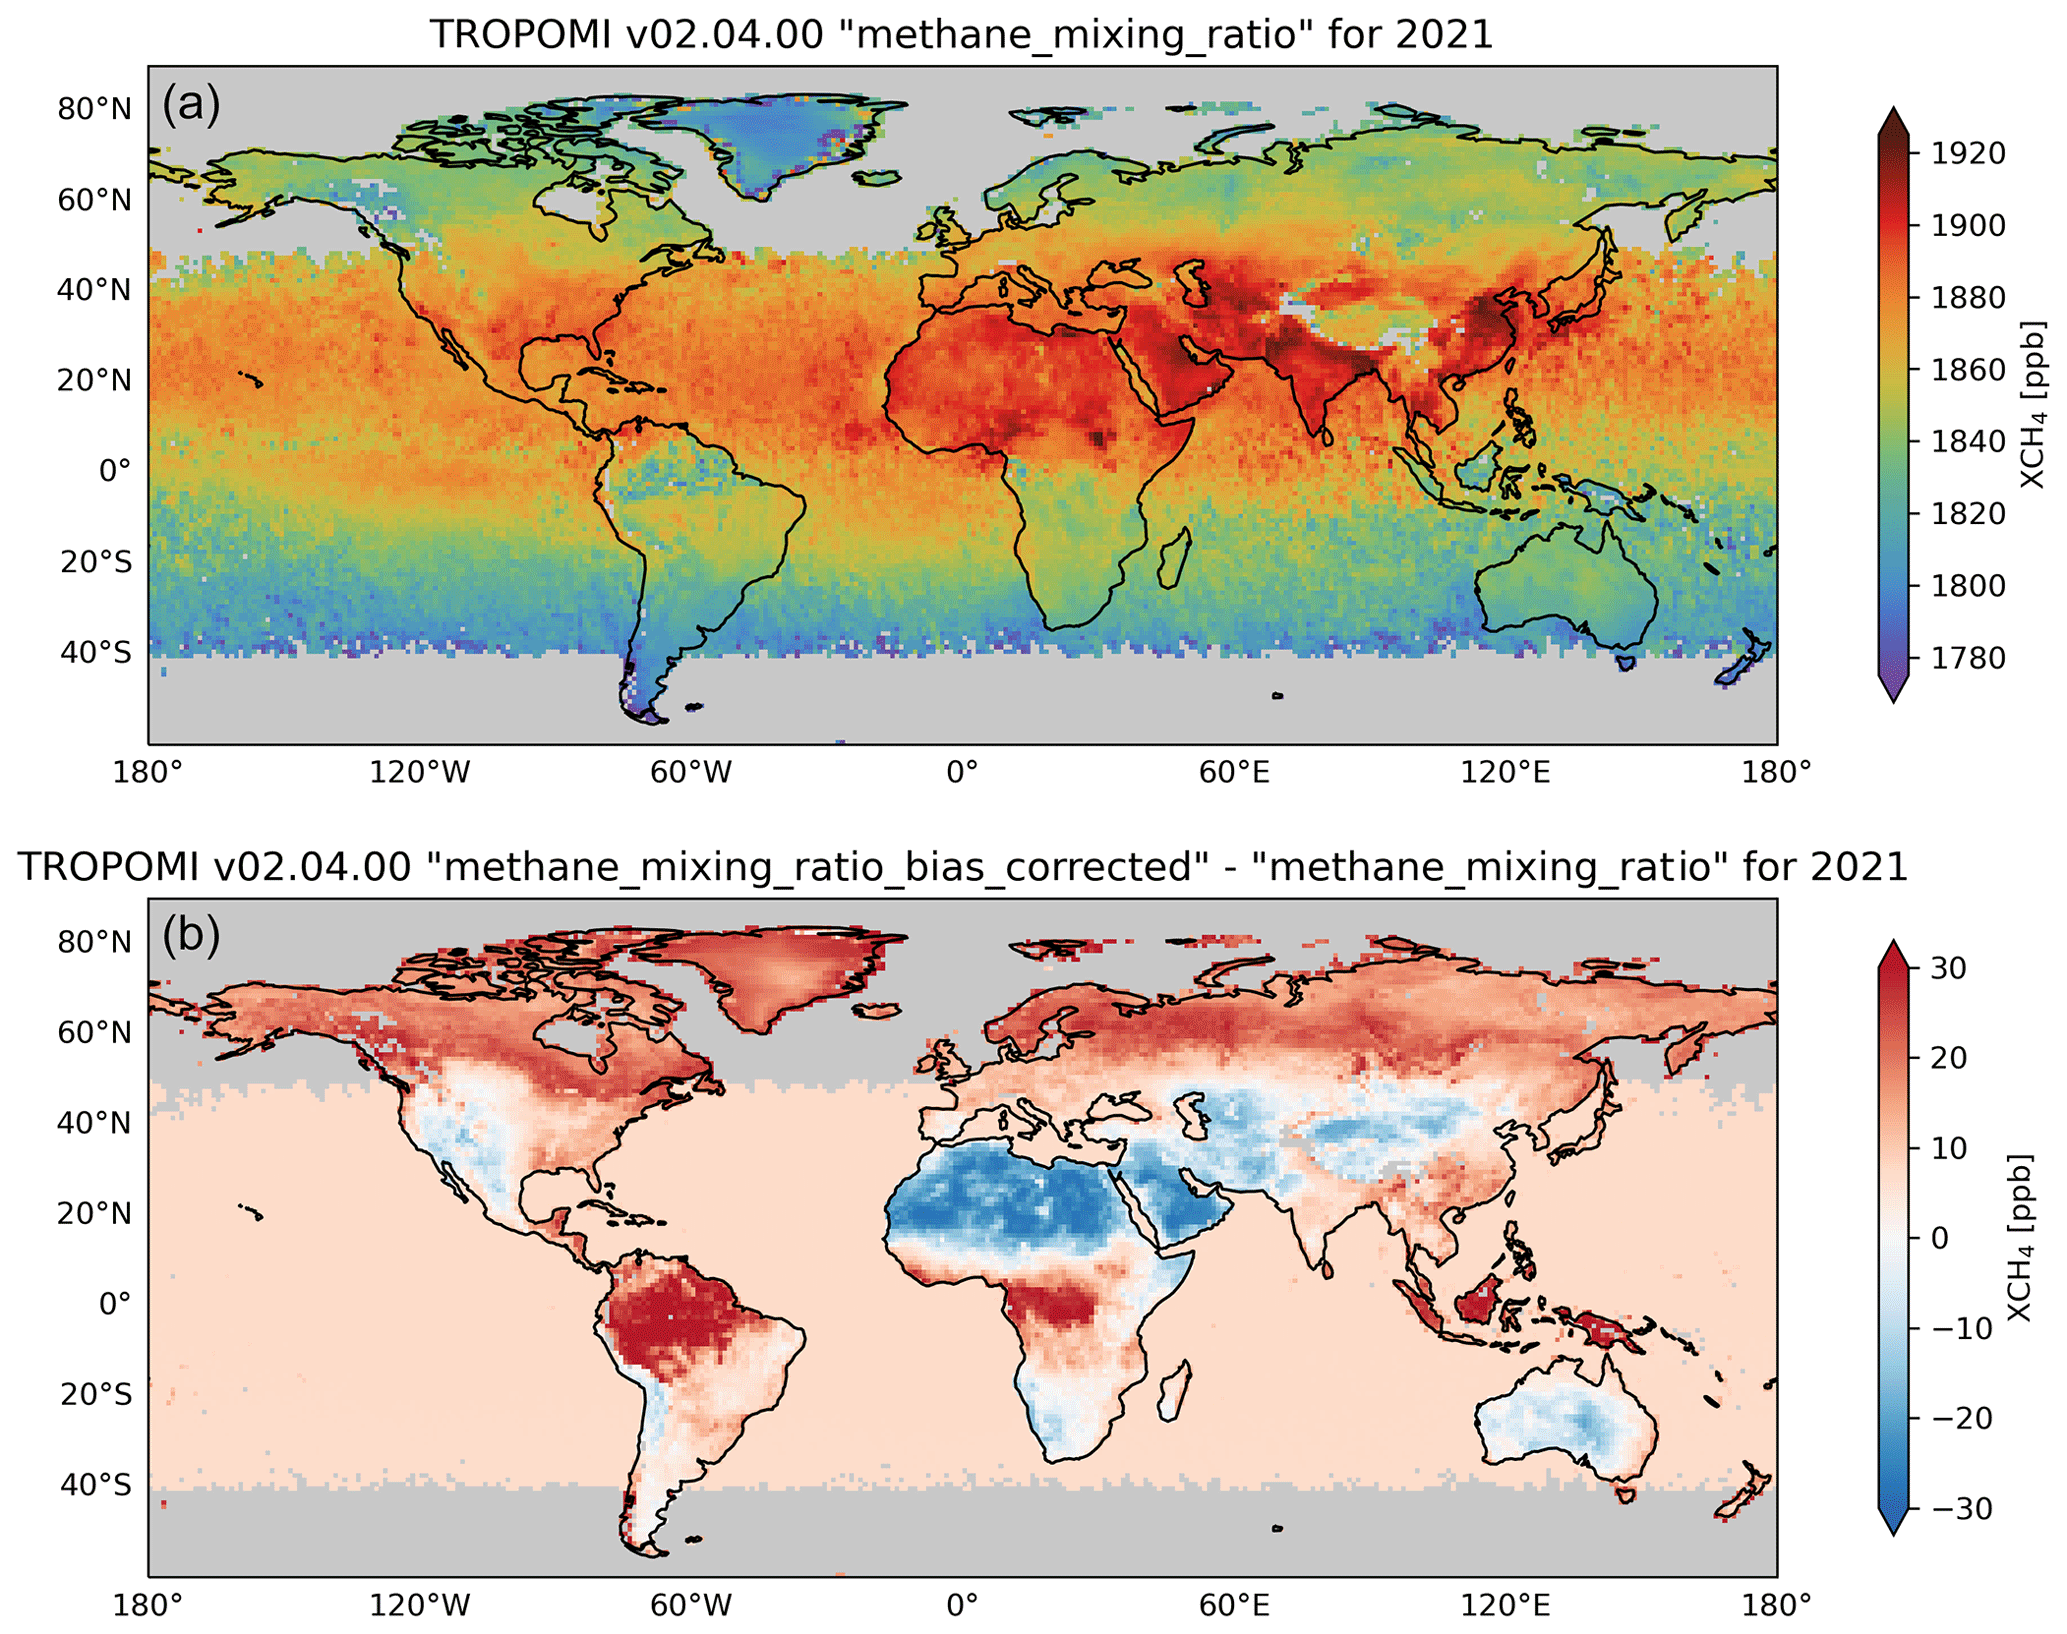
Figure C1TROPOMI operational v02.04.00 XCH4 product for 2021 before the operational albedo bias correction (a) and the operational albedo bias correction (b). The data are annual means and are plotted on a 1∘ × 1∘ grid with data south of 60∘ S cropped for visualization purposes. Gray areas have no TROPOMI data. In the operational files, the top plot corresponds to “methane_mixing_ratio” and the sum of the top and bottom plot corresponds to “methane_mixing_ratio_bias_corrected”.
Retrieval pixels that include both land and water are problematic because of the subpixel albedo contrast. This can result in coastal biases, including for lakes and large rivers, that are not always successfully removed in our blended TROPOMI+GOSAT product. For example, in Fig. D1a, there are enhancements of XCH4 that outline the coast of North Africa. This can be fully avoided by filtering out all retrievals with a “surface_classification” value of 3 (pixel contains mostly water with some land) and retrievals with a “surface_classification” value of 2 (pixel contains mostly land with some water), but this excludes 8 % of the global data. Filtering out all pixels with a surface_classification value of 3 (0.3 % of data) and the subset of retrievals with a surface_classification value of 2 and a SWIR chi-square value greater than 20 000 (see Table 2) largely corrects coastal artifacts while excluding only 0.6 % of the data. Figure D1b shows the pixels that are removed by this filter, and Fig. D1c shows the blended product after removal of these pixels. We keep these coastal pixels in our blended product and leave it to the user to decide what filters to apply.
Figure D1Filtering of coastal pixels in the blended TROPOMI+GOSAT XCH4 product. Panel (a) shows the unfiltered data over North Africa, oversampled on a 0.01∘ × 0.01∘ grid and averaged for 2021. Panel (b) shows our coastal filter excluding all pixels with a surface_classification value of 3 and the subset of pixels with a surface_classification value of 2 and a SWIR chi-square value greater than 20 000 (Table 2). Panel (c) shows the filtered data. Grid cells with less than 10 individual observations contributing to the oversampled average are shown in gray in the top and bottom panels.
The code used for all portions of this project is available at https://github.com/nicholasbalasus/blended_tropomi_gosat_methane (last access: 9 August 2023) and archived on Zenodo at https://doi.org/10.5281/zenodo.8136738 (Balasus, 2023b).
The blended TROPOMI+GOSAT methane product data are available for April 2018–present on Harvard Dataverse at https://dataverse.harvard.edu/dataverse/blended-tropomi-gosat-methane (Balasus, 2023a). The TROPOMI data used here are available at https://s5phub.copernicus.eu/dhus/#/home (ESA, 2023) for April 2018–present. The GOSAT data used here are available at https://doi.org/10.5285/18ef8247f52a4cb6a14013f8235cc1eb (Parker and Boesch, 2020) for 2009–2021. The TCCON data were obtained from the TCCON Data Archive hosted by CaltechDATA at https://tccondata.org (CaltechDATA, 2023).
NB and DJJ designed the study. NB performed the analysis with contributions from AL, JDM, RJP, HB, ZC, MMK, HN, and DJV. NB and DJJ led the writing of the paper with contributions from all co-authors.
The contact author has declared that none of the authors has any competing interests.
Publisher’s note: Copernicus Publications remains neutral with regard to jurisdictional claims in published maps and institutional affiliations.
The authors thank the team that realized the TROPOMI instrument and its data products, consisting of the partnership between Airbus Defense and Space Netherlands, the Royal Netherlands Meteorological Institute (KNMI), SRON, and the Netherlands Organisation for Applied Scientific Research (TNO), commissioned by the Netherlands Space Office (NSO) and the European Space Agency (ESA). Sentinel-5 Precursor is part of the EU Copernicus program, and Copernicus (modified) Sentinel-5P data (2018–2021) have been used. We gratefully acknowledge TCCON site principal investigators for the data used in this work and their guidance on its use. This research used the ALICE high-performance computing facility at the University of Leicester for the GOSAT retrievals and analysis. We thank the Japanese Aerospace Exploration Agency, the National Institute for Environmental Studies, and the Ministry of Environment for the GOSAT data and for their continuous support as part of the joint research agreement.
This work was supported by the NASA Carbon Monitoring System. Nicholas Balasus was supported by the Department of Defense (DoD) through the National Defense Science and Engineering Graduate (NDSEG) fellowship program. Robert J. Parker and Hartmut Boesch are funded via the UK National Centre for Earth Observation (grant nos. NE/R016518/1 and NE/N018079/1) and the ESA GHG-CCI and Copernicus C3S projects (grant no. C3S2_312a_Lot2).
This paper was edited by Sandip Dhomse and reviewed by two anonymous referees.
Aas, K., Jullum, M., and Løland, A.: Explaining individual predictions when features are dependent: More accurate approximations to Shapley values, Artif. Intell., 298, 103502, https://doi.org/10.1016/j.artint.2021.103502, 2021.
Aben, I., Hasekamp, O., and Hartmann, W.: Uncertainties in the space-based measurements of CO2 columns due to scattering in the Earth's atmosphere, J. Quant. Spectrosc. Ra., 104, 450–459, https://doi.org/10.1016/j.jqsrt.2006.09.013, 2007.
Apituley, A., Pedergnana, M., Sneep, M., Veefkind, J. P., Loyola, D., Hasekamp, O., Delgado, A. L., and Borsdorff, T.: Sentinel-5 precursor/TROPOMI Level 2 Product User Manual Methane, v2.4.0, SRON, https://sentinels.copernicus.eu/documents/247904/2474726/Sentinel-5P-Level-2-Product-User-Manual-Methane.pdf (last access: 3 July 2023), 2022.
Balasus, N.: Blended TROPOMI+GOSAT Satellite Data Product for Atmospheric Methane, Harvard Dataverse [data set], https://dataverse.harvard.edu/dataverse/blended-tropomi-gosat-methane (last access: 9 August 2023), 2023a.
Balasus, N.: nicholasbalasus/blended_tropomi_gosat_methane: AMT, Version v2, Zenodo [code], https://doi.org/10.10.5281/zenodo.8136738, 2023b.
Barré, J., Aben, I., Agustí-Panareda, A., Balsamo, G., Bousserez, N., Dueben, P., Engelen, R., Inness, A., Lorente, A., McNorton, J., Peuch, V.-H., Radnoti, G., and Ribas, R.: Systematic detection of local CH4 anomalies by combining satellite measurements with high-resolution forecasts, Atmos. Chem. Phys., 21, 5117–5136, https://doi.org/10.5194/acp-21-5117-2021, 2021.
Belitz, K. and Stackelberg, P. E.: Evaluation of six methods for correcting bias in estimates from ensemble tree machine learning regression models, Environ. Modell. Softw., 139, 105006, https://doi.org/10.1016/j.envsoft.2021.105006, 2021.
Borsdorff, T., aan de Brugh, J., Hu, H., Hasekamp, O., Sussmann, R., Rettinger, M., Hase, F., Gross, J., Schneider, M., Garcia, O., Stremme, W., Grutter, M., Feist, D. G., Arnold, S. G., De Mazière, M., Kumar Sha, M., Pollard, D. F., Kiel, M., Roehl, C., Wennberg, P. O., Toon, G. C., and Landgraf, J.: Mapping carbon monoxide pollution from space down to city scales with daily global coverage, Atmos. Meas. Tech., 11, 5507–5518, https://doi.org/10.5194/amt-11-5507-2018, 2018.
Borsdorff, T., aan de Brugh, J., Schneider, A., Lorente, A., Birk, M., Wagner, G., Kivi, R., Hase, F., Feist, D. G., Sussmann, R., Rettinger, M., Wunch, D., Warneke, T., and Landgraf, J.: Improving the TROPOMI CO data product: update of the spectroscopic database and destriping of single orbits, Atmos. Meas. Tech., 12, 5443–5455, https://doi.org/10.5194/amt-12-5443-2019, 2019.
Breiman, L.: Random Forests, Mach. Learn., 45, 5–32, https://doi.org/10.1023/A:1010933404324, 2001.
Buchwitz, M., Reuter, M., Schneising, O., Boesch, H., Guerlet, S., Dils, B., Aben, I., Armante, R., Bergamaschi, P., Blumenstock, T., Bovensmann, H., Brunner, D., Buchmann, B., Burrows, J. P., Butz, A., Chédin, A., Chevallier, F., Crevoisier, C. D., Deutscher, N. M., Frankenberg, C., Hase, F., Hasekamp, O. P., Heymann, J., Kaminski, T., Laeng, A., Lichtenberg, G., De Mazière, M., Noël, S., Notholt, J., Orphal, J., Popp, C., Parker, R., Scholze, M., Sussmann, R., Stiller, G. P., Warneke, T., Zehner, C., Bril, A., Crisp, D., Griffith, D. W. T., Kuze, A., O'Dell, C., Oshchepkov, S., Sherlock, V., Suto, H., Wennberg, P., Wunch, D., Yokota, T., and Yoshida, Y.: The Greenhouse Gas Climate Change Initiative (GHG-CCI): Comparison and quality assessment of near-surface-sensitive satellite-derived CO2 and CH4 global data sets, Remote Sens. Environ., 162, 344–362, https://doi.org/10.1016/j.rse.2013.04.024, 2015.
Buchwitz, M., Dils, B., Reuter, M., Schneising, O., Hilker, M., Preval, S., Boesch, H., Borsdorff, T., Landgraf, J., and Krisna, T. C.: ESA Climate Change Initiative “Plus” (CCI+) Product Validation and Intercomparison Report (PVIR) version 3 for the Essential Climate Variable (ECV) Greenhouse Gases (GHG), ESA, https://climate.esa.int/media/documents/PVIR_GHG-CCIp_v3_reducedsize.pdf (last access: 27 January 2023), 2022.
Buschmann, M., Petri, C., Palm, M., Warneke, T., Notholt, J., and Engineers, A. S.: TCCON data from Ny-Ålesund, Svalbard, Norway, Release GGG2020R0, CaltechDATA [data set], California Institute of Technology, Pasadena, CA, U.S.A., https://doi.org/10.14291/tccon.ggg2020.nyalesund01.R0, 2022.
Butz, A., Hasekamp, O. P., Frankenberg, C., Vidot, J., and Aben, I.: CH4 retrievals from space-based solar backscatter measurements: Performance evaluation against simulated aerosol and cirrus loaded scenes, J. Geophys. Res., 115, D24302, https://doi.org/10.1029/2010JD014514, 2010.
Butz, A., Galli, A., Hasekamp, O., Landgraf, J., Tol, P., and Aben, I.: TROPOMI aboard Sentinel-5 Precursor: Prospective performance of CH4 retrievals for aerosol and cirrus loaded atmospheres, Remote Sens. Environ., 120, 267–276, https://doi.org/10.1016/j.rse.2011.05.030, 2012.
CaltechDATA: TCCON Data Archive, https://tccondata.org, last access: 18 March 2023.
Carroll, M. L., Townshend, J. R., DiMiceli, C. M., Noojipady, P., and Sohlberg, R. A.: A new global raster water mask at 250 m resolution, Int. J. Digit. Earth, 2, 291–308, https://doi.org/10.1080/17538940902951401, 2009.
Chen, T. and Guestrin, C.: XGBoost: A Scalable Tree Boosting System, in: Proceedings of the 22nd ACM SIGKDD International Conference on Knowledge Discovery and Data Mining, San Francisco, 13 August 2016, 785–794, https://doi.org/10.1145/2939672.2939785, 2016.
De Mazière, M., Sha, M. K., Desmet, F., Hermans, C., Scolas, F., Kumps, N., Zhou, M., Metzger, J.-M., Duflot, V., and Cammas, J.-P.: TCCON data from Réunion Island (La Reunion), France, Release GGG2020R0, CaltechDATA [data set], California Institute of Technology, Pasadena, CA, U.S.A., https://doi.org/10.14291/tccon.ggg2020.reunion01.R0, 2022.
ESA: TROPOMI Methane Product, ESA [data set], https://s5phub.copernicus.eu/dhus/#/home (last access: 9 August 2023), 2023.
Feng, L., Palmer, P. I., Zhu, S., Parker, R. J., and Liu, Y.: Tropical methane emissions explain large fraction of recent changes in global atmospheric methane growth rate, Nat. Commun., 13, 1378, https://doi.org/10.1038/s41467-022-28989-z, 2022.
Frankenberg, C., Meirink, J. F., van Weele, M., Platt, U., and Wagner, T.: Assessing Methane Emissions from Global Space-Borne Observations, Science, 308, 1010–1014, https://doi.org/10.1126/science.1106644, 2005.
García, O. E., Schneider, M., Herkommer, B., Gross, J., Hase, F., Blumenstock, T., and Sepúlveda, E.: TCCON data from Izaña, Tenerife, Spain, Release GGG2020R01, CaltechDATA [data set], California Institute of Technology, Pasadena, CA, U.S.A., https://doi.org/10.14291/tccon.ggg2020.izana01.R1, 2022.
Hase, F., Blumenstock, T., Dohe, S., Groß, J., and Kiel, M.: TCCON data from Karlsruhe, Germany, Release GGG2020R0, CaltechDATA [data set], California Institute of Technology, Pasadena, CA, U.S.A., https://doi.org/10.14291/tccon.ggg2020.karlsruhe01.R0, 2022.
Hasekamp, O., Lorente, A., Hu, H., Butz, A., Aan de Brugh, J., and Landgraf, J.: Algorithm Theoretical Baseline Document for Sentinel-5 Precursor Methane Retrieval, v2.4.0, SRON, https://sentinels.copernicus.eu/documents/247904/2476257/Sentinel-5P-TROPOMI-ATBD-Methane-retrieval.pdf (last access: 3 July 2023), 2022.
Iraci, L., Podolske, J., Roehl, C., Wennberg, P. O., Blavier, J.-F., Allen, N., Wunch, D., and Osterman, G.: TCCON data from Armstrong Flight Research Center, Edwards, CA, USA, Release GGG2020R0, CaltechDATA [data set], California Institute of Technology, Pasadena, CA, U.S.A., https://doi.org/10.14291/tccon.ggg2020.edwards01.R0, 2022.
Jacob, D. J., Turner, A. J., Maasakkers, J. D., Sheng, J., Sun, K., Liu, X., Chance, K., Aben, I., McKeever, J., and Frankenberg, C.: Satellite observations of atmospheric methane and their value for quantifying methane emissions, Atmos. Chem. Phys., 16, 14371–14396, https://doi.org/10.5194/acp-16-14371-2016, 2016.
Jacob, D. J., Varon, D. J., Cusworth, D. H., Dennison, P. E., Frankenberg, C., Gautam, R., Guanter, L., Kelley, J., McKeever, J., Ott, L. E., Poulter, B., Qu, Z., Thorpe, A. K., Worden, J. R., and Duren, R. M.: Quantifying methane emissions from the global scale down to point sources using satellite observations of atmospheric methane, Atmos. Chem. Phys., 22, 9617–9646, https://doi.org/10.5194/acp-22-9617-2022, 2022.
Janardanan, R., Maksyutov, S., Tsuruta, A., Wang, F., Tiwari, Y. K., Valsala, V., Ito, A., Yoshida, Y., Kaiser, J. W., Janssens-Maenhout, G., Arshinov, M., Sasakawa, M., Tohjima, Y., Worthy, D. E. J., Dlugokencky, E. J., Ramonet, M., Arduini, J., Lavric, J. V., Piacentino, S., Krummel, P. B., Langenfelds, R. L., Mammarella, I., and Matsunaga, T.: Country-Scale Analysis of Methane Emissions with a High-Resolution Inverse Model Using GOSAT and Surface Observations, Remote Sensing, 12, 375, https://doi.org/10.3390/rs12030375, 2020.
Jongaramrungruang, S., Matheou, G., Thorpe, A. K., Zeng, Z.-C., and Frankenberg, C.: Remote sensing of methane plumes: instrument tradeoff analysis for detecting and quantifying local sources at global scale, Atmos. Meas. Tech., 14, 7999–8017, https://doi.org/10.5194/amt-14-7999-2021, 2021.
Ke, G., Meng, Q., Finley, T., Wang, T., Chen, W., Ma, W., Ye, Q., and Liu, T.: LightGBM: A Highly Efficient Gradient Boosting Decision Tree, in: Advances in Neural Information Processing Systems, https://proceedings.neurips.cc/paper_files/paper/2017/file/6449f44a102fde848669bdd9eb6b76fa-Paper.pdf (last access: 9 August 2023), 2017.
Kingsford, C. and Salzberg, S. L.: What are decision trees?, Nat. Biotechnol., 26, 1011–1013, https://doi.org/10.1038/nbt0908-1011, 2008.
Kivi, R., Heikkinen, P., and Kyro, E.: TCCON data from Sodankylä, Finland, Release GGG2020R0, CaltechDATA [data set], California Institute of Technology, Pasadena, CA, U.S.A., https://doi.org/10.14291/tccon.ggg2020.sodankyla01.R0, 2022.
Kuze, A., Suto, H., Shiomi, K., Kawakami, S., Tanaka, M., Ueda, Y., Deguchi, A., Yoshida, J., Yamamoto, Y., Kataoka, F., Taylor, T. E., and Buijs, H. L.: Update on GOSAT TANSO-FTS performance, operations, and data products after more than 6 years in space, Atmos. Meas. Tech., 9, 2445–2461, https://doi.org/10.5194/amt-9-2445-2016, 2016.
Lauvaux, T., Giron, C., Mazzolini, M., d'Aspremont, A., Duren, R., Cusworth, D., Shindell, D., and Ciais, P.: Global assessment of oil and gas methane ultra-emitters, Science, 375, 557–561, https://doi.org/10.1126/science.abj4351, 2022.
Liu, C., Wang, W., and Sun, Y.: TCCON data from Hefei, China, Release GGG2020R0, CaltechDATA [data set], California Institute of Technology, Pasadena, CA, U.S.A., https://doi.org/10.14291/tccon.ggg2020.hefei01.R0, 2022.
Liu, M., van der A, R., van Weele, M., Eskes, H., Lu, X., Veefkind, P., de Laat, J., Kong, H., Wang, J., Sun, J., Ding, J., Zhao, Y., and Weng, H.: A New Divergence Method to Quantify Methane Emissions Using Observations of Sentinel-5P TROPOMI, Geophys. Res. Lett., 48, e2021GL094151, https://doi.org/10.1029/2021GL094151, 2021.
Lorente, A., Borsdorff, T., Butz, A., Hasekamp, O., aan de Brugh, J., Schneider, A., Wu, L., Hase, F., Kivi, R., Wunch, D., Pollard, D. F., Shiomi, K., Deutscher, N. M., Velazco, V. A., Roehl, C. M., Wennberg, P. O., Warneke, T., and Landgraf, J.: Methane retrieved from TROPOMI: improvement of the data product and validation of the first 2 years of measurements, Atmos. Meas. Tech., 14, 665–684, https://doi.org/10.5194/amt-14-665-2021, 2021.
Lorente, A., Borsdorff, T., Martinez-Velarte, M. C., Butz, A., Hasekamp, O. P., Wu, L., and Landgraf, J.: Evaluation of the methane full-physics retrieval applied to TROPOMI ocean sun glint measurements, Atmos. Meas. Tech., 15, 6585–6603, https://doi.org/10.5194/amt-15-6585-2022, 2022.
Lorente, A., Borsdorff, T., Martinez-Velarte, M. C., and Landgraf, J.: Accounting for surface reflectance spectral features in TROPOMI methane retrievals, Atmos. Meas. Tech., 16, 1597–1608, https://doi.org/10.5194/amt-16-1597-2023, 2023.
Lundberg, S. M., Erion, G., Chen, H., DeGrave, A., Prutkin, J. M., Nair, B., Katz, R., Himmelfarb, J., Bansal, N., and Lee, S.-I.: From local explanations to global understanding with explainable AI for trees, Nature Machine Intelligence, 2, 56–67, https://doi.org/10.1038/s42256-019-0138-9, 2020.
Maasakkers, J. D., Jacob, D. J., Sulprizio, M. P., Scarpelli, T. R., Nesser, H., Sheng, J.-X., Zhang, Y., Hersher, M., Bloom, A. A., Bowman, K. W., Worden, J. R., Janssens-Maenhout, G., and Parker, R. J.: Global distribution of methane emissions, emission trends, and OH concentrations and trends inferred from an inversion of GOSAT satellite data for 2010–2015, Atmos. Chem. Phys., 19, 7859–7881, https://doi.org/10.5194/acp-19-7859-2019, 2019.
Maasakkers, J. D., Jacob, D. J., Sulprizio, M. P., Scarpelli, T. R., Nesser, H., Sheng, J., Zhang, Y., Lu, X., Bloom, A. A., Bowman, K. W., Worden, J. R., and Parker, R. J.: 2010–2015 North American methane emissions, sectoral contributions, and trends: a high-resolution inversion of GOSAT observations of atmospheric methane, Atmos. Chem. Phys., 21, 4339–4356, https://doi.org/10.5194/acp-21-4339-2021, 2021.
Morino, I., Ohyama, H., Hori, A., and Ikegami, H.: TCCON data from Rikubetsu, Hokkaido, Japan, Release GGG2020R0, CaltechDATA [data set], California Institute of Technology, Pasadena, CA, U.S.A., https://doi.org/10.14291/tccon.ggg2020.rikubetsu01.R0, 2022a.
Morino, I., Ohyama, H., Hori, A., and Ikegami, H.: TCCON data from Tsukuba, Ibaraki, Japan, 125HR, Release GGG2020R0, CaltechDATA [data set], California Institute of Technology, Pasadena, CA, U.S.A., https://doi.org/10.14291/tccon.ggg2020.tsukuba02.R0, 2022b.
Morino, I., Velazco, V. A., Hori, A., Uchino, O., and Griffith, D. W. T.: TCCON data from Burgos, Philippines, Release GGG2020R0, CaltechDATA [data set], California Institute of Technology, Pasadena, CA, U.S.A., https://doi.org/10.14291/tccon.ggg2020.burgos01.R0, 2022c.
Nisbet, E. G., Fisher, R. E., Lowry, D., France, J. L., Allen, G., Bakkaloglu, S., Broderick, T. J., Cain, M., Coleman, M., Fernandez, J., Forster, G., Griffiths, P. T., Iverach, C. P., Kelly, B. F. J., Manning, M. R., Nisbet-Jones, P. B. R., Pyle, J. A., Townsend-Small, A., al-Shalaan, A., Warwick, N., and Zazzeri, G.: Methane Mitigation: Methods to Reduce Emissions, on the Path to the Paris Agreement, Rev. Geophys., 58, e2019RG000675, https://doi.org/10.1029/2019RG000675, 2020.
Notholt, J., Petri, C., Warneke, T., Deutscher, N., Buschmann, M., Weinzierl, C., Macatangay, R., and Grupe, P.: TCCON data from Bremen, Germany, Release GGG2020R0, CaltechDATA [data set], California Institute of Technology, Pasadena, CA, U.S.A., https://doi.org/10.14291/tccon.ggg2020.bremen01.R0, 2022.
Ouyang, Z., Jackson, R. B., McNicol, G., Fluet-Chouinard, E., Runkle, B. R. K., Papale, D., Knox, S. H., Cooley, S., Delwiche, K. B., Feron, S., Irvin, J. A., Malhotra, A., Muddasir, M., Sabbatini, S., Alberto, Ma. C. R., Cescatti, A., Chen, C.-L., Dong, J., Fong, B. N., Guo, H., Hao, L., Iwata, H., Jia, Q., Ju, W., Kang, M., Li, H., Kim, J., Reba, M. L., Nayak, A. K., Roberti, D. R., Ryu, Y., Swain, C. K., Tsuang, B., Xiao, X., Yuan, W., Zhang, G., and Zhang, Y.: Paddy rice methane emissions across Monsoon Asia, Remote Sens. Environ., 284, 113335, https://doi.org/10.1016/j.rse.2022.113335, 2023.
Palmer, P. I., Feng, L., Lunt, M. F., Parker, R. J., Bösch, H., Lan, X., Lorente, A., and Borsdorff, T.: The added value of satellite observations of methane for understanding the contemporary methane budget, Philos. T. Roy. Soc. A., 379, 20210106, https://doi.org/10.1098/rsta.2021.0106, 2021.
Parker, R. and Boesch, H.: University of Leicester GOSAT Proxy XCH4 v9.0, Centre for Environmental Data Analysis [data set], https://doi.org/10.5285/18ef8247f52a4cb6a14013f8235cc1eb, 2020.
Parker, R., Boesch, H., Cogan, A., Fraser, A., Feng, L., Palmer, P. I., Messerschmidt, J., Deutscher, N., Griffith, D. W. T., Notholt, J., Wennberg, P. O., and Wunch, D.: Methane observations from the Greenhouse Gases Observing SATellite: Comparison to ground-based TCCON data and model calculations, Geophys. Res. Lett., 38, L15807, https://doi.org/10.1029/2011GL047871, 2011.
Parker, R. J., Webb, A., Boesch, H., Somkuti, P., Barrio Guillo, R., Di Noia, A., Kalaitzi, N., Anand, J. S., Bergamaschi, P., Chevallier, F., Palmer, P. I., Feng, L., Deutscher, N. M., Feist, D. G., Griffith, D. W. T., Hase, F., Kivi, R., Morino, I., Notholt, J., Oh, Y.-S., Ohyama, H., Petri, C., Pollard, D. F., Roehl, C., Sha, M. K., Shiomi, K., Strong, K., Sussmann, R., Té, Y., Velazco, V. A., Warneke, T., Wennberg, P. O., and Wunch, D.: A decade of GOSAT Proxy satellite CH4 observations, Earth Syst. Sci. Data, 12, 3383–3412, https://doi.org/10.5194/essd-12-3383-2020, 2020.
Petri, C., Vrekoussis, M., Rousogenous, C., Warneke, T., Sciare, J., and Notholt, J.: TCCON data from Nicosia, Cyprus, Release GGG2020R0, CaltechDATA [data set], California Institute of Technology, Pasadena, CA, U.S.A., https://doi.org/10.14291/tccon.ggg2020.nicosia01.R0, 2023.
Pollard, D., Robinson, J., and Shiona, H.: TCCON data from Lauder, New Zealand, 125HR, Release GGG2020R0, CaltechDATA [data set], California Institute of Technology, Pasadena, CA, U.S.A., https://doi.org/10.14291/tccon.ggg2020.lauder03.R0, 2022.
Prather, M. J., Holmes, C. D., and Hsu, J.: Reactive greenhouse gas scenarios: Systematic exploration of uncertainties and the role of atmospheric chemistry, Geophys. Res. Lett., 39, L09803, https://doi.org/10.1029/2012GL051440, 2012.
Qu, Z., Jacob, D. J., Shen, L., Lu, X., Zhang, Y., Scarpelli, T. R., Nesser, H., Sulprizio, M. P., Maasakkers, J. D., Bloom, A. A., Worden, J. R., Parker, R. J., and Delgado, A. L.: Global distribution of methane emissions: a comparative inverse analysis of observations from the TROPOMI and GOSAT satellite instruments, Atmos. Chem. Phys., 21, 14159–14175, https://doi.org/10.5194/acp-21-14159-2021, 2021.
Rodgers, C. D. and Connor, B. J.: Intercomparison of remote sounding instruments, J. Geophys. Res., 108, 4116, https://doi.org/10.1029/2002JD002299, 2003.
Saunois, M., Stavert, A. R., Poulter, B., Bousquet, P., Canadell, J. G., Jackson, R. B., Raymond, P. A., Dlugokencky, E. J., Houweling, S., Patra, P. K., Ciais, P., Arora, V. K., Bastviken, D., Bergamaschi, P., Blake, D. R., Brailsford, G., Bruhwiler, L., Carlson, K. M., Carrol, M., Castaldi, S., Chandra, N., Crevoisier, C., Crill, P. M., Covey, K., Curry, C. L., Etiope, G., Frankenberg, C., Gedney, N., Hegglin, M. I., Höglund-Isaksson, L., Hugelius, G., Ishizawa, M., Ito, A., Janssens-Maenhout, G., Jensen, K. M., Joos, F., Kleinen, T., Krummel, P. B., Langenfelds, R. L., Laruelle, G. G., Liu, L., Machida, T., Maksyutov, S., McDonald, K. C., McNorton, J., Miller, P. A., Melton, J. R., Morino, I., Müller, J., Murguia-Flores, F., Naik, V., Niwa, Y., Noce, S., O'Doherty, S., Parker, R. J., Peng, C., Peng, S., Peters, G. P., Prigent, C., Prinn, R., Ramonet, M., Regnier, P., Riley, W. J., Rosentreter, J. A., Segers, A., Simpson, I. J., Shi, H., Smith, S. J., Steele, L. P., Thornton, B. F., Tian, H., Tohjima, Y., Tubiello, F. N., Tsuruta, A., Viovy, N., Voulgarakis, A., Weber, T. S., van Weele, M., van der Werf, G. R., Weiss, R. F., Worthy, D., Wunch, D., Yin, Y., Yoshida, Y., Zhang, W., Zhang, Z., Zhao, Y., Zheng, B., Zhu, Q., Zhu, Q., and Zhuang, Q.: The Global Methane Budget 2000–2017, Earth Syst. Sci. Data, 12, 1561–1623, https://doi.org/10.5194/essd-12-1561-2020, 2020.
Schepers, D., Guerlet, S., Butz, A., Landgraf, J., Frankenberg, C., Hasekamp, O., Blavier, J.-F., Deutscher, N. M., Griffith, D. W. T., Hase, F., Kyro, E., Morino, I., Sherlock, V., Sussmann, R., and Aben, I.: Methane retrievals from Greenhouse Gases Observing Satellite (GOSAT) shortwave infrared measurements: Performance comparison of proxy and physics retrieval algorithms, J. Geophys. Res., 117, D10307, https://doi.org/10.1029/2012JD017549, 2012.
Schneising, O., Buchwitz, M., Reuter, M., Bovensmann, H., Burrows, J. P., Borsdorff, T., Deutscher, N. M., Feist, D. G., Griffith, D. W. T., Hase, F., Hermans, C., Iraci, L. T., Kivi, R., Landgraf, J., Morino, I., Notholt, J., Petri, C., Pollard, D. F., Roche, S., Shiomi, K., Strong, K., Sussmann, R., Velazco, V. A., Warneke, T., and Wunch, D.: A scientific algorithm to simultaneously retrieve carbon monoxide and methane from TROPOMI onboard Sentinel-5 Precursor, Atmos. Meas. Tech., 12, 6771–6802, https://doi.org/10.5194/amt-12-6771-2019, 2019.
Schneising, O., Buchwitz, M., Hachmeister, J., Vanselow, S., Reuter, M., Buschmann, M., Bovensmann, H., and Burrows, J. P.: Advances in retrieving XCH4 and XCO from Sentinel-5 Precursor: improvements in the scientific TROPOMI/WFMD algorithm, Atmos. Meas. Tech., 16, 669–694, https://doi.org/10.5194/amt-16-669-2023, 2023.
Senghor, H., Machu, É., Hourdin, F., and Gaye, A. T.: Seasonal cycle of desert aerosols in western Africa: analysis of the coastal transition with passive and active sensors, Atmos. Chem. Phys., 17, 8395–8410, https://doi.org/10.5194/acp-17-8395-2017, 2017.
Shao, Y. and Dong, C. H.: A review on East Asian dust storm climate, modelling and monitoring, Global Planet. Change, 52, 1–22, https://doi.org/10.1016/j.gloplacha.2006.02.011, 2006.
Sherlock, V., Connor, B., Robinson, J., Shiona, H., Smale, D., and Pollard, D. F.: TCCON data from Lauder (NZ), 125HR, Release GGG2020.R0, CaltechDATA [data set], California Institute of Technology, Pasadena, CA, U.S.A., https://doi.org/10.14291/tccon.ggg2020.lauder02.R0, 2022.
Shiomi, K., Kawakami, S., Ohyama, H., Arai, K., Okumura, H., Ikegami, H., and Usami, M.: TCCON data from Saga, Japan, Release GGG2020R0, CaltechDATA [data set], California Institute of Technology, Pasadena, CA, U.S.A., https://doi.org/10.14291/tccon.ggg2020.saga01.R0, 2022.
Silva, S. J., Keller, C. A., and Hardin, J.: Using an Explainable Machine Learning Approach to Characterize Earth System Model Errors: Application of SHAP Analysis to Modeling Lightning Flash Occurrence, J. Adv. Model. Earth Sy., 14, e2021MS002881, https://doi.org/10.1029/2021MS002881, 2022.
Strong, K., Roche, S., Franklin, J. E., Mendonca, J., Lutsch, E., Weaver, D., Fogal, P. F., Drummond, J. R., Batchelor, R., and Lindenmaier, R.: TCCON data from Eureka, Canada, Release GGG2020R0, CaltechDATA [data set], California Institute of Technology, Pasadena, CA, U.S.A., https://doi.org/10.14291/tccon.ggg2020.eureka01.R0, 2022.
Sussmann, R. and Rettinger, M.: TCCON data from Garmisch, Germany, Release GGG2020R0, CaltechDATA [data set], California Institute of Technology, Pasadena, CA, U.S.A., https://doi.org/10.14291/tccon.ggg2020.garmisch01.R0, 2023.
Szopa, S., Naik, V., Adhikary, B., Artaxo, P., Berntsen, T., Collins, W. D., Fuzzi, S., Gallardo, L., Kiendler-Scharr, A., Kilmont, Z., Liao, H., Unger, N., and Zanis, P.: Short-Lived Climate Forcers, in: Climate Change 2021: The Physical Science Basis. Contribution of Working Group I to the Sixth Assessment Report of the Intergovernmental Panel on Climate Change, edited by: Masson-Delmotte, V., Zhai, P., Pirani, A., Connors, S. L., Péan, C., Berger, S., Caud, N., Chen, Y., Goldfarb, L., Gomis, M. I., Huang, M., Leitzell, K., Lonnoy, E., Matthews, J. B. R., Maycock, T. K., Waterfield, T., Yelekçi, O., Yu, R., and Zhou, B., Cambridge University Press, https://www.ipcc.ch/report/ar6/wg1/downloads/report/IPCC_AR6_WGI_Chapter06.pdf (last access: 27 January 2023), 2021.
Te, Y., Jeseck, P., and Janssen, C.: TCCON data from Paris, France, Release GGG2020R0, CaltechDATA [data set], California Institute of Technology, Pasadena, CA, U.S.A., https://doi.org/10.14291/tccon.ggg2020.paris01.R0, 2022.
Turner, A. J., Jacob, D. J., Wecht, K. J., Maasakkers, J. D., Lundgren, E., Andrews, A. E., Biraud, S. C., Boesch, H., Bowman, K. W., Deutscher, N. M., Dubey, M. K., Griffith, D. W. T., Hase, F., Kuze, A., Notholt, J., Ohyama, H., Parker, R., Payne, V. H., Sussmann, R., Sweeney, C., Velazco, V. A., Warneke, T., Wennberg, P. O., and Wunch, D.: Estimating global and North American methane emissions with high spatial resolution using GOSAT satellite data, Atmos. Chem. Phys., 15, 7049–7069, https://doi.org/10.5194/acp-15-7049-2015, 2015.
USGS: Global Land Cover Characteristics Data Base Version 2.0, https://lta.cr.usgs.gov/glcc/globdoc2_0 (last access: 27 January 2023), 2018.
Wang, C., Wu, Q., Weimer, M., and Zhu, E.: FLAML: A Fast and Lightweight AutoML Library, in: Proceedings of Machine Learning and Systems, 434–447, https://proceedings.mlsys.org/paper_files/paper/2021/file/1ccc3bfa05cb37b917068778f3c4523a-Paper.pdf (last access: 9 August 2023), 2021.
Warneke, T., Messerschmidt, J., Notholt, J., Weinzierl, C., Deutscher, N., Petri, C., Grupe, P., Vuillemin, C., Truong, F., Schmidt, M., Ramonet, M., and Parmentier, E.: TCCON data from Orléans, France, Release GGG2020R0, CaltechDATA [data set], California Institute of Technology, Pasadena, CA, U.S.A., https://doi.org/10.14291/tccon.ggg2020.orleans01.R0, 2022.
Wennberg, P. O., Roehl, C., Blavier, J.-F., Wunch, D., Landeros, J., and Allen, N.: TCCON data from Jet Propulsion Laboratory, Pasadena, California, USA, Release GGG2020R0, CaltechDATA [data set], California Institute of Technology, Pasadena, CA, U.S.A., https://doi.org/10.14291/tccon.ggg2020.jpl02.R0, 2022a.
Wennberg, P. O., Roehl, C., Wunch, D., Toon, G. C., Blavier, J.-F., Washenfelder, R., Keppel-Aleks, G., Allen, N., and Ayers, J.: TCCON data from Park Falls, Wisconsin, USA, Release GGG2020R1, CaltechDATA [data set], California Institute of Technology, Pasadena, CA, U.S.A., https://doi.org/10.14291/tccon.ggg2020.parkfalls01.R1, 2022b.
Wennberg, P. O., Wunch, D., Roehl, C., Blavier, J.-F., Toon, G. C., and Allen, N.: TCCON data from California Institute of Technology, Pasadena, California, USA, Release GGG2020R0, CaltechDATA [data set], California Institute of Technology, Pasadena, CA, U.S.A., https://doi.org/10.14291/tccon.ggg2020.pasadena01.R0, 2022c.
Wennberg, P. O., Wunch, D., Roehl, C., Blavier, J.-F., Toon, G. C., Allen, N., Dowell, P., Teske, K., Martin, C., and Martin, J.: TCCON data from Lamont, Oklahoma, USA, Release GGG2020R0, CaltechDATA [data set], California Institute of Technology, Pasadena, CA, U.S.A., https://doi.org/10.14291/tccon.ggg2020.lamont01.R0, 2022d.
Western, L. M., Ramsden, A. E., Ganesan, A. L., Boesch, H., Parker, R. J., Scarpelli, T. R., Tunnicliffe, R. L., and Rigby, M.: Estimates of North African Methane Emissions from 2010 to 2017 Using GOSAT Observations, Environ. Sci. Tech. Let., 8, 626–632, https://doi.org/10.1021/acs.estlett.1c00327, 2021.
Worden, J. R., Cusworth, D. H., Qu, Z., Yin, Y., Zhang, Y., Bloom, A. A., Ma, S., Byrne, B. K., Scarpelli, T., Maasakkers, J. D., Crisp, D., Duren, R., and Jacob, D. J.: The 2019 methane budget and uncertainties at 1∘ resolution and each country through Bayesian integration Of GOSAT total column methane data and a priori inventory estimates, Atmos. Chem. Phys., 22, 6811–6841, https://doi.org/10.5194/acp-22-6811-2022, 2022.
Wunch, D., Toon, G. C., Blavier, J.-F. L., Washenfelder, R. A., Notholt, J., Connor, B. J., Griffith, D. W. T., Sherlock, V., and Wennberg, P. O.: The Total Carbon Column Observing Network, Philos. T. Roy. Soc. A., 369, 2087–2112, https://doi.org/10.1098/rsta.2010.0240, 2011.
Wunch, D., Mendonca, J., Colebatch, O., Allen, N., Blavier, J.-F. L., Kunz, K., Roche, S., Hedelius, J., Neufeld, G., Springett, S., Worthy, D., Kessler, R., and Strong, K.: TCCON data from East Trout Lake, Canada, Release GGG2020R0, CaltechDATA [data set], California Institute of Technology, Pasadena, CA, U.S.A., https://doi.org/10.14291/tccon.ggg2020.easttroutlake01.R0, 2022.
Yang, Y., Zhou, M., Langerock, B., Sha, M. K., Hermans, C., Wang, T., Ji, D., Vigouroux, C., Kumps, N., Wang, G., De Mazière, M., and Wang, P.: New ground-based Fourier-transform near-infrared solar absorption measurements of XCO2, XCH4 and XCO at Xianghe, China, Earth Syst. Sci. Data, 12, 1679–1696, https://doi.org/10.5194/essd-12-1679-2020, 2020.
Zhang, G. and Lu, Y.: Bias-corrected random forests in regression, J. Appl. Stat., 39, 151–160, https://doi.org/10.1080/02664763.2011.578621, 2012.
Zhou, M., Wang, P., Kumps, N., Hermans, C., and Nan, W.: TCCON data from Xianghe China, Release GGG2020.R0, CaltechDATA [data set], California Institute of Technology, Pasadena, CA, U.S.A., https://doi.org/10.14291/tccon.ggg2020.xianghe01.R0, 2022.
Zhu, L., Jacob, D. J., Keutsch, F. N., Mickley, L. J., Scheffe, R., Strum, M., González Abad, G., Chance, K., Yang, K., Rappenglück, B., Millet, D. B., Baasandorj, M., Jaeglé, L., and Shah, V.: Formaldehyde (HCHO) As a Hazardous Air Pollutant: Mapping Surface Air Concentrations from Satellite and Inferring Cancer Risks in the United States, Environ. Sci. Technol., 51, 5650–5657, https://doi.org/10.1021/acs.est.7b01356, 2017.
- Abstract
- Introduction
- Construction of the blended TROPOMI+GOSAT product
- Evaluation of the blended TROPOMI+GOSAT product
- Overview of the blended TROPOMI+GOSAT product
- Conclusions
- Appendix A: Adjustment of TROPOMI, GOSAT, and TCCON data to common averaging kernel sensitivities and prior vertical profiles
- Appendix B: Evaluation with TCCON data
- Appendix C: Comparison to the operational TROPOMI bias correction
- Appendix D: Filtering coastal TROPOMI scenes
- Code availability
- Data availability
- Author contributions
- Competing interests
- Disclaimer
- Acknowledgements
- Financial support
- Review statement
- References