the Creative Commons Attribution 4.0 License.
the Creative Commons Attribution 4.0 License.
Evaluating the performance of a Picarro G2207-i analyser for high-precision atmospheric O2 measurements
Andrew C. Manning
Penelope A. Pickers
Grant L. Forster
Alex J. Etchells
Fluxes of oxygen (O2) and carbon dioxide (CO2) in and out of the atmosphere are strongly coupled for terrestrial biospheric exchange processes and fossil fuel combustion but are uncoupled for oceanic air–sea gas exchange. High-precision measurements of both species can therefore provide constraints on the carbon cycle and can be used to quantify fossil fuel CO2 (ffCO2) emission estimates. In the case of O2, however, due to its large atmospheric mole fraction (∼20.9 %) it is very challenging to measure small variations to the degree of precision and accuracy required for these applications. We have tested an atmospheric O2 analyser based on the principle of cavity ring-down spectroscopy (Picarro Inc., model G2207-i), both in the laboratory and at the Weybourne Atmospheric Observatory (WAO) field station in the UK, in comparison to well-established, pre-existing atmospheric O2 and CO2 measurement systems.
In laboratory tests analysing dry air in high-pressure cylinders, we found that the best precision was achieved with 30 min averaging and was ±0.5 ppm ( per meg). Also from continuous measurements from a cylinder of dry air, we found the 24 h peak-to-peak range of hourly averaged values to be 1.2 ppm (∼5.8 per meg). These results are close to atmospheric O2 compatibility goals as set by the UN World Meteorological Organization. However, from measurements of ambient air conducted at WAO we found that the built-in water correction of the G2207-i does not sufficiently correct for the influence of water vapour on the O2 mole fraction. When sample air was dried and a 5-hourly baseline correction with a reference gas cylinder was employed, the G2207-i's results showed an average difference from the established O2 analyser of 13.6±7.5 per meg (over 2 weeks of continuous measurements). Over the same period, based on measurements of a so-called “target tank”, analysed for 12 min every 7 h, we calculated a repeatability of per meg and a compatibility of per meg for the G2207-i. To further examine the G2207-i's performance in real-world applications we used ambient air measurements of O2 together with concurrent CO2 measurements to calculate ffCO2. Due to the imprecision of the G2207-i, the ffCO2 calculated showed large differences from that calculated from the established measurement system and had a large uncertainty of ±13.0 ppm, which was roughly double that from the established system (±5.8 ppm).
- Article
(2196 KB) - Full-text XML
- BibTeX
- EndNote
Oxygen (O2) is the most abundant molecule in the atmosphere after nitrogen (N2), with an atmospheric background mole fraction of approximately 20.9 %. Due to this large atmospheric background, O2 measurements are sensitive to variations in the mole fractions of other atmospheric species, such as carbon dioxide (CO2), due to dilution effects. O2 measurements are therefore typically reported on a relative scale calculated as the change in the ratio of O2 to N2 relative to a standard ratio, as given in Eq. (1), and expressed in “per meg” units.
In practice, atmospheric N2 is far less variable than O2, meaning that changes in the ratio can be assumed to be representative of O2 mole fraction (Keeling and Shertz, 1992). In comparing changes in O2 to changes in CO2, on a mole for mole basis, a 1 per meg change in O2 is equivalent to a 0.2094 ppm (parts per million) change in CO2 mole fraction (Keeling et al., 1998).
Over the past 3 decades, atmospheric O2 has been decreasing at an average rate of ∼15 per meg per year, primarily owing to fossil fuel combustion (Keeling and Manning, 2014); over the same period, atmospheric CO2 has been increasing at an average rate of 2 ppm yr−1 (Dlugokencky and Tans, 2022), also predominantly due to fossil fuel combustion. For most processes that cause variability in atmospheric O2, there is an anti-correlated change in atmospheric CO2; therefore, high-precision measurements of atmospheric O2 play an increasingly important role in our understanding of atmospheric CO2, carbon cycling, and other biogeochemical processes (e.g. Pickers et al., 2017; Resplandy et al., 2019; Battle et al., 2019; Tohjima et al., 2019). Fluxes of O2 and CO2 in and out of the atmosphere are strongly coupled for terrestrial biosphere exchange with a global average oxidative ratio (OR) in the range of 1.03 to 1.10 mol mol−1 (Severinghaus, 1995). For fossil fuel combustion, dependent on fuel type, the OR is in the range of 1.17 to 1.95 mol mol−1 (Keeling, 1988b). Whereas O2 and CO2 fluxes are uncoupled for oceanic air–sea gas exchange primarily due to inorganic reactions in the water involving the carbonate system and not O2, as well as differences in air–sea equilibration times between the two gases.
The relationship between O2 and CO2 fluxes has also allowed for the derivation of the tracer “atmospheric potential oxygen” (APO), as defined in Eq. (2) (Stephens et al., 1998).
where the factor −1.1 represents the mean value of the O2 : CO2 OR for terrestrial biosphere photosynthesis and respiration (Severinghaus, 1995), and where we have ignored very minor influences from methane and carbon monoxide. APO is therefore, by definition, invariant with respect to the terrestrial biosphere. Changes in APO therefore mainly reflect changes in ocean–atmosphere exchange of O2 and CO2 (primarily on seasonal and longer timescales), with a contribution from fossil fuels on both shorter and longer timescales. APO can thus be used to examine oceanic CO2 fluxes and to quantify fossil fuel CO2 (ffCO2) emissions (Pickers et al., 2022).
The World Meteorological Organization (WMO) Global Atmosphere Watch (GAW) programme has established a measurement compatibility goal for O2 of ±2 per meg (±0.4 ppm) (Crotwell et al., 2019), where compatibility refers to the acceptable level of agreement between two field stations or laboratories when measuring the same air sample. This is the scientifically desirable level of compatibility required to resolve, for example, latitudinal gradients and long-term trends (Crotwell et al., 2019). There is also a WMO extended compatibility goal of ±10 per meg (±2 ppm), which is suitable for some specific applications when expected variations are relatively large (Crotwell et al., 2019), such as fossil fuel quantification in large cities. In order to meet the WMO compatibility goals, it is recommended that a measurement system's repeatability should not exceed half of the compatibility goal (i.e. ±1 per meg; ±0.2 ppm). Repeatability refers to the closeness of agreement between results of repeated measurements of the same measure (which is also sometimes referred to as the measurement system's precision). However, routinely achieving a measurement repeatability of ±1 per meg is not achievable for almost any laboratories or field stations making high-precision measurements of atmospheric O2. The large atmospheric background of O2 makes it extremely challenging to measure the relatively small variations to the level of repeatability required, since measuring a change of, for example, 0.2 ppm against the background (∼209 400 ppm) requires a relative repeatability of 0.0001 %.
Presently, there are several different analytical techniques available for measuring atmospheric O2 to high precision: interferometry (Keeling, 1988a), isotope ratio mass spectrometry (Bender et al., 1994), paramagnetic techniques (Manning et al., 1999), vacuum ultraviolet absorption (VUV; Stephens et al., 2011), gas chromatography (Tohjima, 2000), and electrochemical fuel cells (Stephens et al., 2007). The most precise of these current methods is the VUV absorption technique; however, VUV O2 analysers are “homemade” and are not commercially available, thus limiting their widespread application. None of these techniques are “off-the-shelf” systems, all of them are complex and time-consuming systems to design, build, and optimise, with very precise pressure, temperature, and flow control needed. All of the techniques also require frequent interruption to sample measurement to carry out calibration procedures (Kozlova and Manning, 2009). The supply of calibration gases for such systems is particularly labour intensive, due to both their relatively rapid consumption rate and the fact that no commercial gas supply company is able to provide suitable gas mixtures for atmospheric O2 research. Accurate, high-precision atmospheric O2 measurements therefore remain challenging. An alternative commercially available O2 analyser with fewer requirements for external gas handling, air-sample drying, and calibration procedures could consequently advance the field of atmospheric O2 measurements if the required performance could be achieved and if it were relatively easy to operate with low maintenance requirements and a lower rate of calibration gas consumption.
In this paper we present the results from the analysis of a Picarro Inc. G2207-i oxygen analyser, which operates on the principle of cavity ring-down spectroscopy technology (CRDS) (hereafter referred to as the G2207-i) and evaluate its performance in comparison to established O2 measurement systems in the University of East Anglia (UEA) Carbon Related Atmospheric Measurements (CRAM) Laboratory and at the Weybourne Atmospheric Observatory (WAO; North Norfolk, UK). Unlike most other analytical techniques used for atmospheric O2 measurements, it is intended that the G2207-i should not require a continuous reference gas supply, and it has built-in pressure and flow control and the potential for greatly reduced sample drying requirements due to a built-in water measurement and correction procedure. These features make the G2207-i a potentially desirable analyser for high-precision atmospheric O2 research, but we note that it would still require the same rigorous calibration procedures as other analysers (Kozlova and Manning, 2009), albeit possibly at reduced frequency. In this paper we quantify the compatibility, repeatability, and drift rates in the context of the WMO/GAW guidelines (Crotwell et al., 2019). In order to further examine the performance of the G2207-i in real-world applications, we also calculated ffCO2 from concurrent O2 and CO2 measurements, using the novel methodology presented by Pickers et al. (2022). We compare ffCO2 calculated with O2 measurements from the G2207-i installed at WAO with ffCO2 calculated from the established O2 system employing a Sable Systems International Inc. “Oxzilla II” fuel cell analyser.
2.1 Picarro G2207-i O2 analyser
The Picarro G2207-i O2 analyser measures the mole fractions of the two most abundant atmospheric O2 isotopologues, 16O16O and 16O18O, through absorption spectra at 7882.18670 and 7882.050155 cm−1, respectively (Berhanu et al., 2019). The design principles of this analyser have been described in detail by Berhanu et al. (2019). In our study we evaluate only what is called the “O2 concentration” mode, measuring only the 16O16O isotopologue. In the other mode, called the “δ18O plus O2 concentration” mode, O2 mole fraction values are considerably less precise, as the analyser is not optimised for 16O16O measurements (primarily via a different set point for the pressure in the cavity). The analyser reports both “wet” and “dry” O2 mole fraction values. The wet values (O2,NC; NC stands for “not corrected”) do not have any correction applied to them, whereas the dry values (O2,WC; WC stands for “water corrected”) are corrected for the dilution effect of water vapour on the O2 mole fraction, as well as spectroscopic interference, using the analyser's parallel water vapour mole fraction measurements. The G2207-i data sheet states a measurement precision of 5 ppm +0.1 % of the reading (1-σ, 5 s) for the water vapour mole fraction.
2.2 CRAM laboratory measurement of cylinder gases
The performance of the G2207-i was evaluated in the UEA CRAM Laboratory by measuring a suite of 12 gas cylinders all containing dry natural air with varying O2 mole fractions. The cylinders were stored horizontally in a thermally insulated “Blue Box” enclosure in order to prevent gravitational and thermal fractionation of O2 relative to N2 (Keeling et al., 2007). The O2 composition of each of these cylinders was precisely defined on the Scripps Institution of Oceanography (SIO) O2 scale (Keeling et al., 2007) using a VUV O2 analyser, which is also in the CRAM Laboratory. The CO2 mole fraction was defined on the “WMO CO2 X2007” scale (Zhao and Tans, 2006) using a Siemens Corp. Ultramat model 6F non-dispersive infrared (NDIR) CO2 analyser. Five of these cylinders were working secondary standards (WSSes), which were used to calibrate the G2207-i, one was a reference tank (RT; explained below in Sect. 2.3.2), while the other six were treated as cylinders with unknown mole fractions (Table 1). The six “unknown” cylinders were used to evaluate the performance of the analyser with a CO2 mole fraction range of 375 to 443 ppm and an ratio range of −915 to +435 per meg, a much larger range than would typically be observed in ambient air.
The cylinders were run consecutively, starting with the six “unknowns” and ending with the five WSSes, with the RT run at the beginning and end; this sequence was repeated twice. Each of the gas cylinders was flushed for 20 min prior to running on the G2207-i to allow for removal of stagnant air and equilibration of the pressure regulators; air from each cylinder was then passed through the analyser for 20 min, with the first 8 min of data discarded to allow flushing of the previous cylinder's air from the cavity and to maintain consistency with the flushing time employed in subsequent WAO tests (Sect. 2.3.2). The remaining 12 min for each cylinder was then averaged to give the “raw” O2,NC value for each cylinder as measured on the G2207-i.
Table 1Declared ratios and CO2 mole fractions with ±1σ standard deviations of the five WSSes, RT, and six “unknown” cylinder gases used in the CRAM Laboratory tests of the G2207-i.
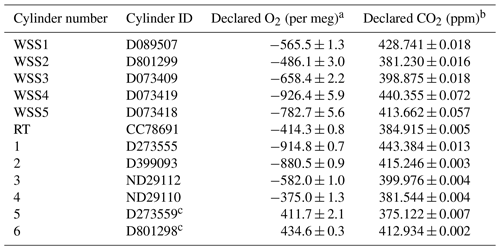
a Values declared with a VUV O2 analyser in the CRAM
laboratory traceable to the SIO O2 scale.
b Values declared with a Siemens Ultramat 6F NDIR CO2 analyser
in the CRAM Laboratory traceable to the WMO CO2 X2007 scale.
c The O2 values of these cylinders are far outside the range
observed in ambient air, thus are less relevant to the applications of
atmospheric observations but have been included in this analysis for
completeness of examining the analyser's performance.
The G2207-i has a linear response to O2 mole fraction (Eq. 3)
where B and C are the coefficients derived from the slope and intercept of the linear regression calculated from the measurement of the WSSes. Therefore, a minimum of two WSS cylinders are required to determine the B and C coefficients, but by using five we are able to calculate the coefficient of determination (R2), as well as providing more robustness in the fit. The calibration equation was used to convert the “raw” O2,NC values taken from the G2207-i (x in Eq. 3) into what we call “ppm equivalent” (ppmEquiv) O2 units (y in Eq. 3), as described in Kozlova and Manning (2009). A linear interpolation between the RT at the beginning and end of each run was used as a baseline for the run and subtracted from all other cylinder measurements to correct for short-term analyser variations. The calibration curve (Eq. 3) for the G2207-i was also determined relative to the interpolated RT values (WSS – RT); thus, all the unknown cylinder measurements could be converted into ppmEquiv. The ppmEquiv O2 units were then converted to per meg units, providing a value for each unknown cylinder, using Eq. (4).
where, δO2 is the calibrated G2207-i O2,NC value in ppmEquiv units, CO2 is the declared cylinder CO2 mole fraction from the Siemens analyser in ppm, is 0.2094, which is the standard mole fraction of O2 molecules in dry air (Tohjima et al., 2005), and 363.29 is an arbitrary CO2 reference value in ppm, inherent to the SIO O2 scale (Stephens et al., 2007).
2.3 Weybourne Atmospheric Observatory field tests
Weybourne Atmospheric Observatory (WAO) is located on the north Norfolk coast, UK (52∘ N, 1∘ E), approximately 35 km north-northwest of Norwich, 170 km northeast of London, and 200 km east of Birmingham. It is part of the European Union's Integrated Carbon Observation System (ICOS) and the World Meteorological Organization's (WMO) Global Atmosphere Watch (GAW) programme. High-precision, high-accuracy, continuous measurements of a wide array of atmospheric gas species (including greenhouse gases, isotopes, reactive gases) are carried out at a fine temporal scale, funded in part through the UK's National Centre for Atmospheric Science (NCAS) long-term measurement programme.
Atmospheric O2 and CO2 have been measured continuously at WAO since 2008 (Wilson, 2013). O2 is measured with an Oxzilla II O2 analyser (Sable Systems International Inc.) (hereafter referred to as the “Oxzilla”), and CO2 is measured with an Ultramat 6E NDIR analyser (Siemens Corp.). These analysers are arranged in series, with the air sample first passing through the Ultramat 6E and then the Oxzilla, with rigorous gas handling and calibration protocols followed (as in Stephens et al., 2007).
The G2207-i was installed at WAO from 23 October 2019–2 November 2019, sampling from a solar shield aspirated air inlet (AAI) at a height of 10 m above ground level (a.g.l.; 20 m above sea level, a.s.l.). The AAI protects the inlet from solar radiation and generates a continuous air flow over the inlet, thus preventing the differential fractionation of O2 molecules relative to N2 molecules due to ambient temperature variations (Blaine et al., 2006) and relatively slow inlet flow rates (Manning, 2001). A diagram of the gas handling set-up for the G2207-i at WAO is displayed in Fig. 1.
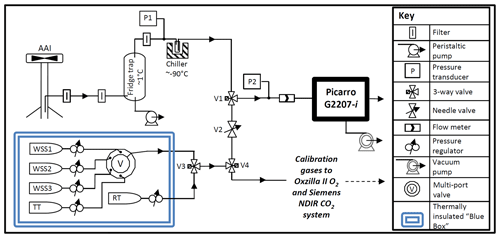
Figure 1Gas handling diagram of the Picarro G2207-i installed at WAO. (AAI, aspirated air inlet; WSS, working secondary standard; RT, reference tank; TT, target tank). Calibration gases were shared with the established O2 and CO2 system (using V4), but the established system has its own AAI, pump, drying system, and pressure and flow control (not depicted here).
2.3.1 Drying
Water vapour mole fractions in the troposphere vary from a few parts per million to a few percent over small temporal and spatial scales. This water vapour has a diluting effect on atmospheric gas measurement. A 1 ppm increase of water vapour will dilute the measured atmospheric O2 by approximately 1.3 per meg (Stephens et al., 2007); thus, the existing method for high-precision atmospheric O2 measurements is to dry the sample air to less than 1 ppm water vapour content before measurement. All calibration and RT gases are also dried to less than 1 ppm water vapour. Furthermore, measurements using spectroscopic techniques are also sensitive to water vapour variability due to changes in the degree of pressure broadening of the spectroscopic lines used to measure the O2 and δ18O2. Water vapour correction has previously been successfully implemented for measurements of CO2 and methane (CH4) with CRDS analysers (Chen et al., 2010); however, in order to achieve accuracies within the WMO goal of 1 % H2O custom coefficients must be obtained for each analyser (Rella et al., 2013).
As discussed in Sect. 2.1, O2 measurements are reported by the G2207-i as “wet” (O2,NC) and, after the implementation of water correction, “dry” (O2,WC). In order to evaluate the effectiveness of the built-in water correction procedure for compensating for water vapour dilution, ambient air was sampled with three different drying regimes: no drying, partial drying, and full drying. Under the full-drying conditions (which is the current standard practice), the sample air passed through a fridge trap (∼1 ∘C) and a cryogenic chiller trap ( ∘C), removing water vapour to <1 ppm. Under partial drying the chiller was bypassed, so the sample air only passed through the fridge trap, which dries the air to approximately 5000 ppm of water vapour. With no drying, both the chiller and fridge were bypassed. Air was simultaneously sampled through a separate AAI (10 m a.g.l.) into the pre-existing O2 and CO2 system with full drying during each of these stages. The time difference between air travelling from the AAIs to each of the two analysers was accounted for.
To evaluate the built-in water correction procedure of the G2207-i, the O2,WC values were compared with measurements from the Oxzilla (which was continuously sampling fully dried air) for the no drying and partial drying periods, and the O2,NC and O2,WC G2207-i values were compared to the Oxzilla when sampling fully dried air.
2.3.2 Calibration procedure
A tailor-made calibration protocol was developed for the G2207-i following ICOS atmospheric station specifications (ICOS-RI, 2020). The calibration cylinders were stored horizontally in a thermally insulated “Blue Box” enclosure in order to prevent gravitational and thermal fractionation of O2 and N2. The calibration gases consisted of three WSSes with precisely defined O2 and CO2 values that span the unpolluted atmospheric range (traceable to the SIO O2 and WMO CO2 X2007 scales) and a reference tank (RT) with O2 and CO2 values close to ambient air conditions at the site. The repeatability and compatibility of the analyser were evaluated using a target tank (TT) (sometimes known as a “surveillance tank”) with precisely defined O2 and CO2 values. With full drying of the sample air, each of the WSSes, the RT, and the TT were run for 20 minutes, of which the first 8 min was discarded due to the sweep-out time of the G2207-i and equilibration after valve switching and surface effects. The final 12 min were averaged to determine the cylinder value for the given run. A flushing period of 8 min and averaging time of 12 min were chosen to match that of the established system. Under partial and no drying the run time of the cylinders was increased in order to fully flush the G2207-i of water vapour; each cylinder was therefore run for 32 min, with the first 20 min being discarded and the final 12 min averaged.
A full three-gas WSS calibration of the G2207-i was run every 23 h, this frequency is intentionally not a multiple of 24 h in order to prevent aliasing the data by calibrating under environmental conditions that may occur at the same time each day. This calibration corrects for drift in the span or non-linearity of the analyser. As in the CRAM laboratory tests (see Sect. 2.2), the WSSes were used to define a calibration equation to convert the raw analyser O2 values into ppmEquiv O2 units. Equation (3) and the concurrent CO2 measurement from the Ultramat 6E NDIR analyser were then used to convert this into per meg units.
The RT is used for data correction caused by short-term analyser drift and was run every 5 h. A linear interpolation between each of the RT run averages was treated as a baseline and subtracted from all subsequent air and cylinder measurements. The calibration curve for the G2207-i was also determined relative to the RT values (WSS-RT), and thus the air measurement differences can be easily converted into per meg units.
Finally, the TT was run every 7 h, this cylinder is used to quantify the repeatability and compatibility of the analyser. “Repeatability” is defined as the closeness of agreement between results of successive measurements of the same measure carried out under the same measurement conditions and is considered as a proxy for the precision of a measurement system. “Compatibility” is defined as the averaged O2 value of all TT runs over time, compared to the values declared by the VUV, and provides a measure of the compatibility to the SIO scale over time (Kozlova and Manning, 2009). The TT air does not pass through the AAI or drying lines (Fig. 1), and it is therefore mainly representative of the analyser's repeatability and compatibility only.
2.4 Quantifying fossil fuel CO2 using atmospheric potential oxygen
In order to further assess the G2207-i's performance in real-world applications, the O2,NC observations from the full-drying regime period at WAO were used to isolate the fossil fuel component of the concurrent CO2 observations and then compared to the ffCO2 values calculated from atmospheric potential oxygen (APO) defined from the Oxzilla O2 observations following the methodology outlined in Pickers et al. (2022).
The tracer APO, derived by Stephens et al. (1998), was first calculated using Eq. (5) (using both G2207-i O2,NC and Oxzilla O2 values); these APO values were then used to calculate ffCO2 using Eq. (6).
where O2 and CO2 are in per meg and parts per million, respectively, −1.1 is the global average O2:CO2 terrestrial biosphere–atmosphere exchange ratio (Severinghaus, 1995), 0.2094 is the standard mole fraction of O2 in dry air (Tohjima et al., 2005), and 350 is an arbitrary reference value for CO2 (in ppm). Multiplying CO2 by −1.1 and dividing by 0.2094 converts the CO2 data from parts per million to per meg units.
where APO is derived from Eq. (5) in per meg units, APObg is the APO background, or baseline, value determined using a statistical baseline fitting procedure, and is the APO : CO2 combustion ratio for fossil fuel emissions. The APObg values were determined using the rfbaseline function from the IDPmisc package in R, which implements robust fitting of local regression models, with a smoothing window of 1 week (Ruckstuhl et al., 2012). The APO : CO2 emission ratio ( used is −0.3 mol mol−1, an approximate mean value for WAO as determined from the COFFEE inventory (a typical value for fossil fuel emissions, given that the APO:CO2 ratio ; Pickers, 2016; Steinbach et al., 2011). The uncertainty on the ffCO2 mole fractions was calculated using Eq. (6) with the upper and lower uncertainty limit for each variable (where the measurement uncertainty for APO was calculated by summing in quadrature the CO2 and O2 measurement uncertainty for each analyser) and then taking the standard deviation (SD) of the resultant ffCO2 value of each combination for each hourly time stamp.
3.1 Precision and drift
To assess the short-term precision and optimal averaging time of the G2207-i, the Allan deviation technique (Werle et al., 1993) was used whilst sampling a compressed-air cylinder in the laboratory (50 L, 200 bar). The cylinder was run for 24 h with a sample flow rate of 94 mL min−1 and cavity pressure and temperature of 340 mbar and 45 ∘C, respectively. The results of this Allan deviation analysis are in agreement with those obtained by Berhanu et al. (2019), where a precision of 1 ppm (∼4.8 per meg) was achieved after an averaging time of 300 s. Precision then continues to improve until around a 30 min averaging time where a precision of ∼0.5 ppm (∼2.4 per meg) is reached, and it remains around that value for averaging times up to around 1 h (Fig. 2). It should be noted that unlike the hourly average and standard deviation obtained from measurement of cylinder air, the hourly averages of atmospheric data also contain natural variability in addition to analyser-related noise and drift.
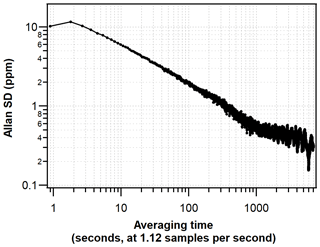
Figure 2Allan deviation plot displaying the precision of the G2207-i O2 mole fraction measured from an ambient compressed-air cylinder.
To evaluate the analyser drift (i.e. the changing sensitivity of the analysers response with time), O2,NC values from the G2207-i were averaged to 1 h (Fig. 3b; reported in ppm where 1 ppm corresponds to a change of 4.8 per meg in the ratio). The G2207-i data sheet states a maximum drift at STP (standard temperature and pressure) (over 24 h, peak-to-peak, 1 h internal average at 21 % O2) of <6 ppm. We found that over 24 h, the maximum peak-to-peak drift of the hourly averages is ∼1.2 ppm (approximately 5.8 per meg); this is better than stated by Picarro Inc. but does not meet the WMO compatibility goal of ±2 per meg, as the internal drift of the analyser is greater than this goal. The standard deviation of each of these hourly averages is ∼14.5 ppm (∼69.6 per meg) (Fig. 3a), this is caused by the large amount of analyser noise in the raw 1 s data points, spanning ∼100 ppm (∼480 per meg) (Fig. 3c). The overall drift over the 24 h of raw data however is very small, shown by a linear regression slope of ppm s−1 (Fig. 3c).
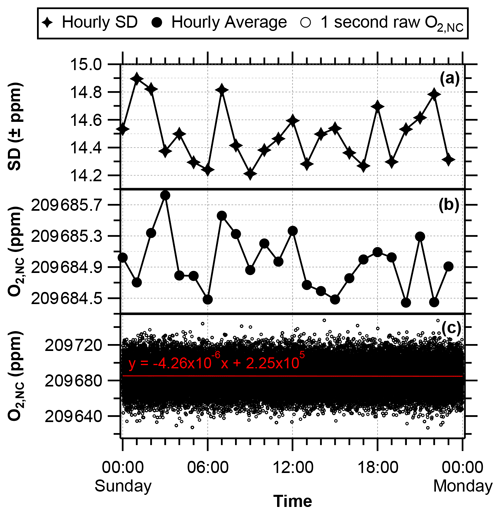
Figure 3O2,NC mole fractions from the G2207-i sampling dry compressed cylinder air over 24 h (reported in ppm, where 1 ppm corresponds to a change of 4.8 per meg in the ratio). (a) Standard deviation of the hourly averaged values. (b) Hourly averaged O2,NC. (c) Raw 1 s O2,NC values, the red line depicts the linear regression line, with the equation and R2 value written above.
3.2 CRAM laboratory measurement of cylinder gases
The G2207-i analyser performance was evaluated by measuring six gas cylinders with precisely defined O2 and CO2 values as measured on a VUV O2 analyser and Siemens Ultramat 6F NDIR CO2 analyser (Table 1). The difference between the O2,NC values (per meg) as measured by the G2207-i and the declared values from the VUV are shown in Table 2 for runs both with and without the RT interpolation applied. This procedure was carried out twice, referred to as “Run 1” and “Run 2” in Table 2
For both sets of runs without the application of the RT interpolation the difference between the VUV declared value and that measured by the G2207-i is very large and far outside of an acceptable range (Table 2), with an average difference from the declared values for all cylinders of 22.0±10.3 per meg. For all cylinders, except for cylinder 5 and 6, a large improvement in the difference is seen after the application of the RT correction. Due to the large differences between the declared and measured values without the RT correction applied, only the results with the RT correction will be discussed hereafter.
Table 2The difference between the O2 value of each cylinder as measured on the G2207-i and the VUV analyser (G2207-i–VUV) for two runs on the G2207-i, each with and without RT correction applied.
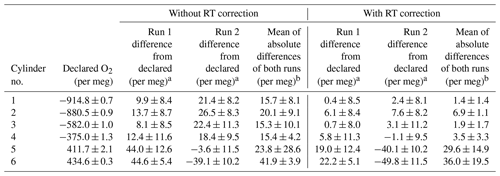
a ±1σ standard deviation of the 12 min G2207-i average.
b ±1σ standard deviation of the average of the run 1 and run 2 G2207-i–VUV absolute differences.
Cylinders 5 and 6 contain O2 values far higher than that found in ambient air (411.7 and 434.6 per meg, respectively) and outside of the range spanned by the WSSes used for calibration. For these two cylinders, the difference between the declared value and that measured by the G2207-i is far larger than the other cylinders and also more variable between the two runs, with a standard deviation of the absolute values between the two runs of ±14.9 and ±19.5 per meg, respectively (Table 2). Berhanu et al. (2019) found that the accuracy of the G2207-i was reduced when the CO2 mole fraction was much higher than that of ambient air but did not observe the same reduction in accuracy with high O2 mole fractions. Ignoring the two cylinders with positive O2, the average absolute difference for the remaining four unknown cylinders and the declared values over the two runs is 3.4±2.5 per meg, this is slightly greater than the WMO compatibility goal of ±2 per meg but does fall within the extended goal of ±10 per meg and is similar to what can be achieved with an Oxzilla II (Pickers et al., 2017). There is also no correlation between the accuracy and the declared O2 value when excluding the two cylinders with positive O2 (R2=0.07 for run 1, R2=0.53 for run 2).
Although the accuracy of the O2 values measured by the G2207-i for these cylinders is variable, particularly for the cylinders with high O2, the standard deviation of the 2 min data points used to calculate the final cylinder O2 value as defined by the G2207-i within each run is more consistent. However, the repeatability, used as a proxy for precision, and defined here as the ±1σ standard deviation of the average of the two measurements of each cylinder, is variable. For the two cylinders with high O2 (cylinders 5 and 6) the repeatability is more than 5 times greater than the WMO extended repeatability goal of ±5 per meg. For the remaining four cylinders the repeatability is far lower, with cylinder 1 and cylinder 3 both falling within the extended repeatability goal.
3.3 Weybourne Atmospheric Observatory field tests
3.3.1 Partial and no drying of ambient air measurements
The results from no drying and partial drying of the sample air into the G2207-i at WAO are displayed in Figs. 4 and 5, respectively. The O2 mole fractions reported (in ppm) by the G2207-i were converted to per meg units using the calibration equations produced through the measurement of the three WSS cylinders every 23 h and the concurrent CO2 observations from the Ultramat 6E analyser.
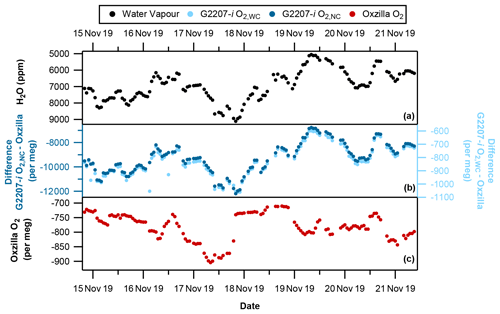
Figure 4With no drying of the sample air through the G2207-i (a) hourly averaged water vapour, (b) G2207-i–Oxzilla difference for O2,NC (dark blue) and O2,WC (light blue), and (c) Oxzilla O2. Note the reversed water vapour axis and different axis scales for O2,NC and O2,WC.
During the period where there was no drying of the G2207-i air sample there is a significant difference between the O2 values reported by the Oxzilla (dried air) and the G2207-i O2,NC values (Fig. 4b). This is to be expected due to the diluting effect of water vapour; however, there is also a significant difference between the Oxzilla O2 and the G2207-i O2,WC values. Over the entire no-drying period the average difference between the Oxzilla observations and the G2207-i O2,NC is per meg. The average difference between the Oxzilla and the G2207-i O2,WC values is per meg. Although the difference is substantially smaller with the application of the G2207-i built-in water correction procedure, it is still unusably large, with no similarity in the Oxzilla and G2207-i signals and both the O2,NC and O2,WC G2207-i values correlating with the H2O variability (Fig. 6a and b). This demonstrates that the algorithm currently applied for water correction is unsuitable for precise O2 measurement.
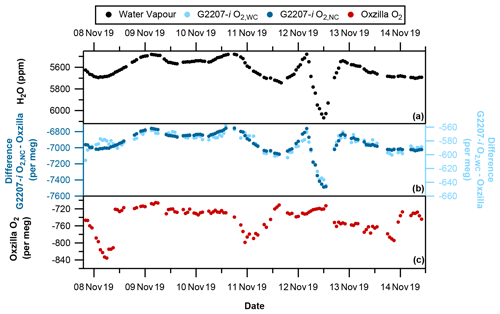
Figure 5With partial drying of the sample air through the G2207-i (a) Hourly averaged water vapour, (b) G2207-i–Oxzilla difference for O2,NC (dark blue) and O2,WC (light blue), and (c) Oxzilla O2 (Oxzilla sample air is fully dried). Note the reversed water vapour axis and different axis scales for O2,NC and O2,WC. The spike in water vapour on 12 November 2019 is due to a temporary increase in the temperature of the fridge.
As seen during the no-drying period of the sample air, there is also a significant difference between the reported O2 values of the Oxzilla and G2207-i under the partial drying regime for both O2,NC and O2,WC (Fig. 5b). With partial drying, the time series of the difference between the O2 values of the two analysers is a lot smoother than with no drying. This is due to the fridge trap removing some of the natural variability in the water vapour mole fraction. Over the entire partial drying period the average difference between the Oxzilla observations and the G2207-i O2,NC is per meg. The average difference between the Oxzilla and the G2207-i O2,WC values is per meg. There is a large improvement with the application of the water correction procedure; however, as with the no-drying results, the difference in O2 values between the Oxzilla and G2207-i O2,WC are too large to be usable for any application, with the O2,NC and O2,WC values correlating with the H2O variability (Fig. 6c and d).
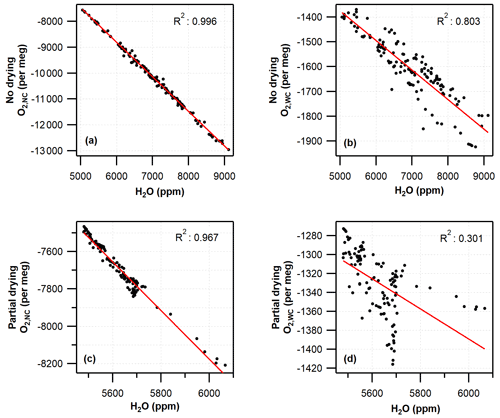
Figure 6Correlation between water vapour mole fraction and hourly averaged G2207-i O2 for (a) no-drying O2,NC, (b) no-drying O2,WC, (c) partial-drying O2,NC, and (d) partial-drying O2,WC. Red lines show linear regression.
Under both partial-drying and no-drying regimes, the difference between the Oxzilla and G2207-i values is strongly correlated with the water vapour mole fraction but decreases with the application of the built-in water correction procedure (Fig. 6). The R2 value decreases from 0.996 to 0.803 for no drying and from 0.967 to 0.301 for partial drying once the water correction has been applied. Given the correlation between the water vapour mole fraction and the O2,WC reported by the G2207-i these values are not usable without significant improvements to the water correction procedure by Picarro Inc.
Due to the large differences observed between the Oxzilla and G2207-i reported O2 values under no drying and partial drying, no further investigation was undertaken, thus only the fully dried sample air data are considered hereafter.
3.3.2 Full drying of ambient air measurements
The results from fully drying the sample air between 24 October and 7 November 2019 are displayed in Fig. 7. The O2 mole fractions reported in ppm units by the G2207-i were converted to per meg units using the calibration equations produced through the measurement of the three WSS cylinders every 23 h, and the concurrent CO2 observations.
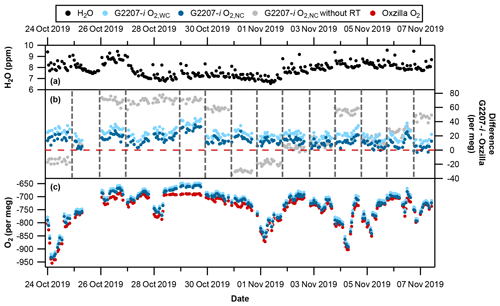
Figure 7Time series with full drying of the air sample. (a) Hourly averaged water vapour; spikes are due to equilibration after valve switching from cylinder air to sample air. (b) G2207-i–Oxzilla difference for O2,WC (light blue), O2,NC (dark blue), and O2,NC without the RT interpolation applied (grey). Vertical dashed lines indicate a full three-gas WSS calibration on the G2207-i, and the red horizontal line indicates zero difference from the Oxzilla. (c) Hourly averaged Oxzilla O2 (red), O2,WC (light blue), and O2,NC (dark blue). Note that there was no WSS calibration on 27 October 2019 due to a macro error which prevented valve switching to calibration gases; therefore, the calibration from 26 October 2019 was applied for 46 h.
There is a greater difference between the Oxzilla and G2207-i O2,WC values than the O2,NC values, with an average difference over the entire full-drying period of 22.6±7.4 per meg compared to 13.6±7.5 per meg, respectively. This may be due to overcorrection of the O2,NC values as the water vapour mole fraction is below the G2207-i's lower detection limit and precision, i.e. the G2207-i is reporting H2O mole fractions of approximately 7 ppm (Fig. 7a) (with frequent spikes due to equilibration after switching of V1 (Fig. 1) from cylinder to sample air); however, when the air sample is fully dried by passing through the chiller and fridge trap, the water vapour is reduced to below 1 ppm. This overestimated water correction whilst sampling fully dried air was also found by Berhanu et al. (2019). We therefore only refer to the O2,NC values, which we believe to be more accurate, in the analysis from now onwards.
The large jumps in the G2207-i O2,NC values following WSS calibrations (see Fig. 7b, grey points) are caused by a drift in the analyser's baseline, which only becomes applied to the data after each calibration. These jumps were reduced through the application of the 5 h RT interpolation procedure (see Fig. 7b, blue points), which constrained the baseline drift (refer to Sect. 2.3.2). After the application of the RT interpolation the jumps between WSS calibrations were vastly reduced (see Fig. 7).
3.3.3 Repeatability and compatibility
The repeatability and compatibility of the analyser were evaluated through the running of a TT every 7 h during the full-drying period using O2,NC values, the results of which are presented in Fig. 8 and Table 3. For O2 the WMO repeatability goal is ±1 per meg (with an extended goal of ±5 per meg) and the compatibility goal is ±2 per meg (with an extended goal of ±10 per meg; indicated by the dashed lines in Fig. 8; Crotwell et al., 2019).
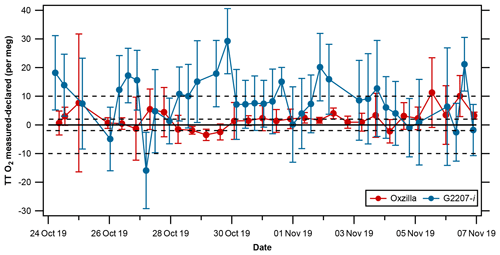
Figure 8TT differences from declared values (measured–declared) (±1σ standard deviation) for the Oxzilla (red) and G2207-i O2,NC (blue) . The solid line indicates zero difference from the declared O2 value of the TT, and the dashed lines indicate the WMO compatibility goal of ±2 per meg and the extended goal of ±10 per meg.
Table 3Repeatability and compatibility goals and achievements for each analyser.

a Values are calculated using the method in Kozlova
and Manning (2009) and Pickers et al. (2017). Mean ±1σ
standard deviations of the average of two consecutive measurements of the
TT, determined from 30 TT measurements for the Oxzilla and 37 TT
measurements for the G2207-i, where one run is the average of 12 min of
data. Uncertainties are given on these mean standard deviations,
illustrating that the analytical repeatability is variable over time.
b Mean differences between the measured TT ratio and
the declared values determined on the VUV analyser against primary
calibration standards on the SIO O2 scale.
c WMO repeatability and compatibility goals, where the repeatability of
a measurement should be at most half of the value of the compatibility goal.
For O2, the WMO goals are very ambitious and not currently
achievable by the O2 measurement community; hence, the “extended”
O2 goals, which are suitable for some O2 applications, shown in
parentheses.
The repeatability is determined from the mean ± 1σ standard deviations of the average of two consecutive measurements of the TT. For the G2207-i this is equal to per meg, compared to per meg on the Oxzilla. Prior to applying the RT interpolation to the G2207-i data, the repeatability of the G2207-i was per meg, twice as bad as after the RT application; this is because after the RT interpolation was applied the large jumps in the TT value after a WSS calibration were removed. In the context of the WMO repeatability goals, neither the Oxzilla nor the G2207-i meet the goal of ± 1 per meg. For O2, the WMO goals are very ambitious and not currently achievable by the O2 measurement community; hence, the “extended” O2 repeatability goal of ± 5 per meg (Crotwell et al., 2019). The Oxzilla TT results lie within this extended goal; however, the G2207-i does not, even after the application of the RT interpolation.
The compatibility of the analyser, which is used here as a proxy for accuracy, is determined by calculating the mean difference between the TT O2 as measured by the G2207-i and the VUV declared value (−718 per meg). The mean absolute difference from the declared value on the VUV for the Oxzilla is 3.0±2.6 per meg, this is well within the extended WMO compatibility goal of ± 10 per meg and is quite close to the more stringent goal of ± 2 per meg. The compatibility of the G2207-i prior to the application of the RT interpolation is 22.9±34.1 per meg, which is far greater than even the extended compatibility goal of ± 10 per meg. After the application of the RT interpolation the compatibility of the G2207-i O2,NC is 10.0±6.7 per meg, although this is not within the WMO compatibility goal, it is just within the extended goal, which is deemed suitable for some applications in specific circumstances, such as where the signals are relatively very large so that reduced repeatability and compatibility does not preclude useful information from the measurements.
The compatibility and repeatability of the G2207-i measurements were vastly improved after the application of a 5-hourly RT; however, if one ignores the TT results immediately after a new WSS calibration (i.e. after the large jumps when the RT was not applied), the repeatability without the RT interpolation is 5.2±4.5 per meg, improving to 4.3±4.6 per meg when the RT is applied. This is because the RT corrected for baseline drift between WSS calibrations, but it does not correct for drift within the calibration period. However, as the TT results are imprecise (as illustrated by the large error bars in Fig. 8), even if any baseline drift within a calibration period were corrected for, there would likely be little improvement in the final TT results as the noise in the RT-corrected TT values is primarily caused by imprecision rather than baseline drift.
3.4 Applications of the G2207-i O2 measurements in the calculation of fossil fuel CO2
In order to further assess the G2207-i's performance in real-world applications the fully dried, RT corrected, O2,NC observations from WAO were used to isolate the fossil fuel component of the concurrent CO2 observations and then compared to the ffCO2 values calculated from the Oxzilla O2 observations following the APO methodology outlined in Pickers et al. (2022). The resultant ffCO2 values calculated from each analyser are displayed in Fig. 9.
The measurement uncertainty was calculated as the average hourly SD on 30 October 2019, this date was chosen as it was a particularly stable period with little variation in the TT results for both analysers (Fig. 8); the resultant uncertainty for the G2207-i is ±11.2 per meg compared to ±4.9 per meg for the Oxzilla. The uncertainty in the baseline determination (±28 %) and the emission ratio uncertainty (±22 %) are significantly larger than these measurement uncertainties (Pickers et al., 2022), but as these are the same for both analysers the additional measurement uncertainty for the G2207-i caused by analyser noise increases the uncertainty of the calculated ffCO2 values. The average final calculated uncertainty on the ffCO2 values calculated from the Oxzilla measurements is ±5.8 ppm, compared to ±13.0 ppm on the G2207-i.
The average ffCO2 value over the entire full-drying period for the Oxzilla is 5.1 ppm, compared to 7.9 ppm on the G2207-i (Table 4); the calculated ffCO2 from the G2207-i is higher than that of the Oxzilla 73 % of the time. This difference is predominantly due to the higher O2 values reported by the G2207-i as discussed in Sect. 3.3.2; some of this difference also comes from the jumps in the G2207-i O2 values, which means that the calculated baselines used for each analyser follow different trends. For example, on the 27 and 30 October 2019 the largest difference between the calculated ffCO2 values is observed (Fig. 9); on both of these dates there is a large jump in O2 values from the previous day measured by the G2207-i following a WSS calibration (Fig. 7). Although the O2 difference between the two analysers on these days is low, there was a large difference the preceding day, the days with the larger difference (due to a higher O2 value reported by the G2207-i) in observed values pull the baseline to become more positive, thus making the difference between the ffCO2 calculated from the two analysers larger on days where the observed O2 difference is smaller.
Although the G2207-i calculated ffCO2 values that are often higher than those from the Oxzilla, they still follow the same trend (with some jumps in the G2207-i values); however, the maximum and minimum values occur at different times. The differences in ffCO2 calculated from the G2207-i and the Oxzilla would become problematic if using the G2207-i analyser for top-down ffCO2 quantification on an hourly basis.
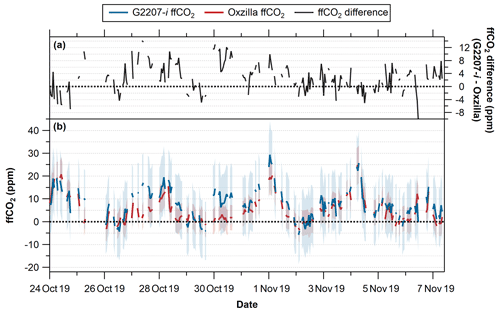
Figure 9(a) Difference between the ffCO2 calculated using O2 from the G2207-i and the Oxzilla (G2207-i – Oxzilla). (b) Calculated ffCO2 using O2 from the G2207-i (blue) and the Oxzilla (red); blue and red shaded areas indicate uncertainty of the calculated ffCO2. Dashed black lines indicate 0 ppm. Negative ffCO2 values occur when the O2 observations are above (more positive than) the calculated O2 baseline. Note that gaps are due to the threshold requirement of a minimum of 20 min of data for hourly averages.
The performance of the Picarro G2207-i under both laboratory and field conditions has been thoroughly evaluated. When running a cylinder on the G2207-i over 24 h in the laboratory, we observed a large amount of noise in the raw 1 s data, resulting in a large standard deviation in averaged data. This standard deviation is reduced over longer averaging times. During the laboratory measurement of cylinder gases with declared O2 values, the G2207-i performed within the WMO extended compatibility goal of ±10 per meg when measuring cylinders with a negative O2 per meg value. When measuring cylinders with a positive O2 value, the precision and accuracy of the result worsened, thus the G2207-i is not recommended for use in this range.
When sampling ambient air, we found that the G2207-i's built-in water correction does not, at present, sufficiently correct for the influence of water vapour even when the sample air is partially dried, and we therefore recommend full drying (<1 ppm H2O) of air samples. When sampling fully dried air, large step-changes in the reported O2 values from the G2207-i were observed after each WSS calibration; the addition of a RT every 5 h vastly reduced these jumps; however, they were still observable. When the RT interpolation was applied, the repeatability of the G2207-i was per meg, falling just outside of the WMO extended goal of ±5 per meg; it is possible that with a more frequent RT interpolation this repeatability will improve. The compatibility was per meg, falling within the WMO extended compatibility goal for O2 of ±10 per meg. In the future, investigation into whether increasing the frequency of the running of an RT to reduce jumps in the observed O2 values after a WSS calibration may improve both the repeatability and compatibility of the analyser. A key benefit of CRDS analysers is that they do not require drying of the air sample; however, this is not currently the case with the G2207-i for O2 measurements.
The G2207-i data from the WAO and CRAM Lab tests are available at: https://doi.org/10.5281/zenodo.6802657 (Fleming et al., 2022). The WAO in situ datasets are available at the CEDA data archives, for O2: https://catalogue.ceda.ac.uk/uuid/b3f9714c956f428a840211e0184e23eb (last access: 1 July 2022; Forster, 2012b), and for CO2: https://catalogue.ceda.ac.uk/uuid/87fc265aab6b4aeb961e62da2cd6ca91 (last access: 1 July 2022; Forster, 2012a).
LSF, ACM, and PAP developed the measurement methodology, and the measurements were conducted by LSF at UEA and WAO. AJE developed the software used to run the analyser. Investigation and visualisation were completed by LSF. Writing was carried out by LSF. Reviewing and editing were done by LSF, ACM, PAP, and GLF.
The contact author has declared that none of the authors has any competing interests.
Publisher's note: Copernicus Publications remains neutral with regard to jurisdictional claims in published maps and institutional affiliations.
We are very grateful to Marica Hewitt, Nick Griffin, and Dave Blomfield (UEA) for supporting the WAO measurements. We are also very grateful to Gregor Lucic and Magdalena Hofmann at Picarro Inc. for the loaning of the G2207-i analyser and their feedback on a draft manuscript.
Leigh S. Fleming was supported by the UK Natural Environment Research Council (NERC) “EnvEast” Doctoral Training Partnership (grant no. NE/L002582/1). The WAO atmospheric O2 and CO2 measurements are supported by the Atmospheric Measurement and Observation Facility (AMOF) of the National Centre for Atmospheric Science (NCAS), in addition to NERC research grant nos. NE/R011532/1 and NE/S004521/1.
This paper was edited by Huilin Chen and reviewed by two anonymous referees.
Battle, M. O., Munger, J. W., Conley, M., Sofen, E., Perry, R., Hart, R., Davis, Z., Scheckman, J., Woogerd, J., Graeter, K., Seekins, S., David, S., and Carpenter, J.: Atmospheric measurements of the terrestrial O2:CO2 exchange ratio of a midlatitude forest, Atmos. Chem. Phys., 19, 8687–8701, https://doi.org/10.5194/acp-19-8687-2019, 2019.
Bender, M. L., Tans, P. P., Ellis, J. T., Orchardo, J., and Habfast, K.: A high precision isotope ratio mass spectrometry method for measuring the O2/N2 ratio of air, Geochim. Cosmochim. Acta, 58, 4751–4758, https://doi.org/10.1016/0016-7037(94)90205-4, 1994.
Berhanu, T. A., Hoffnagle, J., Rella, C., Kimhak, D., Nyfeler, P., and Leuenberger, M.: High-precision atmospheric oxygen measurement comparisons between a newly built CRDS analyzer and existing measurement techniques, Atmos. Meas. Tech., 12, 6803–6826, https://doi.org/10.5194/amt-12-6803-2019, 2019.
Blaine, T. W., Keeling, R. F., and Paplawsky, W. J.: An improved inlet for precisely measuring the atmospheric ArN2 ratio, Atmos. Chem. Phys., 6, 1181–1184, https://doi.org/10.5194/acp-6-1181-2006, 2006.
Chen, H., Winderlich, J., Gerbig, C., Hoefer, A., Rella, C. W., Crosson, E. R., Van Pelt, A. D., Steinbach, J., Kolle, O., Beck, V., Daube, B. C., Gottlieb, E. W., Chow, V. Y., Santoni, G. W., and Wofsy, S. C.: High-accuracy continuous airborne measurements of greenhouse gases (CO2 and CH4) using the cavity ring-down spectroscopy (CRDS) technique, Atmos. Meas. Tech., 3, 375–386, https://doi.org/10.5194/amt-3-375-2010, 2010.
Crotwell, A., Lee, H., and Steinbacher, M.: Report of the 20th WMO/IAEA Meeting on Carbon Dioxide, Other Greenhouse Gases and Related Measurement Techniques (GGMT-2019), World Meteorological Organization Global Atmosphere Watch, Jeju Island, South Korea Report Series, GAW Report No. 255, https://library.wmo.int/doc_num.php?explnum_id=10353 (last access: 1 July 2022), 2019.
Dlugokencky, E. J. and Tans, P. P.: Trends in Atmospheric Carbon Dioxide. National Oceanic and Atmospheric Administration, Earth System Research Laboratory (NOAA/ESRL), https://gml.noaa.gov/ccgg/trends/gl_gr.html, last access: 17 October 2022.
Fleming, L. S., Manning, A. C., Pickers, P. A., Forster, G. L., and Etchells, A. J.: Datasets for “Evaluating the performance of a Picarro G2207-i analyser for high-precision atmospheric O2 measurements”, Zenodo [data set], https://doi.org/10.5281/zenodo.6802657, 2022.
Forster, G.: Weybourne Atmospheric Observatory: Longterm measurements of Atmospheric Carbon Dioxide, NCAS British Atmospheric Data Centre [data set], https://catalogue.ceda.ac.uk/uuid/87fc265aab6b4aeb961e62da2cd6ca91, 2012a.
Forster, G.: Weybourne Atmospheric Observatory: Long term measurements of atmospheric O2, NCAS British Atmospheric Data Centre [data set], https://catalogue.ceda.ac.uk/uuid/b3f9714c956f428a840211e0184e23eb (last access: 1 July 2022), 2012b.
ICOS-RI: ICOS Atmosphere Station Specifications V2.0, ICOS ERIC, https://doi.org/10.18160/GK28-2188, 2020.
Keeling, R. F.: Measuring correlations between atmospheric oxygen and carbon-dioxide mole fractions – a preliminary-study in urban air, J. Atmos. Chem., 7, 153–176, https://doi.org/10.1007/bf00048044, 1988a.
Keeling, R. F.: Development of an Interferometric Oxygen Analyzer for Precise Measurement of the Atmospheric O2 Mole Fraction, PhD thesis, Division of Applied Sciences, Harvard University, Cambridge, Massachusetts, USA, 178 pp., https://scrippso2.ucsd.edu/scientific-literature.html (last access: 1 July 2022), 1988b.
Keeling, R. F. and Manning, A. C.: 5.15 – Studies of Recent Changes in Atmospheric O2 Content, in: Treatise on Geochemistry, 2nd edn., edited by: Holland, H. D. and Turekian, K. K., Elsevier, Oxford, 385–404, https://doi.org/10.1016/B978-0-08-095975-7.00420-4, 2014.
Keeling, R. F. and Shertz, S. R.: Seasonal and interannual variations in atmospheric oxygen and implications for the global carbon cycle, Nature, 358, 723–727, https://doi.org/10.1038/358723a0, 1992.
Keeling, R. F., Manning, A. C., McEvoy, E. M., and Shertz, S. R.: Methods for measuring changes in atmospheric O2 concentration and their application in southern hemisphere air, J. Geophys. Res.-Atmos., 103, 3381–3397, https://doi.org/10.1029/97JD02537, 1998.
Keeling, R. F., Manning, A. C., Paplawsky, W. J., and Cox, A. C.: On the long-term stability of reference gases for atmospheric ON2 and CO2 measurements, Tellus B, 59, 3–14, https://doi.org/10.1111/j.1600-0889.2006.00228.x, 2007.
Kozlova, E. A. and Manning, A. C.: Methodology and calibration for continuous measurements of biogeochemical trace gas and O2 concentrations from a 300-m tall tower in central Siberia, Atmos. Meas. Tech., 2, 205–220, https://doi.org/10.5194/amt-2-205-2009, 2009.
Manning, A. C.: Temporal variability of atmospheric oxygen from both continuous measurements and a flask sampling network: Tools for studying the global carbon cycle, PhD thesis, Scripps Institution of Oceanography, University of California, San Diego, La Jolla, California, USA, 202 pp., https://cramlab.uea.ac.uk/Publications.php (last access: 1 July 2022), 2001.
Manning, A. C., Keeling, R. F., and Severinghaus, J. P.: Precise atmospheric oxygen measurements with a paramagnetic oxygen analyzer, Glob. Biogeochem. Cy., 13, 1107–1115, https://doi.org/10.1029/1999GB900054, 1999.
Pickers, P. A.: New applications of continuous atmospheric O2 measurements: Meridional transects across the Atlantic Ocean, and improved quantification of fossil fuel-derived CO2, PhD thesis, School of Environmental Sciences, University of East Anglia, Norwich, UK, 262 pp., https://cramlab.uea.ac.uk/Publications.php (last access: 1 July 2022), 2016.
Pickers, P. A., Manning, A. C., Sturges, W. T., Le Quéré, C., Mikaloff Fletcher, S. E., Wilson, P. A., and Etchells, A. J.: In situ measurements of atmospheric O2 and CO2 reveal an unexpected O2 signal over the tropical Atlantic Ocean, Glob. Biogeochem. Cy., 31, 1289–1305, https://doi.org/10.1002/2017GB005631, 2017.
Pickers, P. A., Manning, A. C., Quéré, C. L., Forster, G. L., Luijkx, I. T., Gerbig, C., Fleming, L. S., and Sturges, W. T.: Novel quantification of regional fossil fuel CO2 reductions during COVID-19 lockdowns using atmospheric oxygen measurements, Sci. Adv., 8, eabl9250, https://doi.org/10.1126/sciadv.abl9250, 2022.
Rella, C. W., Chen, H., Andrews, A. E., Filges, A., Gerbig, C., Hatakka, J., Karion, A., Miles, N. L., Richardson, S. J., Steinbacher, M., Sweeney, C., Wastine, B., and Zellweger, C.: High accuracy measurements of dry mole fractions of carbon dioxide and methane in humid air, Atmos. Meas. Tech., 6, 837–860, https://doi.org/10.5194/amt-6-837-2013, 2013.
Resplandy, L., Keeling, R. F., Eddebbar, Y., Brooks, M., Wang, R., Bopp, L., Long, M. C., Dunne, J. P., Koeve, W., and Oschlies, A.: Quantification of ocean heat uptake from changes in atmospheric O2 and CO2 composition, Sci. Rep., 9, 20244, https://doi.org/10.1038/s41598-019-56490-z, 2019.
Ruckstuhl, A. F., Henne, S., Reimann, S., Steinbacher, M., Vollmer, M. K., O'Doherty, S., Buchmann, B., and Hueglin, C.: Robust extraction of baseline signal of atmospheric trace species using local regression, Atmos. Meas. Tech., 5, 2613–2624, https://doi.org/10.5194/amt-5-2613-2012, 2012.
Severinghaus, J. P.: Studies of the terrestrial O2 and carbon cycles in sand dune gases and in Biosphere 2, PhD thesis, Graduate School of Arts and Sciences, Columbia University, USA, 159 pp., https://doi.org/10.2172/477735, 1995.
Steinbach, J., Gerbig, C., Rödenbeck, C., Karstens, U., Minejima, C., and Mukai, H.: The CO2 release and Oxygen uptake from Fossil Fuel Emission Estimate (COFFEE) dataset: effects from varying oxidative ratios, Atmos. Chem. Phys., 11, 6855–6870, https://doi.org/10.5194/acp-11-6855-2011, 2011.
Stephens, B. B., Keeling, R. F., Heimann, M., Six, K. D., Murnane, R., and Caldeira, K.: Testing global ocean carbon cycle models using measurements of atmospheric O2 and CO2 concentration, Glob. Biogeochem. Cy., 12, 213–230, https://doi.org/10.1029/97GB03500, 1998.
Stephens, B. B., Bakwin, P. S., Tans, P. P., Teclaw, R. M., and Baumann, D. D.: Application of a differential fuel-cell analyzer for measuring atmospheric oxygen variations, J. Atmos. Ocean. Technol., 24, 82–94, https://doi.org/10.1175/JTECH1959.1, 2007.
Stephens, B. B., Keeling, R. F., and Paplawsky, W. J.: Shipboard measurements of atmospheric oxygen using a vacuum-ultraviolet absorption technique, Tellus B, 55, 857–878, https://doi.org/10.3402/tellusb.v55i4.16386, 2011.
Tohjima, Y.: Method for measuring changes in the atmospheric O2/N2 ratio by a gas chromatograph equipped with a thermal conductivity detector, J. Geophys. Res.-Atmos., 105, 14575–14584, https://doi.org/10.1029/2000JD900057, 2000.
Tohjima, Y., Machida, T., Watai, T., Akama, I., Amari, T., and Moriwaki, Y.: Preparation of gravimetric standards for measurements of atmospheric oxygen and reevaluation of atmospheric oxygen concentration, J. Geophys. Res.-Atmos., 110, D11302, https://doi.org/10.1029/2004JD005595, 2005.
Tohjima, Y., Mukai, H., Machida, T., Hoshina, Y., and Nakaoka, S.-I.: Global carbon budgets estimated from atmospheric ON2 and CO2 observations in the western Pacific region over a 15-year period, Atmos. Chem. Phys., 19, 9269–9285, https://doi.org/10.5194/acp-19-9269-2019, 2019.
Werle, P., Mücke, R., and Slemr, F.: The limits of signal averaging in atmospheric trace-gas monitoring by tunable diode-laser absorption spectroscopy (TDLAS), Appl. Phys. B, 57, 131–139, https://doi.org/10.1007/BF00425997, 1993.
Wilson, P. A.: Insight into the Carbon Cycle from Continuous Measurements of Oxygen and Carbon Dioxide at Weybourne Atmospheric Observatory, UK, PhD thesis, School of Environmental Sciences, University of East Anglia, Norwich, UK, 155 pp., https://cramlab.uea.ac.uk/Publications.php (last access: 1 July 2022), 2013.
Zhao, C. L. and Tans, P. P.: Estimating uncertainty of the WMO mole fraction scale for carbon dioxide in air, J. Geophys. Res.-Atmos., 111, D08S09, https://doi.org/10.1029/2005JD006003, 2006.


