the Creative Commons Attribution 4.0 License.
the Creative Commons Attribution 4.0 License.
 | 30 Aug 2023
First-time comparison between NO2 vertical columns from Geostationary Environmental Monitoring Spectrometer (GEMS) and Pandora measurements
Serin Kim
Daewon Kim
Hyunkee Hong
Lim-Seok Chang
Hanlim Lee
Deok-Rae Kim
Donghee Kim
Jeong-Ah Yu
Dongwon Lee
Ukkyo Jeong
Chang-Kuen Song
Sang-Woo Kim
Sang Seo Park
Jhoon Kim
Thomas F. Hanisco
Junsung Park
Wonei Choi
Kwangyul Lee
The Geostationary Environmental Monitoring Spectrometer (GEMS) is a UV-visible (UV-Vis) spectrometer on board the GEO-KOMPSAT-2B (Geostationary Korea Multi-Purpose Satellite 2B) satellite launched into a geostationary orbit in February 2020. To evaluate the GEMS NO2 total column data, a comparison was carried out using the NO2 vertical column density (VCD) that measured direct sunlight using the Pandora spectrometer system at four sites in Seosan, South Korea, from November 2020 to January 2021. Correlation coefficients between GEMS and Pandora NO2 data at four sites ranged from 0.35 to 0.48, with root mean square errors (RMSEs) from 4.7×10¹⁵ to 5.5×10¹⁵ molec. cm−2 for a cloud fraction (CF) <0.7. Higher correlation coefficients of 0.62–0.78 with lower RMSEs from 3.3×10¹⁵ to 5.0×10¹⁵ molec. cm−2 were found with CF <0.3, indicating the higher sensitivity of GEMS to atmospheric NO2 in less cloudy conditions. Overall, the GEMS NO2 total column data tended to be lower than the Pandora data, owing to differences in the representative spatial coverage, with a large negative bias under high CF conditions. With a correction for horizontal representativeness in the Pandora measurement coverage, correlation coefficients ranging from 0.69 to 0.81, with RMSEs from 3.2×10¹⁵ to 4.9×10¹⁵ molec. cm−2, were achieved for CF <0.3, showing a better correlation with the correction than without the correction.
- Article
(7205 KB) - Full-text XML
- BibTeX
- EndNote


Nitrogen dioxide (NO2) is a key species in the troposphere and stratosphere for atmospheric chemistry and air quality (Crutzen, 1979; Seinfeld and Pandis, 1998) and is mainly emitted by anthropogenic sources, such as fossil fuel combustion in vehicles and power plants. Natural sources, such as lightning, biomass burning, and soil microbial action are also major contributors to atmospheric NO2 (Crutzen, 1979). NO2 is a precursor of tropospheric ozone, aerosols, and the hydroxyl radical (OH; Boersma et al., 2009), and high concentrations affect the lifetime of atmospheric CH4 and the direct radiative forcing of the atmosphere (Pinardi et al., 2020). In addition, the NO2 diurnal cycles are important factors for understanding temporal patterns such as NOx emissions, chemistry, deposition, advection, diffusion, and convection (Li et al., 2021).
Therefore, it is important to monitor NO2 levels, and representative methods for this are as follows. Chemiluminescence-based in situ instruments have provided a highly accurate NO2 mixing ratio at a measurement location but with limited spatial coverage (e.g., Bechle et al., 2013; Jeong and Hong, 2021). Satellite-based remote sensing instruments on polar orbits, such as the GOME-1/2 (Global Ozone Monitoring Experiment 1 or 2; Burrows et al., 1999; Munro et al., 2016), SCIAMACHY (SCanning Imaging Absorption spectroMeter for Atmospheric CartograpHY; Bovensmann et al., 1999), OMI (Ozone Monitoring Instrument; Levelt et al., 2006), and TROPOMI (TROPOspheric Monitoring Instrument; Veefkind et al., 2012), have effectively complemented the ground-based observations by providing a global distribution of NO2 total column density (Lamsal et al., 2014). The recently introduced GEMS (Geostationary Environment Monitoring Spectrometer; Kim et al., 2020) on board the GEO-KOMPSAT-2B (Geostationary Korea Multi-Purpose Satellite 2B) was launched in February 2020. The NIER (National Institute of Environmental Research), from where the GEMS ground station is operated, has been transmitting the GEMS products, including NO2 vertical column density (VCD), in real time since December 2022. The GEMS Map of Air Pollution (GMAP) campaigns have taken place since 2020 and are also scheduled to be held annually to evaluate the quality of the GEMS measurements of trace gas and aerosol products based on trace gases, aerosol composition, and optical property measurements at various platforms. This study conducted the first quick evaluation via comparison between the GEMS NO2 VCDs and the Pandora NO2 VCD measurements at several sites in a suburban area in South Korea during the first GMAP campaign in 2020 winter. We evaluate the differences between NO2 VCDs obtained from Pandora and GEMS, especially with respect to cloudy and clear-sky conditions.
The comparison and validation of satellite-based NO2 VCD retrievals are essential because of their non-negligible error sources such as assumed atmospheric profiles, surface reflectance, and measurement uncertainties (Hong et al., 2017). In addition, NO2 VCD retrievals from GEMS require precise assessments because the observation geometries of the geostationary Earth orbit (GEO) are different from those of the low Earth orbits (LEOs), and other systematic uncertainties may affect the retrievals (e.g., diurnal variations in the atmospheric profiles, which are used for air mass factor, AMF, calculations). Ground-based remote sensing instruments such as the MAX-DOAS (multi-axis differential optical absorption spectroscopy; Hönninger et al., 2004) measure scattered sunlight at various elevation angles to derive tropospheric column amounts of NO2 and profile estimates (e.g., Irie et al., 2008; Wagner et al., 2011; Wang et al., 2017). Direct-sun instruments such as the Pandora (Herman et al., 2009) measure direct sunlight to retrieve the NO2 VCD, of which the absorption light path of the photons reaching to their detector may be shorter than those of the MAX-DOAS instruments; thus, they are less sensitive to the surface mixing ratio of NO2. However, uncertainties in NO2 VCD retrievals by AMF calculation are low, as they use simple geometric AMF (Herman et al., 2009). Numerous studies have utilized the recently expanding Pandonia Global Network (PGN; https://www.pandonia-global-network.org/, last access: 3 August 2023) for the validation of the polar-orbiting satellite products (e.g., Herman et al., 2009; Tzortziou et al., 2014, 2015; Herman et al., 2019; Judd et al., 2019, 2020; Pinardi et al., 2020; Verhoelst et al., 2021).
This study represents the first attempt to compare and validate NO2 VCD retrievals from GEMS with Pandora instruments deployed during the GMAP (GEMS Map of Air Pollution, from November 2020 to January 2021) campaign in Seosan, South Korea. The measurement periods and locations of the four Pandora instruments are summarized in Fig. 1 and Table 1. In Sect. 2, the campaign and GEMS data are explained, followed by the Pandora instrument and retrieval methodology. Section 3 provides a comparison between the instruments and between Pandora and GEMS. The results are described in three parts in Sect. 4, which includes an intercomparison between Pandora instruments, a comparison with GEMS NO2, and the consideration of horizontal representativeness. Finally, the conclusions are provided in Sect. 5.
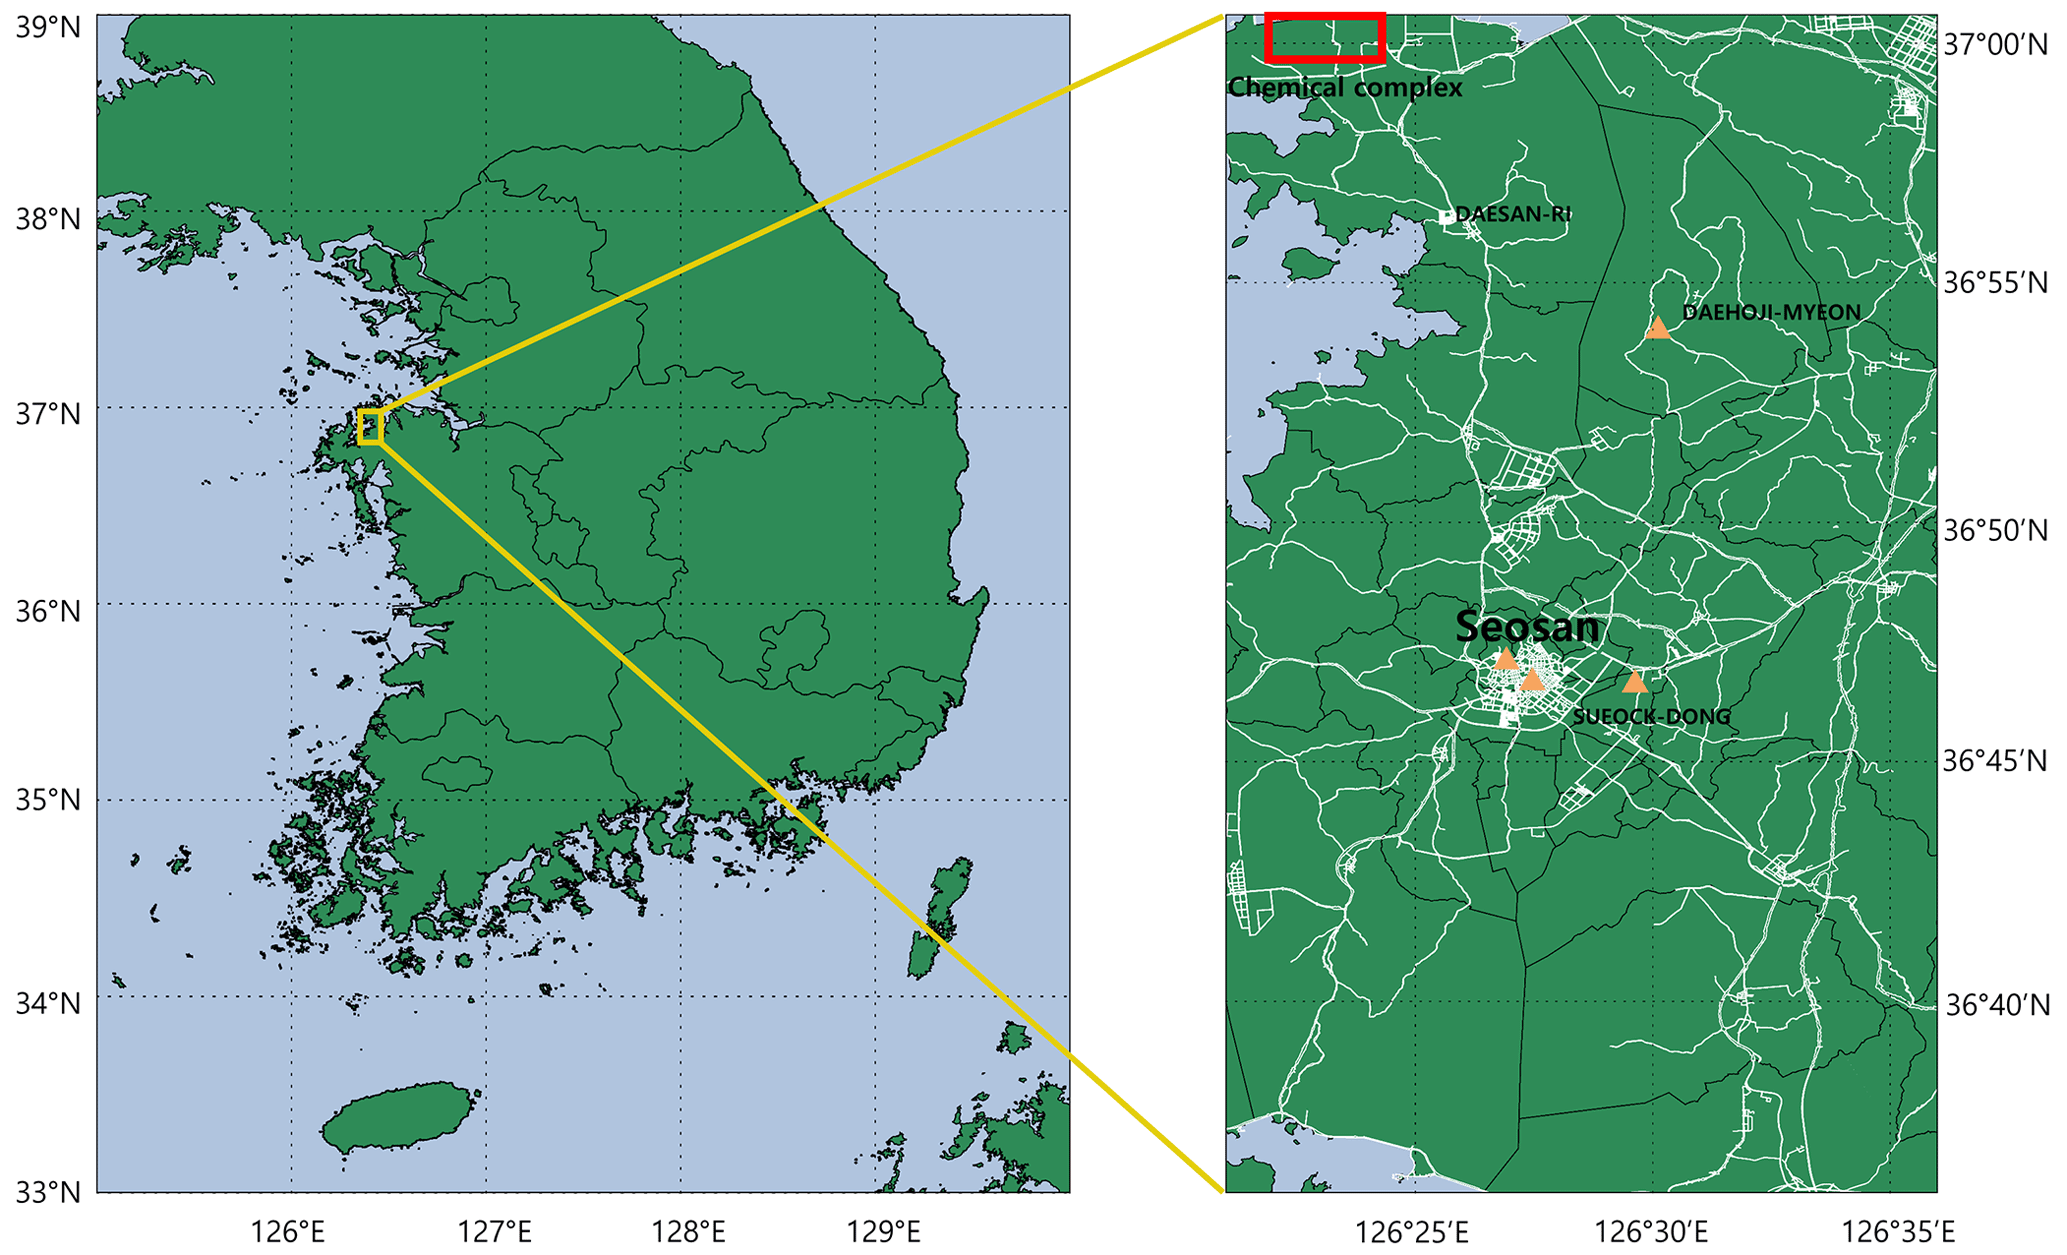
Figure 1Measurement sites for the GMAP 2020 campaign. Triangles indicate observation sites.
2.1 The first GMAP campaign
The first GEMS validation campaign, GMAP 2020, was conducted between November 2020 and January 2021 in Seosan. The Pandora instruments used in the campaign were the standard versions described in Sect. 3.1. The mean NO2 concentration in Seosan for 2016–2020 was 0.017 ppm, which is ∼0.16 % lower than the South Korean national 5-year average (https://www.airkorea.or.kr/web, last access: 7 March 2021). Direct sunlight measurements were conducted at four sites, as described in Table 1 and Fig. 1, namely Seosan (SS), Seosan City Council (CC), Dongmoon-2dong (DM2), and Daehoji (DHJ). Emissions from vehicular and point sources may have contributed to variations in NO2 concentrations in the Pandora lines of sight, depending on the wind direction. Major roads and an agricultural complex were located within ∼0.7 km of the SS site, a road and roundabout were near the CC site, a road was near the DM2 site, and a petrochemical complex was located approximately 16 km NW of the DHJ site. To estimate the differences in the NO2 VCD among the Pandora instruments, an initial intercomparison was conducted for 2 weeks at the SS site. It should be noted that the Pandora instruments were manufactured with the same optics and spectrograph. However, it is still important to quantify the differences between the NO2 columns retrieved from the four Pandora instruments at the same location before comparing them with the GEMS NO2. Instruments were installed at these four sites to measure direct sunlight from December 2020 to January 2021. The measurement periods varied according to the instrument conditions (Table 1).
2.2 GEMS NO2 data
GEMS, a hyperspectral UV-visible (UV-Vis) image spectrometer, covers a wavelength range of 300–500 nm, with a full width at half maximum (FWHM) of approximately 0.6 nm. GEMS measures atmospheric concentrations of species that affect air quality, such as NO2, O3, SO2, HCHO, and aerosols on an hourly basis, from 00:45 to 05:45 UTC, with a spatial resolution of 3.5 km × 8 km (Kim et al., 2020). The GEMS NO2 column retrieval was based on the differential optical absorption spectroscopy (DOAS) algorithm (Platt and Stutz, 2008) at wavelength intervals of 432–450 nm (Park et al., 2020). The GEMS cloud fraction (CF) is retrieved using O2–O2 absorption properties and DOAS (Choi et al., 2020). We used CF for the comparison of NO2 VCDs (for more details, see Sect. 3). For data evaluation, we used GEMS L2 NO2 VCD version 1.0, which was available immediately after the IOT (in-orbit test) carried out in July 2020.
2.3 Pandora instrument and spectral fitting
Pandora is a ground-based spectrometer that measures direct sunlight over a wavelength range of 280–525 nm, with an FWHM of approximately 0.6 nm. The charge-coupled device (CCD) detector in the Pandora spectrometer has 2048×64 pixels. The spectrometer is connected to a telescope head sensor consisting of a collimator and filters such as UV340 filter, neutral density filters, and opaque filter through an optical fiber, with a 400 µm core diameter. A target area can be observed with a field of view (FOV) of up to 1.6∘ (Herman et al., 2018).
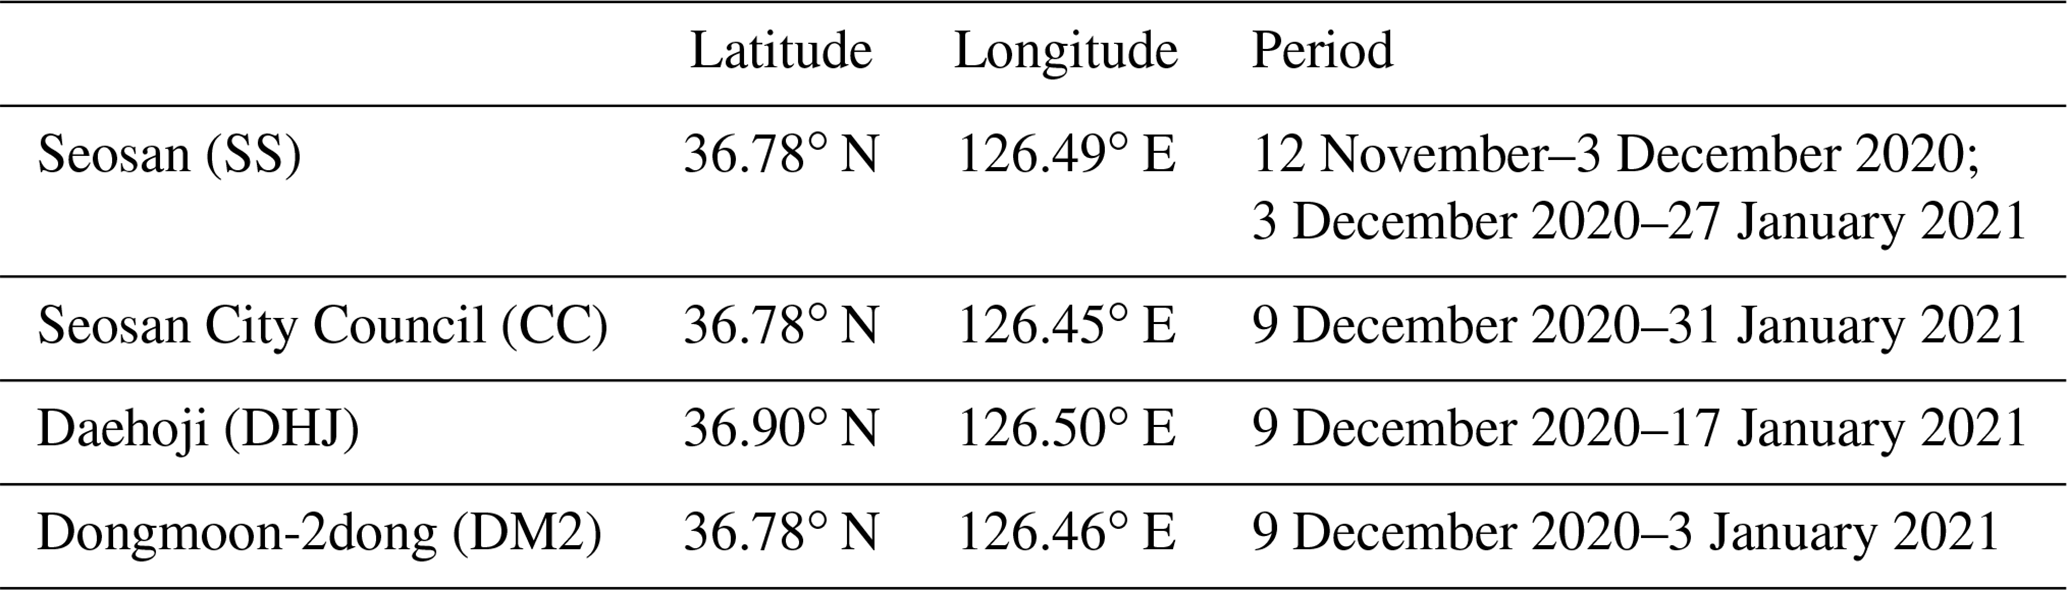
The four instruments used here are referred to as P1, P2, P3, and P4. The measured spectra were analyzed to retrieve NO2 slant column densities (SCDs), using QDOAS software (Fayt et al., 2011) and based on the DOAS technique, which can retrieve trace gas concentrations by separating the trace gas absorption cross section into slowly and rapidly varying parts (Hönninger et al., 2004). The reference spectrum used for fitting was measured at around noon on a clear day (Herman et al., 2009). This refers to the spectrum with the lowest NO2 concentration used to perform optical density fitting over a period of time. During the intercomparison, the radiance obtained at noon on 28 November (a clear day) was used as the reference spectrum for P1, P3, and P4. The day of 14 November was used as a reference for P2 due to the lack of data on 28 November 2020. As the NO2 differential VCD (dVCD) from P2 was retrieved using a different reference spectrum, it was considered to be secondary data. The NO2 differential slant column density (dSCD) was obtained using the absorption cross sections for NO2 (254.5 K), which were calculated using 220 and 294 K (Vandaele et al., 1998), and O3 (225 K; Serdyuchenko et al., 2014) as a fourth-order polynomial in the fitting window of 400–440 nm. The wavelength range and absorption cross section were the same as those used in PGN (https://pandora.gsfc.nasa.gov/, last access: 28 March 2022). Additionally, we used O4 at 293 K (Thalman and Volkamer, 2013) for the spectral fitting (see Fig. 2). This reduced the retrieval error by about 0.2 %. Figure 2 shows an example of the P1 spectrum fitting results at 10:43 local time (LT) on 28 November 2020. The NO2 VCD was obtained by dividing the NO2 SCDs by the geometric AMFs. After the initial intercomparison, the reference spectrum was selected when the weather was clear and with no air pollution because the instrument locations were different. P1 and P4 used the noon spectrum on 14 January 2021 as a reference spectrum, whereas P2 and P3 used spectra from 19 December 2020.
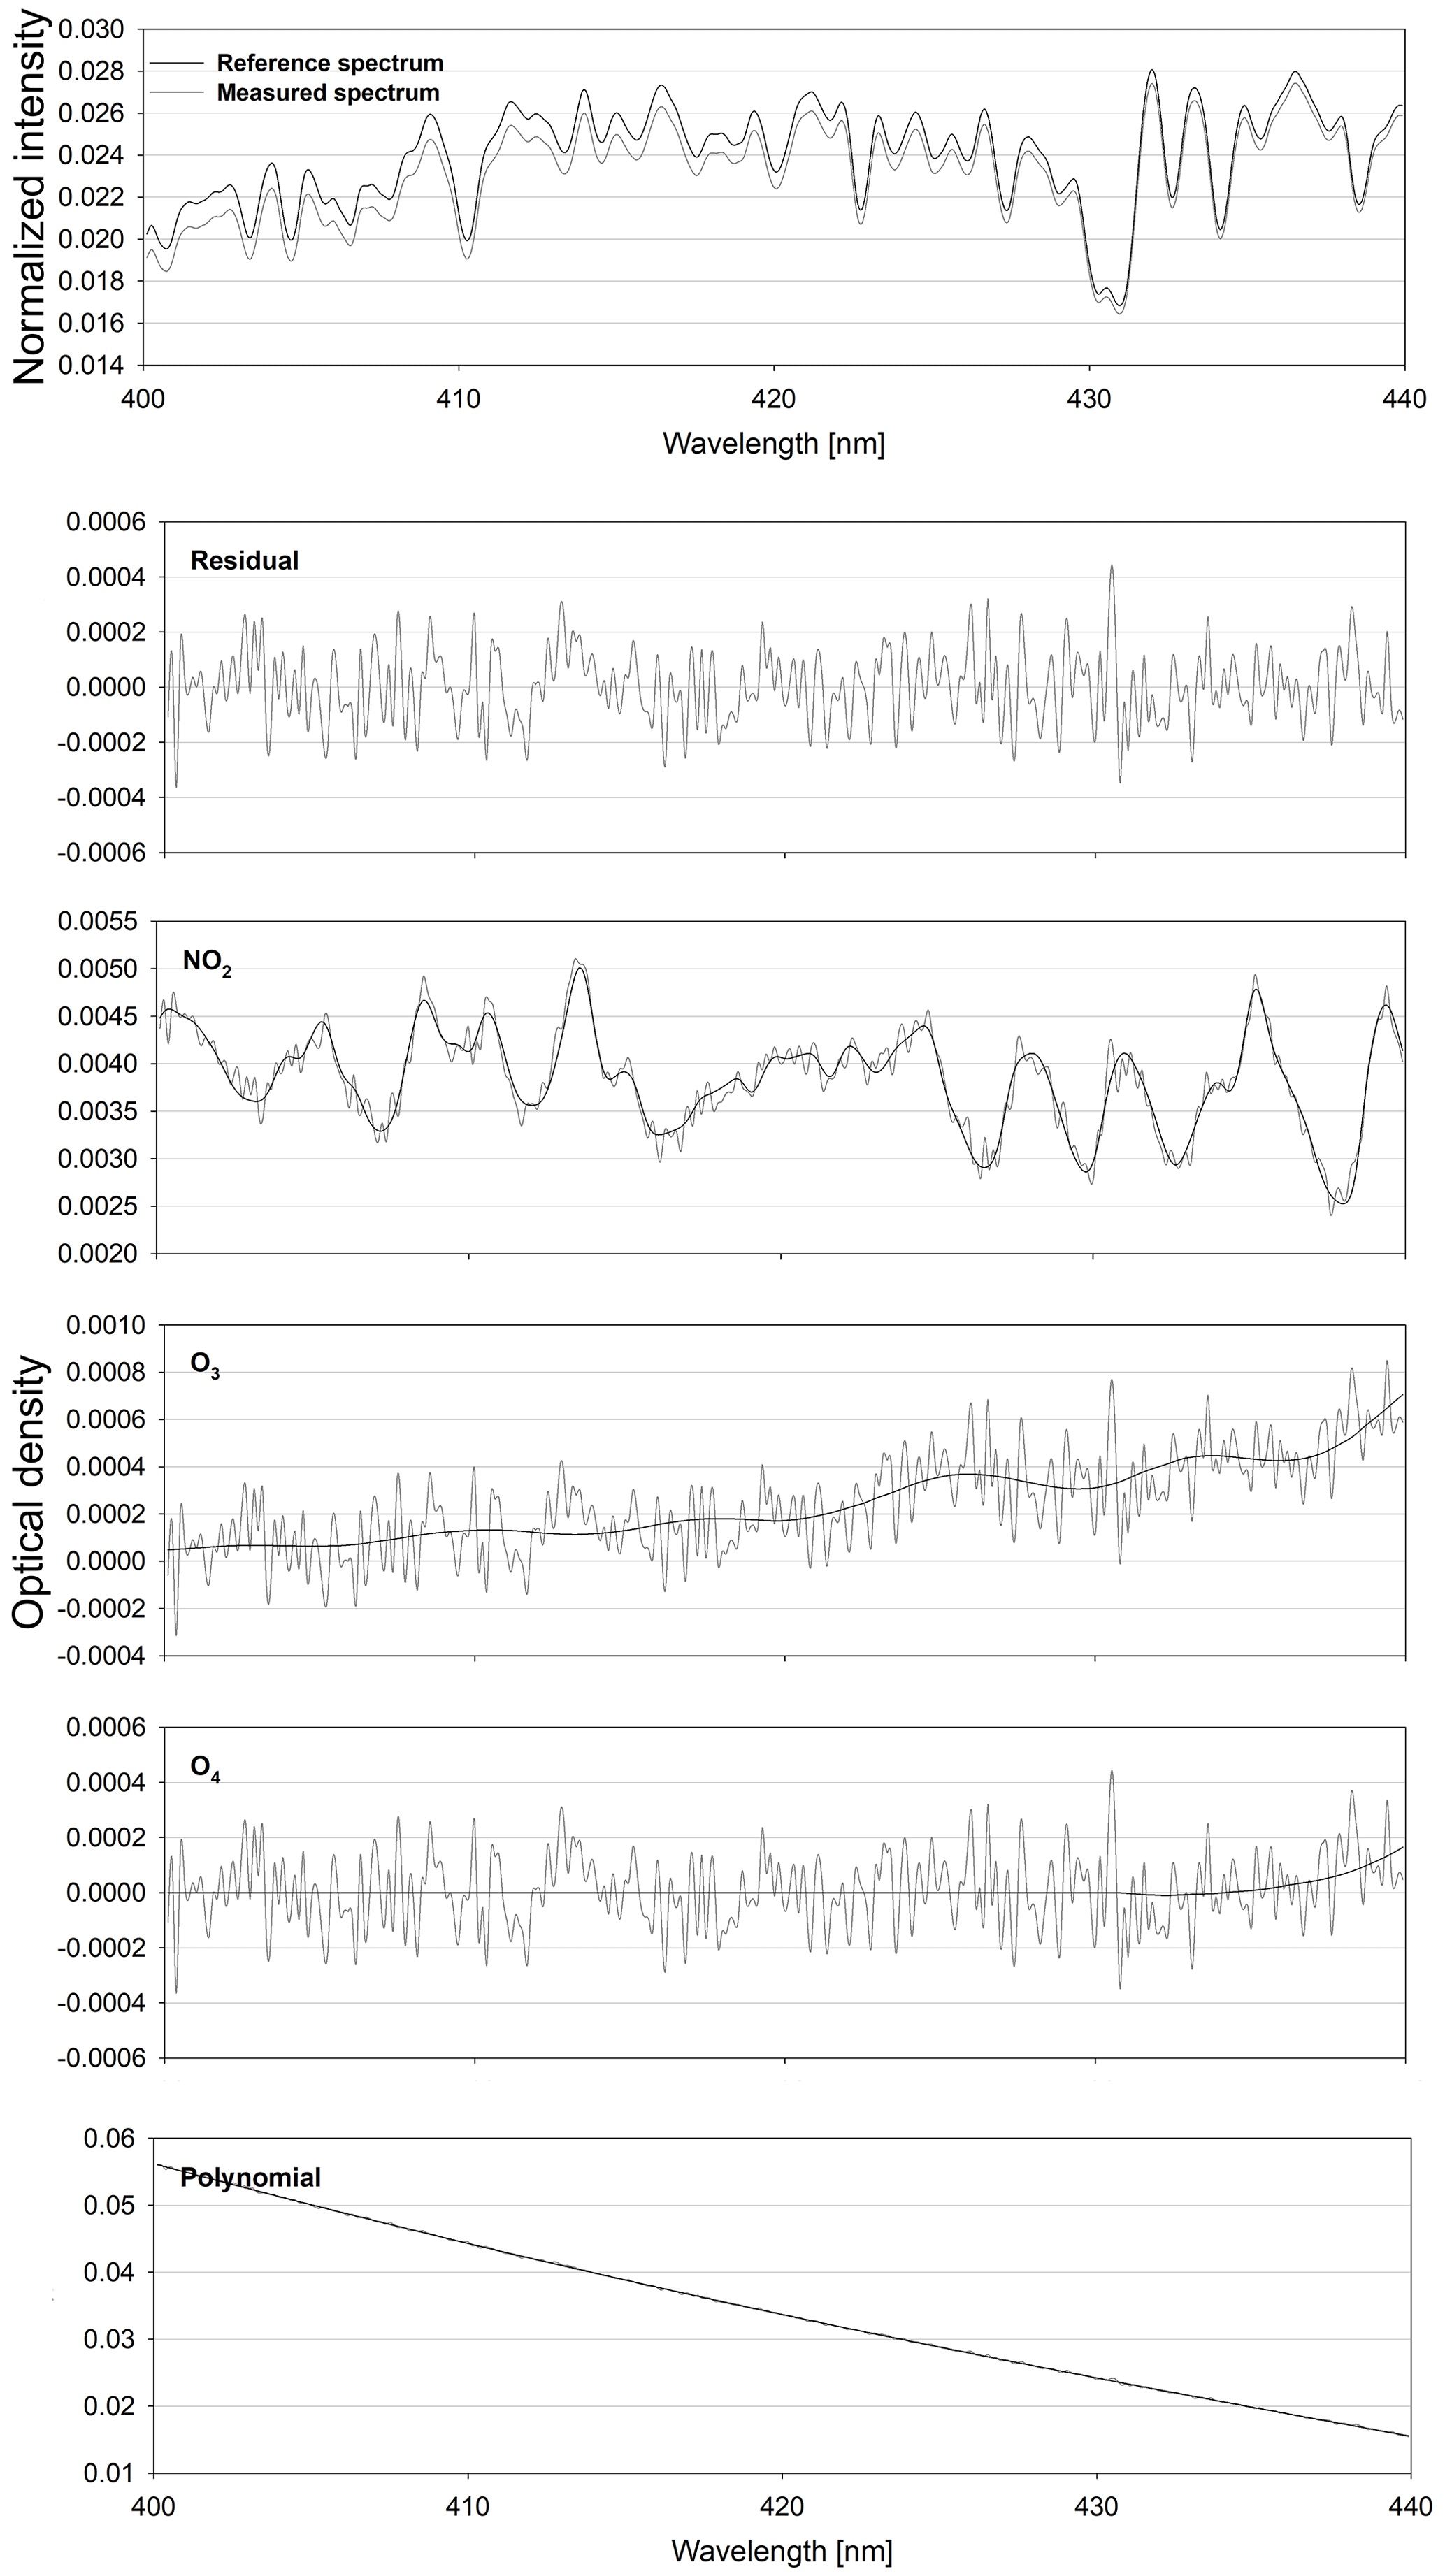
Figure 2Fitted slant column optical depths example for 28 November 2020 at 10:43:37 LT for P1. The black line represents the absorption signal, and the gray line represents the absorption signal and fit residual.
This study aimed to evaluate the GEMS NO2 VCD via quick comparisons between the GEMS NO2 column data and those of Pandora data. The differences between the Pandora and GEMS NO2 data can be attributed to uncertainties in the Pandora and GEMS NO2 columns and differences in the measurement geometries. The spatiotemporal differences between the Pandora and GEMS measurements also cause differences between the NO2 column data obtained from the two platforms. To quantify the differences in the Pandora NO2 measurements, all four Pandora instruments performed identical direct-sun measurements at the SS site during the intercomparison period by setting the same observation schedules for all instruments. The NO2 retrievals from the four colocated Pandora instruments showed consistency with respect to the processed data, as shown in Figs. 3 and 4. The specifications and retrieval methods for Pandora are described in Sect. 2.3. During the intercomparison, because clear days were not sufficient to calculate the background concentration, we compared the Pandora instruments using dVCD. On the other hand, in the comparison with GEMS NO2, NO2 VCDs from Pandora were used. As it measures direct sunlight, it is negligibly affected by scattered sunlight. However, under cloudy conditions, not all Pandora instruments may see the same location of the Sun because of the inhomogeneity of cloud thinness. In conditions with thick clouds compared with clear-sky conditions, it may lead to the inclusion of unwanted stray light and increase detector noise. To understand the influence of clouds, Pandora was investigated using the GEMS cloud fraction (CF) to determine whether the signal was affected by clouds.
Figure 3Time series of Pandora retrievals during the intercomparison. Circle (red), square (orange), triangle (green), and diamond (blue) symbols represent total NO2 dVCD for P1, P2, P3, and P4, respectively. The gray shading represents the Pandora aerosol cloud thickness.
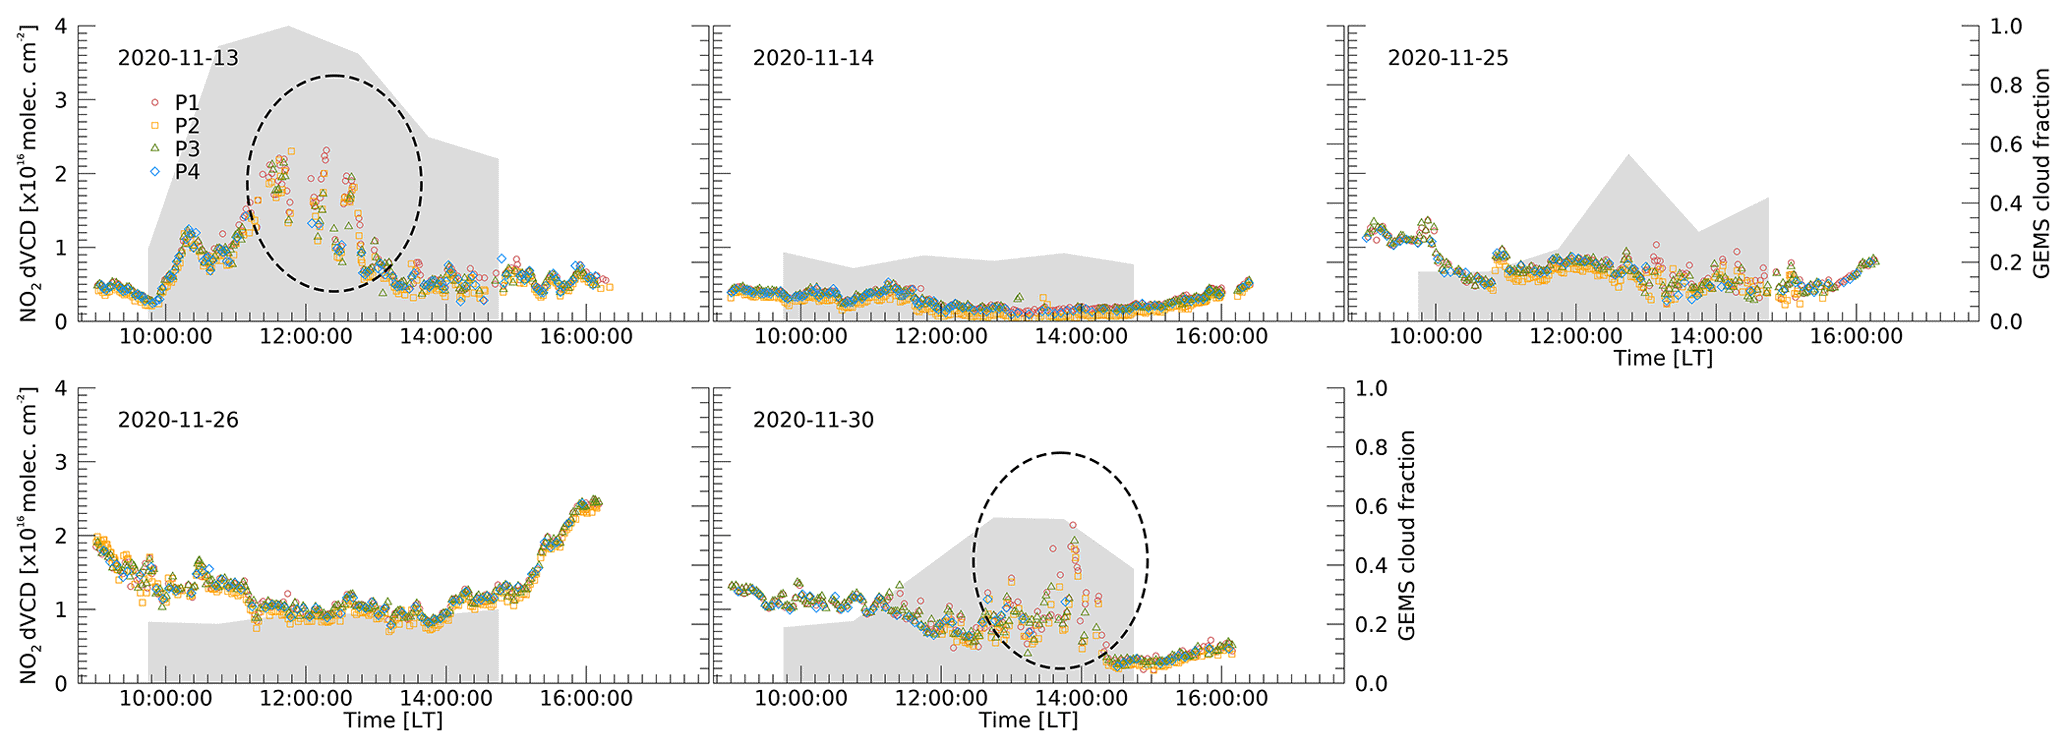
Figure 4Time series of Pandora retrievals during the intercomparison. Circle (red), square (orange), triangle (green), and diamond (blue) symbols represent total NO2 dVCD for P1, P2, P3, and P4, respectively. The gray shading represents the GEMS cloud fraction.
4.1 The intercomparison of NO2 dVCD from Pandora
A Pandora intercomparison was carried out from 12 November to 3 December 2020 at the SS site to quantify NO2 dVCD retrievals from the Pandora instruments. We defined dVCD as differential SCD-divided AMF with no background correction.
The time series of the data from all instruments for the intercomparison period are shown in Figs. 3 and 4, except for the rainy days. Circles, squares, triangles, and diamond symbols represent the NO2 dVCD retrieved by P1, P2, P3, and P4, respectively. The gray area in Fig. 3 represents the Pandora aerosol cloud thickness (ACT), which indicates the aerosol optical depth (AOD) before cloud screening. ACT was retrieved with the Spectral Measurements for Atmospheric Radiative Transfer–spectroradiometer (SMART-s) algorithm developed for aerosol retrieval using the optimal estimation method (OEM; Jeong et al., 2020). The diurnal patterns of NO2 for each Pandora instrument showed good agreement. The NO2 dVCD during the period ranged from 1.63×10¹⁴ to 2.49×10¹⁶ molec. cm−2 and tended to increase during the morning and late afternoon (after 16:00 Korea standard time, hereafter KST). At midday, emissions are relatively lower than those during rush hour, which have NO2 emissions from vehicles (Zhao et al., 2020). As Seosan is a suburban area, it can be affected by commuting vehicles. As shown in Fig. 3, although there was a good agreement between the instruments, discrepancies occurred in some cases. This occurs when there are many clouds with ACT greater than about 2.5. It is considered that clouds contributed to the discrepancies, which shows certain cloud effects on the NO2 retrievals from the ground-based direct-sun measurements. Thus, aerosols and clouds can affect the retrieval accuracy of trace gases. Therefore, when comparing with GEMS, GEMS CF was used to consider the effects of clouds. Before comparison with GEMS, GEMS CF was also applied during the intercomparison, and this can be seen in Fig. 4. The gray area in Fig. 4 represents the GEMS CF of the GEMS observation time. The ovals with dashed lines (Fig. 4) indicate periods with discrepancies between the Pandora instruments during the afternoons of 13 and 30 November, similar to the case of the ACT retrieved from Pandora measurements. Although the temporal trends of ACT and GEMS CF were similar, there is a difference in the spatiotemporal resolution. The GEMS spatial resolution is 3.5×8 km2, and the measurement area of Pandora could be a clear sky, even if GEMS retrieved high CF. These differences sometimes result in less of a spread of Pandora NO2 for CF >0.3. Thus, we compared NO2 VCDs from Pandora and those from GEMS, depending on the CF conditions of less than 0.3, 0.5, and 0.7. Figure 5 shows the linear regression of the NO2 dVCDs from P2, P3, and P4 against those from P1, which produced the smallest fitting errors on average during the intercomparison period.
In Fig. 5a, b, and c, the correlation coefficients were found to be 0.99, with a slope of 1 and an interceptor between 0.004 and 0.09, showing good agreement for all CF conditions. Overall, the NO2 retrieved by each instrument yielded similar correlations, even with CF >0.3, although the R values were slightly lower in Fig. 5d–f, with slopes deviating further from the 1:1 line.
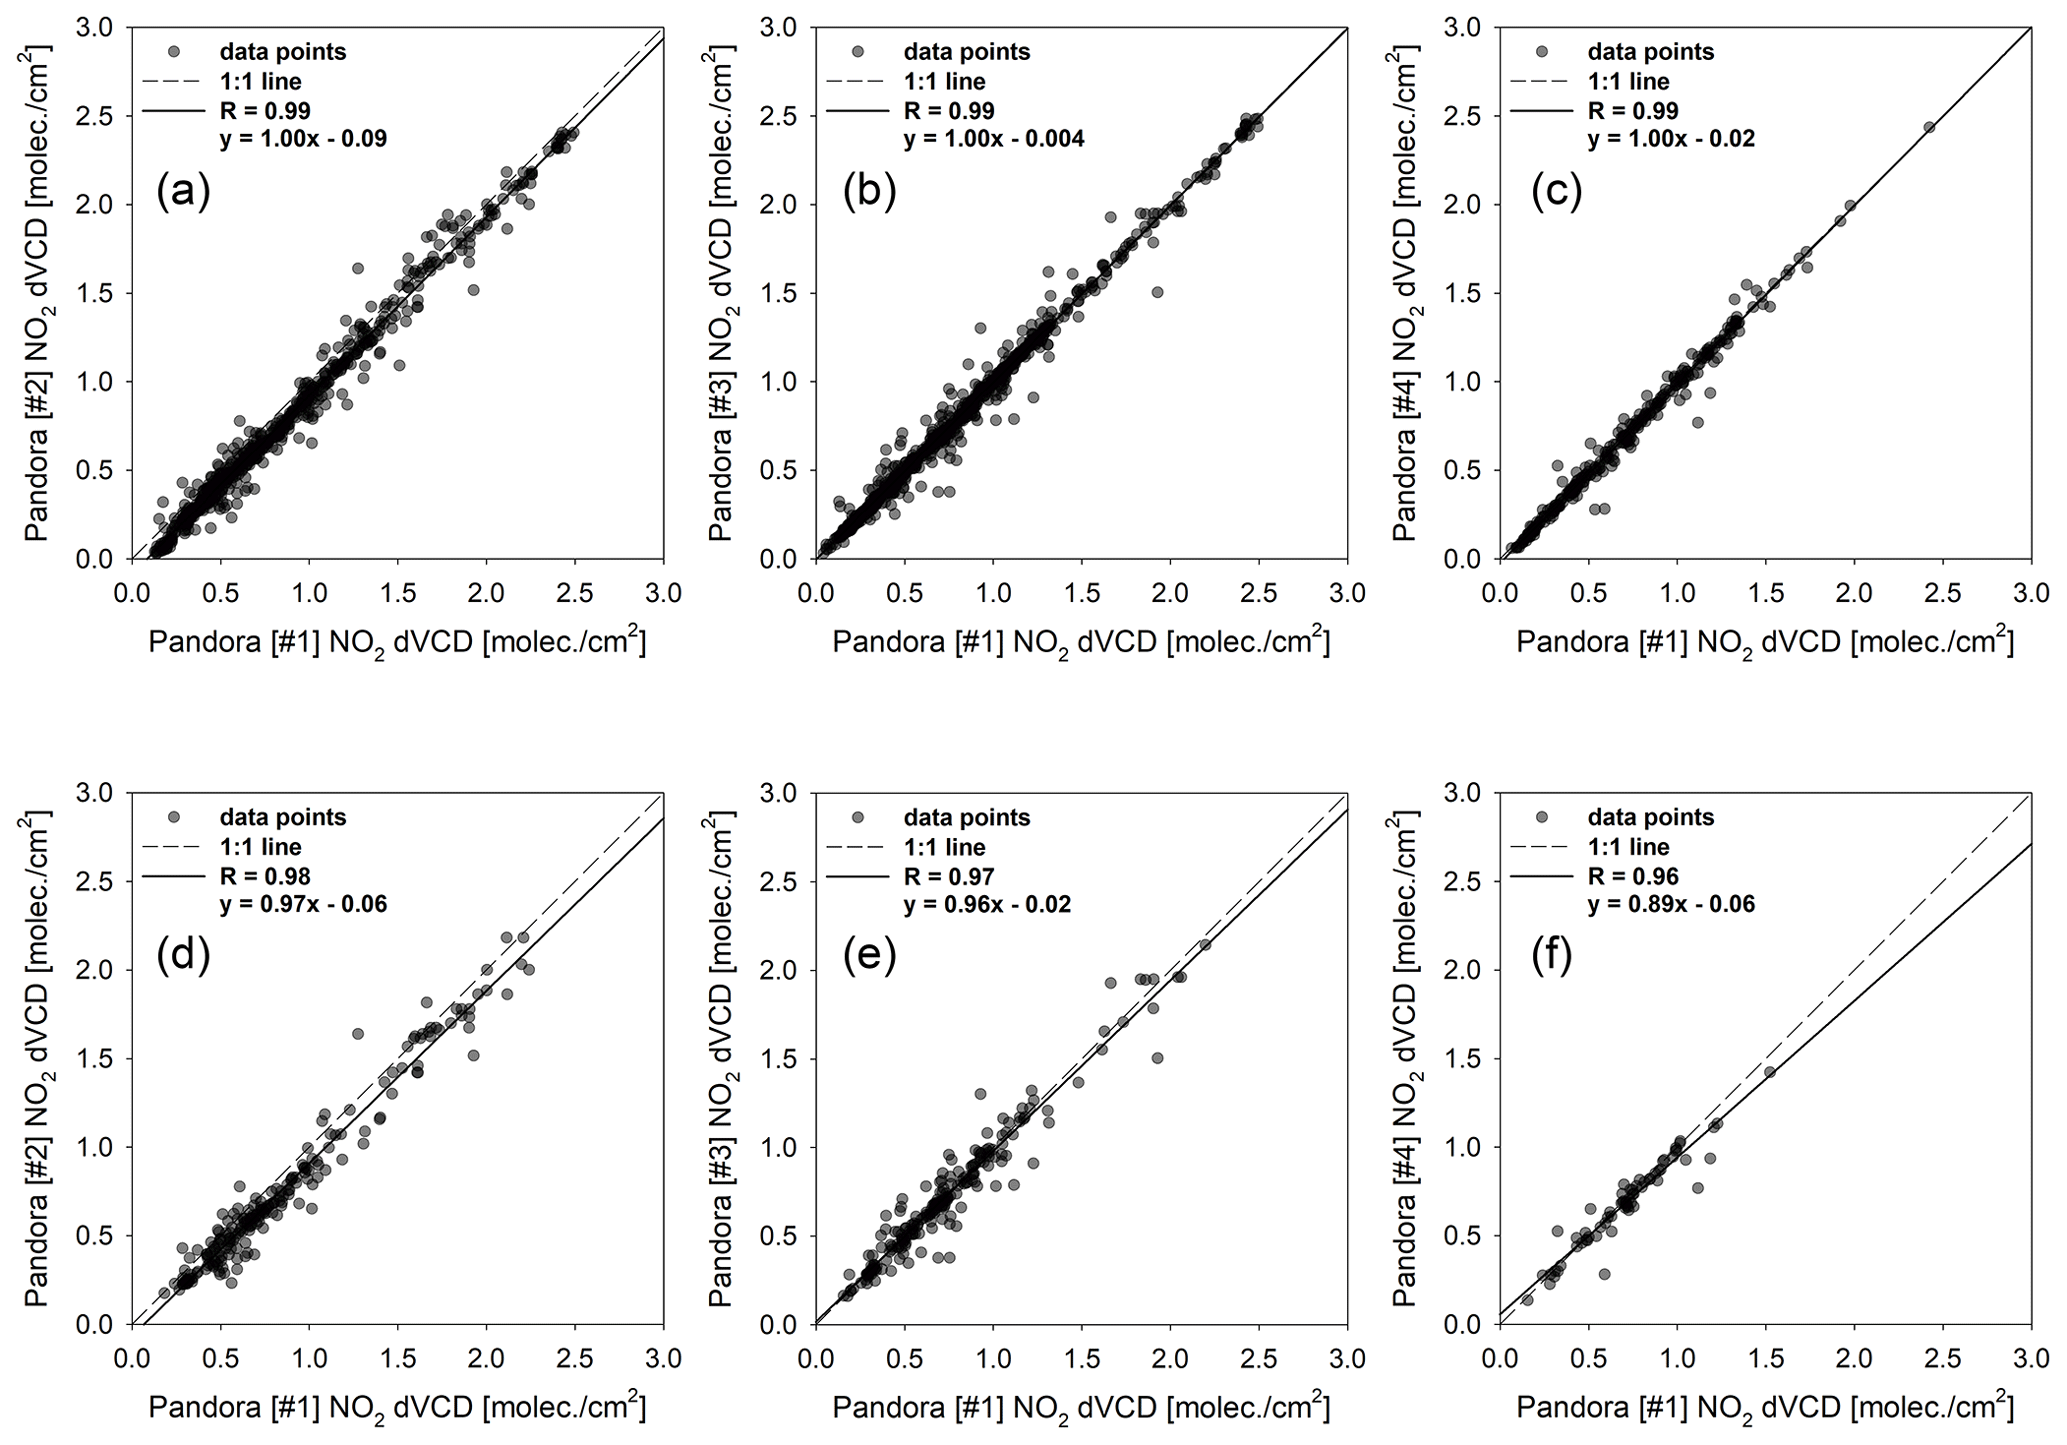
Figure 5The scatterplots between P1 and others. Panels (a), (b), and (c) show the comparison with all data of P2, P3, and P4. Panels (d), (e), and (f) show the comparison with P2, P3 and P4 when GEMS CF >0.3.
4.2 Comparison of NO2 VCD between Pandora and GEMS
After the intercomparison period, the Pandora instruments were moved to the four sites for the observation of direct sunlight to evaluate NO2 VCD for comparison with GEMS data. The measurement was carried out from 9 December 2020, and it was either snowing or raining for more than half of the measurement period. For the validation of GEMS, Pandora data were averaged within ±10 min from the center of the GEMS observation time. The GEMS measurement pixels are not fixed but rather change as a function of time. Therefore, comparisons were made using the GEMS pixels closest to each Pandora station. Comparisons were carried out between the NO2 VCDs obtained from Pandora and GEMS at CFs of 0.3, 0.5, and 0.7. The direct-sun DOAS (DS-DOAS) horizontal absorption path lengths are generally within 4 km, with a solar zenith angle (SZA) <50∘ (Herman et al., 2009). However, most SZAs were greater than 50∘ during the campaign period. Thus, a single GEMS pixel may not cover the absorption path of the Pandora observations. This horizontal discrepancy was partly considered in the comparison between the Pandora NO2 data and those of the GEMS, which can be found in Sect. 4.3.
The hourly variations in the NO2 VCD obtained from Pandora and GEMS are shown in Fig. 6 and compared for each of the four Seosan sites in Fig. 7. Figure 6 shows a good agreement between Pandora and GEMS for all time periods. Since the GEMS measures six times in winter (10:00–15:00 KST), but the Pandora NO2 VCDs were retrieved from sunrise to sunset when the SZA was less than 80∘, Pandora NO2 VCDs have a slightly more widespread trend. In Fig. 7, the differences in the diurnal Pandora NO2 VCD variations among the sites imply the inhomogeneity of the spatial tropospheric NO2 columns over the sites. The hourly characteristics observed at the DHJ site could possibly be affected by emissions from the petrochemical complex located approximately 16 km northwest of the site (see Fig. 1). There appears to be a discrepancy in the NO2 peaks observed from Pandora and GEMS at the CC site, where GEMS shows enhanced NO2 columns at 12:00 and 14:00 LT. The NO2 columns observed from GEMS show hourly patterns similar to those from Pandora at the DHJ site. At the DM2 site, the Pandora and GEMS VCD patterns were consistent, with both displaying peaks at 11:00 LT, followed by a decreasing trend. Overall, the NO2 VCD from Pandora and GEMS showed hourly variations, although those from Pandora tended to have slightly higher values than those from GEMS. There could be several reasons for this difference, which are discussed later. Further quantitative comparisons of the Pandora and GEMS data were performed, as discussed below.
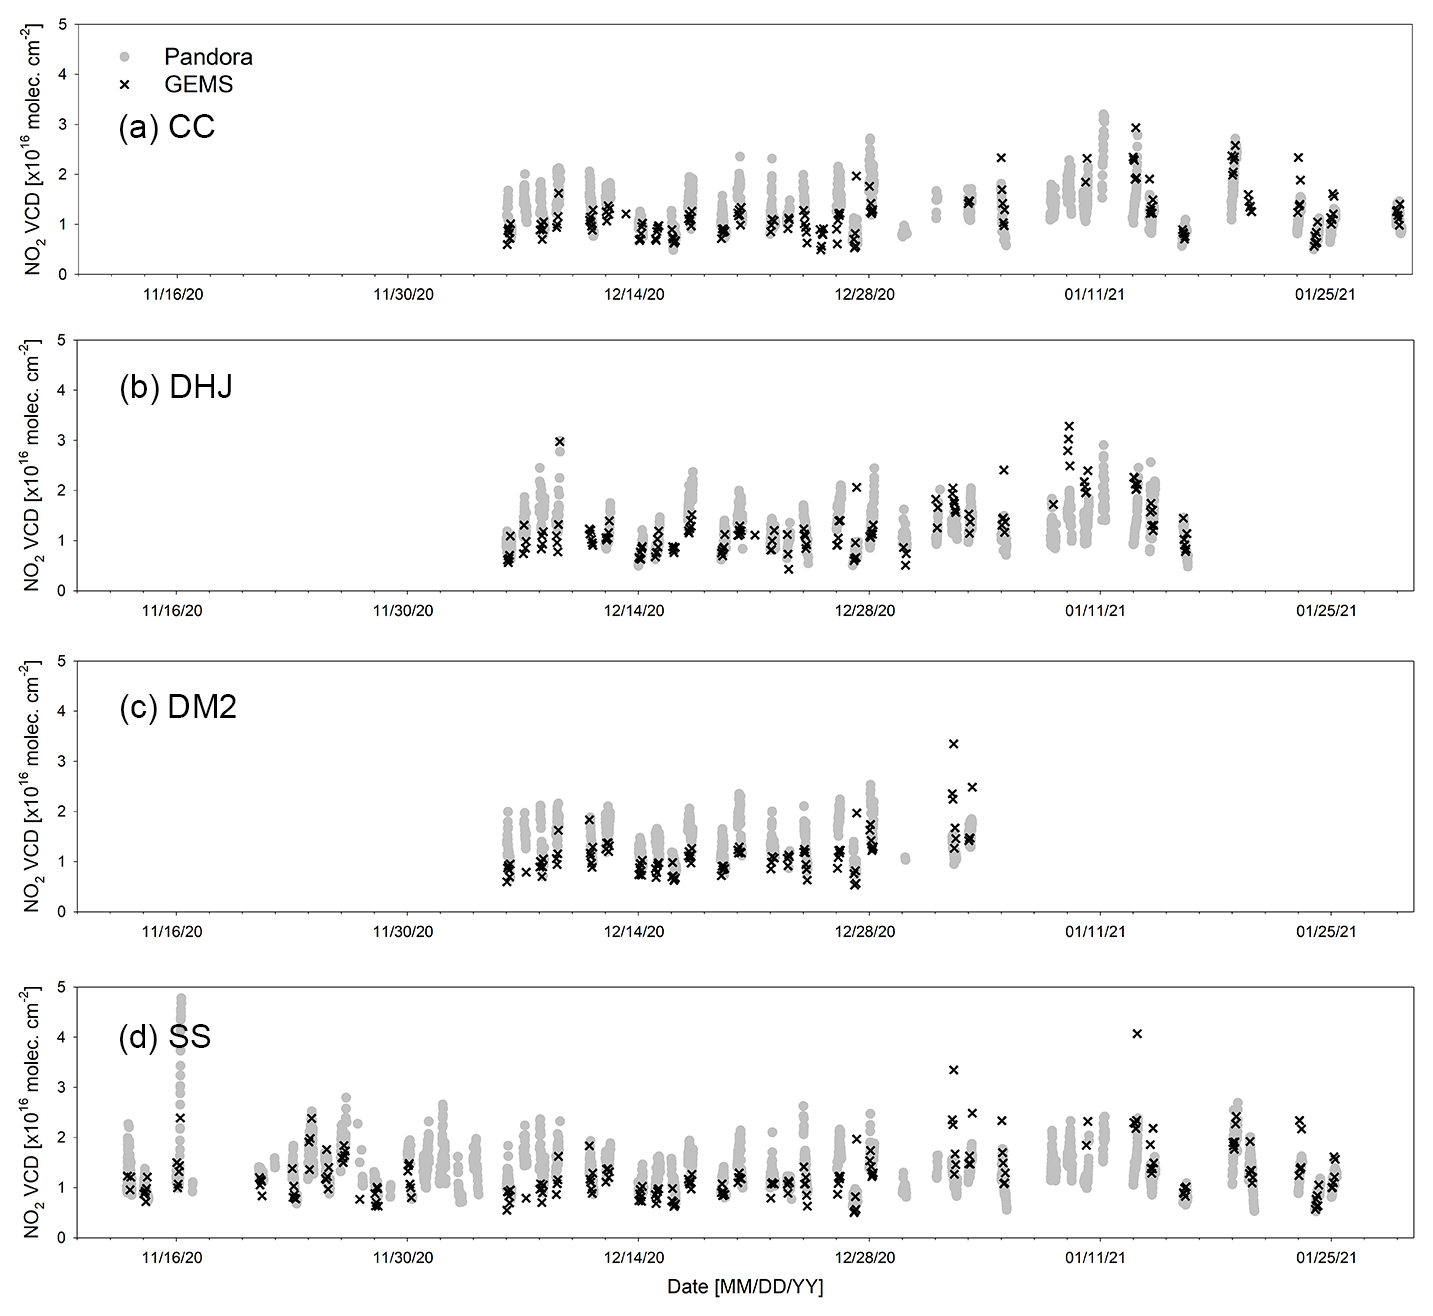
Figure 6Hourly variations in NO2 VCD were obtained from Pandora (full gray circles) and GEMS (black crosses). Panels (a), (b), (c), and (d) represent the CC, DHJ, DM2, and SS sites, respectively.
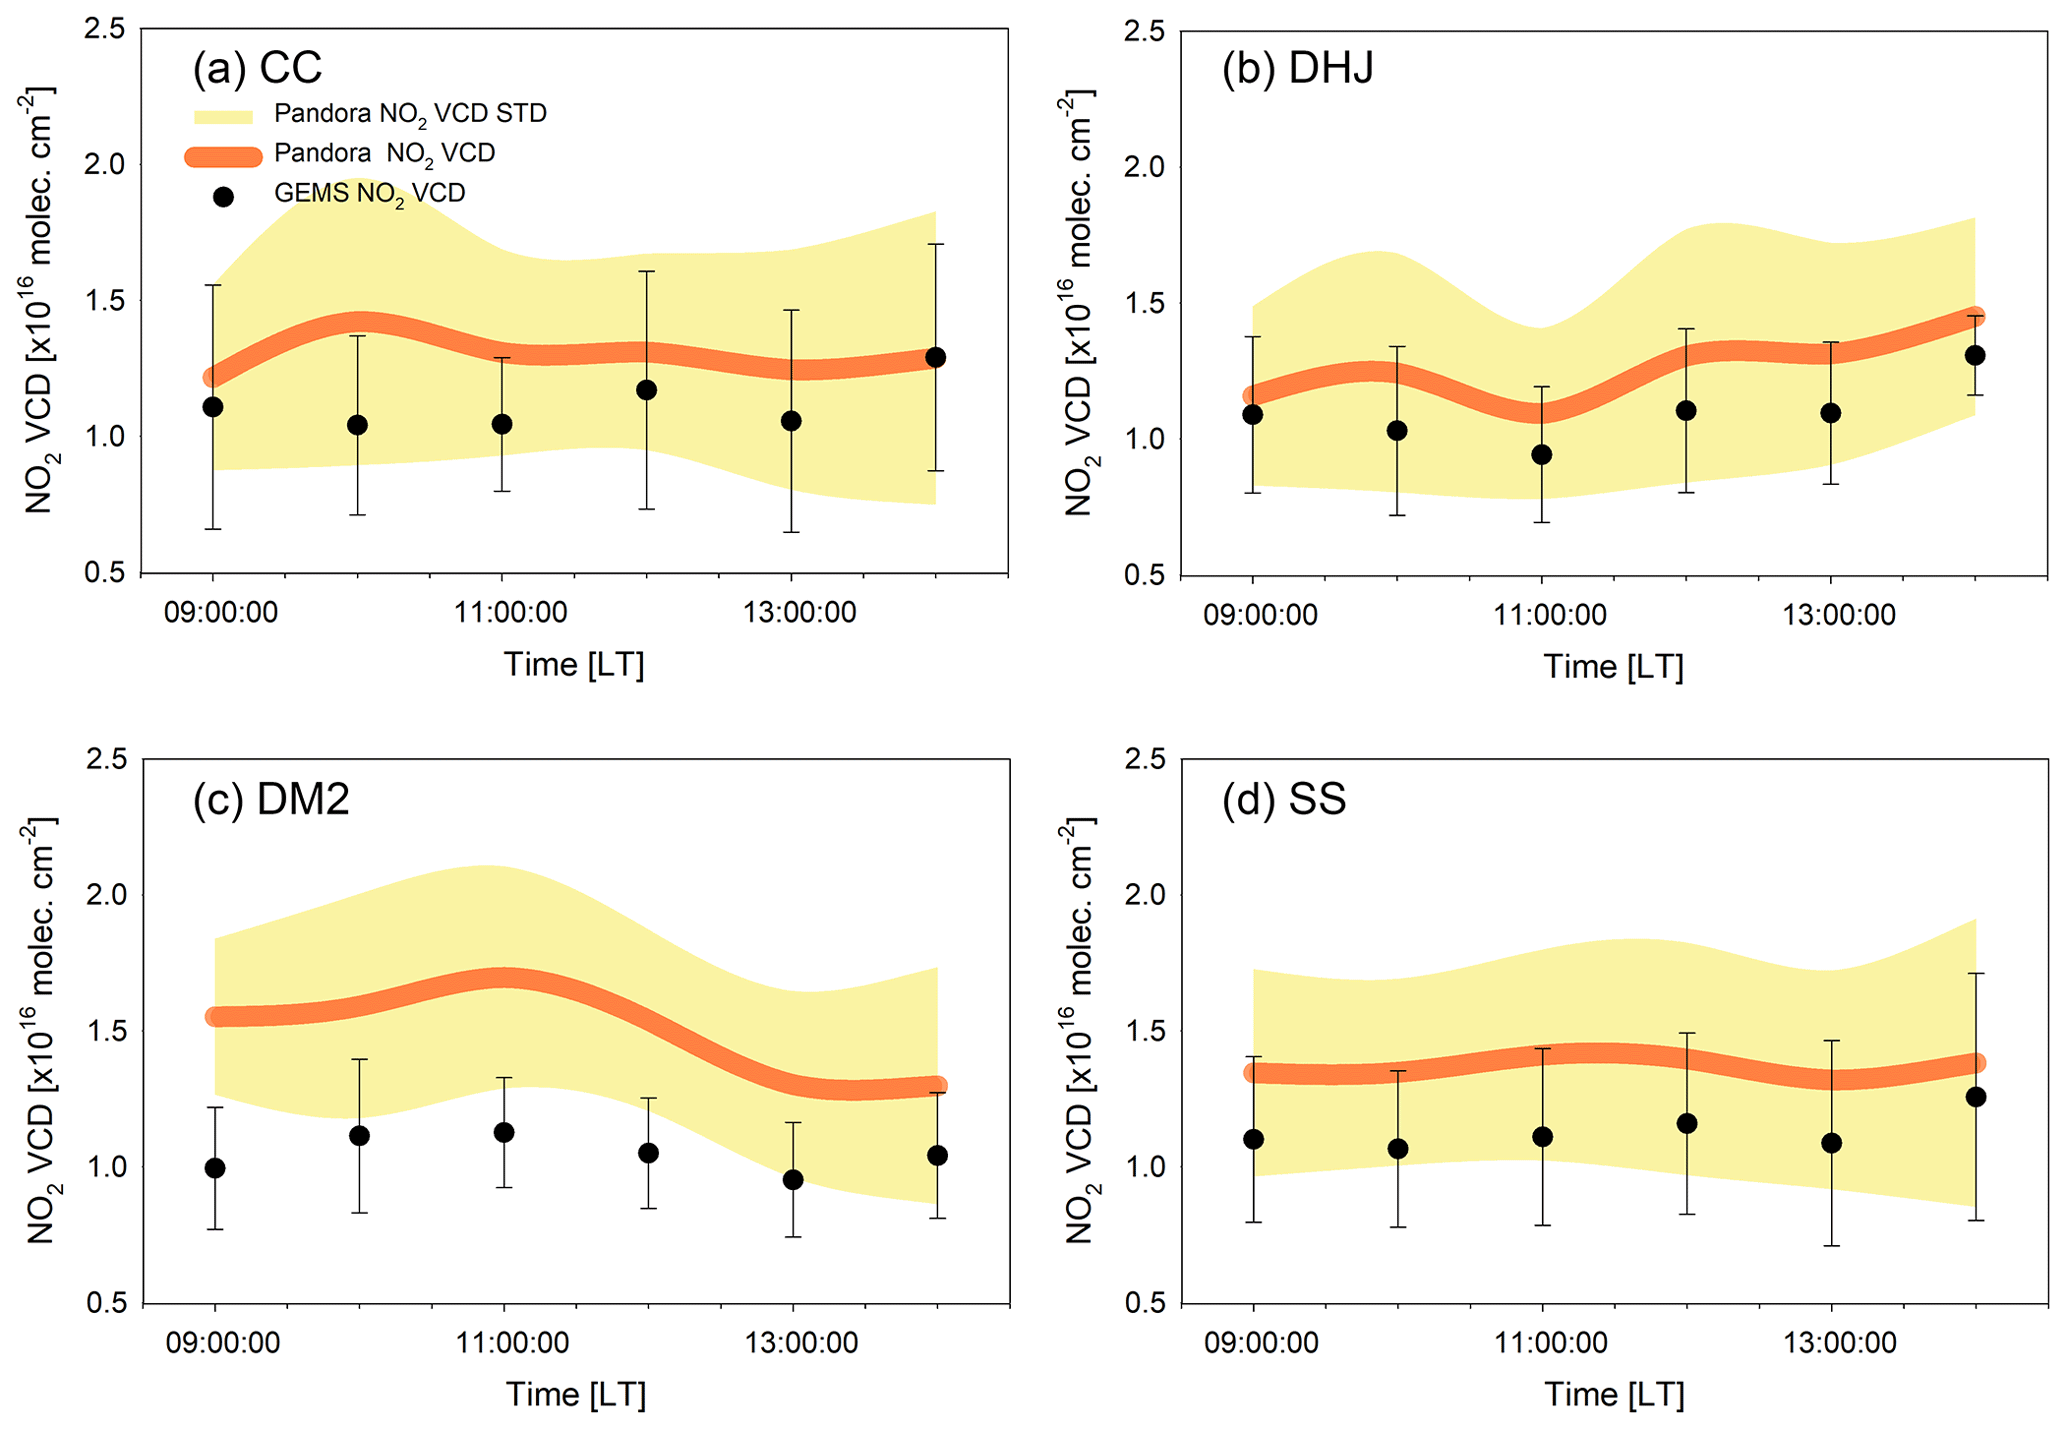
Figure 7Hourly mean NO2 VCD using only matched data from Pandora (orange line) and GEMS (solid black circles). Panels (a), (b), (c), and (d) represent the CC, DHJ, DM2, and SS sites, respectively. Shading in yellow represents the standard deviations of Pandora NO2 VCD, and bars show those of GEMS; SD is the standard deviation.
Figure 8 shows the correlations between the NO2 VCD for the Pandora and GEMS measurements at the four Seosan sites with CF <0.3. The R values range from 0.62 to 0.78, with values of 0.62, 0.70, 0.78, and 0.76 at the CC, DHJ, DM2, and SS sites and slopes of 0.54, 0.49, 0.45, and 0.65, respectively. Although these comparisons were conducted over a short period, the NO2 VCD retrieved from the geostationary GEMS measurements showed good correlations with those observed from ground-based Pandora measurement sites. The root mean square errors (RMSEs) of the GEMS NO2 against Pandora were 0.40, 0.33, 0.50, and 0.36 at the CC, DHJ, DM2, and SS sites, respectively, while the mean bias errors were −0.18, −0.17, −0.43, and −0.24, respectively.
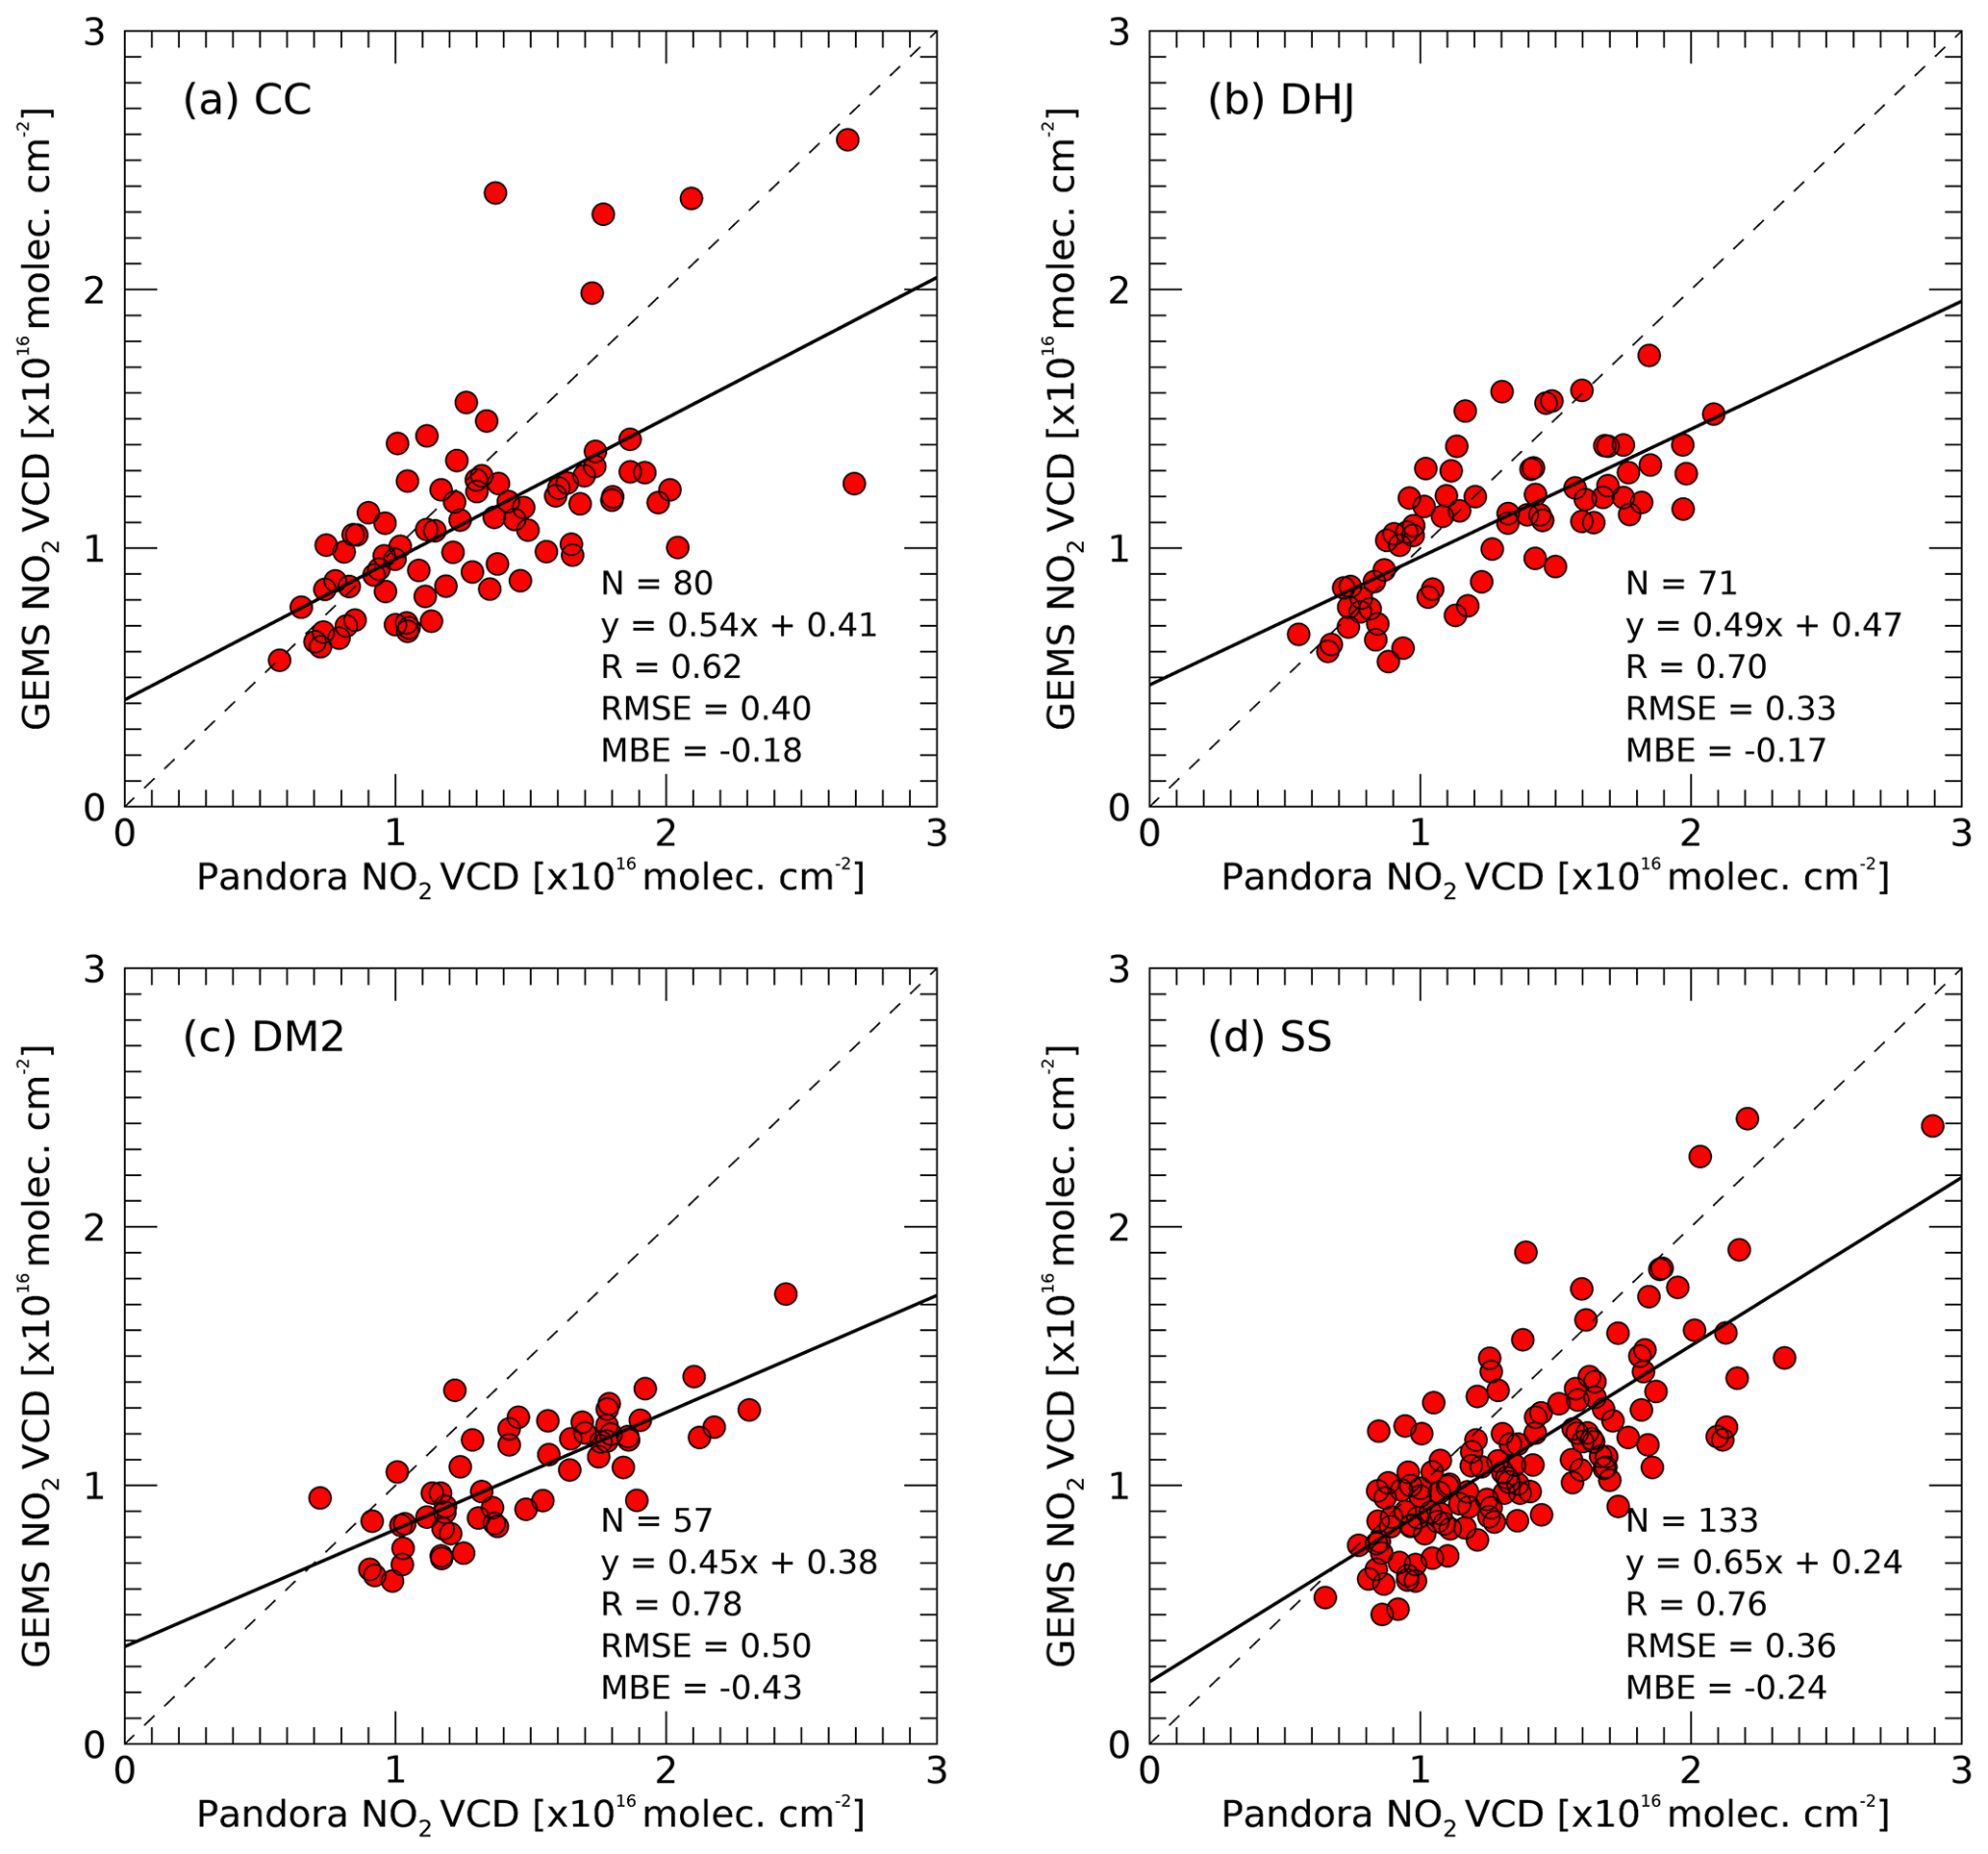
Figure 8The scatterplot of NO2 VCD between Pandora and GEMS in the CF <0.3. Panels (a), (b), (c), and (d) represent the CC, DHJ, DM2, and SS sites, respectively. The dashed gray line represents the 1:1 line, and the solid black line represents the regression line.
Since GEMS is the first GEO satellite and differs from the LEO satellite with observation geometry, an additional comparison was conducted with the LEO satellite TROPOMI. TROPOMI NO2 total columns were used for comparison with Pandora NO2. Data from the TROPOMI offline channel (OFFL) data set were used with a quality assurance (QA) value larger than 0.75 and a cloud radiance fraction less than 0.3. Similar to the method for comparing Pandora and GEMS, pixels close to the Pandora measurement sites were selected and compared. The correlation coefficients between NO2 total column from Pandora and TROPOMI are shown in Fig. 9 and range from 0.58 to 0.74. For the CC, DHJ, DM2, and SS sites, the RMSE of the TROPOMI NO2 against Pandora is calculated to be 0.51, 0.38, 0.70, and 0.55, and mean bias errors (MBEs) were −0.41, −0.19, −0.64, and −0.47, respectively. In the case of GEMS, the RMSE was slightly smaller than that of TROPOMI, and there was a tendency toward less underestimation.
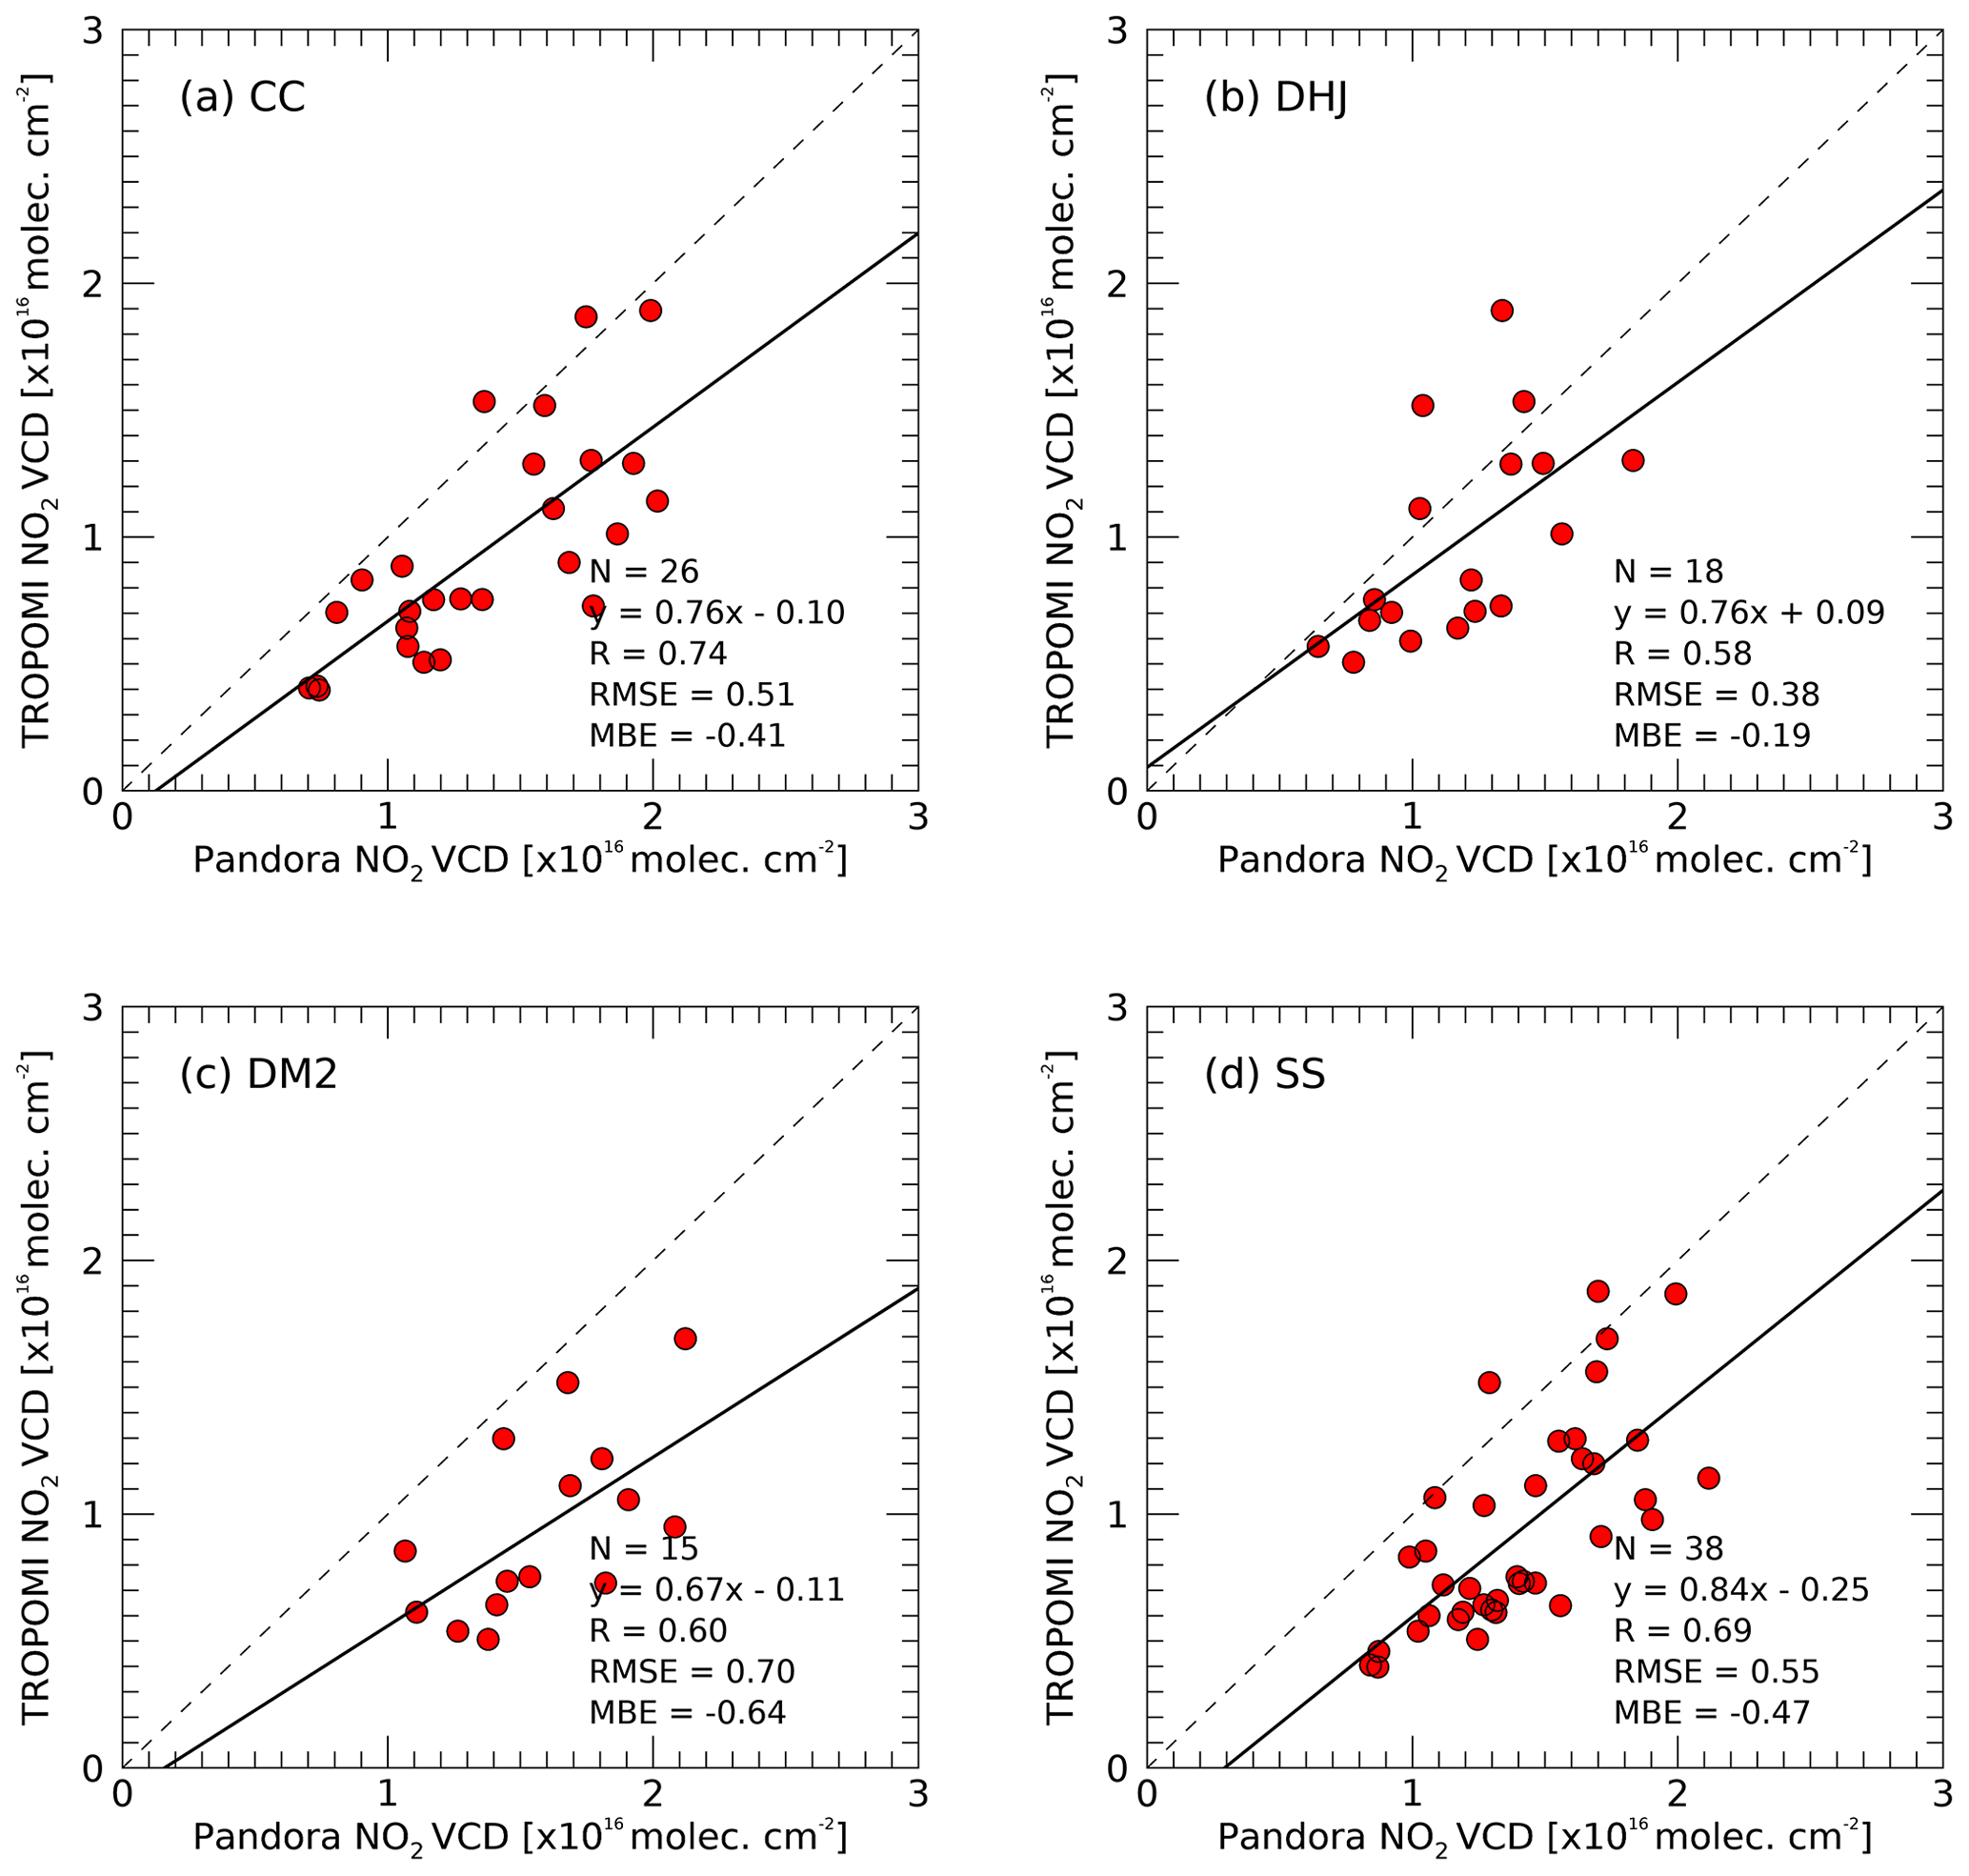
Figure 9The scatterplot of NO2 VCD between Pandora and TROPOMI. Panels (a), (b), (c), and (d) represent the CC, DHJ, DM2, and SS site, respectively. The dashed gray line represents the 1:1 line, and the solid black line represents the regression line.
Figures 10 and 11 show the correlations between the NO2 VCD obtained from the Pandora and GEMS measurements with CF <0.5 and <0.7, respectively. R values tend to decrease with the increasing CF value and are in the ranges of 0.42–0.53 for CF <0.5 and 0.35–0.48 for CF <0.7, with slopes of 0.53, 0.55, 0.39, and 0.61 and 0.54, 0.62, 0.38, and 0.62 at the CC, DHJ, DM2, and SS sites, respectively. The RMSE of the GEMS NO2 VCD against the Pandora NO2 values tended to increase with a high CF value, and the correlation coefficient decreased (Fig. 13). The high correlation coefficient and low RMSE in the low CF conditions indicate that the diurnal NO2 variations observed by the GEMS were consistent with those of Pandora under less cloudy conditions. The tendency of the correlation coefficient and RMSE against the variations in CF conditions implies that enhanced cloud conditions may degrade the sensitivity of the GEMS measurement to NO2 molecules present below or at the cloud layers. However, given the discrepancies among the NO2 VCD values from the four Pandora instruments at the same SS location, especially under cloudy conditions (CF >0.3; Fig. 5), the weaker correlations between the GEMS and Pandora data under higher CF conditions may be partly due to the uncertainties in the Pandora NO2 VCD at high CF.
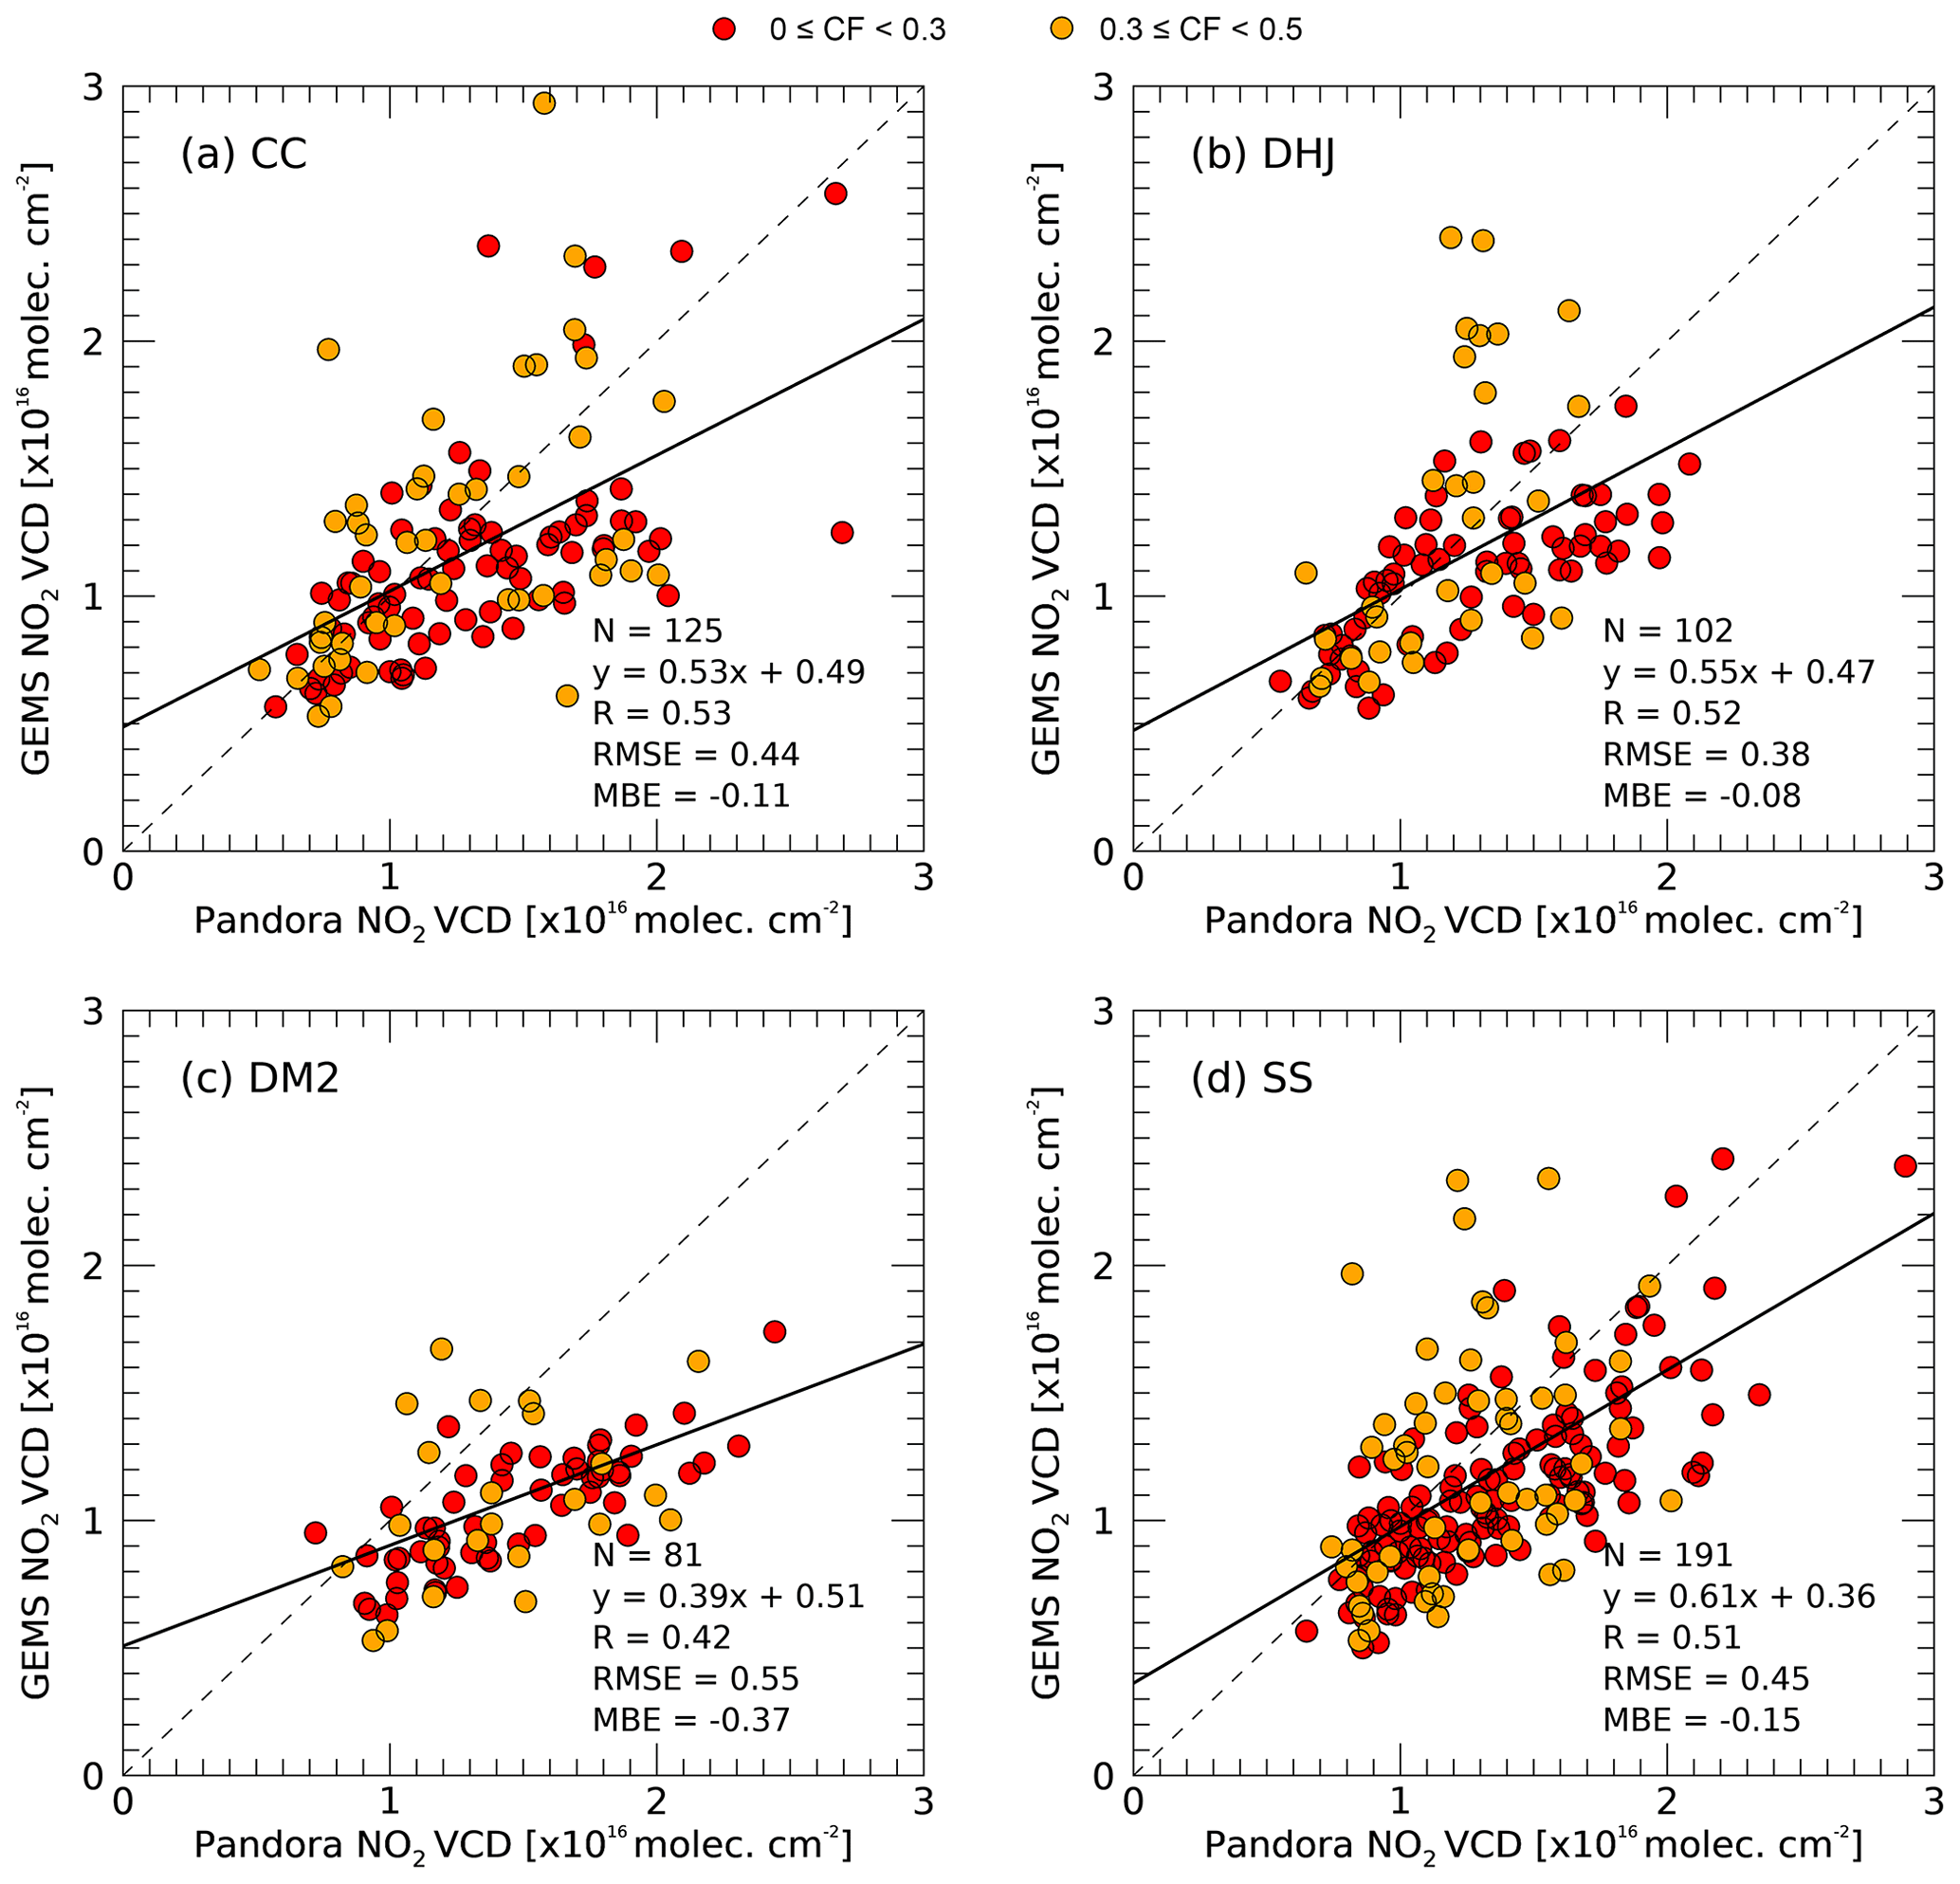
Figure 10The scatterplot of NO2 VCD between Pandora and GEMS in CF conditions <0.5. Panels (a), (b), (c), and (d) represent the CC, DHJ, DM2, and SS sites, respectively. The colored dots mean different ranges of CF. The dashed gray line represents the 1:1 line, and the solid black line represents the regression line.
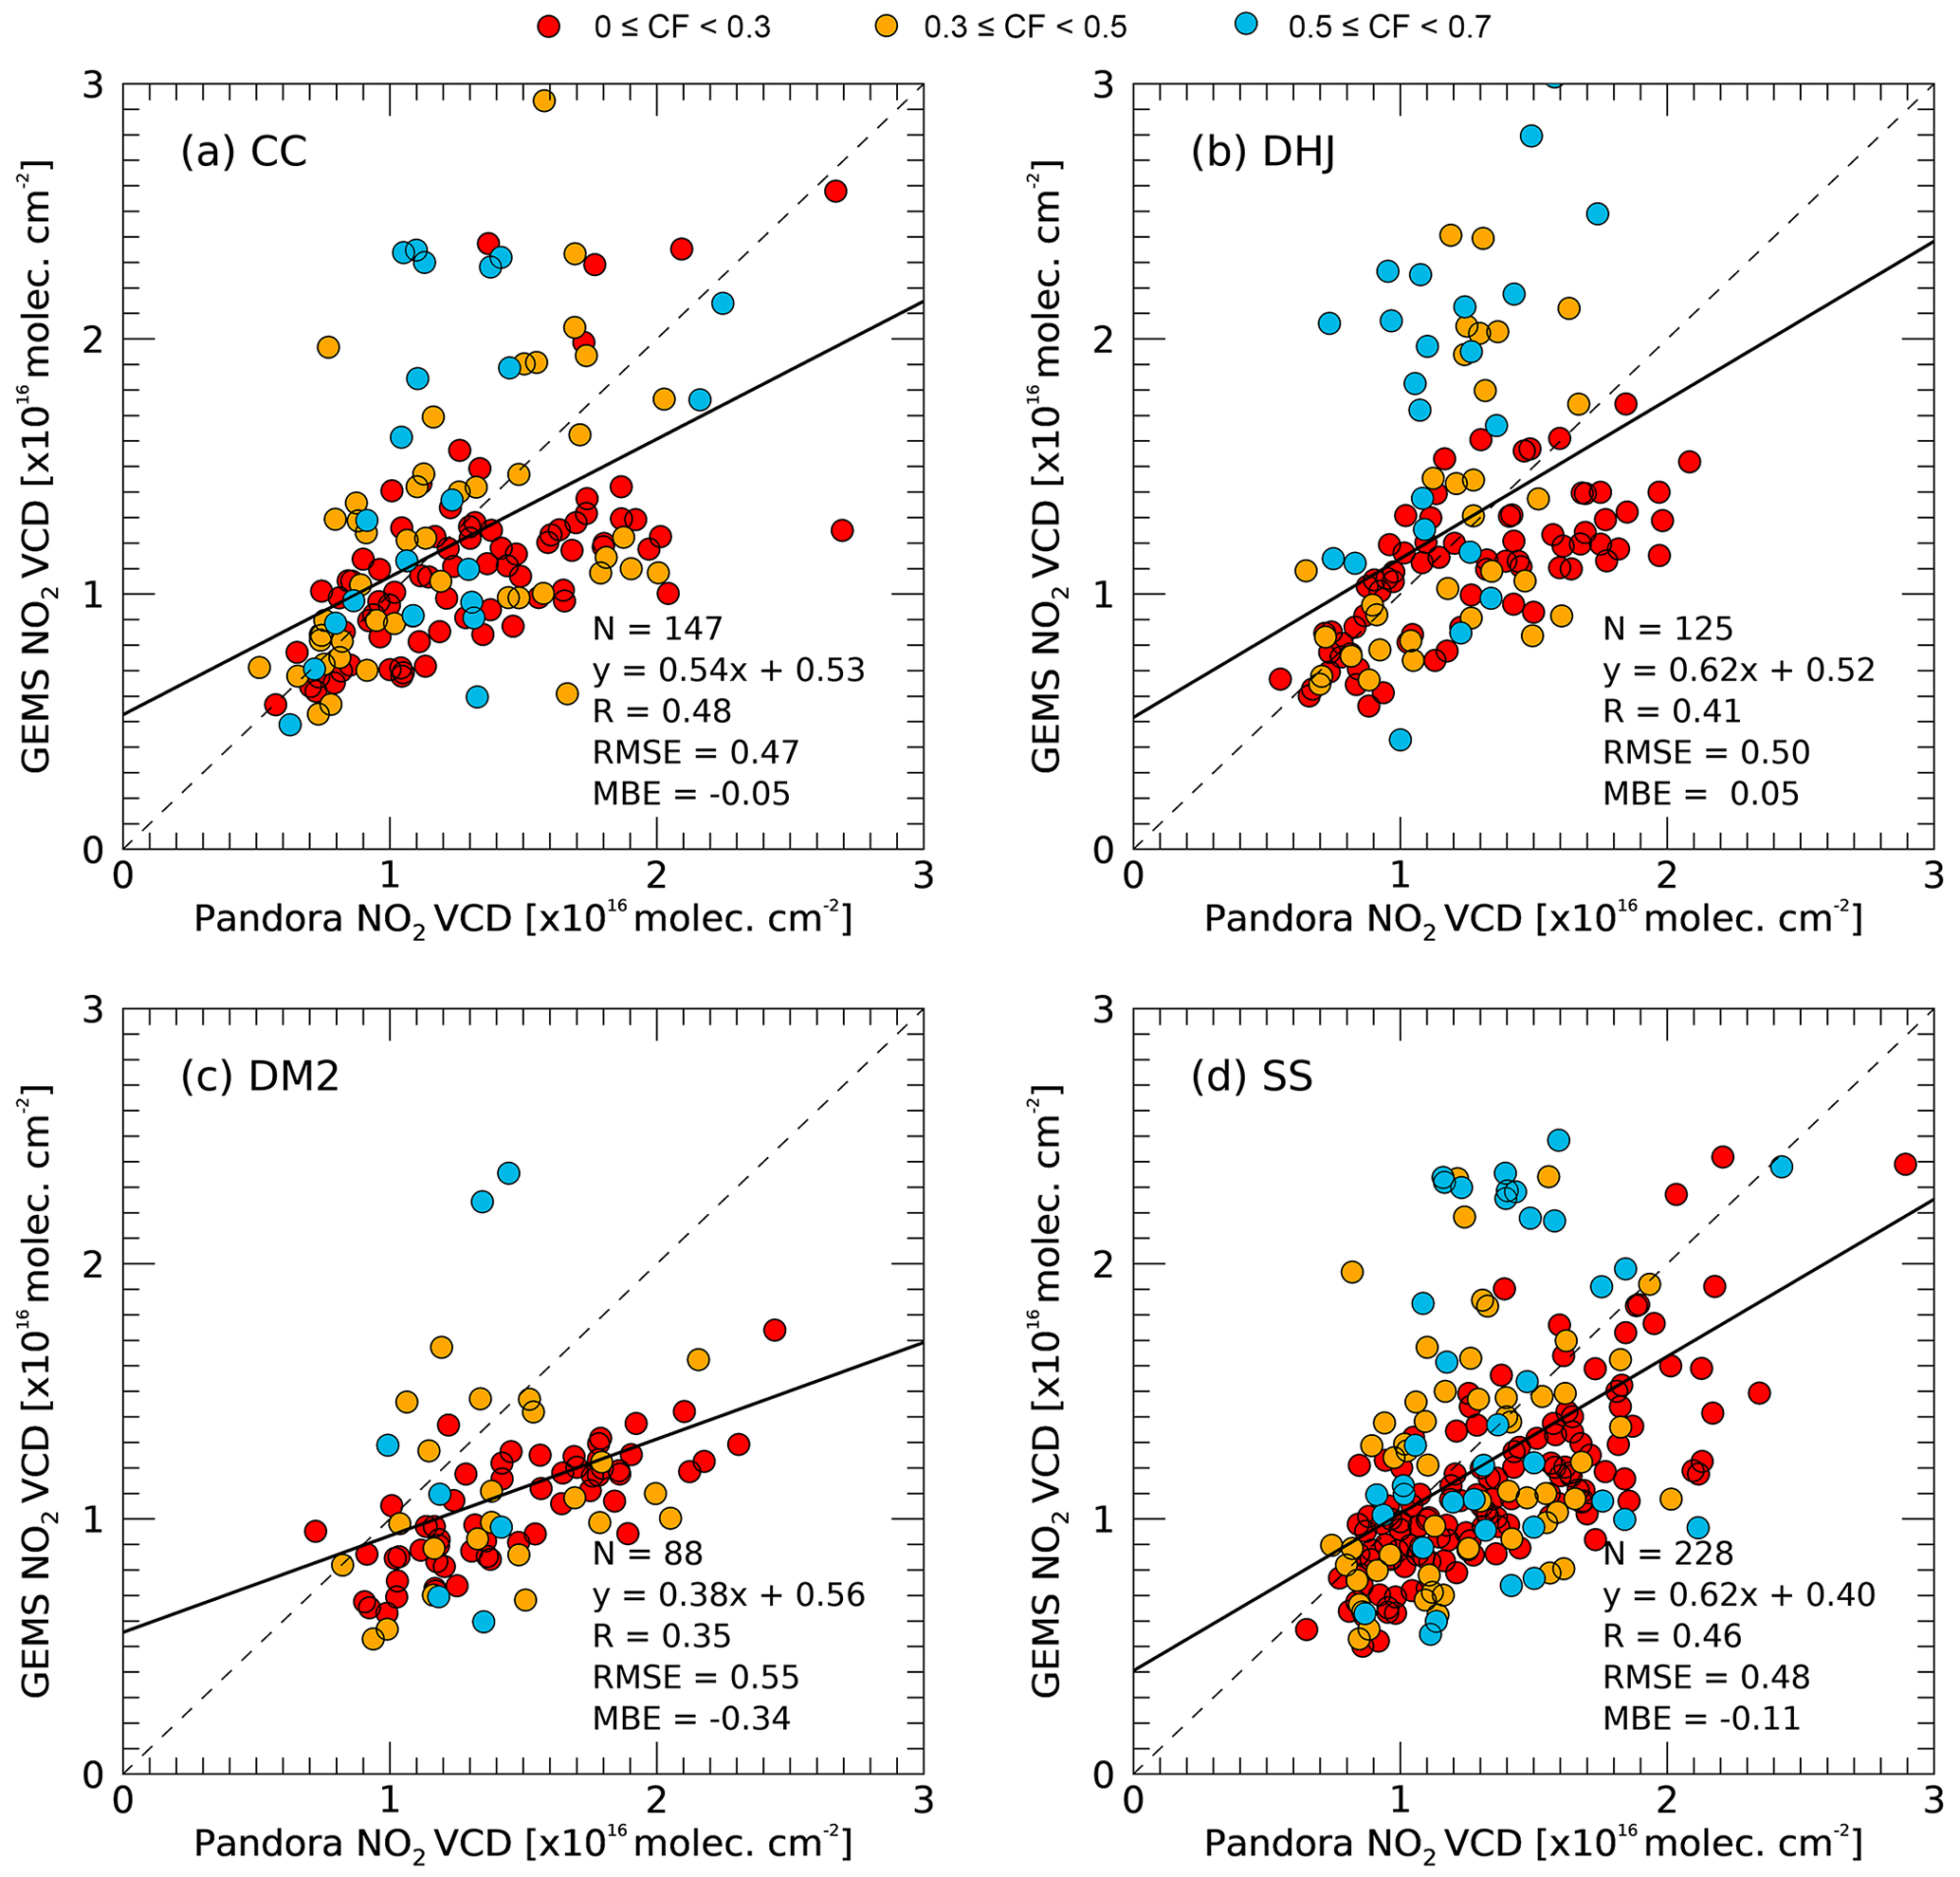
Figure 11The scatterplot of NO2 VCD between Pandora and GEMS in CF conditions <0.7. Panels (a), (b), (c), and (d) represent the CC, DHJ, DM2, and SS sites, respectively. The colored dots mean different ranges of CF. The dashed gray line represents the 1:1 line, and the solid black line represents the regression line.
Variations in MBE with CF can be seen in Fig. 13, showing that the negative bias of GEMS against Pandora generally decreased with increasing CF. Indeed, a positive bias was observed at the DHJ site, with CF <0.7. Except for the DM2 site, the magnitudes of the negative bias at the high CF value (<0.7) were quite small when compared with those at CF <0.3. The increasing negative bias in GEMS NO2 compared to that in Pandora could be associated with GEMS CF, which was used to calculate the GEMS NO2 AMF. When regarding the Pandora NO2 VCD value as being closer to the true values than those of the GEMS, the large negative bias of the GEMS at low CF implies that the GEMS might underestimate the GEMS CF value, as measurement pixels with true CFs should be small. An underestimated GEMS CF may lead to an increase in the AMF and eventually to an underestimation of the NO2 VCD in the pixels. Further investigation is required to identify the relationship between the GEMS CF and the negative bias tendency of the GEMS NO2 VCD under less cloudy conditions.
4.3 Correction of horizontal representativeness
The GEMS pixel closest to the Pandora instrument location was used to assess the correlation between the Pandora and GEMS NO2 VCD, as shown in Figs. 9–11. The GEMS instrument does not always observe the same measurement geometry, and the location of each GEMS pixel varies depending on the measurement schedule. The GEMS pixels close to the location where Pandora was installed did not completely match the Pandora observation coverage. Therefore, differences occur between spatial coverage. In particular, the NO2 dSCD of Pandora was obtained from an absorption light path between the Sun and the instrument at the surface. The photons from the Sun reaching Pandora may pass through more than one GEMS pixel, depending on the observation geometries of the measurements. Figure 12 shows the variation in the measurement geometry of the Pandora instrument with the position of the Sun. As the Sun moves from east to west (morning to afternoon; Fig. 12a–c), the direction of the viewing path of the Pandora instrument changes. The GEMS pixels corresponding to the observation path of the Pandora instrument also differ. Horizontal effects were considered using GEMS pixels and distance ratios that changed according to the observation direction, as follows: first, we selected two pixels of the GEMS, namely one closest to the Pandora site and another closest to the line of sight (i.e., closest to the viewing azimuth angle of the Pandora measurements). We assumed that most of the NO2 was vertically distributed below 2 km altitude, based on the airborne in situ NO2 measurements. The weighted mean values of GEMS NO2 accounting for horizontal representativeness were calculated as follows:
where VCDhr is the NO2 VCD accounting for horizontal representativeness, d1 and d2 are the distances between Pandora and the center of the two GEMS pixels (1 denotes the closest pixel and 2 denotes the pixel at the line of sight), and VCD1 and VCD2 are the GEMS NO2 VCD values of the two pixels.
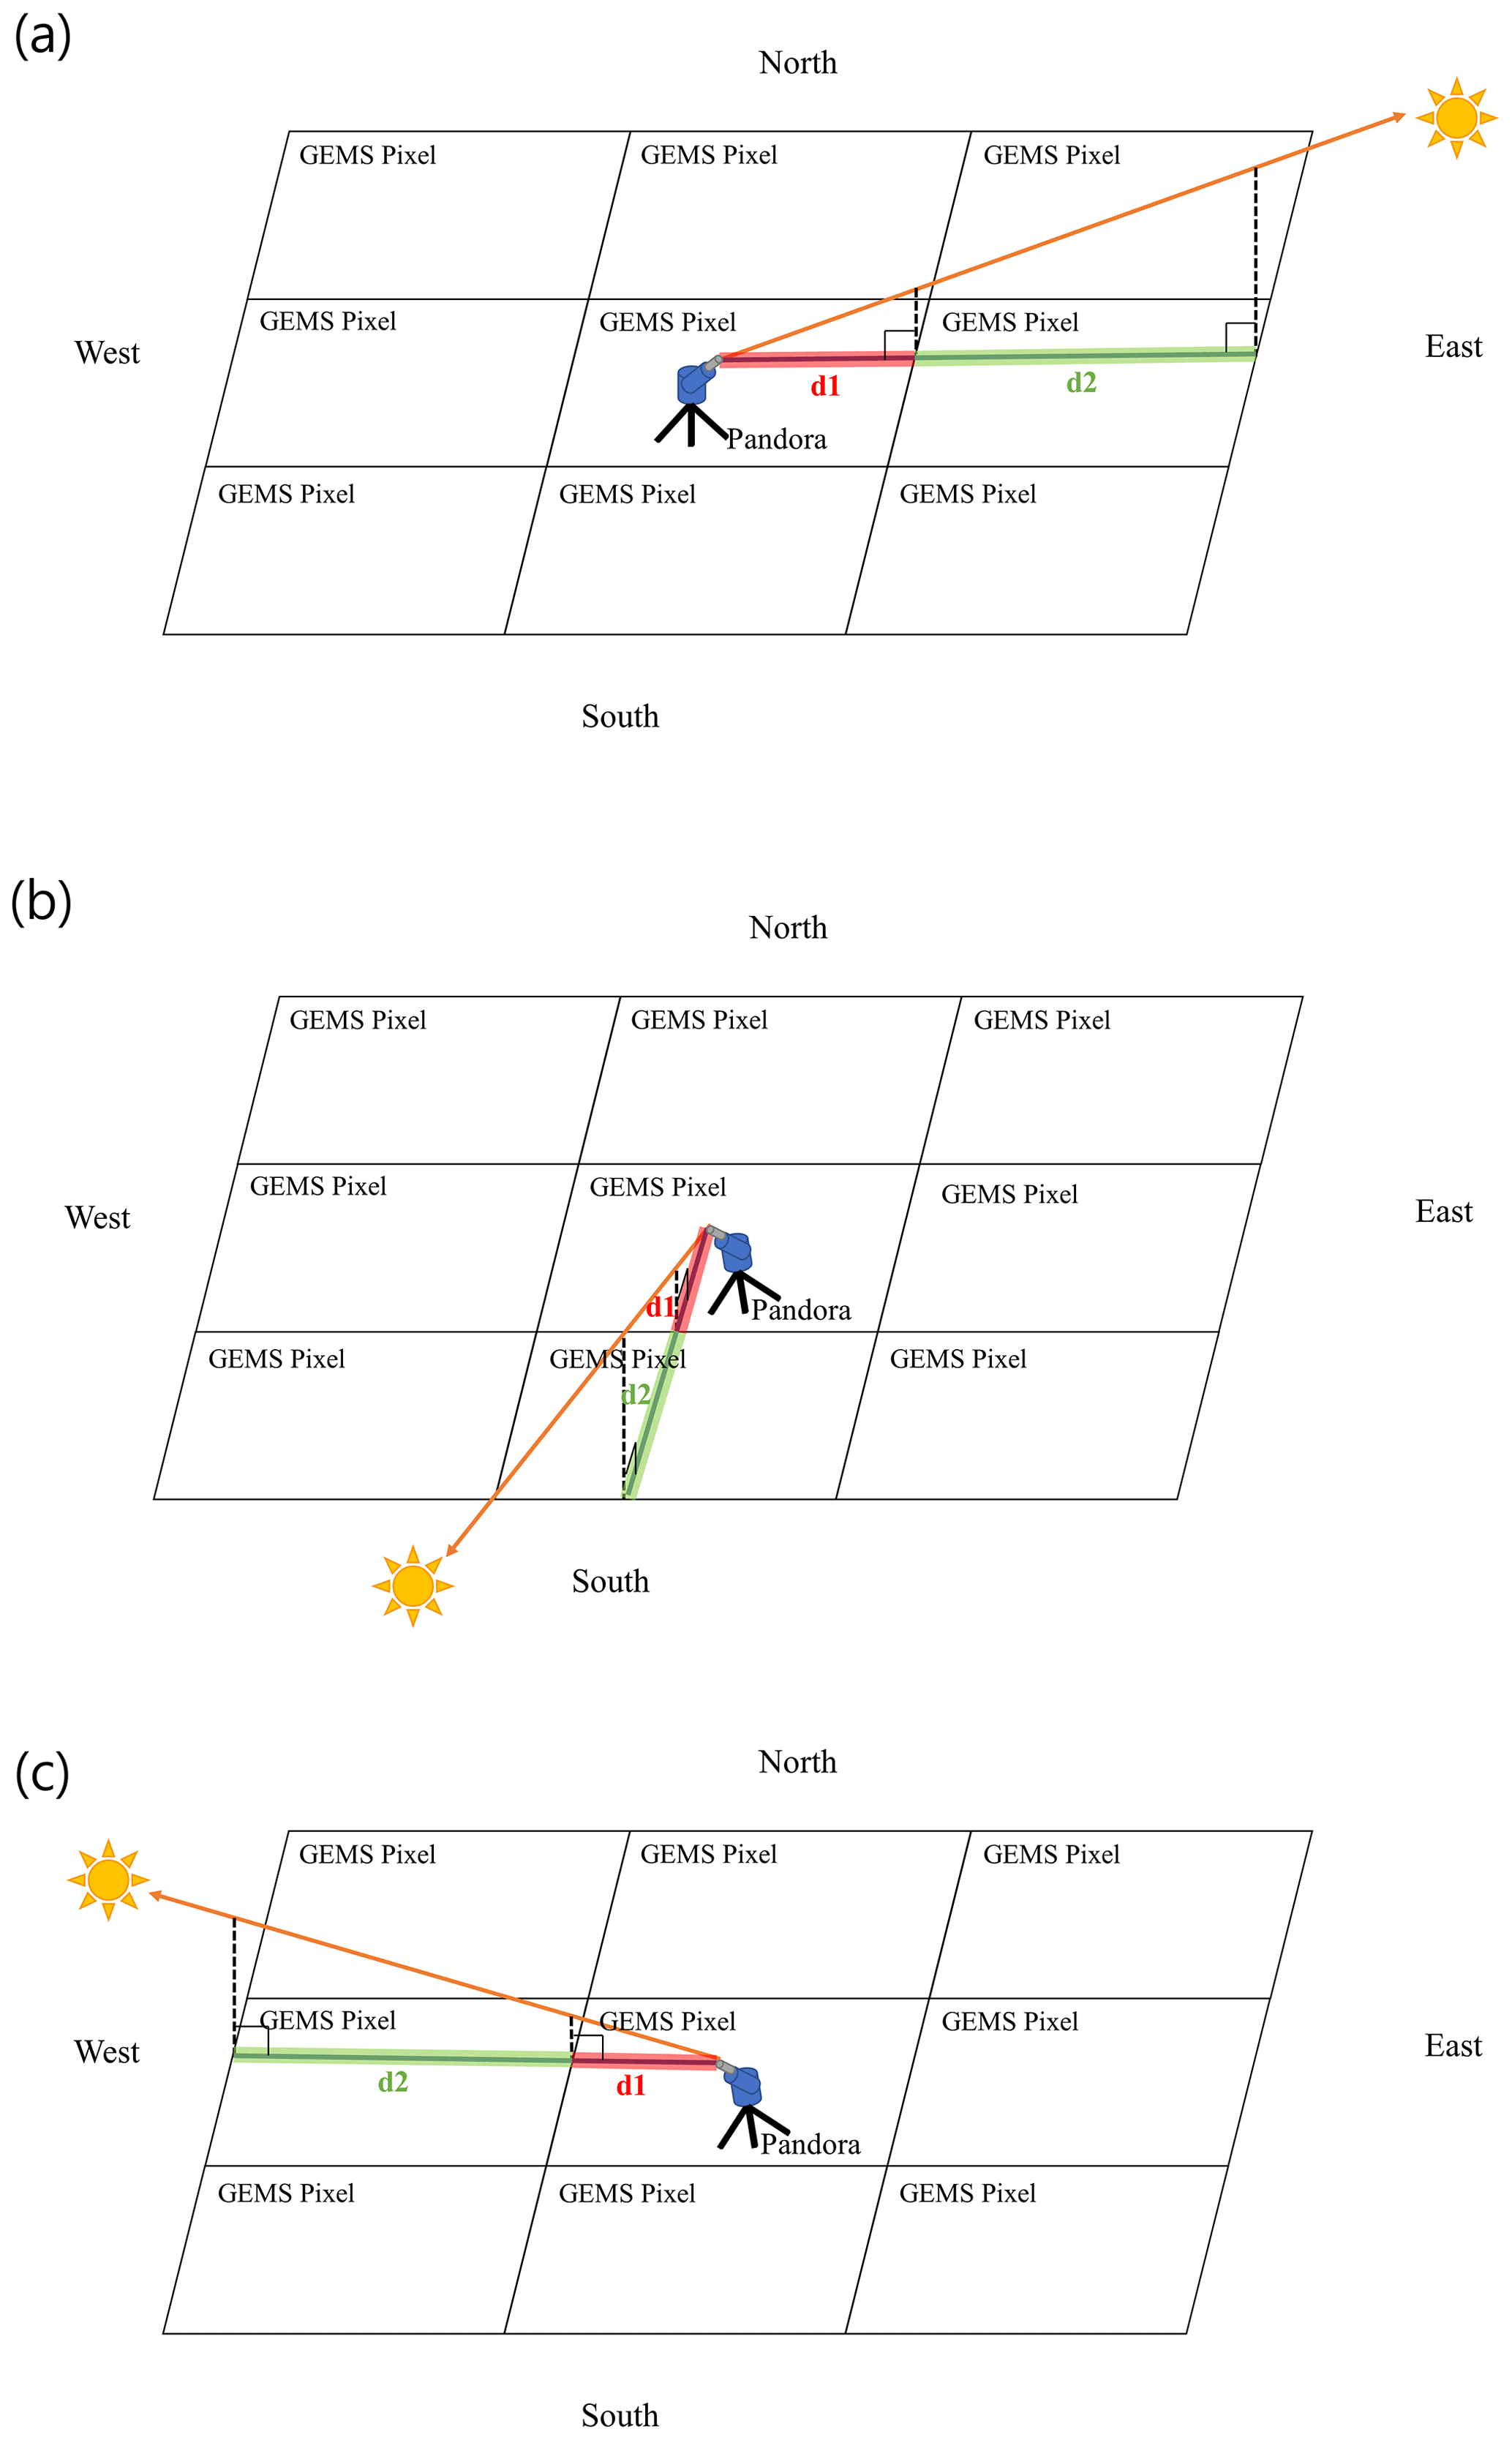
Figure 12Light path changes according to Pandora direct-sun measurement geometry. Panels (a), (b) and (c) represent morning, noon, and afternoon hours, respectively.
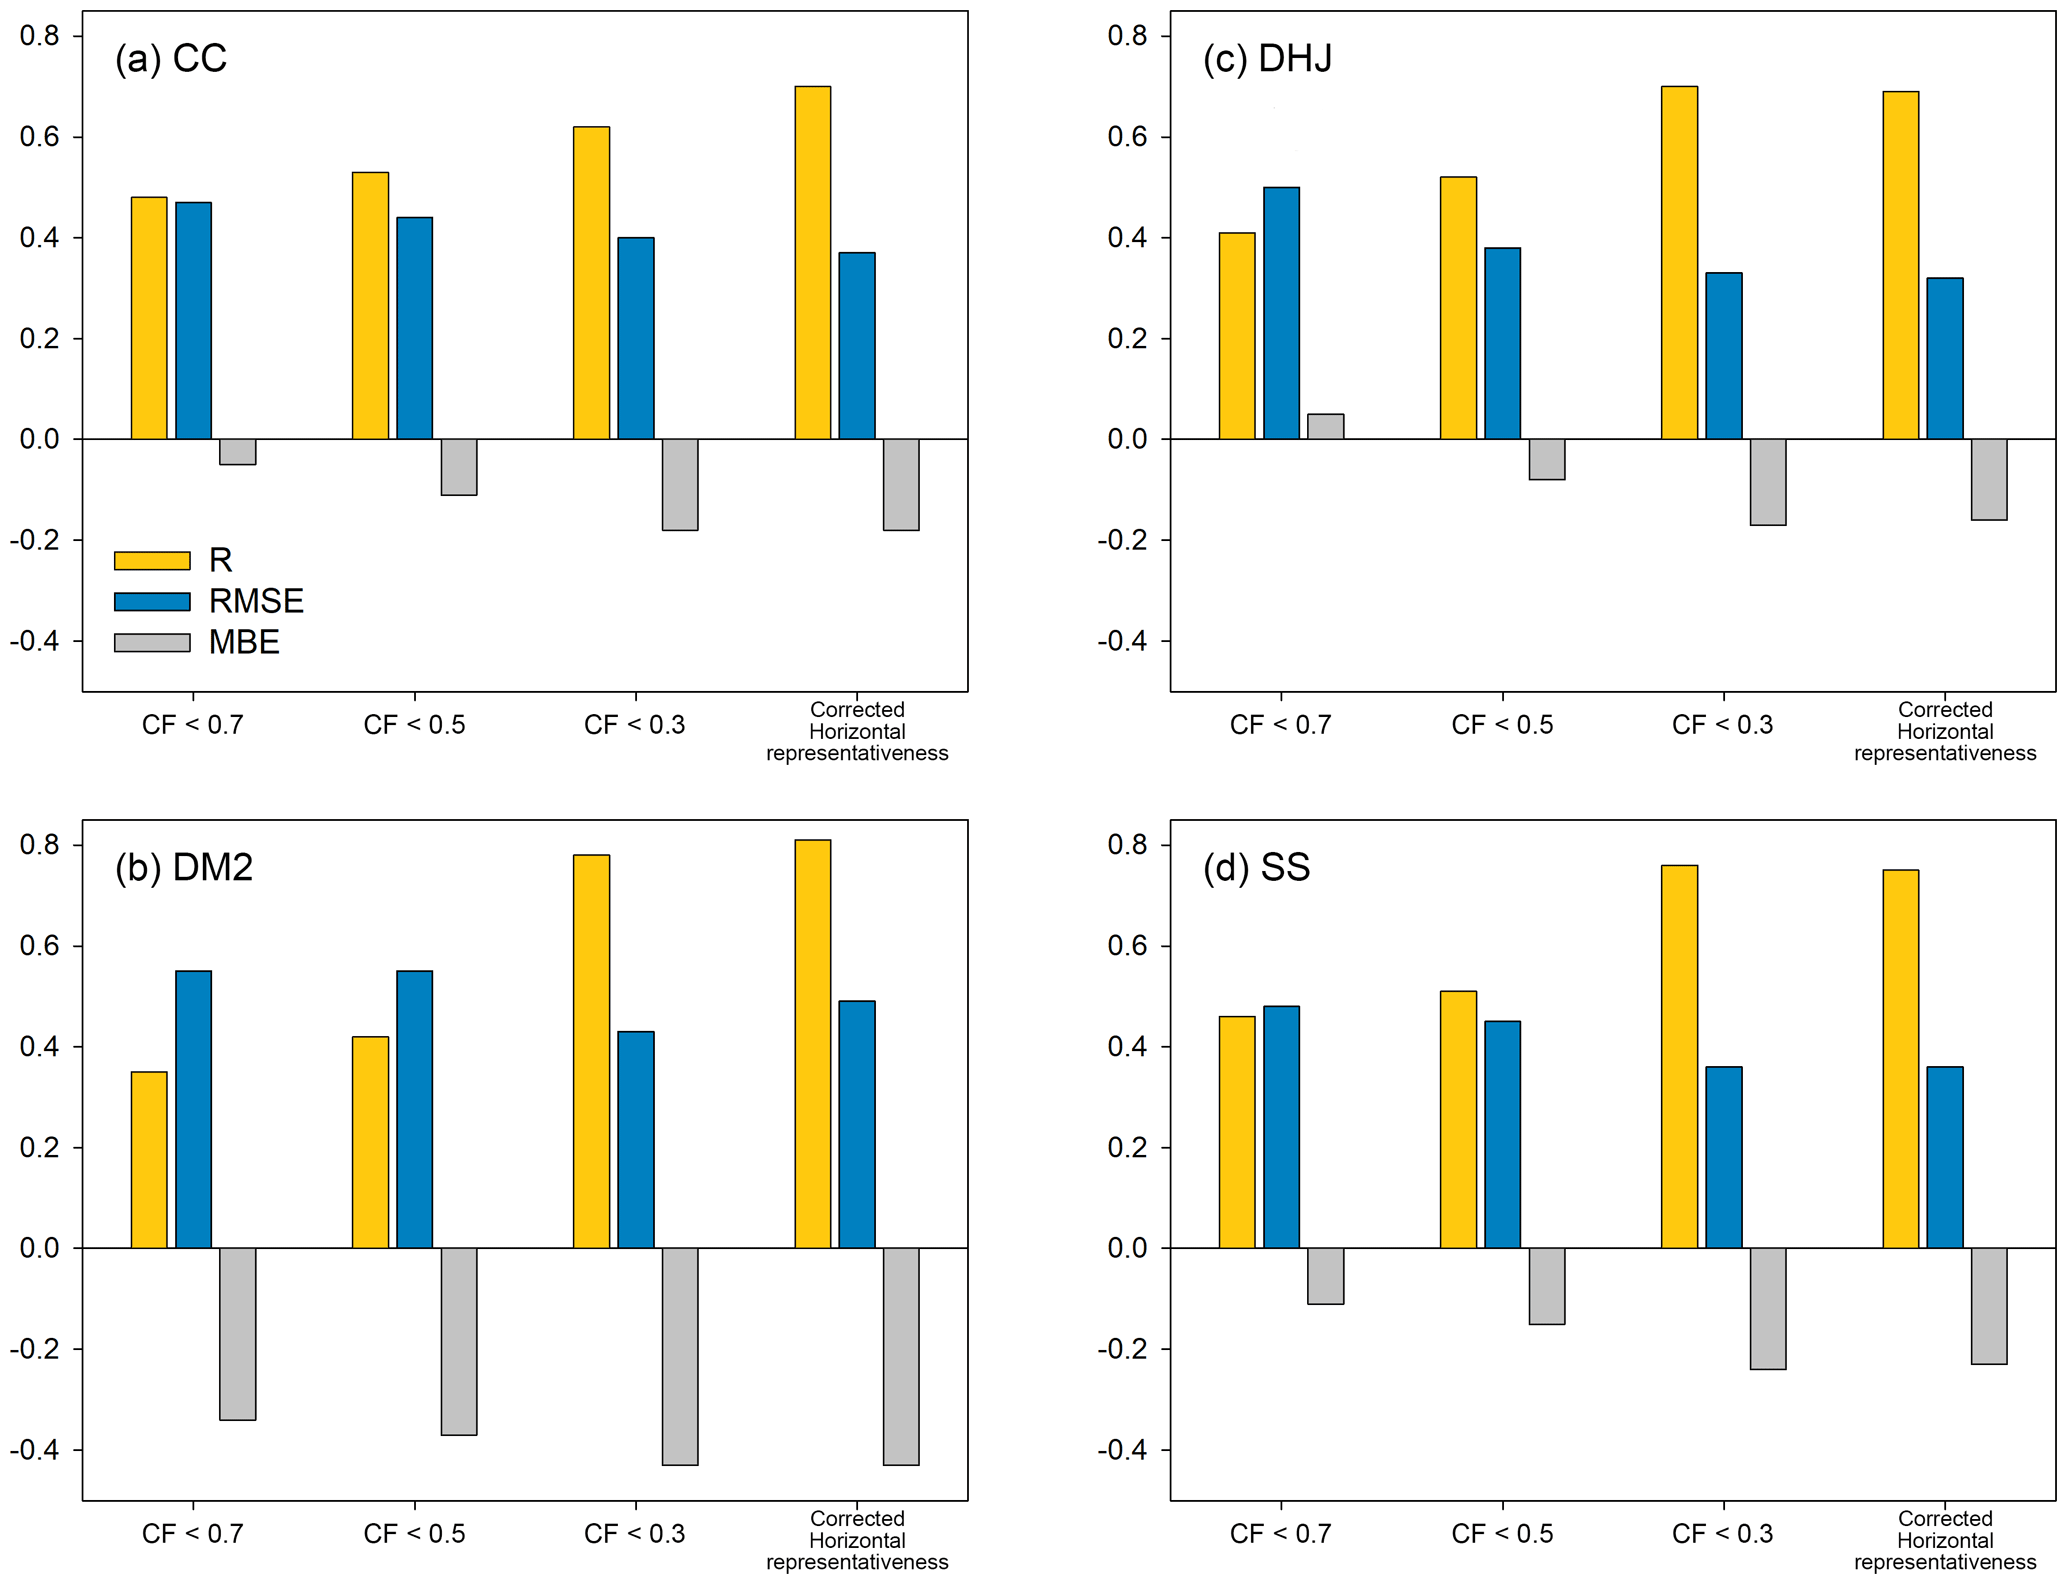
Figure 13R, RMSE, and MBE between NO2 VCDs obtained from Pandora and GEMS, depending on the CF conditions at the (a) CC, (b) DHJ, (c) DM2, and (d) SS sites, respectively.
Figure 14 shows the correlations between the NO2 VCD from Pandora and the GEMS data which were corrected for the horizontal representativeness of Pandora at CF <0.3. The correlation coefficients were found at 0.69–0.81, which were higher than those without the correction of the horizontal representativeness; the R values at the CC, DHJ, DM2, and SS sites were 0.70, 0.69, 0.81, and 0.75, respectively. Correlations at two sites, CC and DM2, increased with horizontal representativeness relative to those without correction, whereas correlations at the DHJ and SS sites were similar with or without correction. RMSEs were 0.37, 0.32, 0.49, and 0.36 with the correction and generally lower than 0.40, 0.33, 0.50, and 0.36 without the correction at the CC, DHJ, DM2, and SS sites, respectively. MBEs with the correction were similar to those without, with values of −0.18, −0.16, −0.43, and −0.23 at the CC, DHJ, DM2, and SS sites, respectively.
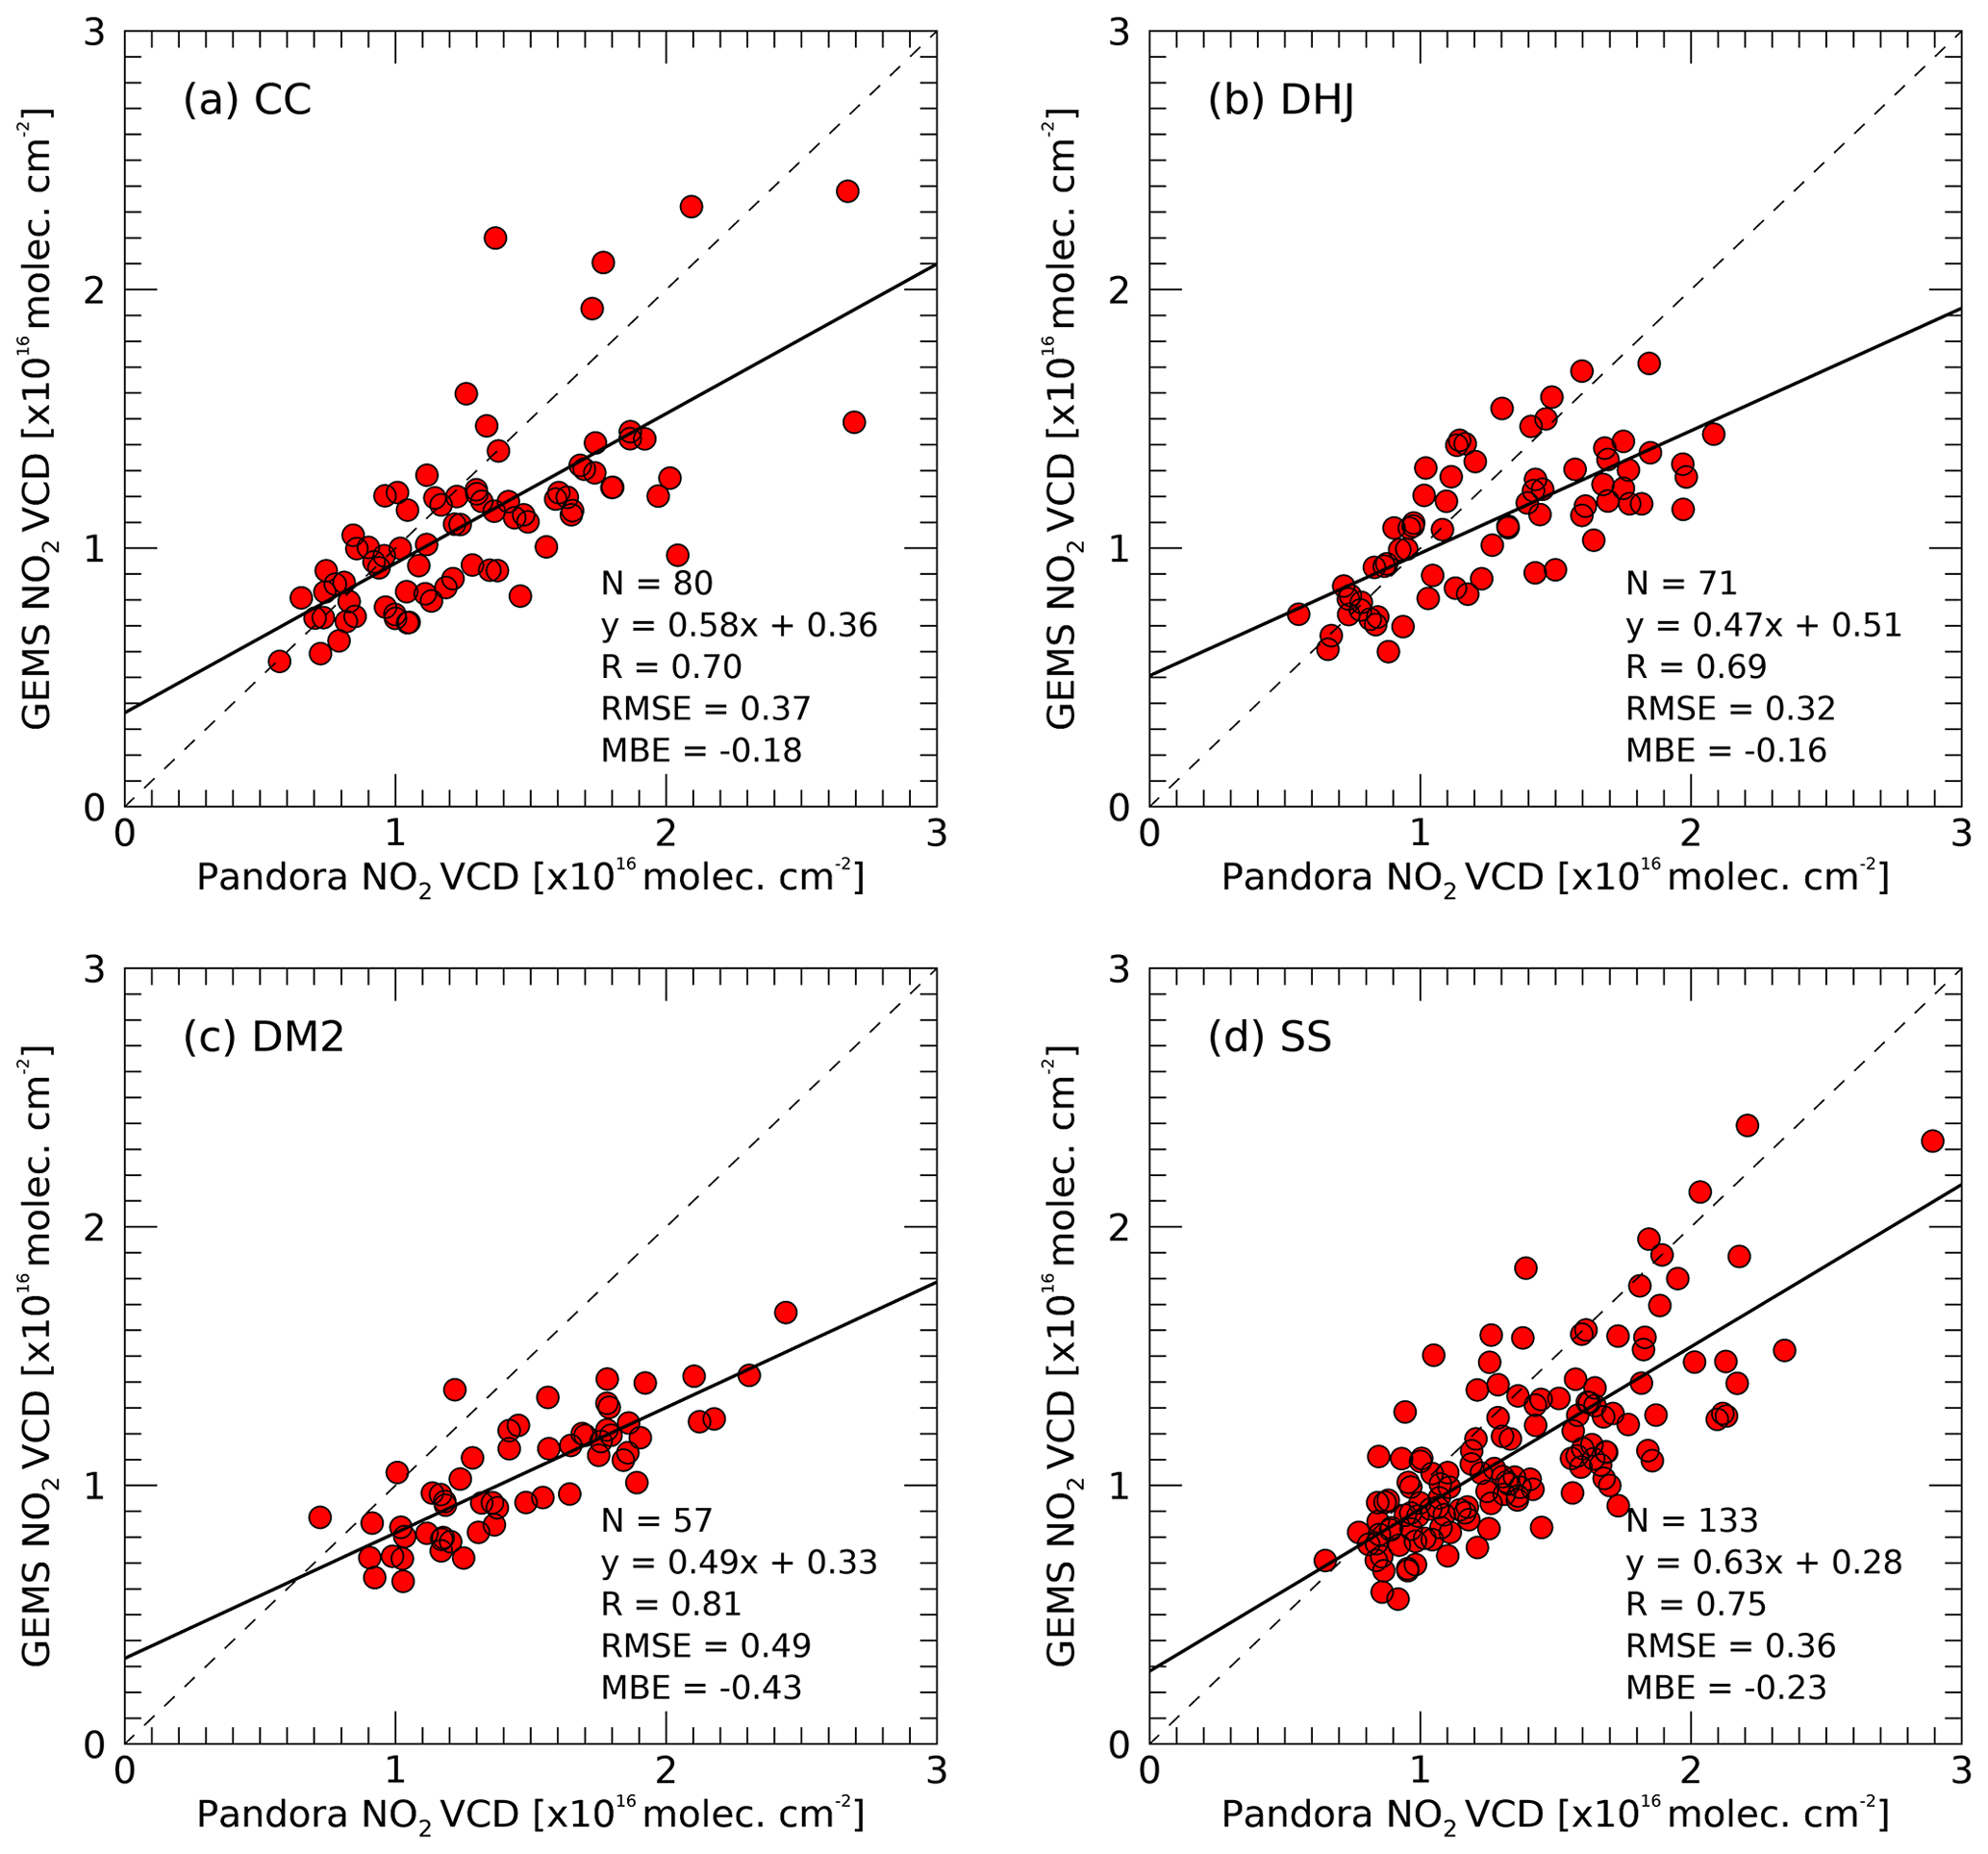
Figure 14The scatterplot of NO2 VCD between Pandora and GEMS, with the correction for the horizontal representativeness. Panels (a), (b), (c), and (d) represent the CC, DHJ, DM2, and SS sites, respectively. The dashed gray line represents the 1:1 line, and the solid black line represents the regression line.
The viewing direction of the Pandora instrument changes, depending on the location of the Sun (see Fig. 12). In the case of CC, Pandora observed the downtown area from morning to noon and the rural area in the afternoon. The DM2 site observes rural areas in the morning and downtown areas from noon onwards. In this case, the correlation can be improved by correcting the horizontal effect, instead of using only the nearby GEMS pixel. In contrast, the reason for the lack of significant changes in agreement before and after considering the horizontal effect in the DHJ and SS appears to be that the regional characteristics are the same, according to the viewing direction. The variability in the Pandora NO2 VCD with the location at a single GEMS pixel has not yet been investigated in Seosan. However, as shown by the diurnal NO2 characteristics at the four sites, the NO2 VCD is likely to vary, depending on the instrument location at a single GEMS pixel, causing inherent discrepancies between the GEMS and Pandora, which may partly account for the discrepancies between the horizontal and vertical measurement coverages of Pandora and GEMS. The range of statistical change was not large, but the correlation between GEMS and Pandora changed when the horizontal correction was applied to four places. Therefore, further investigations under long-term conditions and with a large number of sites are required.
The first evaluation of GEMS NO2 was conducted by a comparison with NO2 data obtained from ground-based Pandora measurements at four sites in Seosan, Korea. An intercomparison of NO2 dVCD among the four Pandora instruments revealed a slightly decreasing agreement among instruments with increasing CF, which could partly contribute to an inherent discrepancy between the GEMS and Pandora systems at high CF. It was observed that the correlations of GEMS NO2 showed good agreement with those of Pandora under less cloudy conditions (CF <0.3). Higher correlation coefficients and lower RMSE were observed at lower CF conditions, indicating a higher sensitivity of GEMS to hourly variations in atmospheric NO2 concentrations under less cloudy conditions. The NO2 VCDs may differ between GEMS and Pandora for several reasons. First, NO2 cross sections at 220 and 254.4 K were used for NO2 retrieval from GEMS and Pandora, respectively. PGN methods of NO2 retrieval can lead to overestimation or underestimation, depending on where tropospheric or stratospheric NO2 is predominantly present (Verhoelst et al., 2021). Second, there is a difference in the spatial resolution of GEMS and Pandora. However, the overall correlations or patterns between the GEMS and Pandora were very similar. We also attempted to account for the horizontal representativeness of Pandora observations. The mean correlations at the four sites increased with correction for horizontal representativeness, with a maximum correlation (R=0.81) and minimum correlation (R=0.69) at the DM2 and DHJ sites, respectively. Variations in the correlations between sites may be attributed to the variability in the NO2 VCD observed by Pandora, depending on the instrument located at a single GEMS pixel. This suggests that the influence of the NO2 source on the observation direction can be considered by correcting for the horizontal effect.
The first comparison of NO2 VCDs from the GEMS showed relatively lower values than Pandora (MBE to −0.17), with moderate correlations (R=0.62 to 0.78) over Seosan. NO2 retrievals from TROPOMI also showed consistent comparison results; the TROPOMI NO2 values underestimated the ground-based retrievals with MBE from −0.64 to −0.19, with comparable correlations (R= 0.58–0.74). However, due to the limited Pandora measurements at the beginning of the GEMS operation, further comparisons at broader regions of GEMS FOV for long-term periods are essential for the relevant studies using the GEMS data.
The code used in this study is available from the corresponding author upon request.
GEMS NO2 total column used here can be accessed at https://nesc.nier.go.kr/ko/html/index.do (National Institute of Environmental Research, NIER, 2023). TROPOMI NO2 total column data are available from the Copernicus Open Access Hub (https://doi.org/10.5270/S5P-s4ljg54, European Space Agency, ESA, 2018). Pandora data are available upon request from the corresponding author.
DaK and SK retrieved and analyzed NO2 VCDs from Pandora and designed the study, while participating in the campaign. HH, LC, HL, DRK, DoK, JY, DL, UJ, WC, and KL planned, organized, and performed the Seosan campaign. UJ, CS, SK, SP, JK, and TFH provided and supported the instrument management. JK and JP provided GEMS NO2 data and supported the validation process. All authors reviewed and discussed this paper.
At least one of the (co-)authors is a member of the editorial board of Atmospheric Measurement Techniques. The peer-review process was guided by an independent editor, and the authors also have no other competing interests to declare.
Publisher’s note: Copernicus Publications remains neutral with regard to jurisdictional claims in published maps and institutional affiliations.
This article is part of the special issue “GEMS: first year in operation (AMT/ACP inter-journal SI)”. It is not associated with a conference.
We thank the National Institute of Environmental Research of South Korea for the financial support and for providing GEMS NO2 total column data. We thank all participants of the GMAP 2020 field campaign. We also acknowledge the editor and two anonymous referees for their valuable comments.
This research has been supported by the National Institute of Environmental Research of South Korea (grant no. NIER-2022-04-02-035).
This paper was edited by Myoung-Hwan Ahn and reviewed by two anonymous referees.
Bechle, M. J., Millet, D. B., and Marshall, J. D.: Remote sensing of exposure to NO2, satellite versus ground-based measurement in a large urban, Atmos. Environ., 69, 345–353, https://doi.org/10.1016/j.atmosenv.2012.11.046, 2013.
Boersma, K. F., Jacob, D. J., Trainic, M., Rudich, Y., DeSmedt, I., Dirksen, R., and Eskes, H. J.: Validation of urban NO2 concentrations and their diurnal and seasonal variations observed from the SCIAMACHY and OMI sensors using in situ surface measurements in Israeli cities, Atmos. Chem. Phys., 9, 3867–3879, https://doi.org/10.5194/acp-9-3867-2009, 2009.
Bovensmann, H., Burrows, J. P., Buchwitz, M., Frerick, J., Noël, S., Rozanov, V. V., Chance, K. V., and Goede, A. P. H.: SCIAMACHY: Mission objectives and measurement modes, J. Atmos. Sci., 56, 127–150, https://doi.org/10.1175/1520-0469(1999)056<0127:SMOAMM>2.0.CO;2, 1999.
Burrows, J., Weber, M., Buchwitz, M., Rozanov, V., Ladstätter-Weißenmayer, A., Richter, A., DeBeek, R., Hoogen, R., Bramstedt, K., Eichmann, K.-U., Eisinger, M., and Perner, D.: The Global Ozone Monitoring Experiment (GOME): Mission concept and first scientific results, J. Atmos. Sci., 56, 151–175, https://doi.org/10.1175/1520-0469(1999)056<0151:TGOMEG>2.0.CO;2, 1999.
Choi, Y., Kim, G., Kim, B., and Kwon, M.: Geostationary Environment Monitoring Spectrometer (GEMS) Algorithm Theoretical Basis Document Cloud Retrieval Algorithm, https://nesc.nier.go.kr/ko/html/satellite/doc/doc.do (last access: 5 June 2023), 2020.
Crutzen, P. J.: The role of NO and NO2 in the chemistry of the troposphere and stratosphere, Annu. Rev. Earth Pl. Sc., 7, 443–472, https://doi.org/10.1146/annurev.ea.07.050179.002303, 1979.
European Space Agency (ESA): Copernicus Sentinel-5P: TROPOMI Level 2 Nitrogen Dioxide total column products, Version 01, ESA [data set], https://doi.org/10.5270/S5P-s4ljg54, 2018.
Fayt, C., De Smedt, I., Letocart, V., Merlaud, A., Pinardi, G., and Van Roozendael, M.: QDOAS Software user manual, Royal Belgian Institute for Space Aeronomy, https://uv-vis.aeronomie.be/software/QDOAS/QDOAS_manual.pdf (last access: 24 March 2022), 2011.
Herman, J. R., Cede, A., Spine, E., Mount, G., Tzortziou, M., and Abuhassan, N.: NO2 column amounts from ground-based Pandora and MFDOAS spectrometers using the direct-sun DOAS technique: Intercomparisons and application to OMI validation, J. Geophys. Res., 114, D13307, https://doi.org/10.1029/2009JD011848, 2009.
Herman, J., Spinei, E., Fried, A., Kim, J., Kim, J., Kim, W., Cede, A., Abuhassan, N., and Segal-Rozenhaimer, M.: NO2 and HCHO measurements in Korea from 2012 to 2016 from Pandora spectrometer instruments compared with OMI retrievals and with aircraft measurements during the KORUS-AQ campaign, Atmos. Meas. Tech., 11, 4583–4603, https://doi.org/10.5194/amt-11-4583-2018, 2018.
Herman, J., Abuhassan, N., Kim, J., Kim, J., Dubey, M., Raponi, M., and Tzortziou, M.: Underestimation of column NO2 amounts from the OMI satellite compared to diurnally varying ground-based retrievals from multiple PANDORA spectrometer instruments, Atmos. Meas. Tech., 12, 5593–5612, https://doi.org/10.5194/amt-12-5593-2019, 2019.
Hong, H., Lee, H., Kim, J., Jeong, U., Ryu, J., and Lee, D. S.: Investigation of Simultaneous Effects of Aerosol Properties and Aerosol Peak Height on the Air Mass Factors for Space-Borne NO2 Retrievals, Remote Sens., 9, 208, https://doi.org/10.3390/rs9030208, 2017.
Hönninger, G., von Friedeburg, C., and Platt, U.: Multi axis differential optical absorption spectroscopy (MAX-DOAS), Atmos. Chem. Phys., 4, 231–254, https://doi.org/10.5194/acp-4-231-2004, 2004.
Irie, H., Kanaya, Y., Akimoto, H., Iwabuchi, H., Shimizu, A., and Aoki, K.: First retrieval of tropospheric aerosol profiles using MAX-DOAS and comparison with lidar and sky radiometer measurements, Atmos. Chem. Phys., 8, 341–350, https://doi.org/10.5194/acp-8-341-2008, 2008.
Jeong, U. and Hong, H.: Assessment of Tropospheric Concentrations of NO2 from the TROPOMI/Sentinel-5 Precursor for the Estimation of Long-Term Exposure to Surface NO2 over South Korea, Remote Sens., 13, 1877, https://doi.org/10.3390/rs13101877, 2021.
Jeong, U., Tsay, S.-C., Giles, D. M., Holben, B. N., Swap, R. J., Abuhassan, N., and Herman, J. R.: The SMART-s Trace Gas and Aerosol Inversions: I. Algorithm Theoretical Basis for Column Property Retrievals, J. Geophys. Res.-Atmos., 125, e2019JD32088, https://doi.org/10.1029/2019JD032088, 2020.
Judd, L. M., Al-Saadi, J. A., Janz, S. J., Kowalewski, M. G., Pierce, R. B., Szykman, J. J., Valin, L. C., Swap, R., Cede, A., Mueller, M., Tiefengraber, M., Abuhassan, N., and Williams, D.: Evaluating the impact of spatial resolution on tropospheric NO2 column comparisons within urban areas using high-resolution airborne data, Atmos. Meas. Tech., 12, 6091–6111, https://doi.org/10.5194/amt-12-6091-2019, 2019.
Judd, L. M., Al-Saadi, J. A., Szykman, J. J., Valin, L. C., Janz, S. J., Kowalewski, M. G., Eskes, H. J., Veefkind, J. P., Cede, A., Mueller, M., Gebetsberger, M., Swap, R., Pierce, R. B., Nowlan, C. R., Abad, G. G., Nehrir, A., and Williams, D.: Evaluating Sentinel-5P TROPOMI tropospheric NO2 column densities with airborne and Pandora spectrometers near New York City and Long Island Sound, Atmos. Meas. Tech., 13, 6113–6140, https://doi.org/10.5194/amt-13-6113-2020, 2020.
Kim, J., Jeong, U., Ahn, M.-H., Kim, J. H., Park, R. J., Lee, H., Song, C. H., Choi, Y.-S., Lee, K.-H., Yoo, J.-M., Jeong, M.-J., Park, S. K., Lee, K.-M., Song, C.-K., Kim, S.-W., Kim, Y. J., Kim, S.-W., Kim, M., Go, S., Liu, X., Chance, K., Miller, C. C., Al-Saadi, J., Veihelmann, B., Bhartia, P. K., Torres, O., Abad, G. G., Haffner, D. P., Ko, D. H., Lee, S. H., Woo, J.-H., Chong, H., Park, S. S., Nicks, D., Choi, W. J., Moon, K.-J., Cho, A., Yoon, J., Kim, S.-K., Hong, H., Lee, K., Lee, H., Lee, S., Choi, M., Veefkind, P., Levelt, P. F., Edwards, D. P., Kang, M., Eo, M., Bak, J., Baek, K., Kwon, H.-A., Yang, J., Park, J., Han, K. M., Kim, B.-R., Shin, H.-W., Choi, H., Lee, E., Chong, J., Cha, Y., Koo, J.-H., Irie, H., Hayashida, S., Kasai, Y., Kanaya, Y., Liu, C., Lin, J., Crawford, J. H., Carmichael, G. R., Newchurch, M. J., Lefer, B. L., Herman, J. R., Swap, R. J., Lau, A. K. H., Kurosu, T. P., Jaross, G., Ahlers, B., Dobber, M., McElroy, C. T., and Choi, Y.: New era of air quality monitoring from space, Geostationary Environment Monitoring Spectrometer (GEMS), B. Am. Meteorol. Soc., 101, E1–E22, https://doi.org/10.1175/BAMS-D-18-0013.1, 2020.
Lamsal, L. N., Krotkov, N. A., Celarier, E. A., Swartz, W. H., Pickering, K. E., Bucsela, E. J., Gleason, J. F., Martin, R. V., Philip, S., Irie, H., Cede, A., Herman, J., Weinheimer, A., Szykman, J. J., and Knepp, T. N.: Evaluation of OMI operational standard NO2 column retrievals using in situ and surface-based NO2 observations, Atmos. Chem. Phys., 14, 11587–11609, https://doi.org/10.5194/acp-14-11587-2014, 2014.
Levelt, P. F., Hilsenrath, E., Leppelmeier, G. W., van den Oord, G. B. J., Bhartia, P. K., Tamminen, J., de Haan, J. F., and Veefkind, J. P.: Science Objectives of the Ozone Monitoring Instrument, IEEE T. Geosci. Remote, 44, 1199–1208, https://doi.org/10.1109/TGRS.2006.872333, 2006.
Li, J., Wang, Y., Zhang, R., Smeltzer, C., Weinheimer, A., Herman, J., Boersma, K. F., Celarier, E. A., Long, R. W., Szykman, J. J., Delgado, R., Thompson, A. M., Knepp, T. N., Lamsal, L. N., Janz, S. J., Kowalewski, M. G., Liu, X., and Nowlan, C. R.: Comprehensive evaluations of diurnal NO2 measurements during DISCOVER-AQ 2011: effects of resolution-dependent representation of NOx emissions, Atmos. Chem. Phys., 21, 11133–11160, https://doi.org/10.5194/acp-21-11133-2021, 2021.
Munro, R., Lang, R., Klaes, D., Poli, G., Retscher, C., Lindstrot, R., Huckle, R., Lacan, A., Grzegorski, M., Holdak, A., Kokhanovsky, A., Livschitz, J., and Eisinger, M.: The GOME-2 instrument on the Metop series of satellites: instrument design, calibration, and level 1 data processing – an overview, Atmos. Meas. Tech., 9, 1279–1301, https://doi.org/10.5194/amt-9-1279-2016, 2016.
National Institute of Environmental Research (NIER): https://nesc.nier.go.kr/ko/html/index.do, last access: 8 August 2023.
Park, J., Lee, H., and Hong, H.: Geostationary Environment Monitoring Spectrometer (GEMS) Algorithm Theoretical Basis Document NO2 Retrieval Algorithm, https://nesc.nier.go.kr/product/document?page=1&limit=10 (last access: 24 March 2022), 2020.
Pinardi, G., Van Roozendael, M., Hendrick, F., Theys, N., Abuhassan, N., Bais, A., Boersma, F., Cede, A., Chong, J., Donner, S., Drosoglou, T., Dzhola, A., Eskes, H., Frieß, U., Granville, J., Herman, J. R., Holla, R., Hovila, J., Irie, H., Kanaya, Y., Karagkiozidis, D., Kouremeti, N., Lambert, J.-C., Ma, J., Peters, E., Piters, A., Postylyakov, O., Richter, A., Remmers, J., Takashima, H., Tiefengraber, M., Valks, P., Vlemmix, T., Wagner, T., and Wittrock, F.: Validation of tropospheric NO2 column measurements of GOME-2A and OMI using MAX-DOAS and direct sun network observations, Atmos. Meas. Tech., 13, 6141–6174, https://doi.org/10.5194/amt-13-6141-2020, 2020.
Platt, U. and Stutz, Z.: Differential Optical Absorption Spectroscopy, Principles and Applications, Springer, Heidelberg, Germany, 597 pp., https://doi.org/10.1007/978-3-540-75776-4, 2008.
Seinfeld, J. H. and Pandis, S. N.: Atmospheric Chemistry and Physics: From Air Pollution to Climate Change, John Wiley & Sons, Inc., ISBN 0471178152, 1998.
Serdyuchenko, A., Gorshelev, V., Weber, M., Chehade, W., and Burrows, J. P.: High spectral resolution ozone absorption cross-sections – Part 2: Temperature dependence, Atmos. Meas. Tech., 7, 625–636, https://doi.org/10.5194/amt-7-625-2014, 2014.
Thalman, R. and Volkamer, R.: Temperature dependant absorption cross-sections of O2–O2 collision pairs between 340 and 630 nm at atmospherically relevant pressure, Phys. Chem. Chem. Phys., 15, 15371–15381, https://doi.org/10.1039/C3CP50968K, 2013.
Tzortziou, M., Herman, J. R., Ahmad, Z., Loughner, C. P., Abuhassan, N., and Cede, A.: Atmospheric NO2 dynamics and impact on ocean color retrievals in urban nearshore regions, J. Geophys. Res.-Oceans, 119, 3834–3854, https://doi.org/10.1002/2014JC009803, 2014.
Tzortziou, M., Herman, J. R., Cede, A., Loughner, C. P., Abuhassan, N., and Naik, S.: Spatial and temporal variability of ozone and nitrogen dioxide over a major urban estuarine ecosystem, J. Atmos. Chem., 72, 287–309, https://doi.org/10.1007/s10874-013-9255-8, 2015.
Vandaele, A., Hermans, C., Simon, P., Carleer, M., Colin, R., Fally, S., M'erienne, M., Jenouvrier, A., and Coquart, B.: Measurements of the NO2 absorption cross-section from 42 000 cm−1 to 10 000 cm−1 (238–1000 nm) at 220 K and 294 K, J. Quant. Spectrosc. Ra., 59, 171–184, https://doi.org/10.1016/s0022-4073(97)00168-4, 1998.
Veefkind, J. P., Aben, I., McMullan, K., Förster, H., de Vries, M., Otter, G., Claas, J., Eskes, H. J., de Haan, J. F., Kleipool, Q. L., van Weele, M., Hasekamp, O., Hoogeveen, R., Landgraf, J., Snel, R., Tol, P., Ingmann, P., Voors, R., Kruizinga, B., Vink, R., Visser, H., Levelt, P. F., and de Vries, J.: TROPOMI on the ESA Sentinel-5 Precursor: A GMES mission for global observations of the atmospheric composition for climate, air quality and ozone layer applications, Remote Sens. Environ., 120, 70–83, https://doi.org/10.5194/amt-13-6113-2020, 2012.
Verhoelst, T., Compernolle, S., Pinardi, G., Lambert, J.-C., Eskes, H. J., Eichmann, K.-U., Fjæraa, A. M., Granville, J., Niemeijer, S., Cede, A., Tiefengraber, M., Hendrick, F., Pazmiño, A., Bais, A., Bazureau, A., Boersma, K. F., Bognar, K., Dehn, A., Donner, S., Elokhov, A., Gebetsberger, M., Goutail, F., Grutter de la Mora, M., Gruzdev, A., Gratsea, M., Hansen, G. H., Irie, H., Jepsen, N., Kanaya, Y., Karagkiozidis, D., Kivi, R., Kreher, K., Levelt, P. F., Liu, C., Müller, M., Navarro Comas, M., Piters, A. J. M., Pommereau, J.-P., Portafaix, T., Prados-Roman, C., Puentedura, O., Querel, R., Remmers, J., Richter, A., Rimmer, J., Rivera Cárdenas, C., Saavedra de Miguel, L., Sinyakov, V. P., Stremme, W., Strong, K., Van Roozendael, M., Veefkind, J. P., Wagner, T., Wittrock, F., Yela González, M., and Zehner, C.: Ground-based validation of the Copernicus Sentinel-5P TROPOMI NO2 measurements with the NDACC ZSL-DOAS, MAX-DOAS and Pandonia global networks, Atmos. Meas. Tech., 14, 481–510, https://doi.org/10.5194/amt-14-481-2021, 2021.
Wagner, T., Beirle, S., Brauers, T., Deutschmann, T., Frieß, U., Hak, C., Halla, J. D., Heue, K. P., Junkermann, W., Li, X., Platt, U., and Pundt-Gruber, I.: Inversion of tropospheric profiles of aerosol extinction and HCHO and NO2 mixing ratios from MAX-DOAS observations in Milano during the summer of 2003 and comparison with independent data sets, Atmos. Meas. Tech., 4, 2685–2715, https://doi.org/10.5194/amt-4-2685-2011, 2011.
Wang, Y., Beirle, S., Lampel, J., Koukouli, M., De Smedt, I., Theys, N., Li, A., Wu, D., Xie, P., Liu, C., Van Roozendael, M., Stavrakou, T., Müller, J.-F., and Wagner, T.: Validation of OMI, GOME-2A and GOME-2B tropospheric NO2, SO2 and HCHO products using MAX-DOAS observations from 2011 to 2014 in Wuxi, China: investigation of the effects of priori profiles and aerosols on the satellite products, Atmos. Chem. Phys., 17, 5007–5033, https://doi.org/10.5194/acp-17-5007-2017, 2017.
Zhao, X., Griffin, D., Fioletov, V., McLinden, C., Cede, A., Tiefengraber, M., Müller, M., Bognar, K., Strong, K., Boersma, F., Eskes, H., Davies, J., Ogyu, A., and Lee, S. C.: Assessment of the quality of TROPOMI high-spatial-resolution NO2 data products in the Greater Toronto Area, Atmos. Meas. Tech., 13, 2131–2159, https://doi.org/10.5194/amt-13-2131-2020, 2020.