the Creative Commons Attribution 4.0 License.
the Creative Commons Attribution 4.0 License.
 | 24 Jan 2023
Investigating the dependence of mineral dust depolarization on complex refractive index and size with a laboratory polarimeter at 180.0° lidar backscattering angle
Danaël Cholleton
Clément Noël
Patrick Rairoux
In this paper, the dependence of the particles' depolarization ratio (PDR) of mineral dust on the complex refractive index and size is for the first time investigated through a laboratory π-polarimeter operating at 180.0∘ backscattering angle and at (355, 532) nm wavelengths for lidar purposes. The dust PDR is indeed an important input parameter in polarization lidar experiments involving mineral dust. Our π-polarimeter provides 16 accurate (<1 %) values of the dust lidar PDR at 180.0∘ corresponding to four different complex refractive indices, studied at two size distributions (fine, coarse) ranging from 10 nm to more than 10 µm and at (355, 532) nm wavelengths while accounting for the highly irregular shape of mineral dust, which is difficult to model numerically. At 355 nm, the lidar PDR of coarser silica, the main oxide in mineral dust, is equal to (33±1) %, while that of coarser hematite, the main light absorbent in mineral dust, is (10±1) %. This huge difference is here explained by accounting for the high imaginary part of the hematite complex refractive index. In turn, Arizona dust exhibits higher depolarization than Asian dust, due to the higher proportion in hematite in the latter. As a result, when the strong light-absorbent hematite is involved, the dust lidar PDR primarily depends on the particles' complex refractive index, and its variations with size and shape are less pronounced. When hematite is less or not involved, the dust lidar PDR increases with increasing sizes, though the shape dependence may then also play a role. The (355, 532) nm wavelength dependence of the dust lidar PDR then allows discussing on the involved particle sizes, thus highlighting the importance of dual-wavelength (or more) polarization lidar instruments. We believe these laboratory findings will help improve our understanding of the challenging dependence of the dust lidar PDR with complex refractive index and size to help interpret the complexity and the wealth of polarization lidar signals.
- Article
(2864 KB) - Full-text XML
- BibTeX
- EndNote


With worldwide annual emissions between 1000 to 3000 Tg (Monge et al., 2012), mineral dust is a highly important constituent of the atmosphere, which contributes to ice cloud formation by acting as a freezing nucleus and to the carbon cycle by fertilizing nutrient-poor ecosystems such as the Amazon rainforest after long-range transport (Bristow et al., 2010). As underscored in the latest IPCC report (IPCC, 2021), mineral dust also contributes to the Earth's radiative budget through light scattering and absorption by reducing the amount of energy reaching the Earth's surface (Kosmopoulos et al., 2017). The radiative impact associated with a Saharan dust storm has been recently quantified by Francis et al. (2022). This climatic impact is however subject to large uncertainties, mainly due to the great complexity in size, shape and mineralogy of mineral dust. In the atmosphere, the size distribution of mineral dust is mainly determined by the distance from the dust source region. Two freshly uplifted dust aerosols may indeed exhibit different size distributions at far-range remote sites (Ryder et al., 2013), due to the rapid removal of the largest particles by gravitational settling. Mineral dust particles also exhibit a high degree of complexity in shape. Electron microscopic images (Kandler et al., 2011) indeed highlight the nonspherical and highly irregular shape of mineral dust particles, with sharp edges, sometimes even surface roughness (Nousiainen, 2009). The mineral dust surface is itself subject to photo-catalytic reactions, even leading to new particle formation events (Dupart et al., 2012). The third degree of complexity of mineral dust related to this study lies in its mineralogy. Mineral dust indeed consists in a heterogeneous mixture of various chemical oxides among which the most predominant is silica oxide. Aluminum and iron oxides are also present in proportions depending on the dust source region. As an example, the desert in central Australia is iron-oxide-rich (Bullard and White, 2002). This diverse mineralogy results in a diversity of complex refractive indices for mineral dust.
In the atmosphere, mineral dust is additionally often mixed with other aerosols. To face such a complexity, ground- and satellite-based polarization lidar instruments, based on light backscattering by nonspherical particles, have been developed (Freudenthaler et al., 2009; Tesche et al., 2009; Sugimoto and Lee, 2006; Winker et al., 2009; Miffre et al., 2019; Hofer et al., 2020; Hu et al., 2020) to discern the mineral dust contribution to two-component particle external mixtures by applying lidar partitioning algorithms such as the 1β+1δ algorithm (Tesche et al., 2009; Mehri et al., 2018). Such lidar-based retrievals are however under-constrained and depend on prior knowledge regarding input parameters such as the lidar particles' depolarization ratio (PDR). The lidar PDR quantifies the mineral dust particles' deviation from isotropy and is key for aerosol typing (Hofer et al., 2020; Burton et al., 2012). As explained in light scattering textbooks (Bohren and Huffman, 1983; Mishchenko et al., 2002), it depends on the particles size, shape and complex refractive index. The size dependence of the lidar PDR was studied in field by Hofer et al. (2020). The downside of such field measurements is that the observed aerosol is nevertheless that of a particle mixture, which may induce some discrepancies in the retrieved dust lidar PDR (Miffre et al., 2011). As an alternate, for accurate retrievals of the mineral dust lidar PDR, light backscattering numerical simulations have been developed by assuming a particle's shape model such as the spheroidal shape model, computed with the T-matrix numerical code (Mishchenko and Travis, 1998), as successfully applied for mineral dust during the SAMUM field campaign (Müller et al., 2013) or by considering more realistic shapes, based on stereograms, computed with the discrete dipole approximation (Lindqvist et al., 2014; Gasteiger et al., 2011). Depending on the assumed shape model, the lidar PDR can be very different with induced variations in the lidar-retrieved dust mass concentrations (Mehri et al., 2018). Recently, Luo et al. (2022) and Huang et al. (2022) discussed the ability of the spheroidal model to mimic the complex shape of mineral dust. Likewise, Zubko et al. (2013) found spheroids inadequate for describing the dust particles' spectral dependence of the lidar PDR. Such light scattering numerical simulations nonetheless rely on simplifying assumptions that should be carefully checked. Laboratory experiments on natural dust samples at the 180.0∘ lidar exact backscattering angle are then looked for, as they provide quantitative evaluations of the mineral dust lidar PDR within experimental error bars. Indeed, in the laboratory, the retrieved lidar PDR is, by construction, that of pure mineral dust and the dependence of the dust lidar PDR with size and mineralogy can be evaluated. Moreover, the complex shape of mineral dust is then accounted for. However, existing laboratory light scattering experimental setups (Glen and Brooks, 2013; Järvinen et al., 2016; Gautam et al., 2020; Liu et al., 2020; Kahnert et al., 2020; Gómez Martín et al., 2021) can only provide approximate values of the dust lidar PDR for the following reasons:
-
Such apparatuses operate at near backscattering angles only (<180.0∘), without covering the exact lidar backscattering angle of 180.0∘. The retrieved lidar PDR is then extrapolated to 180.0∘ following simplifying numerical assumptions, ignoring the complexity in the shape of mineral dust (Liu et al., 2020; Gómez Martín et al., 2021). To provide accurate values of the dust lidar PDR, such assumptions must be carefully discussed as the lidar PDR actually depends on the scattering angle in an unpredictable way, as underscored in light scattering textbooks (Bohren and Huffman, 1983; Mishchenko et al., 2002), due to the complex shape of mineral dust. For that, a laboratory measurement of the dust lidar PDR at 180.0∘ is mandatory.
-
Also, most of the above apparatuses operate at a single wavelength, either 442, 488, 552, 632, 647 or 680 nm, which differs from the (355, 532, 1064 nm) wavelengths which are applied in polarization lidar field experiments. As for Raman lidars, such wavelength extrapolations up to the (355, 532, 1064 nm) lidar wavelengths are a source of discrepancy as the dust lidar PDR actually depends on the complex refractive index, which is wavelength-dependent (Bohren and Huffman, 1983; Mishchenko et al., 2002). For that, a laboratory measurement at the lidar wavelengths is mandatory.
In this paper, accurate values (<1 %) of the dust lidar PDR are provided from a laboratory π-polarimeter operating at 180.0∘ lidar exact backscattering angle and at 355, 532 nm wavelengths to account for the importance of the spectral dependence of the lidar PDR to better constrain lidar inversions and aerosol typing (Burton et al., 2016; Haarig et al., 2022). Since the scattering angle and the wavelengths are determined for lidar purposes, we here investigate the dependence of the mineral dust lidar PDR on the dust particles size and complex refractive index (CRI), the latter being particularly important as related to light absorption. Light absorption by mineral dust preferentially occurs in the UV and VIS spectral domains, being nearly null in the near-infrared spectral range (Di Biagio et al., 2019), noticeably in the presence of iron oxides (Formenti et al., 2014; Caponi et al., 2017). By absorbing shortwave radiations, such oxides hence play a critical role in determining the overall impact of dust aerosol on climate forcing (Go et al., 2022). We hence focused on 355 and 532 nm lidar wavelengths and considered four dust samples differing in their CRI, thus in mineralogy: (i) silica oxide (SiO2), as the most abundant mineral oxide present in mineral dust; (ii) iron oxide (hematite, Fe2O3), as the main light absorbent present in mineral dust (Gautam et al., 2020; Zong et al., 2021; Go et al., 2022); and (iii) and (iv) two heterogeneous mixtures of the above two oxides in various proportions, as detailed in Sect. 2. The dependence of the lidar PDR with size is then likewise investigated by accounting for the fine and coarse modes of the particle size distributions (SDs), to which lidar instruments are sensitive (Mamouri and Ansmann, 2017), thus extending the size range of our previous laboratory findings (Miffre et al., 2016) to particle sizes larger than 800 nm and to other mineralogy, as asked for in Tesche et al. (2019). According to the manufacturer, the size distribution of our dust samples ranged from 10 nm to more than 10 µm in diameter. Our work provides 16 laboratory-derived accurate dust lidar PDR values, corresponding to four mineral dust samples differing in mineralogy, given at two SDs (fine, coarse) and at two wavelengths (355, 532 nm). Moreover, the role of the imaginary part of the hematite CRI, which may lead to modifications in the lidar PDR, is here for the first time quantified and discussed.
The paper is structured as follows. In Sect. 2, the complex refractive indices and size distributions of our four dust samples are presented. The laboratory π-polarimeter at 180.0∘ lidar backscattering angle is then presented in Sect. 3, together with the dust lidar PDR retrieval methodology, derived from the scattering matrix formalism (Mishchenko et al., 2002). The main findings are outlined in Sect. 4 where the 16 values of dust lidar PDR are given and a discussion is proposed to investigate the dependence of the dust lidar PDR on the imaginary part of the dust CRI. As in elastic lidar applications, we here consider the elastic backscattering of electromagnetic radiation of wavelength λ by an ensemble of mineral dust particles of complex refractive index embedded in ambient air.
2.1 Refractive indices
Mineral dust is a complex mixture of several chemical oxides presenting various complex refractive indices. To investigate the dependence of the dust lidar PDR on the complex refractive index (CRI), we consider the four following case studies:
-
Silica, or silicon oxide (SiO2), is here considered being the main pure chemical component present in mineral dust. The silica CRI as given by Longtin et al. (1988) is equal to 1.546, hence exhibiting no absorptive component.
-
Iron oxide, or hematite (Fe2O3), is in contrast here selected as being a climatically significant light absorbent in the shortwave spectral region that can be transported far from source regions with similar efficiency as black carbon particles (Lamb et al., 2021). It recently regained interest with papers specifically dedicated to this constituent (Gautam et al., 2020; Zong et al., 2021). Hematite is unique among all chemical oxides present in mineral dust due to its strong CRI. Both n and κ are large in hematite, with κ values more than 100 times those of other soil mineral components at lidar wavelengths. Hence, hematite dominates absorption, while other minerals can be considered non-absorbing (Go et al., 2022). The real and imaginary parts of the hematite CRI are provided by Scanza et al. (2015): at 355 nm wavelength (3.07+0.55i at 532 nm wavelength).
-
Arizona test dust (hereafter called Arizona dust) is likewise considered an example of natural mineral dust sample that is a mixture of the above two oxides. According to the manufacturer (Power Technology, Inc.), Arizona test dust is composed of silica (68 %–76 %), while hematite is only weakly present in Arizona dust (2 %–5 %). In short, Arizona dust is hence rather silica-rich. As given by the manufacturer, the Arizona dust CRI is , without however any information given on its spectral dependency. Effective medium theories can alternately be applied to account for the sample inhomogeneity as calculated in Miffre et al. (2016), who arrived to at 355 nm wavelength and at 532 nm wavelength. As a result, the Arizona dust sample CRI is characterized by n∼1.5 and a low absorbing component .
-
Asian dust is finally also considered an important case study of natural mineral dust sample, presenting however a lower proportion of silica (34 %–40 %) and a higher proportion in hematite (17 %–23 %). For Asian dust, we use a commercial sample provided by Powder Technology (commercial name: Kanto Loam), commonly used as a dust interferon in pollen light scattering measurements in Japan (Iwai, 2013), hence representative of observed atmospheric Asian dust. In this way, we symmetrized our approach by dealing with both Arizona test dust and Asian test dust. The CRI of Asian dust, evaluated from effective medium approximation, is at 355 nm wavelength and 1.72+0.03i at 532 nm wavelength. Hence, compared with Arizona dust, Asian dust is more hematite-rich and hence exhibits a larger imaginary part for its CRI.
Other chemical oxides are also present in our dust samples in various percentages but with negligible imaginary parts of CRI compared with that of hematite. Investigating the PDR of these oxides is then beyond the scope of this paper. Their percentage (Arizona test dust, Asian dust) is given for clarity: Al2O3 (11 %, 29 %), CaO (4 %, 1.5 %), K2O (3.5 %, 0 %), Na2O (2 %, 0 %), MgO (1.5 %, 5 %) and TiO2 (0.5 %, 2 %). The solid dust samples, provided by Sigma Aldrich and Powder Technology manufacturers, were embedded in laboratory ambient air by using a solid dust generator supplied with dried compressed air (RH<10 %) to get dry, solid dust particles embedded in laboratory ambient air at a constant number concentration, before injecting the dust samples into the light scattering volume, as presented in Sect. 3.
2.2 Size distribution (SD)
For each above dust sample, we consider two size distributions (SDs) to likewise investigate the dependence of the dust lidar PDR on the particle size:
-
the coarser SD, represented in gray in Fig. 1, is more representative of mineral dust particles close to dust regions, although it does not cover the full range of large dust particles measured close to dust sources, showing particles with diameters >50 µm (Ryder et al., 2019), and
-
a finer SD, plotted with a black line in Fig. 1, aimed at being more representative of mineral dust particles after long-range transport, i.e., farther from the dust source regions.
The SDs were obtained by adding/removing a cyclone to our experimental setup, allowing us to add/remove particles with a diameter above 800 nm, thus exploring particle size ranges below and above 800 nm, as asked for in Tesche et al. (2019). More precisely, the two considered SDs correspond to a size distribution with and without coarse mode. The SDs were measured with an optical particle sizer (OPS 3330) coupled with a scanning mobility particles sizer (SMPS 3081), which select the dust particles as a function of their electric mobility, this latter quantity being diameter-dependent. As in Järvinen et al. (2016), our size instruments could not measure dust particles with a diameter above 10 µm. According to the manufacturer, such giant particles (Ryder et al., 2019) are however present in our dust samples, at a low number concentration. The measured SDs are representative of what is observed in the atmosphere, with a low number concentration of more than 10 µm particles, as observed by Weinzierl et al. (2017). The particle SDs displayed in Fig. 1 are in agreement with the specifications provided by the manufacturers.

Figure 1Dust particle size distributions (SDs) for (a) Arizona dust, (b) Asian dust, (c) Silica (SiO2) and (d) Hematite (Fe2O3) in the presence/absence of the added cyclone (finer SD in solid black, coarser SD in dotted gray). The retrieved SDs, obtained by log-normal adjustments, agree with the specifications provided by the manufacturers.
In this section, we detail our methodology for accurate laboratory evaluations of the dust lidar PDR at the lidar exact backscattering angle of 180.0∘ for accurate lidar PDR retrievals.
3.1 Scattering matrix formalism
The dust lidar PDR can be evaluated in the framework of the scattering matrix formalism (Mishchenko et al., 2002; Bohren and Huffman, 1983). In this formalism, the polarization state of the incident and scattered radiations are described by their respective Stokes vectors and , defined with respect to the scattering plane, used as a reference plane (Mishchenko et al., 2002). The first Stokes component I corresponds to the light intensity, Q and U describe linear polarization, while V accounts for circular polarization. At a distance d from the mineral dust samples, if single scattering and particles random orientation are assumed, for macroscopically isotropic and mirror-symmetric mediums, the incident and scattered Stokes vectors relate with a block-diagonal scattering matrix (Mishchenko et al., 2002; Bohren and Huffman, 1983):
where the matrix elements Fij,λ(θ) (ij= 1–4) depend on the wavelength λ of the radiation (hereafter noted as a subscript) and carry information on the mineral dust particle size, shape and CRI. The scattering angle is , where is the wave vector of the electromagnetic wave. In lidar applications, the scattering angle is equal to π (i.e., exact backscattering angle). To highlight the need for laboratory measurements at the specific 180.0∘ lidar backscattering angle, near-backscattering angles (i.e., θ<π) are also considered in this section. Indeed, at θ=π, and (Zubko et al., 2013; David et al., 2013), while due to the backscattering theorem (Van de Hulst, 1957) so that Eq. (1) simplifies as follows for lidar applications:
As a result, it is only at elastic lidar exact backscattering angle (θ=π) that so that the scattering matrix reduces to only two non-vanishing elements, F11,λ(π) and F22,λ(π).
3.2 Lidar particles' depolarization ratio (PDR)
The expression of the so-called particles' linear depolarization ratio (PDR) at wavelength λ and scattering angle θ can be found in light scattering textbooks (Mishchenko et al., 2002; Schnaiter et al., 2012):
where the positive (resp. negative) sign corresponds to p polarized (resp. s polarized) incident electromagnetic radiation. The PDR stated in Eq. (3) is the linear PDR, which can be related to the circular PDR if need be (Mishchenko et al., 2002). Since F11,λ, F12,λ and F22,λ may vary with the scattering angle, depending on the dust sample, the dust PDR at near-backscattering angles (θ<π) differs from that obtained at specific lidar backscattering angles (θ=π). The deviation of F11,λ, F12,λ and F22,λ from their value at exact backscattering angle cannot be quantified, since no analytical light scattering theory exists for such complex-shaped particles as mineral dust. Therefore, a laboratory experiment at specific lidar exact backscattering angle (θ=π) is required for precise evaluations of the dust lidar PDR. At specific lidar backscattering angle of π, Eq. (3) becomes
Hence, accurate evaluations of the dust lidar PDR rely on accurate determinations of the ratio at the specific lidar π angle. As for the ratio , the dust lidar PDR is size-, shape- and refractive-index-dependent, and this dependency is discussed in Sect. 4. Spherical particles, for which , lead to PDRλ(π)=0. In what follows, to ease the reading, the dust lidar PDR will be noted PDRλ without reference to scattering angle (θ=π).
3.3 Laboratory π-polarimeter for retrieving the lidar PDR of mineral dust
In Miffre et al. (2016), for the first time to our knowledge, a laboratory π-polarimeter was built to address light backscattering by aerosol particles. We here recall its main characteristics for clarity. The aerosol π-polarimeter is schemed in Fig. 2. As in lidar applications, pulsed laser light is used to measure the time-of-flight taken by a laser pulse to reach the dust sample and be detected after light backscattering. The backscattering geometry is set by inserting a well-characterized polarizing beam splitter cube (PBC) between the emission and the dust samples, with a precision of 1 mm out of 10 m to ensure the π-polarimeter covers the lidar exact backscattering direction with accuracy: . The laboratory aerosol π-polarimeter is actually composed of two identical polarimeters, one per wavelength, to evaluate the lidar PDR of a given dust sample at 355 and 532 nm wavelengths simultaneously. Moreover, to decrease the retrieval uncertainty on the dust PDR, the polarization state of the backscattered radiation is analyzed for a set of incident polarization states of the incident light using a quarter-wave plate (QWP). To validate the laboratory π-polarimeter, we carefully checked that homogeneous spherical particles, such as ammonium sulfate particles, which scatter light as described by the Mie theory (Bohren and Huffmann, 1983), were indeed providing zero lidar PDR when following the methodology described in the below section.
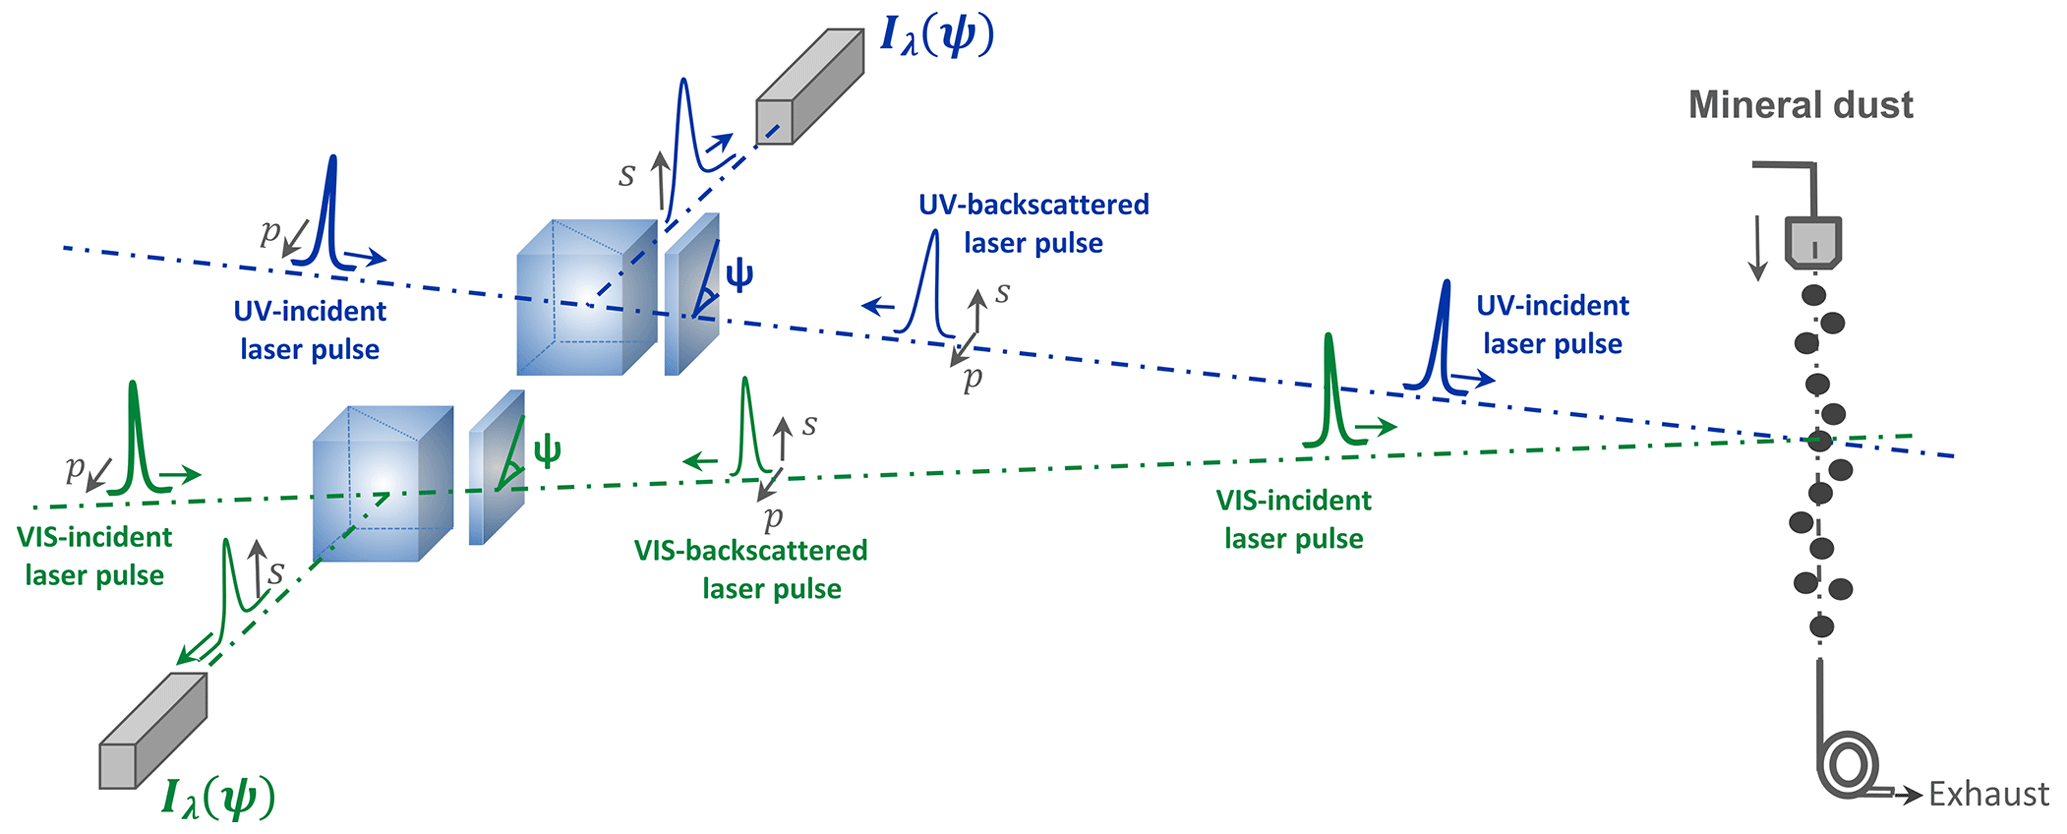
Figure 2Scheme of the laboratory π-polarimeter operating at lidar exact backscattering angle of (180.0±0.2)∘, allowing accurate retrievals of the lidar PDR at 355 and 532 nm wavelengths simultaneously for an aerosol sample (Miffre et al., 2016). The (p, s) polarization components are defined with respect to the laser scattering plane, and ψ is the angle between the fast axis of the QWP and the laser scattering plane, counted counter-clockwise for an observer looking from the PBC to the particles. The dust lidar PDR is then evaluated from the ratio at the specific π angle, following the methodology described in Sect. 3.4.
3.4 Laboratory retrievals of mineral dust lidar PDR
We can formulate the PDR measurements of dust particles, using successive Mueller matrices denoting to the optical elements of the π-polarimeter and the scattering medium, encountered by the laser pulse from the laser source to the dust particle sample then back to the light detector. The measured backscattered intensity is
where ηλ is the optoelectronics efficiency of the light detector and Pλ is the laser power density, while is the Stokes vector of the incident laser light. The expression of the dust backscattering matrix [Fλ] at wavelength λ is given in Eq. (2), while [PBC] and [QWP(±ψ)] are the Mueller matrices of the PBC and the QWP respectively (Shurcliff, 1962). To develop Eq. (5), it is then advised to first calculate the raw vector then multiply it with the Stokes vector of the incident laser light [QWP(ψ)][PBC](Sti) equal to , with ψ the modulation angle of the QWP. After a few calculations, the dust backscattered light intensity Iλ at wavelength λ is calculated as shown in Eq. (6):
where the intensity , while coefficients aλ and bλ are equal to and . Hence, so that the ratio at the π angle can be determined from the ratio . This ratio can be obtained from measurements of Iλ(ψ) for different ψ angles of the QWP, then adjusting these variations with Eq. (6) to get accurate determinations of Iλ,0aλ and Iλ,0bλ, then . Evaluations of the dust lidar PDR are then finally retrieved from Eq. (4):
Within our methodology, the dust lidar PDR is independent of Iλ,0. For that reason, in Sect. 4, the applied voltage to the UV and VIS photodetectors is adjusted to each dust SD and mineralogy to gain in accuracy in the retrieved dust lidar PDR by improving the signal-to-noise ratio on Iλ. For example, Fig. 3 provides simulations of for the following three dust lidar PDR case studies: 33 % dust lidar PDR (in full lines, i.e., ), 25 % dust lidar PDR (in dashed lines, i.e., ) and 10 % dust lidar PDR (in dotted lines, i.e., ). The curve minima, which are equal to , are shape-dependent: each curve hence exhibits non-vanishing minima, since mineral dust particles are nonspherical. Likewise, the curve maxima are equal to and are size-dependent, though it is also shape-dependent. The dust lidar PDR is determined from Iλ,m and Iλ,M since, following Eq. (7), , independently of Iλ,0.
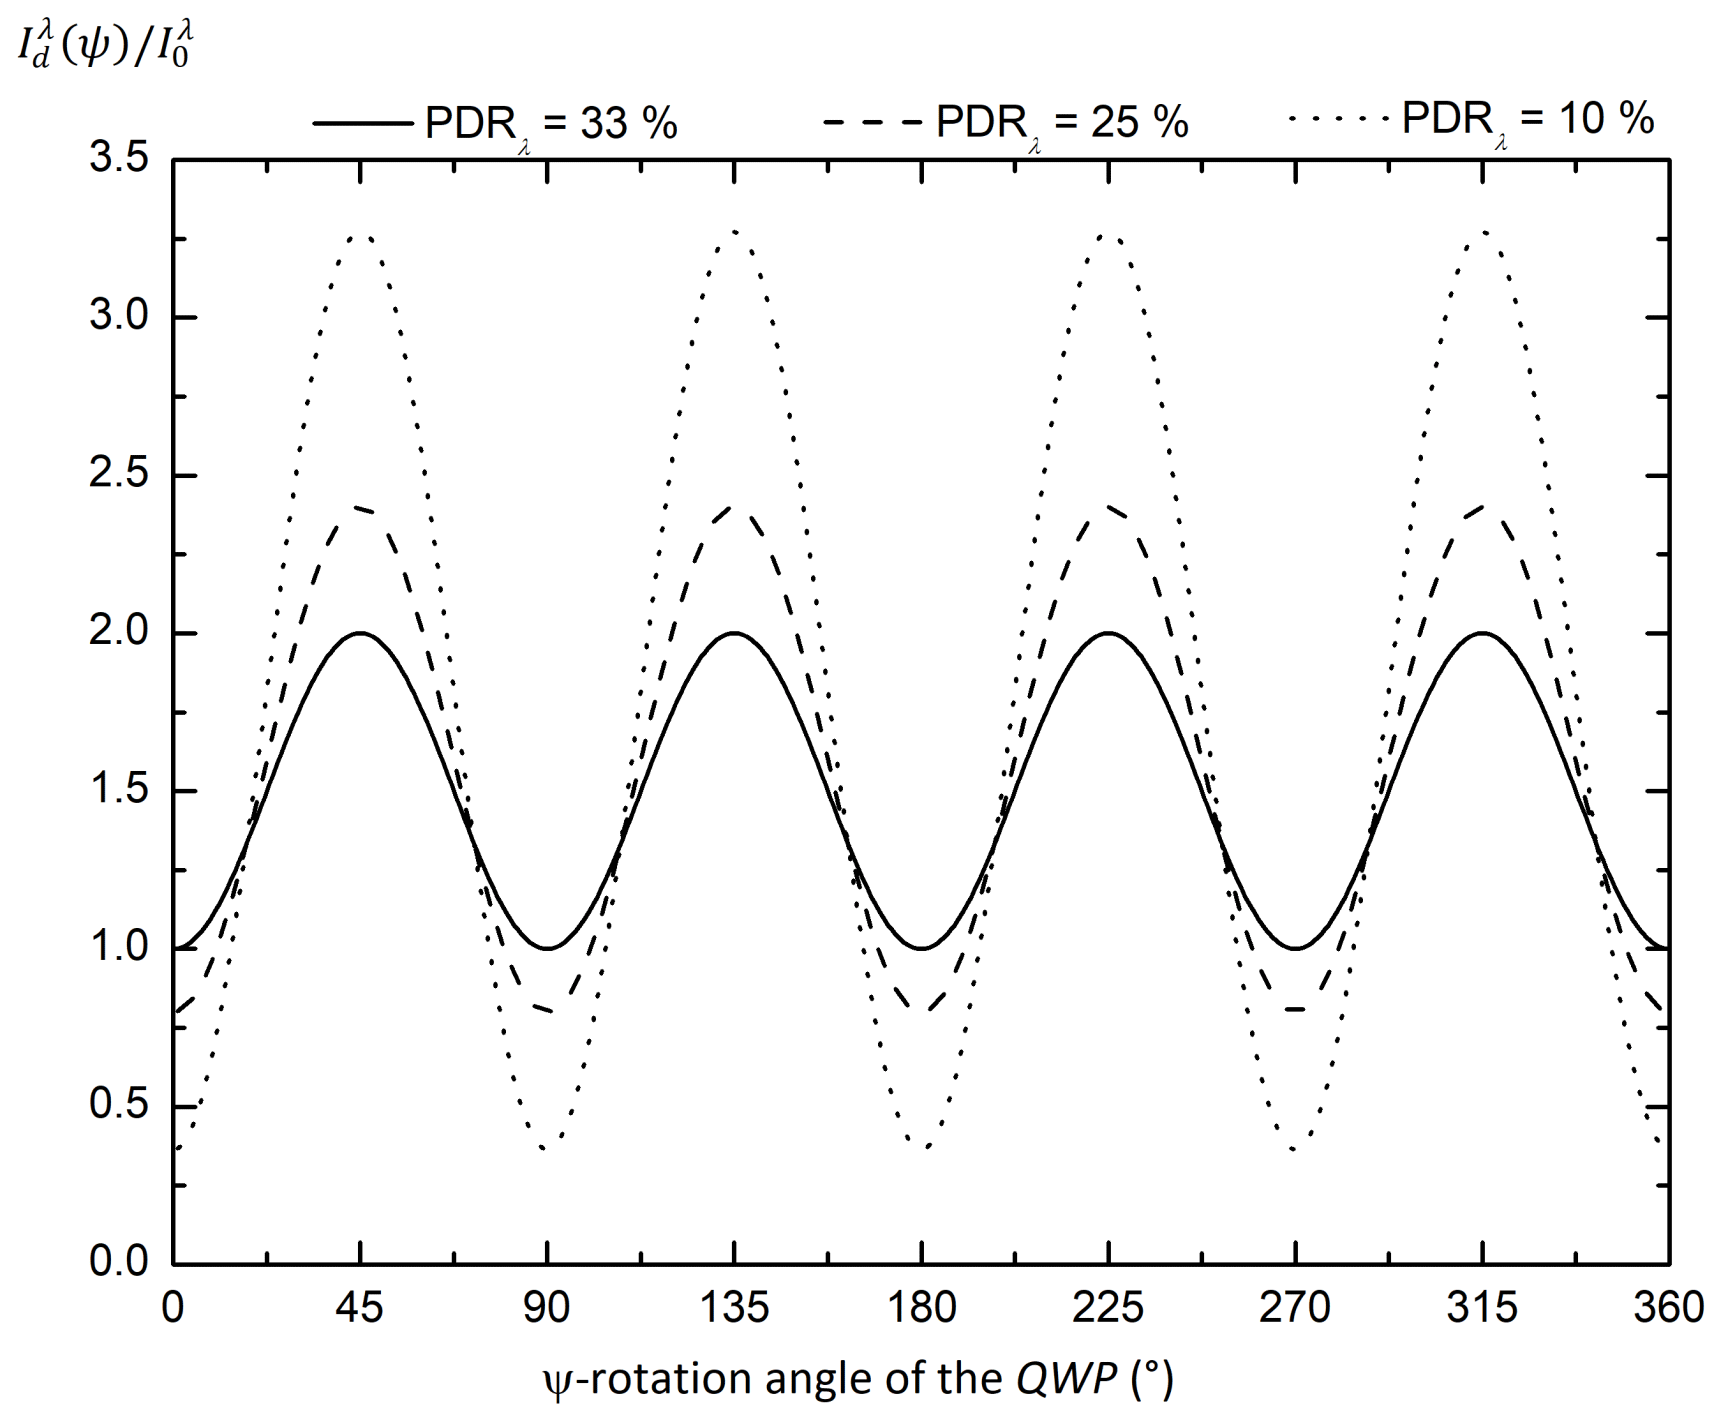
Figure 3Numerical simulation of the dust backscattered light intensity as a function of the orientation ψ of the QWP at a given wavelength at the following three case studies: PDRλ=33 % (in full lines, corresponding to ), PDRλ=25 % (in dashed lines, ), PDRλ=10 % (in dotted lines, ).
3.5 Accuracy on the retrieved laboratory mineral dust lidar PDR
Special care has been taken to quantify the uncertainties on the retrieved dust lidar PDR. The systematic errors in the π-polarimeter are that encountered in 2λ polarization lidar experiments, which we extensively studied (David et al., 2012) and can also be found in polarization lidar reference papers (Freudenthaler, 2016). To summarize, systematic errors arise from the following:
-
Imperfect definition of the polarization state of the incident radiation. In the π-polarimeter, the polarization state of the electromagnetic radiation emitted from the laser is precisely set to (i.e., with no remaining ellipticity) by using two successive PBCs.
-
Polarization cross talk between the emitter and the detector polarization axes. Likewise, on the detector side, to account for the imperfections of the retro-reflecting PBC (Rs>99.5 %, Tp>90 %), a secondary PBC is inserted between the retro-reflecting PBC and the light detector to ensure polarization cross talk or undesired fraction RpTs originating from the p component of the backscattered radiation are fully negligible. Hence, the π-polarimeter is sensitive to the s component of the backscattered radiation only. The emitting PBC being also used as retro-reflecting PBC, any possible mismatch between the s polarization axis of the emitted and detected backscattered radiations cannot occur.
-
Spectral cross talk between the UV- and the VIS-backscattered radiations. Likewise, wavelength cross talk is minimized by using selective interference filters exhibiting a higher than five optical density, at 355 nm wavelength in the VIS π-polarimeter and at 532 nm wavelength in the UV π-polarimeter.
-
Multiple scattering can induce further light depolarization. However, the single-scattering approximation is ensured in our laboratory backscattering experiment (Mishchenko et al., 2007) where the particles are moving in a thin (2.5 mm width) beam so that the volume element is optically thin in contrast to atmospheric chambers (1100 cm−3 for the coarser SD).
Finally, to account for potential fluctuations in the dust particle number concentration that may cause variations in the dust backscattered light intensity Iλ, a normalization channel has been added to the π-polarimeter by including a polarization-insensitive light detector operating at scattering angle θ0=165∘. The corresponding scattered light intensity Iλ(θ0) is quantified similarly to Eq. (5), considering a scattering angle of θ0:
where [Fλ(θ0)] is the scattering matrix at angle θ0. There, the QWP and the PBC only act on the detector side while (Sti) equals . Hence, . Once the variations of Iλ(θ0) with a ψ angle are recorded, the cos (4ψ)-dependency of Iλ(θ0) can be removed by applying a numerical low-pass filter on Iλ(θ0) to get a light intensity proportional to the dust particle number concentration. As a result, in the light backscattering curves presented in Sect. 4, the plotted quantity is the normalized backscattered light intensity , which is insensitive to potential fluctuations in the dust particle number concentration. The scattered light intensities Iλ(π) and Iλ(θ0) being correlated, the standard deviation σN on Iλ,N was calculated by considering the covariance of Iλ and Iλ(θ0). This covariance contributes to the uncertainty on Iλ,N at a rate . Moreover, to gain in accuracy in the dust lidar PDR retrievals, Iλ,N was measured for a complete ψ-angle rotation, while averaging the acquired backscattered light intensity over several thousand laser shots per ψ angle, with resulting mean and standard deviations on Iλ,N as plotted in Figs. 4 and 5.
In this section, using the methodology presented in Sect. 3, the lidar PDR of Arizona dust, Asian dust, silica and hematite is evaluated and discussed at 355 and 532 nm wavelengths for the finer and coarser SDs.
4.1 Laboratory evaluation of the lidar PDR of Arizona and Asian dust
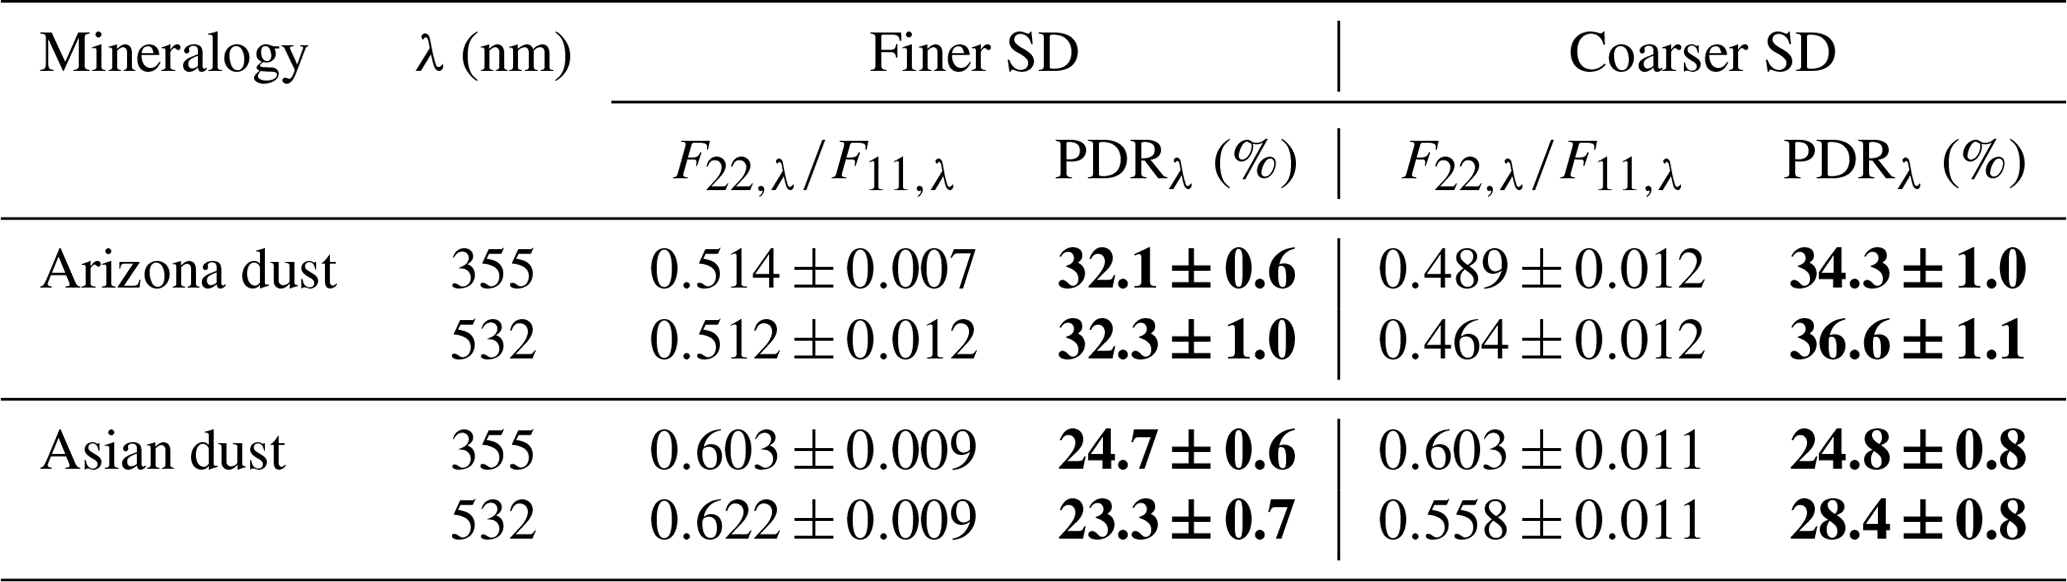
Figure 4 displays the variations of Iλ,N for Arizona (Fig. 4a) and Asian dust (Fig. 4b) as a function of the ψ-rotation angle of the QWP for the finer (left panels) and coarser SDs (right panels) at 355 and 532 nm wavelengths. The observed variations are related to a determined size and shape distribution of the dust sample: indeed, as explained in Sect. 3.4, if the size (resp. the shape) of the dust sample was varying during our acquisitions, the maxima (resp. the minima) of the curves would not remain constant. As a result, the observed variations of Iλ,N reveal the spectral and polarimetric backscattering characteristics of each considered dust sample. Therefore, the experimental data points could be fitted with Eq. (6) to evaluate and then the dust lidar PDR by applying Eq. (7). Table 1 presents the retrieved values of and of dust lidar PDR. The uncertainty on results from the measurement errors of the laboratory π-polarimeter and leads to accurate evaluations of the dust lidar PDR. Within experimental error bars, the lidar PDRs of Arizona and Asian dust clearly differ, whatever the chosen wavelength. The generally admitted value of around 33 % for the dust lidar PDR (Tesche et al., 2009) is only obtained for Arizona dust: Asian dust exhibits a lower PDR in the range from 24 % to 28 %, depending on the considered SD and wavelength. This suggests that the dust lidar PDR is primarily governed by the dust mineralogy and hence particle refractive index. The sensitivity of the dust lidar PDR with the considered SD is indeed less pronounced: from the coarser to the finer SD, a reduction in the dust lidar PDR of below 5 % is observed at 532 nm wavelength. At 355 nm wavelength however, the Arizona and Asian dust lidar PDRs seem practically insensitive to variations in the considered SD.

Figure 4Normalized backscattered light intensity of Arizona (a) and Asian dust (b) for finer SD (left panels) and coarser SD (right panels), using the laboratory π-polarimeter at lidar exact backscattering angle (θ=π) at 355 (blue) and 532 nm (green) wavelengths. The experimental data points are fitted with Eq. (6) to derive , and then the dust lidar PDR is derived using Eq. (7). Care should be taken when comparing Iλ,N for Arizona and Asian dust, since the applied voltage to the UV and VIS photodetectors was adjusted to increase the signal-to-noise ratio, as explained in Sect. 3.4. The Arizona dust lidar PDR, retrieved from , is higher than that of Asian dust.
Table 1Laboratory measurement of the PDR of Arizona and Asian dust at 355 and 532 nm wavelengths, for the finer and coarser SD. The PDR is calculated with Eq. (7) after the derivation of using the laboratory π-polarimeter presented in Sect. 3.2. The uncertainty on is deduced from the evaluation of , itself deduced from the least-square fit adjustment of Iλ. The uncertainty on is mostly dominated by statistical uncertainties, since our biases are minimized, as explained in Sect. 3.5. Bold values are used to emphasize the presented result.
4.2 Laboratory evaluation of the lidar PDRs of silica and hematite
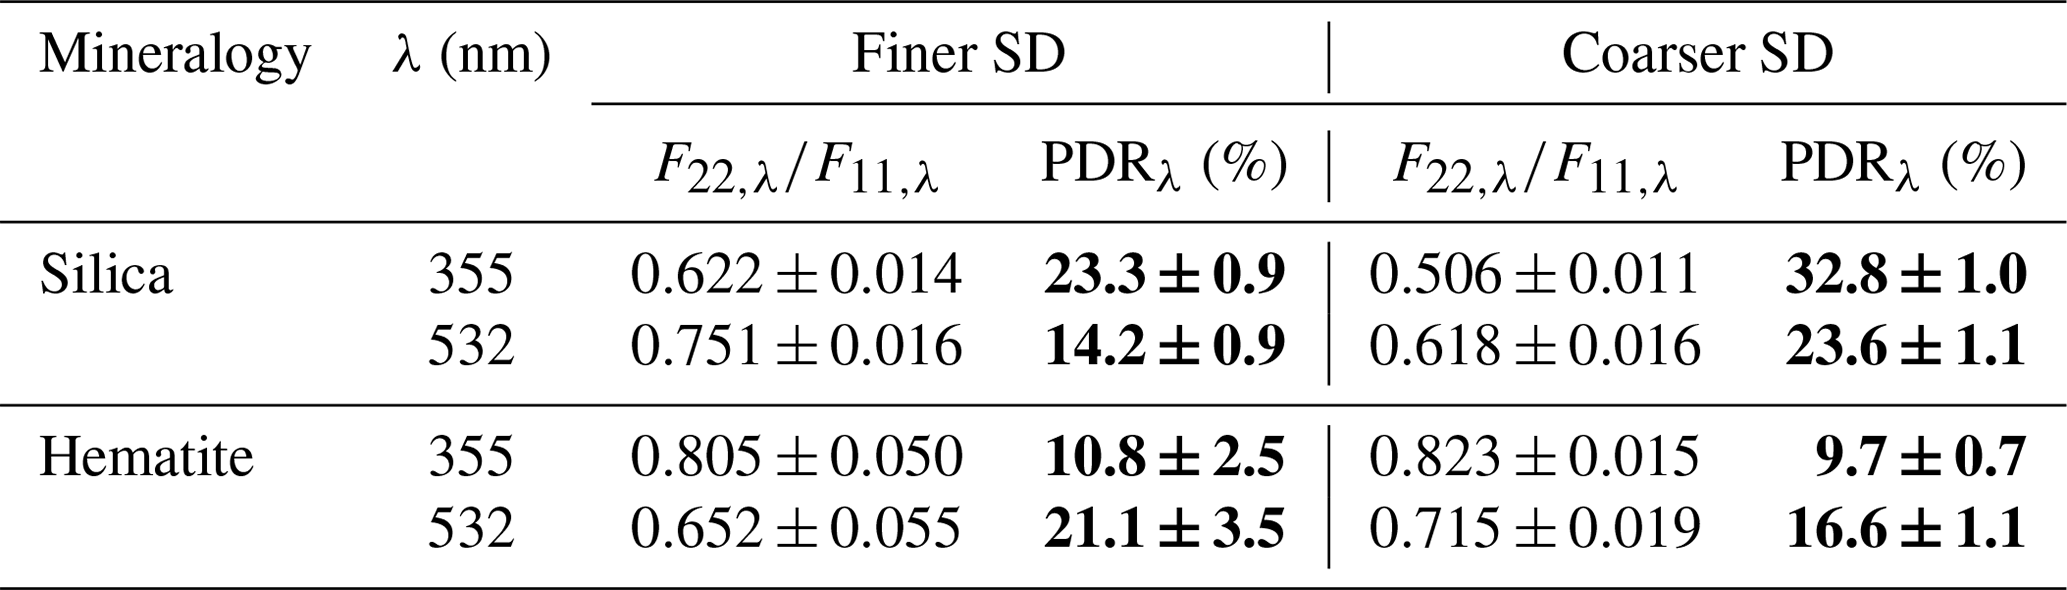
By applying the same methodology, we obtain the PDRs of silica and hematite, as presented in Fig. 5 and Table 2. Accordingly, Fig. 5 is the analog of Fig. 4 for silica (Fig. 5a) and hematite (Fig. 5b). As for Arizona and Asian dust samples, the lidar PDR of silica and hematite primarily depends on the particle CRI, at least at 355 nm wavelength where the silica lidar PDR ranges from 23 % to 33 % depending on the considered SD, while the hematite lidar PDR reaches 10 % only. The silica lidar PDR also strongly depends on the particle diameter: from the coarser to the finer SD, the silica dust lidar PDR reduces by 10 % at both wavelengths. The dependence of the hematite dust lidar PDR with the SD is less pronounced, especially at 355 nm wavelength. The silica and hematite lidar PDRs also strongly depend on the chosen lidar wavelength, with higher depolarization observed at 355 nm wavelength for silica and at 532 nm wavelength for hematite.
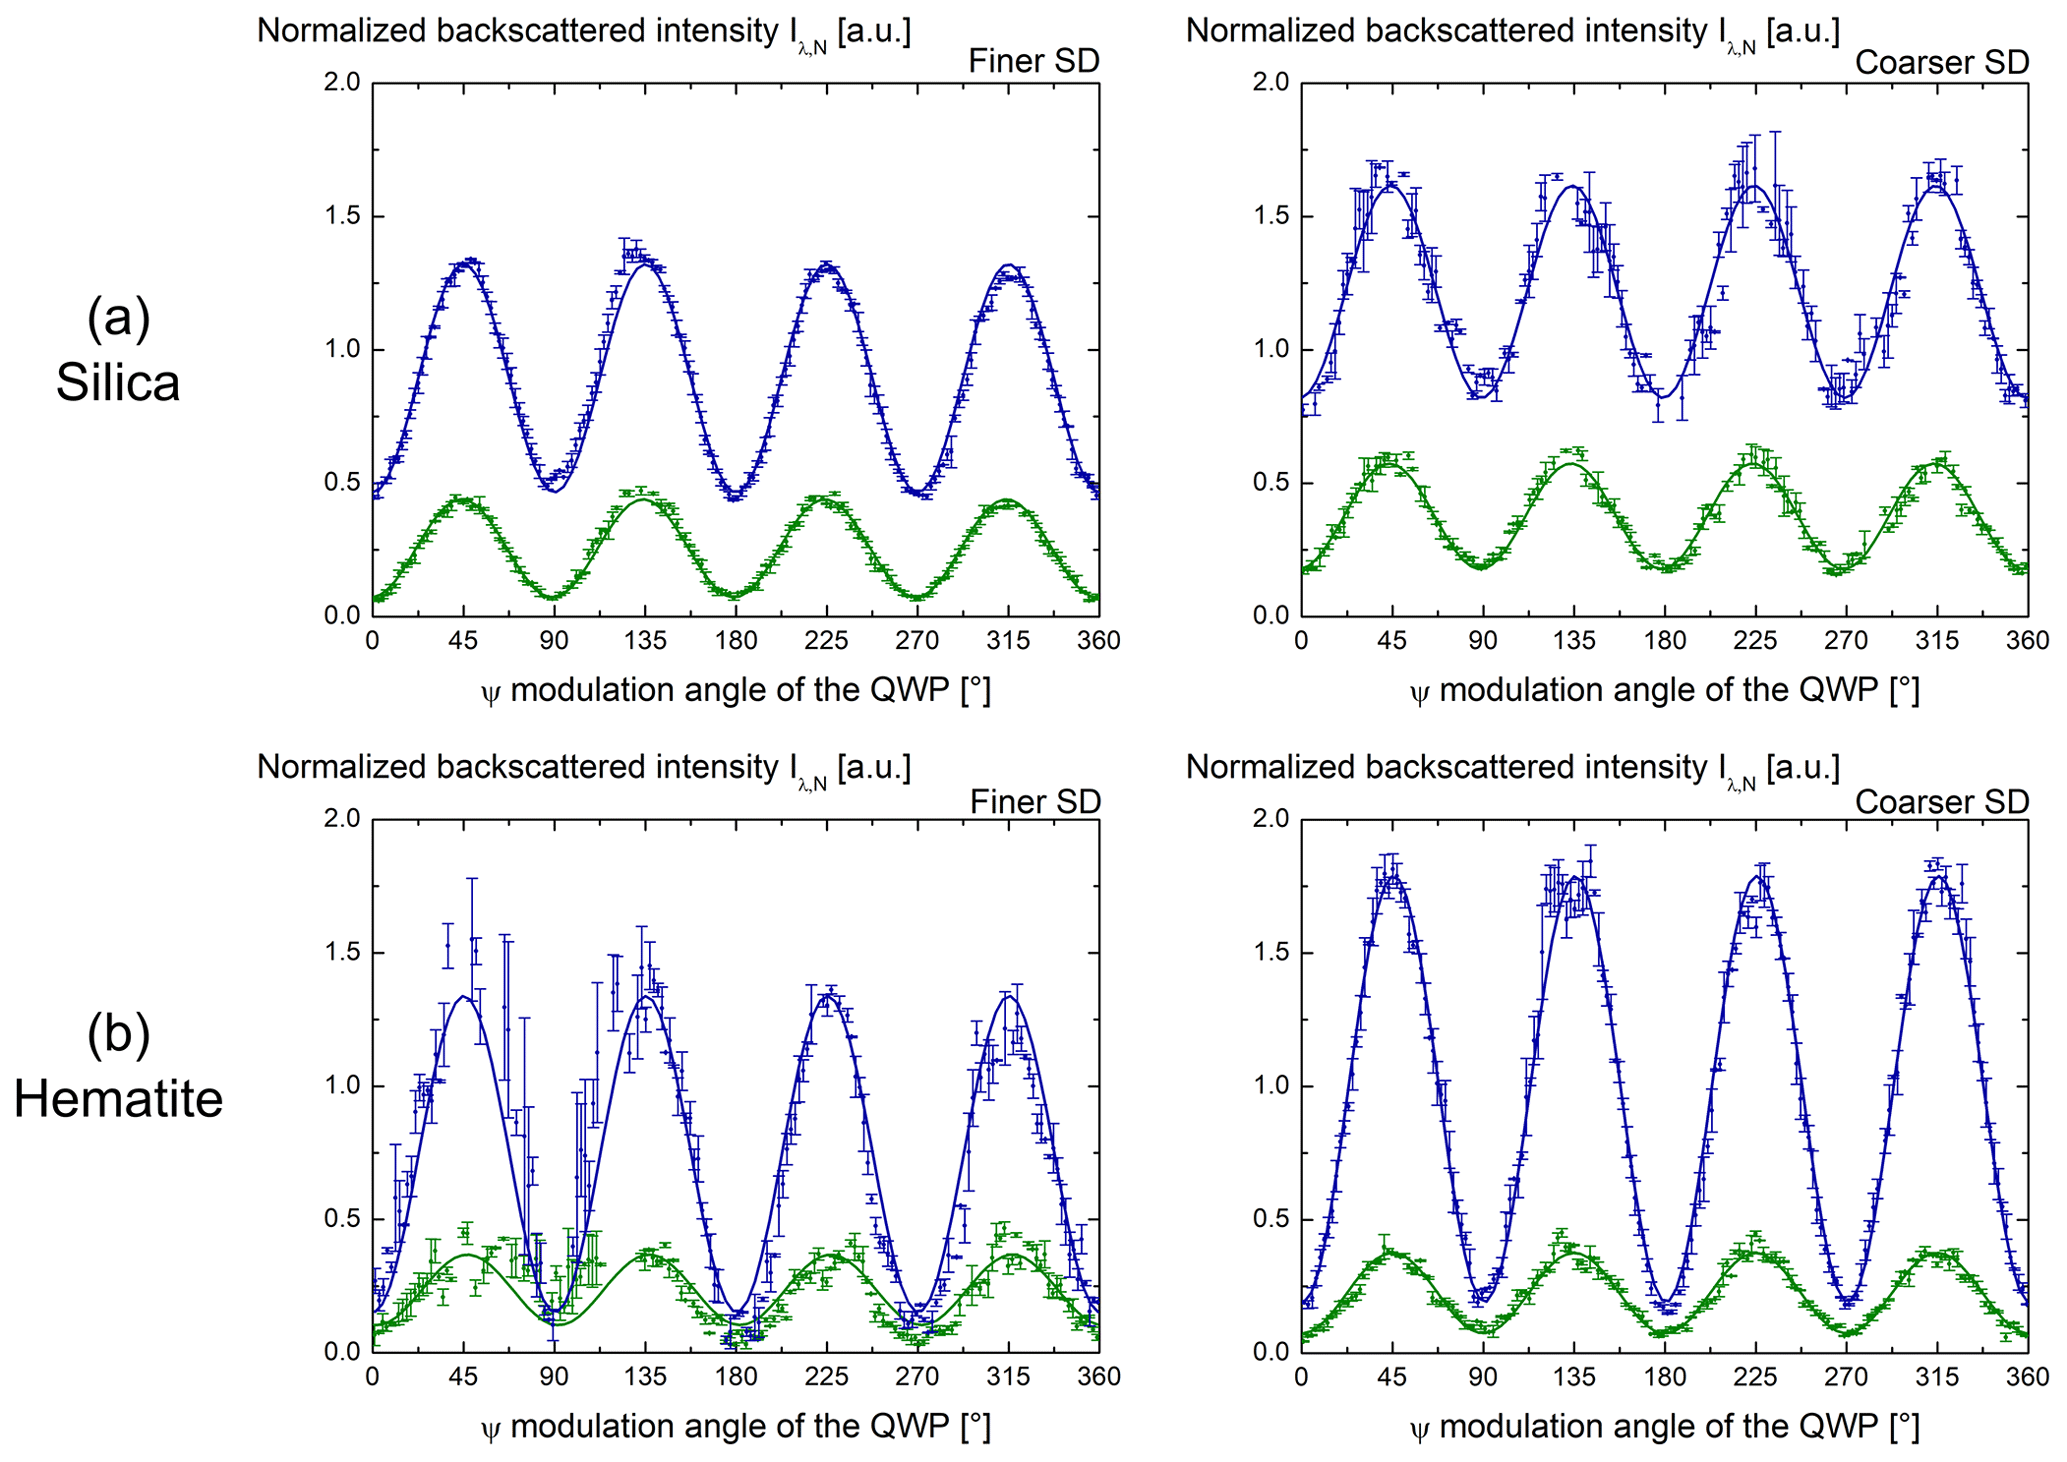
Table 2The same as Table 1 for silica and hematite. Bold values are used to emphasize the presented result.
4.3 Discussion
Comparing our laboratory findings with other laboratory experiments is not straightforward, since as explained in the introduction, none operate at the 180.0∘ lidar exact backscattering angle, while the dust lidar PDR differs from near to exact backscattering angles, especially when light absorbents are present (Cholleton et al., 2022). Moreover, the PDR is wavelength-dependent, and the size distributions (SDs) used are different from other studies. Lidar field experiments provide accurate values of the lidar PDR after an accurate calibration procedure based on the scattering matrix (Freudenthaler, 2016; Belegante et al., 2018; Miffre et al., 2019). Although in such lidar field experiments, the measured PDR is usually that of dust mixtures (Miffre et al., 2011), the comparison with our laboratory findings remains interesting. In lidar retrievals (see for example Tesche et al., 2009), a dust lidar PDR of 30 % is often used. The laboratory π-polarimeter verifies this statement by providing the silica PDR, which is the main oxide present in mineral dust, equal to (33±1) % for the coarser SD at 355 nm. In comparison, within our experimental error bars, the hematite lidar PDR, equal to (10±1) %, is clearly lower. The real part n and the imaginary part κ of the hematite CRI, which are large compared with that of other chemical oxides present in mineral dust (see Sect. 2.1), can be responsible for the observed difference in the silica and hematite lidar PDR. Indeed, parts n and κ modify the backscattering matrix elements, so does the corresponding dust lidar PDR. To highlight the role of κ on the hematite lidar PDR, the lidar PDR of rutile was measured with our π-polarimeter. Indeed, the real part of the rutile CRI is as large as that of hematite, but its imaginary part is negligible compared with that of hematite. As a result, the rutile lidar PDR substantially differed from that of hematite, showing the key role played by light absorption in the measured hematite lidar PDR. In turn, Arizona dust exhibits a higher PDR than Asian dust, due to the higher proportion in hematite in the latter. Hence and as a conclusion, our laboratory findings show that when the light-absorbent hematite is present, it mainly governs the dust lidar PDR, which hence primarily depends on the particle mineralogy, with less pronounced variations with the particle size and wavelength. This finding is in line with (Kahnert, 2015; Kahnert et al., 2020) numerical findings, which highlighted that the dust PDR is strongly modulated by the particle inhomogeneity, especially in the lidar backward scattering direction and in the presence of hematite. We here quantify this effect with a laboratory experiment that accounts for the real shape of mineral dust. The shape dependence of the hematite PDR is weak due to its large imaginary part of complex refractive index: following Wiscombe and Mugnai (1986) or Mishchenko et al. (1997), the effect of particle shape becomes weaker with an increasing imaginary part of the refractive index, a conclusion also drawn by Meland et al. (2011). In contrast, when the proportion of hematite becomes negligible, as is the case for silica and Arizona dust, our laboratory findings show that the dust lidar PDR then increases with increasing the particle size, though the shape dependence may then also play a role. Also, it would be interesting to investigate giant dust particles (Ryder et al., 2019). Likewise, in the literature (Sakai et al., 2010; Hofer et al., 2020; Järvinen et al., 2016; Mamouri and Ansmann, 2017), the dust lidar PDR is usually found to increase with the particle size from the fine to the coarse mode of the SD. The (355, 532) nm wavelength dependence of the dust lidar PDR then becomes key for discussing the involved particle sizes, thus underlying the importance of dual-wavelength (or more) polarization lidar instruments. We here establish this result in the laboratory at 180.0∘ and (355, 532) nm wavelengths, and moreover, show that this consideration holds only when hematite, which is a strong light absorbent, is not involved: the hematite lidar PDR is indeed higher in the finer mode of the SD.
To go further and discuss the role of light absorption in the retrieved dust lidar PDR, we here propose a basic partitioning model in which the dust particle mixture is comprised of two components: an absorbing component (Abs), mainly corresponding to hematite particles, and a non-absorbing component , mainly corresponding to silica particles. For simplicity, we here resume the absorbing (resp. non-absorbing) component to hematite (resp. silica) particles with respective abbreviations Hmt and Sil. We focus on the 355 nm wavelength at which hematite is an efficient light absorber and on the coarser SD, as the dependence of the dust lidar PDR with size is less pronounced than with the particle mineralogy. In Appendix A the derivation of the lidar PDR of such a dust–particle mixture (hereafter noted δd, as in lidar applications) is detailed. This Appendix is an extension of our previous works (Miffre et al., 2011; David et al., 2013, 2014; Mehri et al., 2018) for the case study where both components {Hmt,Sil} are nonspherical. The lidar PDR of such a dust–particle mixture relates to that of its pure components (hereafter noted δSil and δHmt) as follows:
where the expressions of the c, d, e and f coefficients are provided in Appendix A and independently on the depolarization ratios δSil and δHmt of silica and iron oxides. XHmt is the fraction of Hmt to dust particle backscattering. Following Eq. (8) and Appendix A, Fig. 6 displays the variation of δd as a function of XHmt when considering δSil=33 % and δHmt=10 %, as obtained in our laboratory findings at 355 nm wavelength with the coarser SD. As shown in Fig. 6, the dust lidar PDR lies in between δSil and δHmt and equals δSil (resp. δHmt) only when XHmt=0 (resp. 1), depending on the fraction XHmt of light corresponding to the absorbent of the dust particle mixture. Hence, Arizona dust, which contains a lower fraction of hematite, exhibits a higher lidar PDR compared with Asian dust, at least at 355 nm wavelength where hematite is strongly absorbing. Though rather simple, our model interestingly highlights the key role played by light absorption in the retrieved Asian dust lidar PDR. To go further and provide a quantitative analysis, this simple model should be refined by also considering the other chemical oxides present in mineral dust and other lidar wavelengths, as well as other SDs and the effect of shape. To handle such a complex issue, more laboratory experiments are required on other chemical oxides, ideally also at 1064 nm wavelength. This work is however beyond the scope of this paper. Still as is, our model provides an interpretation of the laboratory-observed differences in the dust lidar PDR when the light-absorbent hematite is involved. In the most general case, the dust lidar PDR hence appears as a complex function of the particle mineralogy, SD wavelength and shape. Comparison with lidar field experiments, involving particle mixtures, with a more complex distribution of sizes and refractive indices, is then not straightforward, as underscored by comparison with Hu et al. (2020) who reported 0.28–0.32 ± 0.07 at 355 nm wavelength. Though this complex dependence is difficult to disentangle, our laboratory findings show that the dust lidar PDR is primarily affected by the particle mineralogy, at least when hematite is involved.
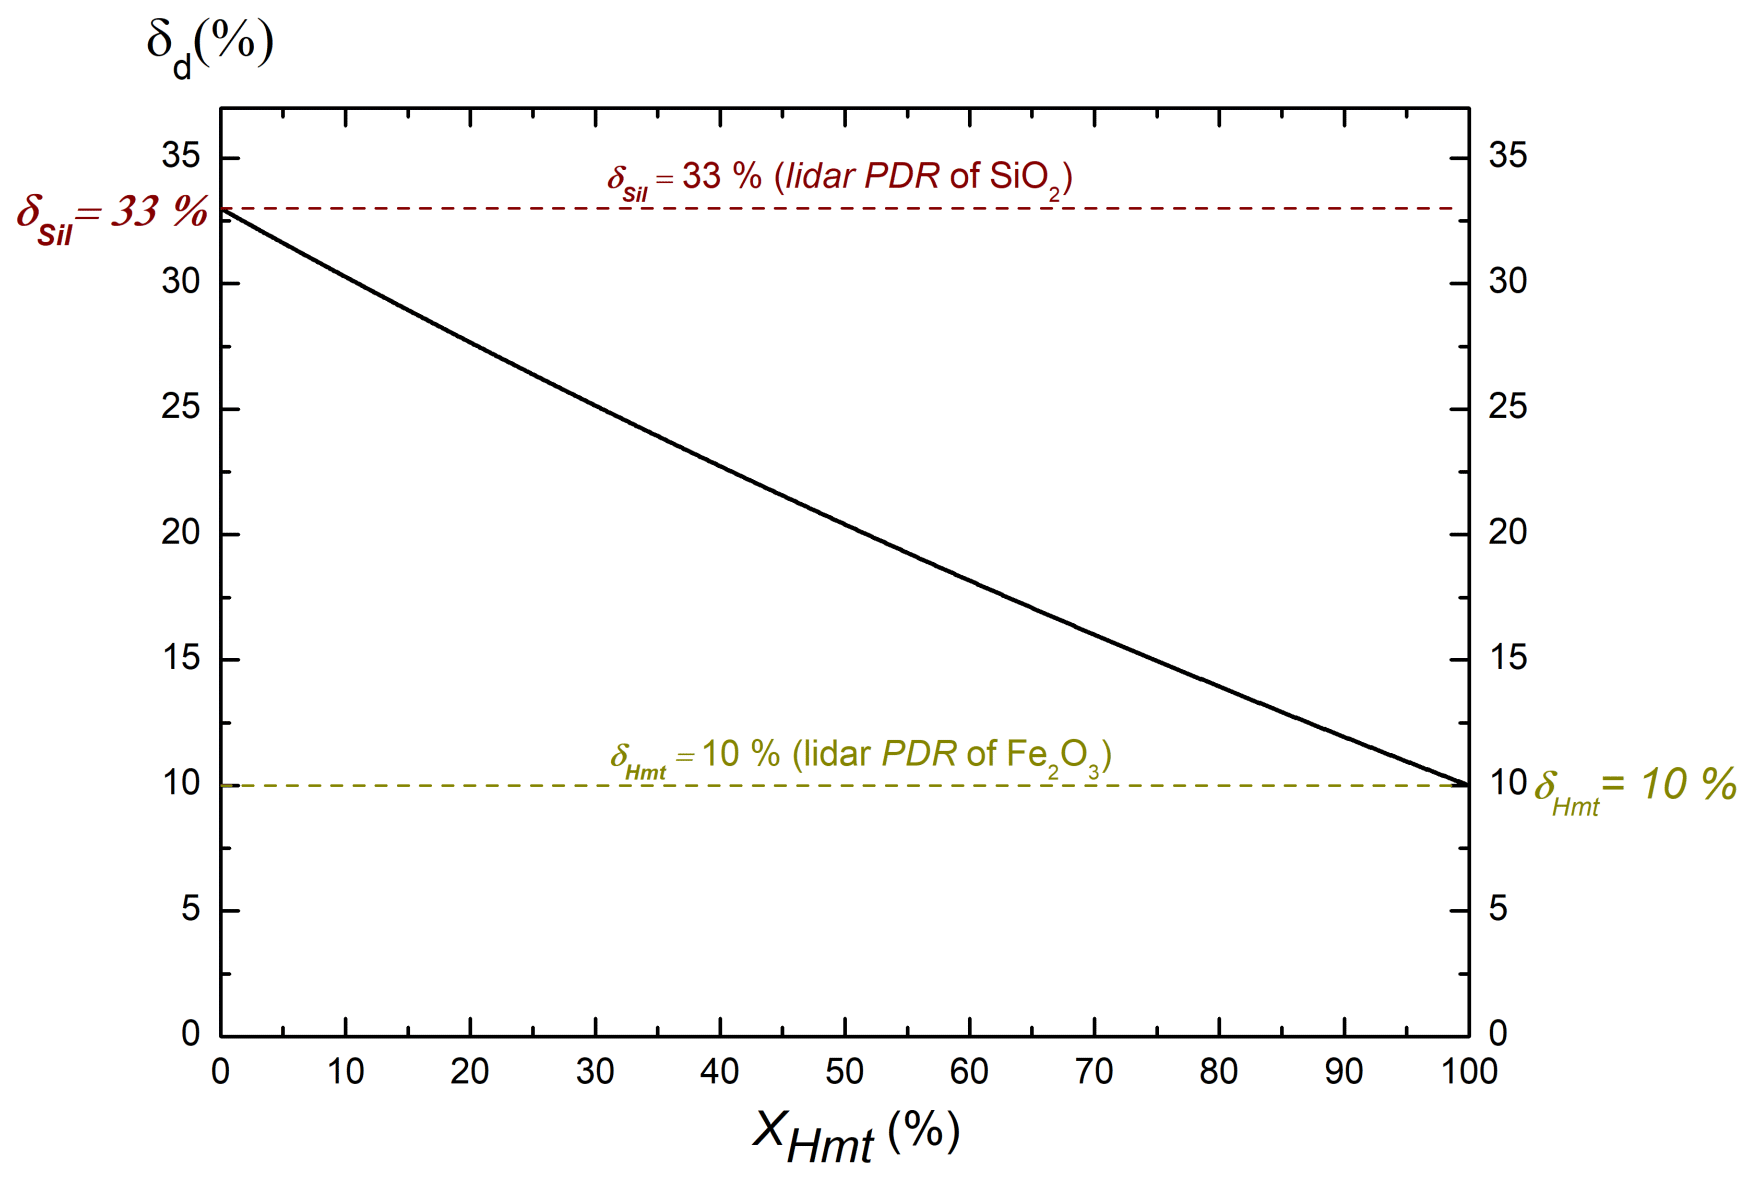
Figure 6Numerical simulation of the 355 nm lidar PDR of a two-component particle mixture , composed of hematite (Hmt) and silica (Sil) oxides as a function of the fraction of Hmt to d particle backscattering, following Eq. (8) and Appendix A, by accounting for our laboratory experimental findings for δSil=33 % and δHmt=10 % (see Table 2 at 355 nm wavelength with coarser SD).
In this paper, the dependence of the lidar particles' depolarization ratio (PDR) of pure mineral dust with complex refractive index (CRI) and size is for the first time investigated through a laboratory π-polarimeter operating at the 180.0∘ lidar backscattering angle and (355, 532) nm wavelengths for lidar purposes. The goal of this work is to improve the knowledge on the dust lidar PDR, which is an important input parameter involved in lidar partitioning algorithms, which are widely applied to reveal the contribution of mineral dust in particle external mixtures (Tesche et al., 2009; Mehri et al., 2018). While mineral dust exhibits a complex and highly irregular shape, which is difficult to model mathematically and numerically, our laboratory approach allows accounting for the real shape of mineral dust. Our laboratory π-polarimeter is likewise a good complement to lidar field experiments, which provide accurate retrievals of the lidar PDR of particle mixtures involving mineral dust. Another advantage of our laboratory π-polarimeter lies in its ability to provide accurate retrievals of the lidar PDR of pure mineral dust samples, differing in CRI and size. The π-polarimeter indeed operates at the 180.0∘ lidar backscattering angle and at (355, 532) nm lidar wavelengths: no assumption is made to retrieve the dust lidar PDR. This is a key novelty of our study. Indeed, the variation of the dust lidar PDR with scattering angle and wavelength cannot be analytically calculated (Bohren and Huffman, 1983; Mishchenko et al., 2002) for complex-shaped particles such as mineral dust. Hence, our π-polarimeter improves the knowledge on the dust PDR, provided in the literature at a non-180.0∘ backscattering angle and/or at wavelengths differing from (355, 532 nm). Our work provides 16 accurate dust lidar PDR values, corresponding to four different complex refractive indices, studied at two size distributions (fine, coarse) and at (355, 532) nm wavelengths (see Sect. 4). The precision on the retrieved dust PDR from the laboratory π-polarimeter is detailed in Sect. 3. To investigate the dependence of the dust lidar PDR with CRI, hematite, the main light absorbent present in mineral dust, was considered in addition to silica oxide, the main chemical oxide present in mineral dust, which is practically nonabsorbent. At 355 nm, our laboratory π-polarimeter provides values of the PDR of coarser silica of (33±1) %, while that of coarser hematite is only (10±1) %. In Sect. 4, this large difference is explained by accounting for the high imaginary part of the hematite CRI. In turn, Arizona dust exhibits a higher depolarization ratio than Asian dust, due to the higher proportion in hematite in the latter. As a result, when the strong light-absorbent hematite is involved, the dust lidar PDR is primarily governed by the particle mineralogy, and the variations of the dust lidar PDR with size are less pronounced. The dependence of the dust lidar PDR on the particle shape is not pronounced in our experiment where hematite, which exhibits a large imaginary part of complex refractive index, plays a key role (Wiscombe and Mugnai, 1986; Mishchenko et al., 1997; Meland et al., 2011). When hematite is less or not involved, the dust lidar PDR increases with increasing sizes and the (355, 532) nm wavelength dependence of the dust lidar PDR then becomes key for discussing the involved particle sizes, thus underscoring the importance of dual-wavelength (or more) polarization lidar instruments. To further disentangle the complex dependence of the dust lidar PDR with complex refractive index and size, our methodology should be extended to other chemical oxides, other natural mineral dust samples, other SDs and other wavelengths, as well as other shape distributions. Giant dust particles, whose importance has been highlighted by Ryder et al. (2019), would likewise be interesting to study specifically. This is however far beyond the scope of this paper: we here focused on (355, 532) nm wavelengths, since mineral dust slightly absorb light in the near infrared (Di Biagio et al., 2019). Still, the above laboratory findings underscore the importance of accounting for the wavelength dependence of the dust lidar PDR, whatever the hematite proportion. The spectral dependence of the dust lidar PDR is indeed instructive (Burton et al., 2016; Haarig et al., 2022; Miffre et al., 2020). Outlooks of this work are obviously also interesting, as underscored by recent papers (Kahnert et al., 2020; Luo et al., 2022), discussing the ability of the spheroidal model to mimic light scattering by complex-shaped mineral dust.
The goal of this Appendix is to establish the expression of the lidar PDR of a two-component particle mixture (p)={ns1ns2} composed of two non-spherical components ns1 and ns2. As in lidar applications, the lidar PDRs of p, ns1 and ns2 particles are respectively noted δp, and . The starting point is given by the set of four equations:
where and are the lidar particle backscattering coefficients, evaluated from a polarization lidar experiment carried out at wavelength λ (here omitted to ease the reading). The backscattering coefficient of ns1 particles is then retrieved by noting that (Miffre et al., 2011; David et al., 2013). Moreover, can be expressed as a function of and , since using Eqs. (A1a)–(A1d). Hence, . By applying the same methodology to ns2 particles, we finally get
where the c, d, e and f coefficients only depend on the depolarization ratios and :
The 2×2 matrix introduced in Eq. (A2) can be inverted to get the expression of and , and hence . By introducing the fraction of ns2 to p particle backscattering, we finally get the relationship between δp and and :
In the specific case where ns2 particles are spherical (i.e., , the expressions of the c, d, e and f coefficients simplify and the relationship between δp and becomes identical to that we already published in Miffre et al. (2011) and David et al. (2013). This new material is hence an extension of our previous works (Miffre et al., 2011; David et al., 2013, 2014; Mehri et al., 2018) to the case study where both components of the particle mixture are nonspherical.
Code and data are available upon request by contacting the authors.
AM designed the idea, DC and AM developed the instrument, and DC and AM performed the measurement and data analysis. DC and AM wrote the paper. DC, CN, PR and AM contributed to the final paper. PR and AM supervised the project.
The contact author has declared that none of the authors has any competing interests.
Publisher’s note: Copernicus Publications remains neutral with regard to jurisdictional claims in published maps and institutional affiliations.
The French National Centre for Space Studies (CNES) is acknowledged for financial support.
This research has been supported by the French National Centre for Space Studies (CNES).
This paper was edited by Vassilis Amiridis and reviewed by two anonymous referees.
Belegante, L., Bravo-Aranda, J. A., Freudenthaler, V., Nicolae, D., Nemuc, A., Ene, D., Alados-Arboledas, L., Amodeo, A., Pappalardo, G., D'Amico, G., Amato, F., Engelmann, R., Baars, H., Wandinger, U., Papayannis, A., Kokkalis, P., and Pereira, S. N.: Experimental techniques for the calibration of lidar depolarization channels in EARLINET, Atmos. Meas. Tech., 11, 1119–1141, https://doi.org/10.5194/amt-11-1119-2018, 2018.
Bohren, C. F. and Huffman, D. R.: Absorption and scattering of light by small particles, Wiley-VCH, Weinheim, 530 pp., ISBN 9783527618163, 1983.
Bristow, C. S., Hudson-Edwards, K. A., and Chappell, A.: Fertilizing the Amazon and equatorial Atlantic with West African dust, Geophys. Res. Lett., 37, L14807, https://doi.org/10.1029/2010GL043486, 2010.
Bullard, J. E. and White, K.: Quantifying iron oxide coatings on dune sands using spectrometric measurements: An example from the Simpson-Strzelecki Desert, Australia, J. Geophys. Res.-Sol. Ea., 107, ECV 5-1–ECV 5-11, https://doi.org/10.1029/2001JB000454, 2002.
Burton, S. P., Ferrare, R. A., Hostetler, C. A., Hair, J. W., Rogers, R. R., Obland, M. D., Butler, C. F., Cook, A. L., Harper, D. B., and Froyd, K. D.: Aerosol classification using airborne High Spectral Resolution Lidar measurements – methodology and examples, Atmos. Meas. Tech., 5, 73–98, https://doi.org/10.5194/amt-5-73-2012, 2012.
Burton, S. P., Chemyakin, E., Liu, X., Knobelspiesse, K., Stamnes, S., Sawamura, P., Moore, R. H., Hostetler, C. A., and Ferrare, R. A.: Information content and sensitivity of the 3β + 2α lidar measurement system for aerosol microphysical retrievals, Atmos. Meas. Tech., 9, 5555–5574, https://doi.org/10.5194/amt-9-5555-2016, 2016.
Caponi, L., Formenti, P., Massabó, D., Di Biagio, C., Cazaunau, M., Pangui, E., Chevaillier, S., Landrot, G., Andreae, M. O., Kandler, K., Piketh, S., Saeed, T., Seibert, D., Williams, E., Balkanski, Y., Prati, P., and Doussin, J.-F.: Spectral- and size-resolved mass absorption efficiency of mineral dust aerosols in the shortwave spectrum: a simulation chamber study, Atmos. Chem. Phys., 17, 7175–7191, https://doi.org/10.5194/acp-17-7175-2017, 2017.
Cholleton, D., Rairoux, P., and Miffre, A.: Laboratory Evaluation of the (355, 532) nm Particle Depolarization Ratio of Pure Pollen at 180.0∘ Lidar Backscattering Angle, Remote Sens., 14, 3767, https://doi.org/10.3390/rs14153767, 2022.
David, G., Miffre, A., Thomas, B., and Rairoux, P.: Sensitive and accurate dual-wavelength UV-VIS polarization detector for optical remote sensing of tropospheric aerosols, Appl. Phys. B, 108, 197–216, https://doi.org/10.1007/s00340-012-5066-x, 2012.
David, G., Thomas, B., Nousiainen, T., Miffre, A., and Rairoux, P.: Retrieving simulated volcanic, desert dust and sea-salt particle properties from two/three-component particle mixtures using UV-VIS polarization lidar and T matrix, Atmos. Chem. Phys., 13, 6757–6776, https://doi.org/10.5194/acp-13-6757-2013, 2013.
David, G., Thomas, B., Dupart, Y., D'Anna, B., George, C., Miffre, A., and Rairoux, P.: UV polarization lidar for remote sensing new particles formation in the atmosphere, Opt. Express, 22, A1009, https://doi.org/10.1364/OE.22.0A1009, 2014.
Di Biagio, C., Formenti, P., Balkanski, Y., Caponi, L., Cazaunau, M., Pangui, E., Journet, E., Nowak, S., Andreae, M. O., Kandler, K., Saeed, T., Piketh, S., Seibert, D., Williams, E., and Doussin, J.-F.: Complex refractive indices and single-scattering albedo of global dust aerosols in the shortwave spectrum and relationship to size and iron content, Atmos. Chem. Phys., 19, 15503–15531, https://doi.org/10.5194/acp-19-15503-2019, 2019.
Dupart, Y., King, S. M., Nekat, B., Nowak, A., Wiedensohler, A., Herrmann, H., David, G., Thomas, B., Miffre, A., Rairoux, P., D'Anna, B., and George, C.: Mineral dust photochemistry induces nucleation events in the presence of SO2, P. Natl. Acad. Sci. USA, 109, 20842–20847, https://doi.org/10.1073/pnas.1212297109, 2012.
Formenti, P., Caquineau, S., Chevaillier, S., Klaver, A., Desboeufs, K., Rajot, J. L., Belin, S., and Briois, V.: Dominance of goethite over hematite in iron oxides of mineral dust from Western Africa: Quantitative partitioning by X-ray absorption spectroscopy, J. Geophys. Res.-Atmos., 119, 12740–12754, https://doi.org/10.1002/2014JD021668, 2014.
Francis, D., Nelli, N., Fonseca, R., Weston, M., Flamant, C., and Cherif, C.: The dust load and radiative impact associated with the June 2020 historical Saharan dust storm, Atmos. Environ., 268, 118808, https://doi.org/10.1016/j.atmosenv.2021.118808, 2022.
Freudenthaler, V.: About the effects of polarising optics on lidar signals and the Δ90 calibration, Atmos. Meas. Tech., 9, 4181–4255, https://doi.org/10.5194/amt-9-4181-2016, 2016.
Freudenthaler, V., Esselborn, M., Wiegner, M., Heese, B., Tesche, M., Ansmann, A., MüLLER, D., Althausen, D., Wirth, M., Fix, A., Ehret, G., Knippertz, P., Toledano, C., Gasteiger, J., Garhammer, M., and Seefeldner, M.: Depolarization ratio profiling at several wavelengths in pure Saharan dust during SAMUM 2006, Tellus B, 61, 165–179, https://doi.org/10.1111/j.1600-0889.2008.00396.x, 2009.
Gasteiger, J., Wiegner, M., GROß, S., Freudenthaler, V., Toledano, C., Tesche, M., and Kandler, K.: Modelling lidar-relevant optical properties of complex mineral dust aerosols, Tellus B, 63, 725–741, https://doi.org/10.1111/j.1600-0889.2011.00559.x, 2011.
Gautam, P., Maughan, J. B., Ilavsky, J., and Sorensen, C. M.: Light scattering study of highly absorptive, non-fractal, hematite aggregates, J. Quant. Spectrosc. Ra., 246, 106919, https://doi.org/10.1016/j.jqsrt.2020.106919, 2020.
Glen, A. and Brooks, S. D.: A new method for measuring optical scattering properties of atmospherically relevant dusts using the Cloud and Aerosol Spectrometer with Polarization (CASPOL), Atmos. Chem. Phys., 13, 1345–1356, https://doi.org/10.5194/acp-13-1345-2013, 2013.
Go, S., Lyapustin, A., Schuster, G. L., Choi, M., Ginoux, P., Chin, M., Kalashnikova, O., Dubovik, O., Kim, J., da Silva, A., Holben, B., and Reid, J. S.: Inferring iron-oxide species content in atmospheric mineral dust from DSCOVR EPIC observations, Atmos. Chem. Phys., 22, 1395–1423, https://doi.org/10.5194/acp-22-1395-2022, 2022.
Gómez Martín, J. C., Guirado, D., Frattin, E., Bermudez-Edo, M., Cariñanos Gonzalez, P., Olmo Reyes, F. J., Nousiainen, T., Gutiérrez, P. J., Moreno, F., and Muñoz, O.: On the application of scattering matrix measurements to detection and identification of major types of airborne aerosol particles: Volcanic ash, desert dust and pollen, J. Quant. Spectrosc. Ra., 271, 107761, https://doi.org/10.1016/j.jqsrt.2021.107761, 2021.
Haarig, M., Ansmann, A., Engelmann, R., Baars, H., Toledano, C., Torres, B., Althausen, D., Radenz, M., and Wandinger, U.: First triple-wavelength lidar observations of depolarization and extinction-to-backscatter ratios of Saharan dust, Atmos. Chem. Phys., 22, 355–369, https://doi.org/10.5194/acp-22-355-2022, 2022.
Hofer, J., Ansmann, A., Althausen, D., Engelmann, R., Baars, H., Fomba, K. W., Wandinger, U., Abdullaev, S. F., and Makhmudov, A. N.: Optical properties of Central Asian aerosol relevant for spaceborne lidar applications and aerosol typing at 355 and 532 nm, Atmos. Chem. Phys., 20, 9265–9280, https://doi.org/10.5194/acp-20-9265-2020, 2020.
Hu, Q., Wang, H., Goloub, P., Li, Z., Veselovskii, I., Podvin, T., Li, K., and Korenskiy, M.: The characterization of Taklamakan dust properties using a multiwavelength Raman polarization lidar in Kashi, China, Atmos. Chem. Phys., 20, 13817–13834, https://doi.org/10.5194/acp-20-13817-2020, 2020.
Huang, Y., Kok, J. F., Saito, M., and Muñoz, O.: Single-scattering properties of ellipsoidal dust aerosols constrained by measured dust shape distributions, Atmos. Chem. Phys. Discuss. [preprint], https://doi.org/10.5194/acp-2022-633, in review, 2022.
IPCC: Climate Change 2021: The Physical Science Basis. Contribution of Working Group I to the Sixth Assessment Report of the Intergovernmental Panel on Climate Change, edited by: Masson-Delmotte, V., Zhai, P., Pirani, A., Connors, S. L., Péan, C., Berger, S., Caud, N., Chen, Y., Goldfarb, L., Gomis, M. I., Huang, M., Leitzell, K., Lonnoy, E., Matthews, J. B. R., Maycock, T. K., Waterfield, T., Yelekçi, O., Yu, R., and Zhou, B., Cambridge University Press, Cambridge, United Kingdom and New York, NY, USA, 2391 pp., 2021.
Iwai, T.: Polarization Analysis of Light Scattered by Pollen Grains of Cryptomeria japonica, Jpn. J. Appl. Phys., 52, 062404, https://doi.org/10.7567/JJAP.52.062404, 2013.
Järvinen, E., Kemppinen, O., Nousiainen, T., Kociok, T., Möhler, O., Leisner, T., and Schnaiter, M.: Laboratory investigations of mineral dust near-backscattering depolarization ratios, J. Quant. Spectrosc. Ra., 178, 192–208, https://doi.org/10.1016/j.jqsrt.2016.02.003, 2016.
Kahnert, M.: Modelling radiometric properties of inhomogeneous mineral dust particles: Applicability and limitations of effective medium theories, J. Quant. Spectrosc. Ra., 152, 16–27, https://doi.org/10.1016/j.jqsrt.2014.10.025, 2015.
Kahnert, M., Kanngießer, F., Järvinen, E., and Schnaiter, M.: Aerosol-optics model for the backscatter depolarisation ratio of mineral dust particles, J. Quant. Spectrosc. Ra., 254, 107177, https://doi.org/10.1016/j.jqsrt.2020.107177, 2020.
Kandler, K., Lieke, K., Benker, N., Emmel, C., Küpper, M., Müller-Ebert, D., Ebert, M., Scheuvens, D., Schladitz, A., Schütz, L., and Weinbruch, S.: Electron microscopy of particles collected at Praia, Cape Verde, during the Saharan Mineral Dust Experiment: particle chemistry, shape, mixing state and complex refractive index, Tellus B, 63, 475–496, https://doi.org/10.1111/j.1600-0889.2011.00550.x, 2011.
Kosmopoulos, P. G., Kazadzis, S., Taylor, M., Athanasopoulou, E., Speyer, O., Raptis, P. I., Marinou, E., Proestakis, E., Solomos, S., Gerasopoulos, E., Amiridis, V., Bais, A., and Kontoes, C.: Dust impact on surface solar irradiance assessed with model simulations, satellite observations and ground-based measurements, Atmos. Meas. Tech., 10, 2435–2453, https://doi.org/10.5194/amt-10-2435-2017, 2017.
Lamb, K. D., Matsui, H., Katich, J. M., Perring, A. E., Spackman, J. R., Weinzierl, B., Dollner, M., and Schwarz, J. P.: Global-scale constraints on light-absorbing anthropogenic iron oxide aerosols, Npj Clim. Atmospheric Sci., 4, 1–12, 2021.
Lindqvist, H., Jokinen, O., Kandler, K., Scheuvens, D., and Nousiainen, T.: Single scattering by realistic, inhomogeneous mineral dust particles with stereogrammetric shapes, Atmos. Chem. Phys., 14, 143–157, https://doi.org/10.5194/acp-14-143-2014, 2014.
Liu, J., Zhang, Q., Huo, Y., Wang, J., and Zhang, Y.: An experimental study on light scattering matrices for Chinese loess dust with different particle size distributions, Atmos. Meas. Tech., 13, 4097–4109, https://doi.org/10.5194/amt-13-4097-2020, 2020.
Longtin, D. R., Shettle, E. P., Hummel, J. R., and Pryce, J. D.: A wind dependent desert aerosol model: Radiative properties, OPTIMETRICS INC BURLINGTON MA, Report AD-A201 951, 39 pp., https://apps.dtic.mil/sti/citations/ADA201951 (last access: 13 January 2023), 1988.
Luo, J., Li, Z., Fan, C., Xu, H., Zhang, Y., Hou, W., Qie, L., Gu, H., Zhu, M., Li, Y., and Li, K.: The polarimetric characteristics of dust with irregular shapes: evaluation of the spheroid model for single particles, Atmos. Meas. Tech., 15, 2767–2789, https://doi.org/10.5194/amt-15-2767-2022, 2022.
Mamouri, R.-E. and Ansmann, A.: Potential of polarization/Raman lidar to separate fine dust, coarse dust, maritime, and anthropogenic aerosol profiles, Atmos. Meas. Tech., 10, 3403–3427, https://doi.org/10.5194/amt-10-3403-2017, 2017.
Mehri, T., Kemppinen, O., David, G., Lindqvist, H., Tyynelä, J., Nousiainen, T., Rairoux, P., and Miffre, A.: Investigating the size, shape and surface roughness dependence of polarization lidars with light-scattering computations on real mineral dust particles: Application to dust particles' external mixtures and dust mass concentration retrievals, Atmos. Res., 203, 44–61, https://doi.org/10.1016/j.atmosres.2017.11.027, 2018.
Meland, B., Kleiber, P. D., Grassian, V. H., and Young, M. A.: Visible light scattering study at 470, 550, and 660nm of components of mineral dust aerosol: Hematite and goethite, J. Quant. Spectrosc. Ra., 112, 1108–1118, https://doi.org/10.1016/j.jqsrt.2010.12.002, 2011.
Miffre, A., David, G., Thomas, B., and Rairoux, P.: Atmospheric non-spherical particles optical properties from UV-polarization lidar and scattering matrix, Geophys. Res. Lett., 38, L16804, https://doi.org/10.1029/2011GL048310, 2011.
Miffre, A., Mehri, T., Francis, M., and Rairoux, P.: UV–VIS depolarization from Arizona Test Dust particles at exact backscattering angle, J. Quant. Spectrosc. Ra., 169, 79–90, https://doi.org/10.1016/j.jqsrt.2015.09.016, 2016.
Miffre, A., Cholleton, D., Mehri, T., and Rairoux, P.: Remote Sensing Observation of New Particle Formation Events with a (UV, VIS) Polarization Lidar, Remote Sens., 11, 1761, https://doi.org/10.3390/rs11151761, 2019.
Miffre, A., Cholleton, D., and Rairoux, P.: On the use of light polarization to investigate the size, shape, and refractive index dependence of backscattering Ångström exponents, Opt. Lett., 45, 1084–1087, https://doi.org/10.1364/OL.385107, 2020.
Mishchenko, M. I. and Travis, L. D.: Capabilities and limitations of a current FORTRAN implementation of the T-matrix method for randomly oriented, rotationally symmetric scatterers, J. Quant. Spectrosc. Ra., 60, 309–324, https://doi.org/10.1016/S0022-4073(98)00008-9, 1998.
Mishchenko, M. I., Travis, L. D., Kahn, R. A., and West, R. A.: Modeling phase functions for dustlike tropospheric aerosols using a shape mixture of randomly oriented polydisperse spheroids, J. Geophys. Res.-Atmos., 102, 16831–16847, https://doi.org/10.1029/96JD02110, 1997.
Mishchenko, M. I., Travis, L. D., and Lacis, A. A.: Scattering, Absorption, and Emission of Light by Small Particles, Cambridge University Press, 492 pp., ISBN 9780521782524, 2002.
Mishchenko, M. I., Liu, L., and Videen, G.: Conditions of applicability of the single-scattering approximation, Opt. Express, 15, 7522, https://doi.org/10.1364/OE.15.007522, 2007.
Monge, M. E., Rosenørn, T., Favez, O., Müller, M., Adler, G., Abo Riziq, A., Rudich, Y., Herrmann, H., George, C., and D'Anna, B.: Alternative pathway for atmospheric particles growth, P. Natl. Acad. Sci. USA, 109, 6840–6844, https://doi.org/10.1073/pnas.1120593109, 2012.
Müller, D., Veselovskii, I., Kolgotin, A., Tesche, M., Ansmann, A., and Dubovik, O.: Vertical profiles of pure dust and mixed smoke–dust plumes inferred from inversion of multiwavelength Raman/polarization lidar data and comparison to AERONET retrievals and in situ observations, Appl. Optics, 52, 3178–3202, https://doi.org/10.1364/AO.52.003178, 2013.
Nousiainen, T.: Optical modeling of mineral dust particles: A review, J. Quant. Spectrosc. Ra., 110, 1261–1279, https://doi.org/10.1016/j.jqsrt.2009.03.002, 2009.
Ryder, C. L., Highwood, E. J., Rosenberg, P. D., Trembath, J., Brooke, J. K., Bart, M., Dean, A., Crosier, J., Dorsey, J., Brindley, H., Banks, J., Marsham, J. H., McQuaid, J. B., Sodemann, H., and Washington, R.: Optical properties of Saharan dust aerosol and contribution from the coarse mode as measured during the Fennec 2011 aircraft campaign, Atmos. Chem. Phys., 13, 303–325, https://doi.org/10.5194/acp-13-303-2013, 2013.
Ryder, C. L., Highwood, E. J., Walser, A., Seibert, P., Philipp, A., and Weinzierl, B.: Coarse and giant particles are ubiquitous in Saharan dust export regions and are radiatively significant over the Sahara, Atmos. Chem. Phys., 19, 15353–15376, https://doi.org/10.5194/acp-19-15353-2019, 2019.
Sakai, T., Nagai, T., Zaizen, Y., and Mano, Y.: Backscattering linear depolarization ratio measurements of mineral, sea-salt, and ammonium sulfate particles simulated in a laboratory chamber, Appl. Optics, 49, 4441–4449, https://doi.org/10.1364/AO.49.004441, 2010.
Scanza, R. A., Mahowald, N., Ghan, S., Zender, C. S., Kok, J. F., Liu, X., Zhang, Y., and Albani, S.: Modeling dust as component minerals in the Community Atmosphere Model: development of framework and impact on radiative forcing, Atmos. Chem. Phys., 15, 537–561, https://doi.org/10.5194/acp-15-537-2015, 2015.
Schnaiter, M., Büttner, S., Möhler, O., Skrotzki, J., Vragel, M., and Wagner, R.: Influence of particle size and shape on the backscattering linear depolarisation ratio of small ice crystals – cloud chamber measurements in the context of contrail and cirrus microphysics, Atmos. Chem. Phys., 12, 10465–10484, https://doi.org/10.5194/acp-12-10465-2012, 2012.
Shurcliff, W. A.: Polarized Light: Production and Use, Harvard University Press, Cambridge, MA and London, England, 181 pp., https://doi.org/10.4159/harvard.9780674424135, 1962.
Sugimoto, N. and Lee, C. H.: Characteristics of dust aerosols inferred from lidar depolarization measurements at two wavelengths, Appl. Optics, 45, 7468–7474, https://doi.org/10.1364/AO.45.007468, 2006.
Tesche, M., Ansmann, A., Müller, D., Althausen, D., Engelmann, R., Freudenthaler, V., and Groß, S.: Vertically resolved separation of dust and smoke over Cape Verde using multiwavelength Raman and polarization lidars during Saharan Mineral Dust Experiment 2008, J. Geophys. Res., 114, D13202, https://doi.org/10.1029/2009JD011862, 2009.
Tesche, M., Kolgotin, A., Haarig, M., Burton, S. P., Ferrare, R. A., Hostetler, C. A., and Müller, D.: : what is the most useful depolarization input for retrieving microphysical properties of non-spherical particles from lidar measurements using the spheroid model of Dubovik et al. (2006)?, Atmos. Meas. Tech., 12, 4421–4437, https://doi.org/10.5194/amt-12-4421-2019, 2019.
van de Hulst, H. C.: Light Scattering by Small Particles, Courier Corporation, 500 pp., 1957.
Weinzierl, B., Ansmann, A., Prospero, J. M., Althausen, D., Benker, N., Chouza, F., Dollner, M., Farrell, D., Fomba, W. K., Freudenthaler, V., Gasteiger, J., Groß, S., Haarig, M., Heinold, B., Kandler, K., Kristensen, T. B., Mayol-Bracero, O. L., Müller, T., Reitebuch, O., Sauer, D., Schäfler, A., Schepanski, K., Spanu, A., Tegen, I., Toledano, C., and Walser, A.: The Saharan Aerosol Long-Range Transport and Aerosol–Cloud-Interaction Experiment: Overview and Selected Highlights, B. Am. Meteorol. Soc., 98, 1427–1451, https://doi.org/10.1175/BAMS-D-15-00142.1, 2017.
Winker, D. M., Vaughan, M. A., Omar, A., Hu, Y., Powell, K. A., Liu, Z., Hunt, W. H., and Young, S. A.: Overview of the CALIPSO Mission and CALIOP Data Processing Algorithms, J. Atmospheric Ocean. Tech., 26, 2310–2323, https://doi.org/10.1175/2009JTECHA1281.1, 2009.
Wiscombe, W. J. and Mugnai, A.: Single scattering from nonspherical Chebyshev particles: a compendium of calculations, NASA Reference Publication (RP), no. NASA-RP-1157, 114 pp., https://ntrs.nasa.gov/citations/19860007670 (last access: 13 January 2023), 1986.
Zong, R., Weng, F., Bi, L., Lin, X., Rao, C., and Li, W.: Impact of hematite on dust absorption at wavelengths ranging from 0.2 to 1.0 µm: an evaluation of literature data using the T-matrix method, Opt. Express, 29, 17405–17427, https://doi.org/10.1364/OE.427611, 2021.
Zubko, E., Muinonen, K., Muñoz, O., Nousiainen, T., Shkuratov, Y., Sun, W., and Videen, G.: Light scattering by feldspar particles: Comparison of model agglomerate debris particles with laboratory samples, J. Quant. Spectrosc. Ra., 131, 175–187, https://doi.org/10.1016/j.jqsrt.2013.01.017, 2013.