the Creative Commons Attribution 4.0 License.
the Creative Commons Attribution 4.0 License.
 | 25 Sep 2023
Comparison of photoacoustic spectroscopy and cavity ring-down spectroscopy for ambient methane monitoring at Hohenpeißenberg
Stefan Weigl
Jennifer Müller-Williams
Matthias Lindauer
Thomas Rück
Simon Jobst
Rudolf Bierl
Frank-Michael Matysik
With an atmospheric concentration of approximately 2000 parts per billion (ppbV, 10−9), methane (CH4) is the second most abundant greenhouse gas (GHG) in the atmosphere after carbon dioxide (CO2). The task of long-term and spatially resolved GHG monitoring to verify whether climate policy actions are effective is becoming more crucial as climate change progresses. In this paper we report the CH4 concentration readings of our photoacoustic (PA) sensor over a 5 d period at Hohenpeißenberg, Germany. As a reference device, a calibrated cavity ring-down spectrometer, Picarro G2301, from the meteorological observatory of the German Weather Service (DWD) was employed. Trace gas measurements with photoacoustic instruments promise to provide low detection limits at comparably low costs. However, PA devices are often susceptible to cross-sensitivities related to fluctuating environmental conditions, e.g. ambient humidity. The obtained results show that for PA sensor systems non-radiative relaxation effects induced by varying humidity are a non-negligible factor. Applying algorithm compensation techniques, which are capable of calculating the influence of non-radiative relaxation effects on the photoacoustic signal, increase the accuracy of the photoacoustic sensor significantly. With an average relative deviation of 1.11 % from the G2301, the photoacoustic sensor shows good agreement with the reference instrument.
- Article
(2695 KB) - Full-text XML
- BibTeX
- EndNote


In the European network Integrated Carbon Observation System (ICOS), 16 different nations united to measure greenhouse gas (GHG) concentrations continuously in the atmosphere and in a standardized way. In order to ensure data comparability of the 46 atmosphere monitoring stations, the required accuracies of the devices were defined in the ICOS program. For CH4, this was specified to be less than ±2 ppbV, emphasizing the high standards set internationally for reliable atmospheric GHG monitoring (ICOS RI, 2020). For this purpose, a state-of-the-art cavity ring-down spectrometer (CRDS) G2301 (Picarro, Inc., USA) was selected by the ICOS program for both CH4 and CO2 quantification, which provides a 3σ precision for CH4 less than 1.5 ppbV and less than 210 ppbV for CO2 at an averaging time of 5 s. For leakage detection of gas pipelines or identification of various methane sources, measurement instruments with slightly lower precision may also be appropriate. In 2021, Defratyka et al. (2021) installed a cavity ring-down system (G2201-i, Picarro, Inc., USA) on a car and identified several methane sources in Paris which increased the CH4 concentration up to 2.7 parts per million (ppmV, 10−6) (Defratyka et al., 2021). Elevations of CH4 levels up to 88.6 ppmV were measured in Washington, DC, USA, in 2014 by Jackson et al. (2014). This work reported a total of 5893 pipeline leaks over a distance of 2414 km (1500 road miles), from which 1122 leaks increased the ambient CH4 concentration to more than 5 ppmV and 67 leaks even over 25 ppmV. The threshold for leakage identification was proposed by von Fischer et al. (2017), who defined a 10 % increase over the normal background concentration as a leakage. For a typical background concentration of about 2 ppmV, this corresponds to 200 ppbV. As an alternative to elaborate measurements in cities, low-cost devices with suitable CH4 resolution (< 200 ppbV) could be installed at multiple locations and combined with a sensor network, which allows continuous remote leakage detection or emission monitoring. Photoacoustic (PA) gas sensors could meet these requirements of low-cost devices while retaining low enough detection limits. In PA sensors, the signal originates from converting vibrational energy of molecules into kinetic energy. A modulated light source electromagnetically excites the analyte of interest, which subsequently can release its additional vibrational energy as kinetic (translational) energy into the sample gas by colliding with surrounding molecules. This process is called vibrational–translational (VT) relaxation. The VT energy transfer increases the kinetic energy of the sample gas, causing the temperature to rise above its equilibrium value. Due to the modulation of the light source, the heat input induced by VT relaxation is also periodic, resulting in periodic density fluctuations, which per definition corresponds to a sound wave. By designing the optical path as an acoustic resonator, e.g. a cylindrical resonator, the photoacoustic sound wave can be amplified and filtered. The sound pressure linearly depends on the analyte concentration and may be detected by an acoustoelectric transducer (e.g. a microphone), quartz tuning fork (QTF), or a cantilever. Generally, the photoacoustically generated sound pressure amplitude, pPA, for cylindrical resonators, excited in their first longitudinal mode, can be described as follows (Miklós et al., 2001; Rück et al., 2023):
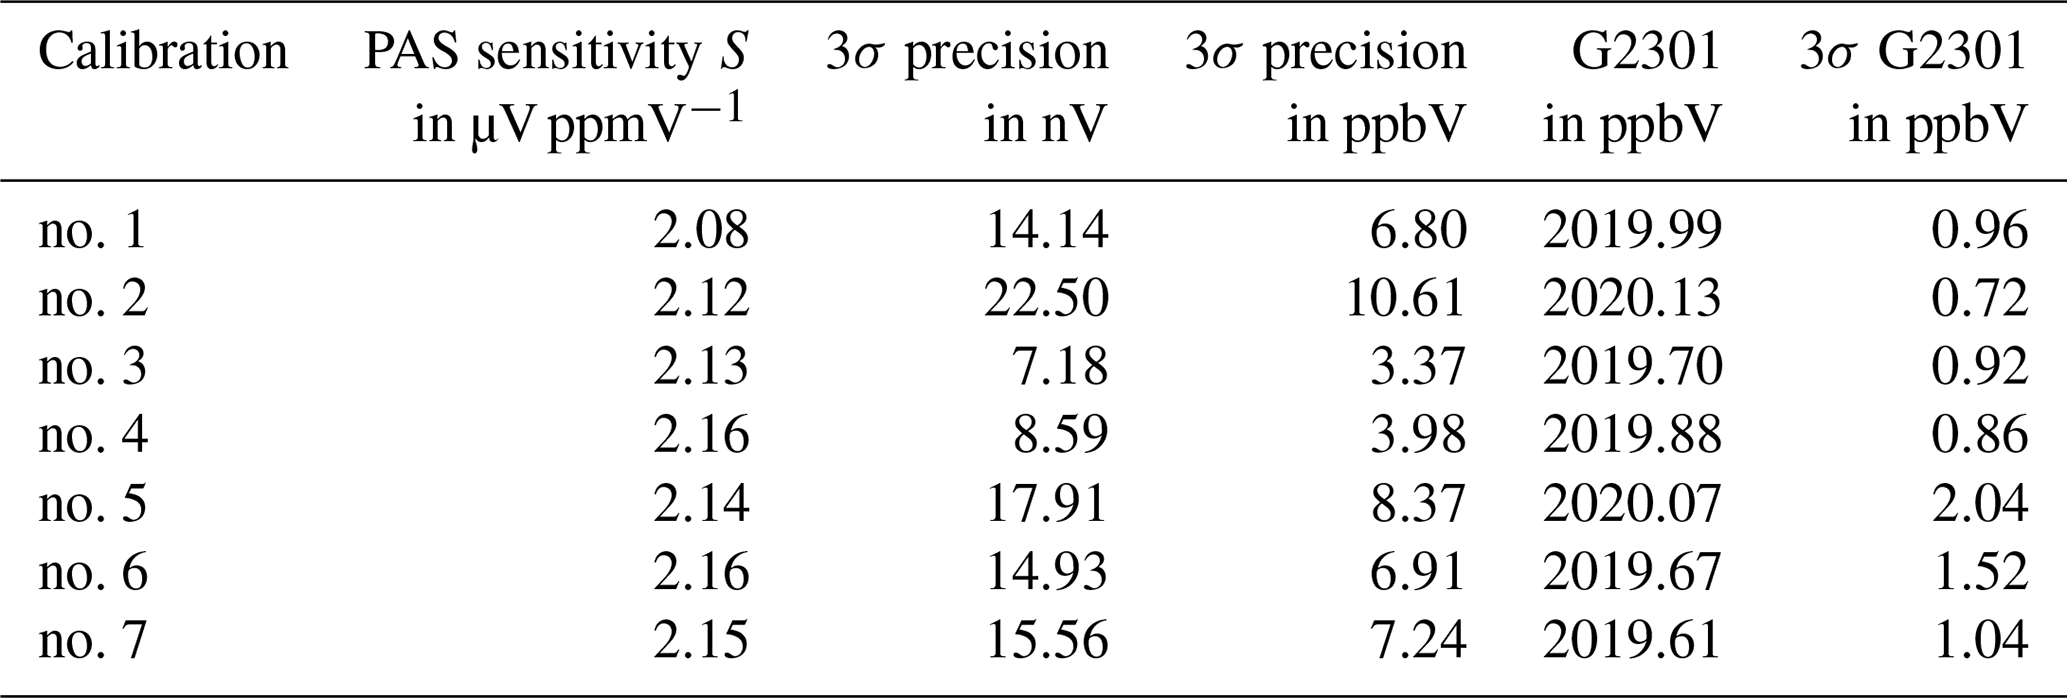
The heat capacity ratio γ contains the number of all degrees of freedom (rotational, vibrational, translational) of the sample gas actively participating in sound propagation. Acoustic cross-sensitivities of the PA signal can be described by the ratio of the quality factor Q and the frequency fres of acoustic resonance amplification. In the equation, r represents the radius of the resonator tube, NA is the Avogadro constant, Vmol is the molar volume of the sample gas, and Ni is the dimensionless volume fraction of the analyte with an absorption cross-section σi at the emitted wavelength λ. The optical power of the light source inside the photoacoustic measurement cell is designated as P0. The efficiency of non-radiative relaxation is denoted as εrelax, which is a quantity between 0 and 1. This quantity depends on the efficiency of all involved energy transitions of the gas mixture (Hunter et al., 1974). Section 2 briefly discusses the effect of non-radiative relaxation on the photoacoustic signal. Regarding photoacoustic methane detection, recent literature provides several publications reporting detection limits in the ppbV – range using infrared laser sources. (Elefante et al., 2019, 2020; Giglio et al., 2020; Gong et al., 2021; Li et al., 2022; Xiao et al., 2022). In this work we present the results of a 5 d CH4 measurement campaign in ambient air at the meteorological observatory of the German Weather Service (DWD) at Hohenpeißenberg with a photoacoustic sensor using a G2301 cavity ring-down spectrometer as a reference. The photoacoustic sensor used in this work provides a limit of detection of 6.8 ppbV and will be briefly introduced in Sect. 3.1 (for a detailed description, see Pangerl et al., 2022). The mountain Hohenpeißenberg (47.48∘ N, 11.01∘ E) is located southwest of Munich at around 985 m above sea level. Due to the naturally occurring fluctuations in ambient humidity during the measurement series, the relaxation behavior was significantly affected. Without including the algorithm CoNRad (see Sect. 2) for data evaluation, no reasonable conclusions about the CH4 concentration would be possible by the PA sensor. The intention of this paper is to demonstrate that the developed PA sensor in combination with the applied signal corrections provides an appropriate choice for reliable and ppbV-level-precise GHG monitoring. During the measuring campaign, the PA sensor does not show any trends in sensitivity (see Table 1); however, it is evident that it is advisable to calibrate the PA sensor frequently in order to maintain the accuracy of the sensor. The G2301, on the other hand, does not show any significant fluctuations in its methane calibration values.
Table 1Sensitivity S of the PA sensor, normalized to a sample humidity of 0.3 % vol, over the 5 d measurement period. An average deviation of 0.98 % and a maximum deviation of −2.61 % from the mean of the observed sensitivities show the stability of the PA sensor. The long-term accuracy and the precision of the G2301 are listed in the two right columns. The campaign started on 6 February 2023 (afternoon) and ended on 10 February 2023 (morning).
The effect of variations in the non-radiative relaxation process is omnipresent in photoacoustic spectroscopy, e.g. Lang et al. (2020), Wysocki et al. (2006), Kalkman and van Kesteren (2008), Hayden et al. (2020), and Qiao et al. (2022). CH4 is Especially well known to be prone to relaxation effects (Schilt et al., 2006; Barreiro et al., 2011, 2012; Elefante et al., 2020; Li et al., 2020; Menduni et al., 2020; Dello Russo et al., 2021; Müller et al., 2022; Pangerl et al., 2022; Rück et al., 2023). To compensate for signal losses due to incomplete relaxation, we introduced an algorithm to compute the collision-based non-radiative efficiency of energy relaxation (CoNRad), which is discussed in detail in Müller et al. (2022). CoNRad can be used to predict the non-radiative relaxation behavior of the analyte, considering the composition, the pressure, and the temperature of the sample gas. Starting from the laser-excited energy state, CoNRad considers all relevant transitions originating from this state and calculates the individual efficiencies, as well as the released photoacoustic energy. The possibility to excite other energy states by collisions (vibrational–vibrational (VV) transition) is also considered by CoNRad. For a state excited by the VV transition, the same procedure is performed as for the initially excited state. This means that, also from the VV excited state, all relevant energy transitions as well as the released photoacoustic energy are computed. Once the ground state is reached, the individual energies are summed up, resulting in the total photoacoustic energy. Consequently, CoNRad calculates the non-radiative relaxation efficiency εrelax, which allows users to predict the influence of different relaxation characteristics on the photoacoustic signal. In Fig. A1, the applied non-radiative relaxation cascade for methane in humid air is shown. The rates k of the individual collision reactions can be taken from Müller et al. (2022).
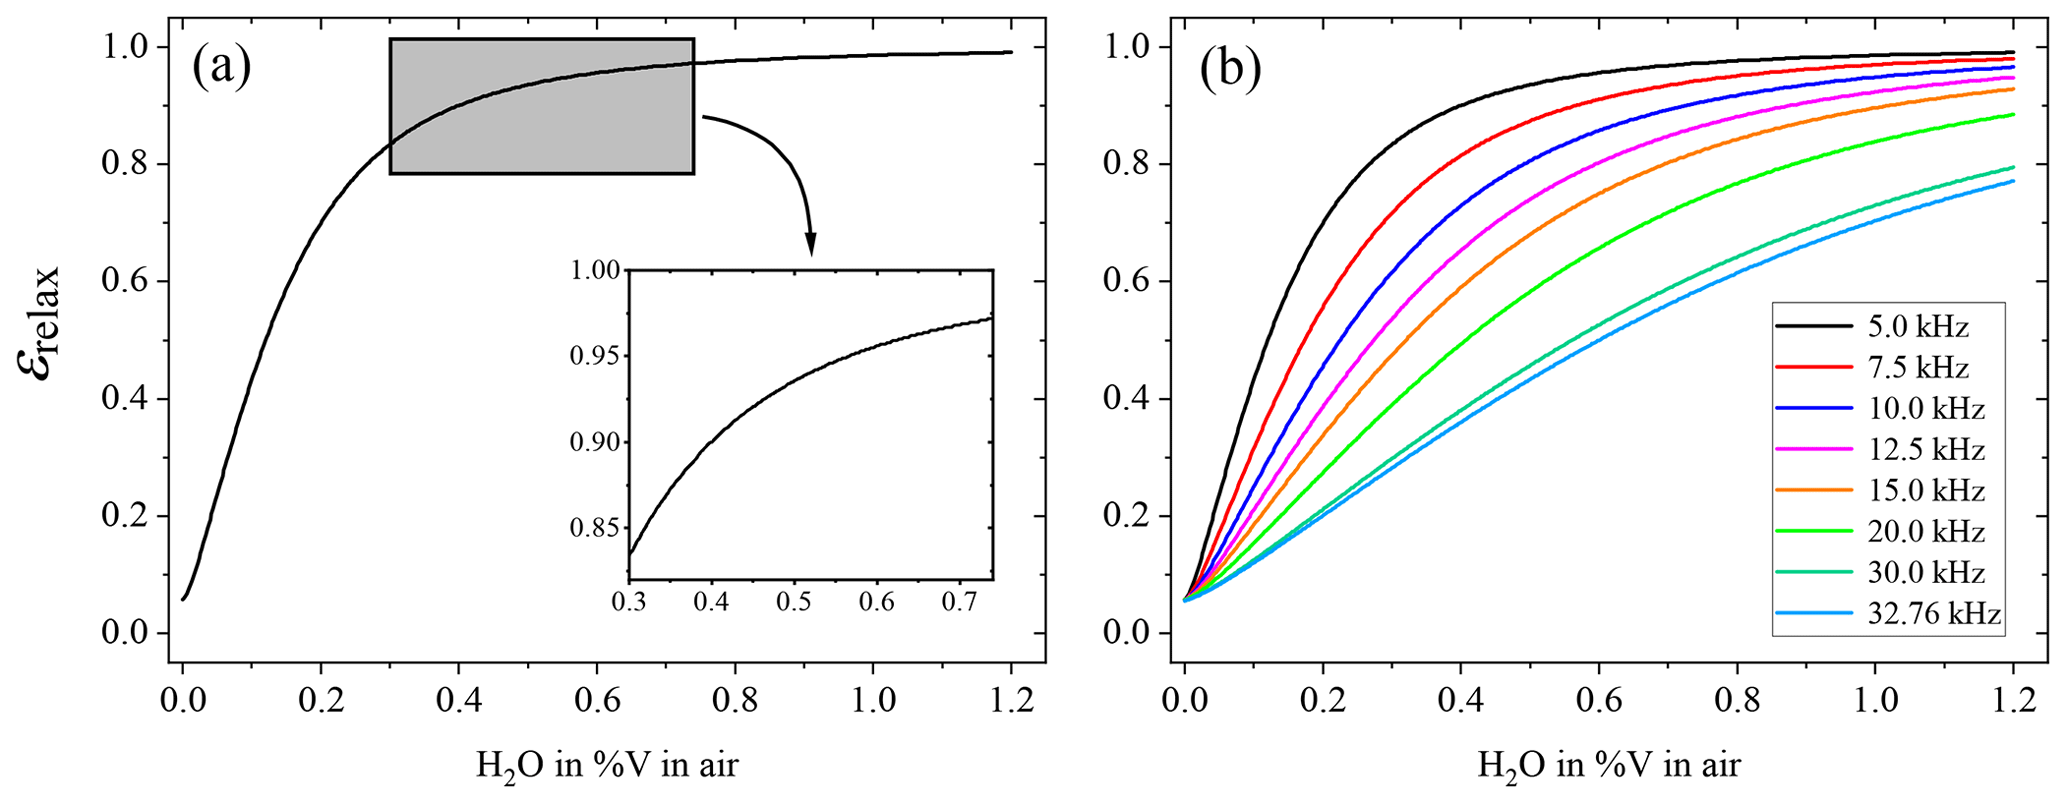
Figure 1Overall efficiency of non-radiative relaxation εrelax at 5055 Hz laser modulation for CH4 in air with rising humidity content (a). The highlighted grey area in (a) indicates the observed humidity during the measurement period. Panel (b) displays how humidification of the sample affects εrelax at different acoustic frequencies up to 32.76 kHz, which is a typical modulation frequency utilized in quartz-enhanced PA sensor (QEPAS) systems.
For an accurate description of the overall relaxation cascade in the case of mid-infrared (MIR) (2968.4 cm−1) methane monitoring in ambient air, i.e. mainly containing N2, O2, and H2O, a total of 29 individual collision reactions have to be considered, according to Müller et al. (2022). In Fig. 1a, the overall relaxation efficiency εrelax at an acoustic frequency of 5055 Hz for methane diluted in air is plotted against continuous humidification of the sample. The data shown in Fig. 1 were obtained via CoNRad (Müller et al., 2022). In dry air, εrelax is only approximately 5.8 %, which implies that 94.2 % of the theoretically possible PA signal is lost due to delayed relaxation. The relaxation loss in the case of methane in dry air is attributed to the strong coupling of the bending modes of methane (2 = 2844 cm−1 and = 1422 cm−1) with the vibrational state of oxygen = 1556 cm−1 (Schilt et al., 2006; Barreiro et al., 2011). This results in a fast vibrational–vibrational (VV) energy transfer from CH4 to O2. Oxygen, however, relaxes rather slowly, causing the energy to accumulate in and not contribute to the PA signal generation, yielding a decrease in εrelax (Schilt et al., 2006; Barreiro et al., 2011; Müller et al., 2022; Pangerl et al., 2022). The addition of humidity significantly increases the relaxation efficiency due to a fast VV energy transfer from to = 1595 cm−1, followed by a fast VT relaxation (Barreiro et al., 2012; Müller et al., 2022; Pangerl et al., 2022). The frequency dependency of the relaxation efficiency for methane is shown in Fig. 1b. The plots demonstrate that with rising acoustic frequencies the relaxation losses become much more pronounced, yielding lower PA signals and thus worse detection limits.
3.1 Photoacoustic sensor
An interband cascade laser (ICL) emitting at 2968.4 cm−1 with an optical power of 7.5 mW, after passing the photoacoustic measurement cell, excites the νs1 stretching mode of CH4 (absorption cross-section = 4.9 × 10⁻¹⁹ cm2 mol−1). Temperature, pressure, and humidity within the PA cell were monitored by a BME280 (Bosch, Germany) TpH sensor. The PA cell is temperature controlled to 40 ∘C and operated in WM(2f) mode, i.e. the modulation frequency of the laser fmod equals half the resonance frequency fres of the PA system. To prevent signal losses due to a mismatch of fres and fmod, the resonance properties of the PA sensor must be determined. Changes in the sample gas composition induce a change in fres, as the speed of sound changes. With the acoustic resonance monitoring system (ARMS) presented in Rück et al. (2023), an integrated, fast, and accurate quantification of the acoustic properties of PA cells was introduced and utilized in this work. This technique additionally allows for Q-factor quantification, which directly affects the generated PA pressure pPA; see Eq. (1). Together with the simulated non-radiative relaxation efficiency εrelax, P0, the measured Q-factor quantification and resonance frequency fres, and the calculated heat capacity ratio γ, the raw photoacoustic signal UPA,raw (in µV) is compensated for according to Eq. (2), yielding the final methane concentration output of the PA sensor CH4,PA.
The quantities labeled with cali in the index were obtained during the respective calibration measurements, with the calibration sensitivity Scali (in µV ppmV−1). For comparison purposes, the sensitivity S in Table 1 is normalized to a humidity of 0.3 % vol.
3.2 Measurement setup
The measurement setup is visualized in Fig. 2. Ambient air was sampled by means of a pump from outside the laboratory. A three-way valve was used to automatically switch between reference gas and ambient air. Dry natural air was chosen as the reference gas, which consists mostly of N2 and O2 but also includes noble gases as well as trace gases (CH4, CO2, N2O, CO). The reference gas tank was filled and calibrated by the ICOS Flask and Calibration Laboratory (FCL) and is linked to the WMO X2004A scale, which provides 2020 ppbV CH4 with an uncertainty below 0.5 ppbV (Jordan and Schumacher, 2022). During the measurement campaign, the reference gas was used a total of seven times for 30 min per interval to avoid and detect potential sensor drifts; see Table 1. As the difference between the theoretical calculations of CoNRad and the measured data is highest for only slightly humidified measuring environments (H2O < 0.25 % vol) (see Fig. 11 from Müller et al. (2022)), an additional humidification of the sample gases of about 0.3 % vol was chosen to avoid this issue. This was realized by a humidity generator installed upstream of the PA sensor. A lock-in-amplifier (LIA) time constant of τLIA = 20 s was chosen to reduce the effect of white noise on the PA data. Every 10 min, the PA sensor recorded three single-point measurements (SPMs) each for 20 s with a data acquisition rate of 5 Hz. The three SPMs themselves where further averaged, as well as the individual standard deviations, yielding the final values. The ARMS routine was performed to determine Q and fres each time before the three SPMs were recorded. Based on the ARMS, the modulation frequency of the laser was automatically adjusted, while the PA ICL was switched off between the measurements. According to Eq. (2), the raw photoacoustic signal was corrected for variations in εrelax, γ, Q, fres, and P0. As shown in Fig. 2, the G2301, operated with a data acquisition rate of 0.2 Hz and an averaging time of 5 s, was installed in the gas setup parallel to the PA sensor, ensuring that both devices received the same sample gas, providing comparability of the sensor readings.
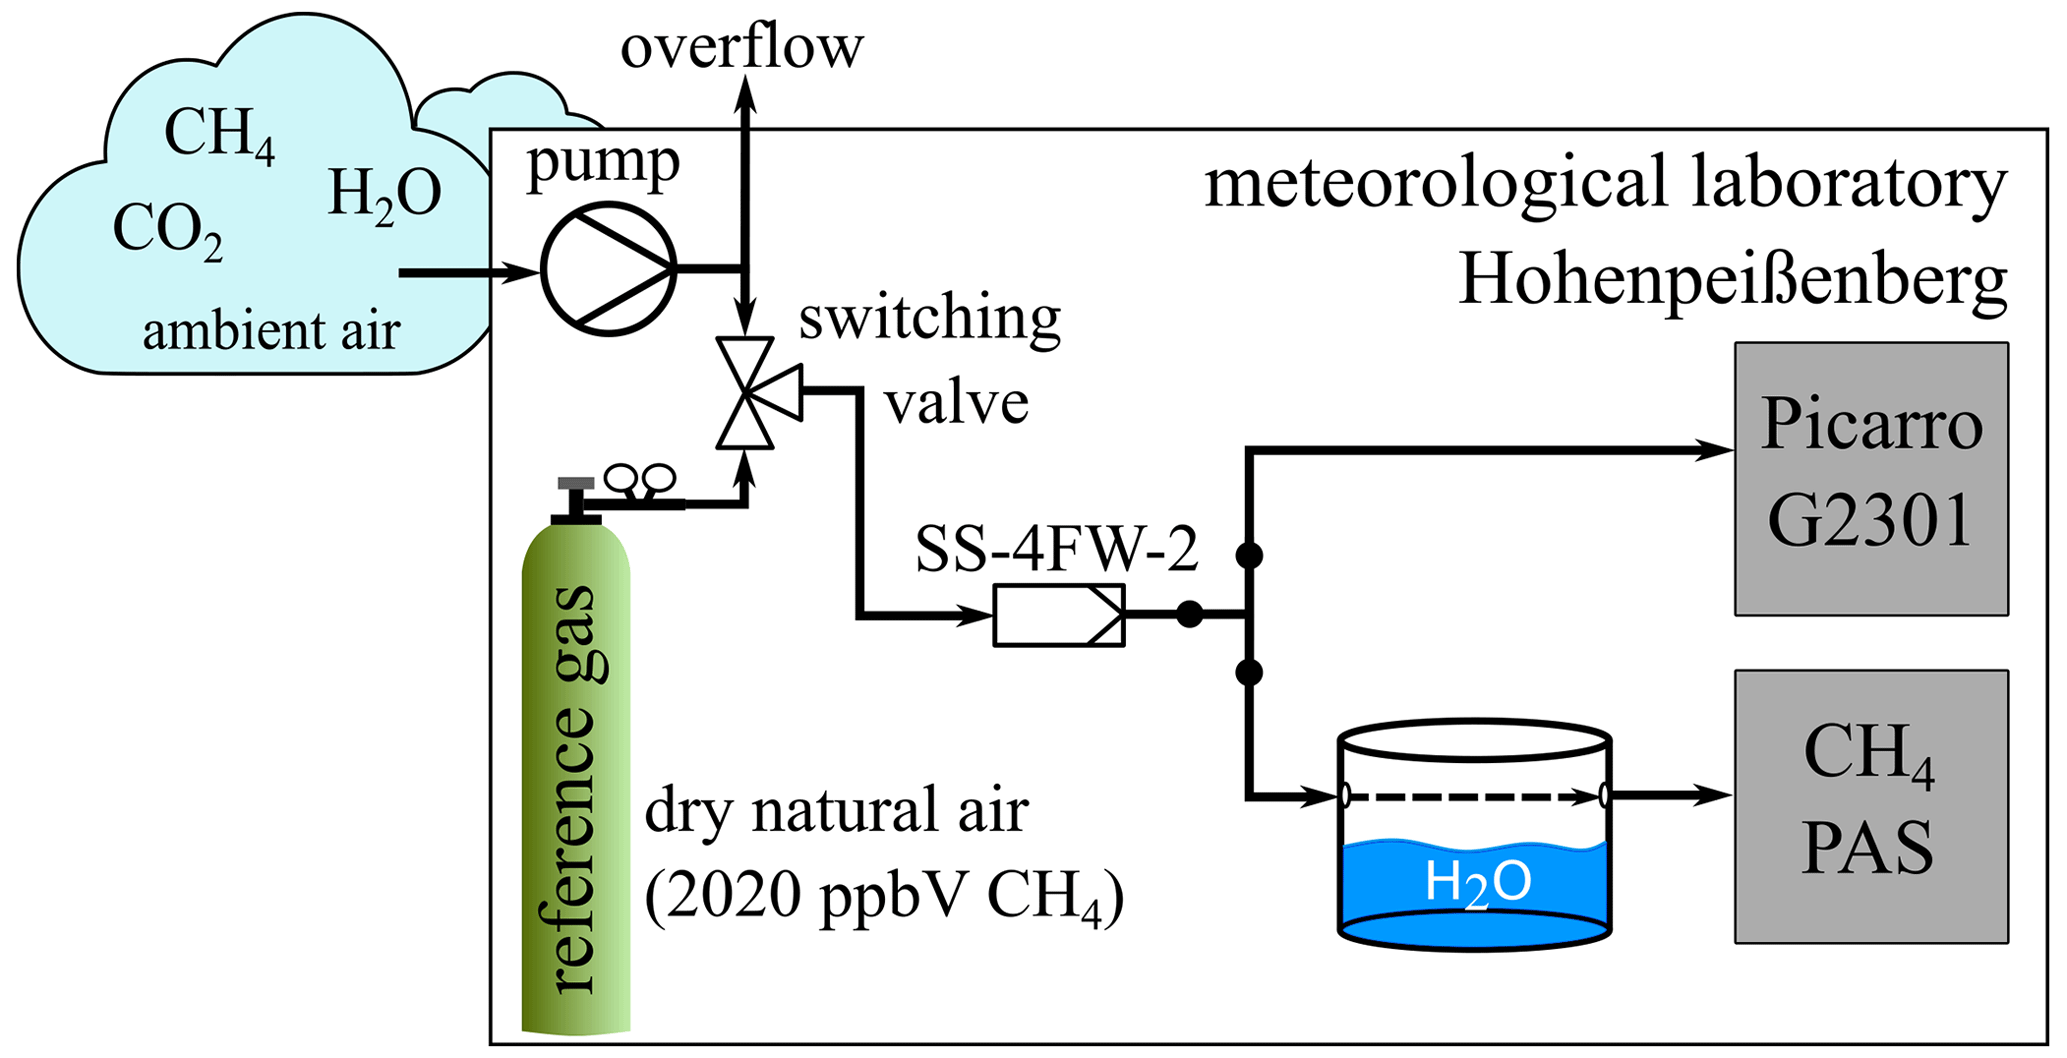
Figure 2Schematic of the experimental setup for the measurement campaign. The pump delivers ambient air from outside the laboratory. A three-way valve is used to switch between ambient air and reference gas. The reference gas consists of 2020 ppbV of methane in dry natural air. Before the respective sample gas is fed into the two measurement instruments, it passes through a stainless-steel filter (SS-4FW-2) to avoid particle contamination.
The data of the PA sensor during reference gas measurements are summarized in Table 1. The sensitivity of the PA sensor varies only slightly (maximum −2.61 % from the average value), which demonstrates the stability of the photoacoustic system, but still shows the necessity for frequent calibration to ensure high accuracy. While the mean CH4 precision (3σPAS = 6.75 ppbV) is worse than the observed precision of the reference (3σG2301 = 1.16 ppbV), the PA sensor is nevertheless sufficiently precise to reliably detect the atmospheric CH4 fluctuations; refer to Fig. 3a. Figure 3 illustrates the CH4 readings (in ppbV) (Fig. 3a) obtained by the PA sensor, including the previously mentioned signal corrections (black) and the G2301 data (red), respectively. The dashed grey lines indicate a new day. It is obvious that the CH4 concentration characteristics monitored with both devices agree quite well with each other. However, more significant discrepancies up to > ±80 ppbV are also evident. As of now, no clear explanation could be identified for these deviations. It is unlikely that these errors are induced by differences in the sample gas of the two systems since the humidity readings of the BME280 integrated into the PA sensor match very well with the readings of the G2301, as shown in Fig. 3c. By evaluating the data acquisition system (DAS), cavity, and etalon temperature of the Picarro G2301, temporal anomalies regarding CH4 discrepancies could be identified (see Fig. A2).
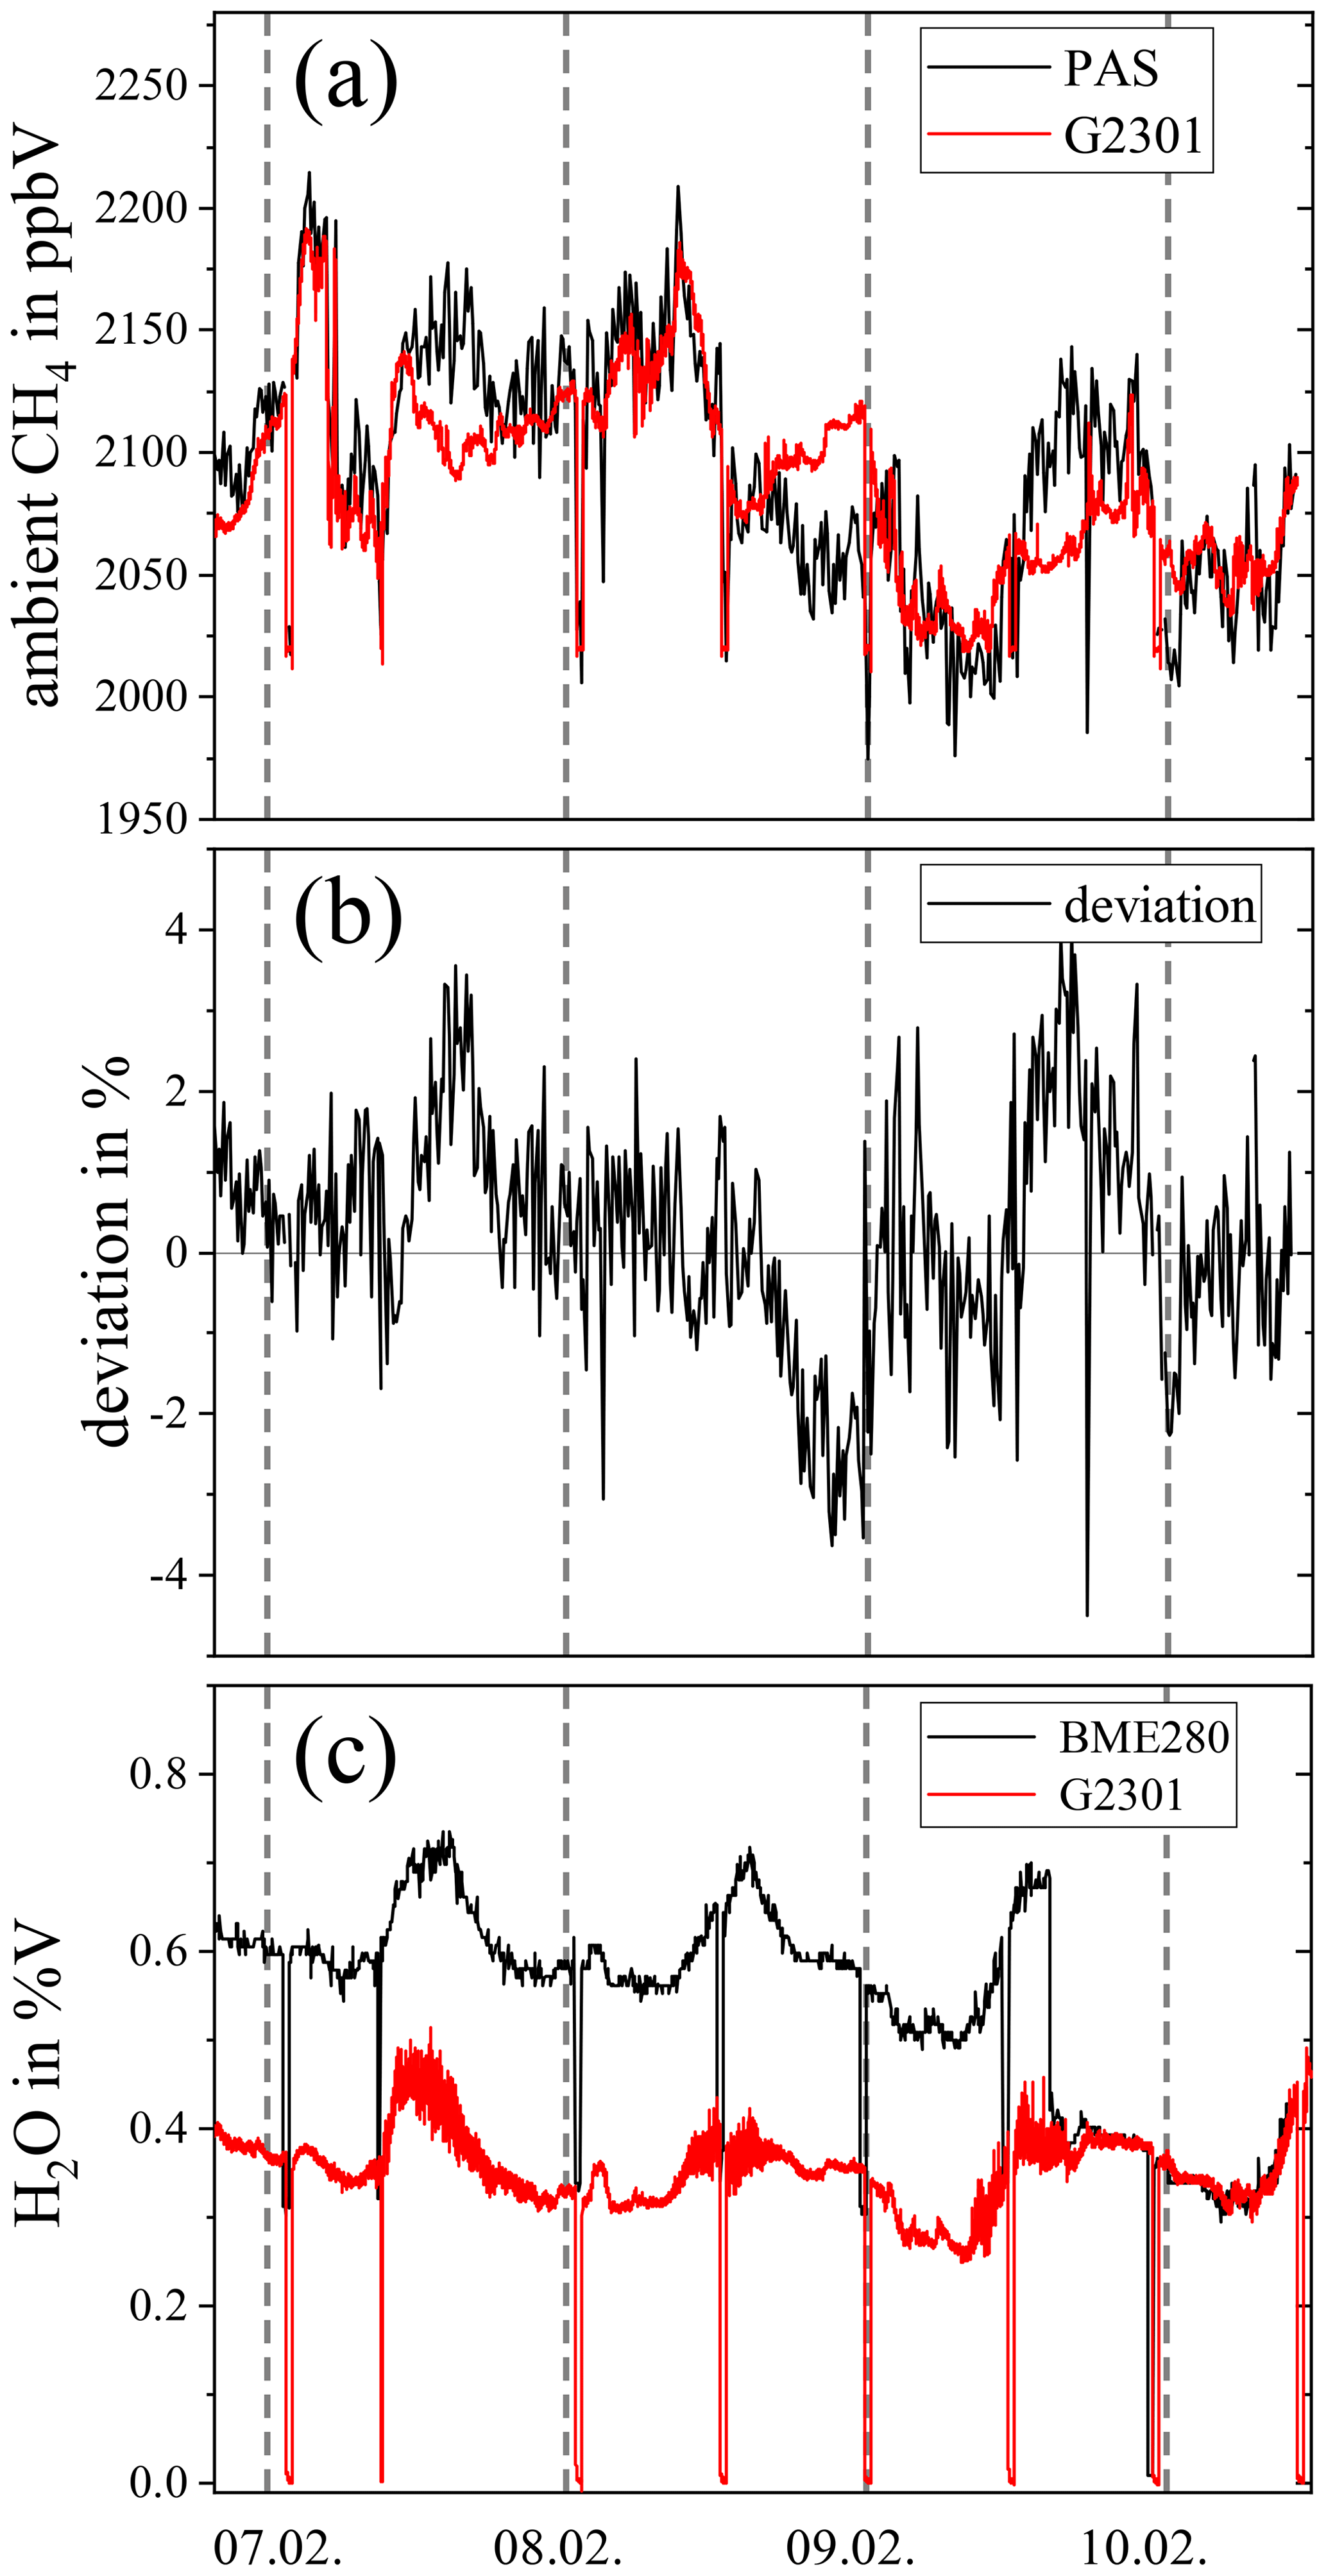
Figure 3Direct comparison of the methane concentration readings (a), the deviation of the PA sensor compared to the Picarro G2301 (in %) (b) and the water readings (c). The humidity offset induced by the measurement setup is clearly visible. During 9 February, the humidity tank became empty, resulting in no additional humidification.
Since the temperature spikes are probably caused by direct sunlight on the G2301, it is recommended to avoid this for similar experiments. Still, the average percentage deviation of the PA sensor and the G2301 reference of 1.11 % is rather moderate; see Fig. 3b.
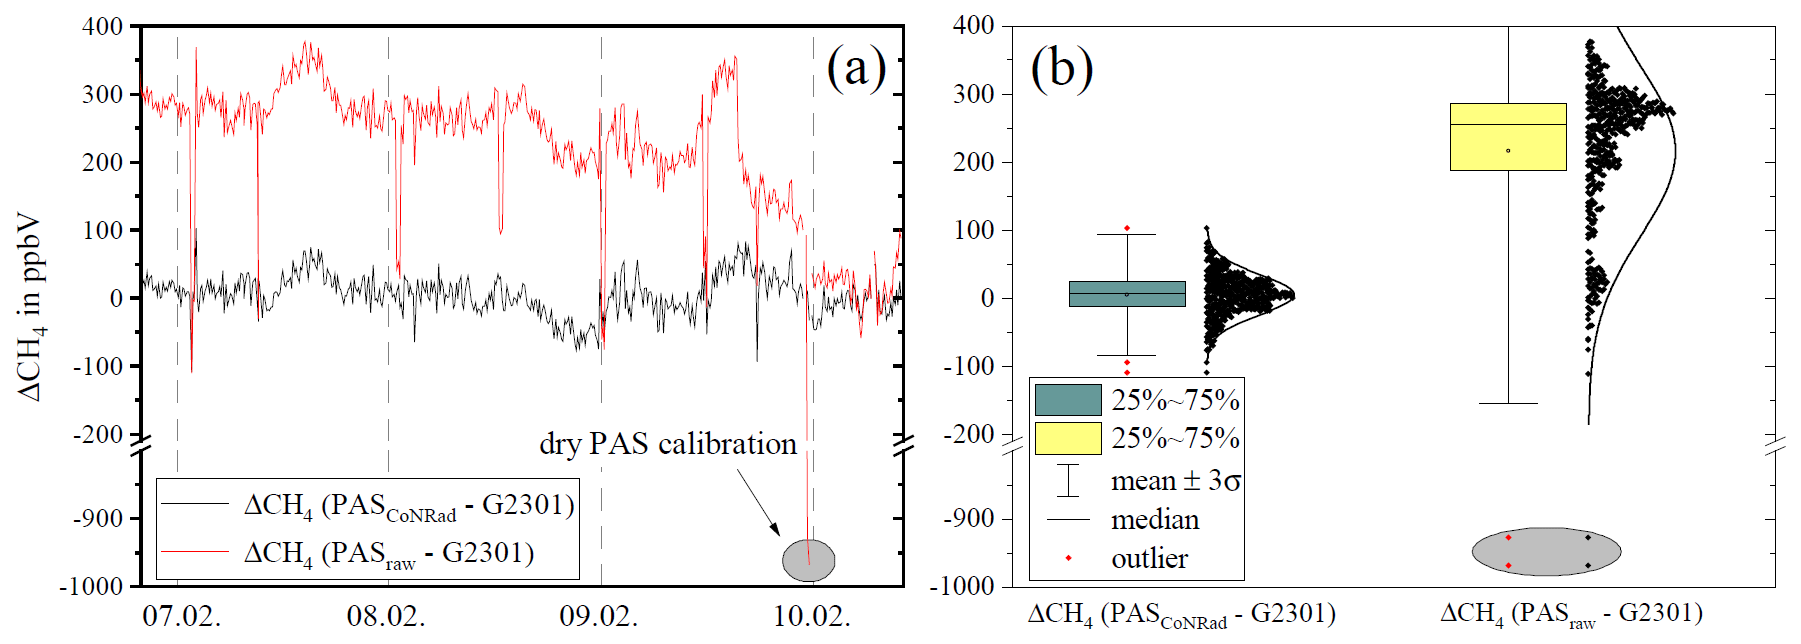
Figure 4Absolute difference of CH4 in ppbV (a) based on raw PA data (red) and after CoNRad compensation (black) with regard to the G2301 reference methane readings. Panel (b) displays the boxplots and histograms of the deviations with CoNRad compensation (green) and without (yellow). The data highlighted in grey indicate dry PAS calibration without CoNRad compensation.
Over the entire period of the measurement campaign, the water content in the PA sample gas varied from about 0.30 % vol to about 0.73 % vol (see Fig. 3c), causing the raw PA sensor readings to alter by about 13.5 % due to relaxation effects (refer to Fig. 1a), which makes standard calibration unfeasible. For this reason, algorithmic compensation methods like CoNRad are essential. The Q-factor quantification, fres, and P0 remained virtually constant during the measurement period. Also, the variation of γ induced by fluctuating humidity was negligible compared to the relaxation effect. Figure 4 illustrates the impact of CoNRad on the reliability of the PA sensor readings. The y axis represents the difference between the CH4 concentration readings of the PA sensor and that of the G2301 (in ppbV). The dashed grey lines again indicate a new day. The black curve in Fig. 4a shows the deviation when CoNRad is implemented (ΔCH4(PACoNRad−G2301)) in the data evaluation, and the red curve illustrates the deviation based on the raw PA data (ΔCH4(PAraw−G2301)). This red curve illustrates that, due to the exponential effect of relaxation processes, the offset between raw data and the reference measurement is not constant. The data highlighted in grey in Fig. 4 show the results for dry PA reference gas operation, with the empty humidity tank during 9 February. Without CoNRad, dry calibration leads to considerable misinterpretations of the PA data. Thus, ambient CH4 PAS monitoring is not possible without the algorithmic compensation approaches. Figure 4b shows a statistical evaluation of the absolute differences with CoNRad compensation (green boxplot) and without (yellow boxplot). It indicates that with CoNRad the variance of the measured deviation with respect to the reference decreases significantly. In addition, the compensated values show a normal distribution around 5.26 ppbV, indicating no long-term drift. The raw values (yellow boxplot), however, are not normally distributed and show a substantially higher variance. The large deviation of about 1000 ppbV CH4 of the raw PA data (highlighted grey area) can be attributed to the dry reference gas mode, in which pronounced relaxation losses occur; see Fig. 1.
We compared our PA methane gas sensor with an established and calibrated cavity ring-down spectrometer (G2301) used for global GHG monitoring. Over a period of 5 d, ambient air has been monitored at the meteorological observatory Hohenpeißenberg of the DWD by both systems. The obtained results demonstrate that the PA sensor (3σ precision = 6.75 ppbV) is able to detect even small natural methane fluctuations in ambient air, thus providing an alternative to established devices. Further applications of the sensor would cover natural-gas leakage detection, identification of new methane sources, and emissions monitoring from agriculture or landfills. Generally, photoacoustic systems provide low detection limits and a high potential for miniaturization; however, relaxation-induced signal alterations pose a major drawback of this technique. The counteracting water- and oxygen-induced relaxation effects play an important role in ambient photoacoustic methane detection, as highlighted in this work. Only in environments with a clearly defined and constant measurement matrix, e.g. contamination measurement of high-purity gases, can the effect of relaxation on the photoacoustic signal be neglected. For measurement applications with varying gas composition, e.g. fluctuating ambient humidity, PA devices essentially require the implementation of algorithmic models, such as CoNRad, in order to compensate for signal losses due to delayed relaxation that otherwise might cause significant errors in PA sensor data. The combination of CoNRad to simulate the non-radiative relaxation cascade and ARMS for real-time monitoring of Q and fres allows for reliable analyte concentration readings with photoacoustic sensors.
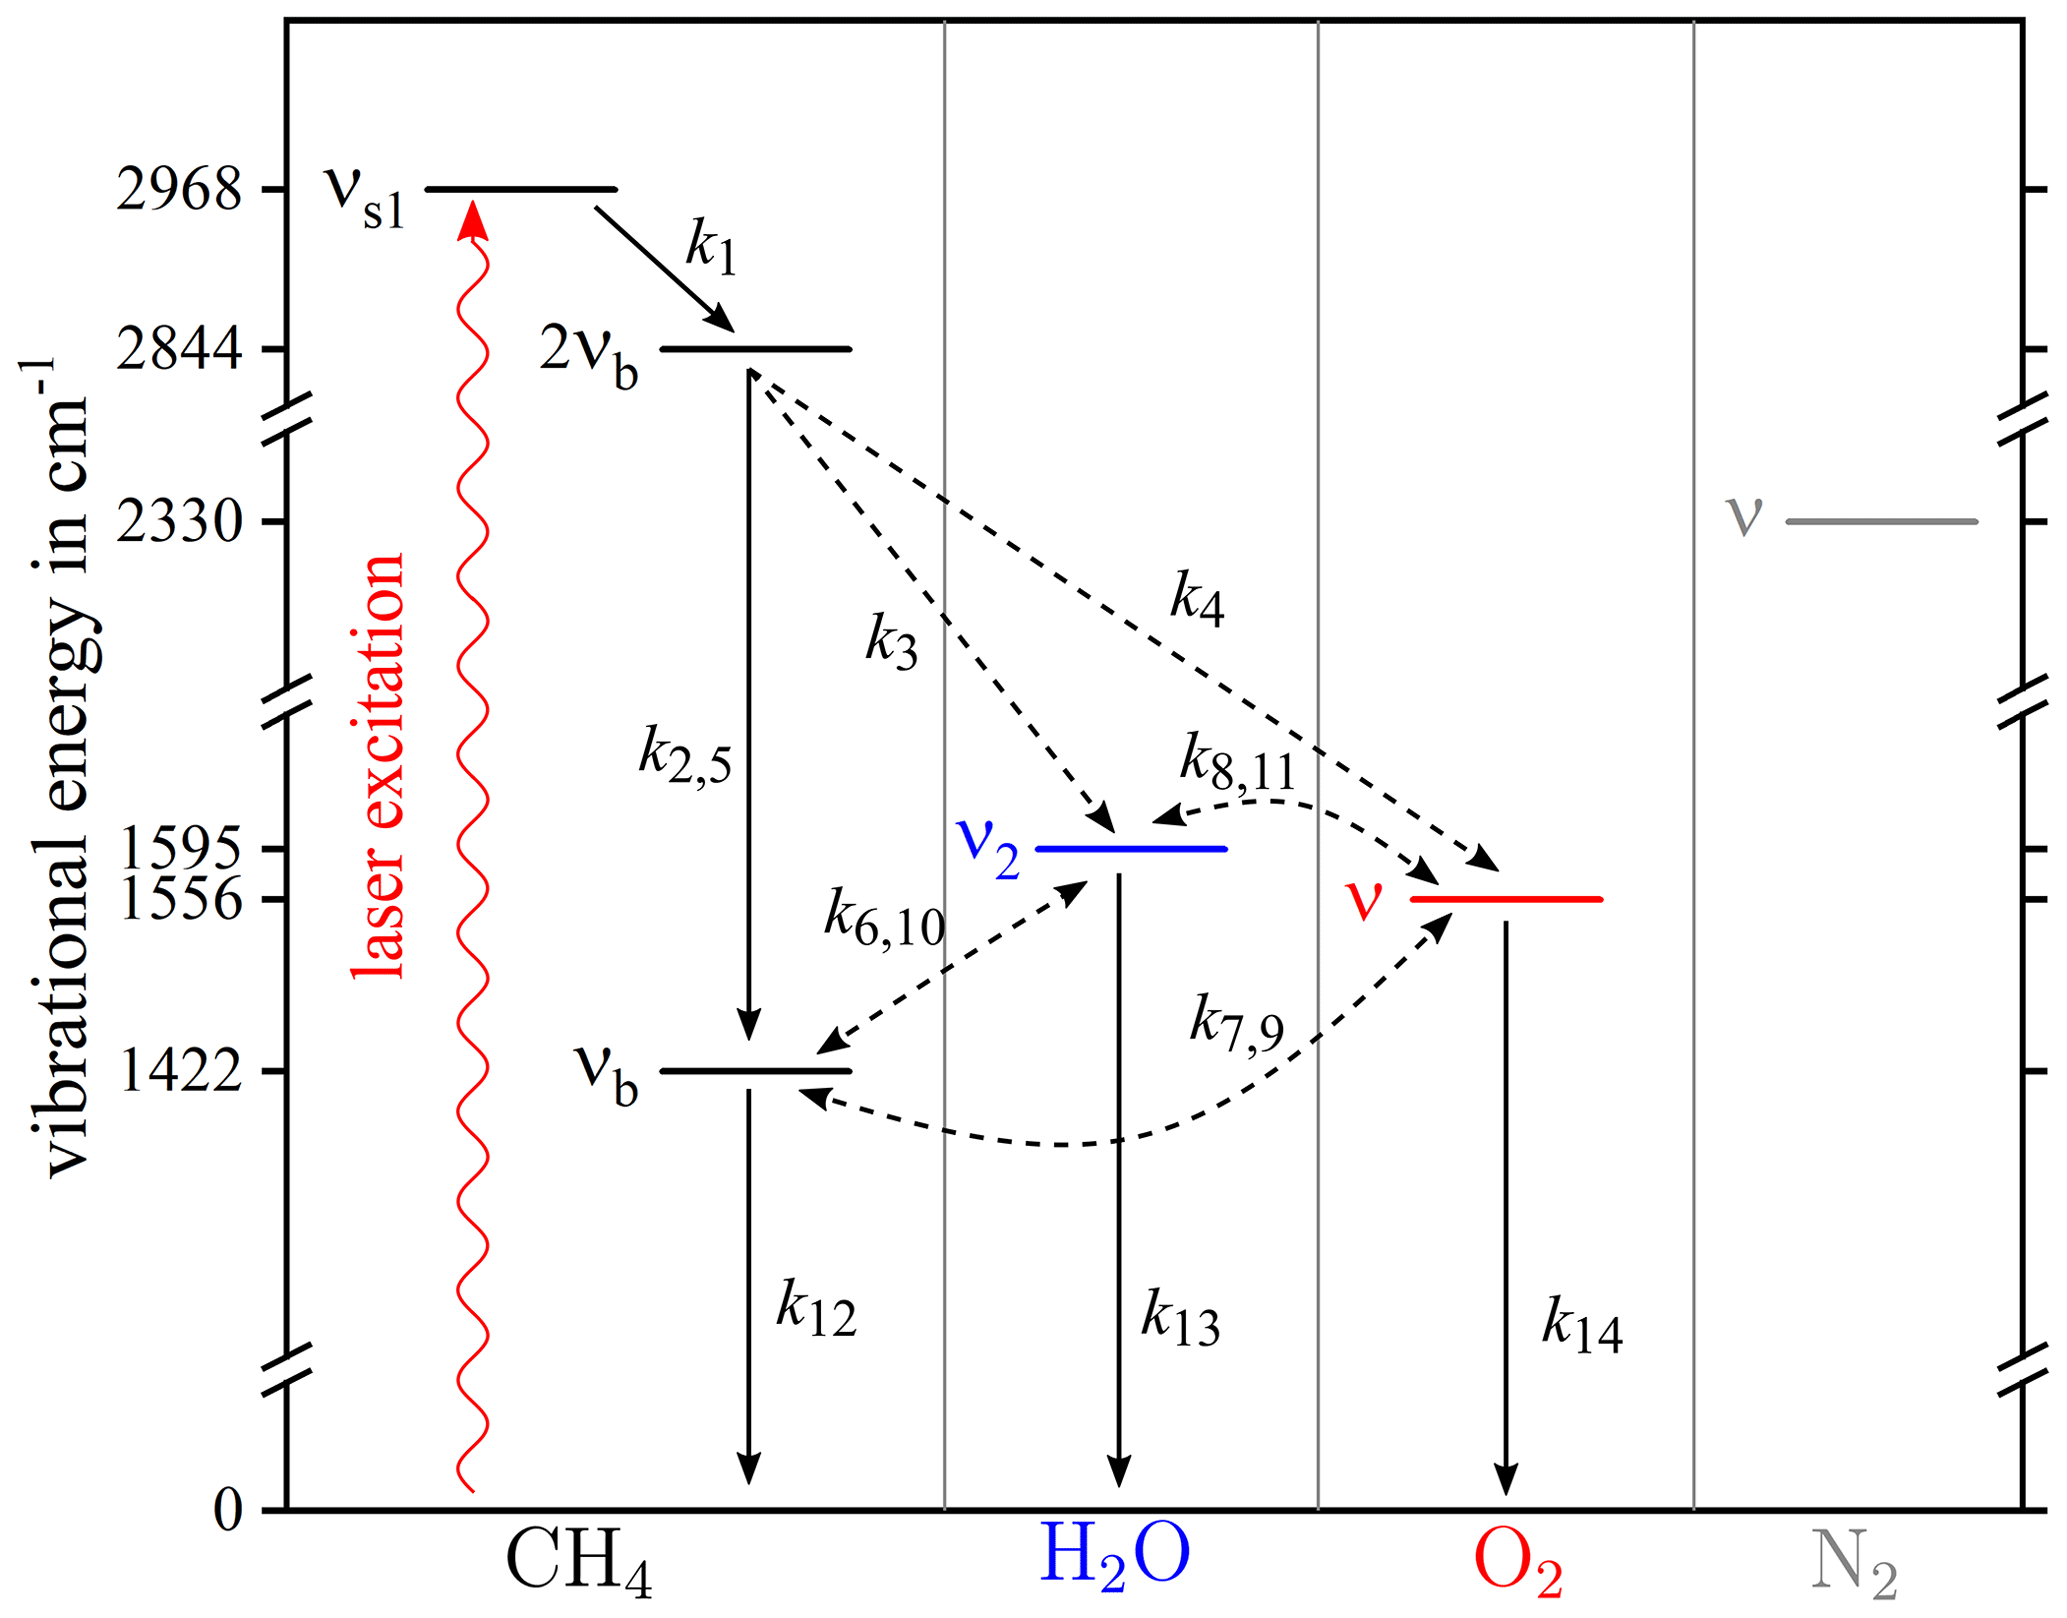
Figure A1Jablonski diagram of the non-radiative relaxation of methane in humid air, after Müller et al. (2022). The rate constants k of the individual transitions can be found in Müller et al. (2022). The influence of traces of CO2 on the relaxation behavior can be neglected (Rück et al., 2023).
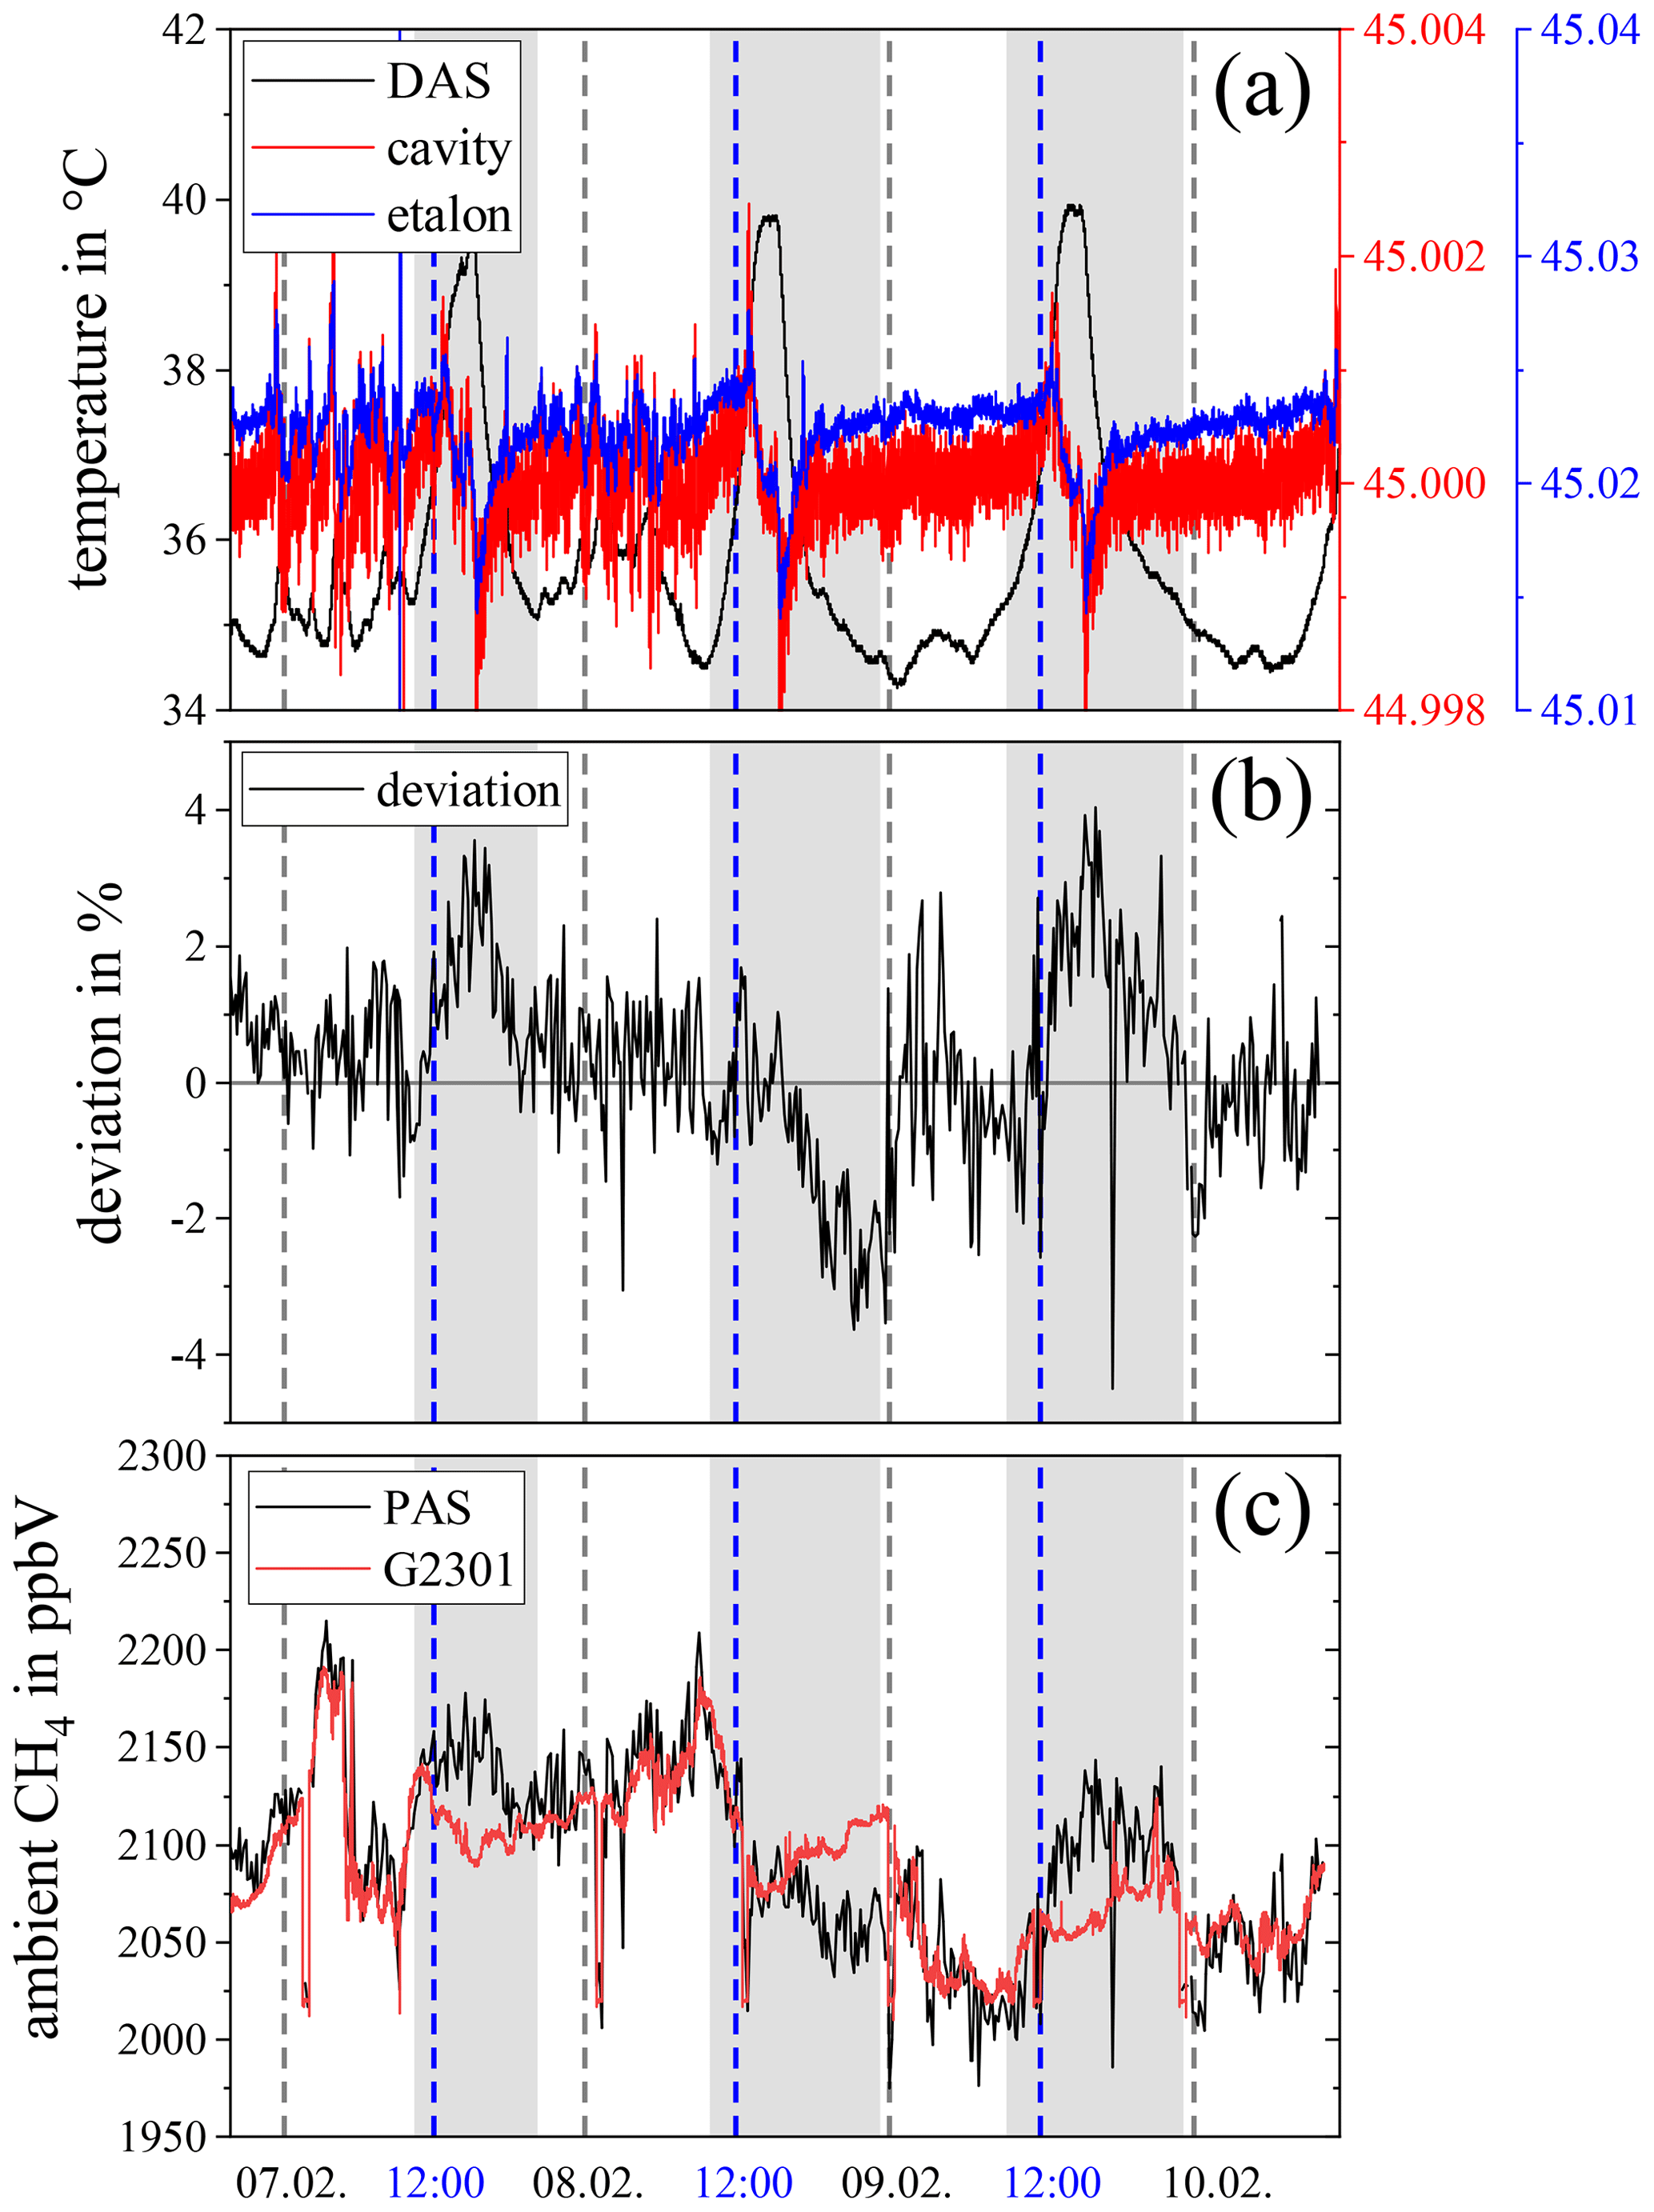
Figure A2Comparison of data acquisition system (DAS), cavity, and etalon temperature (a) of the Picarro G2301 CRDS over time, with the measured percentage deviation (b) and CH4 reading (c). The temperature spikes (highlighted grey areas) seem to correlate with the strongest deviations. The dashed blue lines indicate noon, which leads to the assumption that such spikes in temperature may be caused by direct sun exposure of the device.
The source code is available upon reasonable request. Please contact Max Müller (max.mueller@oth-regensburg.de) or Thomas Rück (thomas.rueck@oth-regensburg.de).
For data related to this paper, please contact Max Müller (max.mueller@oth-regensburg.de).
MM: conceptualization, data curation, investigation, methodology, software, writing (original draft and review and editing). SW: conceptualization, data curation, investigation, methodology, software, writing (review and editing). JMW: conceptualization, data curation, investigation, methodology, writing (review and editing). ML: conceptualization, data curation, investigation, methodology, writing (review and editing). TR: methodology, software, validation, funding acquisition, writing (review and editing). SJ: methodology, software, validation, writing (review and editing). RB: funding acquisition, project administration, supervision, validation, writing (review and editing). FMM: conceptualization, methodology, supervision, validation, writing (review and editing).
The contact author has declared that none of the authors has any competing interests.
Publisher’s note: Copernicus Publications remains neutral with regard to jurisdictional claims in published maps and institutional affiliations.
This work was financially supported by the project PreSEDA funded by the German government and the Federal Ministry of Economic Affairs and Energy (BMWi). The funding code of PreSEDA is 03EN2028A.
This paper was edited by Daniela Famulari and reviewed by Raimund Brunner and one anonymous referee.
Barreiro, N., Vellespi, A., Santiago, G., Slezak, V., and Peuriot, A.: Influence of oxygen on the resonant photoacoustic signal from methane excited at the ν3 mode, Appl. Phys. B, 104, 983–987, https://doi.org/10.1007/s00340-011-4546-8, 2011. a, b, c
Barreiro, N., Peuriot, A., Santiago, G., and Slezak, V.: Water-based enhancement of the resonant photoacoustic signal from methane–air samples excited at 3.3 µm, Appl. Phys. B, 108, 369–375, https://doi.org/10.1007/s00340-012-5018-5, 2012. a, b
Defratyka, S. M., Paris, J.-D., Yver-Kwok, C., Fernandez, J. M., Korben, P., and Bousquet, P.: Mapping Urban Methane Sources in Paris, France, Environ. Sci. Technol., 55, 8583–8591, https://doi.org/10.1021/acs.est.1c00859, 2021. a, b
Dello Russo, S., Sampaolo, A., Patimisco, P., Menduni, G., Giglio, M., Hoelzl, C., Passaro, V. M., Wu, H., Dong, L., and Spagnolo, V.: Quartz-enhanced photoacoustic spectroscopy exploiting low-frequency tuning forks as a tool to measure the vibrational relaxation rate in gas species, Photoacoustics, 21, 100227, https://doi.org/10.1016/j.pacs.2020.100227, 2021. a
Elefante, A., Giglio, M., Sampaolo, A., Menduni, G., Patimisco, P., Passaro, V. M., Wu, H., Rossmadl, H., Mackowiak, V., Cable, A., Tittel, F. K., Dong, L., and Spagnolo, V.: Dual-Gas Quartz-Enhanced Photoacoustic Sensor for Simultaneous Detection of Methane/Nitrous Oxide and Water Vapor, Anal. Chem., 91, 12866–12873, https://doi.org/10.1021/acs.analchem.9b02709, 2019. a
Elefante, A., Menduni, G., Rossmadl, H., Mackowiak, V., Giglio, M., Sampaolo, A., Patimisco, P., Passaro, V. M. N., and Spagnolo, V.: Environmental Monitoring of Methane with Quartz-Enhanced Photoacoustic Spectroscopy Exploiting an Electronic Hygrometer to Compensate the H2O Influence on the Sensor Signal, Sensors, 20, 2935, https://doi.org/10.3390/s20102935, 2020. a, b
Giglio, M., Zifarelli, A., Sampaolo, A., Menduni, G., Elefante, A., Blanchard, R., Pfluegl, C., Witinski, M. F., Vakhshoori, D., Wu, H., Passaro, V. M., Patimisco, P., Tittel, F. K., Dong, L., and Spagnolo, V.: Broadband detection of methane and nitrous oxide using a distributed-feedback quantum cascade laser array and quartz-enhanced photoacoustic sensing, Photoacoustics, 17, 100159, https://doi.org/10.1016/j.pacs.2019.100159, 2020. a
Gong, Z., Gao, T., Mei, L., Chen, K., Chen, Y., Zhang, B., Peng, W., and Yu, Q.: Ppb-level detection of methane based on an optimized T-type photoacoustic cell and a NIR diode laser, Photoacoustics, 21, 100216, https://doi.org/10.1016/j.pacs.2020.100216, 2021. a
Hayden, J., Baumgartner, B., and Lendl, B.: Anomalous Humidity Dependence in Photoacoustic Spectroscopy of CO Explained by Kinetic Cooling, Appl. Sci., 10, 843, https://doi.org/10.3390/app10030843, 2020. a
Hunter, T. F., Rumbles, D., and Stock, M. G.: Photophysical processes in the vapour-phase measured by the optic-acoustic effect. Part 1. – The model and apparatus for the study of radiationless processes, J. Chem. Soc., Faraday Trans. 2, 70, 1010–1021, https://doi.org/10.1039/F29747001010, 1974. a
ICOS RI: ICOS Atmosphere Station Specifications V2.0, edited by: Laurent, O., ICOS CAL, https://doi.org/10.18160/GK28-2188, 2020. a
Jackson, R. B., Down, A., Phillips, N. G., Ackley, R. C., Cook, C. W., Plata, D. L., and Zhao, K.: Natural Gas Pipeline Leaks Across Washington, DC, Environ. Sci. Technol., 48, 2051–2058, https://doi.org/10.1021/es404474x, 2014. a
Jordan, A. and Schumacher, M.: ICOS CAL – Quality Control Report 2021, ICOS CAL, https://doi.org/10.18160/RS2Q-RA1Q, 2022. a
Kalkman, J. and van Kesteren, H.: Relaxation effects and high sensitivity photoacoustic detection of NO2 with a blue laser diode, Appl. Phys. B, 90, 197–200, https://doi.org/10.1007/s00340-007-2895-0, 2008. a
Lang, B., Breitegger, P., Brunnhofer, G., Valero, J., Schweighart, S., Klug, A., Hassler, W., and Bergmann, A.: Molecular relaxation effects on vibrational water vapor photoacoustic spectroscopy in air, Appl. Phys. B, 126, 64, https://doi.org/10.1007/s00340-020-7409-3, 2020. a
Li, Y., Wang, R., Tittel, F. K., and Ma, Y.: Sensitive methane detection based on quartz-enhanced photoacoustic spectroscopy with a high-power diode laser and wavelet filtering, Opt. Laser. Eng., 132, 106155, https://doi.org/10.1016/j.optlaseng.2020.106155, 2020. a
Li, Z., Liu, J., Si, G., Ning, Z., and Fang, Y.: Design of a high-sensitivity differential Helmholtz photoacoustic cell and its application in methane detection, Opt. Express, 30, 28984–28996, https://doi.org/10.1364/OE.465161, 2022. a
Menduni, G., Sgobba, F., Russo, S. D., Ranieri, A. C., Sampaolo, A., Patimisco, P., Giglio, M., Passaro, V. M., Csutak, S., Assante, D., Ranieri, E., Geoffrion, E., and Spagnolo, V.: Fiber-Coupled Quartz-Enhanced Photoacoustic Spectroscopy System for Methane and Ethane Monitoring in the Near-Infrared Spectral Range, Molecules, 25, 5607, https://doi.org/10.3390/molecules25235607, 2020. a
Miklós, A., Hess, P., and Bozóki, Z.: Application of acoustic resonators in photoacoustic trace gas analysis and metrology, Rev. Sci. Instrum., 72, 1937–1955, https://doi.org/10.1063/1.1353198, 2001. a
Müller, M., Rück, T., Jobst, S., Pangerl, J., Weigl, S., Bierl, R., and Matysik, F.-M.: An Algorithmic Approach to Compute the Effect of Non-Radiative Relaxation Processes in Photoacoustic Spectroscopy, Photoacoustics, 26, 100371, https://doi.org/10.1016/j.pacs.2022.100371, 2022. a, b, c, d, e, f, g, h, i, j
Pangerl, J., Müller, M., Rück, T., Weigl, S., and Bierl, R.: Characterizing a sensitive compact mid-infrared photoacoustic sensor for methane, ethane and acetylene detection considering changing ambient parameters and bulk composition (N2, O2 and H2O), Sensor. Actuat. B-Chem., 352, 130962, https://doi.org/10.1016/j.snb.2021.130962, 2022. a, b, c, d
Qiao, Y., Tang, L., Gao, Y., Han, F., Liu, C., Li, L., and Shan, C.: Sensitivity enhanced NIR photoacoustic CO detection with SF6 promoting vibrational to translational relaxation process, Photoacoustics, 25, 100334, https://doi.org/10.1016/j.pacs.2022.100334, 2022. a
Rück, T., Müller, M., Jobst, S., Weigl, S., Pangerl, J., Bierl, R., and Matysik, F.-M.: Digital Twin of a photoacoustic trace gas sensor for monitoring methane in complex gas compositions, Sensor. Actuat. B-Chem., 378, 133119, https://doi.org/10.1016/j.snb.2022.133119, 2023. a, b, c, d
Schilt, S., Besson, J.-P., and Thevenaz, L.: Near-infrared laser photoacoustic detection of methane: the impact of molecular relaxation, Appl. Phys. B, 82, 319–328, https://doi.org/10.1007/s00340-005-2076-y, 2006. a, b, c
von Fischer, J. C., Cooley, D., Chamberlain, S., Gaylord, A., Griebenow, C. J., Hamburg, S. P., Salo, J., Schumacher, R., Theobald, D., and Ham, J.: Rapid, Vehicle-Based Identification of Location and Magnitude of Urban Natural Gas Pipeline Leaks, Environ. Sci. Technol., 51, 4091–4099, https://doi.org/10.1021/acs.est.6b06095, 2017. a
Wysocki, G., Kosterev, A., and Tittel, F.: Influence of molecular relaxation dynamics on quartz-enhanced photoacoustic detection of CO2 at λ = 2 µm, Appl. Phys. B, 85, 301–306, https://doi.org/10.1007/s00340-006-2369-9, 2006. a
Xiao, H., Zhao, J., Sima, C., Lu, P., Long, Y., Ai, Y., Zhang, W., Pan, Y., Zhang, J., and Liu, D.: Ultra-sensitive ppb-level methane detection based on NIR all-optical photoacoustic spectroscopy by using differential fiber-optic microphones with gold-chromium composite nanomembrane, Photoacoustics, 26, 100353, https://doi.org/10.1016/j.pacs.2022.100353, 2022. a