the Creative Commons Attribution 4.0 License.
the Creative Commons Attribution 4.0 License.
 | 09 Oct 2023
Characterisation of gaseous iodine species detection using the multi-scheme chemical ionisation inlet 2 with bromide and nitrate chemical ionisation methods
Jiali Shen
Siddharth Iyer
Paxton Juuti
Jiangyi Zhang
Mrisha Koirala
Mikko M. Kytökari
Douglas R. Worsnop
Matti Rissanen
Markku Kulmala
Norbert M. Maier
Jyri Mikkilä
Mikko Sipilä
Juha Kangasluoma
The multi-scheme chemical ionisation inlet 1 (MION1) enables rapid switching between the measurement of atmospheric ions without chemical ionisation and neutral molecules using various atmospheric pressure chemical ionisation methods. In this study, we introduce the upgraded version, the multi-scheme chemical ionisation inlet 2 (MION2). The new design incorporates enhanced ion optics, resulting in increased reagent ion concentration, ensuring a robust operation, and enabling the use of multiple chemical ionisation methods with the same ionisation time.
In order to simplify the regular calibration of MION2, we developed an open-source flow reactor chemistry model called MARFORCE. This model enables quantification of the chemical production of sulfuric acid (H2SO4), hypoiodous acid (HOI), and hydroperoxyl radical (HO2). MARFORCE simulates the convection–diffusion–reaction processes occurring within typical cylindrical flow reactors with uniform inner diameters. The model also includes options to simulate chemical processes in the following two scenarios: (1) when two flow reactors with different inner diameters are connected and (2) when two flows are merged into one using a Y-shaped tee, although with reduced accuracy. Furthermore, the chemical mechanism files in the model are compatible with the widely used Master Chemical Mechanism (MCM), allowing for future adaptation to simulate other chemical processes in flow reactors.
Furthermore, we conducted a comprehensive characterisation of the bromide (Br−) and nitrate () chemical ionisation methods with different ionisation times. We performed calibration experiments for H2SO4, HOI, and HO2 by combining gas kinetic experiments with the MARFORCE model. The evaluation of sulfur dioxide (SO2), water (H2O), and molecular iodine (I2) involved dilution experiments from a gas cylinder (SO2), dew point mirror measurements (H2O), and a derivatisation approach combined with a high-performance liquid chromatography quantification (I2), respectively.
Our findings indicate that the detection limit is inversely correlated with the fragmentation enthalpy of the analyte–reagent ion (Br−) cluster. In other words, stronger binding (resulting in a larger fragmentation enthalpy) leads to a lower detection limit. Additionally, a moderately longer ionisation time enhances the detection sensitivity, thereby reducing the detection limit. For instance, when using the Br− chemical ionisation method with a 300 ms ionisation time, the estimated detection limit for H2SO4 is 2.9×10⁴ molec. cm−3. Notably, this detection limit is even superior to that achieved by the widely used Eisele-type chemical ionisation inlet (7.6×10⁴ molec. cm−3), as revealed by direct comparisons.
While the chemical ionisation method remains stable in the presence of high humidity, we have observed that the Br− chemical ionisation method (Br−–MION2) is significantly affected by the air water content. Higher levels of air water lead to reduced sensitivity for HO2 and SO2 under the examined conditions. However, we have found that a sharp decline in sensitivity for H2SO4, HOI, and I2 occurs only when the dew point exceeds 0.5–10.5 ∘C (equivalent to 20 %–40 % RH; calculated at 25 ∘C throughout this paper). For future studies utilising the atmospheric pressure Br− chemical ionisation method, including Br−–MION2, it is crucial to carefully consider the molecular-level effects of humidity. By combining approaches such as the water-insensitive –MION2 with Br−–MION2, MION2 can offer more comprehensive insights into atmospheric composition than what can be achieved by either method alone.
By employing instrument voltage scanning, chemical kinetic experiments, and quantum chemical calculations, we have conclusively established that the presence of iodine oxides does not interfere with the detection of HIO3. Our comprehensive analysis reveals that the ions , , and HIO3•Br−, which are detected using the Br− and chemical ionisation methods, are primarily, if not exclusively, generated from gaseous HIO3 molecules within atmospherically relevant conditions.
- Article
(5915 KB) - Full-text XML
- BibTeX
- EndNote


Chemical ionisation mass spectrometry (CIMS) has been widely used in atmospheric chemistry and aerosol formation studies due to its versatility and high sensitivity in measuring trace level gaseous species (see, e.g., Eisele and Tanner, 1993; Munson and Field, 1966; Hansel et al., 1995; Huey, 2007; Kirkby et al., 2011; Ehn et al., 2014; Lee et al., 2014; Berndt et al., 2016; Sipilä et al., 2016; Laskin et al., 2018; He et al., 2021b). With chemical ionisation methods, an analyte is charged either by (1) receiving charge (proton, electron, or ion) from the reagent ion or (2) forming a relatively stable cluster with the reagent ion. Mass spectrometers further measure the charged analyte-containing ions to obtain their molecular information.
Various chemicals have been employed as reagent ions in chemical ionisation methods. The commonly used reagent ions include nitrate (; Eisele and Tanner, 1993), acetate (; Veres et al., 2008), iodide (I−; Caldwell et al., 1989), hydronium (H3O+; Lagg et al., 1994), and, sporadically, bromide (Br−; Caldwell et al., 1989) and ammonium (; Westmore and Alauddin, 1986). These reagent ions transfer charges to or form clusters with distinct subsets of trace gases. However, the detection of an analyte-containing ion is influenced by its transmission through the mass spectrometer's ion optics, as collision-induced cluster fragmentation can diminish the analyte's signature. Analyte–reagent ion clusters with strong bonds have a higher likelihood of reaching the detector when compared to weakly bonded clusters (Passananti et al., 2019). Hence, it is crucial to select a chemical ionisation method that preserves the analyte's signature. For example, the –CIMS has been widely used to detect sulfuric acid (H2SO4; Eisele and Tanner, 1993) and highly oxygenated organic molecules (Ehn et al., 2014). I−–CIMS is regularly used to detect semi-volatile organic compounds (Lee et al., 2014), bromine and chlorine-containing species (Liao et al., 2014; Wang et al., 2019), and, for example, dinitrogen pentoxide (N2O5; Thornton et al., 2010). –CIMS was used to detect small organic acids (Veres et al., 2008) and highly oxygenated organic compounds (Berndt et al., 2016). The bromide chemical ionisation method has recently been used to detect species such as HO2 (Sanchez et al., 2016) and H2SO4 (M. Wang et al., 2021). The detection of a series of halogenated species by the Br− chemical ionisation method was first demonstrated by He (2017). A detailed characterisation of the Br− chemical ionisation method utilising the multi-scheme chemical ionisation inlet 1 (MION1) was presented in several of our earlier studies (M. Wang et al., 2021; Tham et al., 2021; He et al., 2021b). Multiple species were successfully calibrated using either analytical methods or inter-instrument comparison, including H2SO4, I2, Cl2, and HOI (Tham et al., 2021; M. Wang et al., 2021). Among the calibrated species, H2SO4 and I2 were shown to be detected at the collision limit (highest sensitivity). Although H2SO4 has been quantified using standard methods (Kürten et al., 2012), the quantification of the measured I2•Br− signal remains challenging. This is primarily contributed by the following two factors: (1) the current Br−–MION1 and Br−–MION2 have a detection upper limit of a few hundred pptv (parts per trillion by volume) of I2, beyond which the reagent ions become depleted and the measurement is non-linear. (2) On the contrary, spectroscopic and other methods could be limited by their high detection limits and may not be able to detect I2 at appropriate levels. Therefore, the key is to find sensitive methods to quantify gaseous I2 at tens to hundreds of pptv levels.
Ideally, simultaneous measurement of all the mentioned analytes could be achieved by employing their corresponding CIMS methods concurrently in ambient observations or complex laboratory experiments. However, CIMS instruments are costly, and research institutes often face limitations due to the availability of such instrumentation. As an alternative approach, chemical ionisation inlets that have the capability to switch between different reagent ions can be employed. Many switchable systems have been developed previously, such as for proton transfer reaction mass spectrometers (Jordan et al., 2009; Breitenlechner et al., 2017; Pan et al., 2017) and other chemical ionisation mass spectrometers (Hearn and Smith, 2004; Smith and Španěl, 2005; Agarwal et al., 2014; Brophy and Farmer, 2015). A common feature of these techniques is using a reduced-pressure ion molecule reaction chamber, thus unavoidably diluting the gas molecules of interest by orders of magnitude. While the detection limit of an instrument is also affected by other factors, it is commonly observed that chemical ionisation inlets operating at reduced pressures have higher limits of detection compared to atmospheric pressure chemical ionisation inlets. For instance, reduced pressure inlets reported detection limits of various organic compounds from sub-pptv to hundreds of pptv levels (Lee et al., 2014; Brophy and Farmer, 2015), while the best-performing atmospheric pressure chemical ionisation inlets regularly detect vapours at ppqv (parts per quadrillion by volume) levels for selected acids and highly oxygenated organic vapours using the same time-of-flight mass spectrometer (Jokinen et al., 2012; Ehn et al., 2014; He et al., 2021b).
To reduce the detection limit of switchable reagent ion chemical ionisation systems, we developed the MION1 inlet, which allows for fast switching of reagent ion chemistry at atmospheric pressure (Rissanen et al., 2019). This technique has predominantly been employed for the detection of sulfuric acid and halogenated species, using either the or Br− chemical ionisation methods (Rissanen et al., 2019; Tham et al., 2021; He et al., 2021b; M. Wang et al., 2021; Finkenzeller et al., 2023). However, there are some remaining issues with the MION1. First, its limit of detection is higher compared to another commonly used atmospheric pressure chemical ionisation inlet referred to as the Eisele inlet (Eisele and Tanner, 1993; Jokinen et al., 2012; M. Wang et al., 2021). Second, the ionisation times for different chemical ionisation methods have to be different due to the design, which involves aligning and attaching the chemical ionisation units at varying distances on a cylindrical tube. These challenges may restrict its suitability for detecting vapours at extremely low concentrations (e.g. at 105 to 106 molec. cm−3 or 4 to 40 ppqv) and interpreting the species detected by different chemical ionisation methods.
In this study, we introduce an upgraded version of the multi-scheme chemical ionisation inlet (MION), referred to as MION2, which specifically addresses these issues. We conducted laboratory experiments to characterise the performance of this inlet, using analytical methods and a newly developed open-source kinetic model. As chemical ionisation methods based on halogen anions (such as I−) are commonly influenced by the water content in the air (Kercher et al., 2009; Mielke et al., 2011; Woodward-Massey et al., 2014; Lee et al., 2014), we also systematically examined the impact of air water content on the detection of Br−–MION2.
2.1 Characterisation of the MION2 inlet
The ionisation inlet utilised in this study is the upgraded multi-scheme chemical ionisation inlet, MION2, developed by Karsa Ltd. This inlet is specifically designed to enable the measurement of neutral molecules using chemical ionisation methods, while also facilitating the detection of atmospheric ions by disabling chemical ionisation. It offers the capability of rapid switching between two or more chemical ionisation methods, allowing for selective measurement of gaseous species at ambient pressure. Currently, the MION2 inlet supports up to six ion sources.
Due to the geometric limitations of the previous MION1 inlet, the different ionisation sources in MION1 have to employ different ionisation times. The ionisation time is defined by the sample flow rate and the distance between the ion injection port and the instrument pinhole (refer to Fig. 1). The improved geometry of the MION2 inlet overcomes this limitation, allowing for the operation of three bipolar ion sources per ionisation time, which are all positioned at the same distance from the pinhole. Additionally, for the longer ionisation time, the length of the connecting pipe between the sources can be adjusted, providing flexibility in modifying the ionisation time.
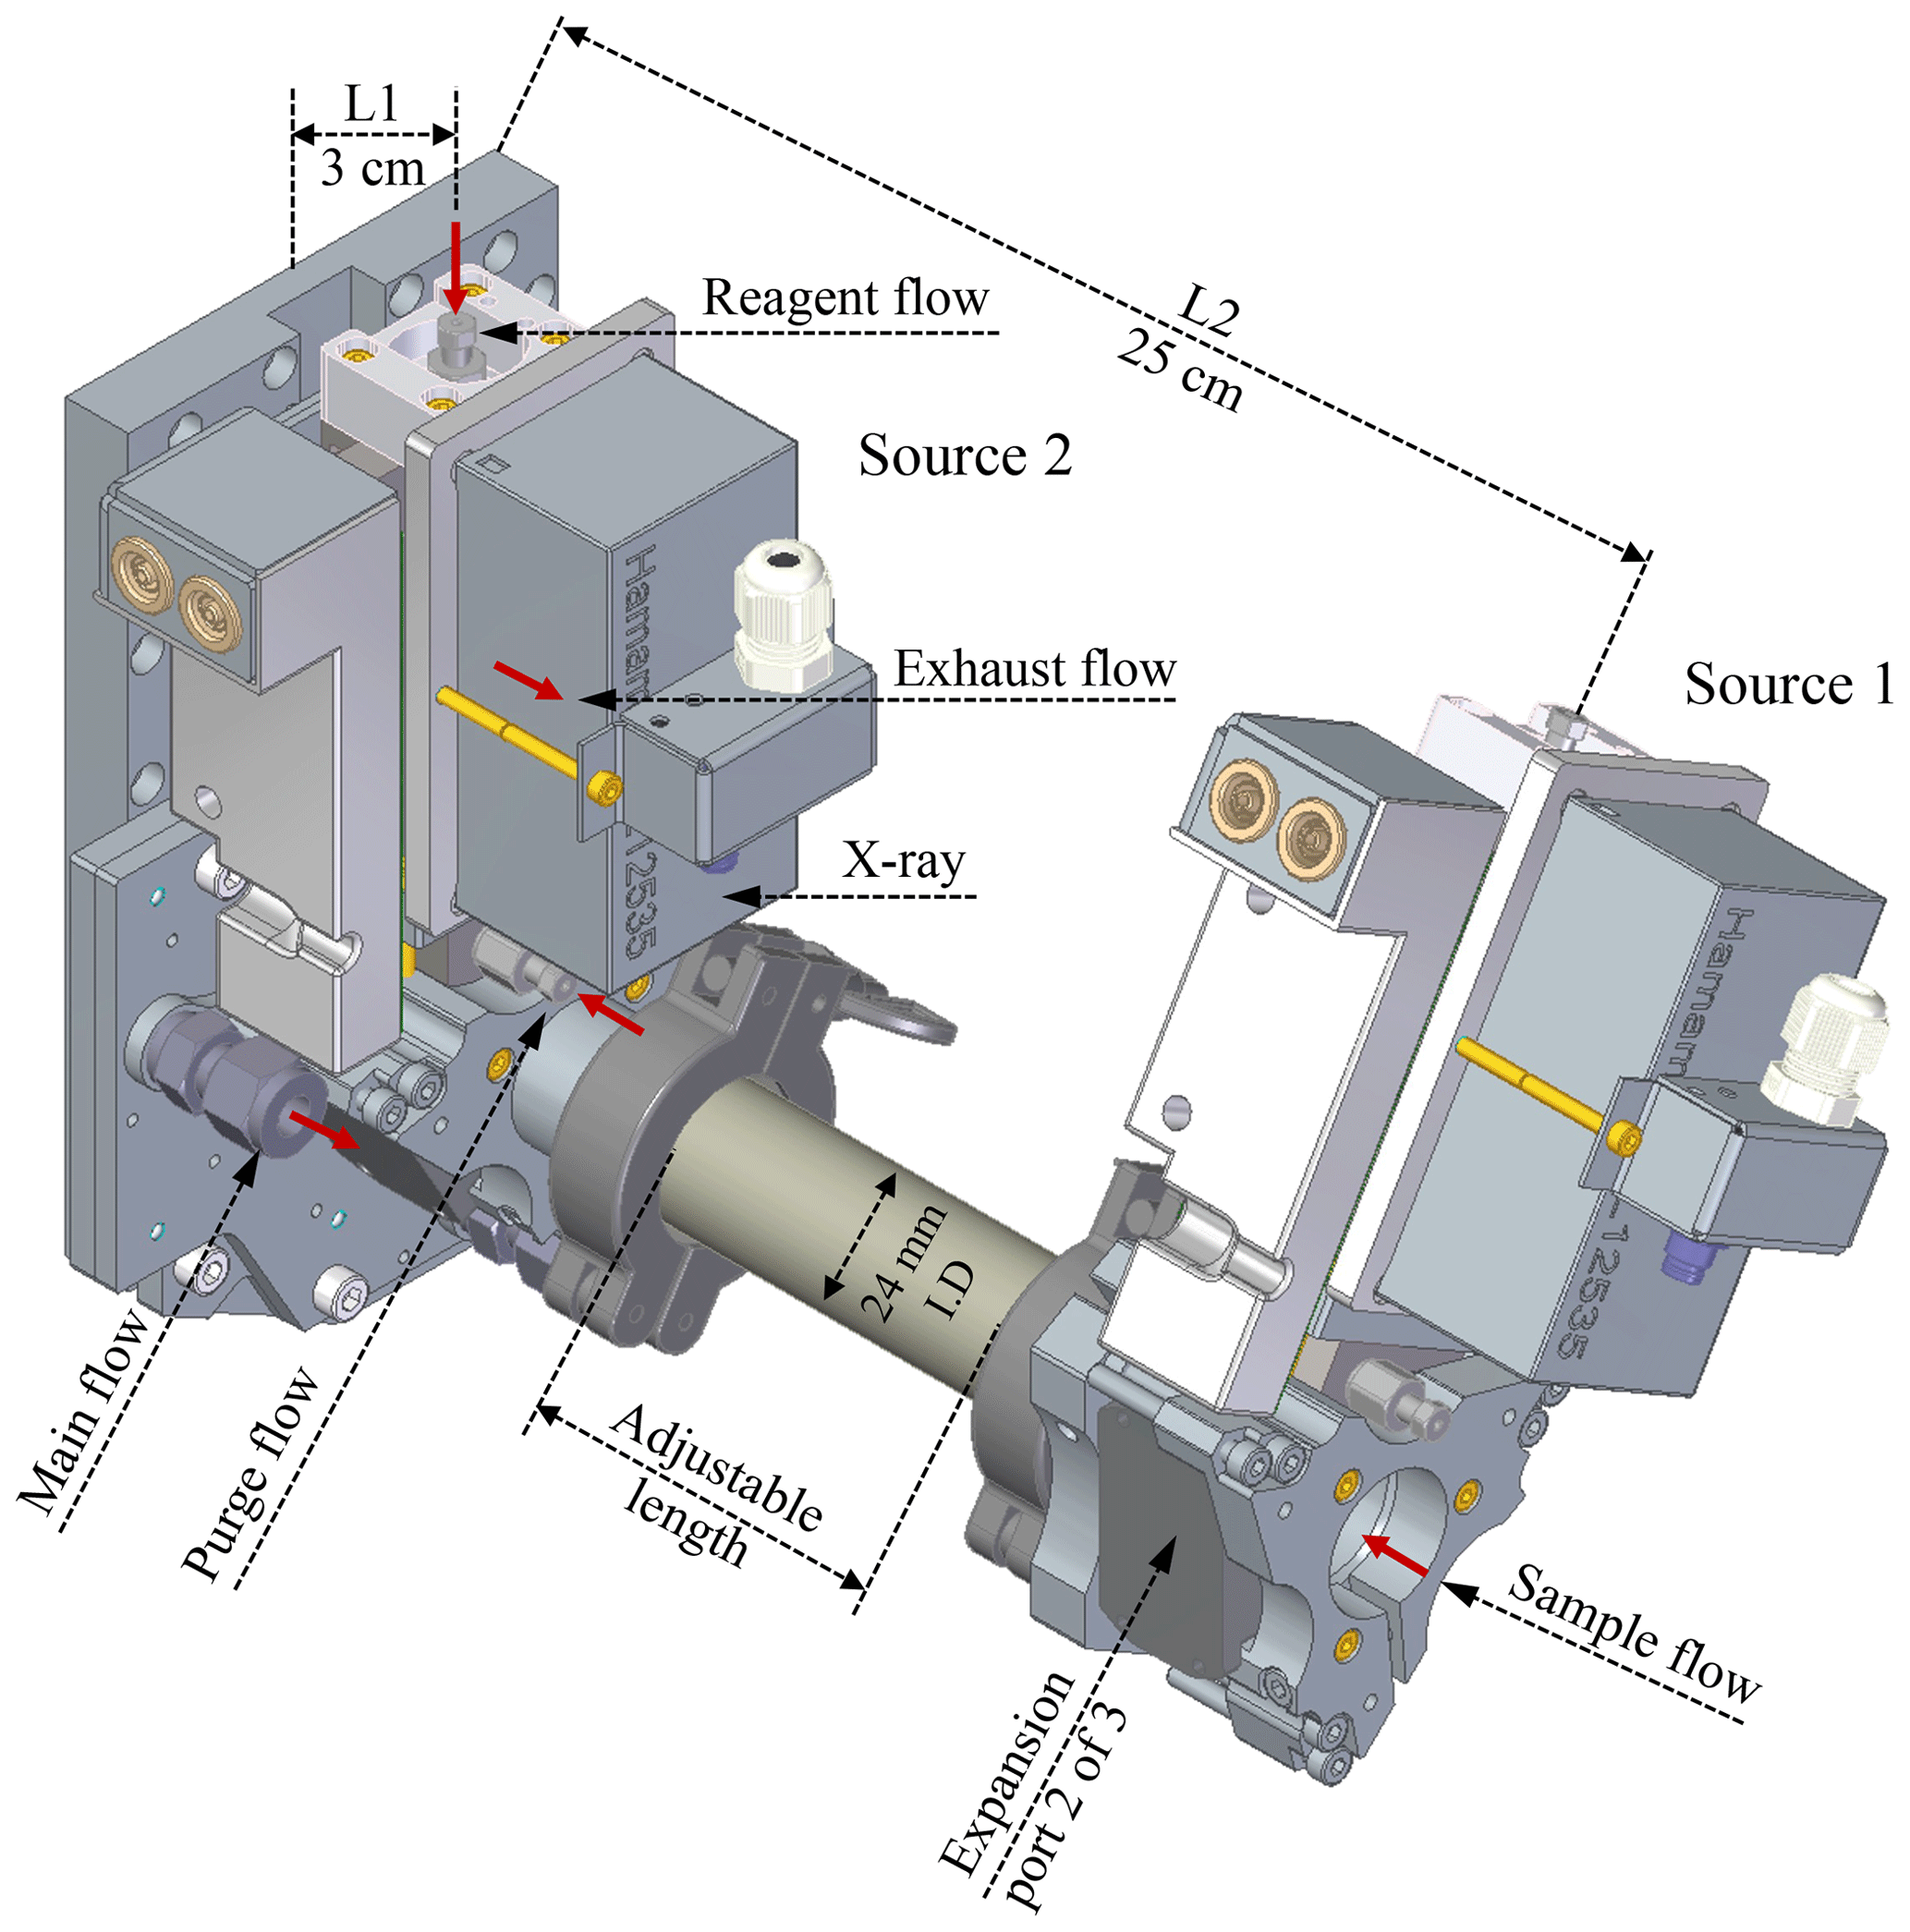
Figure 1Schematic of the MION2 inlet illustrating its gas flows and ion paths. The new design increases the primary ion concentration and allows the operation of multiple chemical ionisation methods with the same ionisation time. L1 and L2 refer to the distances between the ion sources and the pinhole of the mass spectrometer. The exhaust flows are connected to two ports in the middle of the ion source.
In this study, we employed the MION2 inlet with two chemical ionisation methods, namely and Br−, along with two different ionisation times (35 and 300 ms, respectively). This configuration was chosen to investigate the characteristics of the inlet. To facilitate clear referencing, we designate the ion source positioned 3 cm away from the mass spectrometer as tower 1 (T1), while the source located 25 cm away from the mass spectrometer is referred to as tower 2 (T2) throughout this paper (see Fig. 1).
Figure A1 illustrates the conceptual schematic of one of the ion sources, depicting the airflow and ion paths. The entire source is attached to a 24 mm inner diameter tube that is electrically grounded. The sample flow, which is provided by a mass flow controller (MFC) connected to a vacuum pump, is set at a rate of 22.5 standard litres per minute (L min−1). The target molecules undergo ionisation by reacting with the reagent ions ( or Br−).
In this configuration, the ionisation time for the target molecules and charged reagent ions is approximately 35 ms for tower 1 and 300 ms for tower 2. A neutral reagent inflow is introduced, which consists of nitrogen or air enriched with reagent vapour. The reagent vapour is generated by passing nitrogen or air over a liquid reagent (nitric acid, HNO3, or dibromomethane, CH2Br2, in this study). The resulting mixture is then fed into the ion source, where it is ionised by a soft X-ray source (Hamamatsu L12535; 4.9 keV). The charged reagent ions are guided into the sample flow by an electric field within the ion source. This electric field is generated using concentric stainless-steel electrode plates with orifices of different sizes (ranging from 5–10 mm in diameter), with resistances placed between each pair of plates. Two high voltages (approximately 2500 and 250 V) are used in the inlet. The lower of the two voltages determines whether the reagent ions pass through the final orifice in the deflector electrode, effectively controlling the ionisation process and enabling the rapid switching between ion sources.
In contrast to the MION1 design (Rissanen et al., 2019), which relied on the reagent inflow and exhaust flow to define the source reagent flow, MION2 incorporates an additional purge flow to prevent the sample flow from entering the ion source. The purge flow consists of the same nitrogen or air used to generate the reagent flow. Upon entering the ion source, the purge flow splits into two streams; one stream prevents the sample flow from entering, while the other stream ensures that the neutral reagent does not enter the sample flow.
In MION2, the typical flow rates for the reagent, purge, and exhaust are 10, 100, and 50 standard cubic centimetres per minute (m3 min−1), respectively. The reagent concentration in the ion source is estimated to be 2×1017 cm−3. This design effectively addresses the challenges faced in MION1, where a compromise had to be made between the risk of contaminating the sample pipe with a neutral reagent or introducing sample air into the ion source, potentially leading to contamination or uncontrolled ion chemistry and resulting in detection biases. In MION2, the water vapour and other contaminants in the sample flow do not have the opportunity to oxidise the surfaces of the electrodes inside the ion source. Such oxidation would result in reduced ion transmission from the ion source to the sample flow. Operational testing during ambient measurements has demonstrated that MION2 exhibits significantly improved stability compared to MION1. For example, recent measurements conducted at a coastal site in Finland involved the uninterrupted operation of MION2 for at least 2 months.
Additionally, the upgraded ion optics inside the ion sources of MION2 have increased the transmission of reagent ions and the observed reagent ion concentration at the mass spectrometer by approximately 1 order of magnitude when compared to MION1. This improvement was achieved by modifying the last electrode within the ion source to minimise the ion residence time and reduce the diffusion losses of ions.
2.2 Experimental set-up
2.2.1 Calibration of inorganic species
The experimental set-up used for characterising the MION2 inlet is illustrated in Fig. A2. It consists of three main sections, namely the flow reactor section, the MION2 chemical ionisation inlet section, and an atmospheric pressure interface time-of-flight mass spectrometer (APi-TOF; Aerodyne Inc.; Junninen et al., 2010).
The flow reactor section includes a calibration source and several gas feeds. Synthetic air (Woikoski Oy, Finland; purity ≥ 99.999 %, with 20.9 % O2), nitrogen (N2; Woikoski Oy, Finland; purity ≥ 99.999 %), and sulfur dioxide (SO2; Air Products, USA; 99.5 % purity) were injected into the system using mass flow controllers connected to standard gas cylinders or tanks. These gases were pre-mixed before reaching the calibration source.
I2 was generated either from a homemade permeation tube or a commercial permeation tube (VICI Metronics). A stream of nitrogen (50 m3 min−1) was passed over the permeation tube at controlled temperatures ranging from 120 to 140 ∘C. The temperature of the permeation tubes was regulated using an electronically controlled heating mantle, allowing for adjustable yet stable iodine concentrations. Water vapour (H2O) was controlled by adjusting the flow of nitrogen through a water bubbler, providing a controllable source of humidity.
The calibration source was mainly used to calibrate H2SO4, HO2, and HOI. The H2SO4 calibration was detailed in Kürten et al. (2012), and the HOI calibration was presented in Tham et al. (2021) and M. Wang et al. (2021). The calibration source in the experimental set-up was constructed using an aluminium box that encloses a in. (1.905 cm) quartz tube. The quartz tube was chosen for its high transmission properties for ultraviolet (UV) light emitted from a mercury lamp. Adjacent to the quartz tube, the mercury lamp is housed in an aluminium block that contains a filter-covered hole. The filter used in the aluminium block allows for high transmission of 185 nm light emitted from the lamp. This specific wavelength of light is effective in photolysing H2O molecules, thus generating OH radicals.
Before conducting the calibration experiment, a mixed flow of nitrogen (N2), oxygen (O2), H2O, and either SO2 or I2 was continuously passed through the calibration source. This flow ensures that the source is thoroughly flushed with the desired gases and vapours, thereby creating a controlled environment for subsequent calibration measurements. The produced OH radicals from the calibration source then undergo reactions with an excess amount of SO2 or a moderate amount of I2 to produce H2SO4 or HOI as the final products, respectively. Additionally, the HO2 radical is produced as a byproduct of the H2SO4 calibration process.
To quantify the concentrations of H2SO4, HOI, and HO2, an open-source Python library based on two-dimensional convection–diffusion–reaction equations was developed (Marine Atmospheric paRticle FORmation and ChEmistry, MARFORCE; Shen and He, 2023). This library aims to provide a framework for performing similar calibration tasks. Furthermore, it also allows users to simulate and predict concentrations of other chemical species by adopting different chemical reaction schemes. The MARFORCE library can be used as a tool in future research endeavours involving flow reactor chemistry simulations.
The SO2 calibration is straightforward. The SO2 flow from the SO2 gas cylinder was diluted with humidified nitrogen, and the mixed sample was fed into the inlet. The normalised SO2•Br− signal was further compared with the estimated SO2 concentration to derive a calibration factor.
To calibrate the absolute concentration of H2O, a dew point mirror hygrometer (DewMaster Chilled Mirror Hygrometer; Edgetech) was employed. The dew point mirror hygrometer drew a sample from a branch of the humidified flow before it entered the MION2 inlet tube. By measuring the dew point temperature, the dew point mirror hygrometer provides an accurate and reliable determination of the absolute H2O concentration in the sample. This calibration method ensures precise measurement of H2O concentration, which is important for accurate analysis and interpretation of the experimental data.
2.2.2 Development of an iodine source
To calibrate the measured signals of I2•Br− in Br−–MION2, we acquired its stable signals by utilising I2 emitted from a permeation tube, which was regulated at a constant temperature and subjected to a continuous nitrogen stream (50 m3 min−1).
The key to this calibration is determining the quantities of I2 emitted from the permeation tube. We have previously calibrated the I2 measurement of Br−–MION1 using a cavity-enhanced differential optical absorption spectroscopy (CE-DOAS) instrument (M. Wang et al., 2021), an UV–Vis (visible) spectrophotometer and an inductively coupled plasma mass spectrometer (ICP–MS; Tham et al., 2021; M. Wang et al., 2021). As none of these instruments was available for this study, we further adapted an alternative method.
The collection of the I2 sample followed exactly the same procedure as described in our previous studies (Tham et al., 2021; M. Wang et al., 2021). Briefly, 50 m3 min−1 nitrogen carrier gas flow was passed through an I2 permeation tube for 300 min under 120–140 ∘C. The nitrogen carrier stream containing the released I2 was bubbled through a Schlenk-type impinger charged with 20 mL of hexane kept at −70 ∘C by a dry ice and acetone bath. After completion of the sampling process, the absorption flasks were allowed to warm to the ambient temperature and sealed with a Teflon-coated glass stopper. The solution was stored at 4 ∘C until further processing.
Inspired by Mishra et al. (2000), I2 was converted into a non-volatile and stable derivative, followed by quantification of the latter using gas or liquid chromatography. Mishra et al. (2000) quantified I2 in aqueous matrices by gas chromatography–mass spectrometry (GC–MS) after I2 reacted with 2,6-dimethylaniline to form the corresponding 4-iodo derivative.
An adaptation of this method was required, as the iodine to be determined was diluted in hexane. Specifically, the iodine derivatisation reaction was conducted directly with the hexane solutions in the presence of an aqueous buffer to reduce the losses associated with a hexane-to-water transfer. To avoid any losses of the volatile I2 through evaporation, the reaction was conducted in hermetically sealed headspace vials, with efficient phase mass transfer being facilitated by vigorous magnetic stirring.
Control of the pH of the buffer was crucial for achieving high derivatisation yields, with pH at 7.00 providing the most favourable level of conversion after 2 h. Attempts to perform the derivatisation reaction under homogeneous conditions in hexane in the presence of a variety of soluble organic bases (e.g. tertiary amines) returned poor yields and led to the formation of several side products, most probably due to iodine oxidation. Experiments using 1.00 mL aliquots of the I2 sample solutions under investigation produced the derivative at the limit of detection, precluding a reliable quantification of the derivative by the reverse-phase high-performance liquid chromatography (RP–HPLC–UV).
To improve the analytical sensitivity, 10 mL aliquots of the iodine sample solution were employed for derivatisation. To boost the sensitivity further, a high volume (15 µL) of the concentrated derivatisation solution was injected into the HPLC system. Unfortunately, the hexane in the injection solution and the high injection volume gave rise to retention time instability and peak distortion. Subsequent optimisation of the chromatographic method provided robust reverse-phase chromatographic conditions. Specifically, this was achieved by using relatively weakly eluting isocratic conditions for sample elution, followed by strongly eluting conditions for column cleaning and reconditioning. Using the fully optimised protocol, the derivative could be readily quantified for 0.17 to 11.05 µg mL−1 initial iodine concentrations, with the LOD (limit of detection) and LOQ (limit of quantification) being 0.012 and 0.035 µg mL−1. Using this method, the hexane solution obtained by absorption of iodine from the permeation tube was found to contain 0.26 µg iodine per millilitre. Considering a total sample volume of 20 mL, the iodine output rate of the permeation tube under the employed conditions was calculated to be 17.3 ng min−1.
It is worth noting that the sensitivity of the current method can be further improved by employing more sensitive separation and/or detection techniques, e.g. liquid chromatography–mass spectrometry (LC–MS) or GC–MS.
2.2.3 Humidity dependence of analyte detection
An integral aspect of the characterisation involves investigating the influence of water on the detection of MION2 when employing the bromide chemical ionisation method. As water is essential in the calibration source to generate OH radicals, which subsequently yield either H2SO4 or HOI, we incorporated an additional dilution flow that merges with the calibration source through a Y-shaped piece (refer to Fig. A3). This experimental configuration allows for the alteration of the absolute humidity of the sample, independent of the OH production rate in the calibration source. During the experiments with varying humidity, the total flows of the dilution part and the flow reactor section were kept constant, while the relative humidity of the dilution flow was varied by mixing different combinations of dry and humidified flows. By employing this approach, we maintained a consistent level of systematic errors arising from the blending of the dilution and sample flows. By comparing the relative signal intensities of analyte-containing ions, we could examine the influence of water on the detection of different analytes (e.g. H2SO4, HOI and HO2).
2.2.4 Quartz flow reactor set-up
In order to study the sensitivity of Br−–MION2 to other oxidised iodine species, e.g. IO, OIO, HIO3, I2O3, I2O4 and HIO2, a quartz flow reactor with an inner diameter of 2.4 cm and a length of 94 cm was used. The residence time inside the quartz tube was 8.5 s. A green LED, with a wavelength of 528 nm, was hung on top and in parallel to the quartz flow reactor to initiate iodine photochemistry. In order to keep the temperature and light uniformity in the quartz flow reactor, the flow reactor was wrapped together with the green LED light by aluminium foil. The schematics of the set-up are shown in Fig. A4.
2.3 MARFORCE model description
As described above, calibration of H2SO4, HO2, and HOI requires a numerical model to simulate the radial diffusion, chemical reactions, and transport in the calibration source and inlet tube. These processes determine the concentration of the analyte and can be simplified into a two-dimensional convection–diffusion–reaction problem. The concept of such a model was illustrated elsewhere (Kürten et al., 2012), specifically for the calibration of H2SO4. Our earlier studies also presented a numerical model for HOI calibration with similar principles, but a simplified iodine chemistry scheme was instead implemented (Tham et al., 2021; M. Wang et al., 2021). Nevertheless, neither of these studies made their calibration scripts publicly accessible, and the scripts lack adaptability for different chemistry schemes. Consequently, we have developed an open-source two-dimensional flow reactor model named MARFORCE to address these limitations. MARFORCE is built in Python and hosted on GitHub (Shen and He, 2023), allowing free access to interested users. The model comprises two main components, namely (1) the fluid dynamics simulation module and (2) the gas-phase photochemistry module.
2.3.1 Convection–diffusion–reaction equation
The convection–diffusion–reaction equation has been derived and discussed extensively in the literature (Gormley and Kennedy, 1948; Kürten et al., 2012) and is only briefly discussed here.
where i corresponds to a specific chemical (e.g. H2SO4), ci is the concentration, Di is the diffusion coefficient, r is the distance in the radial direction, R is the radius of the flow reactor, Q is the total flow in the flow reactor, z is the distance in the axial direction, and P shows the production (positive values) or loss (negative values) rate due to chemical reactions. As the flow in tangential direction is symmetrical, the term has been ignored.
The diffusion coefficient in the model can be defined in the following three ways: (1) defined manually, using experimental values; (2) calculated by kinetic theory; or (3) calculated based on elemental composition using Fuller's method (Fuller et al., 1966).
The convection and diffusion processes were validated against a theoretical prediction by Alonso et al. (2016). A fixed amount of H2SO4 was set at the first cross section of the MARFORCE simulation, and H2SO4 was further carried to the outlet of a cylinder only by convection and diffusion processes. Comparing the H2SO4 profiles at the outlet yields on average a 0.4 % difference between the MARFORCE model and the theoretical prediction by Alonso et al. (2016, Fig. A5). This suggests that the convection and diffusion processes in the MARFORCE model are well simulated.
2.3.2 Gas-phase photochemistry
The photolysis and chemical reactions in the H2SO4, HO2 and HOI calibrations can be simulated by a set of differential equations which describe the production and loss of various species. To make the MARFORCE model more versatile, the model was designed to accommodate the input file format from the Master Chemical Mechanism (MCM; Jenkin et al., 1997; Saunders et al., 2003), a near-explicit chemistry mechanism for numerous organic precursors. The scripts used to compile and interpret MCM mechanisms were adapted from O'Meara et al. (2021). The input file extracted from MCM is reshaped, and the reaction equations, reaction rate coefficients, reactants, products, their indices, and stoichiometric numbers are generated accordingly. The temperature and pressure dependence of reaction rate coefficients are taken into consideration. Finally, differential equations for each species based on its production and loss processes are produced and solved. Additionally, the MARFORCE model leaves an option to set abundant species as constants, so their concentrations are assumed uniform and homogeneous in the flow reactor. These species include, for example, O2, N2, SO2, I2, and H2O in the H2SO4 and HOI calibration experiments. With its flexibility, the MARFORCE model can be readily adapted to simulate organic oxidation or any other experiments using a laminar flow reactor.
There are two default chemistry schemes provided in the MARFORCE model, and they are used for the H2SO4 calibration and HOI calibration, respectively. The reaction rate coefficients utilised in these two schemes are tabulated in Table A1. The most important procedure of these calibration experiments is to obtain the OH concentration. The OH concentration is determined by the photon intensity produced by the calibration source (It-product) and the absolute water content in the air passing through the calibration source. It-product refers to the product of UV light intensity at 185 nm and effective illumination time. In this study, we derived the It-product from the N2O experiment, which was conducted under the same conditions as the H2SO4 calibration experiments. The details of the It-product determination can be found in Kürten et al. (2012). In brief, the chemical actinometry method was employed, which involves the conversion of N2O to NOx (primarily NO), to determine the light intensity. Since NO exhibits lower reactivity compared to OH and can be conveniently measured using commercial NOx monitors, the It-product can be derived accordingly. Considering that the calibration experiment duration is relatively short (a few hours) compared to the potential lifetime of the mercury lamp, it is reasonable to assume that the attenuation of the It-product over time is negligible.
The OH initial concentration is further defined as
where is the absorption cross section of water vapour, cm2 (Creasey et al., 2000), and is the quantum yield (unity in this case).
2.3.3 Flow mixture
In addition to its ability to simulate a standard cylindrical flow reactor with uniform size, the MARFORCE model also possesses limited capabilities in two specific conditions, including (1) simulating two interconnected flow reactors with varying sizes; the model is capable of simulating scenarios where two flow reactors of different sizes are connected. Moreover, (2) simulating reactions when a dilution flow is merged with the sample flow through a Y-shaped tee is also possible. These additional features enhance the versatility of the MARFORCE model, allowing for a more comprehensive analysis of complex flow reactor systems.
The first design aims to cope with the different sizes of the chemical ionisation inlet and the calibration source itself. For example, the MION2 inlet utilises a KF25 connector with an inner diameter of 24 mm, while the calibration source utilises a in. (1.905 cm) tube with an inner diameter of 15.6 mm. Our model considers an instantaneous transition between the tubes of different sizes; i.e. the chemical distributions at the last cross section of the first cylinder are copied into the first cross section of the second cylinder, while the axial flow speed is adjusted to the cross section of the second cylinder. As this simplification ignores the convective transport of species to the walls at the transition region, it likely gives the concentration upper limit at the pinhole of the mass spectrometer. Since the inner diameter difference between the calibration source and the MION2 inlet is relatively small in this study, we expect that the resulting uncertainty is well within the overall systematic uncertainty of −50 %/+100 %.
The second design considers that an additional dilution flow is utilised to reduce the sample water content when entering the Br−–MION2 inlet. Similarly, we assume an instantaneous transition at the spot where the dilution flow is added. In this case, both the chemical distribution and axial flow speed are changed, since a new branch of flow is added. The simulation is carried out with a two-process procedure, i.e. before and after the dilution. First, we carry out a standard simulation before adding the dilution flow. Once the flow is fully developed and the chemical distribution reaches a steady state in the simulation, the last cross section at the grid right before adding the dilution flow is stored and recalculated into the first cross section of the next simulation. The second simulation is further carried out after considering the dilution flow, together with the changes in chemical distribution and axial flow speed.
It should be noted that the fluid dynamics processes are overly simplified in the second design, and therefore, this option should be used with caution. In this study, this option is necessary only because investigating the detection humidity effect of e.g. H2SO4, HO2 and HOI requires adding a dilution flow after the calibration source. In order to estimate the magnitude of error caused by the simplification of fluid dynamics, we carried out experiments comparing calibration results obtained with the first design (straight tube) and the second design (Y piece), and the results are shown in Fig. A6. We find that the second design additionally introduces a 12 % higher calibration factor in the H2SO4 calibration and a 27 % higher calibration factor in the HOI calibration when compared with the calibrations using the first design. Therefore, the application of the second design for the purpose of this study is reasonable and does not introduce excess uncertainties. This mainly concerns the H2SO4, HO2 and HOI calibration experiments.
2.4 Quantum chemical calculations
Cluster fragmentation enthalpies were calculated using quantum chemical methods. The initial conformational sampling was performed using the Spartan'18 program. The cluster geometry was then optimised using density function theory (DFT) methods at the ωB97X-D/aug-cc-pVTZ-PP level of theory (Chai and Head-Gordon, 2008; Kendall et al., 1992). Iodine and bromine pseudopotential definitions were taken from the Environmental Molecular Sciences Laboratory (EMSL) basis set library (Feller, 1996; Peterson et al., 2003). Calculations were carried out using the Gaussian 16 program (Frisch et al., 2016). An additional coupled-cluster single-point energy correction at the DLPNO-CCSD(T)/def2-QZVPP (Riplinger and Neese, 2013; Riplinger et al., 2013; Weigend and Ahlrichs, 2005) level of theory was carried out on the lowest energy conformers to refine the DFT calculated enthalpies. The coupled-cluster calculation was performed using the ORCA program version 4.2.1 (Neese, 2012).
The master equation solver for multi-energy well reactions (MESMER) program was used to investigate the ionisation chemistry of . For the complex, Lennard–Jones potentials of σ = 6.5 Å and ϵ = 300 K were used, which are identical to those used previously for similar iodine systems (Gálvez et al., 2013). The MesmerILT method was used with a pre-exponential value of cm3 molec.−1 s−1, which is equal to the I2O3 + collision rate calculated using the average dipole orientation (ADO) method. Varying the collision rate by a factor of 3 has no effect on the MESMER results, indicating that the reported final fragmentation rate coefficients of are not sensitive to the accuracy of the computed collision rate.
3.1 Calibration of H2SO4, HOI, and HO2 using MARFORCE
Gaseous H2SO4 concentration is regularly measured around the globe using the nitrate chemical ionisation method. In this study, a direct H2SO4 calibration has been carried out for the MION2 inlet at tower 1, using either Br− (Br−–MION2–T1; Fig. A3) or (–MION2–T1) chemical ionisation methods, and additionally at tower 2 with the Br− (Br−–MION2–T2; Fig. A7) chemical ionisation method. The MARFORCE model is utilised to simulate the evolution of various species at the cross section of the inlet tube, as shown in Fig. 2. The actual H2SO4 concentrations can be calculated by correlating the count rates, which represent the ratio of the measured H2SO4 signals to primary ions. Subsequently, the predicted H2SO4 concentrations are compared with the measured normalised signals to derive calibration factors (Table 1).
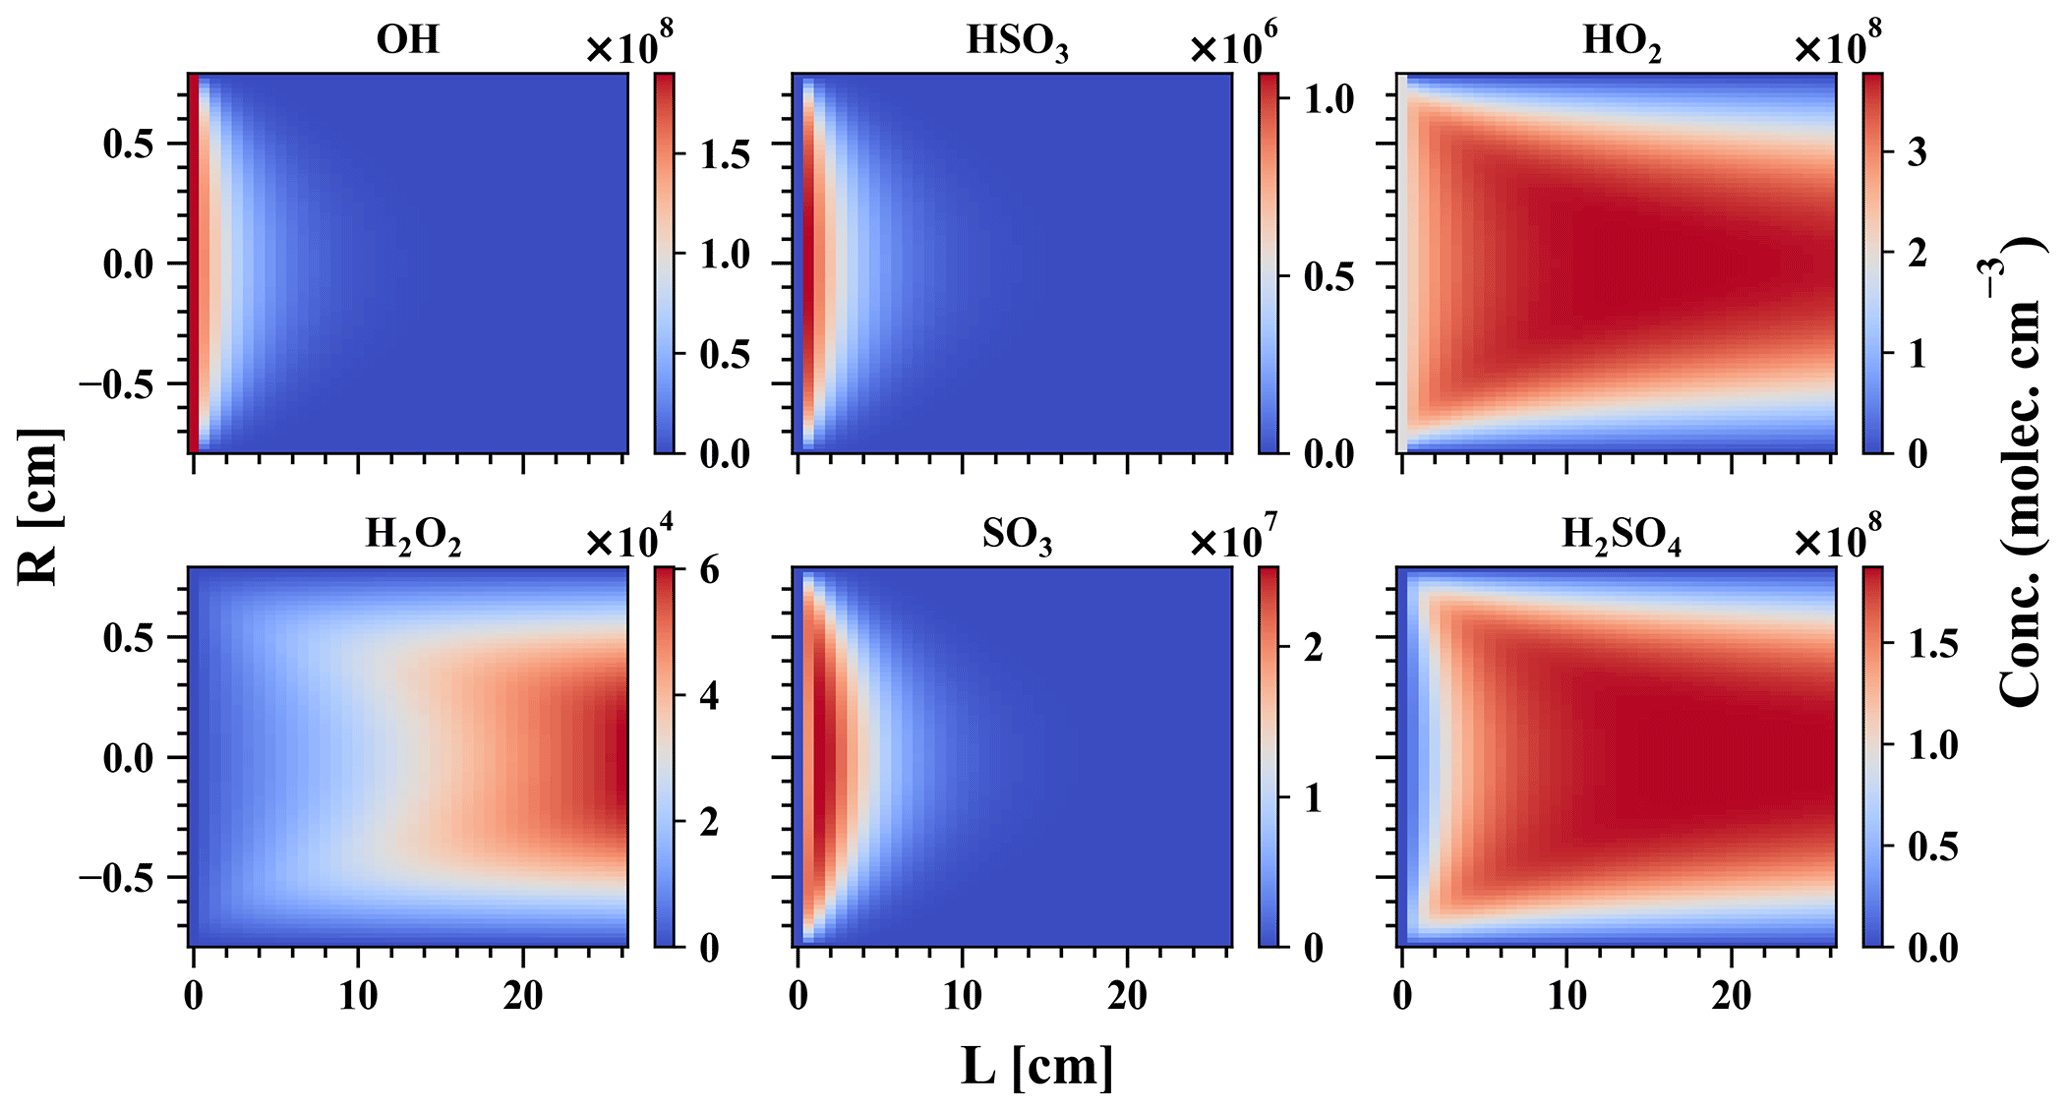
Figure 2MARFORCE simulation results of a H2SO4 calibration experiment. The x axis shows the distance from the UVP pen-ray lamp to the entrance of the chemical ionisation chamber, and the y axis shows the distance in the radial direction. Conditions for the simulation are R = 0.78 cm, L = 26 cm, sample flow = 10.6 L min−1, cm−3, cm−3, and cm−3.
Table 1Calibration factors and detection limits for selected species measured by the MION2 inlet and Eisele-type inlet. It should be noted that the reported numbers are specific to the experimental conditions and instrument tuning in our experiments. Different instrument tuning can result in different calibration factors and detection limits. Undesired impurities may result in elevated detection limits, despite the calibration factors being the same for the analytes. Therefore, these numbers should not be applied to another study without carrying out the same calibration experiments described in this study.
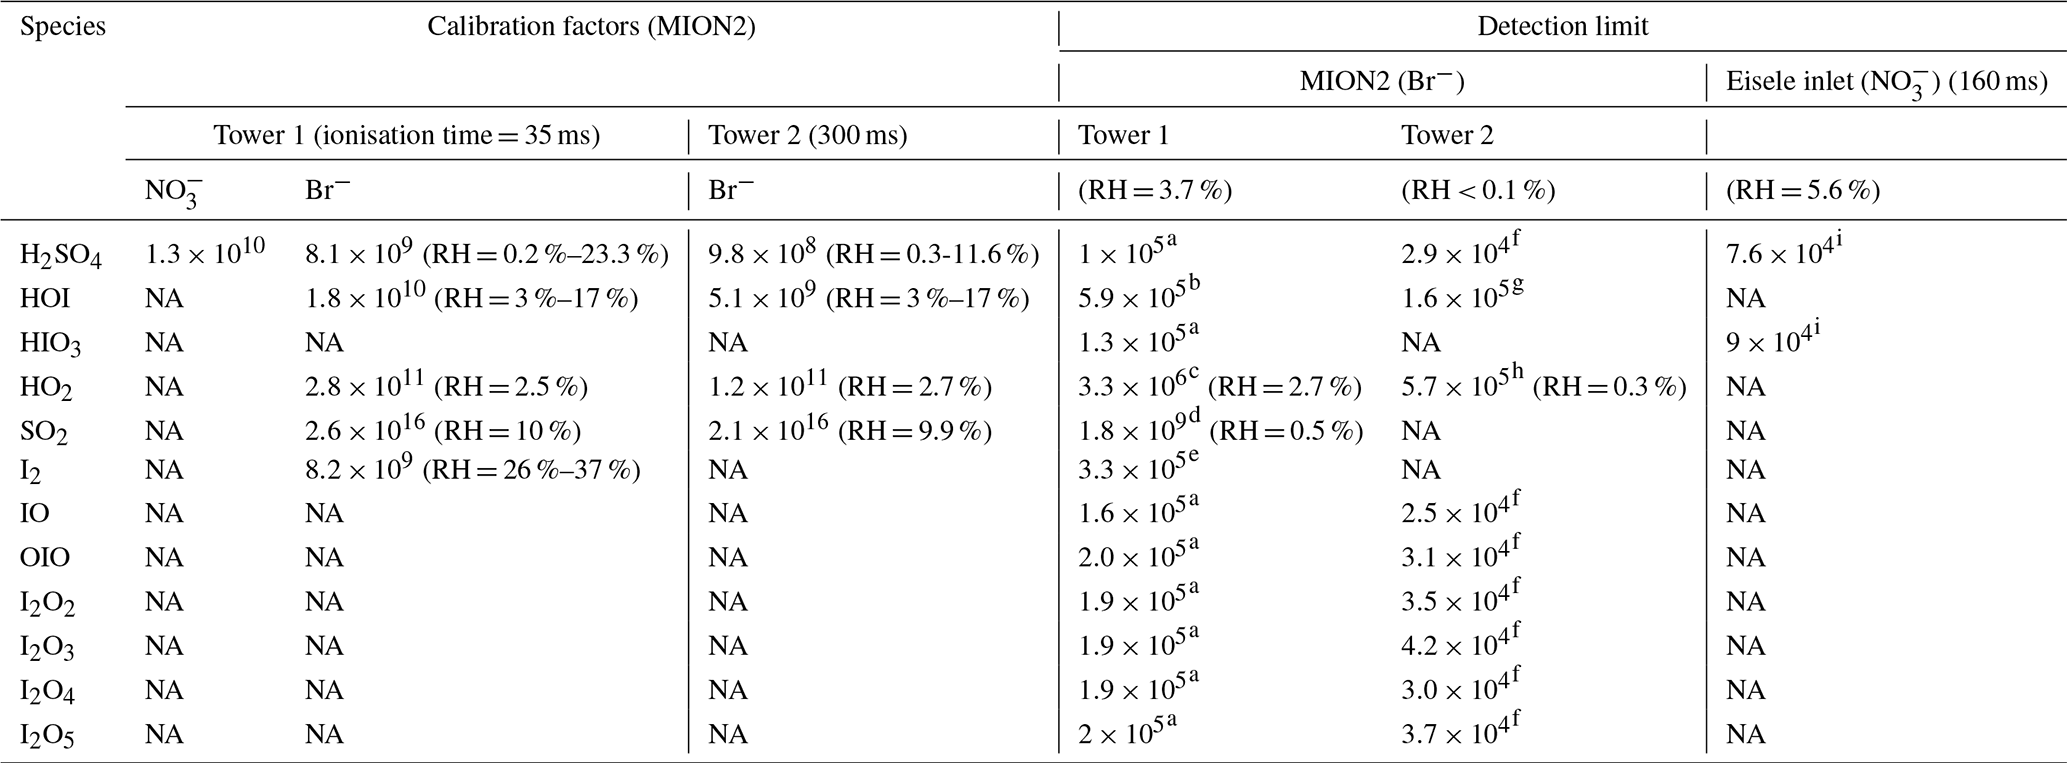
Units are given in molecules per centimeter cubed; NA stands for not available. The experiments were conducted at room temperature. The H2SO4 calibration factor is applied to estimate the detection limits of iodine oxides. Since iodine oxides may not be detected at the kinetic limit, their LOD are mere estimations and can be higher than the reported values in this study. The detection limits are estimated with 1 min data and 1 h data collection time. The RH reported in this table is calculated at 25 ∘C. The calibration factors and LOD have a systematic error of a factor of 2 (−50 %/+100 %).
Calibration factors used for the LOD calculation are as follows:
a 8.1×10⁹, b 1.8×10¹⁰, c 2.8×10¹¹, d 1.03×10¹⁴, e 8.2×10⁹, f 9.8×10⁸, g 5.1×10⁹, h 4.1×10¹⁰, and i 3.5×10⁹. H2SO4 calibration factor is applied to estimate the detection limits for iodine oxides. Since iodine oxides may not be detected at the kinetic limit, their LOD are mere estimations and can be higher than the reported values in this study. The detection limits are estimated with 1 min data and 1 h data collection time.
The derived calibration factor for Br−–MION2–T1 (8.1×10⁹) is approximately 8 times higher than that of Br−–MION2–T2 (9.8×10⁸). This observation is consistent with the fact that the ionisation time from tower 2 to the pinhole (around 300 ms) is roughly 8.6 times longer than that of tower 1 (35 ms). A longer ionisation time leads to a greater conversion of Br− and H2O•Br− into H2SO4•Br− or , resulting in a lower calibration factor.
In the case of –MION2–T1, it exhibits a similar sensitivity to H2SO4 detection as Br−–MION2–T1. This similarity is likely due to the consistent ionisation time (using tower 1) for both methods, since both the and Br− chemical ionisation methods measure H2SO4 at the collision limit, as mentioned in previous studies (Kürten et al., 2012; M. Wang et al., 2021).
Sanchez et al. (2016) reported that the bromide chemical ionisation mass spectrometer (Br−–CIMS) is capable of detecting HO2 radicals at ambient relevant concentrations. In this study, we calibrated HO2 together with H2SO4, as HO2 is a byproduct in the chemical production of H2SO4 (see Table A1). As the binding of HO2 with Br− is significantly weaker than that of H2SO4 with Br−, the collision-induced fragmentation of HO2•Br− in the ion optics of the mass spectrometer is larger (Passananti et al., 2019). Additionally, as the humidity effect of HO2 will be shown to be strong in Sect. 3.3, the calibration factor of HO2 has to be derived with respect to a specific humidity level. The derived HO2 calibration factors at 2.5 %–2.7 % RH (25 ∘C) are 2.8×10¹¹ and 1.2×10¹¹, respectively, for Br−–MION2–T1 and Br−–MION2–T2 (Table 1).
The HOI calibration was also carried out using the H2SO4 calibration source, except that the SO2 source was replaced with an I2 source. As can be seen in Fig. 3 and Table 1, the calibration factor for HOI is roughly 2 times that of H2SO4. This suggests that HOI is detected close to the collision limit. It is worth noting that we find the instrument setting affects HOI detection significantly, since HOI is not strongly bonded to Br−. The preferred fragmentation pathway is HOI•Br− → HOI + Br− (Table 2), and thus a fraction of HOI•Br− dissociates into HOI and Br− after passing the ion optics of the mass spectrometer. A more fragmentation-oriented setting can result in a higher fraction of HOI•Br− becoming lost in the ion optics, thus resulting in a higher calibration factor, i.e. lower sensitivity. As an example, in our earlier studies (Tham et al., 2021; M. Wang et al., 2021), we used a relatively higher fragmentation settings compared to the one used in this study in an attempt to reduce (H2O)n•Br− clusters and other water-associated clusters. This experimental set-up led to a calibration factor for HOI that was 8 times higher than the calibration factor for H2SO4.
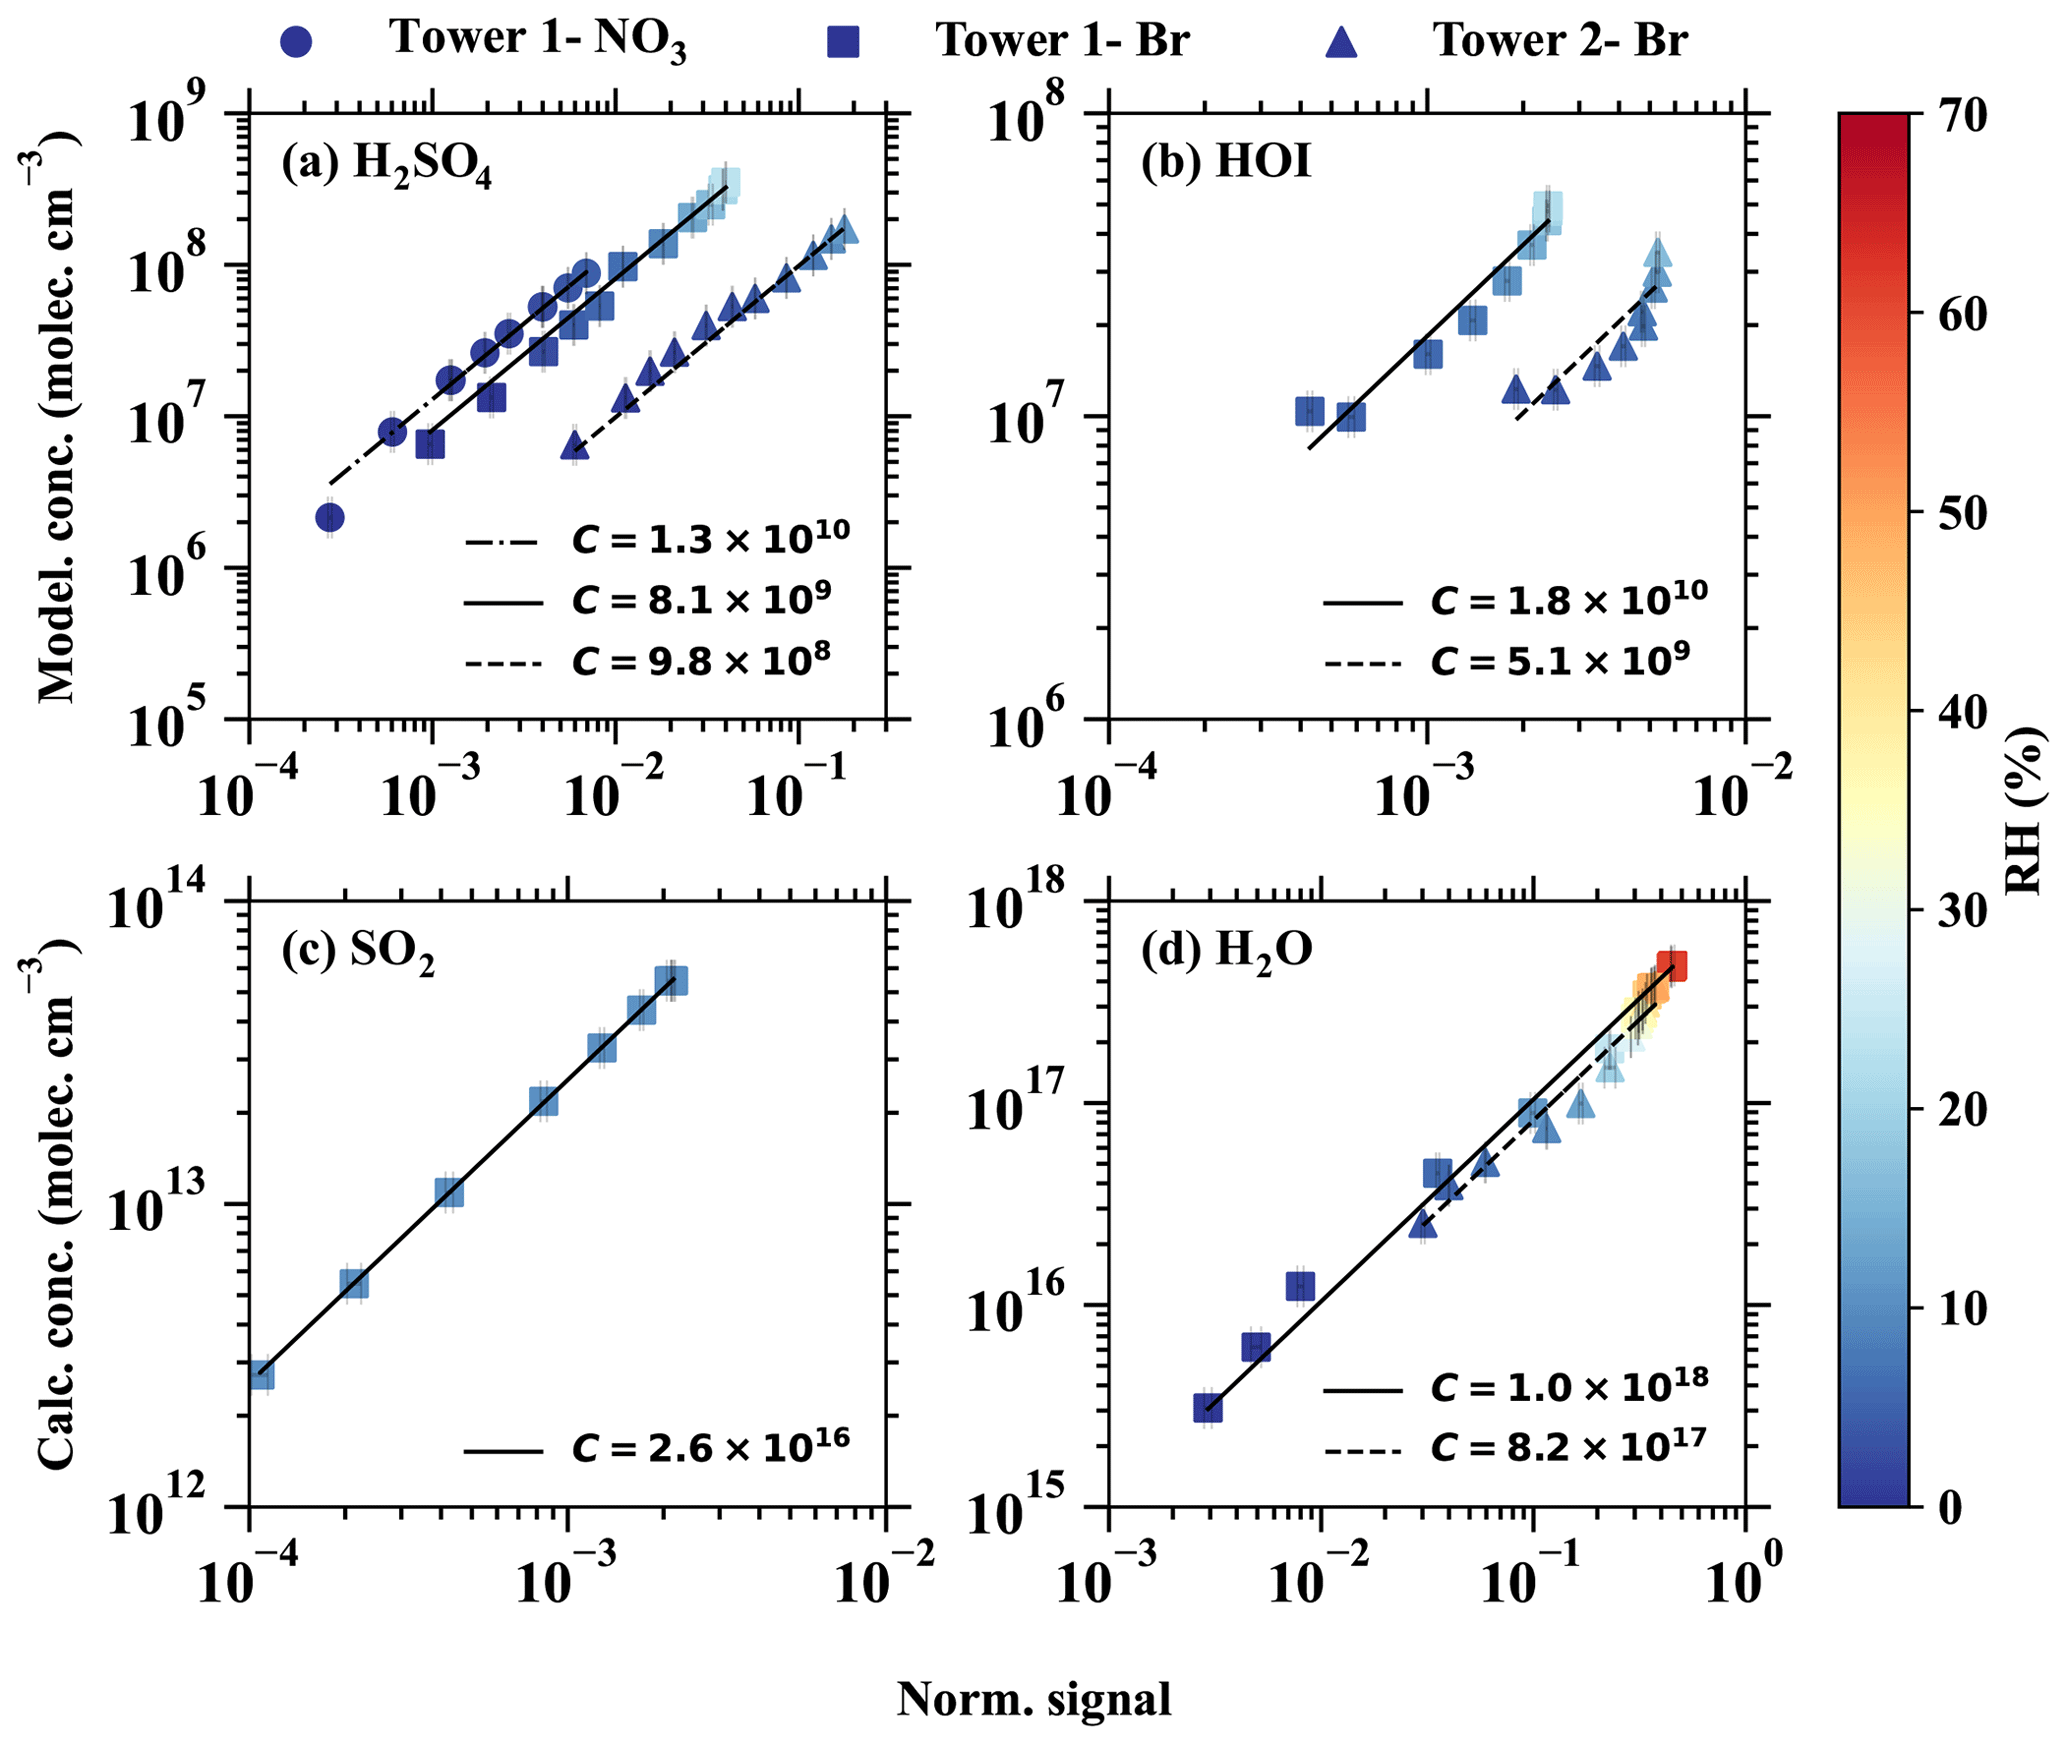
Figure 3The modelled or calculated vapour concentrations vs. the normalised signals for (a) H2SO4, (b) HOI, (c) SO2, and (d) H2O. The dashed–dotted, solid, and dashed lines are the linear fits of the results from different inlet modes, namely (1) tower 1 with the chemical ionisation method, (2) tower 1 with the Br− chemical ionisation method, and tower 2 with the Br− chemical ionisation method. The slopes of the fitted lines represent the calibration factors, as shown in the legend. The colour bar shows the relative humidity in the calibration experiments.
Table 2Fragmentation enthalpies (the opposite of binding enthalpies) of analytes with the Br−. The cluster geometry was optimised at the ωB97X-D/aug-cc-pVTZ-PP level of theory at 298.15 K (Chai and Head-Gordon, 2008; Kendall et al., 1992). The enthalpies were calculated at the DLPNO-CCSD(T)/def2-QZVPP at 298.15 K.
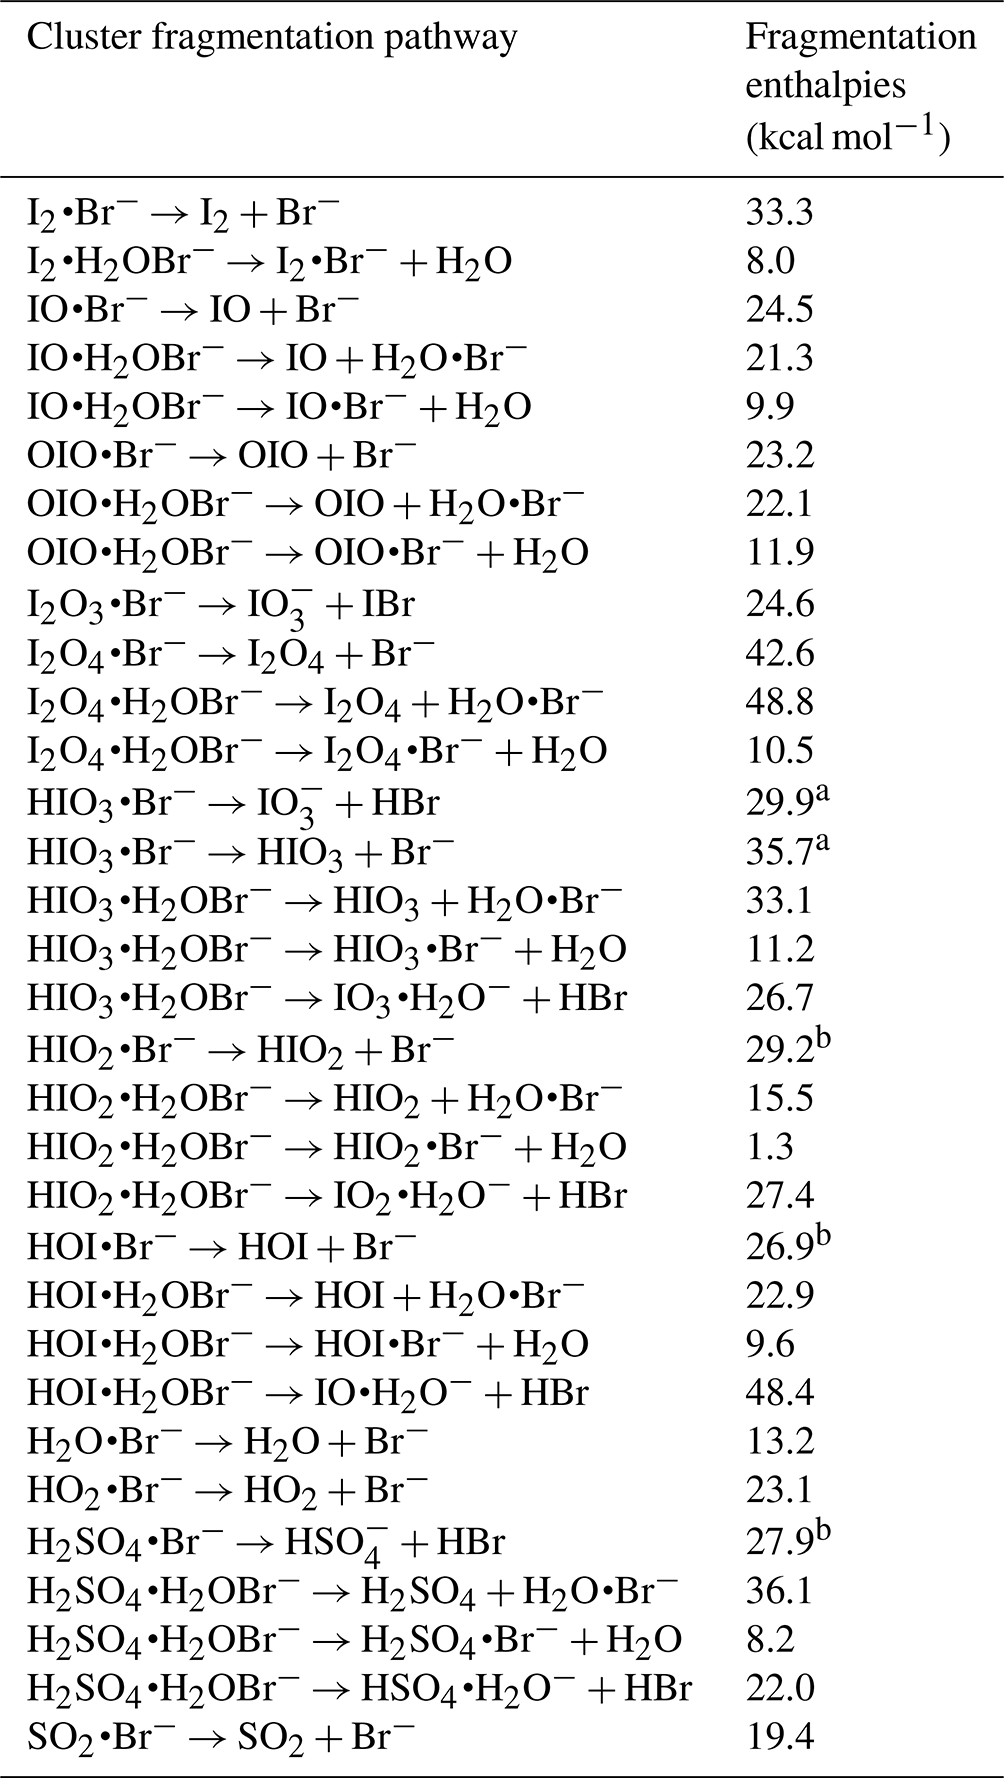
a The fragmentation enthalpy is updated from M. Wang et al. (2021) as a lower-energy HIO3•Br− cluster geometry, which has an additional Br–I interaction, has been located in this study. b Value adopted from M. Wang et al. (2021).
3.2 Calibration of H2O and SO2
H2O•Br− is a regular peak and one of the primary ions measured by the Br−–MION2. Br−–MION2 is, therefore, able to measure absolute water content if the H2O•Br− signal is calibrated against a dew point mirror instrument. Such a calibration has at least two purposes. (1) The calibrated H2O•Br− : Br− can be used as an indicator of the fragmentation level of the Br−–MION2, and (2) compared to regular relative humidity sensors and dew point mirrors, Br−–MION2 exhibits higher sensitivity towards H2O. In this study, the calibration of H2O was performed for both Br−–MION–T1 and Br−–MION–T2, as illustrated in Fig. 3. Interestingly, the calibration factors for both towers did not show significant differences. This can be attributed to the presence of an excess amount of H2O, which establishes a rapid equilibrium with Br− and H2O•Br−, irrespective of the ionisation time.
As a reasonable binding enthalpy of SO2•Br− was predicted using quantum chemical calculations (Table 2), we continued to check whether the Br−–MION2 allows us to detect SO2. A variable amount of SO2 was mixed with a fixed amount of dilution flow at a constant relative humidity (RH = 10 %) which was measured by the Br−–MION2. Clear SO2•Br− was measured, and it increased linearly with the SO2 concentration in the sample flow (Fig. 3). However, the calibration factor of SO2 is roughly 6 orders of magnitude higher than that of H2SO4 at 10 % RH. This is consistent with the weaker binding of SO2•Br− compared with H2SO4•Br−. Additionally, SO2 calibration is extremely sensitive to RH changes, as can be seen in Fig. 4. In this study, the best achieved detection limit was 9.4×107 cm−3 at an RH below 0.1 %. Theoretically, it is possible to enhance the sensitivity even further by reducing the absolute water content.
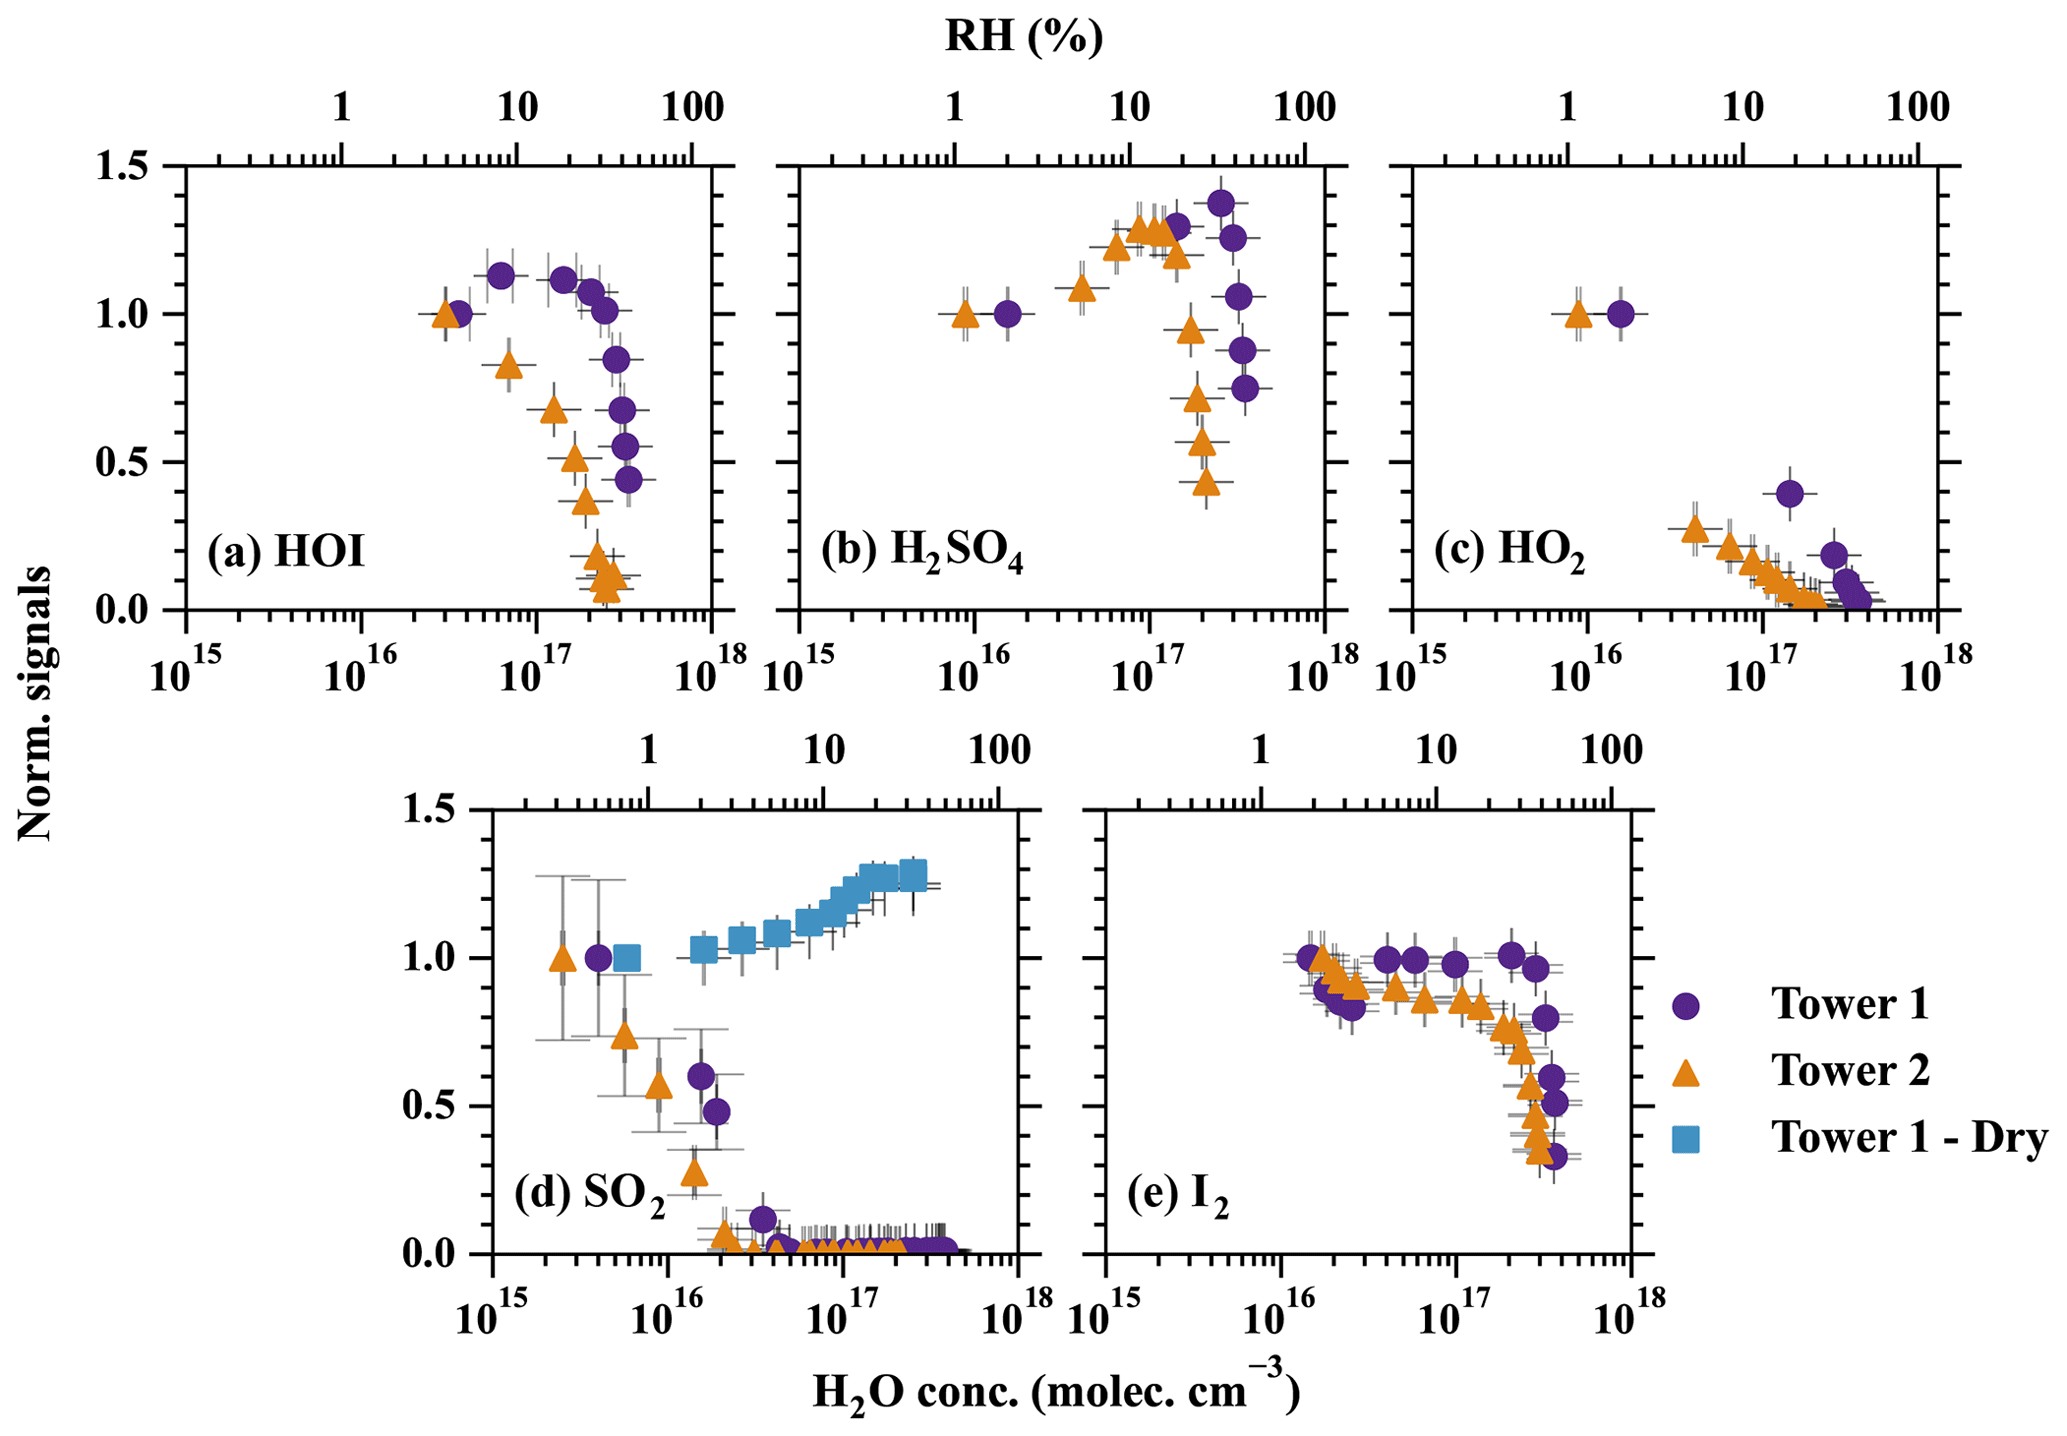
Figure 4The effect of humidity on the detection efficiency of (a) HOI, (b) H2SO4, (c) HO2, (d) SO2, and (e) I2. The measured signals in each set of experiments are normalised by the signal at the lowest RH. Therefore, the normalised signals represent how the increasing RH is affecting the detection limit compared with the initial point. The purple circles and orange triangles show the detection humidity effects of tower 1 and tower 2, respectively. The blue squares refer to the experiments conducted with a dry flow added before the MION2 inlet. The RH is converted from absolute H2O concentrations at 25 ∘C. Error bars represent 1 standard deviation.
3.3 Detection humidity effect
The measurement sensitivity of the halide anion-based chemical ionisation method was regularly reported to be affected by atmospheric water content (Kercher et al., 2009; Mielke et al., 2011; Woodward-Massey et al., 2014; Lee et al., 2014). The humidity effect of atmospheric pressure Br−–MION2 could be amplified due to the higher water content present in air samples. Although M. Wang et al. (2021) demonstrated that the detection of I2 by Br−–MION1 was not affected within a limited humidity variation (40 %–80 % RH at −10 ∘C), characterisation under a wider range of humidity conditions is needed. As the detection humidity effect in this study exclusively refers to the effect of absolute humidity instead of relative humidity, absolute humidity parameters such as the dew or frost point or H2O molecule concentration are commonly presented together with the relative humidity (at 25 ∘C, unless indicated otherwise).
In this study, we examine the detection humidity effect of H2SO4, HOI, HO2, SO2, and I2 with RH from below 1 % to 60 % at 25 ∘C. Unlike H2SO4, HO2, and HOI, which require generation from a calibration source, both SO2 and I2 have their own standardised sources. This simplifies their control during the characterisation of the detection humidity effect. Therefore, a straight flow reactor is used to premix the analyte containing air sample to the Br−–MION2 (Fig. A2). It is worth noting that we do not account for the wall loss of SO2 and I2 in the analysis. The wall loss of SO2 is negligible at the timescale of the calibration processes (a few seconds). Despite I2 vapour being able to both condense on and evaporate from the walls of the flow reactor, equilibrium can be achieved given a sufficient amount of time. In our experiments, it took up to 24 h to reach equilibrium. Once equilibrium is established, the condensation and evaporation of I2 balance each other out, making the estimation of I2 concentration straightforward.
On the other hand, the characterisation of the detection humidity effect of H2SO4, HOI, and HO2 is more challenging, as the production of these species is nearly proportional to the amount of H2O passing the calibration source. Therefore, an experimental apparatus was built, which enabled humidifying the air sample after the calibration source without disturbing HOx production processes in the calibration source (Fig. A3).
The results of the humidity characterisation are shown in Fig. 4. Although only five species were characterised and observed for their distinct humidity sensitivity, a general conclusion can be drawn that applies to essentially all of the species; i.e. an excessive amount of water content leads to a decrease in detection sensitivity. The species with stronger binding with Br− exhibit less sensitivity to changes in humidity (e.g. H2SO4 and I2), while the weakly bonded ones (HOI, SO2, and HO2) are strongly affected. The humidity tolerance of the measured species can be ordered as I2 > HOI > HO2 > SO2, which is the same order as the strength of their bindings with Br− (Table 2).
Interestingly, the detection humidity effect of H2SO4 is observed to be non-linear; i.e. the detection sensitivity of H2SO4 first increases with higher RH but eventually has a sharp drop at around 33 % RH. The enhancement of H2SO4 detection at below ca. 33 % RH could be contributed by two mechanisms. First, the diffusivity of H2SO4 is lower at higher RH (Hanson and Eisele, 2000). A higher RH, therefore, reduces the wall deposition of H2SO4 in the inlet tube, thus effectively increasing the detected H2SO4. This is a universal factor that influences all H2SO4 detection techniques with an appreciable sampling line residence time. The second possibility is that, at low RH regime, H2O enhances H2SO4 detection by offering more modes through which the excess energy of the cluster can dissipate in the formation of H2SO4•Br−, thus resulting in a relatively more stable cluster (Iyer et al., 2017). Regardless of the sources of the detection humidity effect at the low water content regime, the maximum systematic error is measured to be 37 % by comparing the experiment carried out at 2 % RH (frost point of −25 ∘C) and the experiment carried out at 33 % (dew point of 7.6 ∘C) in Fig. 4b. Based on our findings, we anticipate that the detection humidity effect of H2SO4 would be moderate when the dew point is below approximately 7.6 ∘C. However, it is important to exercise caution when conducting measurements under higher absolute humidity conditions.
Additionally, a longer ionisation time by utilising the Br−–MION2–T2 results in a stronger detection humidity effect, as shown in Fig. 4. This phenomenon is the most significant for HOI; i.e. the detection of HOI is more humidity dependent when using Br−–MION2–T2 instead of Br−–MION2–T1. This phenomenon also elucidates the curvature observed in the HOI calibration when employing the MION2–T2 (Fig. 3); the diminished detection sensitivity of HOI counterbalances the augmented HOI production at elevated water content. Although this effect is difficult to quantify, it practically suggests that the Br− chemical ionisation method should employ a shorter ionisation time (i.e. using the T1) when operating MION2 with multiple chemical ionisation methods.
In summary, we find that the detection of Br−–MION2 is strongly affected by air water content. The atmospheric pressure Br− chemical ionisation method is suitable for laboratory experiments where water content is controlled and atmospheric observations in the cryosphere where air water content is low. Nevertheless, the humidity effect should be considered individually for different analytes, and the binding enthalpy between the analyte and Br− is likely a good indicator. As the –MION2 (or the chemical ionisation in general) is known to have minimal detection humidity sensitivity, it is commonly operated together with the Br−–MION2. Performing a cross-check of mutually measured species, such as H2SO4, HIO3, and oxidised organic species, will provide crucial insights into whether and when the detection capability of Br−–MION2 is compromised by the water content in the air. In this context, the new design of Br−–MION2, which enables three chemical ionisation methods to have the same ionisation time, is essential.
3.4 Attempts to reduce the detection humidity effect
Various approaches were explored to mitigate the detection humidity effect. One commonly used method is to employ a low-pressure chemical ionisation system, which has been successfully implemented in iodide chemical ionisation systems (Lee et al., 2014) and bromide chemical ionisation systems (M. Wang et al., 2021). However, reducing the relative humidity (RH) of the air sample comes at the expense of reducing the measurement sensitivity for species detected at the collision limit, such as H2SO4, HIO3, and I2, as the air sample unavoidably undergoes dilution in this process. We estimated previously that the Br−–FIGAERO (Filter Inlet for Gases and AEROsols) inlet had a more than 10 times higher detection limit compared to the Br−–MION1 inlet (M. Wang et al., 2021). For example, the Br−–FIGAERO had a HIO3 detection limit of 5.1×106 cm−3, which struggles to detect atmospheric levels of HIO3 (commonly below 107 cm−3) (He et al., 2021b). The lower level of the detection limit provided by the Br−–MION2 inlet is therefore essential in the detection of iodine species. Another important factor is the reaction of halogen radicals with analytes. Besides halogen anions, halogen radicals can also be produced by chemical ionisation processes. While iodine radical (I•) mostly reacts with halogen species and a minimal number of organic species, the bromide radical (Br•) reacts with a wider range of organic species, as it has a larger reactivity. Conventional low-pressure systems that involve mixing analytes with reagent gases, such as the FIGAERO inlet, can introduce additional complexities when interpreting mass spectra. As a result, alternative approaches were pursued to effectively reduce the detection humidity effect.
The first method is the dilution method. Instead of measuring the air sample directly, a dry dilution flow was mixed with the air sample at the entrance of the Br−–MION2 inlet (see Fig. A4). We tested this method for the SO2 detection with an air sample flow of 1.8 L min−1 and a dilution flow of 20.7 L min−1 (Fig. 4). The x axis for this set of experiments represents humidity in the air sample instead of the humidity after the dilution to compare with the experiments without adding the dilution flow. We observe a significantly reduced detection humidity effect compared to the case without dilution. It is noteworthy that as the air sample was diluted by a factor of 12.5, the detection limit of the instrument is likely enhanced by the same factor. However, since the detection humidity effect for SO2 is significantly higher than other species (e.g. H2SO4, HOI, and I2), the dilution is still effective for SO2 measurement. For example, no SO2•Br− signal would not be measured at 40 % RH (25 ∘C) if the air sample is not diluted but a noticeable signal would be measured if the air sample is diluted. A similar conclusion is likely applicable to other species but with a different optimal humidity cutoff.
The second method is additionally introducing a core-sampling device that uses the air sample as the core flow and a dry synthetic airflow as the sheath flow (Fig. A8). This takes advantage of the fact that H2O diffuses into the sheath flow faster than other analytes with larger molecular weight, thus effectively reducing the RH in the core flow from which the instrument pinhole collects the most sample. Nevertheless, it is important to note that the core-sampling method, while helping to mitigate the detection humidity effect, also leads to a reduction in the SO2•Br− signal. This is because the SO2 itself is diluted, partially counteracting the benefits of the reduced detection humidity effect.
Various sample-to-sheath flow combinations were tested, as presented in Fig. 5. The measured SO2•Br− signal from all sets of experiments was normalised by the experiment with the sample-to-sheath ratio of 21 : 1 at 0.21 % RH (25 ∘C). The results indicate that reducing the sample-to-sheath ratio effectively alleviates the SO2 detection humidity effect. It is observed that different mixing ratios have only a moderate impact on the measured SO2•Br− when the H2O concentration is below 1016 cm−3 (1 % RH), indicating a low-detection humidity effect in such conditions. However, the core-sampling device clearly enhances the SO2 detection efficiency when the H2O concentration is larger than 1016 cm−3. The sample-to-sheath ratio of 1 : 21 enables the effective detection of SO2 at around 4.5×1017 cm−3 (60 % RH) of H2O, while the sample-to-sheath ratio of 21 : 1 is not able to detect SO2 after around 4.3×1016 cm−3 of H2O (6 % RH). Overall, the sample-to-sheath ratio of 1 : 21 is at least 2 orders of magnitude more effective at detecting SO2 when H2O is greater than 2×1016 cm−3. Therefore, the core-sampling method is an effective method for reducing the detection humidity effect of species which are weakly bonded with Br−. Despite the reduced detection humidity effect, it is important to note that the sample water content still impacts the detection limit of SO2. Therefore, dedicated experiments need to be conducted to accurately determine the concentration of SO2.
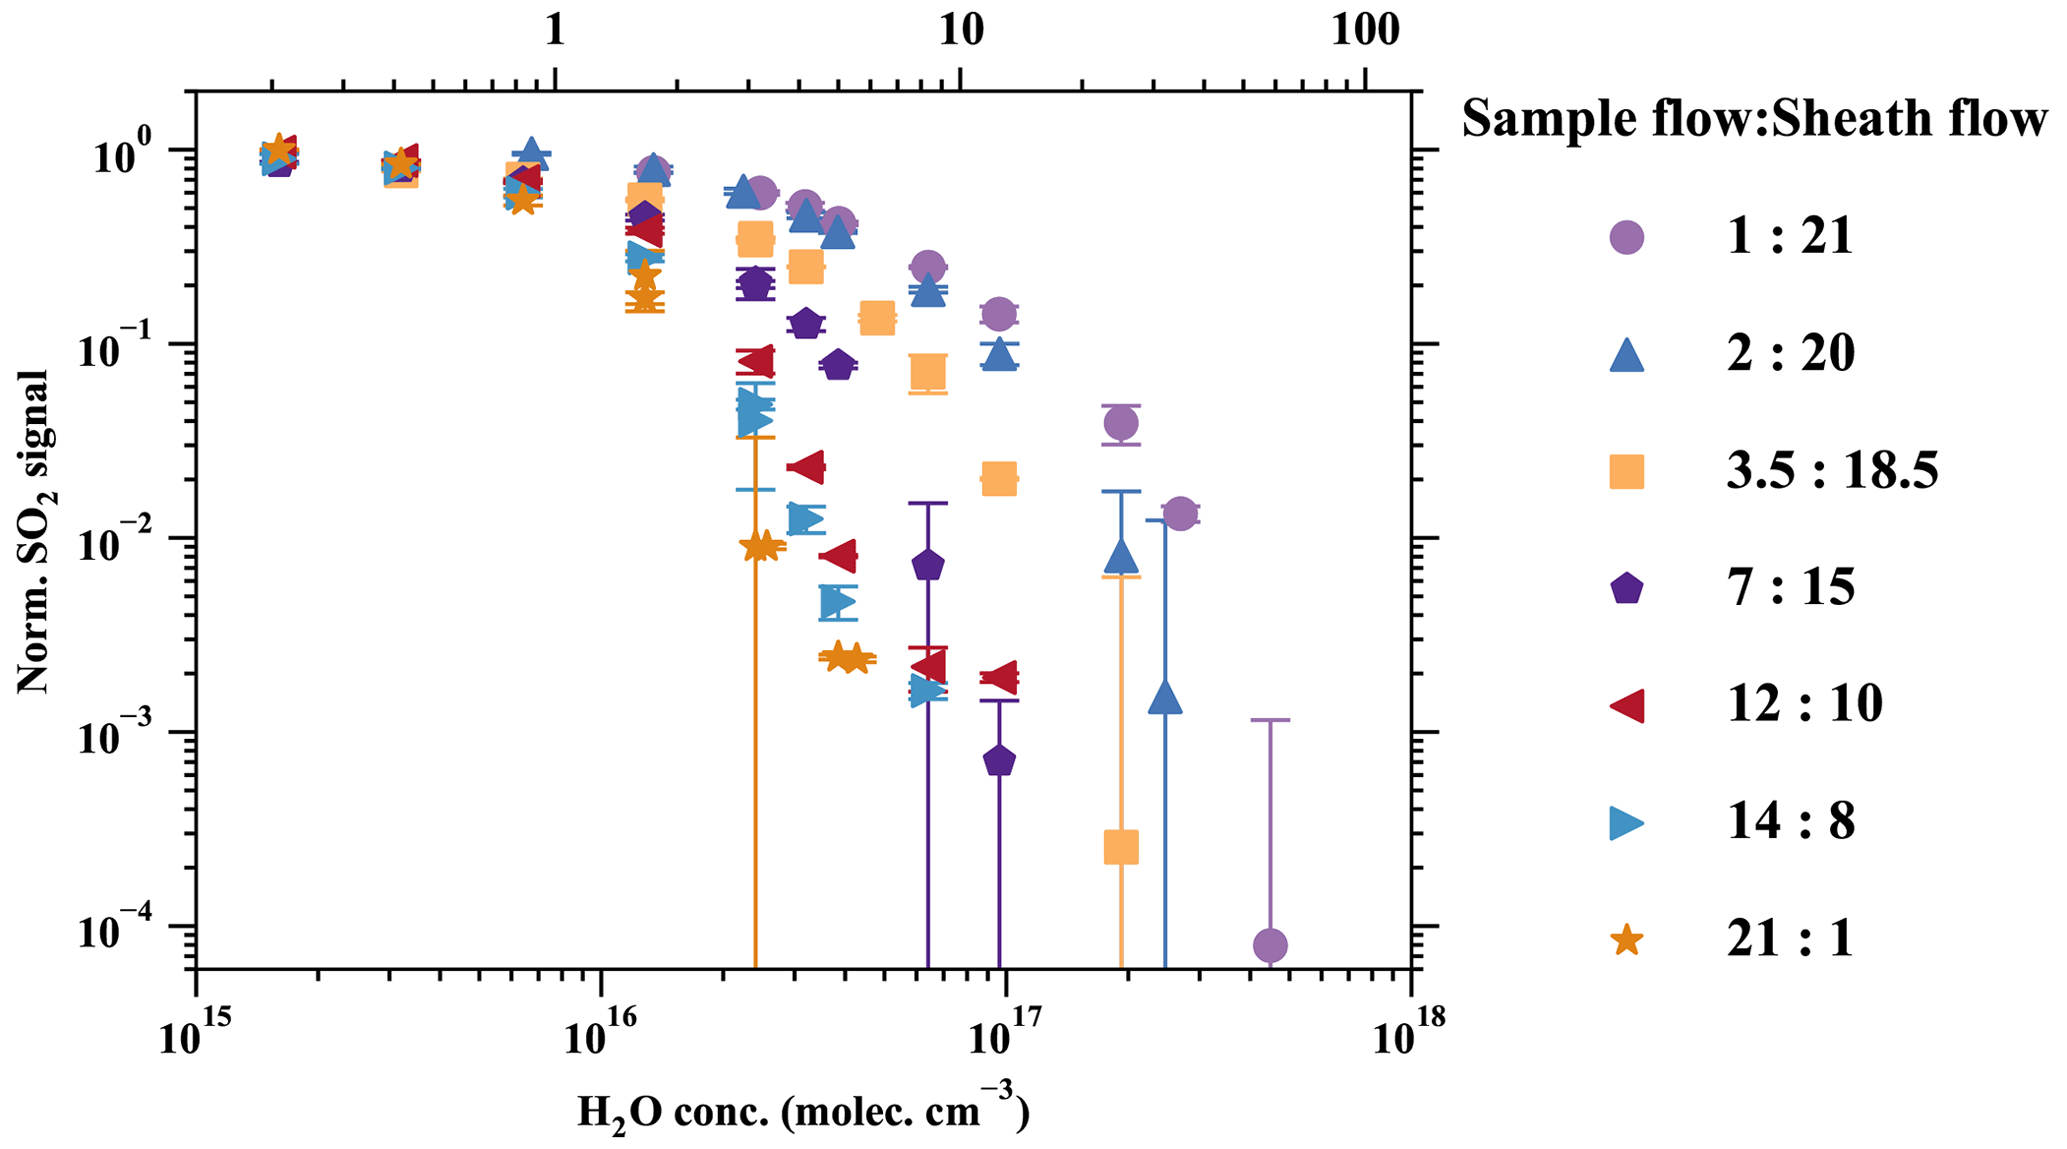
Figure 5Reducing the detection humidity effect with the core-sampling method (Fig. A8). This design takes advantage of the faster diffusion of H2O than SO2 from the sample flow to the sheath flow and effectively reduces the RH in the sample flow. Various sample-to-sheath ratios were tested at different H2O concentrations to find the optimal setting. All the data are normalised to the lowest RH data point in the sample-to-sheath = 21 : 1 experiment. Due to experimental constraints, the sample-to-sheath ratios are (a) 3.5 : 18.5, (b) 2 : 20, and (c) 1 : 21, and experiments started only from the second-, third-, and fourth-lowest RH points, respectively. All other experiments collected data in all humidity conditions. The error bars represent the standard deviation of the normalised SO2 signals.
3.5 Limit of detection
The limit of detection (LOD) is an essential parameter for a chemical ionisation inlet system. For the convenience of intercomparison, we define the LOD in this study as
where μ is the mean value of 1 h mass spectrometric data with a 1 min time resolution, and σ is the standard variation in the same data. Both μ and σ include the experimentally derived calibration factor. The species without direct calibration utilise the calibration factor of H2SO4; thus the LOD for these species generally represent the lower limit. The LOD is determined by introducing pure nitrogen or synthetic air into the chemical ionisation inlet, where none of the species listed in Table 1 is expected to be present. It is important to emphasise that this LOD definition is specifically suitable for distinguishing trace gas concentrations from background levels in long-term observations.
The reported LOD can be affected by many factors. Some of these factors are (1) the purity of the reagent source (e.g. HNO3 or CH2Br2 solution); (2) the purity of the sample air used at the LOD determination experiment; (3) the signal-to-noise (electronic background noise) ratio of the instrument; (4) the fragmentation level (controlled by the tuning of the instrument) of the mass spectrometer; (5) the humidity of the sample air used at the LOD determination experiment (for Br− chemical ionisation method); and (6) different ways of estimating LOD.
Therefore, comparing the LOD derived in this study with earlier studies may not be meaningful. Hence, we additionally compared the H2SO4 LOD of the MION2 inlet with the widely used Eisele-type inlet, which are both attached to the same mass spectrometer (Table 1). The direct comparison suggests that the Br−–MION2–T1 LOD is roughly 30 % higher than the LOD of the Eisele inlet and is thus a comparable performance. When we increased the ionisation time from 35 ms (Br−–MION2–T1) to 300 ms (Br−–MION2–T2), the LOD of Br−–MION2 for H2SO4 is further reduced by a factor of 3; thus, Br−–MION2–T2 performs better than the Eisele inlet. This suggests that the MION2 inlet can achieve a comparable (Br−–MION2–T1) or even better (Br−–MION2–T2) LOD than the Eisele inlet. Additionally, the Eisele-type inlet was regularly shown to have a LOD as low as 104 cm−3 (Jokinen et al., 2012), so a well-performing mass spectrometer may further reduce the LOD of MION2. Nevertheless, the attained LOD are sufficiently low for atmospheric measurements. The molecules in question typically require concentrations above 106 cm−3 to exert a significant influence on atmospheric chemistry and aerosol formation.
3.6 Voltage scanning and cluster formation enthalpy
Collision-induced cluster fragmentation is an unavoidable issue which affects the detection of analytes that are weakly bonded with the reagent ion. Since if a charged cluster is loosely bonded, then collisions between the charged clusters and air molecules in the atmospheric pressure interface may break a large portion of the charged clusters apart prior to reaching the detector (Passananti et al., 2019). Therefore, the charged cluster binding strength is an important factor determining whether an analyte–reagent ion cluster can be measured by the mass spectrometer (Iyer et al., 2016; Lopez-Hilfiker et al., 2016; M. Wang et al., 2021). Lopez-Hilfiker et al. (2016) showed that the level of collision-induced cluster fragmentation is associated with the voltage differences between the first and second quadrupoles in the atmospheric pressure interface of the mass spectrometer. The voltage difference was shown to be indicative of the fragmentation level of the CIMS, and it positively correlates with the cluster formation enthalpy (Iyer et al., 2016).
In this study, we carried out voltage scan experiments with the same procedures as described in Lopez-Hilfiker et al. (2016). Briefly, we kept the voltage differences inside two individual quadruples constant, while changing the voltage difference between these two quadruples to modulate energies in the collision processes, and the results are shown in Fig. 6. Generally, a higher voltage difference indicates a higher fragmentation level, which in turn results in a lower remaining fraction of charged clusters. Charged clusters that are less sensitive to voltage changes, especially in the low-voltage difference regime are more stable.
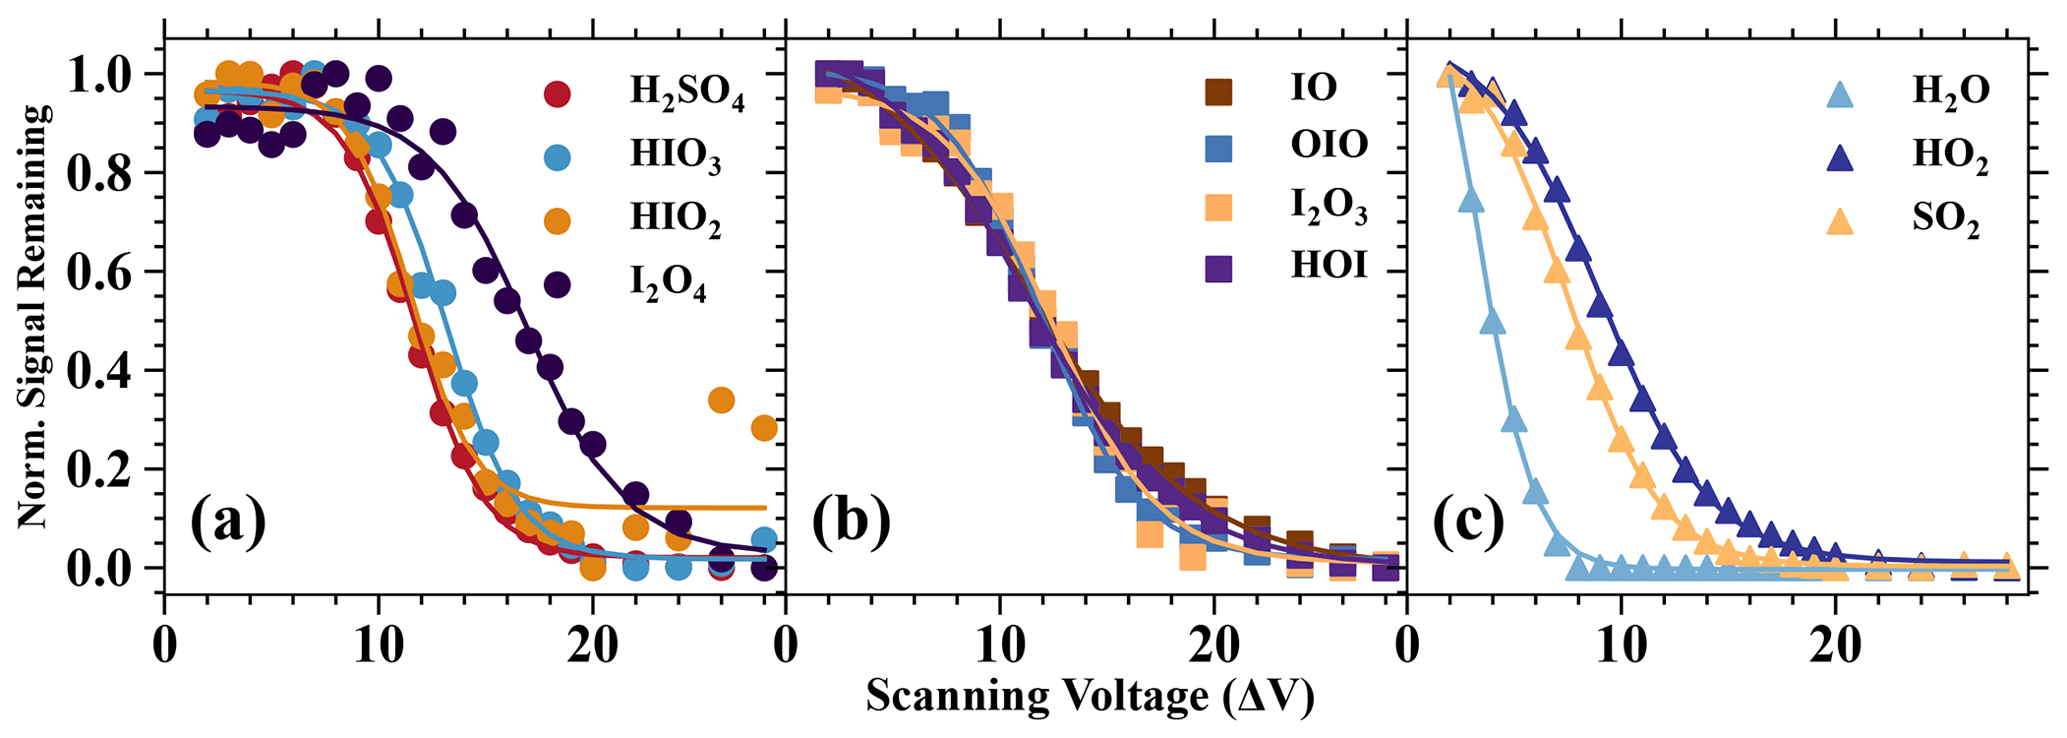
Figure 6Normalised signal remaining vs. the scanning voltage (ΔV). The normalised signal remaining of each species is normalised by the maximum and minimum values of its values with different ΔV (or dV). The ΔV describes the voltage difference between the skimmer, and the second quadruple and can be considered an indicator of the softness of the instrument tuning (Lopez-Hilfiker et al., 2016). A higher ΔV commonly indicates a more fragmenting setting.
A series of iodine oxides and oxoacids is evaluated together with other inorganic species, such as H2O, HO2, SO2, and H2SO4 (Fig. 6). Based on the results, we categorise the analytes into the following three categories: (1) analytes which are strongly bonded with Br−, (2) analytes which are moderately bonded with Br−, and (3) analytes which are weakly bonded with Br−. The species H2SO4, HIO3, HIO2, and I2O4 can be classified into the first category, since the initial change in voltage difference does not have a significant impact on the normalised signal. This indicates that these species are detected at the collision limit. It is also apparent that H2O, HO2, and SO2 belong to the third category, since a small increase in the voltage difference leads to substantially reduced normalised ratios. Finally, IO, OIO, I2O3, and HOI are moderately bonded with Br−. These moderately bonded charged clusters can reach a close to collision limit detection if the instrument is softly tuned (the voltage difference is small), but their detection sensitivity can change dramatically if the instrument fragmentation level is high. Lopez-Hilfiker et al. (2016) defined a parameter ΔV50 (dV50; i.e. the dV value at half the maximum of the signal remaining) to describe the analyte and reagent ion binding strength. In this study, the dV50 is defined by the following equation:
where NSR is the normalised signal remaining, SR is the signal remaining, dV50 is the desired fitted value as represented in Fig. 7, and SR is the fitted value that represents the maximum SR when a compound does not undergo fragmentation while passing through the ion optics.
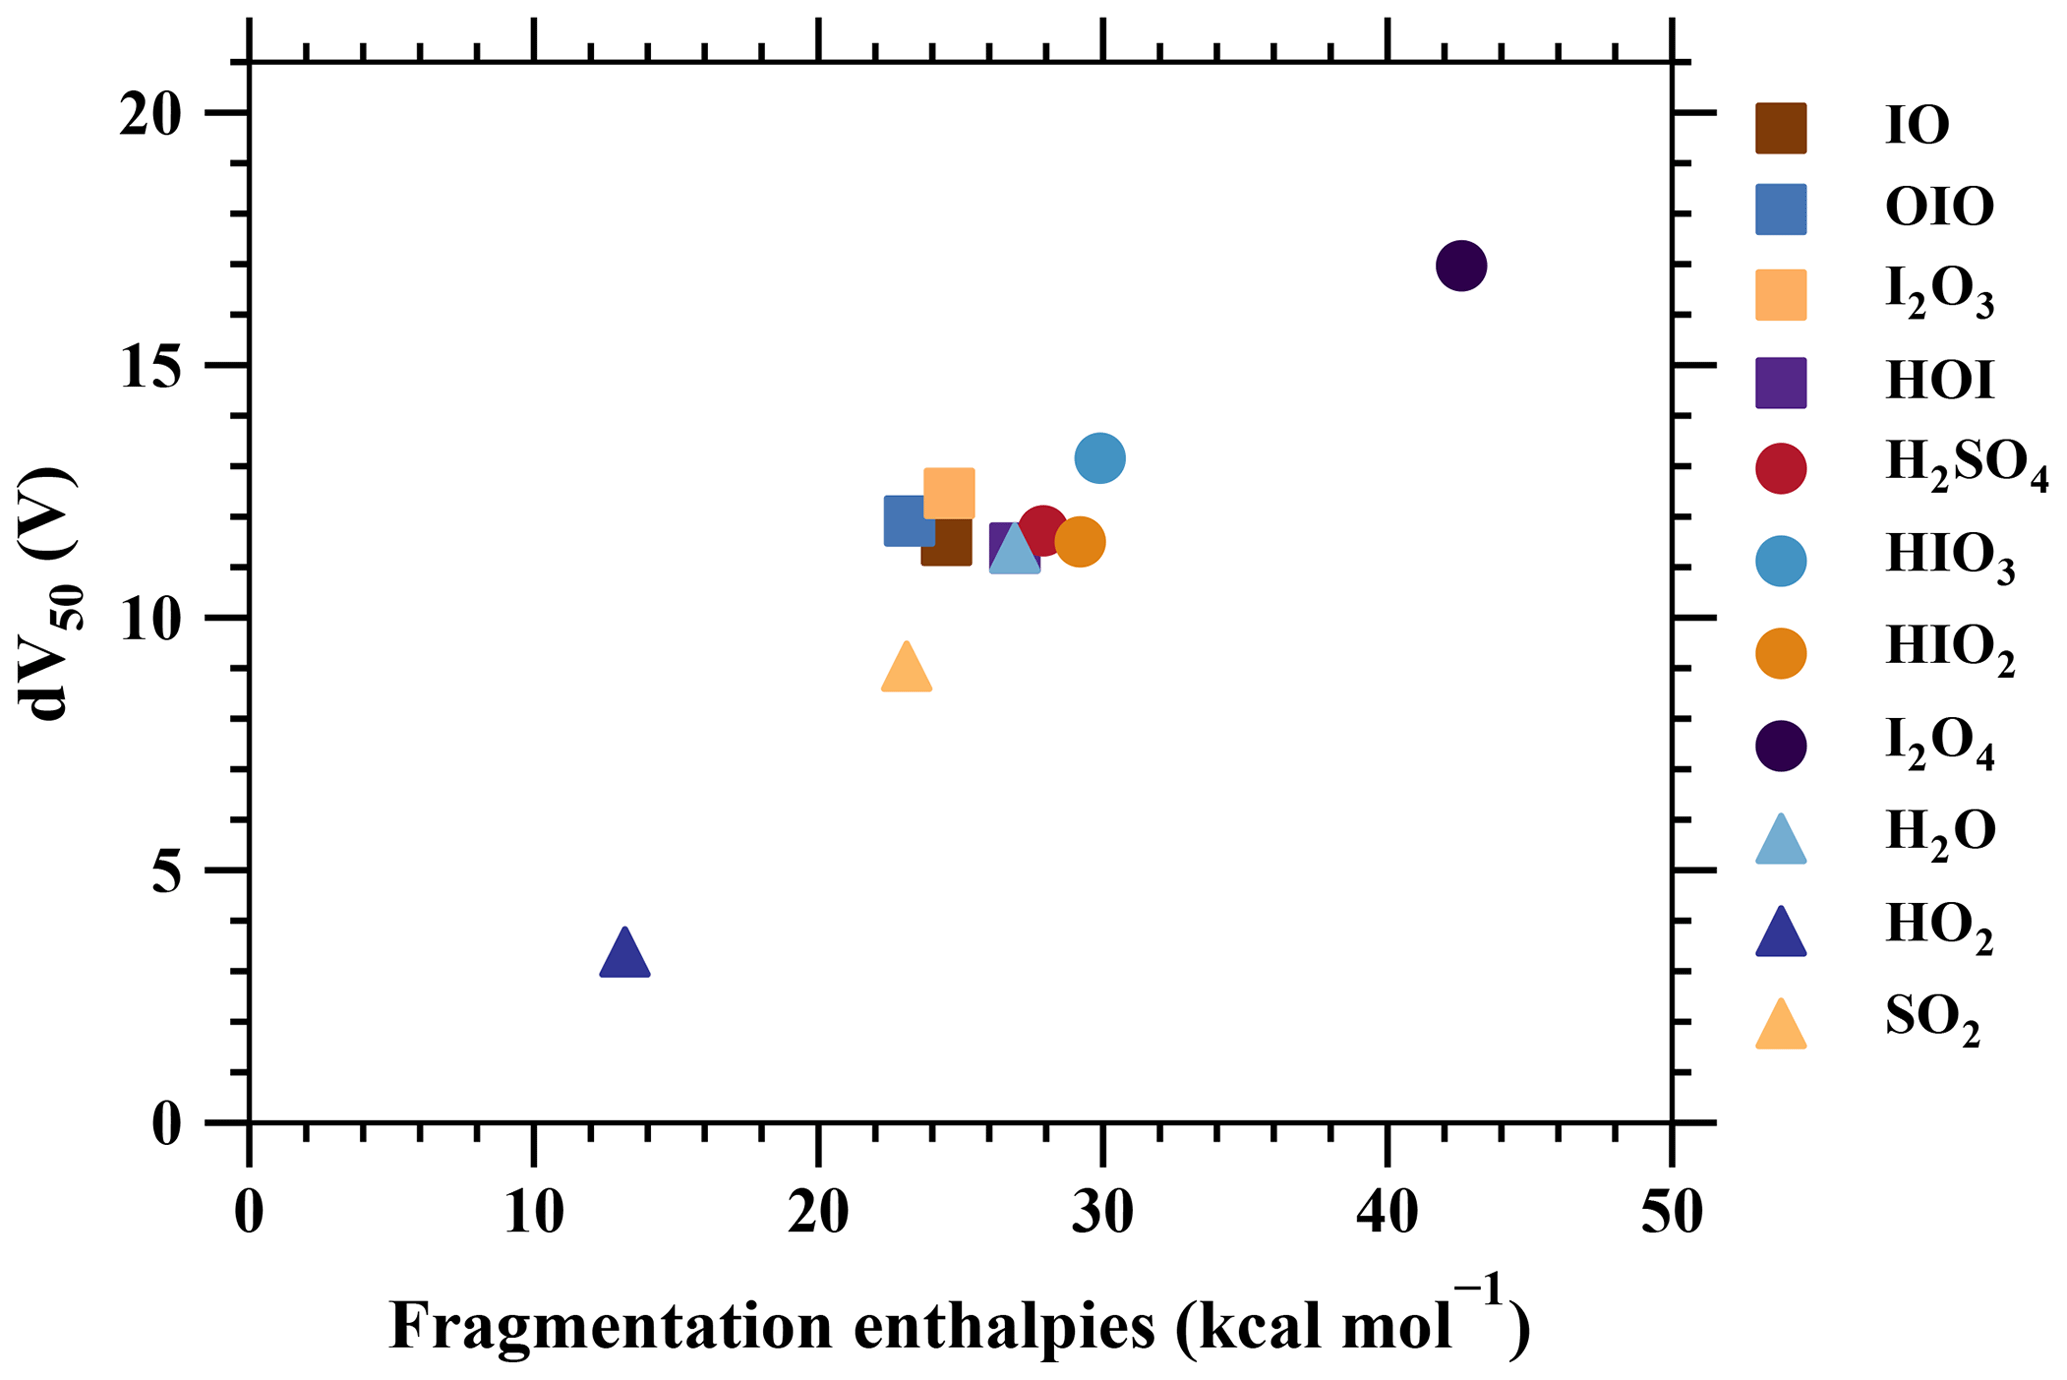
Figure 7The voltage at which 50 % of analyte-+bromide adducts have dissociated (dV50) vs. the fragmentation free enthalpies of the adducts (Table 2).
Additionally, the formation of free enthalpies of various charged clusters are calculated using quantum chemical calculations (see Sect. 2) and are compared with dV50, as shown in Fig. 7. The two sets of parameters, consisting of theoretical predictions and measurements of the binding strength, provide a consistent understanding, as demonstrated in previous studies (Lopez-Hilfiker et al., 2016; Iyer et al., 2016). In summary, strongly bonded charged clusters exhibit larger fragmentation-free enthalpies, larger dV50 values, and lower calibration factors. Examples of such species include H2SO4•Br− and I2•Br−. On the other hand, weakly bonded charged clusters exhibit opposite properties, including species like HO2•Br−, H2O•Br−, and SO2•Br−.
3.7 Validation of the iodic acid (HIO3) measurement
Oxidised iodine vapours have been shown to influence atmospheric oxidation capacity (Saiz-Lopez et al., 2014; Sherwen et al., 2016; X. Wang et al., 2021) and particle formation processes (Hoffmann et al., 2001; O'Dowd et al., 2002). Recent publications have proposed iodine oxoacids as the critical driver for iodine particle formation processes (Sipilä et al., 2016; Baccarini et al., 2020; He et al., 2021b, a; Zhang et al., 2022; Liu et al., 2023). However, active debate remains concerning the presence of gaseous HIO3 and whether HIO3 plays an important role in atmospheric aerosol nucleation. For example, a recent laboratory study sheds doubt on the existence of gaseous HIO3, as the authors only managed to measure HIO3 in the particle phase, with a photoionisation mass spectrometer, but not in the gas phase. They concluded that the particle-phase HIO3 was formed from higher iodine oxides instead of from gaseous HIO3 (Gómez Martín et al., 2020). Furthermore, they proposed a hypothesis that the signal, previously attributed to gaseous HIO3 measurements using –CIMS (Sipilä et al., 2016), could also originate from I2O2−4 species. Their evidence is primarily the exothermicity of the reactions from I2O2−4 + to . However, it should be noted that exothermic reactions do not guarantee that the reactions occur at significant rates, as various transition states and barriers exist in these reactions. Therefore, direct instrument validation is desired. In a more recent study, Gómez Martín et al. (2022) alternatively used the nitrate chemical ionisation method and detected gaseous HIO3, which is consistent with our earlier studies (Sipilä et al., 2016; He et al., 2021b, a; M. Wang et al., 2021; Finkenzeller et al., 2023) regarding the existence of gaseous HIO3. The authors suggested that the measured ion, previously interpreted as HIO3, could potentially be formed through reactions such as the following:
due to the reaction being exothermic. This hypothesis is challenged by the fact that the reaction
is a favoured pathway compared to Reaction (R1), as shown in Fig. 8. The authors of Finkenzeller et al. (2023) additionally estimated that the MESMER-derived overall rate coefficients at 298 K and 1 atm for Reactions (R1) and (R2) are and cm3 molec.−1 s−1, respectively. Therefore, the yield of Reaction (R2) is close to unity and cannot affect the HIO3 detection.
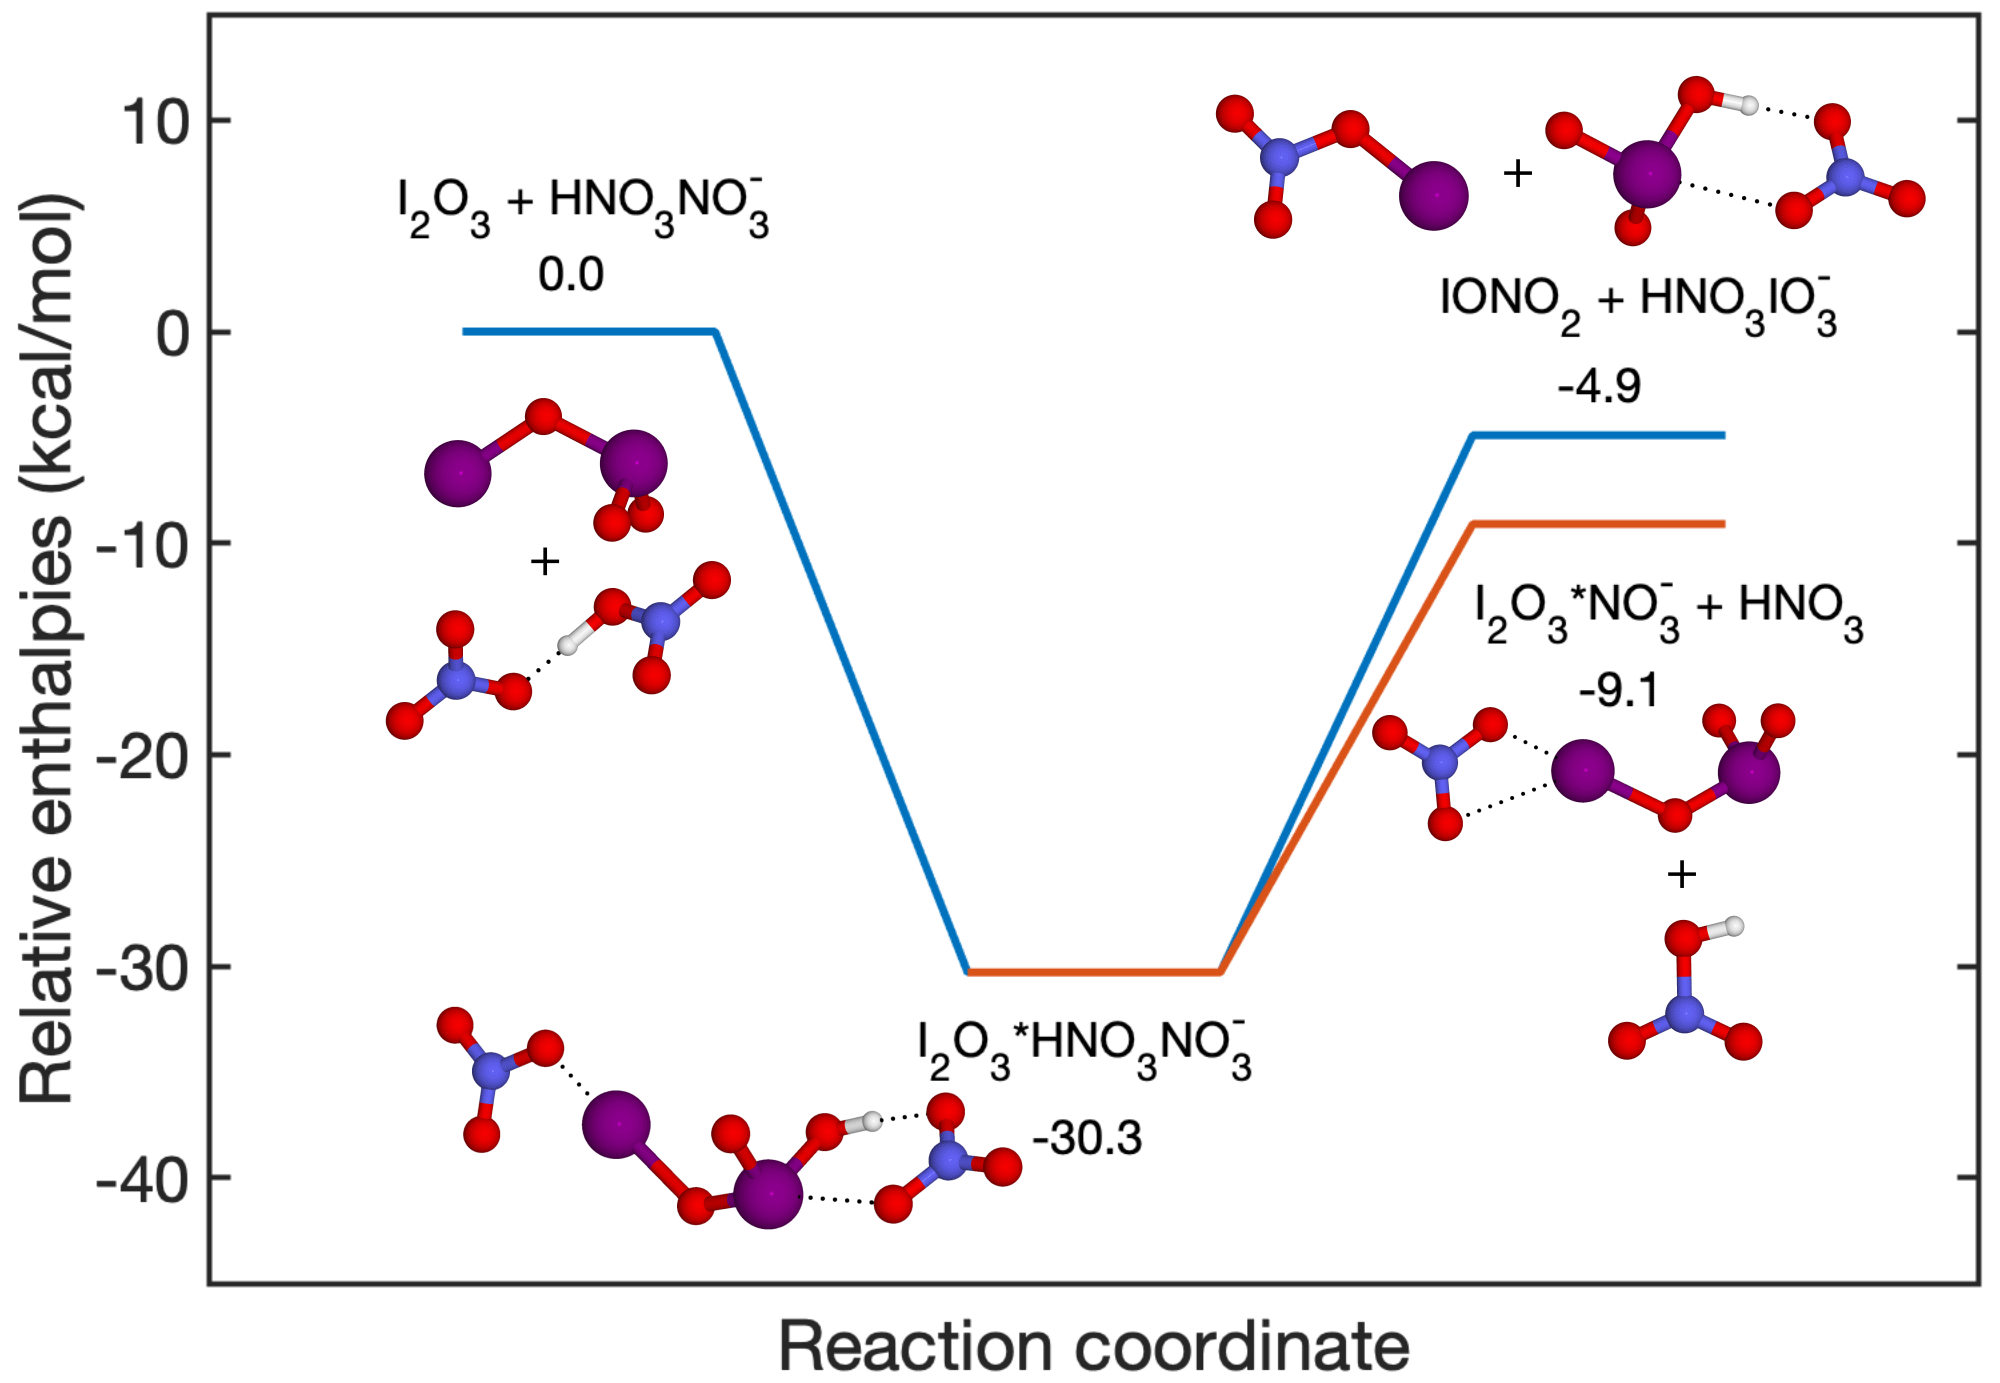
Figure 8Fragmentation pathways of . The enthalpies are calculated at the DLPNO-CCSD(T)/def2-QZVPP//wB97X-D/aug-cc-pVTZ-PP level of theory.
It is essential to highlight that our previous studies (He et al., 2021b; Finkenzeller et al., 2023) and the studies by Gómez Martín et al. (2020, 2022) have consistently concluded that I2O4 is the predominant form of I2Oy. Fortunately, the gaseous I2O4 species can be effectively measured using both the and Br− chemical ionisation methods. Finkenzeller et al. (2023) calculated the cluster formation enthalpy of as −45.6 kcal mol−1, which indicates that the cluster is extremely stable. Gómez Martín et al. (2020) found that the I2O4 + → products + reaction is endothermic thus less likely to occur. The same principle applies to the Br− chemical ionisation method as well. As mentioned earlier in the previous section, voltage scan experiments have shown that the I2O4•Br− cluster is the most stable among the clusters investigated (refer to Fig. 7). Consequently, I2O4 is detected at the collision limit using the Br− chemical ionisation method, and it does not fragment into species such as . Given that the measured concentration of I2O4 is more than 1 order of magnitude lower than that of HIO3, according to previous studies (M. Wang et al., 2021; He et al., 2021b; Finkenzeller et al., 2023), it is unlikely that I2O3−4 has a significant impact on the detection of HIO3.
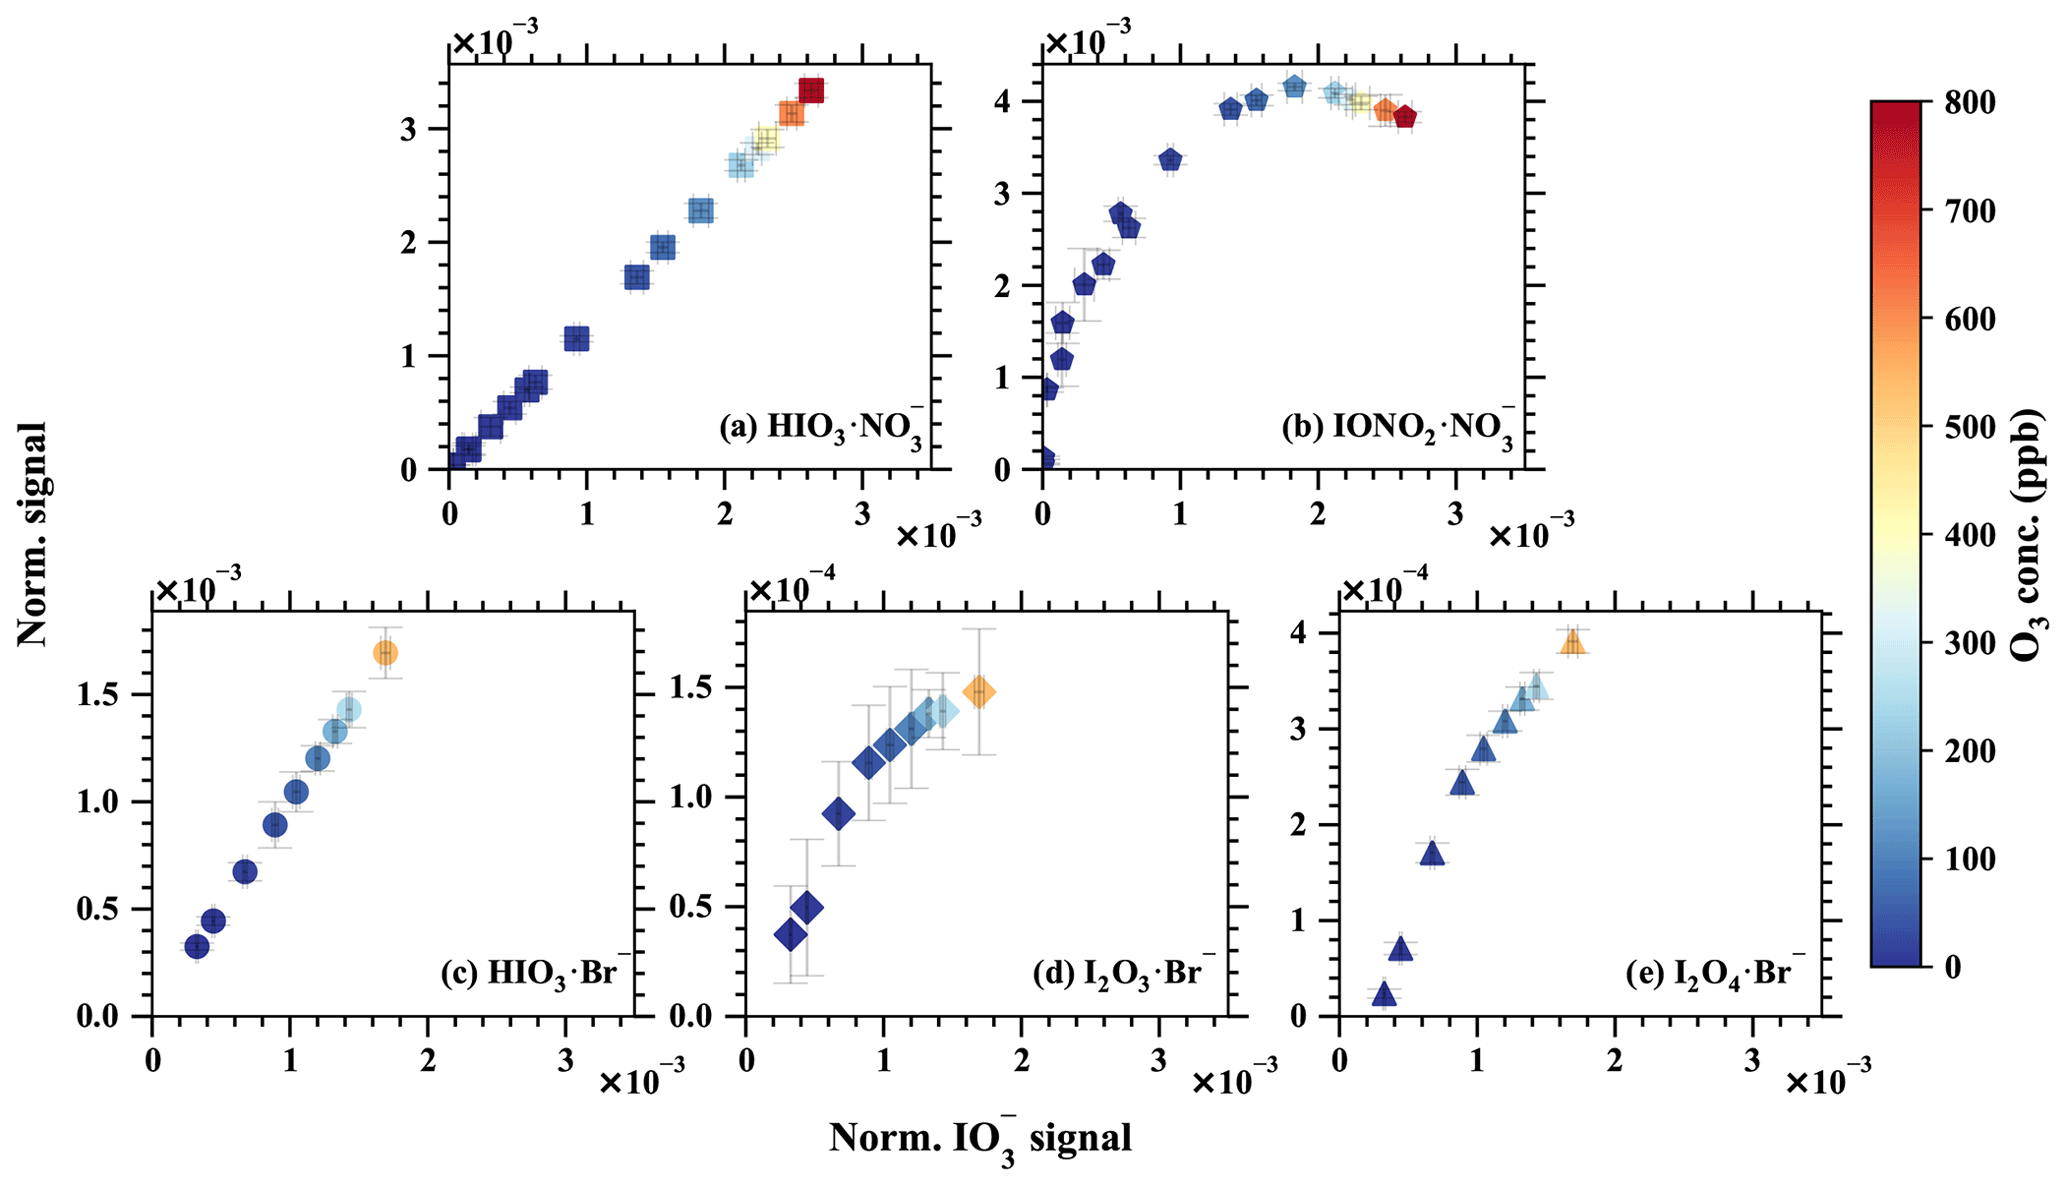
Figure 9The normalised signal vs. the normalised signals of (a) , (b) , (c) HIO3•Br−, (d) I2O3•Br−, and (e) I2O4•Br−. The iodine injection and light intensity were kept constant, but the O3 concentration was varied to modulate the ratio of iodine oxides to oxoacids. Error bars show 1 standard deviation. Notice the different y-axis scales.
Most importantly, complex and distinct chain reactions lead to the formation of higher iodine oxides and iodine oxoacids. Conducting laboratory experiments with elevated iodine concentrations could inevitably disrupt the balance between iodine oxides and iodine oxoacids. The concentration of iodine monoxide (IO) is widely regarded as being a reliable indicator of atmospheric iodine chemistry intensity and has been shown to influence the ratio of iodine oxides to iodine oxoacids (Finkenzeller et al., 2023). Leveraging this phenomenon, we executed chemical perturbation experiments by varying the concentration of ozone (O3), while maintaining constant concentrations of iodine (I2) and light intensity within a laminar flow reactor. The concentrations of IO were carefully controlled to levels below to a few parts per trillion by volume levels. These experiments were replicated for both Br−–MION2–T1 and –MION2–T1, as depicted in Fig. 9. The measured signal was compared with and signals from –MION2–T1 and with HIO3•Br−, I2O3•Br−, and I2O4•Br− signals from the Br−–MION2–T1, in order to ascertain the source of . It is noteworthy that the gaseous signals of HIO3 ( and HIO3•Br−) exhibit a perfectly linear relationship with the signals. However, the signals of , I2O3•Br−, and I2O4•Br− demonstrate a non-linear dependence on . This observation implies that the primary source of is gaseous HIO3, as a non-linear correlation between , HIO3•Br−, and would be expected if I2O3−4 significantly contributed to . Furthermore, if the proposed Reaction (R1) were to occur at a substantial rate, one would anticipate the signal to display a linear dependence on and HIO3•Br−. However, this is not observed.
Hence, we deduce that the contribution of I2O3−4 to the and signals within the marine boundary layer conditions is improbable. Consistent experimentation with precursor concentrations at ambient levels consistently reveals a notable scarcity of gaseous I2O4 when compared to HIO3 (He et al., 2021b, a; Finkenzeller et al., 2023). Furthermore, simulations of iodine chemistry conducted for the Maïdo Observatory in Réunion, indicate that the collective concentration of I2O3 and I2O4 accounts for a mere 1 % of HIO3, thus making it unlikely to exert any substantial influence on HIO3 measurements or the generation of iodine particles in marine boundary layer conditions (Finkenzeller et al., 2023).
In this study, we present an upgraded version of the multi-scheme chemical ionisation inlet known as MION2. It is capable of simultaneously operating in atmospheric ion measurement mode and employing multiple chemical ionisation methods. While the fundamental concept of this inlet remains the same as MION1 (Rissanen et al., 2019), MION2 enhances the operational stability and enables the concurrent use of multiple chemical ionisation methods with the same ionisation time. Additionally, we find that the new version significantly improves performance by effectively focusing reagent ions, resulting in lower limits of detection (LOD).
We further developed a Python open-source flow reactor kinetic model (MARFORCE; see Shen and He, 2023) to simulate convection–diffusion–reaction equations in cylindrical flow reactors to calibrate gaseous species such as H2SO4, HOI, and HO2. The model is also compatible with the widely used Master Chemical Mechanism, thus allowing future implementation of other chemical mechanisms.
Furthermore, we undertook a comprehensive characterisation of the MION2 inlet's capabilities for detecting an array of inorganic species, employing both Br− and chemical ionisation techniques with distinct ionisation times. By combining the analytical calibration with the MARFORCE model, we quantified the photochemical production of H2SO4, HOI, and HO2 within a flow reactor. We reveal that the LOD hover around 105 molec. cm−3 (averaged over a 1 min interval) for species such as H2SO4 and HIO3, with an ionisation time of 35 ms. With a longer ionisation time (300 ms), the LOD for H2SO4 experiences further reduction to 2.9×10⁴ molec. cm−3 (approximately 1 ppqv). Upon direct comparison, the MION2 inlet demonstrates equivalent or superior LOD in contrast to the widely employed Eisele inlet (Jokinen et al., 2012). Thus, this enhanced iteration of the inlet showcases exceptional sensitivity, making it a formidable asset for the precise measurement of trace gases relevant to atmospheric particle formation.
Furthermore, we conducted an assessment of the detection capabilities of SO2 and I2, since they serve as crucial precursors for H2SO4 and HIO3, respectively. We found that the Br−–MION2 inlet is capable of detecting SO2 by diluting a gas cylinder containing a known quantity of SO2. In addition to our previously established methods for calibrating gaseous I2 (M. Wang et al., 2021; Tham et al., 2021), we successfully employed a derivatisation approach in conjunction with high-performance liquid chromatography to quantify the iodine permeation rate, which was found to be as low as 17.3 ng min−1. The I2 calibration using the Br−–MION2 inlet further confirms that I2 is detected at the collision limit, similar to H2SO4, and aligns with our previous estimations (M. Wang et al., 2021).
As the Br−–MION2 measures H2O in the form of H2O•Br−, we quantified the H2O detection with a dew point mirror instrument by running them side by side. As a large portion of Br− is converted to H2O•Br− in the ion molecule reaction chamber, we predicted the fragmentation pathways of analyte–H2O•Br− clusters using quantum chemical calculations. We show that H2O evaporates from the analyte–H2O•Br− clusters when passing the ion optics of our mass spectrometer, due to the weak attachment of H2O to the charged clusters. However, the chemical signature of the analyte is commonly preserved as the analyte–Br− cluster or deprotonated analyte anion.
We have observed that the application of the Br− chemical ionisation method at atmospheric pressure is susceptible to the influence of elevated moisture levels in the ambient air, despite its enhanced detection sensitivity. We find that analytes detected at collision limits, including H2SO4, HIO3, and I2, experience a noticeable reduction in measurement sensitivity when the dew point rises beyond 0.5–10.5 ∘C (equivalent to 20 %–40 % RH). Moreover, the detection of analytes with weaker bonds, such as HO2 and SO2, is notably more profoundly impacted by variations in water content, even in situations where the dew point remains below 0 ∘C. To illustrate, the LOD for HO2 is approximately 1 order of magnitude higher than that of H2SO4 at a relative humidity (RH) of 2.7 %, while the LOD for SO2 surpasses that of H2SO4 by approximately 3 orders of magnitude when the RH falls below 0.1 %. These outcomes show the critical role played by atmospheric water content in the effectiveness of Br− chemical ionisation, particularly for species characterised by weak bonding interactions. Such insights contribute to our understanding of the method's limitations and provide valuable considerations for optimising analytical conditions in future atmospheric studies.
In order to mitigate the impact of humidity on detection, two methods, namely the dilution method and the core-sampling method, were tested in this study. We found that both methods effectively reduce the influence of humidity on detection. By employing these methods, it becomes possible to detect ambient levels of SO2 (below 1 part per billion by volume), even at RH levels of up to 50 %, which would otherwise be challenging. However, it should be noted that the use of these methods inevitably results in sample dilution, thereby affecting the detection of species that are less affected by air water content, such as H2SO4, HOI, and I2. Therefore, these methods should be employed selectively, when there is a specific objective, such as detecting extremely low levels of SO2, or when the sample's dew point is higher than 10 ∘C (40 % RH). This implies that atmospheric pressure Br− chemical ionisation is suitable for laboratory experiments with controlled RH and for ambient measurements in relatively cold environments. When interpreting data obtained through the atmospheric pressure Br− chemical ionisation method, it is crucial to carefully account for the influence of water by employing analytical characterisation or predicting fragmentation enthalpy. Despite these considerations, the MION2 inlet, which allows for the concurrent operation of the water-insensitive chemical ionisation method and the water-sensitive yet more versatile Br− chemical ionisation method, provides a more comprehensive understanding of atmospheric conditions compared to using either of these methods in isolation.
Finally, we validated the measurement of gaseous HIO3 using both the and Br− chemical ionisation methods. The signal of HIO3 typically consists of and either or HIO3•Br−, depending on the chemical ionisation method employed. Through experimental and theoretical validation, we confirmed that all three ions primarily originate from genuine gaseous iodic acid and that iodine oxides do not contribute to the formation of these ions under marine boundary layer conditions.
Table A1Chemical reactions and the reaction rate coefficients used for H2SO4 and HOI calibration experiments.
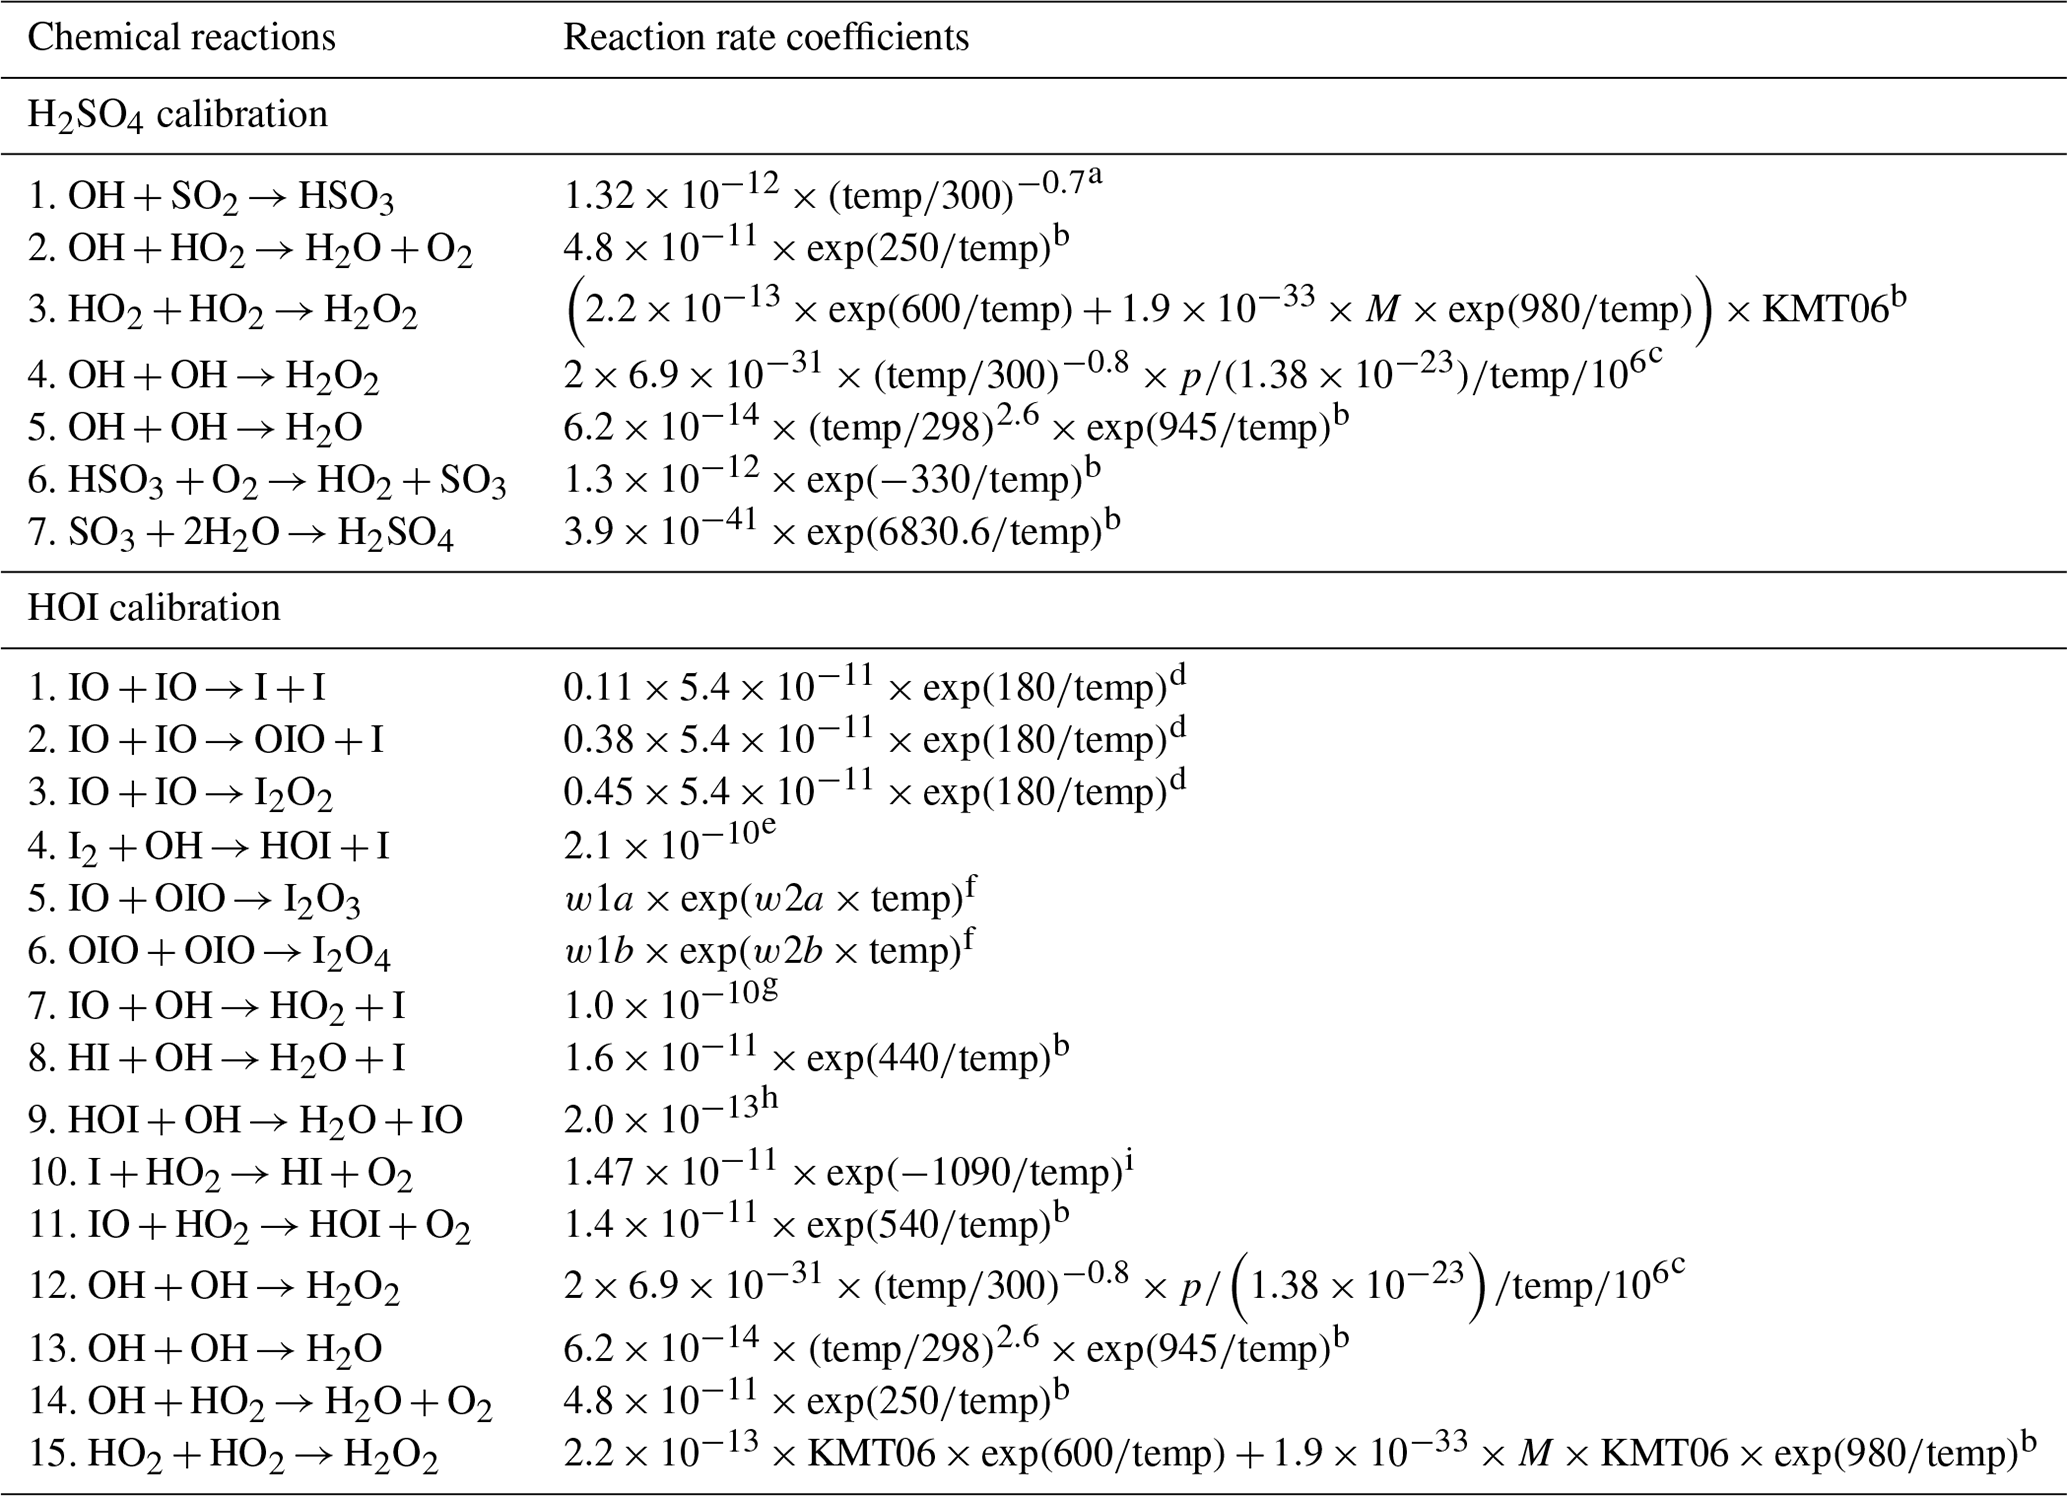
a Wine et al. (1984); b Atkinson et al. (2004); c Zellner et al. (1988); d Bloss et al. (2001); e Gilles et al. (1999); f Saiz-Lopez et al. (2014); g Bösch (2003); h Chameides and Davis (1980); i Jenkin et al. (1990).
, and [H2O] is the absolute water concentration. M is the total number of molecules in the atmosphere. p is the pressure.
;
;
;
.
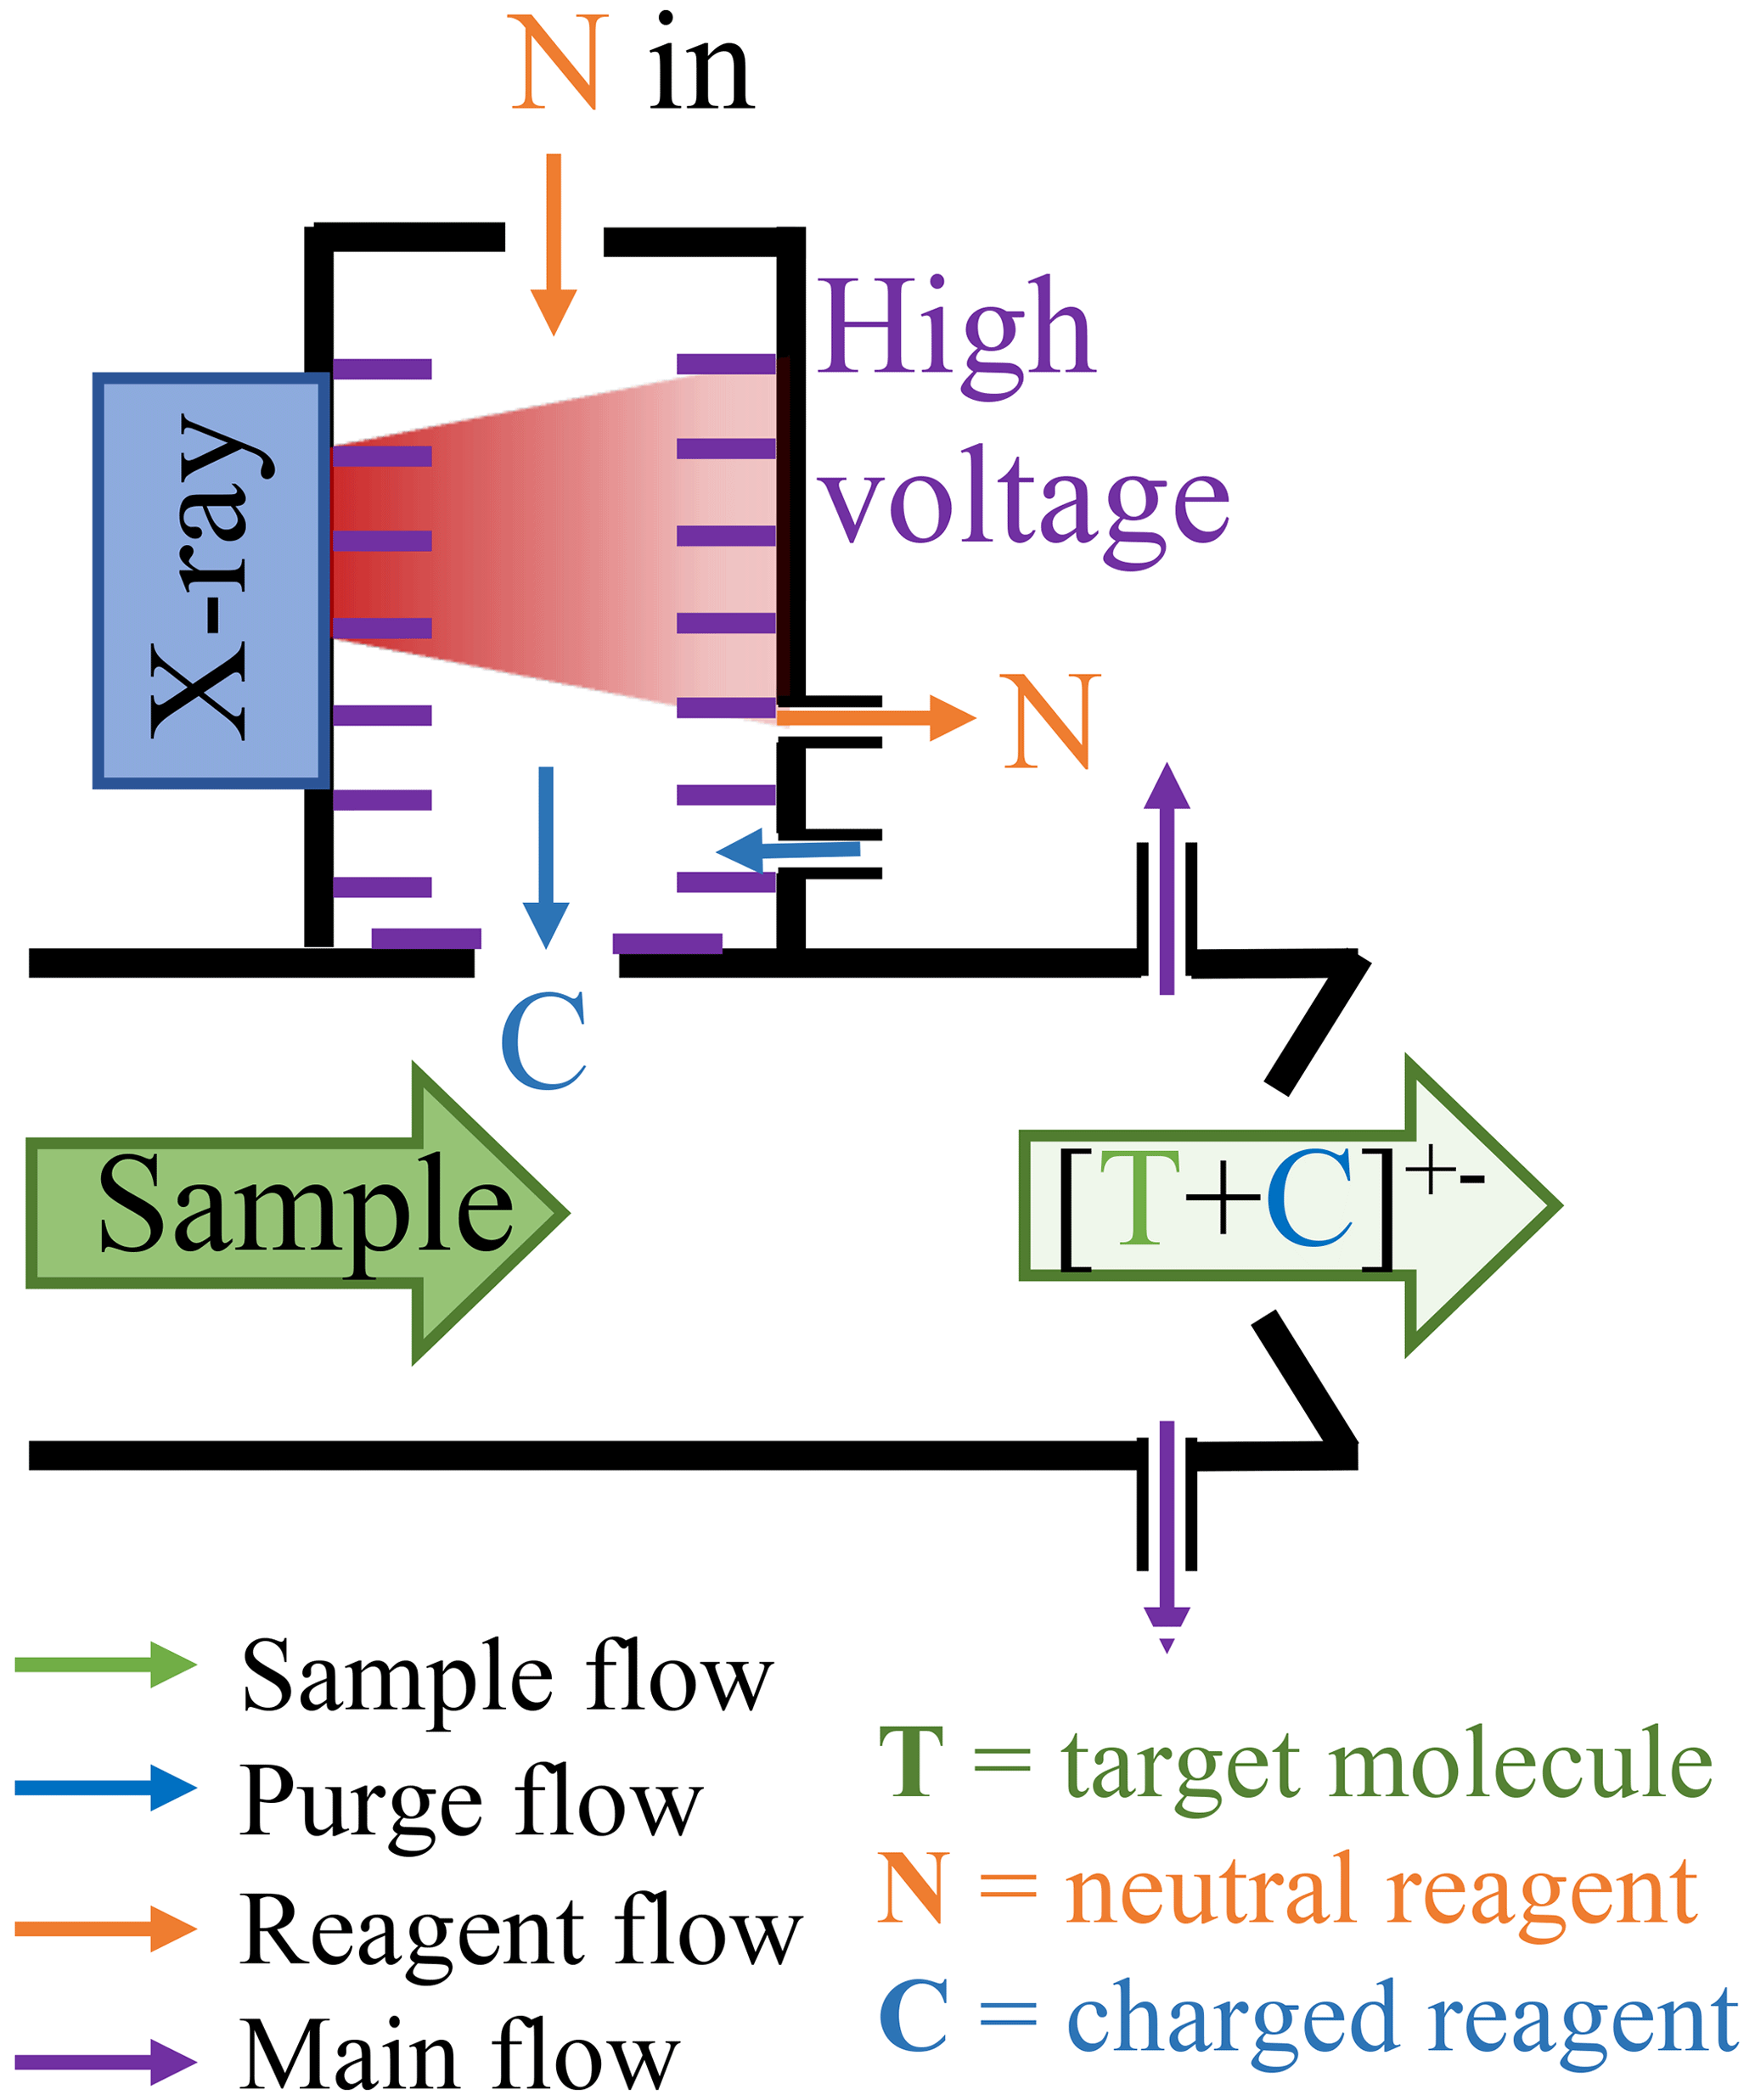
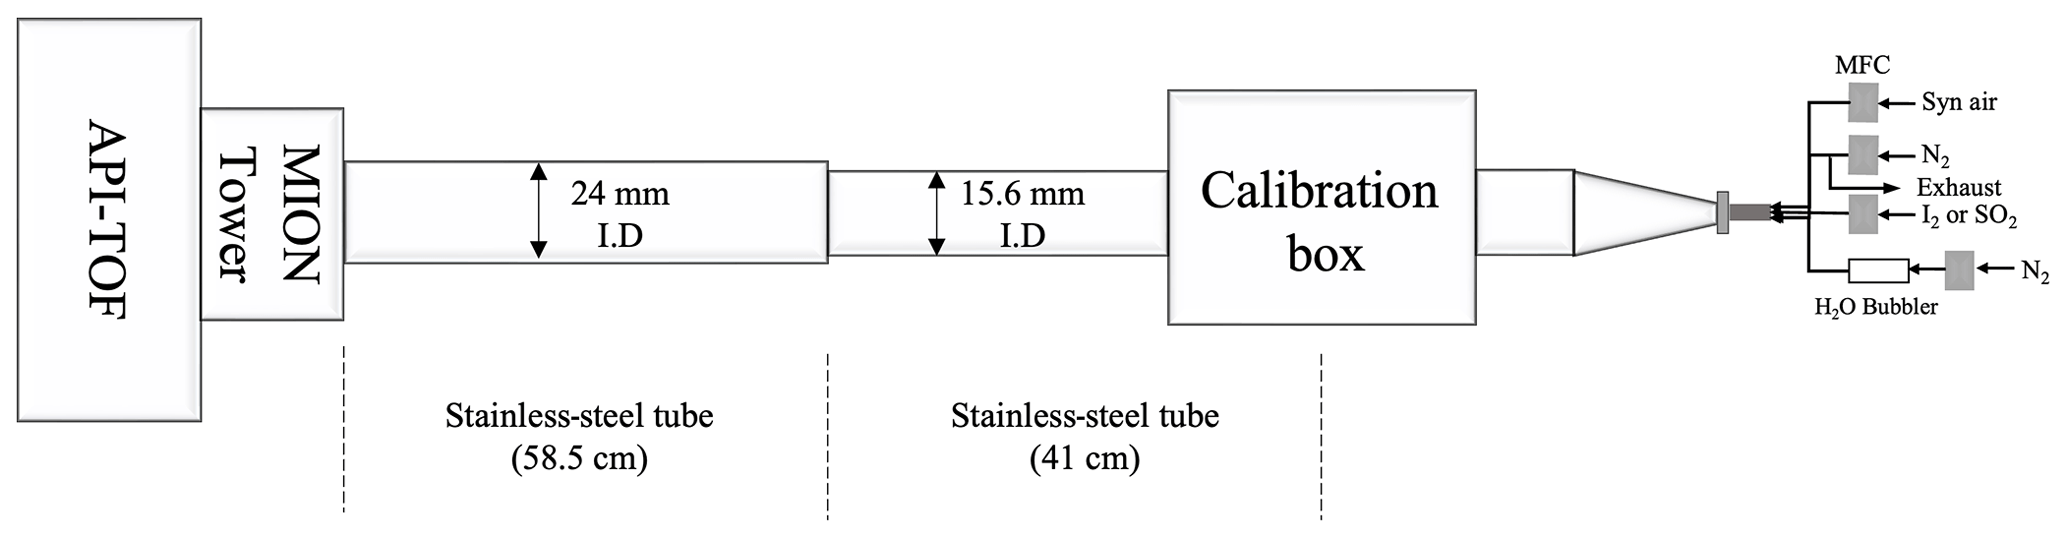
Figure A2Schematic of a typical calibration experiment connecting the MION2 inlet (internal diameter of 24 mm) with the calibration source (internal diameter of 15.6 mm).
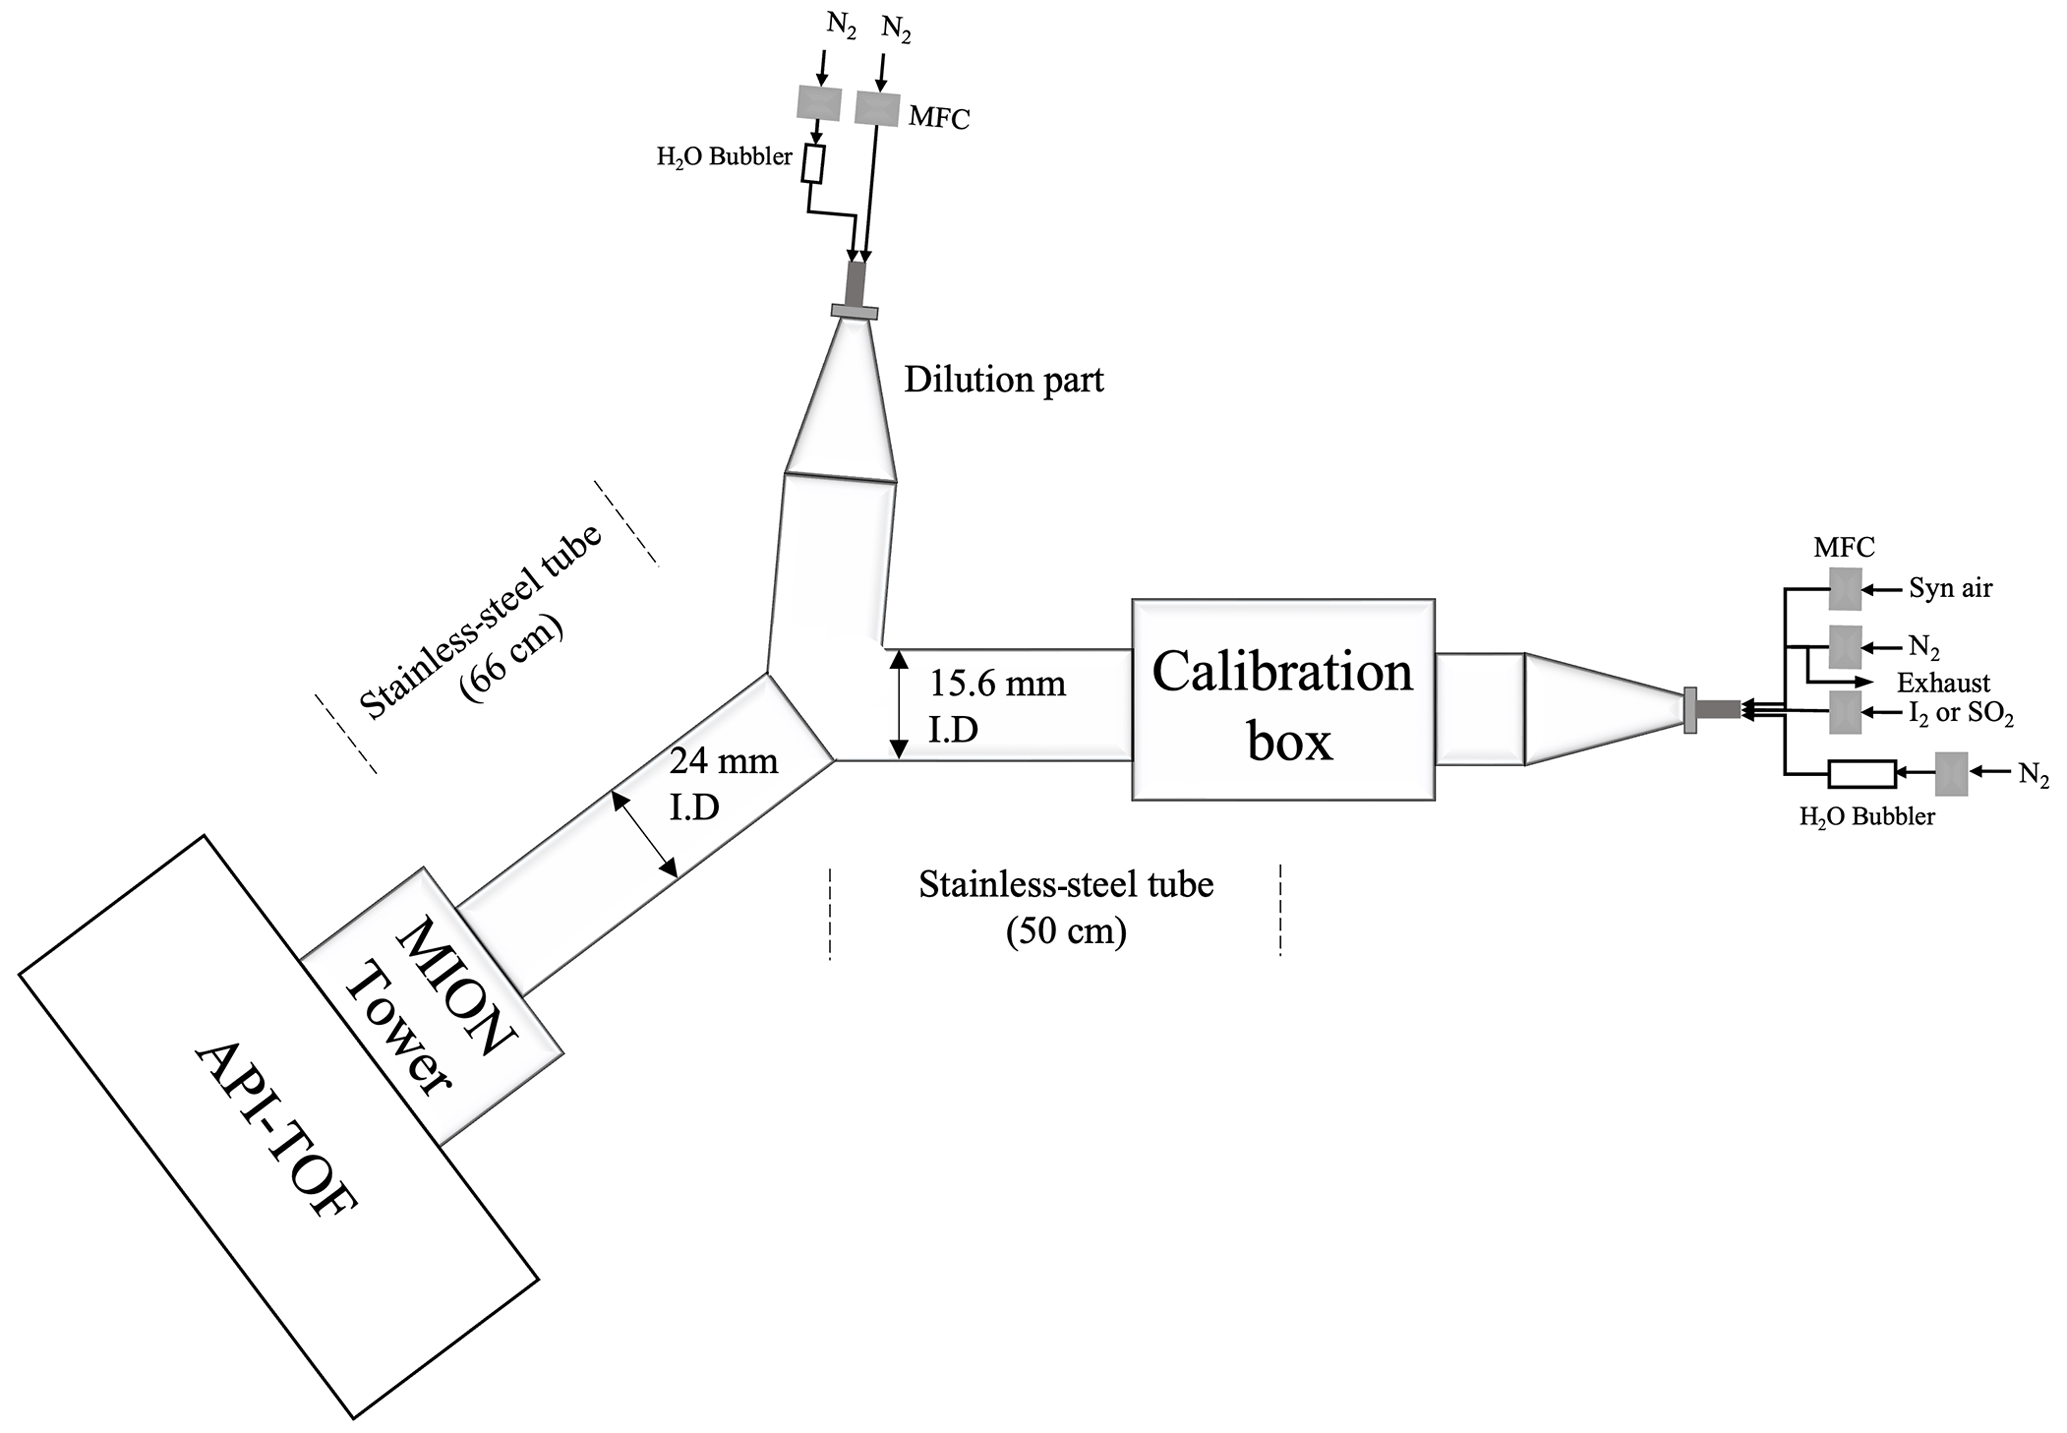
Figure A3Schematic of the set-up for examining the detection humidity effect of H2SO4, HOI and HO2.
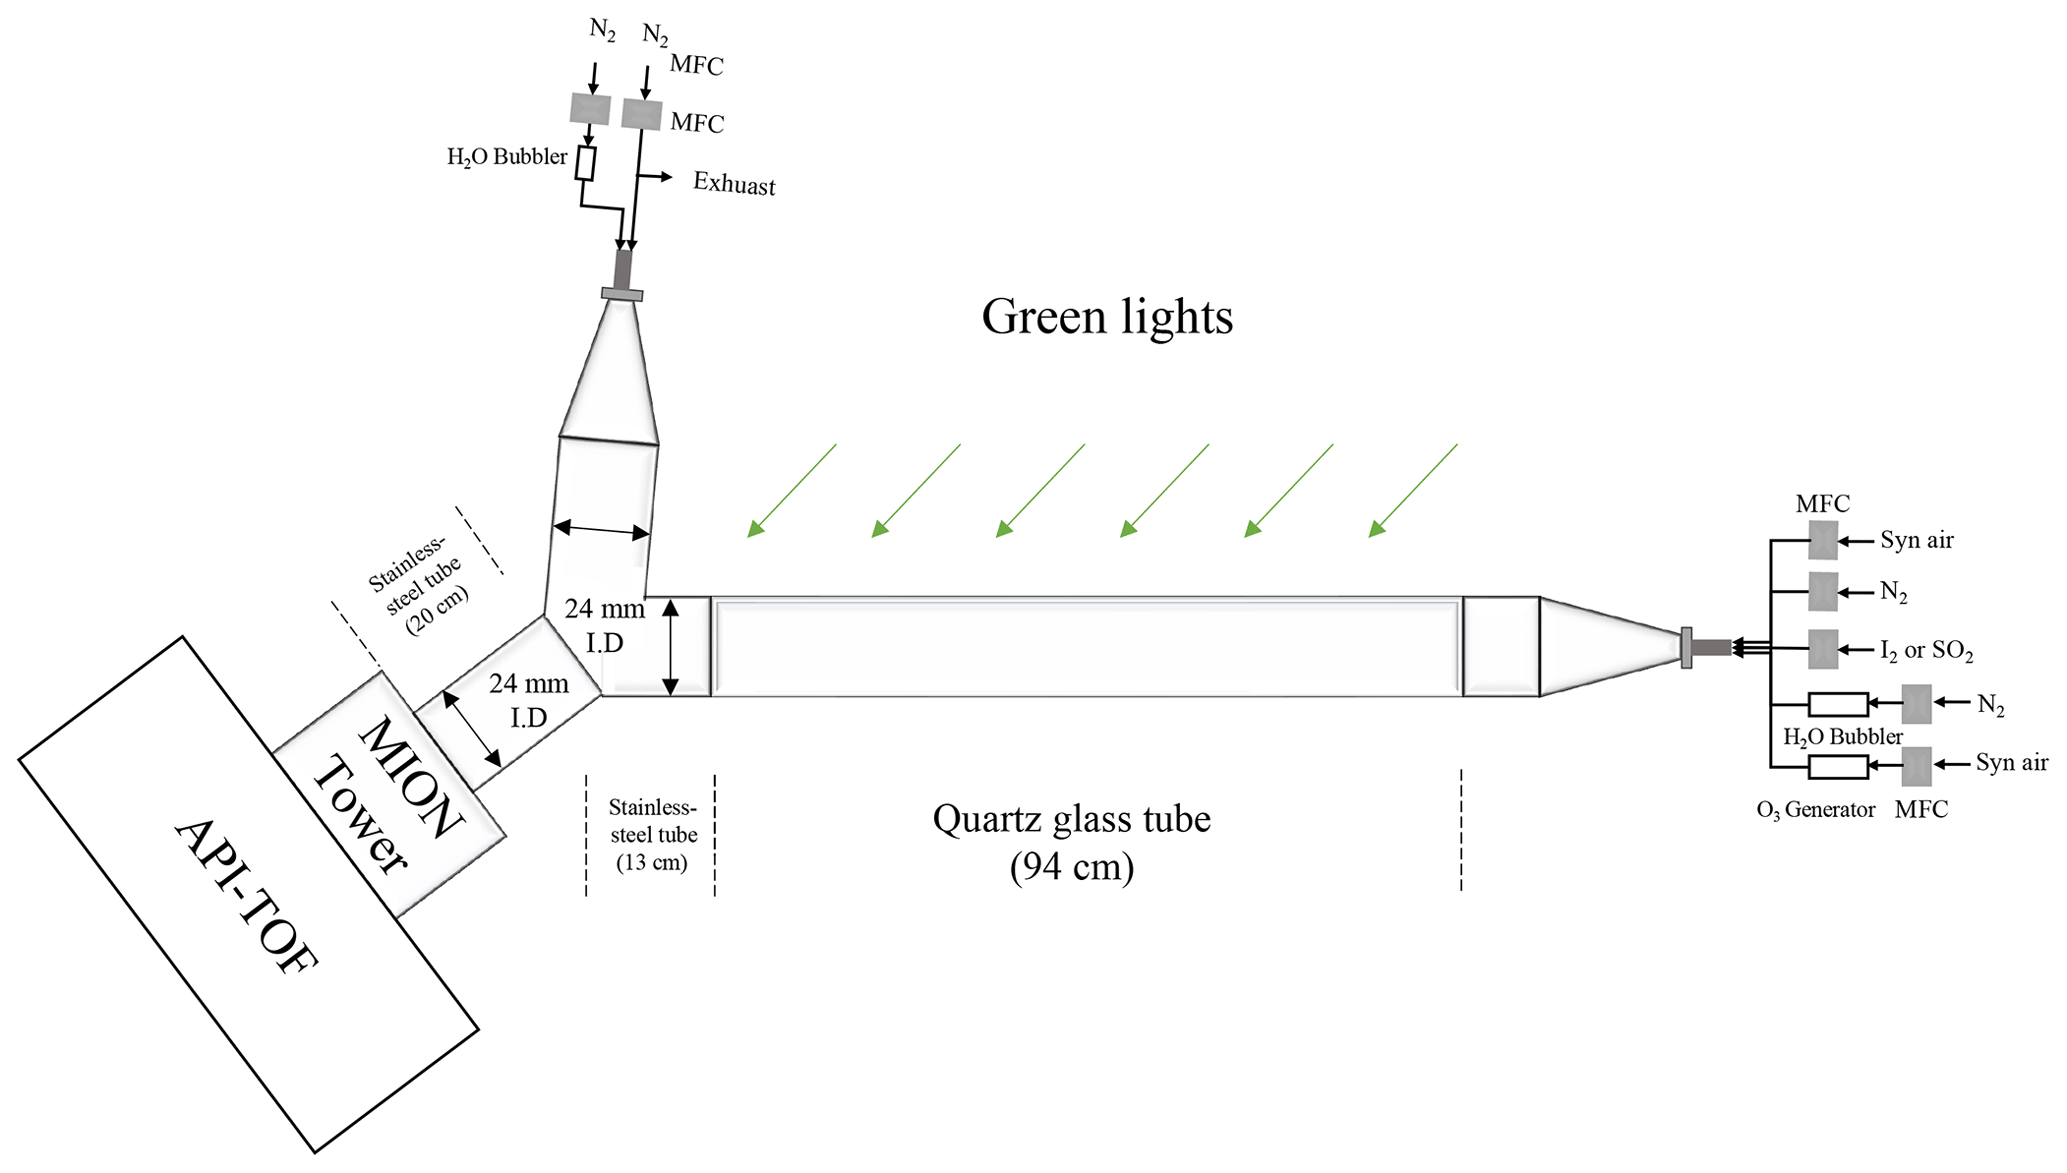
Figure A4Schematic of the experimental set-up for iodine chemistry experiments to produce higher concentrations of iodine oxides and oxoacids.
Figure A5Comparison of the H2SO4 profiles at the outlet of a flow reactor. Theoretical values are predicted using Alonso et al. (2016), and the model results indicate the MARFORCE simulation. In both the theoretical prediction and the MARFORCE model, the tube length is assumed to be 2 m, the inlet flow is set to 10 L min−1, and the diffusivity of H2SO4 is set to 0.088 cm2 s−1.
Figure A6Comparing calibration experiments of (a) H2SO4 and HOI with a straight tube (Fig. A2) or additionally with a dilution flow (Fig. A3). The difference in the calibration factors between the two experimental set-ups is the result of the less accurate representation of fluid dynamics when the dilution flow is added (Fig. A3).
Figure A7Schematic of the set-up for the H2SO4, HOI, and HO2 calibration experiment with the tower 2. The difference between this set-up and the one shown in Fig. A3 is that the position of the MION2 tower is changed from tower 1 to tower 2.
Figure A8The configuration of the core-sampling device (Karsa Ltd.), which is used for adjusting the sheath and sample flows. This core-sampling piece features three ports for the dilution flows which pass through a mesh and are further mixed with the sample flow.
The MARFORCE model is shared through the GitHub repository (https://github.com/momo-catcat/MARFORCE-flowtube, Shen and He, 2023; https://doi.org/10.5281/zenodo.8318790, He et al., 2023). Other data analysis codes can be requested from the corresponding authors.
Data for all figures in the main text and the Appendix are available from the Zenodo repository (https://doi.org/10.5281/zenodo.8318790, He et al., 2023).
XCH and JS designed and carried out the experiments. JS and XCH wrote the MARFORCE model. JZ wrote the documentation of the MARFORCE model. SI carried out quantum chemical calculations. NMM, MrK, and MMK analysed the molecular iodine samples. JK, PJ, MS, and JM provided technical support. XCH wrote the paper, with contributions from JS, NMM, PJ, and SI. Finally, JK, JS, MR, SI, DRW, and MaK commented on and edited the paper.
Paxton Juuti and Jyri Mikkilä work for Karsa, Ltd., Finland. Juha Kangasluoma works part-time for Karsa, Ltd., Finland. The peer-review process was guided by an independent editor, and the authors also have no other competing interests to declare.
Publisher's note: Copernicus Publications remains neutral with regard to jurisdictional claims in published maps and institutional affiliations.
Miska Olin, Gustaf Lönn, and Heikki Junninen are acknowledged for their helpful discussions and contributions to the MARFORCE model. Simon Patrick O'Meara and Gordon McFiggans are acknowledged for their contributions to the MCM interpreter in the MARFORCE model.
This research has been supported by the ACCC Flagship funded by the Research Council of Finland (grant no. 337549), the Academy professorship funded by the Research Council of Finland (grant no. 302958), and the Research Council of Finland (project nos. 331207, 346370, 325656, 316114, 314798, 325647, 341349, 353836, 346373 and 349659). This project has received funding from the European Research Council under the European Union's Horizon 2020 research and innovation programme (grant nos. 742206 and 101002728). The Arena for the gap analysis of the existing Arctic Science Co-Operations (AASCO) has been funded by the Prince Albert Foundation (grant no. 2859). Markku Kulmala has received funding from the Jane and Aatos Erkko Foundation. Markku Kulmala and Xu-Cheng He have received funding from the Jenny and Antti Wihuri Foundation.
Open-access funding was provided by the Helsinki University Library.
This paper was edited by Anna Novelli and reviewed by four anonymous referees.
Agarwal, B., González-Méndez, R., Lanza, M., Sulzer, P., Märk, T. D., Thomas, N., and Mayhew, C. A.: Sensitivity and Selectivity of Switchable Reagent Ion Soft Chemical Ionization Mass Spectrometry for the Detection of Picric Acid, J. Phys. Chem. A, 118, 8229–8236, https://doi.org/10.1021/jp5010192, 2014. a
Alonso, M., Carsí, M., and Huang, C.-H.: Using the fully developed concentration profile to determine particle penetration in a laminar flow tube, J. Aerosol Sci., 97, 34–37, https://doi.org/10.1016/j.jaerosci.2016.04.002, 2016. a, b, c
Atkinson, R., Baulch, D. L., Cox, R. A., Crowley, J. N., Hampson, R. F., Hynes, R. G., Jenkin, M. E., Rossi, M. J., and Troe, J.: Evaluated kinetic and photochemical data for atmospheric chemistry: Volume I – gas phase reactions of Ox, HOx, NOx and SOx species, Atmos. Chem. Phys., 4, 1461–1738, https://doi.org/10.5194/acp-4-1461-2004, 2004. a
Baccarini, A., Karlsson, L., Dommen, J., Duplessis, P., Vüllers, J., Brooks, I. M., Saiz-Lopez, A., Salter, M., Tjernström, M., Baltensperger, U., Zieger, P., and Schmale, J.: Frequent new particle formation over the high Arctic pack ice by enhanced iodine emissions, Nat. Commun., 11, 4924, https://doi.org/10.1038/s41467-020-18551-0, 2020. a
Berndt, T., Richters, S., Jokinen, T., Hyttinen, N., Kurtén, T., Otkjær, R. V., Kjaergaard, H. G., Stratmann, F., Herrmann, H., Sipilä, M., Kulmala, M., and Ehn, M.: Hydroxyl radical-induced formation of highly oxidized organic compounds, Nat. Commun., 7, 13677, https://doi.org/10.1038/ncomms13677, 2016. a, b
Bloss, W. J., Rowley, D. M., Cox, R. A., and Jones, R. L.: Kinetics and Products of the IO Self-Reaction, J. Phys. Chem. A, 105, 7840–7854, https://doi.org/10.1021/jp0044936, 2001. a
Bösch, H.: Upper limits of stratospheric IO and OIO inferred from center-to-limb-darkening-corrected balloon-borne solar occultation visible spectra: Implications for total gaseous iodine and stratospheric ozone, J. Geophys. Res., 108, 4455, https://doi.org/10.1029/2002JD003078, 2003. a
Breitenlechner, M., Fischer, L., Hainer, M., Heinritzi, M., Curtius, J., and Hansel, A.: PTR3: An Instrument for Studying the Lifecycle of Reactive Organic Carbon in the Atmosphere, Anal. Chem., 89, 5824–5831, https://doi.org/10.1021/acs.analchem.6b05110, 2017. a
Brophy, P. and Farmer, D. K.: A switchable reagent ion high resolution time-of-flight chemical ionization mass spectrometer for real-time measurement of gas phase oxidized species: characterization from the 2013 southern oxidant and aerosol study, Atmos. Meas. Tech., 8, 2945–2959, https://doi.org/10.5194/amt-8-2945-2015, 2015. a, b
Caldwell, G. W., Masucci, J. A., and Ikonomou, M. G.: Negative ion chemical ionization mass spectrometry – binding of molecules to bromide and iodide anions, Org. Mass Spectrom., 24, 8–14, https://doi.org/10.1002/oms.1210240103, 1989. a, b
Chai, J.-D. and Head-Gordon, M.: Long-range corrected hybrid density functionals with damped atom–atom dispersion corrections, Phys. Chem. Chem. Phys., 10, 6615, https://doi.org/10.1039/b810189b, 2008. a, b
Chameides, W. L. and Davis, D. D.: Iodine: Its possible role in tropospheric photochemistry, J. Geophys. Res.-Oceans, 85, 7383–7398, https://doi.org/10.1029/JC085iC12p07383, 1980. a
Creasey, D. J., Heard, D. E., and Lee, J. D.: Absorption cross-section measurements of water vapour and oxygen at 185 nm. Implications for the calibration of field instruments to measure OH, HO2 and RO2 radicals, Geophys. Res. Lett., 27, 1651–1654, https://doi.org/10.1029/1999GL011014, 2000. a
Ehn, M., Thornton, J. A., Kleist, E., Sipilä, M., Junninen, H., Pullinen, I., Springer, M., Rubach, F., Tillmann, R., Lee, B., Lopez-Hilfiker, F., Andres, S., Acir, I.-H., Rissanen, M., Jokinen, T., Schobesberger, S., Kangasluoma, J., Kontkanen, J., Nieminen, T., Kurtén, T., Nielsen, L. B., Jørgensen, S., Kjaergaard, H. G., Canagaratna, M., Maso, M. D., Berndt, T., Petäjä, T., Wahner, A., Kerminen, V.-M., Kulmala, M., Worsnop, D. R., Wildt, J., and Mentel, T. F.: A large source of low-volatility secondary organic aerosol, Nature, 506, 476–479, https://doi.org/10.1038/nature13032, 2014. a, b, c
Eisele, F. L. and Tanner, D. J.: Measurement of the gas phase concentration of H2SO4 and methane sulfonic acid and estimates of H2SO4 production and loss in the atmosphere, J. Geophys. Res.-Atmos., 98, 9001–9010, https://doi.org/10.1029/93JD00031, 1993. a, b, c, d
Feller, D.: The role of databases in support of computational chemistry calculations, J. Comput. Chem., 17, 1571–1586, https://doi.org/10.1002/(SICI)1096-987X(199610)17:13<1571::AID-JCC9>3.0.CO;2-P, 1996. a
Finkenzeller, H., Iyer, S., He, X.-C., Simon, M., Koenig, T. K., Lee, C. F., Valiev, R., Hofbauer, V., Amorim, A., Baalbaki, R., Baccarini, A., Beck, L., Bell, D. M., Caudillo, L., Chen, D., Chiu, R., Chu, B., Dada, L., Duplissy, J., Heinritzi, M., Kemppainen, D., Kim, C., Krechmer, J., Kürten, A., Kvashnin, A., Lamkaddam, H., Lee, C. P., Lehtipalo, K., Li, Z., Makhmutov, V., Manninen, H. E., Marie, G., Marten, R., Mauldin, R. L., Mentler, B., Müller, T., Petäjä, T., Philippov, M., Ranjithkumar, A., Rörup, B., Shen, J., Stolzenburg, D., Tauber, C., Tham, Y. J., Tomé, A., Vazquez-Pufleau, M., Wagner, A. C., Wang, D. S., Wang, M., Wang, Y., Weber, S. K., Nie, W., Wu, Y., Xiao, M., Ye, Q., Zauner-Wieczorek, M., Hansel, A., Baltensperger, U., Brioude, J., Curtius, J., Donahue, N. M., Haddad, I. E., Flagan, R. C., Kulmala, M., Kirkby, J., Sipilä, M., Worsnop, D. R., Kurten, T., Rissanen, M., and Volkamer, R.: The gas-phase formation mechanism of iodic acid as an atmospheric aerosol source, Nat. Chem., 15, 129–135, https://doi.org/10.1038/s41557-022-01067-z, 2023. a, b, c, d, e, f, g, h, i
Frisch, M. J., Trucks, G. W., Schlegel, H. B., Scuseria, G. E., Robb, M. A., Cheeseman, J. R., Scalmani, G., Barone, V., Petersson, G. A., Nakatsuji, H., Li, X., Caricato, M., Marenich, A. V., Bloino, J., Janesko, B. G., Gomperts, R., Mennucci, B., Hratchian, H. P., Ortiz, J. V., Izmaylov, A. F., Sonnenberg, J. L., Williams, Ding, F., Lipparini, F., Egidi, F., Goings, J., Peng, B., Petrone, A., Henderson, T., Ranasinghe, D., Zakrzewski, V. G., Gao, J., Rega, N., Zheng, G., Liang, W., Hada, M., Ehara, M., Toyota, K., Fukuda, R., Hasegawa, J., Ishida, M., Nakajima, T., Honda, Y., Kitao, O., Nakai, H., Vreven, T., Throssell, K., Montgomery Jr., J. A., Peralta, J. E., Ogliaro, F., Bearpark, M. J., Heyd, J. J., Brothers, E. N., Kudin, K. N., Staroverov, V. N., Keith, T. A., Kobayashi, R., Normand, J., Raghavachari, K., Rendell, A. P., Burant, J. C., Iyengar, S. S., Tomasi, J., Cossi, M., Millam, J. M., Klene, M., Adamo, C., Cammi, R., Ochterski, J. W., Martin, R. L., Morokuma, K., Farkas, O., Foresman, J. B., and Fox, D. J.: Gaussian 16 Rev. C.01, Gaussian, Inc., Wallingford CT, 2016. a
Fuller, E. N., Schettler, P. D., and Giddings, J. C.: New Method For Prediction Of Binary Gas-Phase Diffusion Coefficients, Ind. Eng. Chem., 58, 18–27, https://doi.org/10.1021/ie50677a007, 1966. a
Gálvez, O., Gómez Martín, J. C., Gómez, P. C., Saiz-Lopez, A., and Pacios, L. F.: A theoretical study on the formation of iodine oxide aggregates and monohydrates, Phys. Chem. Chem. Phys., 15, 15572, https://doi.org/10.1039/c3cp51219c, 2013. a
Gilles, M. K., Burkholder, J. B., and Ravishankara, A. R.: Rate coefficients for the reaction of OH with Cl2, Br2, and I2 from 235 to 354 K, Int. J. Chem. Kinet., 31, 417–424, https://doi.org/10.1002/(SICI)1097-4601(1999)31:6<417::AID-KIN3>3.0.CO;2-A, 1999. a
Gómez Martín, J. C., Lewis, T. R., Blitz, M. A., Plane, J. M. C., Kumar, M., Francisco, J. S., and Saiz-Lopez, A.: A gas-to-particle conversion mechanism helps to explain atmospheric particle formation through clustering of iodine oxides, Nat. Commun., 11, 4521, https://doi.org/10.1038/s41467-020-18252-8, 2020. a, b, c
Gómez Martín, J. C., Lewis, T. R., James, A. D., Saiz-Lopez, A., and Plane, J. M. C.: The Role of Iodine Oxides and the Source of Iodic Acid, J. Am. Chem. Soc., 144, 9240–9253, https://doi.org/10.1021/jacs.1c12957, 2022. a, b
Gormley, P. and Kennedy, M.: Diffusion from a stream flowing through a cylindrical tube, P. Roy. Irish Acad. A, 52, 163–169, 1948. a
Hansel, A., Jordan, A., Holzinger, R., Prazeller, P., Vogel, W., and Lindinger, W.: Proton transfer reaction mass spectrometry: on-line trace gas analysis at the ppb level, Int. J. Mass Spectrom., 149-150, 609–619, https://doi.org/10.1016/0168-1176(95)04294-U, 1995. a
Hanson, D. R. and Eisele, F.: Diffusion of H2SO4 in Humidified Nitrogen: Hydrated H2SO4, J. Phys. Chem. A, 104, 1715–1719, https://doi.org/10.1021/jp993622j, 2000. a
He, X.-C.: From the measurement of halogenated species to iodine particle formation, master thesis, University of Helsinki, Helsinki, https://helda.helsinki.fi/handle/10138/229173 (last access: 5 October 2023), 2017. a
He, X.-C., Iyer, S., Sipilä, M., Ylisirniö, A., Peltola, M., Kontkanen, J., Baalbaki, R., Simon, M., Kürten, A., Tham, Y. J., Pesonen, J., Ahonen, L. R., Amanatidis, S., Amorim, A., Baccarini, A., Beck, L., Bianchi, F., Brilke, S., Chen, D., Chiu, R., Curtius, J., Dada, L., Dias, A., Dommen, J., Donahue, N. M., Duplissy, J., El Haddad, I., Finkenzeller, H., Fischer, L., Heinritzi, M., Hofbauer, V., Kangasluoma, J., Kim, C., Koenig, T. K., Kubečka, J., Kvashnin, A., Lamkaddam, H., Lee, C. P., Leiminger, M., Li, Z., Makhmutov, V., Xiao, M., Marten, R., Nie, W., Onnela, A., Partoll, E., Petäjä, T., Salo, V.-T., Schuchmann, S., Steiner, G., Stolzenburg, D., Stozhkov, Y., Tauber, C., Tomé, A., Väisänen, O., Vazquez-Pufleau, M., Volkamer, R., Wagner, A. C., Wang, M., Wang, Y., Wimmer, D., Winkler, P. M., Worsnop, D. R., Wu, Y., Yan, C., Ye, Q., Lehtinen, K., Nieminen, T., Manninen, H. E., Rissanen, M., Schobesberger, S., Lehtipalo, K., Baltensperger, U., Hansel, A., Kerminen, V.-M., Flagan, R. C., Kirkby, J., Kurtén, T., and Kulmala, M.: Determination of the collision rate coefficient between charged iodic acid clusters and iodic acid using the appearance time method, Aerosol Sci. Tech., 55, 231–242, https://doi.org/10.1080/02786826.2020.1839013, 2021a. a, b, c
He, X.-C., Tham, Y. J., Dada, L., Wang, M., Finkenzeller, H., Stolzenburg, D., Iyer, S., Simon, M., Kürten, A., Shen, J., Rörup, B., Rissanen, M., Schobesberger, S., Baalbaki, R., Wang, D. S., Koenig, T. K., Jokinen, T., Sarnela, N., Beck, L. J., Almeida, J., Amanatidis, S., Amorim, A., Ataei, F., Baccarini, A., Bertozzi, B., Bianchi, F., Brilke, S., Caudillo, L., Chen, D., Chiu, R., Chu, B., Dias, A., Ding, A., Dommen, J., Duplissy, J., El Haddad, I., Gonzalez Carracedo, L., Granzin, M., Hansel, A., Heinritzi, M., Hofbauer, V., Junninen, H., Kangasluoma, J., Kemppainen, D., Kim, C., Kong, W., Krechmer, J. E., Kvashin, A., Laitinen, T., Lamkaddam, H., Lee, C. P., Lehtipalo, K., Leiminger, M., Li, Z., Makhmutov, V., Manninen, H. E., Marie, G., Marten, R., Mathot, S., Mauldin, R. L., Mentler, B., Möhler, O., Müller, T., Nie, W., Onnela, A., Petäjä, T., Pfeifer, J., Philippov, M., Ranjithkumar, A., Saiz-Lopez, A., Salma, I., Scholz, W., Schuchmann, S., Schulze, B., Steiner, G., Stozhkov, Y., Tauber, C., Tomé, A., Thakur, R. C., Väisänen, O., Vazquez-Pufleau, M., Wagner, A. C., Wang, Y., Weber, S. K., Winkler, P. M., Wu, Y., Xiao, M., Yan, C., Ye, Q., Ylisirniö, A., Zauner-Wieczorek, M., Zha, Q., Zhou, P., Flagan, R. C., Curtius, J., Baltensperger, U., Kulmala, M., Kerminen, V.-M., Kurtén, T., Donahue, N. M., Volkamer, R., Kirkby, J., Worsnop, D. R., and Sipilä, M.: Role of iodine oxoacids in atmospheric aerosol nucleation, Science, 371, 589–595, https://doi.org/10.1126/science.abe0298, 2021b. a, b, c, d, e, f, g, h, i, j
He, X. C., Shen, J., Iyer, S., Juuti, P., Zhang, J., Koirala, M., Kytökari, M. M., Worsnop, D. R., Rissanen, M., Kulmala, M., Maier, N. M., Mikkilä, J., Sipilä, M., and Kangasluoma, J.: Characterisation of gaseous iodine species detection using the multi-scheme chemical ionisation inlet-2 with bromide and nitrate chemical ionisation methods, Zenodo [data set], https://doi.org/10.5281/zenodo.8318790, 2023. a, b
Hearn, J. D. and Smith, G. D.: A Chemical Ionization Mass Spectrometry Method for the Online Analysis of Organic Aerosols, Anal. Chem., 76, 2820–2826, https://doi.org/10.1021/ac049948s, 2004. a
Hoffmann, T., O'Dowd, C. D., and Seinfeld, J. H.: Iodine oxide homogeneous nucleation: An explanation for coastal new particle production, Geophys. Res. Lett., 28, 1949–1952, https://doi.org/10.1029/2000GL012399, 2001. a
Huey, L. G.: Measurement of trace atmospheric species by chemical ionization mass spectrometry: Speciation of reactive nitrogen and future directions, Mass Spectrom. Rev., 26, 166–184, https://doi.org/10.1002/mas.20118, 2007. a
Iyer, S., Lopez-Hilfiker, F., Lee, B. H., Thornton, J. A., and Kurtén, T.: Modeling the Detection of Organic and Inorganic Compounds Using Iodide-Based Chemical Ionization, J. Phys. Chem. A, 120, 576–587, https://doi.org/10.1021/acs.jpca.5b09837, 2016. a, b, c
Iyer, S., He, X., Hyttinen, N., Kurtén, T., and Rissanen, M. P.: Computational and Experimental Investigation of the Detection of HO2 Radical and the Products of Its Reaction with Cyclohexene Ozonolysis Derived RO2 Radicals by an Iodide-Based Chemical Ionization Mass Spectrometer, J. Phys. Chem. A, 121, 6778–6789, https://doi.org/10.1021/acs.jpca.7b01588, 2017. a
Jenkin, M. E., Cox, R. A., Mellouki, A., Le Bras, G., and Poulet, G.: Kinetics of the reaction of iodine atoms with hydroperoxy radicals, J. Phys. Chem., 94, 2927–2934, https://doi.org/10.1021/j100370a036, 1990. a
Jenkin, M. E., Saunders, S. M., and Pilling, M. J.: The tropospheric degradation of volatile organic compounds: a protocol for mechanism development, Atmos. Environ., 31, 81–104, https://doi.org/10.1016/S1352-2310(96)00105-7, 1997. a
Jokinen, T., Sipilä, M., Junninen, H., Ehn, M., Lönn, G., Hakala, J., Petäjä, T., Mauldin III, R. L., Kulmala, M., and Worsnop, D. R.: Atmospheric sulphuric acid and neutral cluster measurements using CI-APi-TOF, Atmos. Chem. Phys., 12, 4117–4125, https://doi.org/10.5194/acp-12-4117-2012, 2012. a, b, c, d
Jordan, A., Haidacher, S., Hanel, G., Hartungen, E., Herbig, J., Märk, L., Schottkowsky, R., Seehauser, H., Sulzer, P., and Märk, T.: An online ultra-high sensitivity Proton-transfer-reaction mass-spectrometer combined with switchable reagent ion capability (PTR+SRI−MS), Int. J. Mass Spectrom., 286, 32–38, https://doi.org/10.1016/j.ijms.2009.06.006, 2009. a
Junninen, H., Ehn, M., Petäjä, T., Luosujärvi, L., Kotiaho, T., Kostiainen, R., Rohner, U., Gonin, M., Fuhrer, K., Kulmala, M., and Worsnop, D. R.: A high-resolution mass spectrometer to measure atmospheric ion composition, Atmos. Meas. Tech., 3, 1039–1053, https://doi.org/10.5194/amt-3-1039-2010, 2010. a
Kendall, R. A., Dunning, T. H., and Harrison, R. J.: Electron affinities of the first‐row atoms revisited. Systematic basis sets and wave functions, J. Chem. Phys., 96, 6796–6806, https://doi.org/10.1063/1.462569, 1992. a, b
Kercher, J. P., Riedel, T. P., and Thornton, J. A.: Chlorine activation by N2O5: simultaneous, in situ detection of ClNO2 and N2O5 by chemical ionization mass spectrometry, Atmos. Meas. Tech., 2, 193–204, https://doi.org/10.5194/amt-2-193-2009, 2009. a, b
Kirkby, J., Curtius, J., Almeida, J., Dunne, E., Duplissy, J., Ehrhart, S., Franchin, A., Gagné, S., Ickes, L., Kürten, A., Kupc, A., Metzger, A., Riccobono, F., Rondo, L., Schobesberger, S., Tsagkogeorgas, G., Wimmer, D., Amorim, A., Bianchi, F., Breitenlechner, M., David, A., Dommen, J., Downard, A., Ehn, M., Flagan, R. C., Haider, S., Hansel, A., Hauser, D., Jud, W., Junninen, H., Kreissl, F., Kvashin, A., Laaksonen, A., Lehtipalo, K., Lima, J., Lovejoy, E. R., Makhmutov, V., Mathot, S., Mikkilä, J., Minginette, P., Mogo, S., Nieminen, T., Onnela, A., Pereira, P., Petäjä, T., Schnitzhofer, R., Seinfeld, J. H., Sipilä, M., Stozhkov, Y., Stratmann, F., Tomé, A., Vanhanen, J., Viisanen, Y., Vrtala, A., Wagner, P. E., Walther, H., Weingartner, E., Wex, H., Winkler, P. M., Carslaw, K. S., Worsnop, D. R., Baltensperger, U., and Kulmala, M.: Role of sulphuric acid, ammonia and galactic cosmic rays in atmospheric aerosol nucleation, Nature, 476, 429–433, https://doi.org/10.1038/nature10343, 2011. a
Kürten, A., Rondo, L., Ehrhart, S., and Curtius, J.: Calibration of a Chemical Ionization Mass Spectrometer for the Measurement of Gaseous Sulfuric Acid, J. Phys. Chem. A, 116, 6375–6386, https://doi.org/10.1021/jp212123n, 2012. a, b, c, d, e, f
Lagg, A., Taucher, J., Hansel, A., and Lindinger, W.: Applications of proton transfer reactions to gas analysis, Int. J. Mass Spectrom., 134, 55–66, https://doi.org/10.1016/0168-1176(94)03965-8, 1994. a
Laskin, J., Laskin, A., and Nizkorodov, S. A.: Mass Spectrometry Analysis in Atmospheric Chemistry, Anal. Chem., 90, 166–189, https://doi.org/10.1021/acs.analchem.7b04249, 2018. a
Lee, B. H., Lopez-Hilfiker, F. D., Mohr, C., Kurtén, T., Worsnop, D. R., and Thornton, J. A.: An Iodide-Adduct High-Resolution Time-of-Flight Chemical-Ionization Mass Spectrometer: Application to Atmospheric Inorganic and Organic Compounds, Environ. Sci. Technol., 48, 6309–6317, https://doi.org/10.1021/es500362a, 2014. a, b, c, d, e, f
Liao, J., Huey, L. G., Liu, Z., Tanner, D. J., Cantrell, C. A., Orlando, J. J., Flocke, F. M., Shepson, P. B., Weinheimer, A. J., Hall, S. R., Ullmann, K., Beine, H. J., Wang, Y., Ingall, E. D., Stephens, C. R., Hornbrook, R. S., Apel, E. C., Riemer, D., Fried, A., Mauldin, R. L., Smith, J. N., Staebler, R. M., Neuman, J. A., and Nowak, J. B.: High levels of molecular chlorine in the Arctic atmosphere, Nat. Geosci., 7, 91–94, https://doi.org/10.1038/ngeo2046, 2014. a
Liu, L., Li, S., Zu, H., and Zhang, X.: Unexpectedly significant stabilizing mechanism of iodous acid on iodic acid nucleation under different atmospheric conditions, Sci. Total Environ., 859, 159832, https://doi.org/10.1016/j.scitotenv.2022.159832, 2023. a
Lopez-Hilfiker, F. D., Iyer, S., Mohr, C., Lee, B. H., D'Ambro, E. L., Kurtén, T., and Thornton, J. A.: Constraining the sensitivity of iodide adduct chemical ionization mass spectrometry to multifunctional organic molecules using the collision limit and thermodynamic stability of iodide ion adducts, Atmos. Meas. Tech., 9, 1505–1512, https://doi.org/10.5194/amt-9-1505-2016, 2016. a, b, c, d, e, f
Mielke, L. H., Furgeson, A., and Osthoff, H. D.: Observation of ClNO2 in a Mid-Continental Urban Environment, Environ. Sci. Technol., 45, 8889–8896, https://doi.org/10.1021/es201955u, 2011. a, b
Mishra, S., Singh, V., Jain, A., and Verma, K. K.: Determination of iodide by derivatization to 4-iodo-N,N-dimethylaniline and gas chromatography–mass spectrometry, Analyst, 125, 459–464, https://doi.org/10.1039/a908363d, 2000. a, b
Munson, M. S. B. and Field, F. H.: Chemical Ionization Mass Spectrometry. I. General Introduction, J. Am. Chem. Soc., 88, 2621–2630, https://doi.org/10.1021/ja00964a001, 1966. a
Neese, F.: The ORCA program system: The ORCA program system, WIRES Comput. Mol. Sci., 2, 73–78, https://doi.org/10.1002/wcms.81, 2012. a
O'Dowd, C. D., Jimenez, J. L., Bahreini, R., Flagan, R. C., Seinfeld, J. H., Hämeri, K., Pirjola, L., Kulmala, M., Jennings, S. G., and Hoffmann, T.: Marine aerosol formation from biogenic iodine emissions, Nature, 417, 632–636, https://doi.org/10.1038/nature00775, 2002. a
O'Meara, S. P., Xu, S., Topping, D., Alfarra, M. R., Capes, G., Lowe, D., Shao, Y., and McFiggans, G.: PyCHAM (v2.1.1): a Python box model for simulating aerosol chambers, Geosci. Model Dev., 14, 675–702, https://doi.org/10.5194/gmd-14-675-2021, 2021. a
Pan, Y., Zhang, Q., Zhou, W., Zou, X., Wang, H., Huang, C., Shen, C., and Chu, Y.: Detection of Ketones by a Novel Technology: Dipolar Proton Transfer Reaction Mass Spectrometry (DP-PTR-MS), J. Am. Soc. Mass Spectr., 28, 873–879, https://doi.org/10.1007/s13361-017-1638-7, 2017. a
Passananti, M., Zapadinsky, E., Zanca, T., Kangasluoma, J., Myllys, N., Rissanen, M. P., Kurtén, T., Ehn, M., Attoui, M., and Vehkamäki, H.: How well can we predict cluster fragmentation inside a mass spectrometer?, Chem. Commun., 55, 5946–5949, https://doi.org/10.1039/C9CC02896J, 2019. a, b, c
Peterson, K. A., Figgen, D., Goll, E., Stoll, H., and Dolg, M.: Systematically convergent basis sets with relativistic pseudopotentials. II. Small-core pseudopotentials and correlation consistent basis sets for the post-d group 16–18 elements, J. Chem. Phys., 119, 11113–11123, https://doi.org/10.1063/1.1622924, 2003. a
Riplinger, C. and Neese, F.: An efficient and near linear scaling pair natural orbital based local coupled cluster method, J. Chem. Phys., 138, 034106, https://doi.org/10.1063/1.4773581, 2013. a
Riplinger, C., Sandhoefer, B., Hansen, A., and Neese, F.: Natural triple excitations in local coupled cluster calculations with pair natural orbitals, J. Chem. Phys., 139, 134101, https://doi.org/10.1063/1.4821834, 2013. a
Rissanen, M. P., Mikkilä, J., Iyer, S., and Hakala, J.: Multi-scheme chemical ionization inlet (MION) for fast switching of reagent ion chemistry in atmospheric pressure chemical ionization mass spectrometry (CIMS) applications, Atmos. Meas. Tech., 12, 6635–6646, https://doi.org/10.5194/amt-12-6635-2019, 2019. a, b, c, d
Saiz-Lopez, A., Fernandez, R. P., Ordóñez, C., Kinnison, D. E., Gómez Martín, J. C., Lamarque, J.-F., and Tilmes, S.: Iodine chemistry in the troposphere and its effect on ozone, Atmos. Chem. Phys., 14, 13119–13143, https://doi.org/10.5194/acp-14-13119-2014, 2014. a, b
Sanchez, J., Tanner, D. J., Chen, D., Huey, L. G., and Ng, N. L.: A new technique for the direct detection of HO2 radicals using bromide chemical ionization mass spectrometry (Br-CIMS): initial characterization, Atmos. Meas. Tech., 9, 3851–3861, https://doi.org/10.5194/amt-9-3851-2016, 2016. a, b
Saunders, S. M., Jenkin, M. E., Derwent, R. G., and Pilling, M. J.: Protocol for the development of the Master Chemical Mechanism, MCM v3 (Part A): tropospheric degradation of non-aromatic volatile organic compounds, Atmos. Chem. Phys., 3, 161–180, https://doi.org/10.5194/acp-3-161-2003, 2003. a
Shen, J. and He, X.-C.: MARFORCE-Flowtube model, GitHub [code], https://github.com/momo-catcat/MARFORCE-flowtube (last access: 5 September 2023), 2023. a, b, c, d
Sherwen, T., Evans, M. J., Carpenter, L. J., Andrews, S. J., Lidster, R. T., Dix, B., Koenig, T. K., Sinreich, R., Ortega, I., Volkamer, R., Saiz-Lopez, A., Prados-Roman, C., Mahajan, A. S., and Ordóñez, C.: Iodine's impact on tropospheric oxidants: a global model study in GEOS-Chem, Atmos. Chem. Phys., 16, 1161–1186, https://doi.org/10.5194/acp-16-1161-2016, 2016. a
Sipilä, M., Sarnela, N., Jokinen, T., Henschel, H., Junninen, H., Kontkanen, J., Richters, S., Kangasluoma, J., Franchin, A., Peräkylä, O., Rissanen, M. P., Ehn, M., Vehkamäki, H., Kurten, T., Berndt, T., Petäjä, T., Worsnop, D., Ceburnis, D., Kerminen, V.-M., Kulmala, M., and O'Dowd, C.: Molecular-scale evidence of aerosol particle formation via sequential addition of HIO3, Nature, 537, 532–534, https://doi.org/10.1038/nature19314, 2016. a, b, c, d
Smith, D. and Španěl, P.: Selected ion flow tube mass spectrometry (SIFT-MS) for on-line trace gas analysis, Mass Spectrom. Rev., 24, 661–700, https://doi.org/10.1002/mas.20033, 2005. a
Tham, Y. J., He, X.-C., Li, Q., Cuevas, C. A., Shen, J., Kalliokoski, J., Yan, C., Iyer, S., Lehmusjärvi, T., Jang, S., Thakur, R. C., Beck, L., Kemppainen, D., Olin, M., Sarnela, N., Mikkilä, J., Hakala, J., Marbouti, M., Yao, L., Li, H., Huang, W., Wang, Y., Wimmer, D., Zha, Q., Virkanen, J., Spain, T. G., O'Doherty, S., Jokinen, T., Bianchi, F., Petäjä, T., Worsnop, D. R., Mauldin, R. L., Ovadnevaite, J., Ceburnis, D., Maier, N. M., Kulmala, M., O'Dowd, C., Dal Maso, M., Saiz-Lopez, A., and Sipilä, M.: Direct field evidence of autocatalytic iodine release from atmospheric aerosol, P. Natl. Acad. Sci. USA, 118, e2009951118, https://doi.org/10.1073/pnas.2009951118, 2021. a, b, c, d, e, f, g, h, i
Thornton, J. A., Kercher, J. P., Riedel, T. P., Wagner, N. L., Cozic, J., Holloway, J. S., Dubé, W. P., Wolfe, G. M., Quinn, P. K., Middlebrook, A. M., Alexander, B., and Brown, S. S.: A large atomic chlorine source inferred from mid-continental reactive nitrogen chemistry, Nature, 464, 271–274, https://doi.org/10.1038/nature08905, 2010. a
Veres, P., Roberts, J. M., Warneke, C., Welsh-Bon, D., Zahniser, M., Herndon, S., Fall, R., and de Gouw, J.: Development of negative-ion proton-transfer chemical-ionization mass spectrometry (NI-PT-CIMS) for the measurement of gas-phase organic acids in the atmosphere, Int. J. Mass Spectrom., 274, 48–55, https://doi.org/10.1016/j.ijms.2008.04.032, 2008. a, b
Wang, M., He, X.-C., Finkenzeller, H., Iyer, S., Chen, D., Shen, J., Simon, M., Hofbauer, V., Kirkby, J., Curtius, J., Maier, N., Kurtén, T., Worsnop, D. R., Kulmala, M., Rissanen, M., Volkamer, R., Tham, Y. J., Donahue, N. M., and Sipilä, M.: Measurement of iodine species and sulfuric acid using bromide chemical ionization mass spectrometers, Atmos. Meas. Tech., 14, 4187–4202, https://doi.org/10.5194/amt-14-4187-2021, 2021. a, b, c, d, e, f, g, h, i, j, k, l, m, n, o, p, q, r, s, t, u, v
Wang, S., McNamara, S. M., Moore, C. W., Obrist, D., Steffen, A., Shepson, P. B., Staebler, R. M., Raso, A. R. W., and Pratt, K. A.: Direct detection of atmospheric atomic bromine leading to mercury and ozone depletion, P. Natl. Acad. Sci. USA, 116, 14479–14484, https://doi.org/10.1073/pnas.1900613116, 2019. a
Wang, X., Jacob, D. J., Downs, W., Zhai, S., Zhu, L., Shah, V., Holmes, C. D., Sherwen, T., Alexander, B., Evans, M. J., Eastham, S. D., Neuman, J. A., Veres, P. R., Koenig, T. K., Volkamer, R., Huey, L. G., Bannan, T. J., Percival, C. J., Lee, B. H., and Thornton, J. A.: Global tropospheric halogen (Cl, Br, I) chemistry and its impact on oxidants, Atmos. Chem. Phys., 21, 13973–13996, https://doi.org/10.5194/acp-21-13973-2021, 2021. a
Weigend, F. and Ahlrichs, R.: Balanced basis sets of split valence, triple zeta valence and quadruple zeta valence quality for H to Rn: Design and assessment of accuracy, Phys. Chem. Chem. Phys., 7, 3297, https://doi.org/10.1039/b508541a, 2005. a
Westmore, J. B. and Alauddin, M. M.: Ammonia chemical ionization mass spectrometry, Mass Spectrom. Rev., 5, 381–465, https://doi.org/10.1002/mas.1280050403, 1986. a
Wine, P. H., Thompson, R. J., Ravishankara, A. R., Semmes, D. H., Gump, C. A., Torabi, A., and Nicovich, J. M.: Kinetics of the reaction OH + SO2 + M → HOSO2 + M. Temperature and pressure dependence in the fall-off region, J. Phys. Chem., 88, 2095–2104, https://doi.org/10.1021/j150654a031, 1984. a
Woodward-Massey, R., Taha, Y. M., Moussa, S. G., and Osthoff, H. D.: Comparison of negative-ion proton-transfer with iodide ion chemical ionization mass spectrometry for quantification of isocyanic acid in ambient air, Atmos. Environ., 98, 693–703, https://doi.org/10.1016/j.atmosenv.2014.09.014, 2014. a, b
Zellner, R., Ewig, F., Paschke, R., and Wagner, G.: Pressure and temperature dependence of the gas-phase recombination of hydroxyl radicals, J. Phys. Chemi., 92, 4184–4190, https://doi.org/10.1021/j100325a038, 1988. a
Zhang, R., Xie, H.-B., Ma, F., Chen, J., Iyer, S., Simon, M., Heinritzi, M., Shen, J., Tham, Y. J., Kurtén, T., Worsnop, D. R., Kirkby, J., Curtius, J., Sipilä, M., Kulmala, M., and He, X.-C.: Critical Role of Iodous Acid in Neutral Iodine Oxoacid Nucleation, Environ. Sci. Technol., 56, 14166–14177, https://doi.org/10.1021/acs.est.2c04328, 2022. a