the Creative Commons Attribution 4.0 License.
the Creative Commons Attribution 4.0 License.
 | 03 Nov 2023
Validation of the WRF-ARW eclipse model with measurements from the 2019 and 2020 total solar eclipses
Carl E. Spangrude
Jennifer W. Fowler
W. Graham Moss
June Wang
Field research campaigns in 2019 and 2020 collected hourly atmospheric profiles via radiosonde surrounding the 2 July 2019 and 14 December 2020 total solar eclipses over South America from locations within the paths of eclipse totality. As part of these atmospheric data collection campaigns, the eclipse module of the Advanced Research Weather Research and Forecast (WRF-ARW) model was utilized to model meteorological conditions before, during, and after the eclipse events. The surface and upper-air observational datasets collected through these campaigns have enabled further assessment and validation of the WRF-ARW's eclipse module performance in simulating atmospheric responses to total solar eclipses. We provide descriptions of the field campaigns for both 2019 and 2020 and present results from comparisons of meteorological variables both at the surface and aloft using observational datasets obtained through the campaigns. The paper concludes by recommending further scientific analyses to be explored utilizing the unique datasets presented.
- Article
(5591 KB) - Full-text XML
-
Supplement
(360 KB) - BibTeX
- EndNote


Numerical weather prediction models are utilized widely in the fields of meteorology and climatology for characterizing atmospheric states, general weather forecasting, and research purposes. At present, many such predictive models exist with various intended applications, inherent assumptions, and levels of complexity. One such numerical model, the Advanced Research Weather Research and Forecast model (WRF-ARW; Skamarock et al., 2008; Skamarock et al., 2021), is of particular interest because it features an eclipse module (WRF-eclipse) for calculating solar eclipses in model simulations. Of course, one major research application of this module is for investigation of atmospheric responses to a total solar eclipse (TSE). WRF-eclipse (Montornès et al., 2016) is implemented here for assessing model performance during two TSE events occurring over South America in 2019 and 2020. Due to their precise temporal and spatial predictability, eclipses can offer valuable research opportunities through measurements of atmospheric responses to the reduction or removal of incoming solar irradiance both at the surface and aloft. However, comprehensive meteorological studies of eclipses are made difficult by the relatively short duration of eclipse totality (i.e., ∼ 2 min) compared to typical model output and observational measurement frequencies. Such measurements (Amiridis et al., 2007; Anderson et al., 1972; Anfossi et al., 2004; Aplin and Harrison, 2003; Eaton et al., 1997; Founda et al., 2007; Giles and Hanna, 2016; Hanna, 2000; Ramchandran et al., 2002; Szalowski, 2002; Fowler et al., 2019) can be carried out through field research campaigns surrounding an eclipse. Specifically, field campaigns dedicated to high-temporal-resolution balloon-borne radiosonde observations during a TSE can produce valuable datasets for establishing a more robust scientific understanding of the atmospheric responses to TSEs, such as eclipse-induced atmospheric gravity waves (AGWs). Such campaigns were performed during the TSEs of 21 August 2017 (Fowler et al., 2019), 2 July 2019 (Colligan et al., 2020), and 14 December 2020 and were led by the Montana Space Grant Consortium and other collaborators. This study presents basic WRF-eclipse model validation of not only surface variables but also – for the first time – preliminary validation using relatively-high-frequency profile observations.
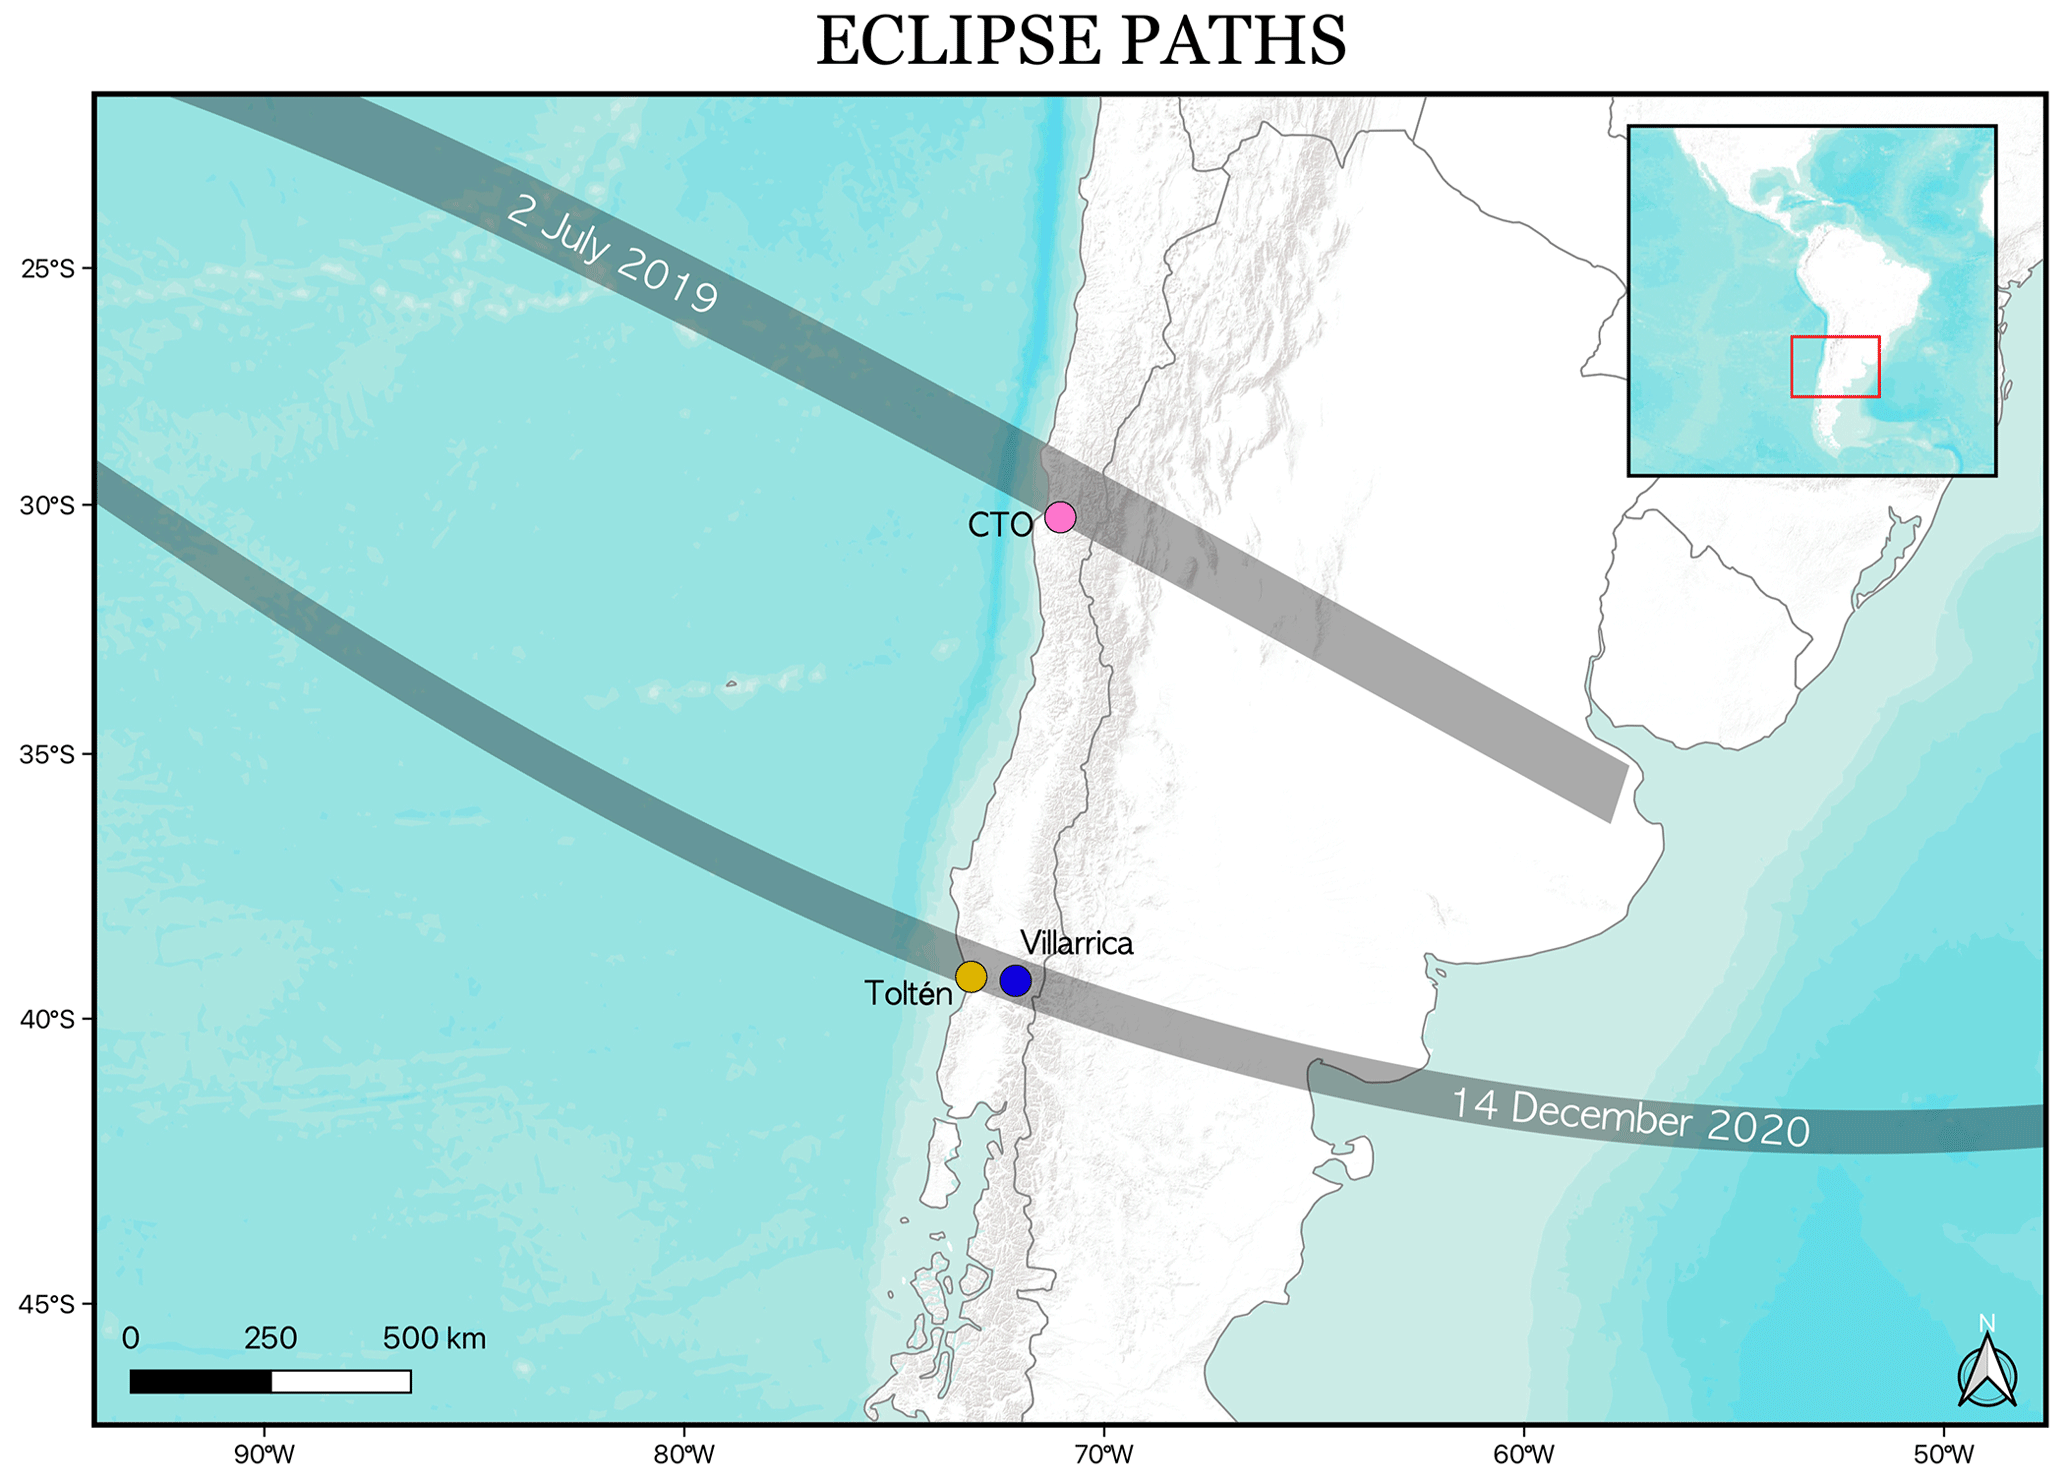
Figure 1Map of eclipse totality paths (gray shaded areas) for the 2 July 2019 and 14 December 2020 TSEs. The 2019 launch site at Collowara Tourism Observatory (CTO; pink point) and 2020 launch sites, Toltén (yellow point) and Villarrica (blue point), are shown. Map created by Carl Spangrude using QGIS software ver. 3.22.0. Eclipse paths courtesy of Xavier M. Jubier (http://xjubier.free.fr/en/site_pages/SolarEclipsesGoogleEarth.html, last access: 13 July 2022; Jubier, 2022).
To build upon the findings of eclipse-focused ballooning research campaigns (Fowler et al., 2019), another similar eclipse ballooning campaign was proposed for the 2 July 2019 TSE over South America, described by Colligan et al. (2020). The 2019 campaign collected balloon-borne radiosonde data for 30 h surrounding the 2019 TSE. Soundings collected during the 2019 TSE specifically targeted higher altitudes and were launched with greater temporal frequency before and after the eclipse, relative to previous campaigns, to maximize stratospheric measurements. A brief overview of the 2019 campaign is provided in Sect. 2. To verify the findings of the 2019 eclipse campaign, a subsequent field campaign was proposed and carried out during the only TSE of 2020 over Chile and Argentina. Figure 1 shows the paths of eclipse totality for the 2019 and 2020 TSEs. These two TSEs over South America presented a unique opportunity to conduct this research; the passage of two TSEs over the same general region will not occur again until the 2037 and 2038 eclipses over Australia and New Zealand. In contrast to their relative geographic similarities, the 2019 and 2020 TSEs occurred at different times of day, during opposite seasons in the Southern Hemisphere, and during markedly different meteorological conditions. Further, measurements were performed at a much higher elevation in 2019 relative to 2020. While these differences slightly reduce the feasibility of making direct comparisons between the two TSEs, a general assessment of WRF-eclipse's ability to simulate eclipse impacts across various meteorological, temporal, and seasonal conditions is possible. If profile data generated by WRF-eclipse are within a reasonable range of accuracy relative to observations from 2019 and 2020, this finding may support the use of model forecasts to estimate future TSE impacts on the atmosphere.
The only TSE of 2020 occurred amid a global pandemic on 14 December over southern South America. Overcoming numerous logistic challenges, a field project entitled Atmospheric Gravity Wave Radiosonde Field Campaign for Eclipse 2020 was successfully conducted in Chile, collecting surface measurements and hourly radiosonde profiles from two locations 24 h before, during, and 24 h after eclipse totality. Prior to the COVID-19 pandemic, the 2020 campaign was intended to complete measurements from four sites spanning the continental extent of the path of totality. However, due to the increased logistical complexity presented by the pandemic, the final launch locations were ultimately reduced to two locations in Chile. Both launch sites were located along the centerline of eclipse totality, allowing for additional validation of AGW detection methods compared to measurements from a single site as performed by Colligan et al. (2020). The goals of the 2020 campaign were to replicate the methods employed during previous field campaigns (Colligan et al., 2020; Fowler et al., 2019), to study the atmospheric impacts of a TSE, and to detect eclipse-induced AGWs in the stratosphere via balloon-borne radiosonde measurements. While totality occurred during the last few hours of daylight for the 2019 TSE, totality of the 2020 TSE occurred near mid-day. Additionally, thick cloud cover and persistent precipitation during the 2020 campaign obscured views of the eclipse and reduced the overall reduction in solar irradiance at the surface caused by the TSE. These meteorological conditions, in stark contrast to the clear skies experienced during the 2019 TSE campaign, offered further opportunity to assess the performance of WRF-eclipse (Montornès et al., 2016) in simulating TSE events across a range of meteorological conditions. A further description of the 2020 campaign is provided in Sect. 2.2.
The primary goals of this paper are as follows: (1) provide descriptions and present comparisons of the field campaigns for the 2019 and 2020 TSEs, (2) introduce the resulting dataset from the 2020 campaign, and (3) present preliminary results for assessment and validation of the performance of WRF-eclipse version 4.3.2 (Skamarock et al., 2021) in simulating atmospheric responses to the 2019 and 2020 TSEs. Though the ability to represent TSEs with WRF-eclipse was included in the fourth major release of WRF-ARW (Skamarock et al., 2019), few studies (Montornès et al., 2016; Moss et al., 2020, 2021; Spangrude et al., 2019) have utilized radiosonde-sounding data to validate WRF-eclipse's upper-air performance. Observational data obtained during the 2019 and 2020 eclipse field campaigns by both radiosondes and in situ surface weather stations (Spangrude et al., 2023) are analyzed here to assess and validate the performance of WRF-eclipse in simulating TSEs across a range of environmental and temporal conditions. Section 2 provides descriptions of the 2019 and 2020 eclipse campaigns and describes the modeling methods implemented in this study related to WRF-ARW. Section 3 presents preliminary results from comparisons between measurements and model results for the 2019 and 2020 eclipse events. The study's resulting conclusions and implications for future research are provided in Sect. 4.
2.1 Description of the 2019 radiosonde eclipse campaign
The 2019 campaign utilized balloon-borne radiosondes launched hourly before, during, and after eclipse totality to detect eclipse-induced AGWs in the stratosphere. Both surface and profile observations were made from a single site within the path of eclipse totality beginning 24 h prior to first contact of the eclipse and continuing until ∼ 3 h after fourth contact. An additional radiosonde flight was performed 30 min prior to totality. First contact (C1) of the 2019 eclipse occurred at 19:22:41 UTC and fourth contact (C4) occurred at 21:46:24 UTC. Eclipse totality occurred at 20:39:17 UTC and lasted approximately 1 min. The radiosonde launch location was determined by intended “coincident measurements with the Andes LiDAR Observatory” (Colligan et al., 2020). By characterizing and distinguishing wave parameters of AGWs generated by specific sources (e.g., topography, wind shear, convection), the 2019 campaign resulted in the first unambiguous detection of eclipse-induced AGWs in the stratosphere (Colligan et al., 2020). The AGW analysis for the TSE of 2 July 2019 is described in detail by Colligan et al. (2020).
The 2019 field site is located in the Coquimbo region, approximately 2 km southeast of Andacollo, Chile, at the Collowara Tourism Observatory (−30.250∘, −71.063∘; 1283 m). The site has a primarily easterly aspect and little surface vegetation. During the campaign, 2 m air temperature ranged from 11–21 ∘C and 2 m winds were generally low and from the west. The sky was nearly cloud free for much of the campaign, with “little convective activity” and “no frontal system passages” (Colligan et al., 2020).
The 2019 campaign personnel were highly trained in radiosonde operations and followed a detailed launch schedule and flight checklists during the campaign. In total, 25 radiosonde flights were performed hourly between 19:18:00 UTC on 1 July 2019 and 22:35:00 UTC on 2 July 2019. Graw brand DFM-09 radiosondes were suspended from 600 g latex balloons and measured air temperature, pressure, relative humidity, wind speed, and wind direction every 1 s (∼ 5 m vertically). All radiosondes were initialized using 2 m surface meteorological values provided by an in situ Lufft brand WS502-UMB Smart Weather Sensor measuring temperature, relative humidity, pressure, wind speed, wind direction, and solar irradiance every 2 s. Measurement uncertainties for the DFM-09 radiosonde and the WS502-UMB station are provided by the manufacturer's technical datasheets. Each radiosonde flight lasted approximately 2 h. Graw brand GRAWMET software Version 5.12 was used for all ground station systems. The lowest maximum radiosonde altitude was 10.6 km and the highest maximum altitude was 34.2 km. The average maximum altitude for the 25 flights was 30.5 km.
WRF-ARW Version 3.8 (Skamarock et al., 2008) was utilized in the planning phase of the 2019 campaign. Meteorological predictions for the campaign were generated using WRF-ARW for two reasons: firstly to provide local weather predictions for operational and logistical planning and secondly to provide Chilean aviation authorities and regional air traffic controllers with predicted volumes of operational intent for the campaign's radiosonde flight trajectories, based on local weather conditions surrounding measurements of the TSE. Data collected during the 2019 campaign were subsequently used for preliminary validation of the WRF-eclipse model by Spangrude et al. (2019).
A major update to the WRF-ARW model from Version 3.9 to Version 4.0 occurred on 8 June 2018. However, WRF-eclipse was not fully included in Version 4 until the Version 4.3.1 release on 28 October 2021. As such, WRF-ARW was originally run using Version 3.8, which did include the eclipse module, for the 2019 campaign. Since the inclusion of WRF-eclipse in the WRF-ARW Version 4.3.1 update, the 2019 WRF-ARW model simulations have been re-run for comparison to the model simulations of the 2020 TSE, with results presented in Sect. 3. For full clarity, all WRF-ARW and WRF-eclipse model results presented here were generated with Version 4.3.2 of the WRF-ARW model (Skamarock et al., 2021).
2.2 Description of the atmospheric gravity wave radiosonde field campaign for the eclipse in 2020
The 2020 TSE passed over southern South America on 14 December 2020. During the 2020 campaign, surface and upper-air data were collected over 2 d (13–15 December 2020) from two sites in Chile, Toltén (−39.236∘, −73.160∘; 3 m) and Villarrica (−39.307∘, −72.104∘; 276 m) (Fig. 1). C1 of the eclipse occurred at 14:39:17 UTC (14:41:21 UTC) at Toltén (Villarrica) and C4 occurred at 17:28:59 UTC (17:31:22 UTC). Eclipse totality lasted approximately 2 min, occurring at 16:01:45 UTC at Toltén and 16:04:12 UTC at Villarrica. Both sites are located in the Araucanía region in southern Chile. Toltén is less than 10 km from the Pacific coast, while Villarrica is located along the Andean foothills, about 100 km inland from Toltén. The area surrounding Toltén features primarily agricultural and native grasslands and tributaries into the South Pacific Ocean. At a higher elevation, Villarrica's surrounding environment is relatively more forested with both deciduous and conifer species. Surface winds at each site were generally low and from the west during the campaign, though gusts were higher at Toltén due to its coastal proximity. Thick clouds and heavy rain persisted throughout much of the campaign at each site; however, measurements of precipitation were not performed at Villarrica or Toltén.
During the 2020 campaign, hourly atmospheric soundings were collected from Toltén and Villarrica using helium-filled 600 g balloons carrying Graw DFM-17 radiosondes. Each radiosonde sounding recorded temperature, pressure, relative humidity, wind speed, and wind direction every 1 s (∼ 5 m vertically) from the surface into the mid-stratosphere. Measurement uncertainties associated with the DFM-17 radiosonde sensors are provided by the radiosonde manufacturer's technical datasheet. Each radiosonde ascent lasted approximately 2 h. At each site, observations of temperature, relative humidity, pressure, wind speed, wind direction, and solar irradiance were recorded every 2 s at 2 m above ground using Lufft brand WS502-UMB Smart Weather Sensors identical to the 2019 station cited in Sect. 2.1. Surface measurements from the WS502-UMB station were used for initialization of all radiosondes. While identical surface stations were used for the 2019 and 2020 campaigns, the DFM-17 radiosondes used in 2020 featured slightly improved measurement uncertainties for wind speed relative to the DFM-09 (0.1 and 0.2 m s−1, respectively). Additionally, the DFM-09 calculates pressure using a single GPS, while the DFM-17 utilizes multi-GNSS, resulting in improved uncertainties in pressure, especially aloft. Graw brand GRAWMET software Version 5.16 was used for all ground station systems.
All radiosonde soundings were collected hourly beginning at 16:01:00 UTC on 13 December 2020 and ending at 18:14:00 UTC on 15 December 2020. A total of 50 balloon-borne radiosondes were released hourly from each site simultaneously. Additionally, a radiosonde was released from each site at a 30 min interval during eclipse totality, resulting in six active soundings at various altitudes across two locations during maximum totality. Continuous surface and profile measurements concluded after 50 h, at 18:14:00 UTC on 15 December 2020, corresponding to termination of the final sounding at each site. Standard operating procedures utilized during the 2019 campaign (Colligan et al., 2020) were adapted for scaling to multiple teams in 2020.
In 2020, the lowest maximum radiosonde altitude for soundings collected at Toltén (Villarrica) was 16.9 km (10.6 km) and the highest maximum altitude was 36.5 km (36.8 km). The average maximum altitude for soundings collected at Toltén (Villarrica) was 31.2 km (29.6 km). The maximum average altitude at Villarrica was lower than at Toltén due to winds aloft and increased interference from topography.
Data quality was maintained throughout both campaigns through extensive team training to ensure adherence to operational standards defined by the Federal Meteorological Handbook No. 3 (NOAA, 1997). Once all data were collected, three types of screening methods (Meek and Hatfield, 1994) were employed for quality control of the data. These methods include checks for (1) range limits to confirm values are within a reasonably expected range, (2) rate-of-change limits to identify abrupt data changes during flight, and (3) continuity of the data over time to identify periods of interference when ground receivers were not properly receiving data (Meek and Hatfield, 1994). As a result of careful data quality control and consistent field procedures, 94 of 100 soundings were of high enough quality and completeness to be analyzed (49 from Toltén and 45 from Villarrica) from 2020 and 22 of 25 soundings met the criteria for quality and completeness in 2019. The acceptable soundings from both campaigns each reached the minimally acceptable pressure level of 400 hPa as defined by the NOAA National Weather Service (NWS, n.d.). The omitted profiles either lost telemetry completely in flight, failed to properly save data files, or did not reach a high enough altitude to be considered in analyses. This study compares the aforementioned surface and profile measurements to model simulations generated by WRF-ARW Version 4.3.2. A further description of the WRF-ARW model is provided in Sect. 2.3.
2.3 WRF-ARW models
WRF-ARW Version 4.2.1 was originally used to generate meteorological forecasts for balloon trajectory prediction during the 2020 campaign. All 2019 and 2020 simulations have subsequently been re-run using WRF-ARW Version 4.3.2 (Skamarock et al., 2021) for validation of WRF-eclipse. A three-domain model simulation with 50 vertical levels and 253 × 253 grid points (in each domain) was initialized using boundary conditions provided by Global Forecast System (Version 16) data with 0.25∘ × 0.25∘ horizontal and hourly temporal resolutions for 2019 and 2020. Models were initialized using the Thompson microphysics scheme (Thompson et al., 2008), Yonsei University Scheme for planetary boundary layer (PBL) physics (Hong, Noh, and Dudhia, 2006), and Rapid Radiative Transfer Model for GCMs (RRTMG; Iacono et al., 2008). A 1 min radiation time step and 45 s integration time step were used. The model top was set to the 50 hPa pressure level. The 2020 simulations were configured to begin at 00:00:00 UTC on 13 December 2020 and run through 00:00:00 UTC on 16 December 2020. The 2019 simulations were run from 00:00:00 UTC on 2 July 2019 to 00:00:00 UTC on 4 July 2019. Three geographic model domains were successively nested with a 1:3 parent grid ratio to enable a 1 km horizontal resolution in the innermost domain, centered over the launch site(s). Further specifications for WRF-ARW model initialization and configuration are outlined in Tables S1–S4 in the Supplement. Inclusion of TSE calculations is the only difference in initialization of the WRF-ARW and WRF-eclipse simulations.
Three meteorological variables are examined here for comparison between observations and WRF-ARW/WRF-eclipse model results for the 2019 and 2020 TSE campaigns. Observational data are comprised of surface-based in situ measurements of air temperature (∘C) and irradiance (W m−2) at 2 m, wind magnitude (m s−1) at 2 m (surface station) and 10 m (radiosonde), and air temperature (∘C) profiles up to ∼ 30 km from the 94 soundings collected. Radiosonde soundings are not representative of a vertically continuous column of the atmosphere, but rather can experience significant horizontal drift during ascent. As such, model grid cells corresponding to both the horizontal and vertical flight paths of soundings are considered in comparisons between model results and the observations presented in Sect. 3.
3.1 Comparison of measured and modeled near-surface variables
Presented here are near-surface observations of irradiance (W m−2), wind speed (m s−1), and air temperature (∘C) compared against WRF-ARW and WRF-eclipse model results for the 2019 and 2020 eclipses. The two indicators used to evaluate accuracy of the WRF-ARW models were root mean square error (RMSE) and mean absolute error (MAE); values from the radiosonde profiles were used as the reference values (Sun et al., 2023). The corresponding equations are as follows:
where Tr and Tm represent temperature from the radiosonde and temperature from the model, respectively, with Is, Im, wr, and wm substituting for temperature in evaluating the additional parameters. As a note, results for WRF-ARW in Figs. 2–4 are masked by WRF-eclipse results until the time of the eclipse; however, both models were run for the entirety of the time series. As seen in Fig. 2, in situ measurements for the 2019 eclipse concluded prior to conclusion of the 2020 model simulations, hence the difference in the time series. Figure 2 shows that the measured irradiance during the 2020 eclipse was far more dynamic relative to the smoother time series for 2019 (Fig. 2a). Observations of irradiance at 2 m during the 2019 eclipse show an immediate decrease beginning at C1 leading to 0 W m−2 during totality (Fig. 2a). WRF-eclipse simulates this decrease in incoming shortwave radiation well, showing close agreement with observations (Fig. 2a) based on an RMSE of 14.9 W m−2 and MAE of 13.1 W m−2. As expected, results from WRF-ARW do not include an eclipse-related decrease in irradiance; hence results are an RMSE of 107.0 W m−2 and MAE of 75.0 W m−2.
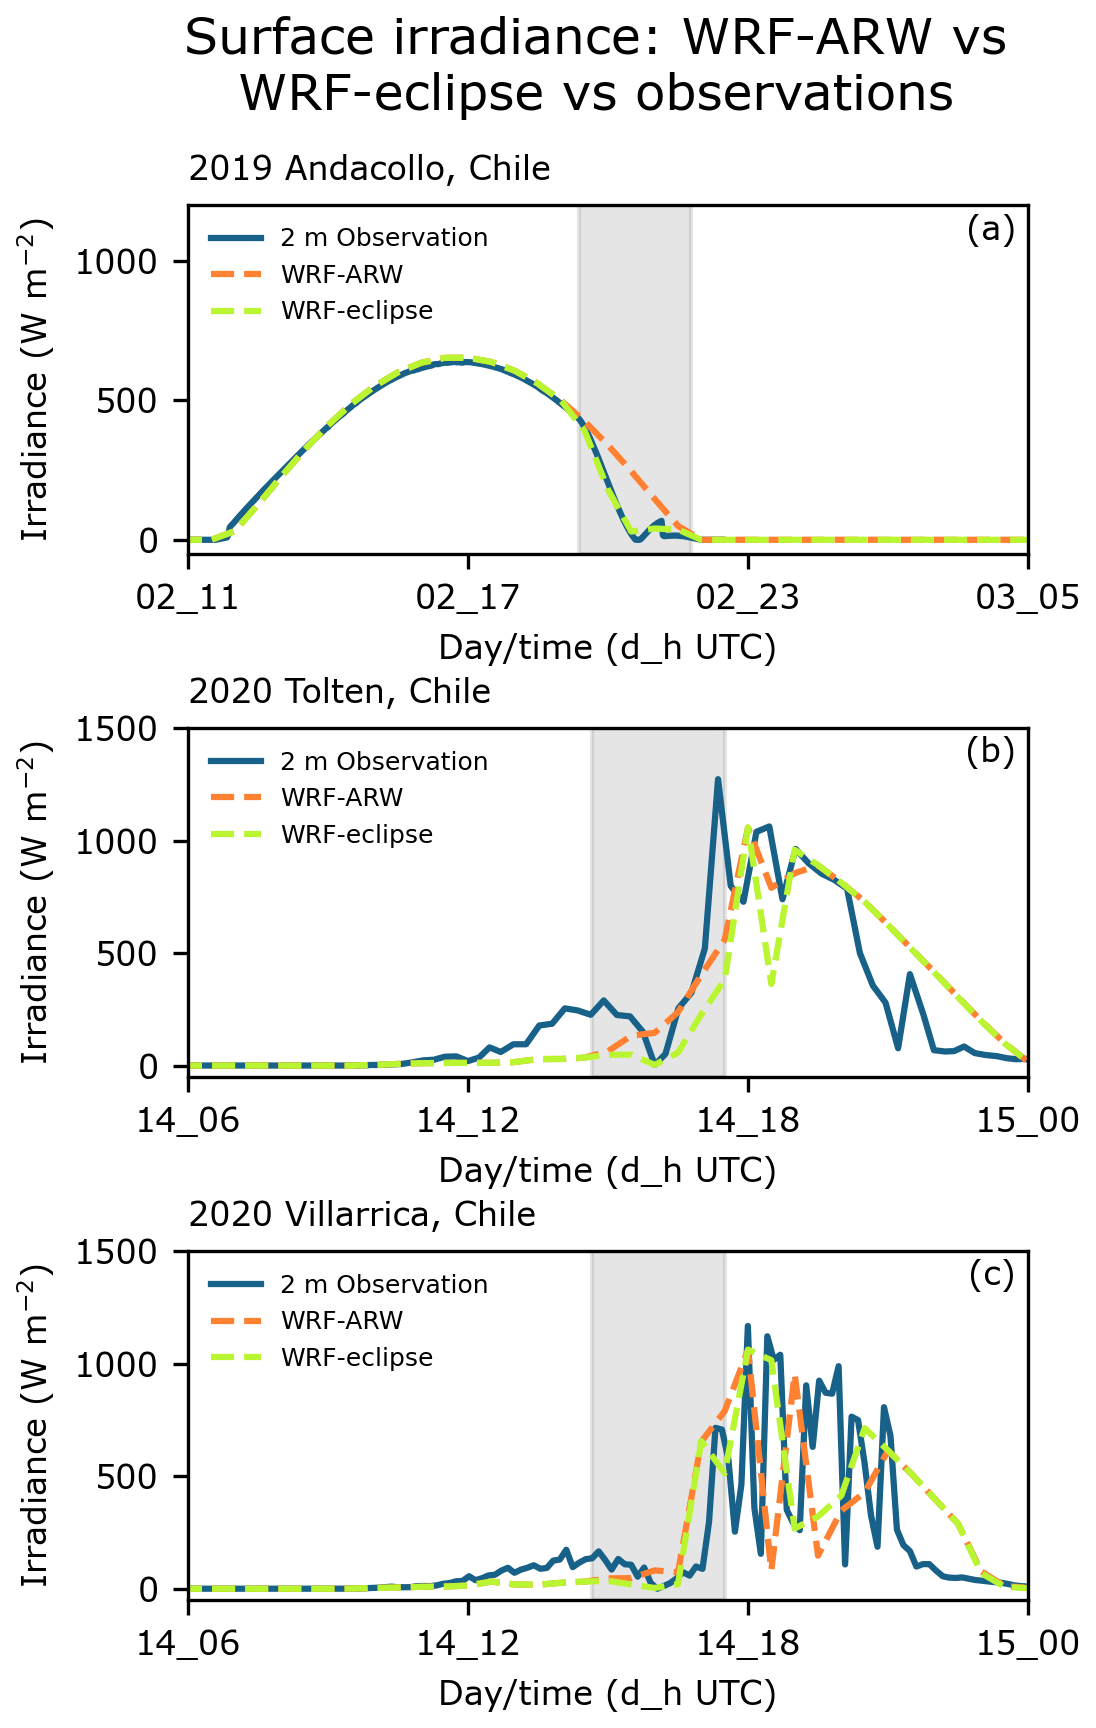
Figure 2Comparison of irradiance (W m−2) observations (solid blue lines) and modeled results at the surface for the 2 July 2019 eclipse (a) and from two sites (Toltén, b; Villarrica, c) during the 14 December 2020 eclipse. Modeled results include WRF simulations with the eclipse enabled (dashed green lines) and disabled (dashed orange lines). Times of the eclipses are marked by the shaded gray area. Surface measurements from Andacollo, Chile, in 2019 concluded at 22:30:00 UTC. Prior to the eclipse, WRF-ARW results are masked by WRF-eclipse results since both were identical until C1.
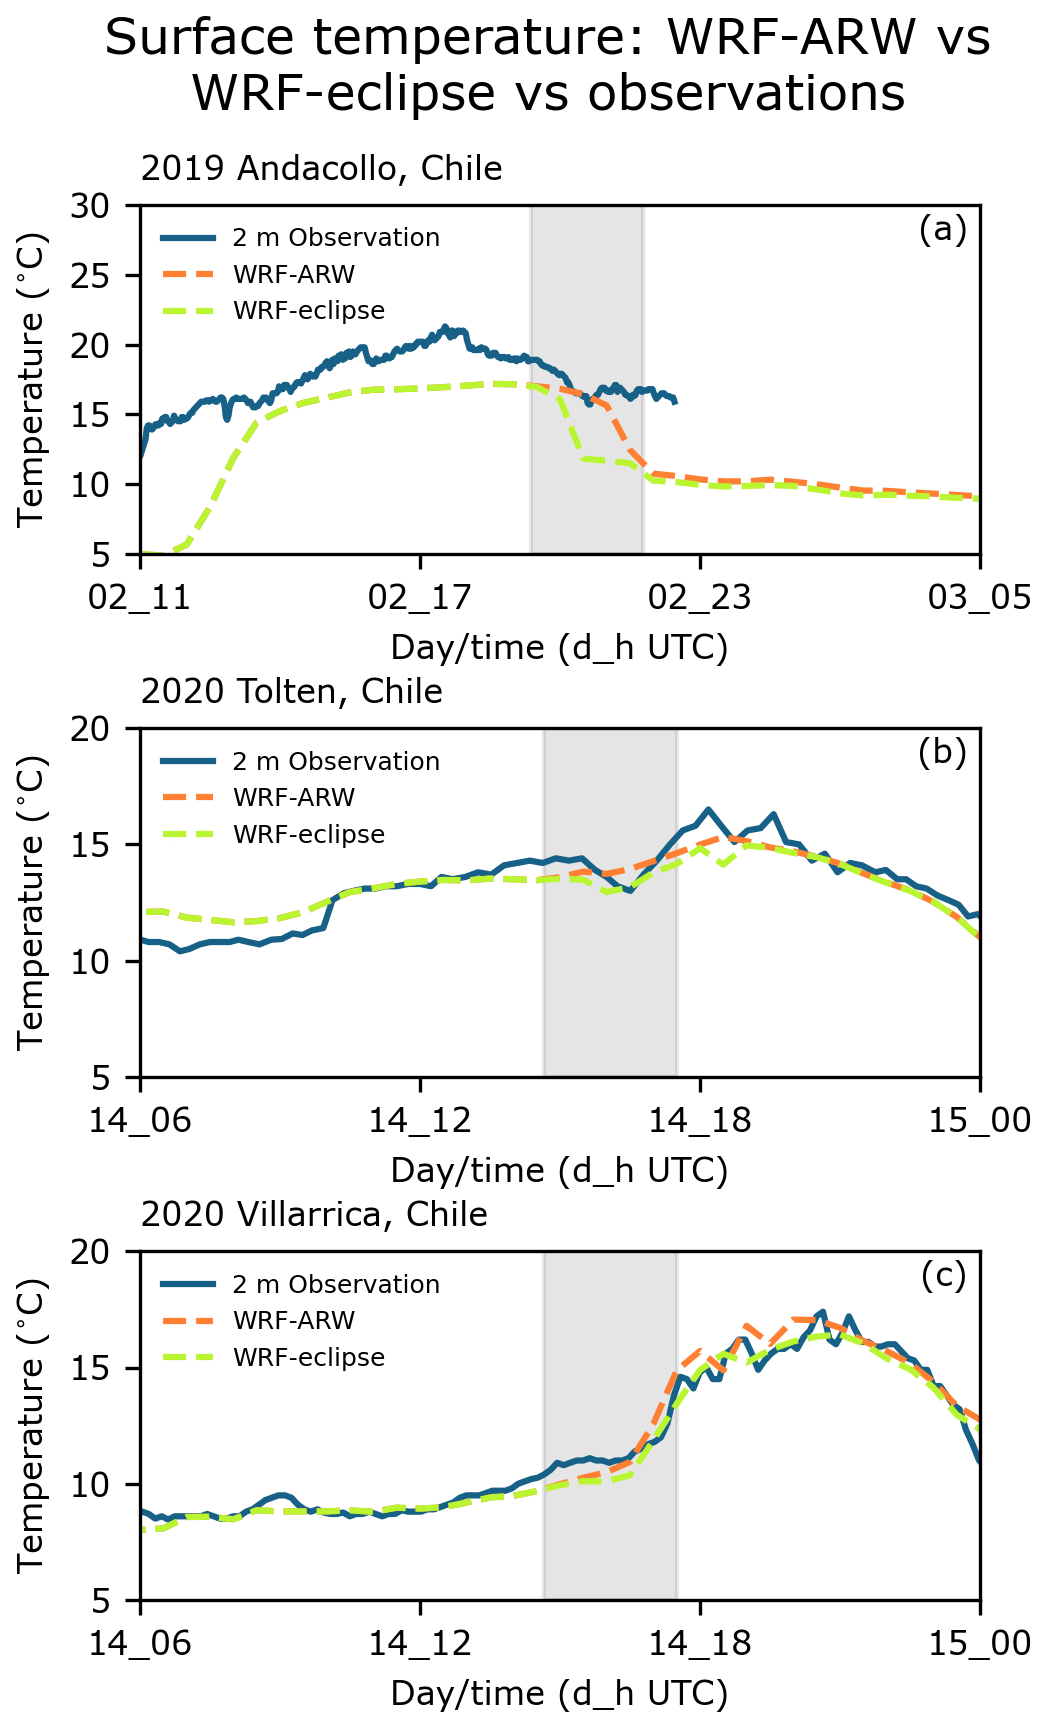
Figure 3Comparison of temperature (∘C) observations at 2 m (solid blue lines) and modeled results at 2 m for the 2 July 2019 eclipse (a) and from two sites (Toltén, b; Villarrica, c) during the 14 December 2020 eclipse. Modeled results include WRF simulations with the eclipse enabled (dashed green lines) and disabled (dashed orange lines). Times of the eclipses are marked by the shaded gray area. Surface measurements from Andacollo, Chile, in 2019 concluded at 22:30:00 UTC. Prior to the eclipse, WRF-ARW results are masked by WRF-eclipse results since both were identical until C1.
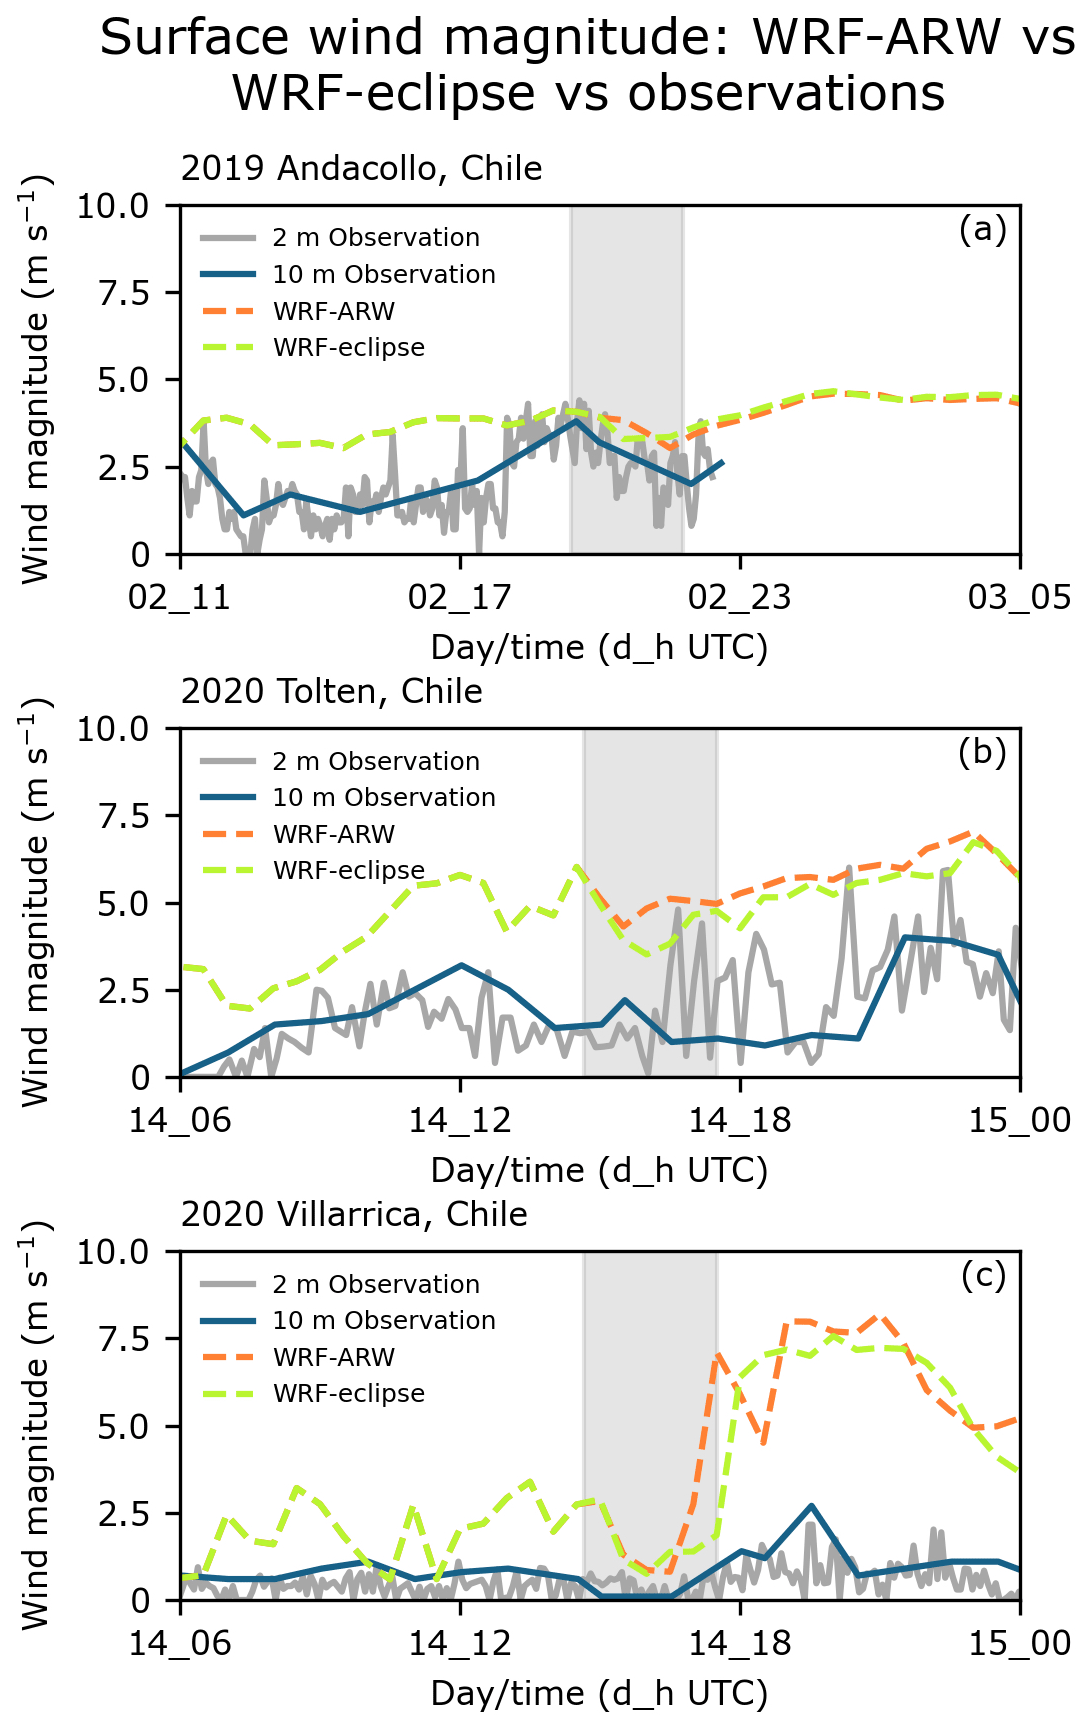
Figure 4Comparison of wind speed (m s−1) observations at 2 m (solid gray lines), observations at 10 m (solid blue lines), and modeled results at 10 m for the 2 July 2019 eclipse (a) and from two sites (Toltén, b; Villarrica, c) during the 14 December 2020 eclipse. Modeled results include WRF simulations with the eclipse enabled (dashed green lines) and disabled (dashed orange lines). Surface station observations are 3 min averages. Times of the eclipses are marked by the shaded gray area. Surface measurements from Andacollo, Chile, in 2019 concluded at 22:30:00 UTC. Prior to the eclipse, WRF-ARW results are masked by WRF-eclipse results since both were identical until C1.
Both WRF-ARW and WRF-eclipse suppress irradiance too strongly prior to the 2020 eclipse at Toltén and Villarrica, with an RMSE for WRF-eclipse of 75.6 W m−2 (49.7 W m−2) for Toltén (Villarrica) and an MAE of 36.2 W m−2 (26.2 W m−2) for Toltén (Villarrica). However, the reduction in irradiance to 0 W m−2 during eclipse totality is captured by WRF-eclipse at both sites (Fig. 2b and c). After C4, both WRF-ARW and WRF-eclipse results show increased fluctuations in irradiance but do not capture the timing of the fluctuations as compared to observations (Fig. 2b and c), with an RMSE for WRF-eclipse of 237.4 W m−2 (415.7 W m−2) for Toltén (Villarrica) and an MAE of 194.4 W m−2 (321.1 W m−2) for Toltén (Villarrica). For WRF-ARW, the RMSE post-eclipse is 302.0 W m−2 (253.9 W m−2) for Toltén (Villarrica) and the MAE is 239.4 W m−2 (204.5 W m−2) for Toltén (Villarrica). Notably, post-eclipse differences in simulated irradiance between WRF-ARW and WRF-eclipse are resolved relatively quickly, with the models converging 4–6 h after initial divergence (Fig. 2b and c).
Figure 3 shows comparisons between observations of air temperature (∘C) and results from WRF-ARW and WRF-eclipse at 2 m for the 2019 and 2020 eclipses. Both WRF-ARW and WRF-eclipse underestimated temperature by ≥ 3 ∘C relative to observations from 2019. WRF-eclipse results for 2019 show a larger decrease in temperature relative to observations during the eclipse (Fig. 3a) with an RMSE for WRF-eclipse of 4.1 ∘C and an MAE of 3.8 ∘C. Post-eclipse comparisons between observed and modeled air temperature cannot be made since the 2019 measurements concluded at 22:30:00 UTC.
For the 2020 eclipse, WRF-ARW and WRF-eclipse produce identical results in temperature prior to the TSE and agree well with observations at both Toltén and Villarrica (Fig. 3b and c) with an RMSE for WRF-eclipse of 0.8 ∘C (0.3 ∘C) for Toltén (Villarrica) and an MAE of 0.7 ∘C (0.3 ∘C) for Toltén (Villarrica). At Toltén, WRF-eclipse diverges from WRF-ARW somewhat after C1, briefly showing a decrease in temperature in agreement with trends in observations (Fig. 3b). Observations from Villarrica do not indicate a notable temperature decrease during the eclipse; however both models slightly underestimate temperature relative to observations from C1 to totality (Fig. 3c). From C1 to C4 both models perform relatively equally with an RMSE for WRF-eclipse after C1 of 0.6 ∘C (0.6 ∘C) for Toltén (Villarrica) and an MAE of 0.5 ∘C (0.6 ∘C) for Toltén (Villarrica); for WRF-ARW, the RMSE after C1 is 0.8 ∘C (0.8 ∘C) for Toltén (Villarrica) and there is an MAE of 0.7 ∘C (0.7 ∘C) for Toltén (Villarrica).
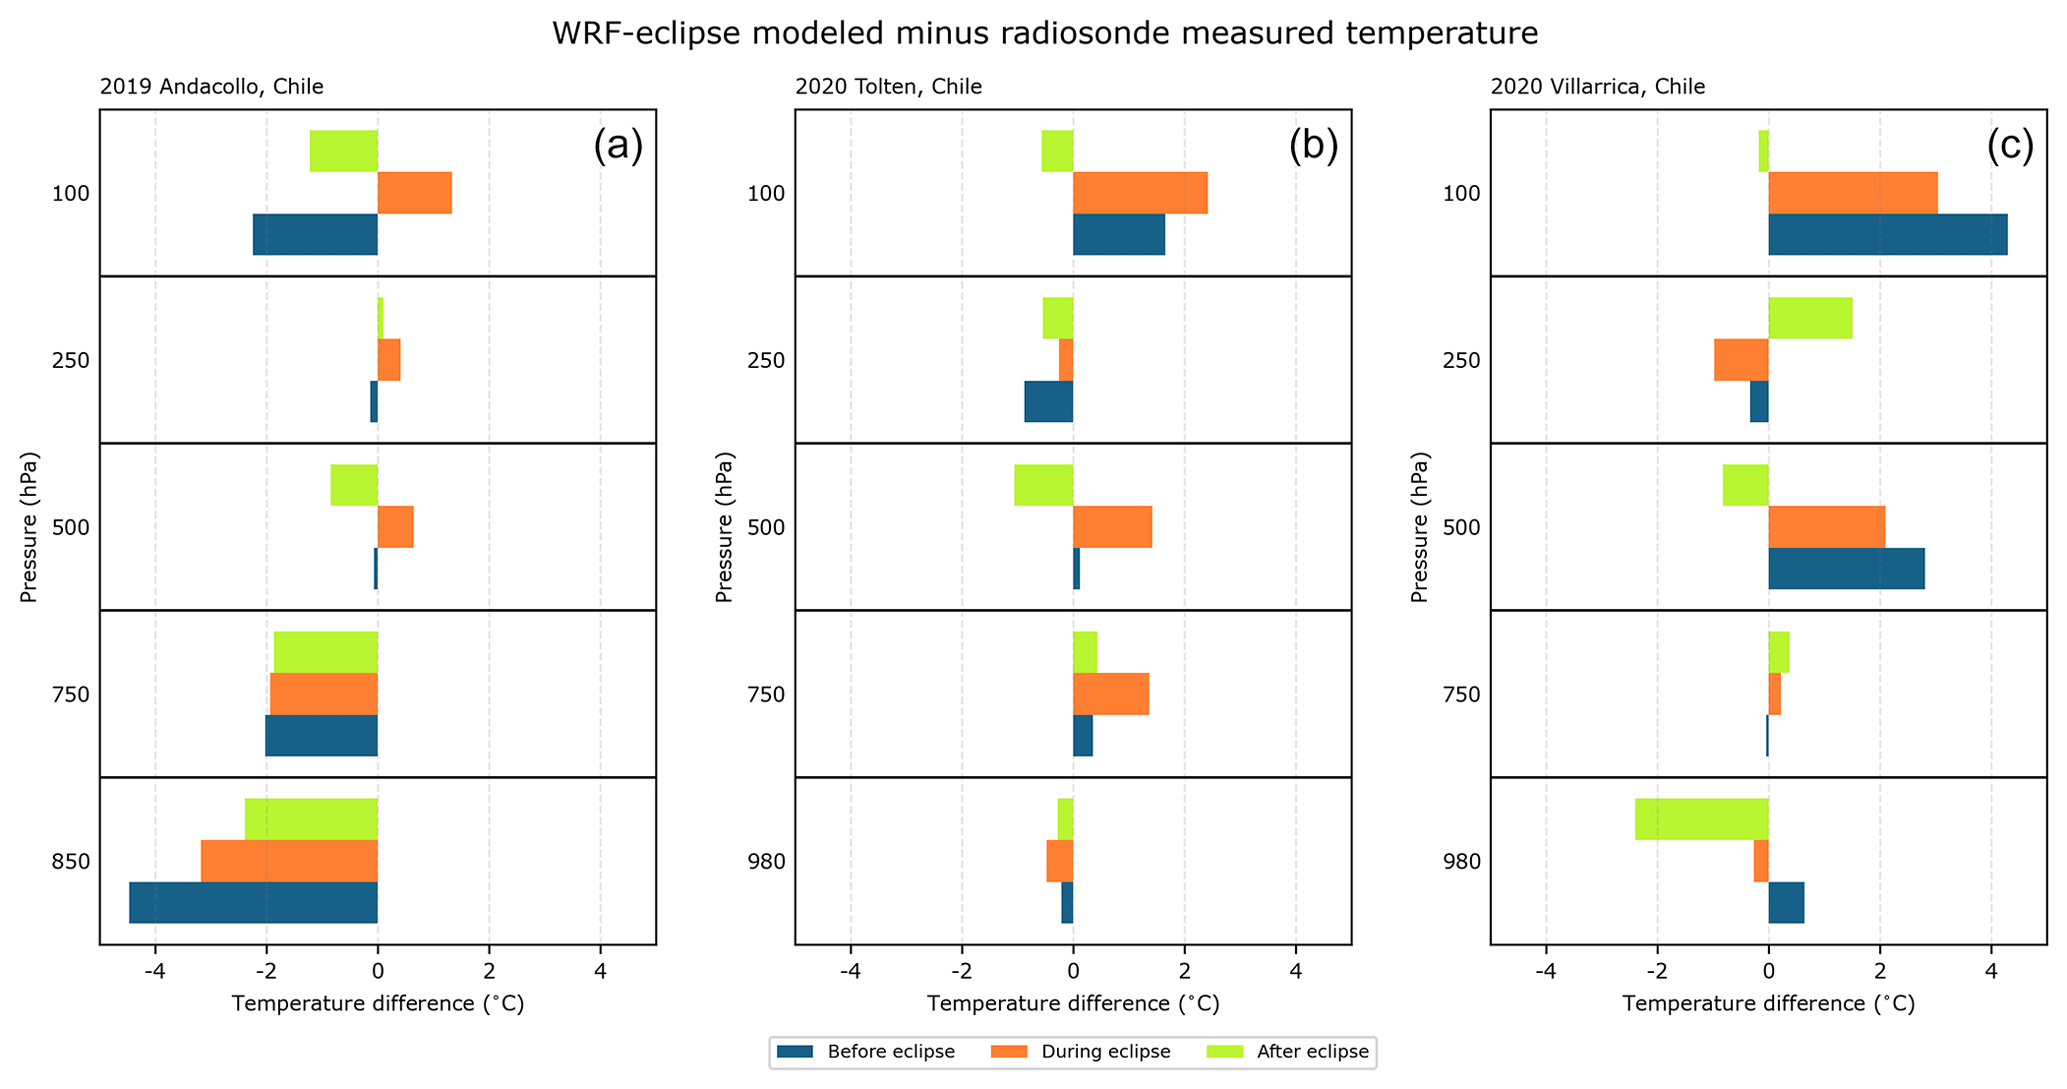
Figure 5Differences between WRF-eclipse results and profile observations of air temperature (∘C) before (blue), during (orange), and after (green) the eclipses of 2019 (a) and 2020 (b, c). For Andacollo (a), before-eclipse data are from flight 21, during eclipse-data are from flight 23, and after-eclipse data are from flight 25 (launched 2 July 2019 at 17:23:00, 19:58:50, and 22:35:39 UTC, respectively; eclipse totality occurred at 20:39:17 UTC). For Toltén (b), before-eclipse data are from flight 21, during-eclipse data are from flight 24, and after-eclipse data are from flight 27 (launched 14 December 2020 at 12:01:19, 14:59:02, and 17:30:13 UTC, respectively; eclipse totality occurred at 16:01:45 UTC). For Villarrica (c), before-eclipse data are from flight 21, during-eclipse data are from flight 24, and after-eclipse data are from flight 27 (launched 14 December 2020 at 12:02:21, 15:02:03, and 18:02:00 UTC, respectively; eclipse totality occurred at 16:04:12 UTC). Negative values indicate underestimation of air temperature by the model relative to observations; positive values indicate overestimation by the model. Differences are calculated from pressure levels (hPa) 980, 850, 750, 500, 250, and 100 for profile data and at the closest corresponding model grid altitudes. For Andacollo, 850 hPa is substituted for the 980 hPa level given the high elevation of the Andacollo launch site.
Figure 4 shows wind magnitude observations at 2 m (surface station) and 10 m (radiosonde) and model results from WRF-ARW and WRF-eclipse at 10 m for the 2019 and 2020 eclipses. Both models overestimate wind magnitude relative to 2019 and 2020 observations. Observations of wind magnitude in 2019 indicate an increase of 1.9 m s−1 leading up to C1 and a decrease of 1.25 m s−1 during totality with an RMSE of 2.2 m s−1 and MAE of 1.9 m s−1 prior to C1 and an RMSE of 1.4 m s−1 and MAE of 1.2 m s−1 during the eclipse (Fig. 4a). WRF-eclipse results diverge from WRF-ARW during the 2019 eclipse, showing a slight decrease in wind magnitude at totality (Fig. 4a). For the 2020 eclipse at Toltén, results from both models show a decrease in wind magnitude beginning at C1 not seen in the 10 m observations (Fig. 4b) and of a greater magnitude than the 2 m observations. The 2.25 m s−1 decrease in wind magnitude from C1 to totality calculated by WRF-eclipse at Toltén is greater than the decrease shown by WRF-ARW (Fig. 4b). Observations at 2 m show a 1.25 m s−1 decrease in wind magnitude during totality at Toltén (Fig. 5b). At Villarrica, both WRF-ARW and WRF-eclipse calculate a decrease in wind magnitude of 2.1 m s−1 from C1 to totality which generally aligns with the observational trend (Fig. 4c). Both models show a 6.25 m s−1 increase in wind magnitude from totality to C4, while observations suggest a much smaller increase of 1.25 m s−1 from totality to just after C4 at Villarrica (Fig. 4c). The RMSE for WRF-eclipse from C1 to C4 is 3.9 m s−1 (3.1 m s−1) for Toltén (Villarrica) and the MAE is 3.7 m s−1 (2.3 m s−1) for Toltén (Villarrica); the equivalent RMSE calculation for WRF-ARW is 3.4 m s−1 (1.7 m s−1) for Toltén (Villarrica) and the MAE is 3.1 m s−1 (1.4 m s−1) for Toltén (Villarrica).
3.2 Comparison of measured and modeled profiles
Differences between radiosonde wind magnitude (m s−1) and air temperature (∘C) profiles and WRF-eclipse model results at various pressure levels before, during, and after the eclipses of 2019 and 2020 are presented (Figs. 5 and 6). Measurements at a given pressure level are subtracted from the value at the closest corresponding WRF-eclipse model grid position. The authors accordingly acknowledge the limited representativeness of these data based on the relatively small sample size. Horizontal and vertical model grids are indexed to account for balloon drift during ascent. For 2020 results, pressure levels at (hPa) 980, 750, 500, 250, and 100 are considered. For the 2019 results, the bottommost pressure level considered is 850 (hPa) since the field site at Andacollo, Chile, has a surface elevation of 1283 m.
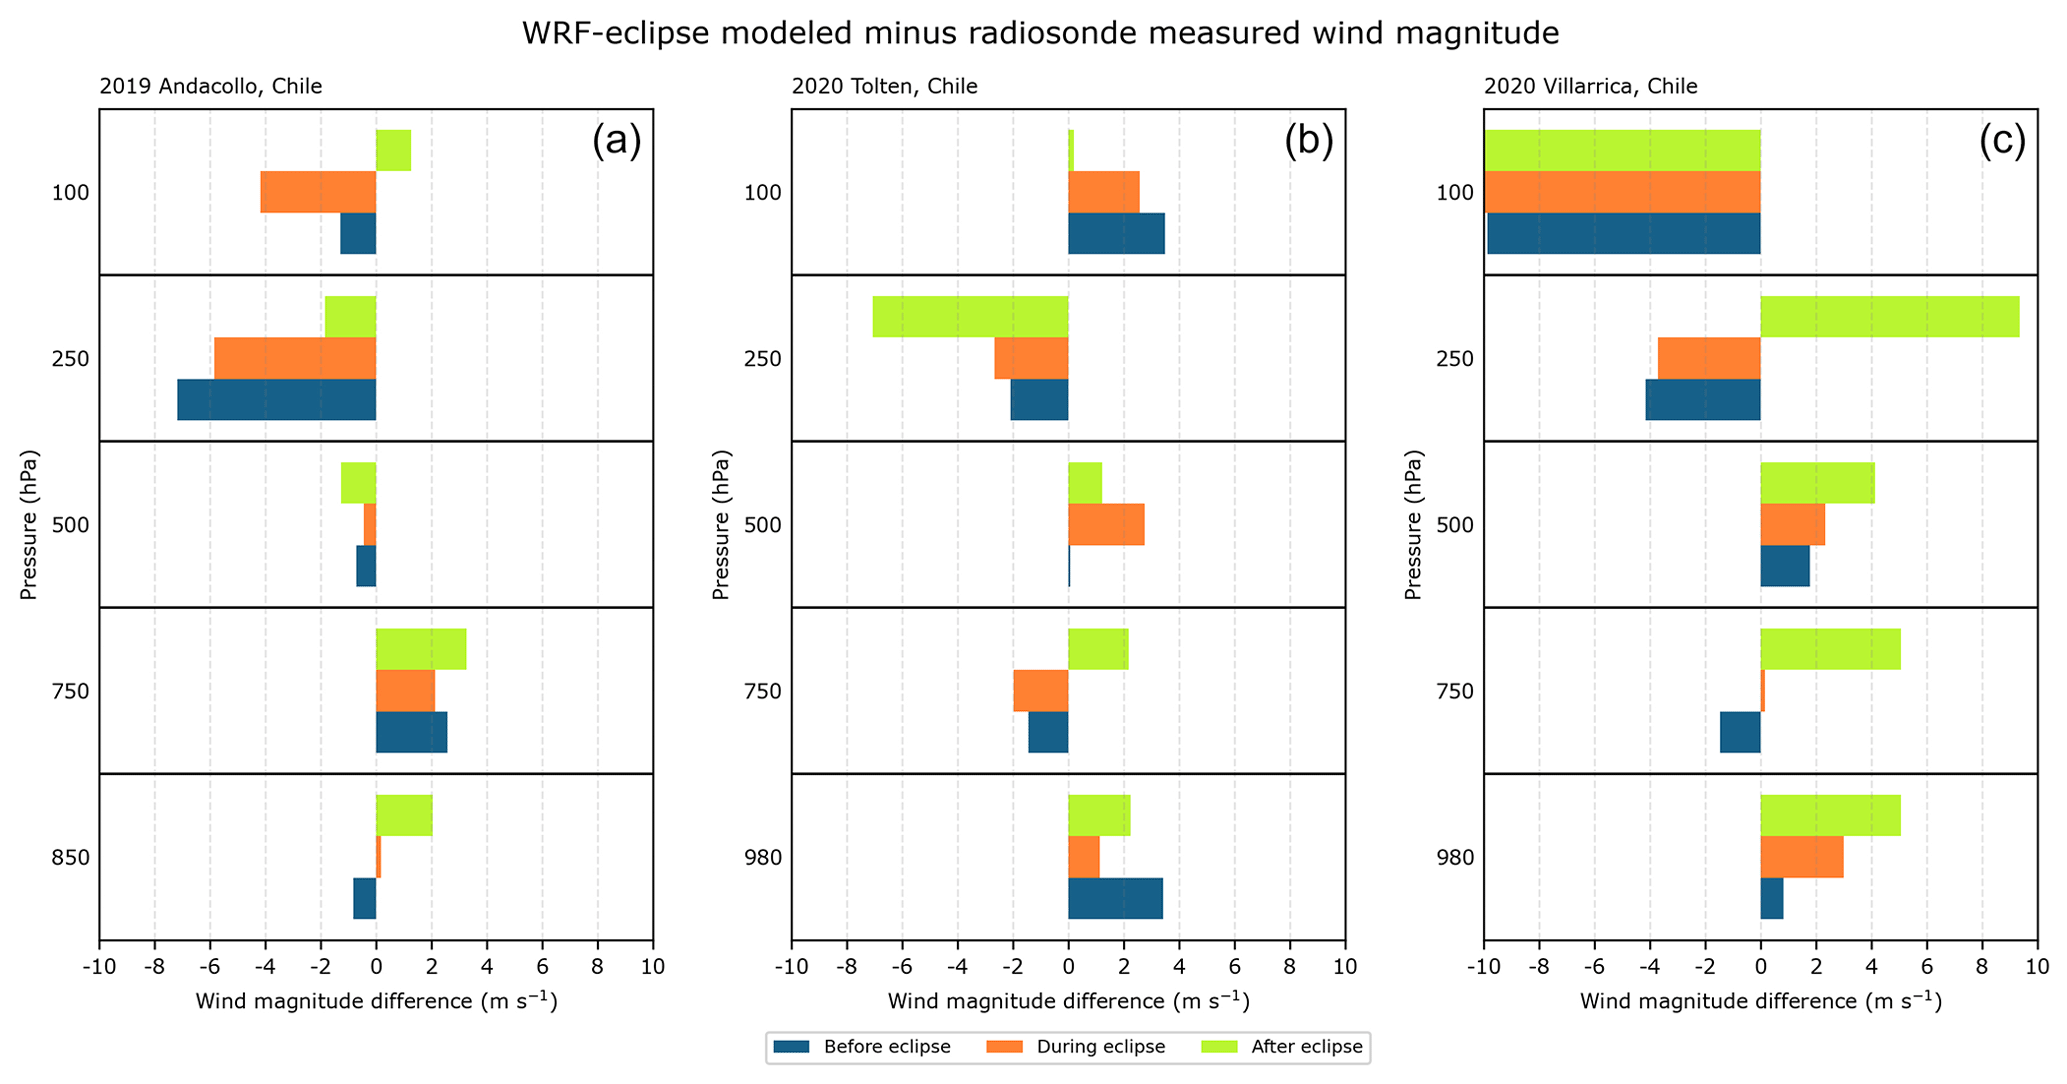
Figure 6Differences between WRF-eclipse results and profile observations of wind magnitude (m s−1) before (blue), during (orange), and after (green) the eclipses of 2019 (a) and 2020 (b, c). For Andacollo (a), before-eclipse data are from flight 21, during-eclipse data are from flight 23, and after-eclipse data are from flight 25 (launched 2 July 2019 at 17:23:00, 19:58:50, and 22:35:39 UTC, respectively; eclipse totality occurred at 20:39:17 UTC). For Toltén (b), before-eclipse data are from flight 21, during-eclipse data are from flight 24, and after-eclipse data are from flight 27 (launched 14 December 2020 at 12:01:19, 14:59:02, and 17:30:13 UTC, respectively; eclipse totality occurred at 16:01:45 UTC). For Villarrica (c), before-eclipse data are from flight 21, during-eclipse data are from flight 24, and after-eclipse data are from flight 27 (launched 14 December 2020 at 12:02:21, 15:02:03, and 18:02:00 UTC, respectively; eclipse totality occurred at 16:04:12 UTC). Negative values indicate underestimation of wind magnitude by the model relative to observations; positive values indicate overestimation by the model. Differences are calculated from pressure levels (hPa) 980, 850, 750, 500, 250, and 100 for profile data and at the closest corresponding model grid altitudes. For Andacollo, 850 hPa is substituted for the 980 hPa level given the high elevation of the Andacollo launch site.
For 2019, the largest differences between observed air temperature and WRF-eclipse results occurred near the surface. Figure 5a shows WRF-eclipse underestimated air temperature at 850 hPa by 2.5 to 4.5 ∘C before, during, and after and 750 hPa pressure levels (Fig. 5b and c). The largest differences between observations and model results for both sites in 2020 occurred before and during the eclipse at the 100 hPa pressure level (Fig. 5b and c). At Toltén and Villarrica, WRF-eclipse overestimated temperature at 100 hPa by 1.75 to 4.25 ∘C before and during the eclipse (Fig. 5b and c). All three simulations show differences < 2 ∘C before, during, and after the eclipse at the 250 hPa pressure level (Fig. 5a–c).
Table 1RMSE and MAE values for upper-air data and WRF-eclipse model comparison.
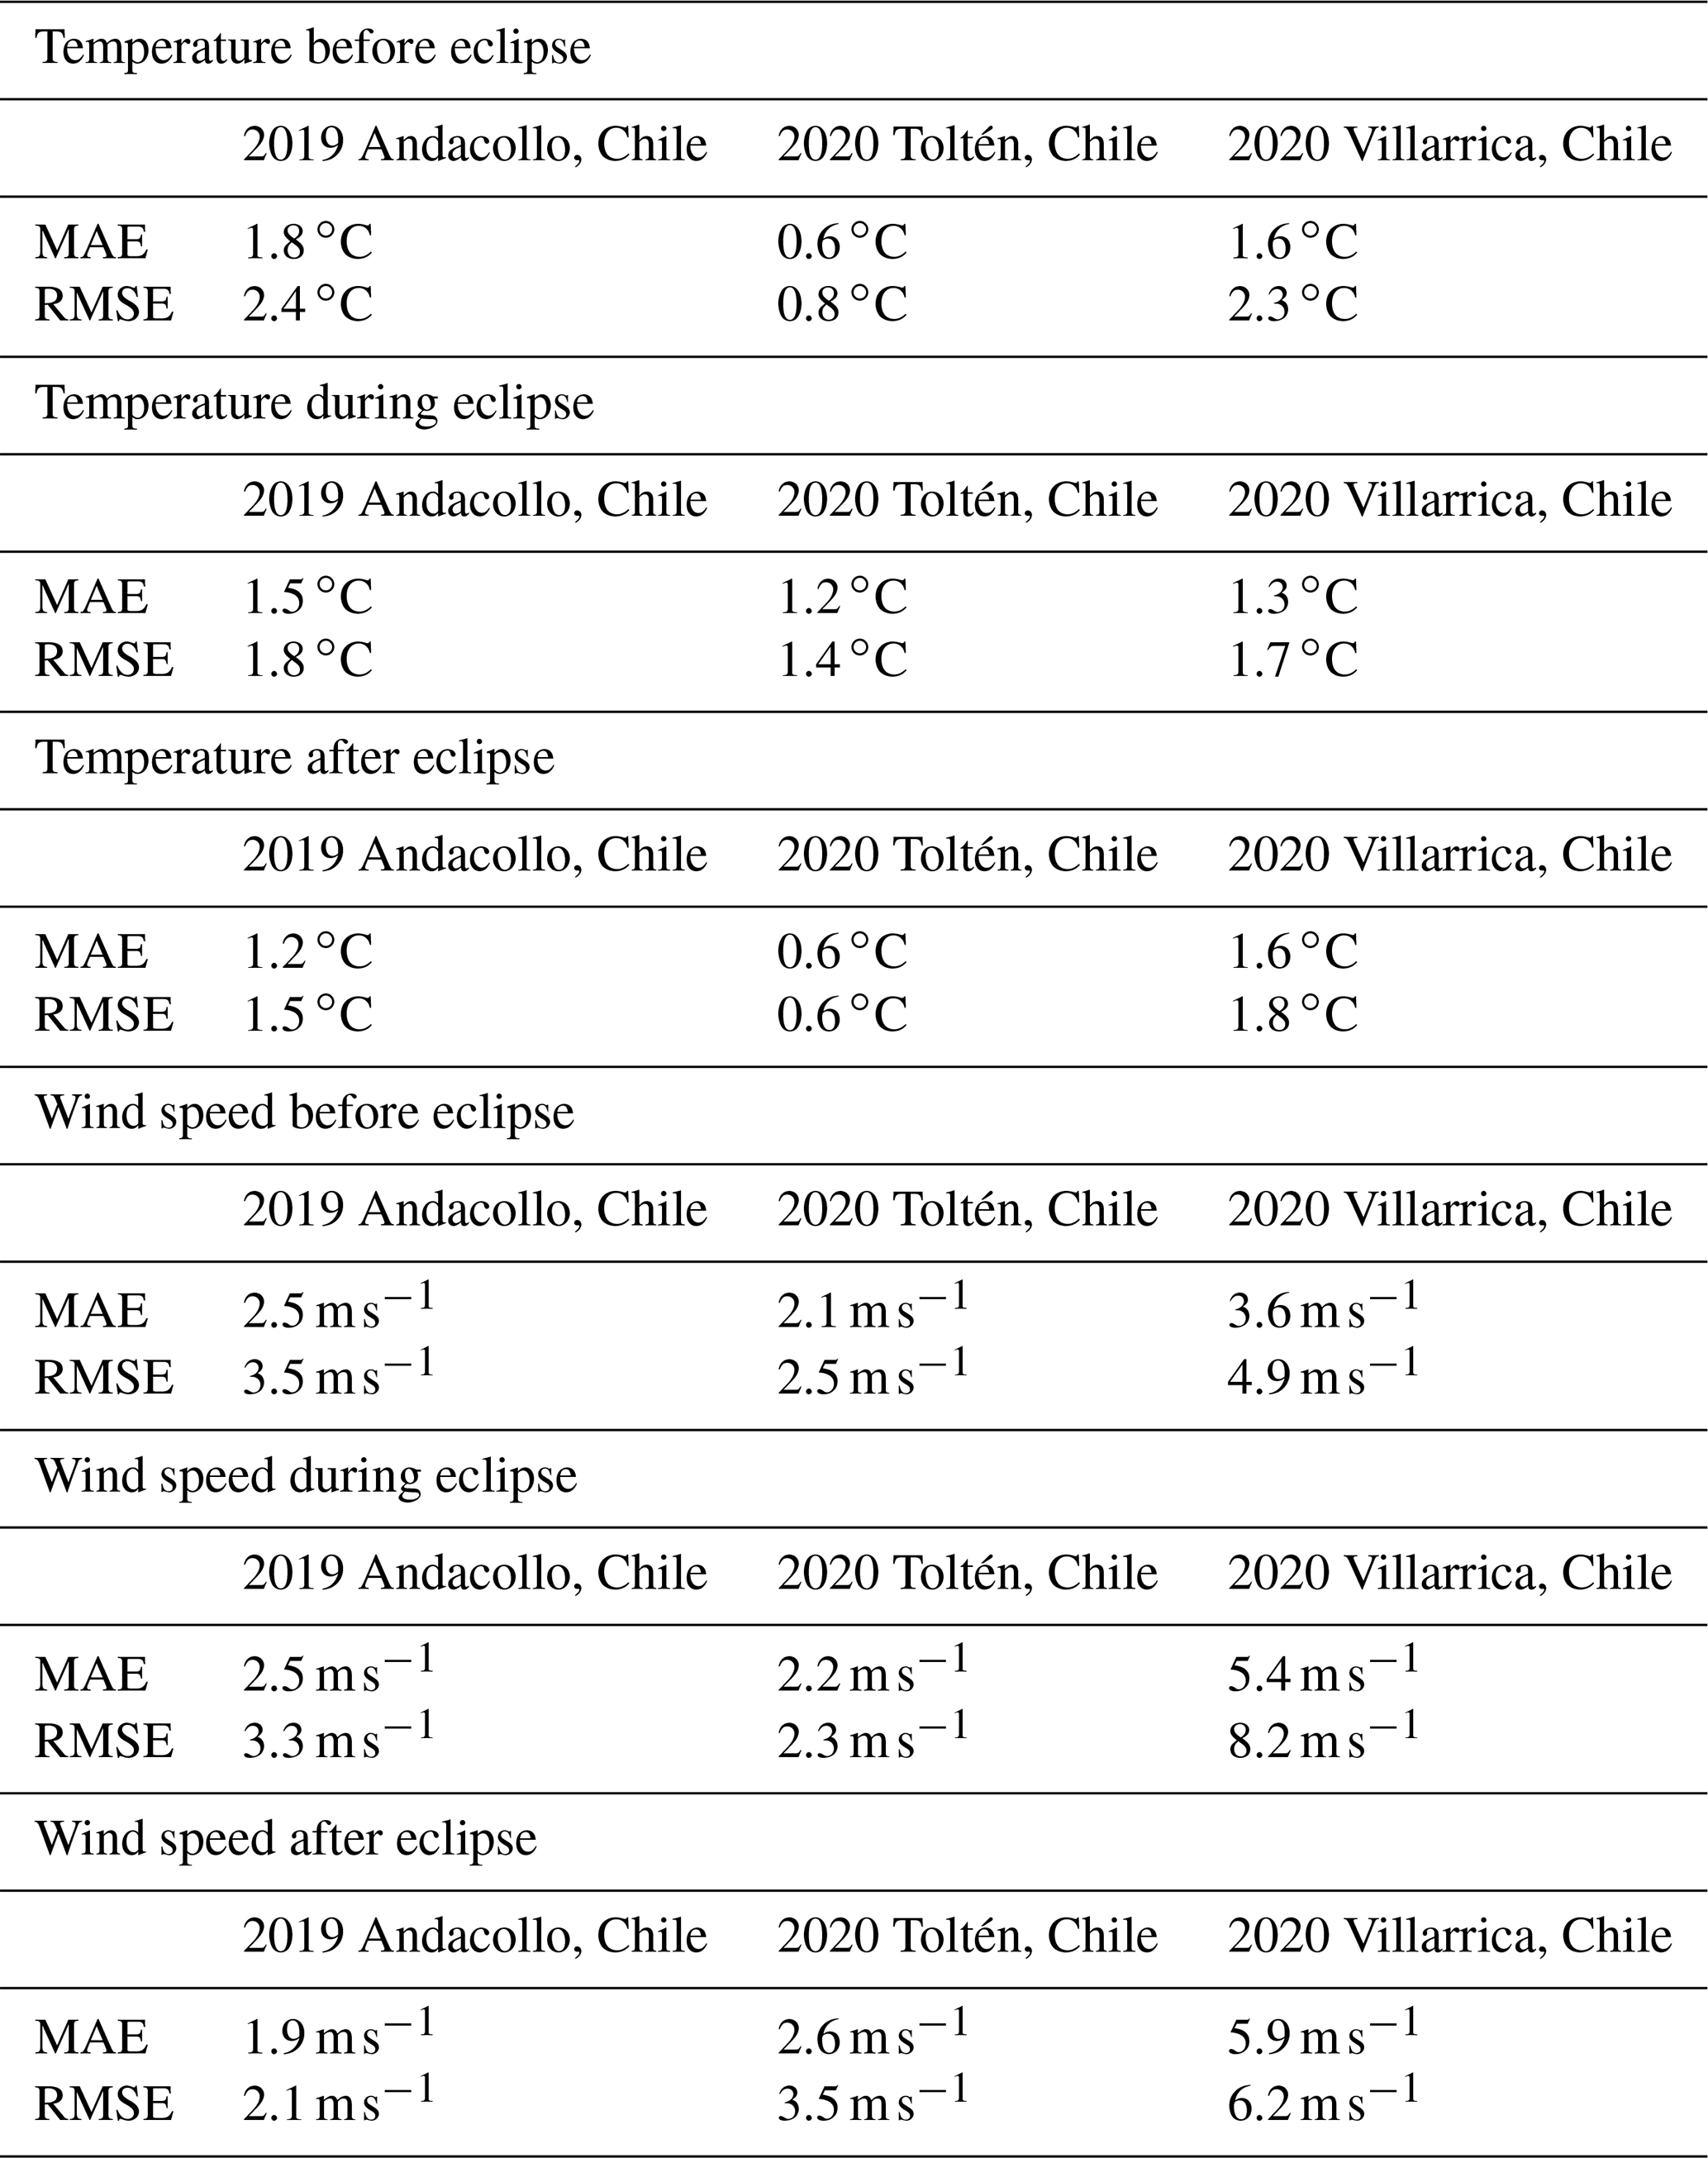
Figure 6 shows differences between measured and modeled wind magnitudes before, during, and after the 2019 and 2020 eclipses. In all three cases, the largest differences between measurements and model results occurred at the 250 and 100 hPa pressure levels. Notably, WRF-eclipse greatly underestimated wind magnitude at 100 hPa for Villarrica (Fig. 6c). Table 1 presents the RMSE and MAE values for these measurements.
3.3 WRF modeling of atmospheric gravity waves during a total solar eclipse
Preliminary results comparing the WRF-ARW and WRF-eclipse models in simulating AGWs are presented in Figs. 7 and 8. In each case, the gravity-wave-focused model simulations mirror the configuration of those previously described here, with the following exceptions: (1) model version 4.3.3 (Skamarock et al., 2021) was used, (2) time step reduced to 36 s, (3) model top increased to 5 hPa (∼ 35 km), (4) time off-centering damping (epssm) set to 0.2, and (5) smooth_cg_topo set to true.
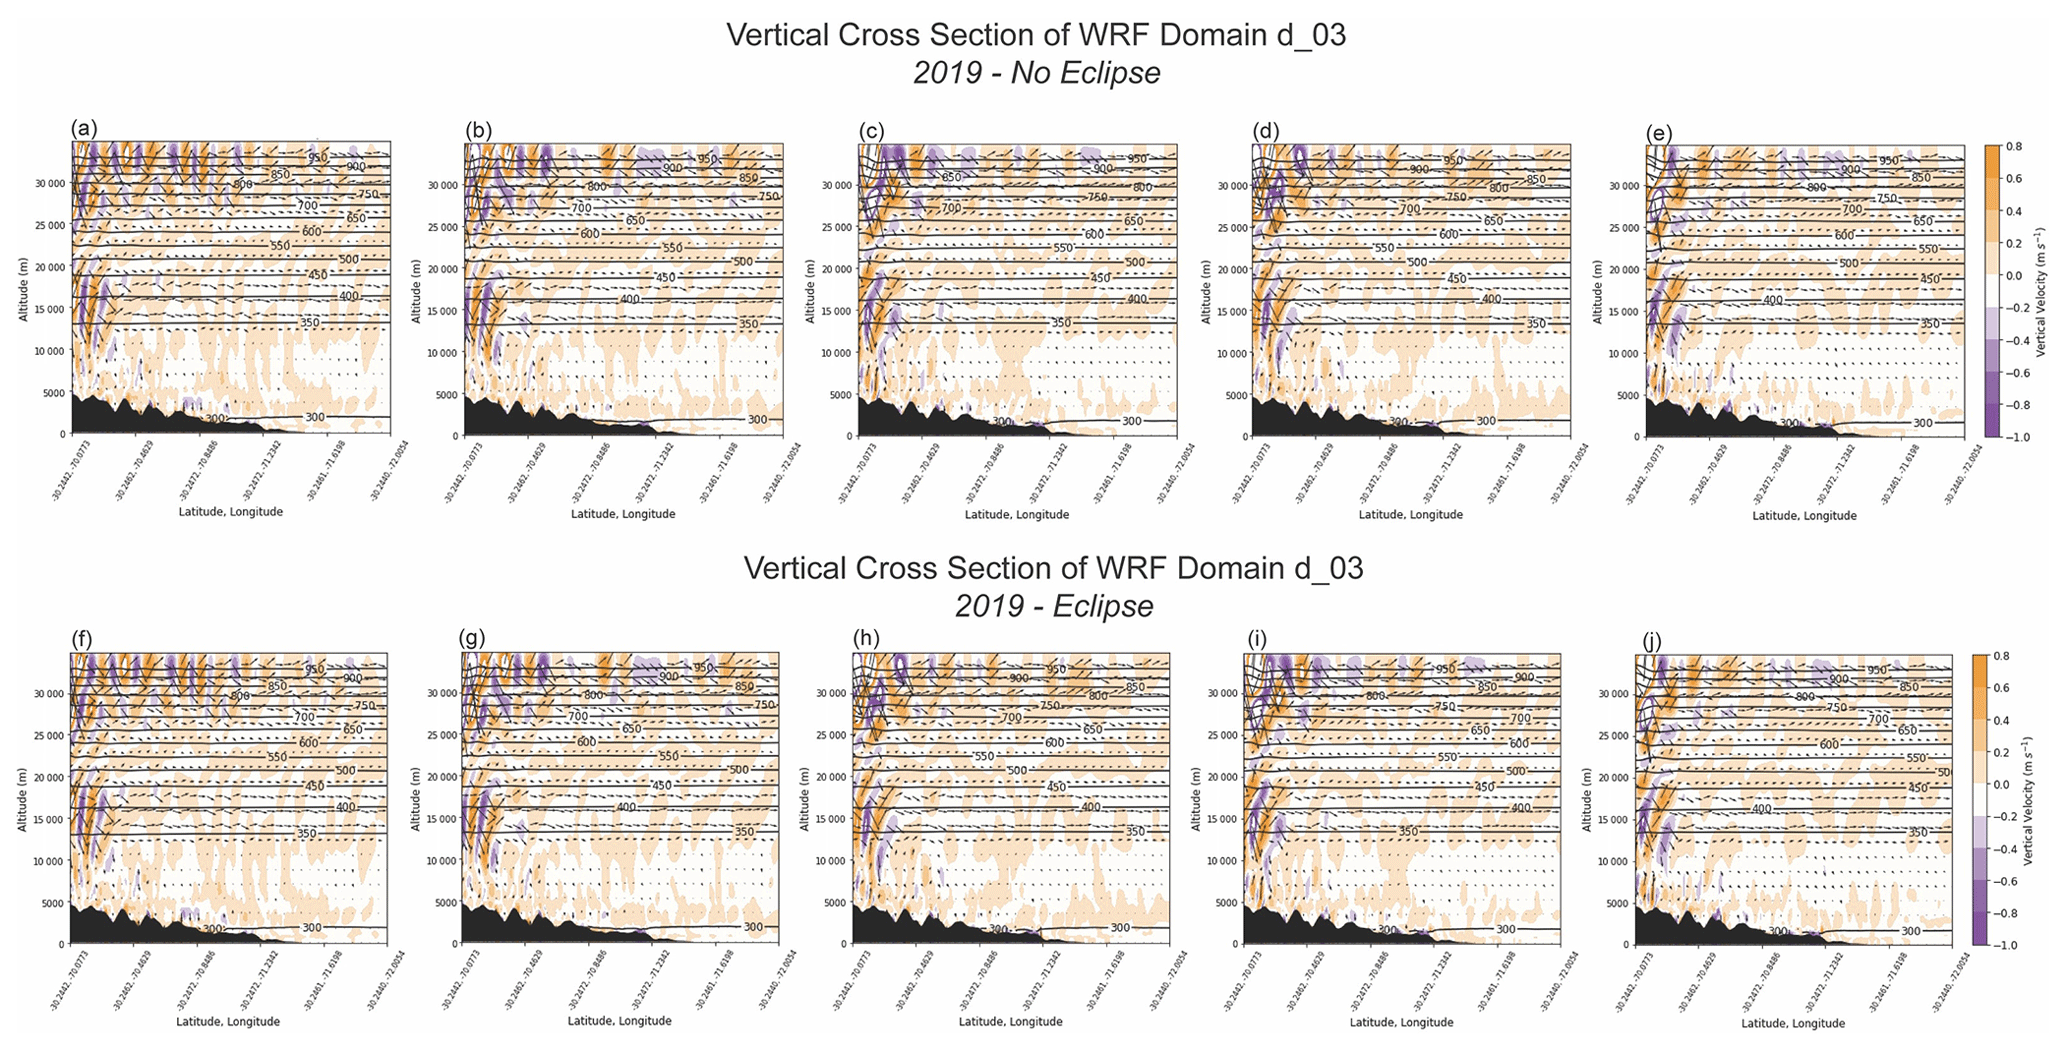
Figure 7Vertical cross sections of WRF-ARW and WRF-eclipse model domain 3 over the 2019 field site. Plots show hourly model outputs surrounding the eclipse from 19:00:00 UTC (a, f) to 23:00:00 UTC (e, j). Horizontal lines indicate potential temperature, arrows indicate wind magnitude and direction, and shading indicates the W wind component (m s−1). The model domain's topographic profile is shown in black along the bottom. Model simulations shown here were modified to optimize for investigation of AGWs. Version 4.3.3 of the WRF model (Skamarock et al., 2021) was used.
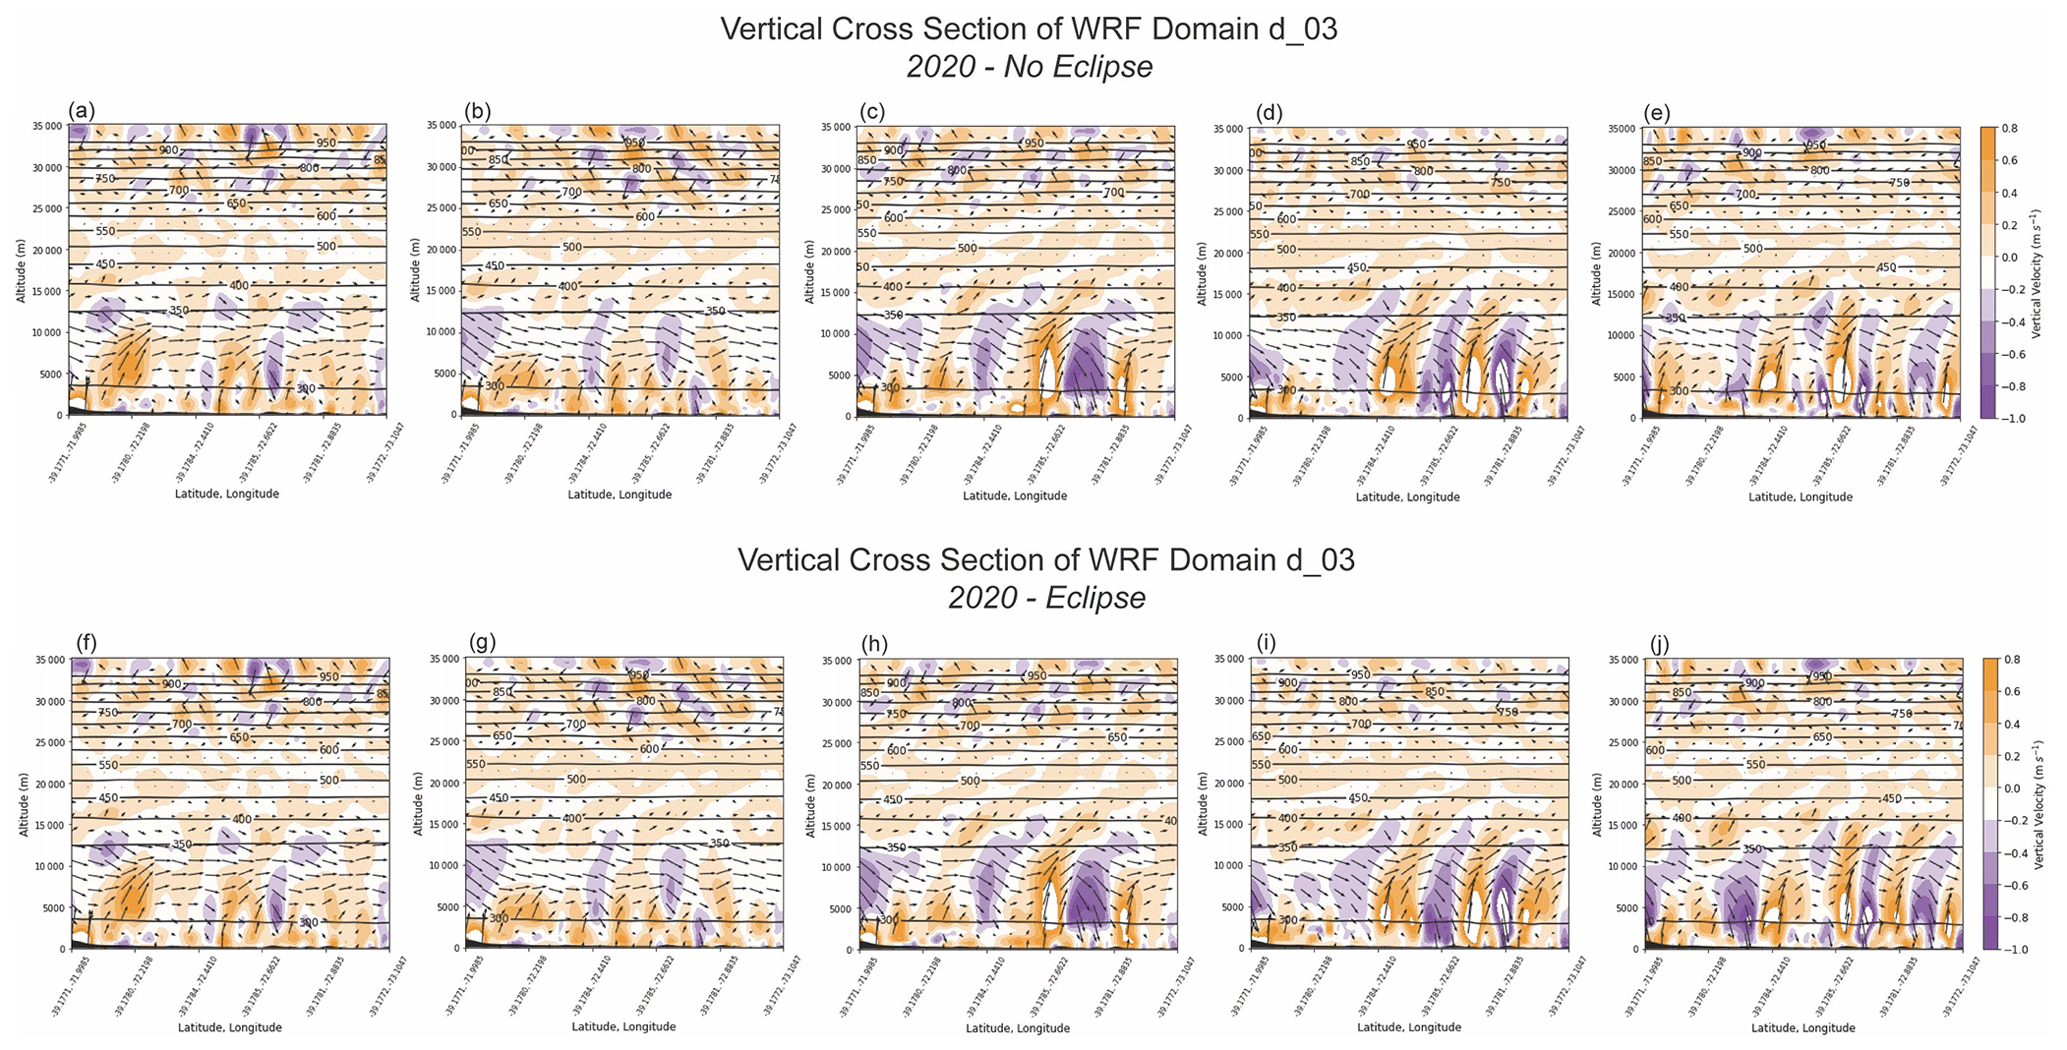
Figure 8Vertical cross sections of WRF-ARW and WRF-eclipse model domain 3 over the 2020 field sites. Plots show hourly model outputs surrounding the eclipse from 14:00:00 UTC (a, f) to 18:00:00 UTC (e, j). Horizontal lines indicate potential temperature, arrows indicate wind magnitude and direction, and shading indicates the W wind component (m s−1). The model domain's topographic profile is shown in black along the bottom. Model simulations shown here were modified to optimize for investigation of AGWs. Version 4.3.3 of the WRF model (Skamarock et al., 2021) was used.
Comparisons between eclipse and non-eclipse simulations for both 2019 (Fig. 7) and 2020 (Fig. 8) show such similar results that very few differences are discernable in either case. Relative to the observations collected during the 2019 TSE by Colligan et al. (2020), which showed AGW signatures at ∼ 25 km after eclipse totality, WRF-eclipse did not simulate a similar signal with the present model physics configuration (Fig. 7c and d). The WRF-eclipse simulation for 2020 was also not indicative of notable AGW activity with the present model physics configuration, showing minimal fluxes in the W (vertical) wind component around the time of the TSE.
The variability of WRF-eclipse's performance in simulating atmospheric responses surrounding a TSE under differing meteorological conditions is made clear through the results presented. Figure 2a highlights the consistency of observed and modeled irradiance under stable, clear-sky conditions. Under such conditions, WRF-eclipse simulates irradiance reasonably well based on RMSE and MAE values and demonstrates a marked reduction during the eclipse, corresponding well to observations. In contrast, thick cloud cover and heavy precipitation over the 2020 campaign's field sites are most likely responsible for the highly dynamic observed and simulated irradiance values at each site (Fig. 2b and c), which are also reflected in the RMSE and MAE values. Both models likely overestimated cloud cover leading up to the eclipse, causing an underestimation of irradiance from 12:00:00 to 16:00:00 UTC on 14 December 2020 (Fig. 2b and c).
Conversely, both models simulated air temperature with reasonable accuracy relative to 2020 observations (Fig. 3b and c), while both underestimated temperature by ≥ 3 ∘C relative to observations from the 2019 campaign (Fig. 3a), which is consistent with the resulting RMSE and MAE values from both campaigns. This potential temperature bias in the 2019 data was shown by Spangrude et al. (2019); however the present results indicate that a reduction in this bias between 15:00:00 and 22:00:00 UTC was achieved, likely through increased resolution of meteorological input data and a lower radiation time step. Other factors possibly contributing to the variable accuracy of modeled air temperature between the 2019 and 2020 TSEs are the 1000 m difference in elevation between the 2019 and 2020 field sites and the significant differences in the surrounding surface vegetation for each campaign.
While results from previous studies on changes in wind magnitude during a TSE are varied, many have shown winds decreasing during TSEs (Fernández et al., 1993, 1996; Ramchandran et al., 2002; Krishnan et al., 2004; Stoev et al., 2005; Founda et al., 2007). A decrease in wind magnitude during eclipse totality was indeed observed in 2019, though results from 2020 are less conclusive. The observed wind magnitudes in 2020 were likely impacted by the passage of a low-level jet associated with strong horizontal water vapor transport which occurred during the campaign. The differences in variability and overall wind magnitude observed at Toltén and Villarrica (Fig. 4b and c) are likely explained by the coastal environment at Toltén compared to Villarrica's higher elevation and closer proximity to the Andes Mountains, given that other meteorological variables were otherwise similar. Both models simulated a sharp rise in wind magnitude after totality at Villarrica which was far more gradual at Toltén.
Comparisons of vertical air temperature measurements against results from WRF-eclipse show greater disagreement near the surface during the clear-sky conditions in 2019, while results from 2020 at both Toltén and Villarrica show the greatest disagreement occurring aloft, at the 100 hPa pressure level (Fig. 5). Overall, the RMSE and MAE values indicate better agreement between models and observations for the 2020 eclipse (Table 1). However, the authors acknowledge the limits of this preliminary analysis (a tertiary goal of this study) based on the relatively small sample size and encourage future studies to carry out more comprehensive analyses.
That the WRF-eclipse model (in the present configuration) did not simulate an AGW signature similar to the observations reported by Colligan et al. (2020) for the 2019 TSE suggests additional investigation of model physics configurations is warranted to further assess the model's ability to predict eclipse-induced AGWs. The authors thus recommend additional analyses focused on AGWs be performed, leveraging the unique observational datasets presented here.
In conclusion, the above results comparing surface and profile observations indicate that the WRF-eclipse model is indeed capable of simulating atmospheric responses to an eclipse with reasonable accuracy; however, overall accuracy across meteorological variables is shown to be partly influenced by local or regional atmospheric conditions. Beyond applications of this dataset to future atmospheric and modeling studies, additional research is recommended to validate the performance of other WRF-ARW physics schemes since this study does not attempt to provide a comprehensive assessment of the multiple physics and dynamics options available within WRF-ARW. PBL schemes within WRF-ARW are of particular interest since eclipse-induced atmospheric responses are expected primarily in this lowest region of the atmosphere.
One future research opportunity, the Nationwide Eclipse Ballooning Project (https://eclipse.montana.edu/, last access: 13 July 2022), will perform hourly radiosonde measurements from sites across the US during eclipses in 2023 and 2024. This project will result in an abundance of atmospheric profile and surface data for before, during, and after the eclipses which would be highly valuable for further validation studies of the WRF-eclipse model to expand on the results presented here. Additionally, since previous eclipse ballooning campaigns have focused on TSEs, the 14 October 2023 annular eclipse presents an opportunity to perform measurements and subsequent validation studies for an additional type of solar eclipse.
The algorithms and software used in collection and analyses of the data presented here are publicly available from the corresponding author upon reasonable request.
The datasets presented here are publicly available from https://doi.org/10.17605/OSF.IO/894JR (Spangrude et al., 2023).
The supplement related to this article is available online at: https://doi.org/10.5194/amt-16-5167-2023-supplement.
The 2020 eclipse campaign was conceived by JWF and CES. The methodology was completed by WGM and CES. CES drafted the manuscript, and JWF, JW, and WGM provided reviews and revisional suggestions. The manuscript map was created by CES, and figure plots were created by WGM and JWF.
The contact author has declared that none of the authors has any competing interests.
Publisher's note: Copernicus Publications remains neutral with regard to jurisdictional claims made in the text, published maps, institutional affiliations, or any other geographical representation in this paper. While Copernicus Publications makes every effort to include appropriate place names, the final responsibility lies with the authors.
This research was conducted through program support from NASA Montana Space Grant Consortium. We gratefully acknowledge the support of the following organizations and individuals: the Chilean Directorate General of Civil Aviation; the Chilean Ministry of Health; the Chilean Ministry of Science, Technology, Knowledge and Innovation; Elizabeth Isaman, the US Embassy in Santiago; Jorge Carrasco, Universidad de Santiago; and the Consulate General of Chile. Students, faculty, and staff of the University of Montana, Carroll College, the University of Idaho, Oklahoma State University, and the University of Kentucky also contributed greatly to the project's success including data collection and analysis efforts.
This research has been supported by the National Science Foundation (grant no. 2018182) and the NASA Montana Space Grant Consortium.
This paper was edited by Laura Bianco and reviewed by two anonymous referees.
Amiridis, V., Melas, D., Balis, D. S., Papayannis, A., Founda, D., Katragkou, E., Giannakaki, E., Mamouri, R. E., Gerasopoulos, E., and Zerefos, C.: Aerosol Lidar observations and model calculations of the Planetary Boundary Layer evolution over Greece, during the March 2006 Total Solar Eclipse, Atmos. Chem. Phys., 7, 6181–6189, https://doi.org/10.5194/acp-7-6181-2007, 2007.
Anderson, R. C., Keefer, D. R., and Myers, O. E.: Atmospheric Pressure and Temperature Changes During the 7 March 1970 Solar Eclipse, J. Atmos. Sci., 29, 583–587, https://doi.org/10.1175/1520-0469(1972)029<0583:APATCD>2.0.CO;2, 1972.
Anfossi, D., Schayes, G., Degrazia, G., and Goulart, A.: Atmospheric Turbulence Decay During the Solar Total Eclipse of 11 August 1999, Bound.-Lay. Meteorol., 111, 301–311, https://doi.org/10.1023/B:BOUN.0000016491.28111.43, 2004.
Aplin, K. L., and Harrison, R.: Meteorological effects of the eclipse 0f 11 August 1999 in cloudy and clear conditions, P. Roy. Soc. London, 459A, 353–371, https://doi.org/10.1098/rspa.2002.1042, 2003.
Colligan T., Fowler J., Godfrey J., and Spangrude C.: Detection of stratospheric gravity waves induced by the total solar eclipse of July 2, 2019, Sci. Rep.-UK, 10, 19428, https://doi.org/10.1038/s41598-020-75098-2, 2020.
Eaton, F., Hines, J., Hatch, W., Cionco, R., Byers, J., Garvey, D., and Miller, D.: Solar Eclipse Effects Observed in the Planetary Boundary Layer Over a Desert, Bound.-Lay. Meteorol., 83, 331–346, https://doi.org/10.1023/A:1000219210055, 1997.
Fernández, W., Castro, V., and Hidalgo, H.: Air temperature and wind changes in Costa Rica during the total solar eclipse of July 11, 1991, Earth Moon Planets, 63, 133–147, https://doi.org/10.1007/BF00575102, 1993.
Fernández, W., Hidalgo, H., Coronel, G., and Morales, E.: Changes in meteorological variables in Coronel Oviedo, Paraguay, during the total solar eclipse of 3 November 1994, Earth Moon Planets, 74, 49–59, https://doi.org/10.1007/BF00118721, 1996.
Founda, D., Melas, D., Lykoudis, S., Lisaridis, I., Gerasopoulos, E., Kouvarakis, G., Petrakis, M., and Zerefos, C.: The effect of the total solar eclipse of 29 March 2006 on meteorological variables in Greece, Atmos. Chem. Phys., 7, 5543–5553, https://doi.org/10.5194/acp-7-5543-2007, 2007.
Fowler, J., Wang, J., Ross, D., Colligan, T., and Godfrey, J.: Measuring ARTSE2017: Results from Wyoming and New York, B. Am. Meteorol. Soc., 100, 1049–1060, https://doi.org/10.1175/BAMS-D-17-0331.1, 2019.
Giles, H. R., and Hanna, E.: The solar eclipse: a natural meteorological experiment, Philos. T. Roy. Soc., 374A, 20150225, https://doi.org/10.1098/rsta.2015.0225, 2016.
Hanna, E.: Meteorological effects of the solar eclipse of 11 August 1999, Weather, 55, 430–446, https://doi.org/10.1002/j.1477-8696.2000.tb06481.x, 2000.
Hong, S.-Y., Noh Y., and Dudhia, J.: A New Vertical Diffusion Package with an Explicit Treatment of Entrainment Processes, Mon. Weather Rev., 134, 2318–2341, https://doi.org/10.1175/MWR3199.1, 2006.
Iacono, M. J., Delamere, J. S., Mlawer, E. J., Shephard, M. W., Clough, S. A., and Collins, W. D.: Radiative forcing by long–lived greenhouse gases: Calculations with the AER radiative transfer models, J. Geophys. Res., 113, D13103, https://doi.org/10.1029/2008JD009944, 2008.
Jubier, X.: Google Earth Files (kmz), http://xjubier.free.fr/en/site_pages/SolarEclipsesGoogleEarth.html (last access 13 July 2022), 2022.
Krishnan, P., Kunhikrishnan, P. K., Muraleedharan Nair, S., Ravindran, S., Ramachandran, R., Subrahamanyam, D. B., and Venkata Ramana, M.: Observations of the atmospheric surface layer parameters over a semi arid region during the solar eclipse of August 11th, 1999, J. Earth Syst. Sci., 113, 353–363, https://doi.org/10.1007/BF02716730, 2004.
Meek, D., and Hatfield, J.: Data quality checking for single station meteorological databases, Agr. Forest Meteorol., 69, 85–109, https://doi.org/10.1016/0168-1923(94)90083-3, 1994.
Montornès, A., Codina, B., Zack, J. W., and Sola, Y.: Implementation of Bessel's method for solar eclipses prediction in the WRF-ARW model, Atmos. Chem. Phys., 16, 5949–5967, https://doi.org/10.5194/acp-16-5949-2016, 2016.
Moss, G., Fowler, J., Spangrude, C., and Woody, H.: Using the WRF-ARW Model to Visualize and Predict Atmospheric Parameters During an Eclipse, AGU Fall Meeting 2020, 1–17 December 2020, online, A215-0009, https://agu.confex.com/agu/fm20/meetingapp.cgi/Paper/745166 (last access: 13 July 2022), 2020.
Moss, G., Spangrude, C., and Fowler, J.: Evaluation of WRF-ARW's Ability to Simulate Simultaneous Atmospheric River and Total Solar Eclipse at High Resolution Utilizing Data Assimilation, AGU Fall Meeting 2021, 13–17 December 2021, New Orleans, Louisiana, USA and Online, A45K-1994, https://agu.confex.com/agu/fm21/prelim.cgi/Paper/904097 (last access: 13 July 2022), 2021.
NOAA National Weather Service: Radiosonde Observation, https://www.weather.gov/upperair/factsheet#:~:text=Although% 20all%20the%20data%20from,minimally%20acceptable%20for %20NWS%20operations (last access: 13 July 2022), 2022.
NOAA Office of the Federal Coordinator for Meteorological Services and Supporting Research: Federal Meteorological Handbook No. 3: Rawinsonde and Pibal Observations, https://www.icams-portal.gov/resources/ofcm/fmh/FMH3/00-entire-FMH3.pdf (last access: 13 July 2022), 1997.
Ramchandran, P. M., Ramshandran, R., Gupta, K., Patil, S., and Jadhav, P.: Atmospheric Surface-Layer Processes During the Total Solar Eclipse Of 11 August 1999, Bound.-Lay. Meteorol., 104, 445–461, https://doi.org/10.1023/A:1016577306546, 2002.
Skamarock, W. C., Klemp, J. B., Dudhia, J., Gill, D. O., Barker, D., Duda, M. G., Huang, X. -Y., Wang, W., and Powers, J. G.: A Description of the Advanced Research WRF Model Version 3 (No. NCAR/TN-475+STR), National Center for Atmospheric Research (NCAR), https://doi.org/10.5065/D68S4MVH, 2008.
Skamarock, W. C., Klemp, J. B., Dudhia, J., Gill, D. O., Liu, Z., Berner, J., Wang, W., Powers, J. G., Duda, M. G., Barker, D., and Huang, X. -Y.: A Description of the Advanced Research WRF Model Version 4.1 (No. NCAR/TN-556+STR), National Center for Atmospheric Research (NCAR), https://doi.org/10.5065/1dfh-6p97, 2019.
Skamarock, W. C., Klemp, J. B., Dudhia, J., Gill, D. O., Liu, Z., Berner, J., Wang, W., Powers, J. G., Duda, M. G., Barker, D., and Huang, X. -Y.: NCAR/TN-556+STR), National Center for Atmospheric Research (NCAR), https://doi.org/10.5065/1dfh-6p97, 2021.
Spangrude, C., Ross, D., Fowler, J., Colligan, T., and Godfrey, J.: Validating the WRF Montornès et al. Eclipse Module with the July 2, 2019 Total Solar Eclipse, AGU Fall Meeting 2019, San Francisco, CA, 9–13 December 2019, A31M-2886, https://agu.confex.com/agu/fm19/meetingapp.cgi/Paper/521528 (last access: 13 July 2022), 2019.
Spangrude, C., Fowler, J., Moss, W. G., and Wang, J.: Validation of the WRF-ARW Eclipse Model with Measurements from the 2019 & 2020 Total Solar Eclipses, OSF [data set], https://doi.org/10.17605/OSF.IO/894JR, 2023.
Stoev, A., Stoeva, P., Valev, D., Kiskinova, N., and Tasheva, T.: Dynamics of the microclimate parameters of the ground atmospheric layer during the total solar eclipse on August 11, 1999, Geophys. Res. Abstr., 7, 10209, SRef-ID: 1607-7962/gra/EGU05-A-10209, 2005.
Sun, Y., Yang, F., Liu, M., Li, Z., Gong, X., and Wang, Y.: Evaluation of the weighted mean temperature over China using multiple reanalysis data and radiosonde, Atmos. Res., 285, 106664, https://doi.org/10.1016/j.atmosres.2023.106664, 2023.
Szalowski, K.: The effect of the solar eclipse on the air temperature near the ground, J. Atmos. Sol.-Terr. Phy., 64, 1589–1600, https://doi.org/10.1016/S1364-6826(02)00134-7, 2002.
Thompson, G., Field, P. R., Rasmussen, R. M., and Hall, W. D.: Explicit Forecasts of Winter Precipitation Using an Improved Bulk Microphysics Scheme. Part II: Implementation of a New Snow Parameterization, Mon. Weather Rev., 136, 5095–5115, https://doi.org/10.1175/2008MWR2387.1, 2008.