the Creative Commons Attribution 4.0 License.
the Creative Commons Attribution 4.0 License.
 | 14 Nov 2023
Airborne bacteria viability and air quality: a protocol to quantitatively investigate the possible correlation by an atmospheric simulation chamber
Virginia Vernocchi
Elena Abd El
Marco Brunoldi
Silvia Giulia Danelli
Elena Gatta
Tommaso Isolabella
Federico Mazzei
Franco Parodi
Paolo Prati
Dario Massabò
Biological particulate matter or bioaerosol are a subset of atmospheric aerosol. They influence climate, air quality, and health via several mechanisms which often are poorly understood. In particular, the quantitative study of possible relationship between bioaerosol viability and air quality or meteorological conditions is an open and relevant issue. The difficulty of retrieving such possible correlations by analyses of data collected during in-field campaigns can benefit of targeted experiments conducted in well-controlled conditions inside atmospheric simulation chambers (ASCs). ChAMBRe (Chamber for Aerosol Modelling and Bio-aerosol Research) is an ASC in Genoa (Italy) designed and built to perform experimental research on bioaerosol. In this article, we focus on bacteria viability. A multi-step protocol was developed and thoroughly tested to cultivate a suitable bacteria population (E. coli), nebulize and inject in a chamber of viable cells, expose and monitor the viability variation inside ChAMBRe, hold at selected conditions, and finally incubate and count the concentration of viable bacteria. The whole procedure showed an estimated lifetime of total (T) and viable (V) E. coli of about 153 and 32 min, respectively and a V : T lifetime ratio of 40±5 min when ChAMBRe is held in a reference baseline condition. The coefficient of variation of 13 % shows how sensitive the protocol is also to changes in viability when the bacteria are exposed to other (e.g. polluted) conditions. First results showing a viability reduction observed exposing the E. coli strain to NOx concentrations and solar irradiation are presented and discussed. The present results pave the way for systematic studies aimed at the definition of dose–effect relationship for several bacteria strains under different conditions of atmospheric pollutants.
- Article
(2870 KB) - Full-text XML
-
Supplement
(980 KB) - BibTeX
- EndNote


This article focusses on bioaerosol, which is the aerosol of biological origin. The major types of bioaerosols are primary and secondary biological aerosols and biogenic aerosols.
Primary biological aerosols (PBAs) refer to bioaerosols that are directly released into the atmosphere from biological sources, such as plants, animals, or microorganisms; these aerosols can be composed of various biological materials, including bacteria, viruses, fungi, pollen, spores, algae, or other organic particles (Ariya and Amyot, 2004; Fröhlich-Nowoisky et al., 2016).
Secondary biological aerosols (SBAs) are the result of environmental processes or human activities that modify or transform primary biological aerosols. Unlike primary biological aerosols, SBAs are not directly released from biological sources but are generated through secondary processes, like oxidation and condensation, involving biological materials. SBAs are fragments of larger biological particles, material released from cells (disruption, excretion, etc.), nucleated biogenic gases, or cells “born” in the air from microbial multiplication (Morris et al., 2014; Ervens and Amato, 2020).
The PBAs vary in size, depending on the specific biological material being aerosolized; they range from several nanometres (e.g. viruses and cell fragments) to a few hundred micrometres in aerodynamic diameter (e.g. pollen and plant debris; Pöschl, 2005). Larger particles of biological material, such as large pollen grains or larger fragments of plants or insects, can be lifted into the air; however, due to their relatively high settling velocities, they tend to rapidly settle or deposit onto surfaces rather than remain suspended in the air for extended periods. As a result, these larger particles are typically not considered atmospheric aerosol particles (Després et al., 2012).
Among all the different bioaerosol microorganisms, bacteria are considered to play a significant role in the composition and dynamics of bioaerosols (Gong et al., 2020). They are ubiquitous in the atmosphere, and their presence and abundance can vary, depending on factors such as location, season, and local environmental conditions. Usually, over the land, the concentration in the atmosphere is greater than 104 cells m−3 (Burrows et al., 2009), while our understanding of airborne microbes over oceans is indeed limited compared to the knowledge we have about microbes in terrestrial and aquatic environments. In a recent work (Mayol et al., 2014), the airborne prokaryotic abundance over the North Atlantic Ocean ranged from about 3000 to 20 000 prokaryotes m−3 (average about 8000 cells m−3).
Bacteria, as small airborne particles, or aerosols can have relatively long atmospheric residence times compared to larger particles. This is due to their small size and low settling velocity, which allows them to remain suspended in the air for prolonged periods (Després et al., 2012). Airborne bacteria may be suspended as individual cells or attached to other particles, such as soil or leaf fragments, or found as agglomerates of many bacterial cells (Lighthart et al., 1993). For this reason, whereas individual bacteria are typically of the order of ∼1 µm or smaller in size, the median aerodynamic diameter of particles containing culturable bacteria at several continental sites has been reported to be ∼ 2–4 µm (Shaffer and Lighthart, 1997; Wang et al., 2007). Even if several works have contributed to the identification of bacterial diversity in the atmosphere up to now (Amato et al., 2007; Burrows et al., 2009; Després et al., 2012; Romano et al., 2019), it remains difficult to establish a clear picture of the actual abundance and composition of bacteria in the air. Numerous studies have suggested that the presence of bacteria in the atmosphere can have significant implications for cloud formation, atmospheric chemistry, microbial biogeography, and climate. As a matter of fact, bacteria can serve as ice-nucleating particles and cloud condensation nuclei, influencing the precipitation processes and affecting cloud lifetime, optical properties, and climate patterns (Bauer et al., 2003; Morris et al., 2004; Sun and Ariya, 2006; Möhler et al., 2007).
In particular, bacterial viability, the proportion of viable to total bacteria concentration, can act as cloud condensation nuclei (CCN), thanks to the hygroscopic properties of their surfaces (Delort et al., 2010). Additionally, the near-surface atmosphere's viable bacteria can have a significant impact on human health, including allergies, acute toxic effects, and infections (Bolashikov and Melikov, 2009).
Since bacteria have also been shown to metabolize within cloud droplets, some authors have proposed an impact on the chemistry of cloud droplets and air (Fankhauser et al., 2019; Jaber et al., 2020, 2021; Khaled et al., 2021). Finally, the presence of bacteria in the atmosphere can influence microbial biogeography (Martiny et al., 2006) by facilitating long-distance dispersal and the establishment of microbial populations in new environments.
Bacteria can enter the atmosphere as aerosol particles from various surfaces, including soil, water, and plant surfaces (Burrows et al., 2009). Once in the air, they are carried upwards by air currents and may remain in the atmosphere for many days before being removed by wet or dry deposition onto surfaces. Indeed, the mechanisms that govern the transport, survival, and activity of bacteria in the atmosphere are complex and multifaceted. Understanding these mechanisms is crucial for various scientific disciplines, including microbiology, atmospheric science, and public health. This complexity is related to some key factors such as aerosolization, transport and dispersion, survival, hygroscopicity, interactions with other particles, droplet nucleation, deposition, activation of ice nucleation, impacts on cloud formation, and chemistry; all these processes are indeed intertwined (Amato et al., 2023). The interactions between bacteria and their living environment, as well as the atmospheric conditions, play crucial roles in determining their behaviour and impacts on climate (Deguillaume et al., 2008) and, consequently, on health.
Atmospheric simulation chambers (ASCs) have been widely used to study chemical and photochemical atmospheric processes, but the high versatility of these facilities allows for a wider application that covers all fields of atmospheric aerosol science. For example, a consistent improvement in characterizing bioaerosols, in understanding the mechanisms affecting their behaviour in the atmosphere, and finally in elucidating their impacts can be obtained using atmospheric chamber facilities, where transdisciplinary studies addressing atmospheric physics, chemistry, and biology issues are possible.
In the last few decades, the use of atmospheric simulation chambers has been much more focused on the potential interest of bioaerosol as ice nuclei and cloud condensation activity (Bundke et al., 2010; Chou et al., 2011). Few studies have investigated bacterial survival and activity using simulation chambers, and some of them are old (Wright et al., 1969; Ehrlich et al., 1970; Krumins et al., 2014). Recently, addressing the public health concerns related to bioaerosol contamination has led to increased research efforts focusing on the survival and transformation of bioaerosols in the atmospheric environment. Innovative chamber studies have been initiated to investigate these questions and gain insights into the behaviour of bioaerosols (Amato et al., 2015; Brotto et al., 2015). These works have led to the development of a new dedicated simulation chamber, ChAMBRe (Chamber for Aerosol Modelling and Bio-aerosol Research; Massabò et al., 2018). The chamber has been installed at the National Institute of Nuclear Physics in Genoa (Italy), in collaboration with the Environmental Physics Laboratory at the Physics Department of the University of Genoa. ChAMBRe is also a national facility of the constituting ACTRIS ERIC, the worldwide largest research infrastructure to study atmospheric phenomena, set up by the European Union on 25 April 2023 (CID, 2023). The main scientific target at ChAMBRe is the description of the behaviour of biological microorganisms in the atmosphere, aiming to gain a deeper understanding of the still-unclear mechanisms that control the evolution of bioaerosols in atmosphere, in particular their bacterial components. The long-term goal is the parameterization of survival and activity of bioaerosols to develop specific tools to be implemented in chemical transport models (e.g. CAMx; Wagstrom et al., 2008) presently limited to treat transport and chemistry of gaseous and non-biological aerosol species.
This article gives all the details of the present status and capability of the ChAMBRe facility and introduces a multi-step, interdisciplinary procedure assessed to perform quantitative studies on the impact of different pollutants on bacteria viability. Preliminary results are also shown to illustrate the sensitivity of the experimental procedures developed at ChAMBRe that pave the way to systematic investigations on different strains and air quality conditions.
Since the beginning of 2017, ChAMBRe has been one of the nodes of the EUROCHAMP-2020 network, with specific tasks on bioaerosol studies. From the date of installation, the ChAMBRe control and acquisition system has been enriched with a wide range of equipment aimed at monitoring and controlling the processes occurring inside the chamber. In addition, most efforts have been devoted to developing protocols to produce, inject, expose, and collect bioaerosols to maximize the experiments reproducibility.
Briefly, ChAMBRe (Massabò et al., 2018) has a cylindrical shape with domed bases. It has a maximum height and diameter of 2.9 and 1 m, respectively, and a total volume of about 2.2 m3.
The main body is divided into three parts (two domed cylinders connected by a central ring) equipped with several flanged apertures of different diameters that match the different types of fittings for the instrument interface.
To favour the mixing of the gas and aerosol species, a fan is installed at the bottom of the chamber. It is a standard venting system with a particular pass-through component designed and built at INFN Genoa (National Institute of Nuclear Physics) to ensure the vacuum seal. The fan speed can be regulated by an external controller and set to up to 50 Hz in steps of 0.1 Hz.
One of the two flanges in the bottom part is connected through a pneumatic valve to a smaller horizontal cylinder (length about 1 m), which hosts a movable tray designed to move specific samples inside the chamber. The samples are typically Petri dishes for bacteria collection inside the chamber during the experiments. They can remain exposed for the whole experiment or for a selected time interval controlled by the user. A custom-made side flange has been worked in the central ring of the main body of the chamber. The large tipper tailgate allows the introduction and positioning of bulky sensor devices for testing and calibration purposes. The flange features a small window for visual inspection and four vacuum feedthrough connectors to power and communicate with devices inserted in the chamber.
ChAMBRe is equipped with a composite pumping system (rotary, root, and turbo pump), which can evacuate the internal volume to a level of about mbar. The return to atmospheric pressure can proceed by flowing ambient air inside the chamber through a five-stage filtering–purifying–drying inlet system, including an absolute high-efficiency particulate absorbing (HEPA) filter and a zeolite trap or using synthetic air from a cylinder (reducing the relative humidity close to zero).
Two types of UV lamps are permanently installed inside the chamber. A 58 cm long lamp (W=60 W; λ=253.7 nm; UV-STYLO-F-60H, Light Progress s.r.l.) is inserted through a custom side flange to sterilize the chamber volume without producing ozone after any experiment involving bioaerosol. A second type of lamp, producing UV radiation at λ<240 nm, can be inserted through one of the ISO-K100 flanges of the central ring to generate ozone.
A set of two pressure gauges is used to measure the atmospheric pressure inside (range –103 mbar) and outside (range of –103 mbar). ChAMBRe internal temperature and relative humidity are continuously measured by a sensor located in the upper ISO-K100 flange on the top dome.
Supervised injection of known volumes of different gas species inside the chamber is made by a set of software-controlled digital mass flow controllers (MFCs) ranging from 5 to 30 L min−1 full-scale manufactured by Bronkhorst®. Two 5 L min−1 MFCs are designed for the injection of CO2 and other gases (i.e. SO2, CO, NO, and NO2), respectively, whose concentration in the chamber can be selected by the operator (units in parts per million or parts per billion); a PID (proportional–integral–derivative) controller, using the gas concentration values read from the corresponding gas analyser, keeps the gas concentration in ChAMBRe constant during the experiment.
A 30 L min−1 MFC regulates the injection of dry air inside the chamber. In this case, the PID controller (using the ChAMBRe pressure values measured by pressure sensor mentioned above) allows us to maintain a predefined pressure gap between inside and outside the chamber. MFCs with 12 and a 0.2 L min−1 are dedicated to the injection of known volumes of air and fuel, respectively, inside the burning chamber of a Miniature Inverted Soot Generator (MISG-2; Argonaut Scientific Corporation, Edmonton, Alberta, Canada). The MISG can be connected to an inlet flange of ChAMBRe for the study of the properties of soot particles exposed and maintained in different conditions or to study the effects of soot particles. The input airflow of the nebulizers (see Sect. 2.2), responsible for the crucial process of bacteria injection inside the chamber, is regulated by an analogue 5 L min−1 full-scale MFC (EL-FLOW, Bronkhorst®).
2.1 Instruments permanently connected to the chamber
The concentration of several gaseous pollutants potentially present inside the chamber can be monitored by a set of calibrated gas detectors manufactured by ENVEA®, including a non-dispersive carbon monoxide and dioxide analyser (CO12e), an ozone analyser (O342e), a sulfur dioxide analyser (AF22e), a chemiluminescent nitrogen oxide analyser (AC32e), and a gas chromatography volatile organic compound (VOC) analyser (VOC72M). Details on the quoted monitors are provided in Sect. S1 in the Supplement.
A custom solar simulator manufactured by Sciencetech Inc.™ has been installed on the top of the upper dome of the chamber. The top ISO-K250 flanged aperture has been appropriately modified by inserting a dedicated quartz window (diameter =25 cm) with a high degree of transmittance (>95 %, with nm) and reflectance (<1.5 %, with nm) to the solar spectrum radiation. The system consists of two main sections, namely the light source and the power supply. The light source, a 1600 W Xenon short-arc lamp (Sciencetech Inc.™; XE1600), is mounted inside a dedicated housing, where a set of optical lenses and mirrors deflects the light beam perpendicularly to fit the quartz window aperture. A set of filters is available to intercept the light beam and cut off selectable portions of the spectrum before entering the chamber. In particular, the simulator can be fitted with a low-pass optical filter, designed to cut off a portion of the spectrum in the infrared (IR) region. Alternatively, the optical absorption of the atmosphere can be simulated by using a dedicated filter (AM1.5G air mass filter; Sciencetech Inc.™), which cuts off selected bands to mimic the light interaction of an air mass coefficient of 1.5 (i.e. an optical path length that is 1.5 times that of light traversing the atmosphere at the zenith). Figure 1 shows the impact of the available filters on the light spectrum sent to the chamber. The nominal maximum irradiance provided by the solar simulator without any filter is about 2.4 SUN (2424 W m−2), corresponding to about 119 W passing through the quartz window on the ChAMBRe top dome with the AM1.5 filter mounted inside the solar simulator.
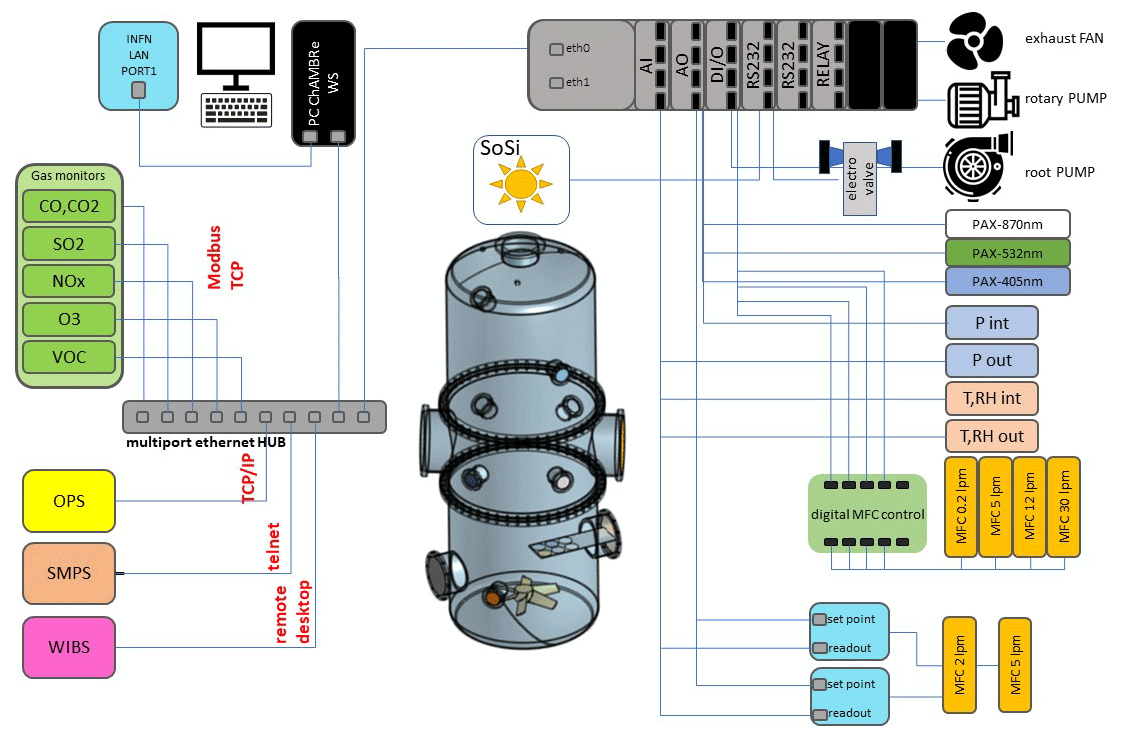
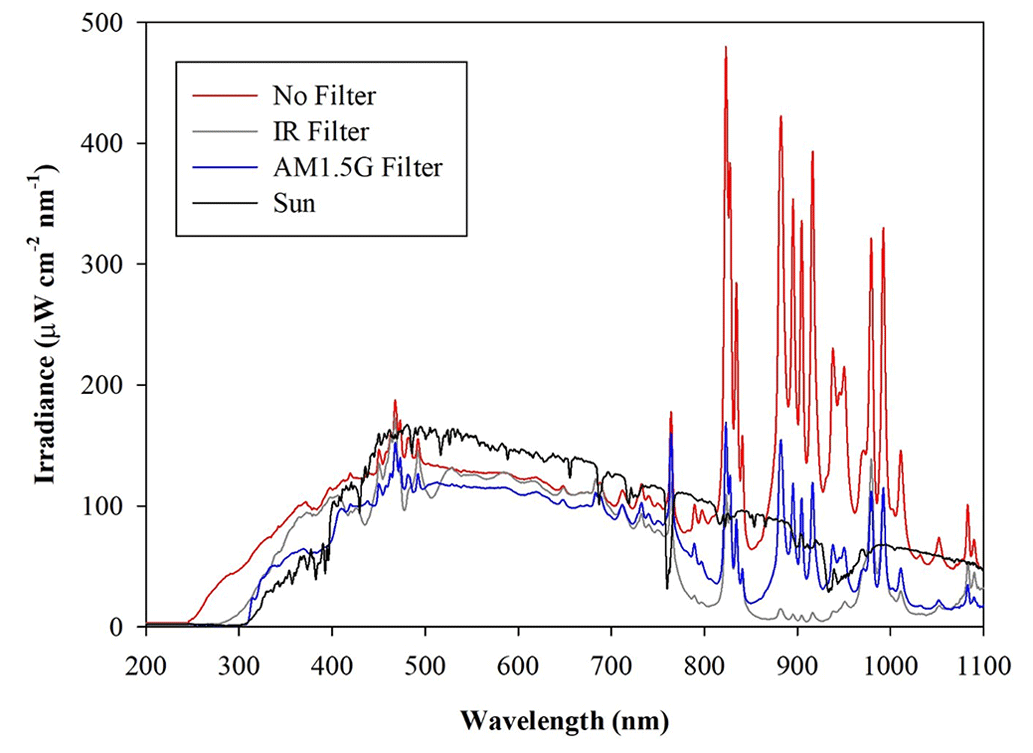
Figure 2Irradiance vs. wavelength measured with a calibrated Avantes ULS2048CL-EVO spectrometer directly at the exit of the solar simulator with and without the available filters. The spectrum labelled “Sun” has been measured on a springtime sunny day in the terrace of the Physics Department in Genoa, Italy. The uncertainties in the irradiance (not reported in the graph) are ±10 % from 200 to 350 nm and 5 % from 350 to 1100 nm.
The solar simulator is also equipped with a set of four neutral density optical filters to reduce the light intensity entering the chamber. These filters provide an attenuation of 19 %, 34 %, 50 %, and 71 % of the lamp power, respectively, and can be fitted two at a time on the device, offering a minimum transmittance of 7 %. The neutral density filters do not significantly alter the shape of spectrum of the transmitted light, attenuating the optical power uniformly (see Sect. S3 and Fig. S2 in the Supplement).
The radial distribution of the optical power measured inside the chamber volume is shown in Fig. 3 as a function of the distance along a cross-sectional diameter in the centre of ChAMBRe. The light intensity has a strong peak at the centre of the diameter, where the optical power is more than 6 times that close to the walls. To obtain the total light intensity irradiated by the lamp in the chamber volume, the measured data points were fitted with a double Gaussian function, which was then integrated in cylindrical coordinates, exploiting the symmetry of the light beam. The resulting intensity is 160±6 W, with the lamp set at full power (power supply set at 105 % of the nominal value) and no optical filter. The total intensity with the AM1.5 filter is 94±4 W, while with the IR filter the total integrated intensity is 81±4 W. With respect to the irradiance measured directly at the solar simulator output, the value inside the chamber shows just a loss of about 20 % (likely due to focusing or collimation). It must be noted that, at the maximum power and no-filter, the irradiance measured on the middle plane of ChAMBRe is about 0.2 SUN, this almost corresponding to the dilution given by the ratio of the surfaces of the top quartz window (diameter of 25 cm) and of the chamber (diameter of 100 cm).
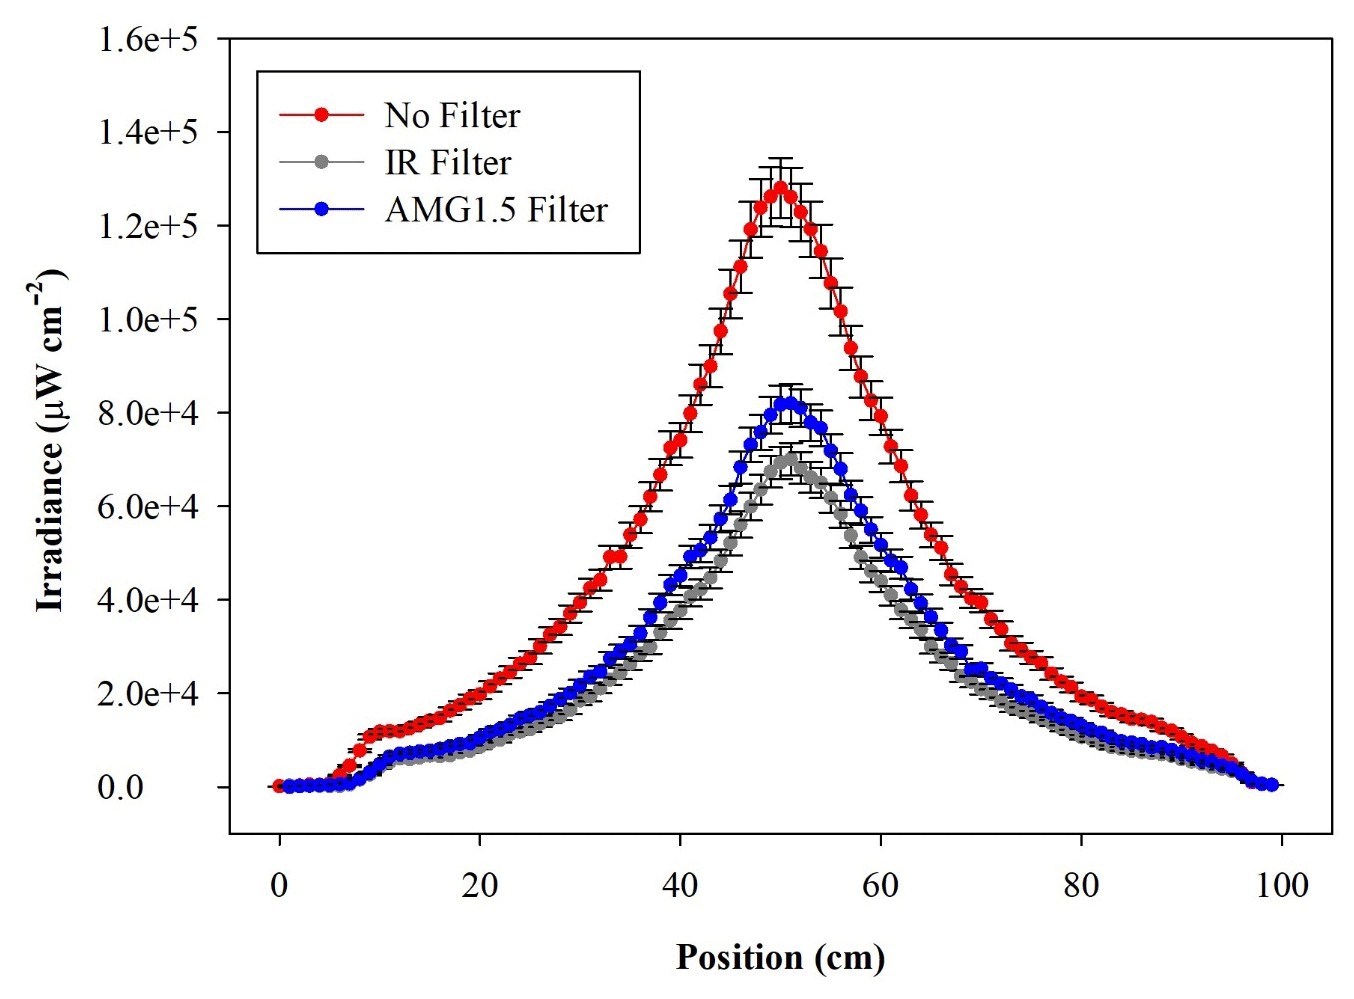
Figure 3Irradiance vs. wavelength measured with a calibrated Avantes ULS2048CL-EVO spectrometer along a diameter at the centre of the ChAMBRe volume, with and without the available optical filters. The centre of the chamber is at a position of 50 cm.
Particle concentration and size distribution inside ChAMBRe are monitored in real time by a scanning mobility particle sizer (SMPS; TSI Inc.; model 3938), in the range of 10–1000 nm, and an optical particle sizer (OPS; TSI Inc.; model 3330) in the range 0.3–10 µm. The SMPS is formed by three components, namely a neutralizer (i.e. a bipolar diffusion charger), a differential mobility analyser (DMA; series 3080), and a condensation particle counter (W-CPC; model 3789) from TSI Inc. The model 3088 neutralizer uses a low-energy (<9.5 keV) soft X-ray source to generate high concentrations of both positive and negative ions to bring the aerosol to a defined, steady-state charge distribution. The DMA is available with two different columns, namely model 3081 long DMA, which provides the widest size range of 10–1000 nm; and the model 3085 nano DMA, which covers the range of particle diameter from 2 and 150 nm. In a DMA, an electric field is created, and the airborne particles drift in the DMA according to their electrical mobility. The particle size is then calculated from the mobility distribution. In the CPC, downstream of the DMA, the particle size is increased by water condensation on their surface, and then the particles are optically counted. The maximum measurable concentration can reach 2×10⁵ particles cm−3. The SMPS working airflow ranges between 0.2 and 1.5 L min−1.
The model 3330 OPS is an optical particle sizer spectrometer that provides the measurement of particle number concentration and particle size distribution based on single-particle counting technology. The OPS has an inlet flow rate of 1.0 L min % and measures particles from 0.3 to 10 µm in 16 user-adjustable size channels (particles above 10 µm are counted but not sized). The OPS 3330 works on the principle of optical scattering from single particles. The OPS uses a laser beam (λ=660 nm) and a detector to detect particles passing through a sensing volume illuminated by the laser. Particle pulses are counted individually and binned into 16 channels up to their pulse heights. The OPS is factory-calibrated using different monodispersed polystyrene latex (PSL) particles for size classification; the size resolution is 5 % at 0.5 µm, following the procedure described in the International Organization for Standardization (ISO) 21501-1 normative. Particles exiting the chamber are trapped by a gravimetric filter for possible chemical analysis after sampling.
A waveband-integrated bioaerosol sensor (WIBS-NEO; Droplet Measurement Technologies®) has been integrated in the ChAMBRe particle monitoring system to measure the bioaerosol concentration. The instrument uses two UV-filtered flashlamp sources (λ=280 nm and λ=370 nm) to excite fluorescence in individual particles (Lieberherr et al., 2021). Detection wavebands have been selected to optimize the detection of common bioaerosol components and let the user discriminate between different types of biological microorganisms (bacteria, fungi, pollen, etc.). The massive amount of data generated by the WIBS during the experiments at ChAMBRe through a list-mode offline analysis has made it necessary to develop a dedicated software tool, written in the Igor PRO 8.0 (WaveMetrics, Inc.) language, aimed at implementing a multi-parametric data reduction and to retrieve the airborne bacteria or bioaerosol concentration inside the chamber as a function of time. Starting from the raw data, the Igor procedure first sets a background threshold for the particle fluorescence intensity and groups the particles into three channels (A, B, and C) and their relative intersections (AB, AC, BC, and ABC), according to their presence within the three fluorescence detection waveband groups (FL1, FL2, and FL3), following the terminology adopted in the WIBS (Lieberherr et al., 2021). Then, for signal–background separation purposes, fiducial cuts are applied on scatterplots (fluorescence intensity vs. particle size) relative to particles belonging to channel A, which is known to be mainly populated by particles showing a bacteria-like fluorescence emission. Examples of the scatterplots are reported in Fig. 4, where the region of interest of the signal (E. coli bacteria) is well separated from the background region.
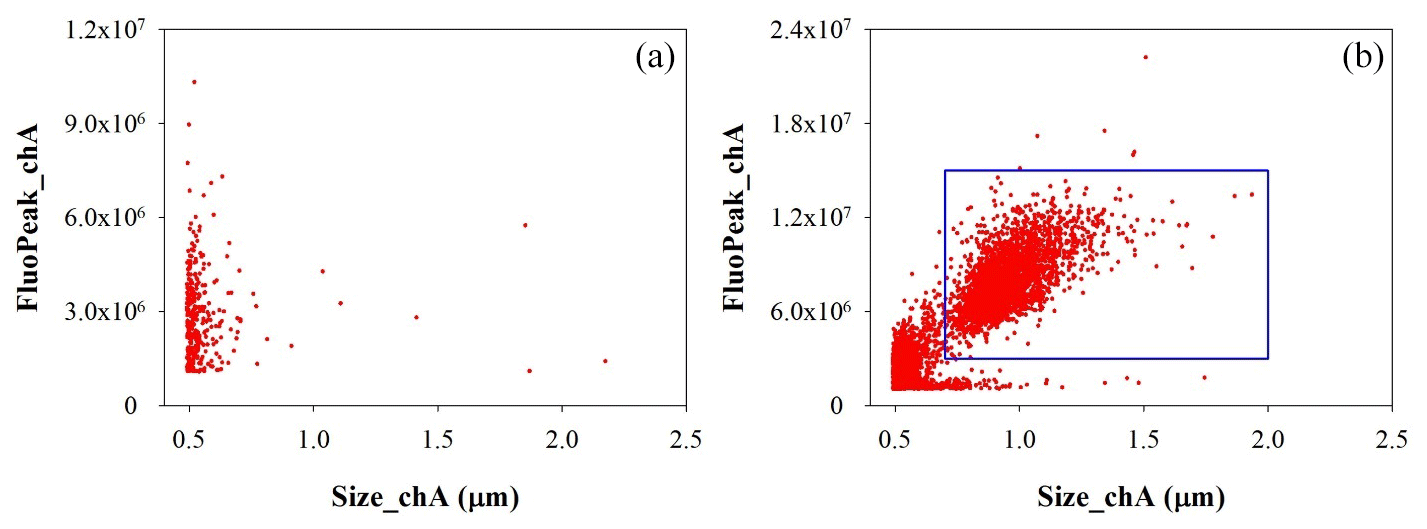
Figure 4Size distribution of particles in channel A. (a) Background measured without any bacteria injected in ChAMBRe. (b) Particle population after E. coli injection. The particles inside the rectangular blue region of interest are identified as E. coli.
Finally, the whole analysis is cycled over user-selectable time intervals to retrieve the time-resolved particle concentration during the whole experiment. Figure 5 shows the time series of E. coli concentration inside the chamber during a typical experiment.
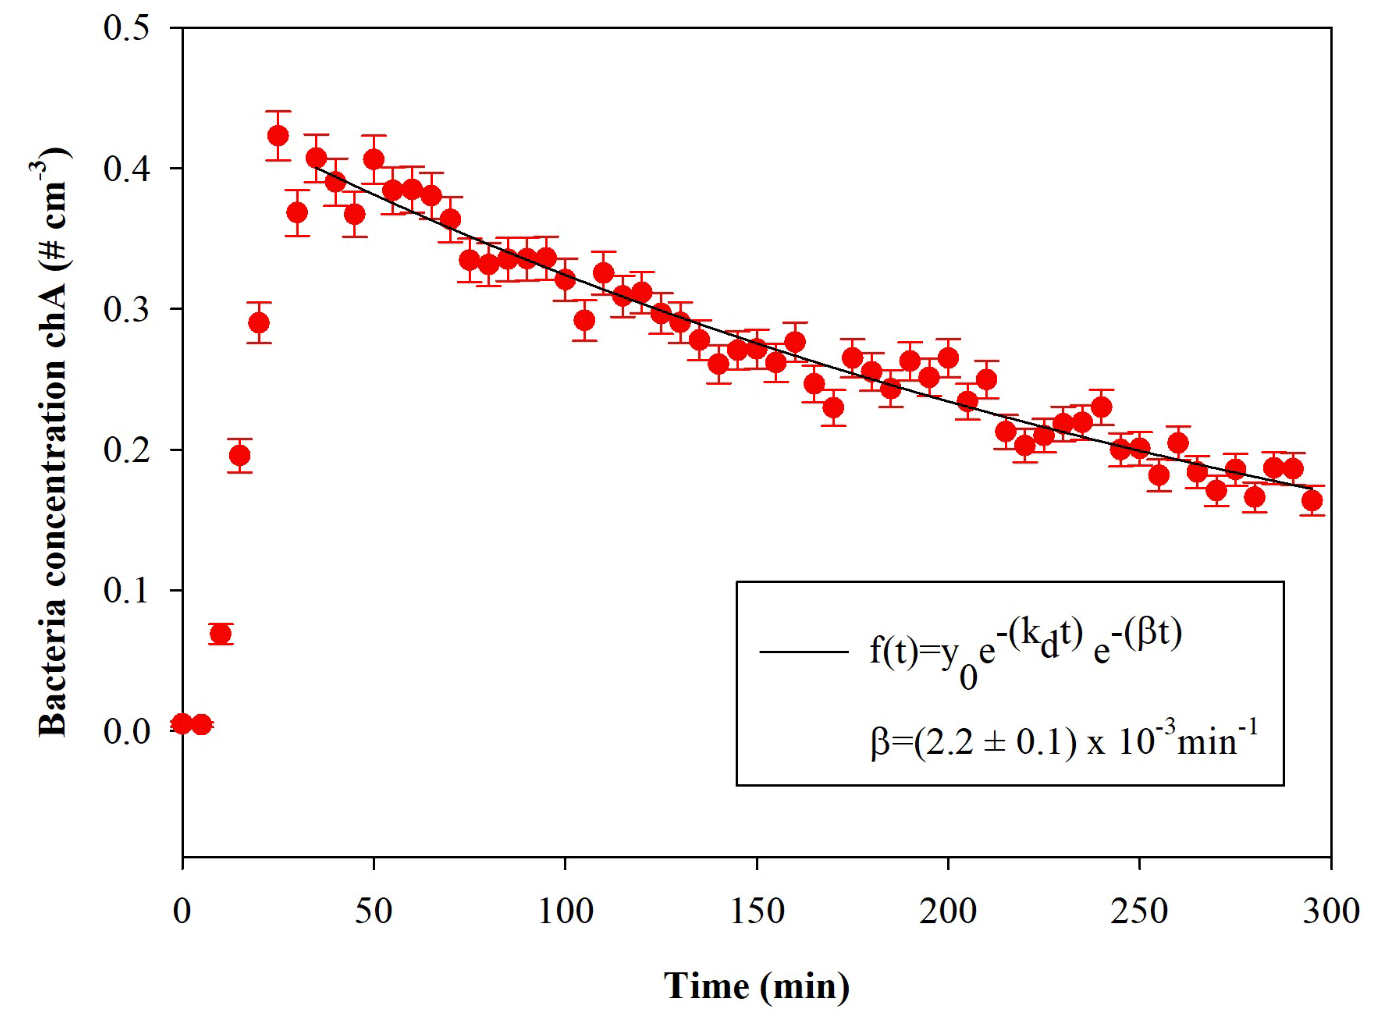
Figure 5Temporal trend of E. coli particles inside the chamber; t=0 is the injection start. The curve fit is also shown, where β is the particle loss rate coefficient, and kd is the dilution factor (here min−1). The error bars are the standard deviations calculated following the Poisson statistics.
Optical properties (i.e. absorption, extinction, and scattering coefficients) of particles suspended inside the chamber can be measured online by photoacoustic extinction meters (PAXs; Droplet Measurement Technologies) at three wavelengths of λ= 870, 532, and 405 nm. The PAX directly measures in situ light absorption and scattering of aerosol particles, from which it derives extinction, single-scattering albedo, and black carbon mass concentration (Vernocchi et al., 2022). PAX uses a modulated diode laser to simultaneously measure the light scattering and absorption. The standard infrared 870 nm wavelength option is highly specific to black carbon (BC) particles, since there is relatively little absorption from gases and non-BC aerosol species at this wavelength. A nominal 1 L min−1 aerosol sample flow is drawn into the PAX using an internal vacuum pump controlled by two critical orifices. The flow is split between the two distinct measurement regions, namely a nephelometer, for the light scattering measurement, and a photoacoustic resonator, for the absorption measurement. Absorbing particles heat up and quickly transfer heat to the surrounding air. A sensitive microphone detects the pressure waves produced by the heating, whose intensities are interpreted to infer the particle absorption coefficient (Moosmüller et al., 2009). In the nephelometer, a photodiode set at 90∘ with respect to the beam detects the radiation reflected by the sampled particles. The scattering measurement responds to all particle types, regardless of chemical make-up, mixing state, or morphology.
Acquisition and control of the instruments connected to ChAMBRe is handled by a National-Instruments™-based system made up of a main controller (NI cRIO-9057) and several modules (C Series modules), which allow communication with the peripheral devices via analogue, serial, and ethernet data transfer protocols. The operator interaction with the sensor network is demanded to a single NI LabVIEW™ SCADA (supervisory control and data acquisition) custom application, which provides the user with a global data overview and a full real-time control over all the instruments parameters via a user-friendly human–machine interface (HMI). In Sect. S2 (Fig. S1), a screenshot of the main panel of the SCADA application is shown.
2.2 Other equipment for specific applications or experiments
Aerosols to be used in ChAMBRe experiments can be generated in different ways, depending on the specific application. The flow-focusing monodisperse aerosol generator (FMAG; TSI Inc.; model 1520) can be used to produce monodisperse particles in the diameter range 0.8–12 µm, starting from both liquid and solid materials. The MISG is used to produce soot particles from the controlled combustion of different gaseous fuels (Vernocchi et al., 2022).
Three nebulizers designed for bioaerosol applications are also available, namely the Collison nebulizer, the Blaustein Atomizing Modules (BLAM), and the Sparging Liquid Aerosol Generator (SLAG), all manufactured and distributed by CH Technologies, Inc. The performances of the three nebulizers in connection to the injection of viable bacteria in the chamber have been previously investigated and described in Danelli et al. (2021).
Bacteria injected inside ChAMBRe can be collected by different methods. All of the methods described below allow us to perform offline analyses. A cylindrical horizontal volume is connected to the chamber by an ISO-KF250 pneumatic valve; this volume can be alternatively opened or closed without disturbing the inner atmosphere, thanks to another ISO-KF250 pneumatic valve. Inside the cylinder, there is a sliding tray that can be inserted in ChAMBRe by an external manual control to minimize the risk of contamination. The tray can host up to six Petri dishes (diameter of 10 cm each) to collect bacteria (or, in general, PBA) directly by gravitational settling. In addition, bacteria can be collected on solid medium (i.e. Petri dishes filled with culture medium) by the active sampling by an Andersen impactor (single-stage Andersen Cascade Impactor; Tisch Environmental) working at a fixed airflow of 28.3 L min−1 that is supplied by a dedicated pump. The impactor is connected to the chamber by ISO-K flanges. Moreover, bioaerosol can be collected through a liquid impinger (Flow Impinger, Aquaria Srl) filled with 20 mL sterile liquid solution. Such a device can be easily connected to the chamber volume through the ISO-K flanges. The impinger operates at a constant airflow of 12.5 L min−1 (e.g. by a low-capacity pump; model LCP5; Copley Scientific Limited). Finally, aerosol suspended in the chamber can be also collected on filters (i.e. quartz fibre, PTFE, and cellulose). Sampling is managed by a low-volume particulate matter sampler, setting the airflow in the range 10–50 L min−1.
2.3 Equipment to manipulate bioaerosol
A biological laboratory with specific instrumentation for isolating and maintaining bacterial cells culture is part of the ChAMBRe facility. It has the following instruments:
-
A biosafety cabinet and laminar flow hood (Miniflow Linear Blue Air; Aquaria, Milan, Italy) is used to provide a contamination-free working environment for the workers. A laminar flow filters the air and traps dust particles and microbes for providing a sterile working environment in the stainless-steel cabinet. The hood is equipped with HEPA filter and an UV lamp allows the sterilization of the illuminated surfaces inside the hood.
-
The centrifuge MPW-352 MPW MED instruments (Warsaw, Poland) are used to separate particles from a homogeneous solution through rotational movement and centrifugal acceleration, thus causing the sedimentation of its components. The MPW-352 has a swinging-bucket rotor that swings out when a centripetal force is applied and holds the pellet at an approximate 90∘ angle relative to the angle of rotation.
-
A Shimadzu 1900 spectrophotometer, designed for liquid samples, is a double-beam UV-Vis device (Shimadzu Corporation, Japan) that measures intensity as a function of the light source wavelength. For each wavelength of light passing through the spectrometer, the intensity of the light passing through the sample cell is measured. The biological applications include measurement of substance concentration such as protein, DNA or RNA, growth of bacterial cells, and enzymatic reactions.
-
A shaker incubator, designed for liquid samples, which has an orbital rotation movement (SKI 4 ARGOLAB, Carpi, Modena, Italy), provides a controlled environment for samples to grow and develop, while also providing the mechanical agitation to mimic the natural movement of the cells in their environment. Shaking can be used to promote the growth and development of cells and microorganisms to increase the oxygen supply to the cells. The oxygen is an important factor that can affect the growth and metabolism of cells. By shaking the culture, it is possible to increase the oxygen supply to the cells by increasing the diffusion of oxygen into the media.
-
QUANTOM Tx™ microbial cell counter Logos Biosystems, South Korea, is an automated cell counter that can detect individual bacterial cells in a liquid sample. The instrument provides the counting of the total number of cells in the suspension using a fluorescent probe. It captures images of fluorescence-stained cells (10 fields). The optimal concentration range of the count is 5×10⁵–5×10⁸ cells mL−1, and the size range of the count cells is between 0.3 and 50 µm. To evaluate the uncertainty of the bacteria count (QTxTOT), we repeated the measurement on the same sample 10 times, and we found a results repeatability of 5 %. This uncertainty is much higher than the statistical error in the total counting (assuming the Poisson statistic), and for this reason, we adopted a 5 % uncertainty for all QUANTOM Tx™ counts. The sample is prepared from the bacterial suspension in physiological solution immediately before injection; to count the total number of cells, three different solutions to 10 µL of the initial suspension are added, namely Total Cell Staining Dye, Total Cell Staining Enhancer, and Loading Buffer I. The first solution added is the Total Cell Staining Dye, a membrane-permeable fluorescent dye, which is capable of binding to nucleic acids in viable and non-viable cells and allows the detection of Gram-positive and Gram-negative bacteria. This probe has an excitation wavelength of λ=484 nm, and it emits λ=504 nm. The second solution used is the Total Cell Staining Enhancer to guarantee a better cell penetration by the probe and to obtain a uniform background during the images acquisition by QUANTOM Tx™. The sample must be incubated in the dark at 37 ∘C for about 30 min to favour the penetration of the fluorescent dye into the cells. Finally, the Loading Buffer I solution is added and used to uniform the distribution and the sedimentation of bacterial cells in the counting stands. The slide, after being centrifuged at 300 RCF (relative centrifugal force) for 10 min, is inserted in the specific support in the counter and then illuminated with a lamp at λ=470 nm, with a bandpass of 30 nm. The light power can be set to nine levels of intensity (labelled from one to nine). In our experiments, the best results are obtained by selecting the intensity of five to count the total cells.
Bacteria cultivation, injection, monitoring, and experiments in ChAMBRe
The bacteria strain used so far to perform experiments at ChAMBRe is Escherichia coli (ATCC® 25922™), which is Gram-negative bacterio purchased by Thermo Scientific™ Culti-Loops™. E. coli is rod-shaped, about 1–2 µm long, and about 0.25 µm in diameter (Jang et al., 2017). It is a common inhabitant of the gastrointestinal apparatus of warm-blooded animals, including humans. This strain is a non-pathogen proxies for the typical atmospheric bacteria, which is extensively used as model organisms in microbiology and molecular biology fundamental and applied studies (Lee et al., 2002; Lee and Kim, 2003).
The first step of our procedure was to determine the growth curve of E. coli by recording the optical density (OD) at λ=600 nm (OD600 nm) at specific time intervals during the population's evolution and measuring the bacteria total concentration by the QUANTOM Tx™ and the bacteria viable concentration by standard dilution plating, as detailed in Sect. S4.
To describe the growth curve of E. coli as a function of nutrient depletion, we followed the logistic function model that has been shown to return the best fit for modelling bacteria growth (Annadurai et al., 2000; Wachenheim et al., 2003; Akin et al., 2020). The logistic equation is written as
where y indicates the bacteria concentration in the solution, y0 is the saturation value, b is the maximum specific growth rate, and t0 is the time at the inflection point.
We followed the growth of E. coli in the suspension culture for about 8 h from the lag phase to the horizontal asymptote and the values of reduced chi-squared (χ2), y0, b, and t0 of the logistic fit for OD600 nm, QTxTOT, and CFU (colony-forming unit) (mL−1) are reported in Table 1.
Table 1χ2, y0, b and t0 of the logistic fit for OD600 nm, QTxTOT, and CFU (mL−1).
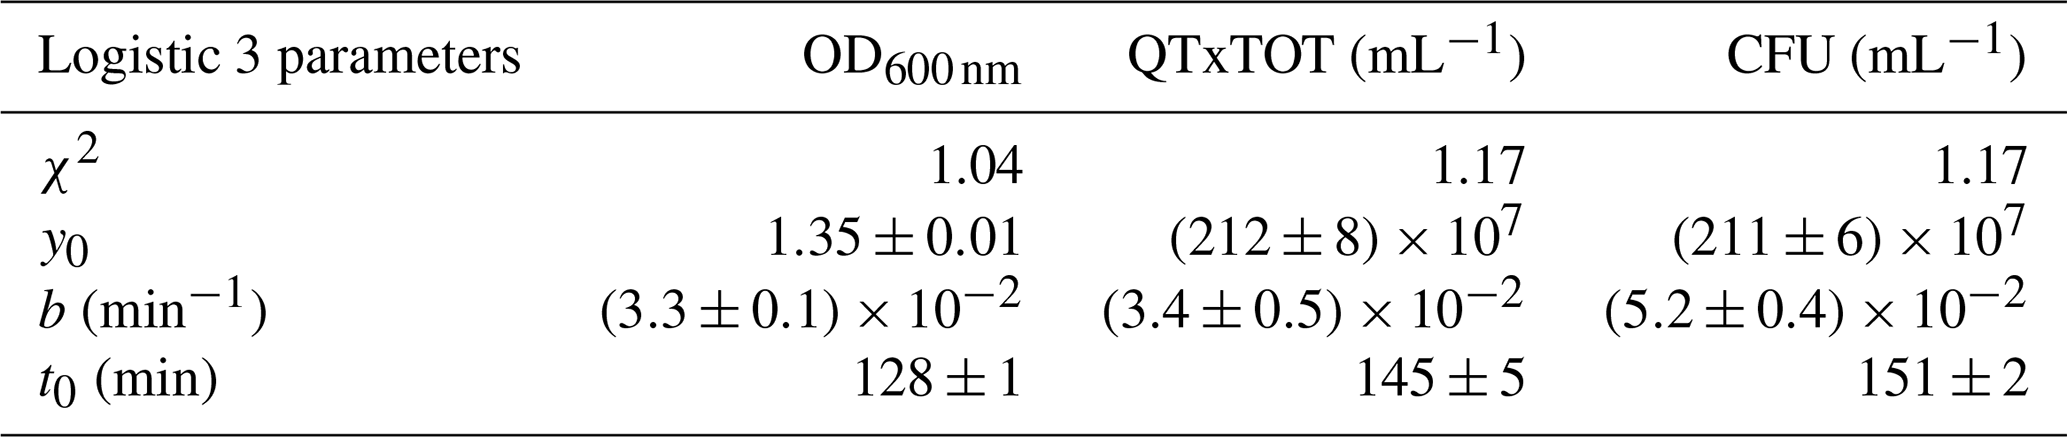
The b values of OD600 nm and QTxTOT are compatible within their uncertainties, and this result is expected, since the OD600 nm is an indirect measurement of the total concentration of cells in suspension. The grow rate of CFU (mL−1) is faster, and the corresponding doubling time (about 19 min) is compatible with the value reported in the literature (Son and Taylor, 2021).
To prepare the inoculum for the chamber experiments, the E. coli is grown in 30 mL fresh TSB (tryptic soy broth) nonselective medium in a shaking incubator at 37 ∘C and 200 rpm (revolutions per minute), and its growth is followed by checking the OD600 nm value until the mid-exponential phase, when OD600 nm∼0.5, 20 mL of this liquid preparation is centrifuged at 3000 rpm for 10 min. Afterward, the bacteria pellet, separated by surnatant, is resuspended in a 20 mL sterile physiological solution (NaCl 0.9 % ) to prepare a suspension of approximately 108 CFU mL−1, as verified by standard dilution plating. To retrieve the bacterial concentration, the average of CFU counting on agar plates and the uncertainty are calculated following the metric described in Sect. S4.
For the experiments performed at ChAMBRe, the typical bacterial concentration in the inoculum is 107 CFU mL−1. To reach this concentration, a further dilution step is needed (i.e. typically 1:10 or 1:5) before the injection (see Massabò et al., 2018, for details).
The concentration of the solution to be injected inside ChAMBRe is also controlled in terms of total cells (mL−1) by QUANTOM Tx™ microbial cell counter. The sample is prepared from the bacterial suspension in a physiological solution. In each single analysis, QUANTOM Tx™ acquires 10 visual fields of the slide's counting chamber, which correspond to an approximate volume of 0.09 µL to retrieve the bacterial count. To evaluate if the exposure of QUANTOM Tx™ lamp degrades the fluorescent probe (photobleaching) of the total cells, we repeated the total cell counts by inserting and ejecting the same sample 10 times. The total count probe did not show a particular sensitivity to the exposure to the QUANTOM Tx™ lamp, and the coefficient of variation turned out to be less than 5 %. Further details on the use of QUANTOM Tx™ counter are given in Sect. S5.
The bacteria suspension, properly diluted, is injected into the chamber volume mainly by using the Sparging Liquid Aerosol Generator, SLAG, which ensured the better reproducibility in earlier tests (Danelli et al., 2021). The injection phase typically lasts 5 min. Injection airflow and duration are automatically controlled by a mass flow controller (Bronkhorst; model F201C-FA) managed via SCADA. In this way, 2 mL of the bacterial suspension are nebulized inside ChAMBRe.
Experiments with E. coli have been performed by active sampling via the Andersen impactor. The sampling time was progressively increased after the injection to collect a suitable number of CFUs. Sampling times during E. coli experiments are summarized in Table S2 in the Supplement.
After the experiments in the simulation chamber, the plates sampled are incubated at 37 ∘C for 24 h. The CFUs are then counted, and in the experiments conducted by active sampling, the CFU (cm−3) are calculated.
The possible correlation between bacteria viability and air quality can be investigated in terms of change in bacteria viability due to the exposure to atmospheric pollutants. Effects on bacteria viability are compared in relation to “baseline experiments”. In a baseline experiment, the viability of airborne bacteria is measured at atmospheric pressure, with temperatures around 20 ∘C and with relative humidity around 60 %. Such values have been chosen to reproduce an environment suitable for the survival of bacteria (Dunklin and Puck, 1948; Cox, 1966; Benbough, 1967). During baseline experiments, the bacteria's viability depended on their characteristics and experimental procedures only. The baseline was assessed both in dark (solar simulator off) and light (solar simulator on) conditions. With light conditions, the solar simulator was used with the AM1.5 filter mounted (see Sect. 2.1) to reduce the UV radiation; several experiments were replicated with the solar simulator lamp intensity set at 105 % and 80 % of the nominal value (i.e. the maximum and minimum intensity level which guarantees stability without using neutral filters). Baseline experiments (see Sect. 3) were also particularly important to assess the reproducibility and hence the sensitivity of the whole procedure.
The baseline assessment was followed by a set of exploratory experiments with E. coli exposed to selected pollutants. We measured the possible bacterial viability changes due to the exposure to atmospheric conditions typically met in polluted urban areas. So far, E. coli was exposed to different concentrations of NO and NO2, which are two of the most common pollutants emitted by vehicular and ship traffic (Seinfeld and Pandis, 1998; Monks et al., 2009; Pöschl and Shiraiwa, 2015).
The experiments performed to investigate the possible effects on bacteria viability due to the exposure to atmospheric pollutants were conducted by following the same procedure adopted to assess the baseline and introducing the specific pollutant inside ChAMBRe. During gas pollutant experiments, NO or NO2 concentration was kept constant, thanks to the feedback control system described in Sect. 2.1.3.
3.1 Baseline experiments with E. coli in dark conditions
E. coli behaviour in a set of eight replicated experiments, led from separate cultures, was first determined in dark conditions. The average total concentration and standard deviation of E. coli inside the chamber at t=0 (3 min after the conclusion of the injection to allow proper mixing or homogenization inside the ChAMBRe volume) was (0.34±0.08) cells cm−3, as measured by the WIBS; the average viable concentration and standard deviation, determined by the Andersen impactor sampling at t=0, was (0.04±0.02) cells cm−3. The viable concentration at t=0 was obtained by measuring the CFUs on three Petri dishes consecutively sampled; the coefficient of variation on the CFUs collected on the three Petri dishes had results equal to 12 %.
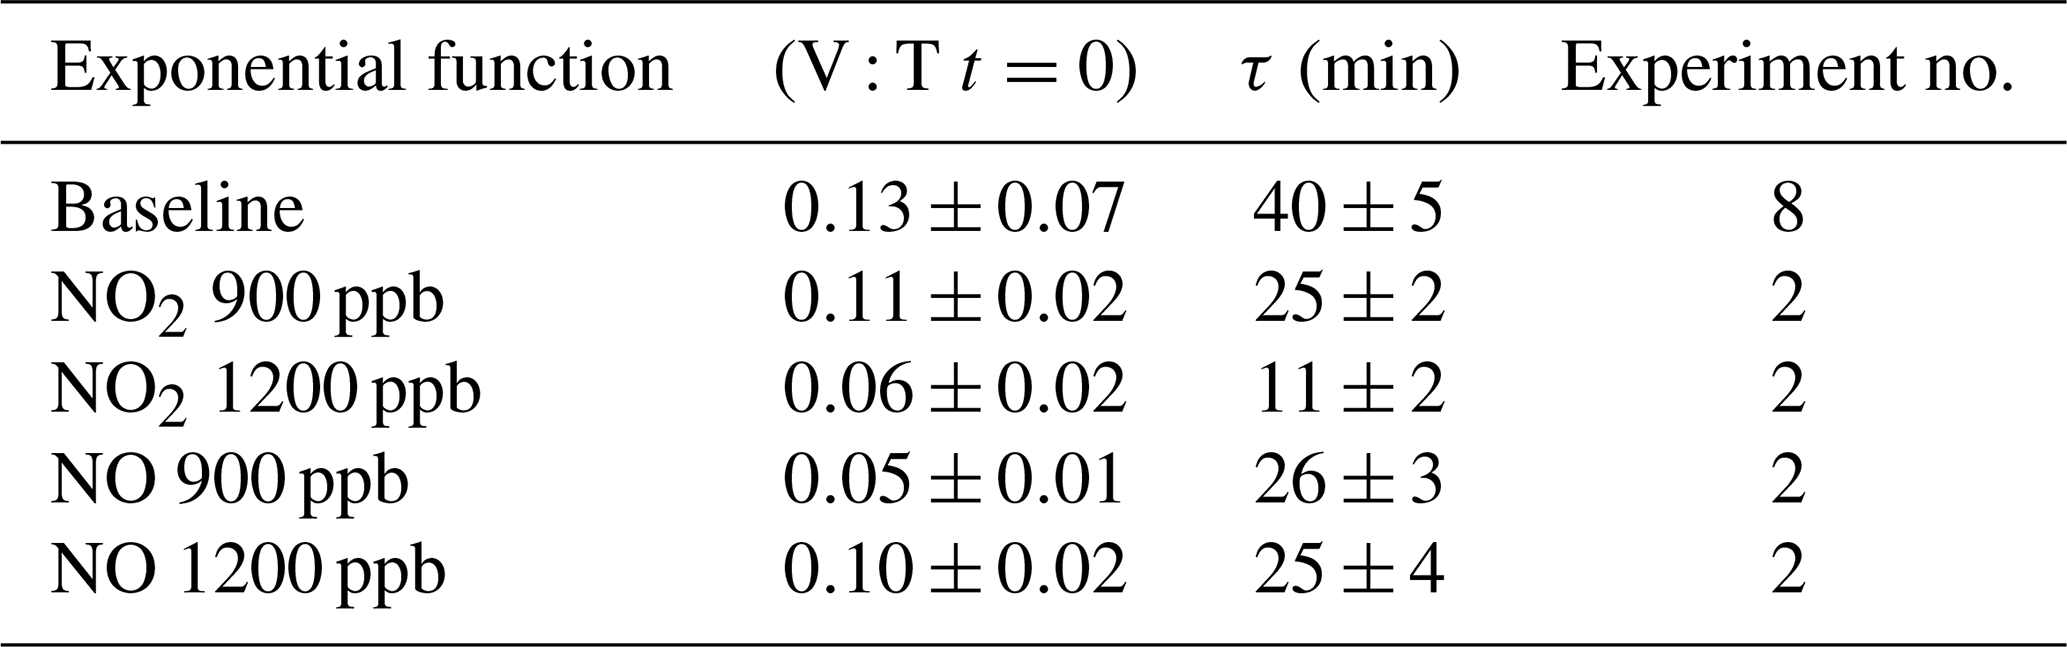
The average ratio and standard deviation of viable : total (V : T in the following) bacteria concentration inside ChAMBRe at t=0 turned out to be V : T . The total and viable bacteria concentration values measured inside ChAMBRe depended on the V : T ratio in the inoculum to be injected (biological effects between each bacteria culture) and on the aerosolization process affecting the bacteria viability. The bacteria viable concentration in the inoculum was determined via standard dilution plating, while the bacteria total concentration was calculated by the QUANTOM Tx™. During baseline experiments, the V : T ratio of the inoculum ranged between 0.25±0.03 and 0.50±0.06. Time trends of the averaged total and viable concentration of the bacteria, nebulized inside ChAMBRe, are shown in Fig. 6. Bacteria lifetime in ChAMBRe can be calculated by fitting the data of each experiment with an exponential function as
where C0 is the total or viable concentration of E. coli just after the injection (t=0), and τ is the total or viable bacteria lifetime, respectively. In Table 2, the average and standard deviation of C0 and τ for the E. coli total and viable concentration of eight experiments are reported.
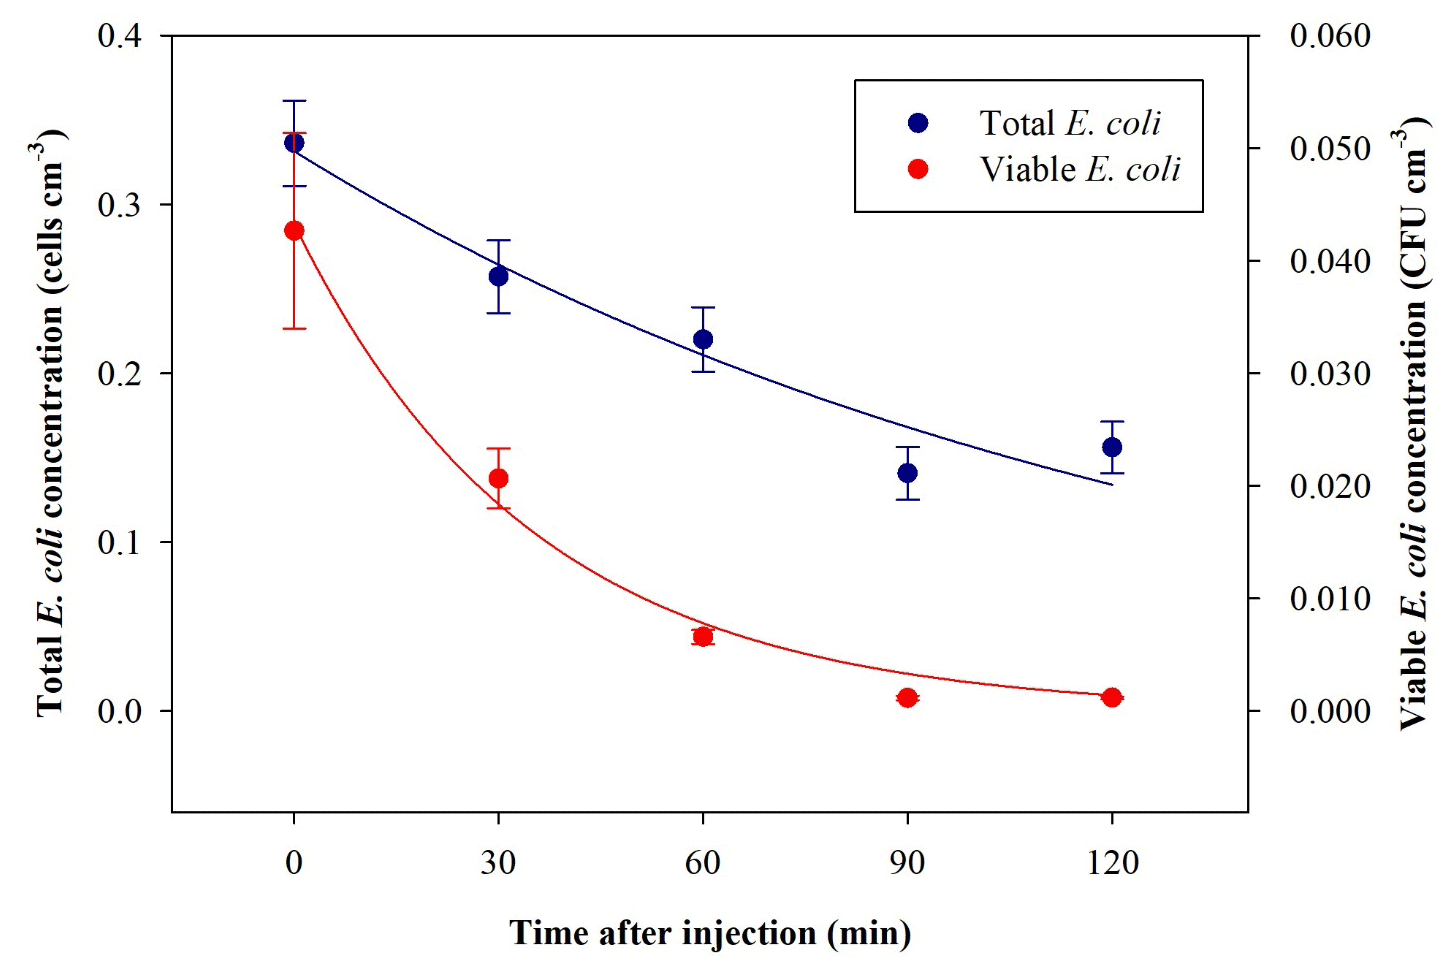
Figure 6Time trend of E. coli average bacteria total (blue) and viable (red) concentration inside ChAMBRe obtained by eight repetitions of baseline experiments.
Table 2C0 and τ (average ± standard deviation) of the exponential fit for total and viable concentration of E. coli.
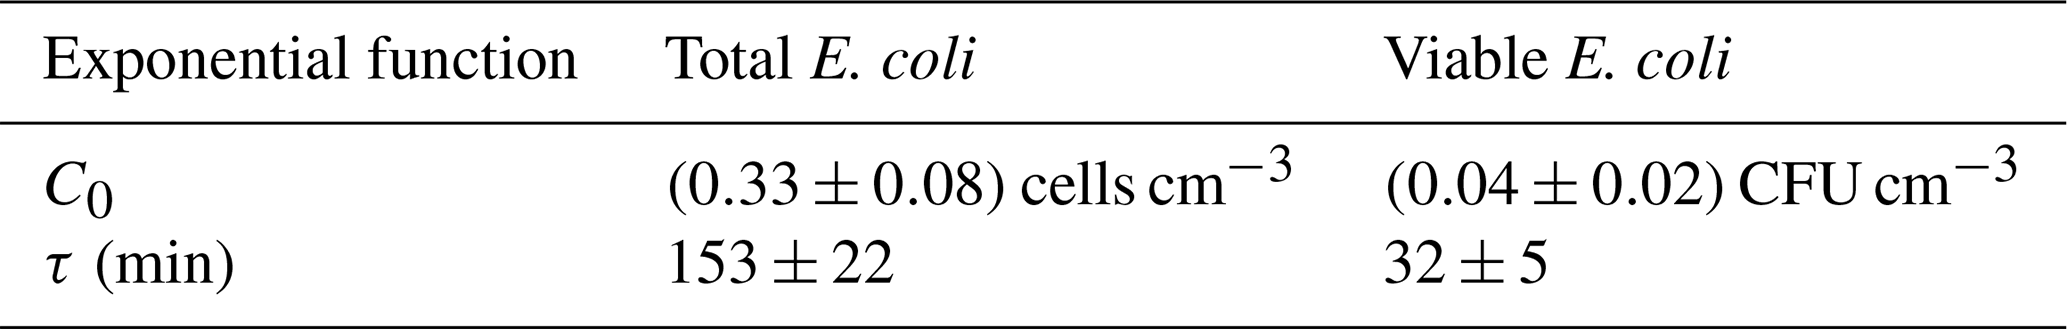
The total E. coli average lifetime is about 153 min; this value agrees with data reported in Massabò et al. (2018) for generic aerosols, with particles in the same size range of E. coli (1–2 µm) and τ= 2–3 h. The viable E. coli average lifetime is about 32 min, lower than the aerodynamic lifetime, thus indicating the difficulty this microorganism has in surviving in the atmospheric medium.
3.2 Experiments with E. coli and NOx in dark conditions
A preliminary check was performed exposing the E. coli to O3, which is recognized to be a strong antimicrobial agent (Kim et al., 1999; Thanomsub et al., 2002; Giuliani et al., 2018); hence, the expected result was a complete viability loss. The exposure of bacteria to O3 (concentration >1000 ppb) resulted in a complete cell mortality, as expected. The initial condition immediately after the injection was V : T , and no CFUs were collected in any of the following sampling activities (starting 30 min after the injection).
In another experiment, bacteria were exposed to NO2 and NO concentrations, with 900 and 1200 ppb for both the pollutants. The exposure of bacteria to such pollutants showed a V : T reduction. The average results, obtained in a set of eight experiments led from separate cultures, are shown in Fig. 7.
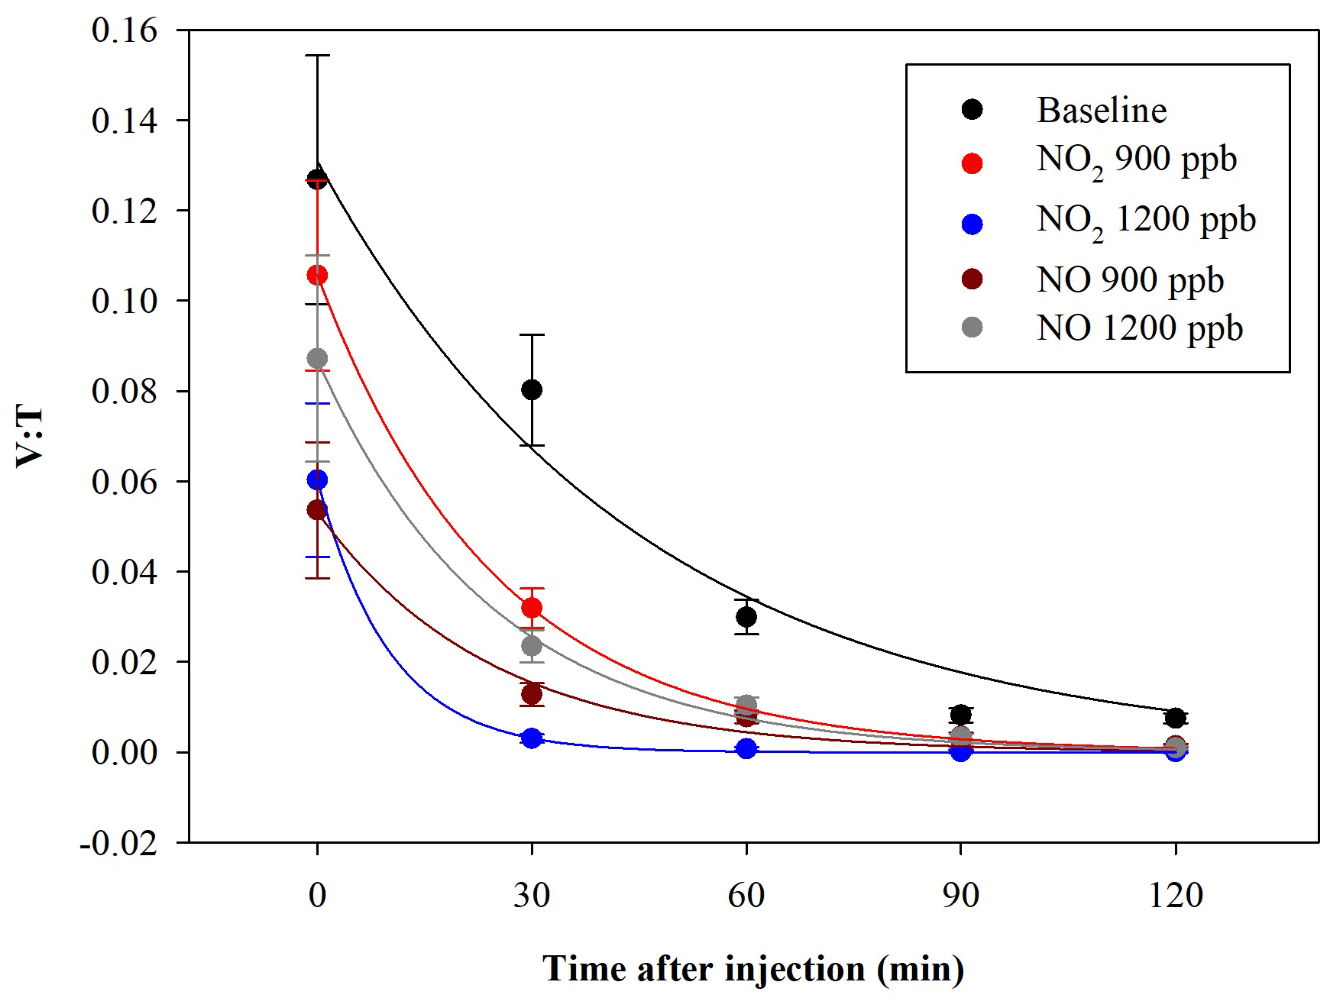
Figure 7Time trend of the V : T ratio for E. coli in the baseline (black) and in the experiments with ChAMBRe maintained at a constant concentration of NO2 (900 ppb red and 1200 ppb blue) and NO (900 ppb in dark red and 1200 ppb in grey).
The quantitative reduction in the E. coli lifetime, due to the exposure to pollutants, can be evaluated considering the V : T ratio and fitting the data with an exponential curve, as previously described; the results are shown in Table 3.
Table 3Initial values and τ (average and standard deviation) of the exponential fit for V : T ratio of E. coli at different pollutant concentrations.
E. coli average lifetime in baseline experiments, calculated on the V : T ratio, turned out to be about 40 min. The exposure of E. coli to NO2 reduced the lifetime to about 25 and 11 min, with a concentration of 900 and 1200 ppb, respectively. The exposure to 900 and 1200 ppb of NO decreased bacteria lifetime to 26 and 25 min, respectively, and the values are similar to the value obtained with the lowest NO2 concentration. The increase in the NO concentration did not correspond to a decrease in the E. coli viability, as observed with NO2; these results suggest a greater toxic effect of NO2 than of NO on E. coli. The literature regarding a comparison of the toxic effects of NO and NO2 on E. coli is poor. Some research articles have demonstrated negative effects of these two gases on bacterial strains. Kosaka et al. (1986) found a decrease in E. coli viability with increasing NO2 concentration. Janvier et al. (2020) highlighted a significant adverse effect of NO2 on some commensal skin bacterial strains. Mancinelli and McKay (1983) found that a low concentration of NO is bacteriostatic for some organisms but not for others. It is worth noting that NO has a strong antimicrobial property, as it is an endogenously produced molecule that is critical for critical infection defence (Fang, 1997), although some bacteria are able to escape this NO action (Privett et al., 2012).
3.3 Experiments with E. coli and solar simulator
E. coli behaviour when exposed to light was determined in a set of dedicated baseline experiments. No significant differences in the results appeared when changing the intensity of the solar simulator operated with the AM1.5G filter, and the data with a solar simulator intensity of 100 % are reported here. After the injection, the average total concentration of E. coli reached inside the chamber was (0.30±0.03) cells cm−3, which is compatible with the dark baseline, while the average viable concentration was (0.019±0.005) cells cm−3 and lower than what was obtained in dark experiments. The consequent V : T ratio was (0.06±0.02). The viable concentration collapses quickly, reaching zero after 30 min. The comparison between V : T ratio obtained for dark and light baseline is shown in Fig. 8.
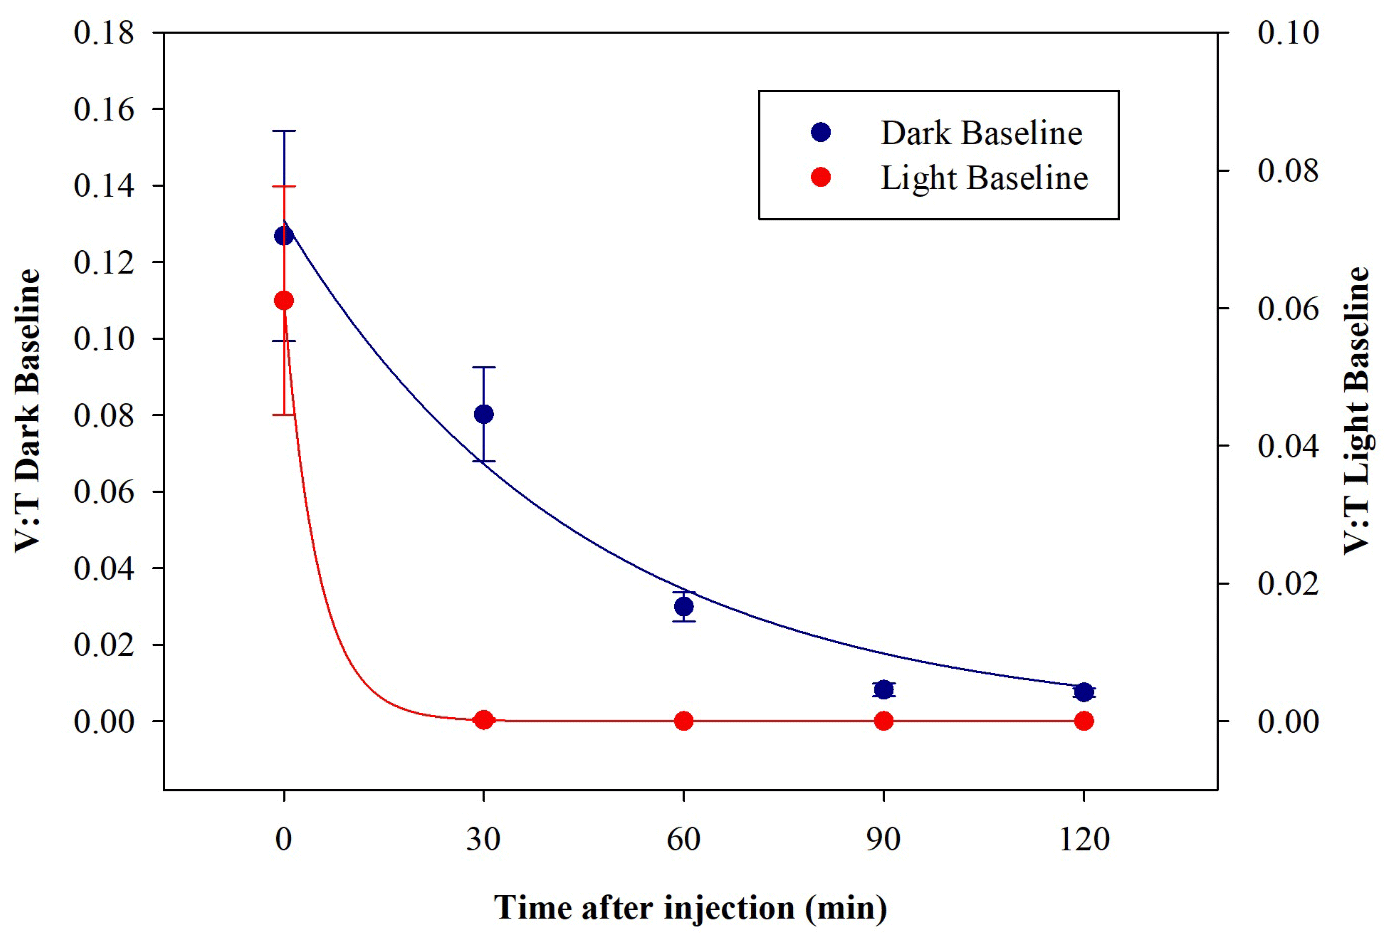
Figure 8Time trend of the V : T ratio for E. coli in the dark baseline (dark blue) and light baseline (red) experiments.
These results indicate a significant decrease in bacteria viability due to their exposure to solar radiation. The behaviour, here evaluated in an atmospheric environment, agrees with observation in water environments reported in several works (Whitman et al., 2004; Jozić et al., 2014; Tiwari et al., 2022); the solar radiation is indicated to be an abiotic factor, with the negative effect of bringing some bacteria strains, among which are E. coli, into a temporary inactivation or non-cultivable state.
The main result presented in this work is the assessment of a multi-step and well-controlled protocol to perform experiments on the impact of air quality on bacteria viability by an atmospheric simulation chamber, which is ChAMBRe in this case. Even if the chamber configuration is still in progress and several new pieces of equipment will be deployed at ChAMBRe in the near future, the present set-up opens the possibility of systematic studies. The average τ of the V : T ratio of eight baseline experiments was 40 min, with a standard deviation of 5 min; the coefficient of variation of 13 % corresponds to the experimental sensitivity to changes in E. coli viability due to exposure to pollutants and/or other relevant parameters. The baseline reference must be experimentally determined for each bacteria strain, and efforts are planned to repeat the observation with Bacillus subtilis, Bacillus spizizenii, and Pseudomonas fluorescens in the near future. It is worth noting that the experimental protocol returns the lifetime of total and viable bacteria injected in the chamber. The figure for total bacteria corresponds to the aerodynamic behaviour of aerosol of diameter around 1 µm, as already reported in Massabò et al. (2018), while the lifetime of the viable bacteria is much shorter (about half an hour) due to the difficulty of this microorganism has in surviving in the atmospheric medium. Such a shorter lifetime posed clear constraints on the first experiments, with the exposure of E. coli to NOx inside ChAMBRe. A time window of 2 h after the bacteria injection was considered to observe the behaviour of E. coli viability, and it was possible to quantify a lifetime reduction, in dark conditions, that are clearly related to the NO and NO2 concentration inside ChAMBRe. These findings pave the way for systematic studies that include other bacteria strains and pollutant species. With E. coli exposed to the light produced by the solar simulator operated with the AM1.5 filter, the viability that resulted was very short, even in the baseline conditions, and therefore, no further experiment with pollutants was performed. With other bacterial strains, the impact of light on viability will have to be reinvestigated.
It is well known in the literature that the viable but non-culturable condition (VBNC) is a survival strategy of many bacteria in the environment in response to adverse environmental conditions (e.g. solar radiation). There is a growing scientific interest in studying VBNC cells, including to understand novel public health implications of VBNC cells. In our simulated experiments, we are investigating alternative methods to detect bacterial viability and VBNC state, such as “live and dead staining” by fluorescence microscopy. This assay can be used to monitor the viability of bacterial populations as a function of cell membrane integrity using different fluorescent dyes.
Further experiments with “flow cytometry” could certainly be more beneficial not only to enumerate live and dead bacteria but also to evaluate the health and viability of bacterial cells by determining the activity of bacterial oxidases and reductases.
All code as well as raw and processed data can be provided by the corresponding author upon request.
The supplement related to this article is available online at: https://doi.org/10.5194/amt-16-5479-2023-supplement.
EAE, EG, FM, and VV, performed the measurements in chamber. EAE and EG studied and characterized the bioaerosol and, with VV, the Quantom Tx. MB and SD developed the acquisition set-up and wrote the Igor PRO code to treat the WIBS data. TI and VV set-up the solar simulator. FP supported the development of the ChAMBRe structure. FM analysed the data. EAE, MB, EG, TI, DM, FM, PP, and VV wrote the paper.
The contact author has declared that none of the authors has any competing interests.
Publisher's note: Copernicus Publications remains neutral with regard to jurisdictional claims made in the text, published maps, institutional affiliations, or any other geographical representation in this paper. While Copernicus Publications makes every effort to include appropriate place names, the final responsibility lies with the authors.
We are indebted to the personnel of the mechanical workshop of the INFN division of Genoa for the continuous support in the development of the ChAMBRe structure.
This research has been supported by EUROCHAMP2020 (H2020: Infrastructure Activity; grant no. 730997), PON PER-ACTRIS-IT (MURIT PON; project no. PIR_00015; “Per ACTRIS IT”), Blue-Lab 60 Net (FESR – Fondo Europeo Di Sviluppo Regionale Azione POR, Regione Liguria, Italy), ATMO-ACCESS (H2020 Infrastructure Activity; grant no. 101008004), and IR0000032–ITINERIS, Italian Integrated Environmental Research Infrastructures System (D.D. n. 130/2022 - CUP B53C22002150006) funded by the EU (Next Generation EU PNRR, Mission 4 “Education and Research”, Component 2 “From research to business”, Investment 3.1, “Fund for the realisation of an integrated system of research and innovation infrastructures”)
This paper was edited by Daniela Famulari and reviewed by Pierre Amato and one anonymous referee.
Akin, E., Pelen, N. N., Tiryaki, I. U., and Yalcin, F.: Parameter identification for gompertz and logistic dynamic equations, PLoS ONE, 15, e0230582, https://doi.org/10.1371/journal.pone.0230582, 2020.
Amato, P., Demeer, F., Melaouhi, A., Fontanella, S., Martin-Biesse, A.-S., Sancelme, M., Laj, P., and Delort, A.-M.: A fate for organic acids, formaldehyde and methanol in cloud water: their biotransformation by micro-organisms, Atmos. Chem. Phys., 7, 4159–4169, https://doi.org/10.5194/acp-7-4159-2007, 2007.
Amato, P., Joly, M., Schaupp, C., Attard, E., Möhler, O., Morris, C. E., Brunet, Y., and Delort, A.-M.: Survival and ice nucleation activity of bacteria as aerosols in a cloud simulation chamber, Atmos. Chem. Phys., 15, 6455–6465, https://doi.org/10.5194/acp-15-6455-2015, 2015.
Amato, P., Mathonat, F., Nuñez Lopez, L., Péguilhan, R., Bourhane, Z., Rossi, F., Vyskocil, J., Joly, M., and Ervens, B.: The aeromicrobiome: the selective and dynamic outer-layer of the Earth's microbiome, Front. Microbiol., 14, 1186847, https://doi.org/10.3389/fmicb.2023.1186847, 2023.
Annadurai, G., Rajesh Babu, S., and Srinivasamoorthy, V. R.: Development of mathematical models (Logistic, Gompertz and Richards models) describing the growth pattern of Pseudomonas putida (NICM 2174), Bioprocess Eng., 23, 607–612, https://doi.org/10.1007/s004490000209, 2000.
Ariya, P. A. and Amyot, M.: New Directions: The role of bioaerosols in atmospheric chemistry and physics, Atmos. Environ., 38, 1231–1232, https://doi.org/10.1016/j.atmosenv.2003.12.006, 2004.
Bauer, H., Giebl, H., Hitzenberger, R., Kasper-Giebl, A., Reischl, G., Zibuschka, F., and Puxbaum, H.: Airborne bacteria as cloud condensation nuclei, J. Geophys. Res., 108, 4658, https://doi.org/10.1029/2003JD003545, 2003.
Benbough, J. E.: Death Mechanisms in Airborne Escherichia coli, J. Gen. Microbiol., 47, 325–333, https://doi.org/10.1099/00221287-47-3-325, 1967.
Bolashikov, Z. D. and Melikov, A. K.: Methods for air cleaning and protection of building occupants from airborne pathogens, Build. Environ., 44, 1378–1385, https://doi.org/10.1016/j.buildenv.2008.09.001, 2009.
Brotto, P., Repetto, B., Formenti, P., Pangui, E., Livet, A., Bousserrhine, N., Martini, I., Varnier, O., Doussin, J. F., and Prati, P.: Use of an atmospheric simulation chamber for bioaerosol investigation: a feasibility study, Aerobiologia, 31, 445–455, https://doi.org/10.1007/s10453-015-9378-2, 2015.
Bundke, U., Reimann, B., Nillius, B., Jaenicke, R., and Bingemer, H.: Development of a Bioaerosol single particle detector (BIO IN) for the Fast Ice Nucleus CHamber FINCH, Atmos. Meas. Tech., 3, 263–271, https://doi.org/10.5194/amt-3-263-2010, 2010.
Burrows, S. M., Butler, T., Jöckel, P., Tost, H., Kerkweg, A., Pöschl, U., and Lawrence, M. G.: Bacteria in the global atmosphere – Part 2: Modeling of emissions and transport between different ecosystems, Atmos. Chem. Phys., 9, 9281–9297, https://doi.org/10.5194/acp-9-9281-2009, 2009.
Chou, C., Stetzer, O., Weingartner, E., Jurányi, Z., Kanji, Z. A., and Lohmann, U.: Ice nuclei properties within a Saharan dust event at the Jungfraujoch in the Swiss Alps, Atmos. Chem. Phys., 11, 4725–4738, https://doi.org/10.5194/acp-11-4725-2011, 2011.
CID: Commission Implementing Decision (EU) 2023/900: “Setting up the Aerosol, Clouds and Trace Gases Research Infrastructure (ACTRIS ERIC)”, Official Journal of the European Union, L115/15, 3 May 2023.
Cox, C. S.: The Survival of Escherichia coli sprayed into Air and into Nitrogen from Distilled Water and from Solutions of Protecting Agents, as a Function of Relative Humidity, J. Gen. Microbiol., 43, 383–399, https://doi.org/10.1099/00221287-43-3-383, 1966.
Danelli, S. G., Brunoldi, M., Massabò, D., Parodi, F., Vernocchi, V., and Prati, P.: Comparative characterization of the performance of bio-aerosol nebulizers in connection with atmospheric simulation chambers, Atmos. Meas. Tech., 14, 4461–4470, https://doi.org/10.5194/amt-14-4461-2021, 2021.
Deguillaume, L., Leriche, M., Amato, P., Ariya, P. A., Delort, A.-M., Pöschl, U., Chaumerliac, N., Bauer, H., Flossmann, A. I., and Morris, C. E.: Microbiology and atmospheric processes: chemical interactions of primary biological aerosols, Biogeosciences, 5, 1073–1084, https://doi.org/10.5194/bg-5-1073-2008, 2008.
Delort, A. M., Vaïtilingom, M., Amato, P., Sancelme, M., Parazols, M., Mailhot, G., Laj, P., and Deguillaume, L.: A short overview of the microbial population in clouds: Potential roles in atmospheric chemistry and nucleation processes, Atmos. Res., 98, 249–260, https://doi.org/10.1016/j.atmosres.2010.07.004, 2010.
Després, V. R., Huffman, J. A., Burrows, S. M., Hoose, C., Safatov, A. S., Buryak, G., Fröhlich-Nowoisky, J., Elbert, W., Andreae, M. O., Pöschl, U., and Jaenicke, R.: Primary biological aerosol particles in the atmosphere: a review, Tellus B, 64, 15598, https://doi.org/10.3402/tellusb.v64i0.15598, 2012.
Dunklin, E. W. and Puck, T. T.: The lethal effect of relative humidity on airborne bacteria, J. Exp. Med., 87, 87–101, https://doi.org/10.1084/jem.87.2.87, 1948.
Ehrlich, R., Miller, S., and Walker, R. L.: Relationship Between Atmospheric Temperature and Survival of Airborne Bacteria, Appl. Microbiol., 19, 245–249, 1970.
Ervens, B. and Amato, P.: The global impact of bacterial processes on carbon mass, Atmos. Chem. Phys., 20, 1777–1794, https://doi.org/10.5194/acp-20-1777-2020, 2020.
Fang, F. C.: Perspectives series: host/pathogen interactions. Mechanisms of nitric oxide-related antimicrobial activity, J. Clin. Invest., 99, 2818–2825, https://doi.org/10.1172/JCI119473, 1997.
Fankhauser, A. M., Antonio, D. D., Krell, A. M., Alston, S. J., Banta, S., and and McNeill, V. F.: Constraining the impact of bacteria on the aqueous atmospheric chemistry of small organic compounds, ACS Earth Space Chem., 3, 1485–1491, https://doi.org/10.1021/acsearthspacechem.9b00054, 2019.
Fröhlich-Nowoisky, J., Kampf, C. J., Weber, B., Huffman, J. A., Pöhlker, C., Andreae, M. O., Lang-Yona, N., Burrows, S. M., Gunthe, S. S., Elbert, W., Su, H., Hoor, P., Thines, E., Hoffmann, T., Després, V. R., and Pöschl, U.: Bioaerosols in the Earth system: Climate, health, and ecosystem interactions, Atmos. Res., 182, 346–376, https://doi.org/10.1016/j.atmosres.2016.07.018, 2016.
Giuliani, G., Ricevuti, G., Galoforo, A., and Franzini, M.: Microbiological aspects of ozone: bactericidal activity and antibiotic/antimicrobial resistance in bacterial strains treated with ozone, Ozone Therapy, 3, 7971, https://doi.org/10.4081/ozone.2018.7971, 2018.
Gong, J., Qi, J., E, B., Yin, Y., and Gao, D.: Concentration, viability and size distribution of bacteria in atmospheric bioaerosols under different types of pollution, Environ. Pollut., 257, 113485, https://doi.org/10.1016/j.envpol.2019.113485, 2020.
Jaber, S., Lallement, A., Sancelme, M., Leremboure, M., Mailhot, G., Ervens, B., and Delort, A.-M.: Biodegradation of phenol and catechol in cloud water: comparison to chemical oxidation in the atmospheric multiphase system, Atmos. Chem. Phys., 20, 4987–4997, https://doi.org/10.5194/acp-20-4987-2020, 2020.
Jaber, S., Joly, M., Brissy, M., Leremboure, M., Khaled, A., Ervens, B., and Delort, A.-M.: Biotic and abiotic transformation of amino acids in cloud water: experimental studies and atmospheric implications, Biogeosciences, 18, 1067–1080, https://doi.org/10.5194/bg-18-1067-2021, 2021.
Jang, J., Hur, H.-G., Sadowsky, M. J., Byappanahalli, M. N., Yan, T., and Ishii, S.: Environmental Escherichia coli: ecology and public health implications – a review, J. Appl. Microbiol., 123, 570–581, https://doi.org/10.1111/jam.13468, 2017.
Janvier, X., Alexandre, S., Boukerb, A. M., Souak, D., Maillot, O., Barreau, M., Gouriou, F., Grillon, C., Feuilloley, M. G. J., and Groboillot, A.: Deleterious Effects of an Air Pollutant (NO2) on a Selection of Commensal Skin Bacterial Strains, Potential Contributor to Dysbiosis?, Front. Microbiol., 11, 591839, https://doi.org/10.3389/fmicb.2020.591839, 2020.
Jozić, S., Morovié, M., Šolić, M., KrstuIović, N., and Ordulj, M.: Effect of solar radiation, temperature and salinity on the survival of two different strains of Escherichia coli, Fresenius Environ. Bull., 23, 1852–1859, 2014.
Khaled, A., Zhang, M., Amato, P., Delort, A.-M., and Ervens, B.: Biodegradation by bacteria in clouds: an underestimated sink for some organics in the atmospheric multiphase system, Atmos. Chem. Phys., 21, 3123–3141, https://doi.org/10.5194/acp-21-3123-2021, 2021.
Krumins, V., Mainelis, G., Kerkhof, L. J., and Fennell, D. E.: Substrate-Dependent rRNA Production in an Airborne Bacterium, Environ. Sci. Technol. Lett., 1, 376–381, https://doi.org/10.1021/ez500245y, 2014.
Kim, J. G., Yousef, A. E., and Dave, S.: Application of Ozone for Enhancing the Microbiological Safety and Quality of Foods: A Review, J. Food Protect., 62, 1071–1087, https://doi.org/10.4315/0362-028X-62.9.1071, 1999.
Kosaka, H., Yamamoto, H., Oda, Y., and Uozumi, M: Induction of SOS functions by nitrogen dioxide in Escherichia coli with different DNA-repair capacities, Mutat. Res.-Fund. Mol. M., 162, 1–5, https://doi.org/10.1016/0027-5107(86)90065-5, 1986.
Lee, B. U. and Kim, S. S.: Sampling E. coli and B. subtilis bacteria bioaerosols by a new type of impactor with a cooled impaction plate, J. Aerosol Sci., 34, 1097–1100, 2003.
Lee, B. U., Kim, S. H., and Kim, S. S.: Hygroscopic growth of E. coli and B. subtilis bioaerosols, J. Aerosol Sci., 33, 1721–1723, https://doi.org/10.1016/S0021-8502(02)00114-3, 2002.
Lieberherr, G., Auderset, K., Calpini, B., Clot, B., Crouzy, B., Gysel-Beer, M., Konzelmann, T., Manzano, J., Mihajlovic, A., Moallemi, A., O'Connor, D., Sikoparija, B., Sauvageat, E., Tummon, F., and Vasilatou, K.: Assessment of real-time bioaerosol particle counters using reference chamber experiments, Atmos. Meas. Tech., 14, 7693–7706, https://doi.org/10.5194/amt-14-7693-2021, 2021.
Lighthart, B., Shaffer, B. T., Marthi, B., and Ganio, L. M.: Artificial wind-gust liberation of microbial bioaerosols previously deposited on plants, Aerobiologia, 9, 189–196, https://doi.org/10.1007/BF02066261, 1993.
Mancinelli, R. L. and McKay, C. P.: Effects of Nitric Oxide and Nitrogen Dioxide on Bacterial Growth, Appl. Environ. Microb., 4, 198–202, https://doi.org/10.1128/aem.46.1.198-202.1983, 1983.
Martiny, J. B. H., Bohannan, B. J. M., Brown, J. H., Colwell, R. K., Fuhrman, J. A., Green, J. L., Horner-Devine, M. C., Kane, M., Krumins, J. A., Kuske, C. R., Morin, P. J., Naeem, S., Øvreås, L., Reysenbach, A.-L., Smith, V. H., and Staley, J. T.: Microbial biogeography: putting microorganisms on the map, Nat. Rev. Microbiol., 4, 102–112, https://doi.org/10.1038/nrmicro1341, 2006.
Massabò, D., Danelli, S. G., Brotto, P., Comite, A., Costa, C., Di Cesare, A., Doussin, J. F., Ferraro, F., Formenti, P., Gatta, E., Negretti, L., Oliva, M., Parodi, F., Vezzulli, L., and Prati, P.: ChAMBRe: a new atmospheric simulation chamber for aerosol modelling and bio-aerosol research, Atmos. Meas. Tech., 11, 5885–5900, https://doi.org/10.5194/amt-11-5885-2018, 2018.
Mayol, E., Jiménez, M. A., Herndl, G. J., Duarte, C. M., and Arrieta, J. M.: Resolving the abundance and air-sea fluxes of airborne microorganisms in the North Atlantic Ocean, Front. Microbiol., 5, 557, https://doi.org/10.3389/fmicb.2014.00557, 2014.
Möhler, O., DeMott, P. J., Vali, G., and Levin, Z.: Microbiology and atmospheric processes: the role of biological particles in cloud physics, Biogeosciences, 4, 1059–1071, https://doi.org/10.5194/bg-4-1059-2007, 2007.
Monks, P. S., Granier, C., Fuzzi, S., Stohl, A., Williams, M. L., Akimoto, H., Amann, M., Baklanov, A., Baltensperger, U., Bey, I., Blake, N., Blake, R. S., Carslaw, K., Cooper, O. R., Dentener, F., Fowler, D., Fragkou, E., Frost, G. J., Generoso, S., Ginoux, P., Grewe, V., Guenther, A., Hansson, H. C., Henne, S., Hjorth, J., Hofzumahaus, A., Huntrieser, H., Isaksen, I. S. A., Jenkin, M. E., Kaiser, J., Kanakidou, M., Klimont, Z., Kulmala, M., Laj, P., Lawrence, M. G., Lee, J. D., Liousse, C., Maione, M., McFiggans, G., Metzger, A., Mieville, A., Moussiopoulos, N., Orlando, J. J., O'Dowd, C. D., Palmer, P. I., Parrish, D. D., Petzold, A., Platt, U., Pöschl, U., Prévôt, A. S. H., Reeves, C. E., Reimann, S., Rudich, Y., Sellegri, K., Steinbrecher, R., Simpson, D., ten Brink, H., Theloke, J., van der Werf, G. R., Vautard, R., Vestreng, V., Vlachokostas, Ch., and von Glasow, R.: Atmospheric composition change – global and regional air quality, Atmos. Environ., 43, 5268–5350, https://doi.org/10.1016/j.atmosenv.2009.08.021, 2009.
Moosmüller, H., Chakrabarty, R. K., and Arnott, W. P.: Aerosol light absorption and its measurement: A review, J. Quant. Spectrosc. Ra., 110, 844–878, https://doi.org/10.1016/j.jqsrt.2009.02.035, 2009.
Morris, C. E., Georgakopoulos, D. G., and Sands, D. C.: Ice nucleation active bacteria and their potential role in precipitation, J. Phys. IV France, 121, 87–103, https://doi.org/10.1051/jp4:2004121004, 2004.
Morris, C. E., Leyronas, C., and Nicot, P. C.: Movement of Bioaerosols in the Atmosphere and the Consequences for Climate and Microbial Evolution, in: Aerosol Science: Technology and Applications, edited by: Colbeck, I. and Lazaridis, M., John Wiley & Sons, Ltd, Chichester, UK, 393–415, https://doi.org/10.1002/9781118682555.ch16, 2014.
Pöschl, U.: Atmospheric Aerosols: Composition, Transformation, Climate and Health Effects, Angew. Chem. Int. Edit., 44, 7520–7540, https://doi.org/10.1002/anie.200501122, 2005.
Pöschl, U. and Shiraiwa, M.: Multiphase Chemistry at the Atmosphere–Biosphere Interface Influencing Climate and Public Health in the Anthropocene, Chem. Rev., 115, 4440–4475, https://doi.org/10.1021/cr500487s, 2015.
Privett, B. J., Broadnax, A. D., Bauman, S. J., Riccio, D. A., and Schoenfisch, M. H.: Examination of bacterial resistance to exogenous nitric oxide, Nitric Oxide, 26, 169–173, https://doi.org/10.1016/j.niox.2012.02.002, 2012.
Romano, S., Di Salvo, M., Rispoli, G., Alifano, P., Perrone, M. R., and Talà, A.: Airborne bacteria in the Central Mediterranean: Structure and role of meteorology and air mass transport, Sci. Total Environ., 697, 134020, https://doi.org/10.1016/j.scitotenv.2020.138899, 2019.
Seinfeld, J. H. and Pandis, S. N.: Atmospheric Chemistry and Physics: From Air Pollution to Climate Change, Wiley-Interscience, ISBN 10: 0471178152, ISBN 13: 9780471178156, 1998.
Shaffer, B. T. and Lighthart, B.: Survey of Culturable Airborne Bacteria at Four Diverse Locations in Oregon: Urban, Rural, Forest, and Coastal, Microb. Ecol., 34, 167–177, https://doi.org/10.1007/s002489900046, 1997.
Son, M. S. and Taylor, R. K.: Growth and Maintenance of Escherichia coli Laboratory Strains, Current Protocols, 1, e20, https://doi.org/10.1002/cpz1.20, 2021.
Sun, J. and Ariya, P.: Atmospheric organic and bio-aerosols as cloud condensation nuclei (CCN): A review, Atmos. Environ., 40, 795–820, https://doi.org/10.1016/j.atmosenv.2005.05.052, 2006.
Thanomsub, B., Anupunpisit, V., Chanphetch, S., Watcharachaipong, T., Poonkhum, R., and Srisukonth, C.: Effects of ozone treatment on cell growth and ultrastructural changes in bacteria, J. Gen. Appl. Microbiol., 48, 193–199, https://doi.org/10.2323/jgam.48.193, 2002.
Tiwari, A., Kauppinen, A., Räsänen, P., Salonen, J., Wessels, L., Juntunen, J., Miettinen, I. T., and Pitkänen, T.: Effects of temperature and light exposure on the decay characteristics of fecal indicators, norovirus, and Legionella in mesocosms simulating subarctic river water, Sci. Total Environ., 859, 160340, https://doi.org/10.1016/j.scitotenv.2022.160340, 2022.
Vernocchi, V., Brunoldi, M., Danelli, S. G., Parodi, F., Prati, P., and Massabò, D.: Characterization of soot produced by the mini inverted soot generator with an atmospheric simulation chamber, Atmos. Meas. Tech., 15, 2159–2175, https://doi.org/10.5194/amt-15-2159-2022, 2022.
Wachenheim, D. E., Patterson, J. A., and Ladish, M. R.: Analysis of the logistic function model: derivation and applications specific to batch cultured microorganisms, Bioresource Technol., 86, 157–164, https://doi.org/10.1016/S0960-8524(02)00149-9, 2003.
Wagstrom, K. M., Pandis, S. N., Yarwood, G., Wilson, G. M., and Morris, R. E.: Development and application of a computationally efficient particulate matter apportionment algorithm in a three-dimensional chemical transport model, Atmos. Environ., 42, 5650–5659, https://doi.org/10.1016/j.atmosenv.2008.03.012, 2008.
Wang, C.-C., Fang, G.-C., and Lee, L.: Bioaerosols study in central Taiwan during summer season, Toxicol. Ind. Health, 23, 133–139, https://doi.org/10.1177/0748233707078741, 2007.
Whitman, R. L., Nevers, M. B., Korinek, G. C., and Byappanahalli, M. N.: Solar and temporal effects on Escherichia coli concentration at a Lake Michigan swimming beach, Appl. Environ. Microb., 70, 4276–4285, https://doi.org/10.1128/AEM.70.7.4276-4285.2004, 2004.
Wright, D. N., Bailey, G. D., and Goldberg, L. J.: Effect of Temperature on Survival of Airborne Mycoplasma pneumoniae, J Bacteriol, 99, 491–495, 1969.