the Creative Commons Attribution 4.0 License.
the Creative Commons Attribution 4.0 License.
 | 21 Nov 2023
Atmospheric N2O and CH4 total columns retrieved from low-resolution Fourier transform infrared (FTIR) spectra (Bruker VERTEX 70) in the mid-infrared region
Minqiang Zhou
Bavo Langerock
Mahesh Kumar Sha
Christian Hermans
Nicolas Kumps
Rigel Kivi
Pauli Heikkinen
Christof Petri
Justus Notholt
Huilin Chen
Martine De Mazière
Nitrous oxide (N2O) and methane (CH4) are two important greenhouse gases in the atmosphere. In 2019, mid-infrared (MIR) solar absorption spectra were recorded by a Bruker VERTEX 70 spectrometer and a Bruker IFS 125HR spectrometer at Sodankylä, Finland, at spectral resolutions of 0.2 and 0.005 cm−1, respectively. The N2O and the CH4 retrievals from high-resolution MIR spectra have been well investigated within the Network for the Detection of Atmospheric Composition Change (NDACC) but not for MIR spectra gathered with instruments operating at low spectral resolution. In this study, N2O and CH4 retrieval strategies and retrieval uncertainties from the VERTEX 70 MIR low-resolution spectra are discussed and presented. The accuracy and precision of the VERTEX 70 N2O and CH4 retrievals are assessed by comparing them with the coincident 125HR retrievals and AirCore measurements. The relative differences between the N2O total columns retrieved from 125HR and VERTEX 70 spectra are −0.3 ± 0.7 (1σ) % with a correlation coefficient (R) of 0.93. Regarding the CH4 total column, we first used the same retrieval microwindows for 125HR and VERTEX 70 spectra, but there is an underestimation in the VERTEX 70 retrievals, especially in summer. The relative differences between the CH4 total columns retrieved from the 125HR and VERTEX 70 spectra are (1σ) % with a R value of 0.77. To improve the VERTEX 70 CH4 retrievals, we propose alternative retrieval microwindows. The relative differences between the CH4 total columns retrieved from the 125HR and VERTEX 70 spectra in these new windows become 0.0±0.8 (1σ) %, along with an increase in the R value to 0.87. The coincident AirCore measurements confirm that the VERTEX 70 CH4 retrievals using the latter window choice are better, with relative mean differences between the VERTEX 70 CH4 retrievals and AirCore measurements of −1.9 % for the standard NDACC microwindows and of 0.13 % for the alternative microwindows. This study provides insight into the N2O and CH4 retrievals from the low-resolution (0.2 cm−1) MIR spectra observed with a VERTEX 70 spectrometer, and it demonstrates the suitability of this kind of instrument for contributing to satellite validation, model verification, and other scientific campaigns with the advantage of its transportability and lower cost compared to standard NDACC-type Fourier-transform infrared (FTIR) instruments.
- Article
(4969 KB) - Full-text XML
- BibTeX
- EndNote


Nitrous oxide (N2O) and methane (CH4) are two important atmospheric greenhouse gases, which contribute greatly to global climate change (IPCC, 2013). The global mean N2O concentration has been increasing continuously since the pre-industrial era and reached up to 332.87 ppb in 2020, as observed by National Oceanic and Atmospheric Administration (NOAA; https://gml.noaa.gov/ccgg/trends_n2o/, last access: 1 January 2023) surface measurements (Hall et al., 2007). Moreover, the NOAA surface measurements show that the global annual growth rate of N2O has been increasing recently. The N2O annual growth rate has been about 1.0 ppb yr−1 during the last 5 years (2015–2020) compared to that of 0.9 ppb yr−1 from 2010 to 2015. The increasing N2O concentration also contributes to stratospheric ozone depletion (Park et al., 2012). Tian et al. (2020) used both bottom-up and top-down methods to estimate the atmospheric N2O emissions between 1980 and 2016 and highlighted that it is urgent to mitigate human-induced N2O emissions, as their measured growth rate exceeds some of the highest projected emission scenarios. According to the surface in situ measurements (WMO, 2020), the global mean CH4 concentration kept increasing from 1984 to 1999 and remained stable between 1999 and 2006, but it started to increase again after 2007. It is not fully understood what caused the variation in CH4 during the last few decades, as the sources of atmospheric CH4 are diverse and variable (Saunois et al., 2020). Many factors can affect the atmospheric CH4 concentration, such as natural wetland and fossil fuel emissions (Kirschke et al., 2013), tropical biogenic sources (Schwietzke et al., 2016), biomass burning emissions (Worden et al., 2017), and the atmospheric OH level (Turner et al., 2017).
Mid-infrared (MIR) solar absorption spectra (2400–3000 cm−1) recorded by ground-based Fourier-transform infrared (FTIR) spectrometers are used to retrieve the N2O and CH4 vertical profiles and total columns within the Network for the Detection of Atmospheric Composition Change Infrared Working Group (NDACC-IRWG) (De Mazière et al., 2018). The NDACC N2O and CH4 measurements are widely used for understanding their temporal variations (Angelbratt et al., 2011; Zhou et al., 2018), for satellite validation (Barret et al., 2021; Sha et al., 2021; Zhou et al., 2023), and for model comparison and verification (Bader et al., 2017; Zhou et al., 2019b). The NDACC-IRWG sites are typically operated with either a Bomem DA8, a Bruker IFS 120 M/HR, or a Bruker IFS 125 M/HR instrument to record the MIR spectra with a high spectral resolution of 0.003–0.005 cm−1. The lower-spectral-resolution spectrometers, such as the Bruker VERTEX 70, Bruker EM27/SUN, and Bruker IRcube with a spectral resolution of 0.16–0.5 cm−1, have advantages such as lower cost, higher temporal resolution, and transportability.
Within the Fiducial Reference Measurements for Ground-Based Infrared Greenhouse Gas Observations (FRM4GHG) project, carbon dioxide (CO2), methane (CH4), and carbon monoxide (CO) total columns retrieved from the near-infrared (NIR) solar spectra recorded by these lower-spectral-resolution spectrometers are proved to be comparable with the data products retrieved from the Total Carbon Column Observing Network (TCCON) high-spectral-resolution measurements (Sha et al., 2020). Inter-comparisons between low- and high-resolution MIR spectra and retrievals have been investigated in the past as well; e.g., Taylor et al. (2008) used two FTIR instruments with differing spectral resolutions (0.004 cm−1 for the Bomem DA8 and 0.2 cm−1 for the ABB Analytical DA5) over a period of 4 months in the summer of 2005, but they pointed out that relatively poor correlations were observed for the N2O and CH4 column observed with high and low spectral resolutions, with the median differences being −0.36 % for N2O and 3.7 % for CH4.
The Bruker VERTEX 70 instrument is capable of measuring NIR and MIR spectra quasi-simultaneously. However, to our knowledge, the retrievals of N2O and CH4 from the MIR spectra observed by the Bruker VERTEX 70 instrument have not yet been investigated. To better understand the N2O and CH4 retrievals from the MIR spectra observed by lower-spectral-resolution measurements, we operated the Bruker VERTEX 70 and the Bruker 125HR next to each other at Sodankylä in 2019 (March–November). The spectral resolutions of the Bruker VERTEX 70 and the Bruker IFS 125HR are 0.2 and 0.005 cm−1, respectively. Further details of the instrumental setup are provided in Sect. 2. The retrieval is performed with the SFIT4 v0.9.4.4 code, updated from SFIT4 (Pougatchev et al., 1995; Hase et al., 2004), which is commonly used in the NDACC-IRWG community. The retrieval strategies and retrieval uncertainties of N2O and CH4 are discussed in Sect. 3. In Sect. 4, the N2O and CH4 retrievals derived from the VERTEX 70 are compared to those from the 125HR measurements following NDACC-recommended retrieval strategies. In addition, the CH4 retrievals are also compared to the coincident AirCore profiles. Finally, conclusions are drawn in Sect. 5.
The FTIR measurements used in this study are carried out at the Sodankylä facility of the Finnish Meteorological Institute (FMI), north Finland (67.4∘ N, 26.6∘ E; 180 ). The FMI site is located in a boreal forest region and is about 6 km south of the downtown. Due to the high latitude, the site is located in the polar night in boreal winter, and the atmospheric components above the site are affected by polar-vortex conditions in winter and spring (Kivi et al., 2007; Ostler et al., 2014).
A Bruker IFS 125HR FTIR instrument has been operated at Sodankylä since 2009. The 125HR initially only recorded NIR spectra (4000–15 000 cm−1) with indium gallium arsenide (InGaAs) and silicon (Si) detectors and has been affiliated to the TCCON network (Kivi and Heikkinen, 2016; Wunch et al., 2015). In 2011, the 125HR started measuring MIR spectra (2200–3500 cm−1) using an indium antimonide (InSb) detector as well, with a spectral resolution of 0.005 cm−1. The NIR and MIR spectra at Sodankylä have been observed quasi-simultaneously since then. Profiles of N2O and CH4 have been successfully retrieved from the MIR spectra using the SFIT4 code following the NDACC-IRWG guide, and the products are supporting the Copernicus Atmosphere Monitoring Service (https://cams27.aeronomie.be/, last access: 1 January 2023) and the TROPOMI satellite validation (Sha et al., 2021).
Table 1The main characteristics of the spectra observed by the VERTEX 70 and 125HR at Sodankylä used in this study.
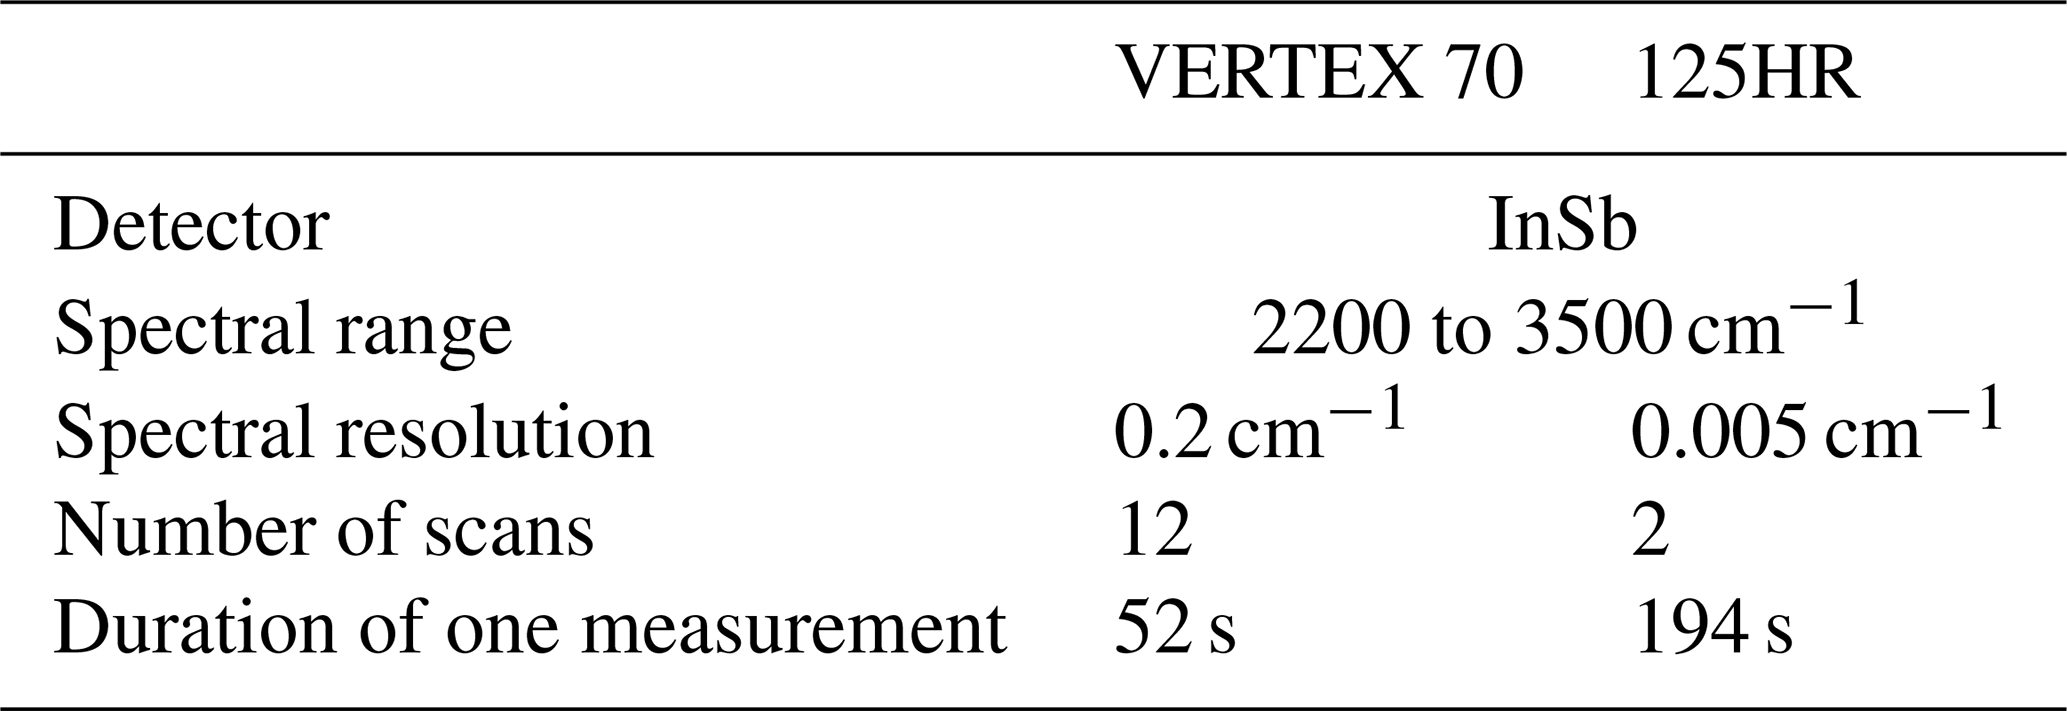
During the ESA-funded FRM4GHG project, several portable FTIR instruments (Bruker EM27/SUN, Bruker IRcube, and Bruker VERTEX 70) were operated between 2017 and 2019 close to the Bruker 125HR instrument at Sodankylä. A schematic diagram of the VERTEX 70 measurement is shown in Fig. 1. In 2017 and 2018, only NIR spectra were recorded by the VERTEX 70 because the main objective of this campaign was to study the performance of CO2, CH4, and CO retrieved from the NIR spectra observed by the portable FTIR instruments, and we compared them to the TCCON NIR measurements (Sha et al., 2020). However, it is also important to understand the performance of N2O and CH4 retrievals derived from the MIR spectra observed by the portable FTIR and to compare them with the NDACC MIR measurements performed at a high spectral resolution. Therefore, at the beginning of 2019, we added an InSb detector to the VERTEX 70 instrument and performed 1 year of measurements to record MIR spectra. Note that the implementation of MIR measurements for the IRcube and EM27/SUN needs extra effects and has not been done yet. Table 1 lists the main characteristics of the MIR spectra observed by the VERTEX 70 and 125HR instruments; more information about the instruments and the FRM4GHG Sodankylä campaign can be found in Sha et al. (2021).
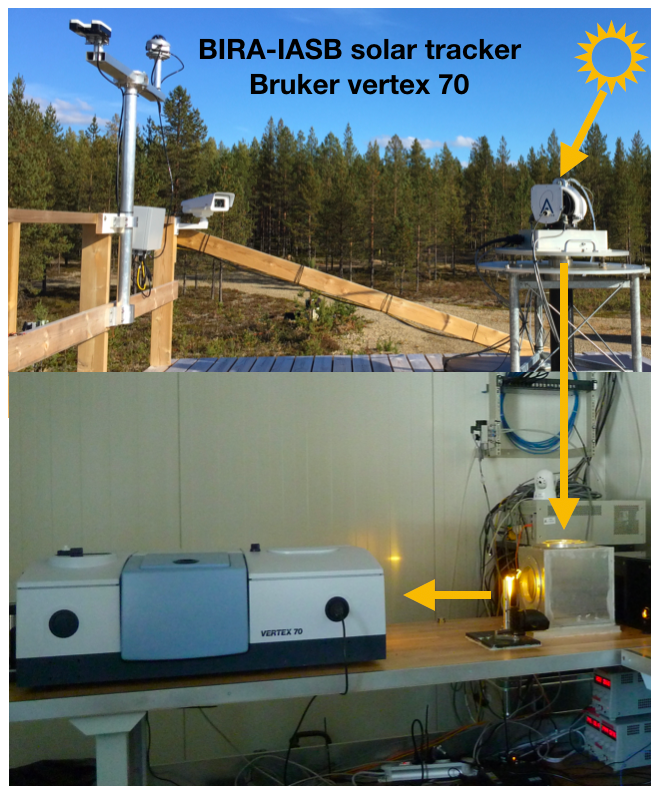
Figure 1The Bruker VERTEX 70 system operated at Sodankylä during the FRM4GHG campaign, including the weather station and the solar tracker. The orange arrows shows the light path coming from the sun till it enters the FTIR instrument. BIRA-IASB is the Royal Belgian Institute for Space Aeronomy.
N2O and CH4 partial column profiles are derived from the width and shape of their absorption lines in the solar spectra (y) observed by the ground-based FTIR instrument, modeled as
where F is the forward atmospheric radiation transfer model, x is the state vector (the retrieved parameters), b is the forward-model parameters but not retrieved, and ε represents the measurement noise and forward-model uncertainty. In this study, the SFIT4 algorithm is used to simulate the observed spectrum and to minimize the residual between the simulated and the observed spectra by looking for the optimal state vector using an inverse model (optimal estimation model or Tikhonov regularization). The inverse problem is solved using the Levenberg–Marquardt Gauss–Newton iteration in the SFIT4 algorithm, and the retrieved state vector can be related to the actual state of the atmosphere by
where xa and xt are the a priori and the true state vectors, respectively. A is the averaging kernel matrix (AVK), representing the sensitivity of the retrieved vertical profile of the target species to the true profile. ε is the retrieval uncertainty. The trace of the A is the degrees of freedom (DOFs), indicating the number of independent pieces of information (Rodgers, 2000). Following Eq. (2), the retrieved total column can be written as
where TCa and TCr are the a priori and retrieved total columns, respectively. PCa and PCt are the a priori and true partial columns, respectively. Acol is the column averaging kernel (CAVK), representing the sensitivity of the retrieved total column to the true partial column.
3.1 Retrieval strategy
3.1.1 N2O
The N2O retrieval strategy for the high-spectral-resolution measurements from the 125HR is well harmonized within the NDACC-IRWG community (Zhou et al., 2019b). Four microwindows (2481.3–2482.6, 2526.4–2528.2, 2537.85–2538.8, 2540.1–2540.7 cm−1) including the N2O absorption lines are used to retrieve the N2O vertical profile (Fig. 2), and the HITRAN2008 spectroscopy is adopted (Rothman et al., 2009). To reduce the effect from the interfering species, HDO, CO2, and CH4 columns are retrieved simultaneously together with the N2O vertical profile. The a priori profiles of the target species and CO2 and CH4 interfering species are created from the Whole Atmosphere Community Climate Model (WACCM) v4 monthly means between 1980 and 2020. Due to its high spatial–temporal variability, the temperature vertical profile and the a priori profile of HDO is derived from the National Centers for Environmental Prediction (NCEP) 6-hourly reanalysis data with interpolation to the measurement time. In this study, the same four windows are used for VERTEX 70 and 125HR N2O retrievals. The signal-to-noise ratio (SNR) of the spectra is calculated from the observed spectra, and then the measurement uncertainty Sϵ is calculated as for the diagonal values and 0 for the off-diagonal values. The regularization matrix R for the N2O retrieval is created with the Tikhonov L1 method (Tikhonov, 1963), and the same regulation matrix is applied to VERTEX 70 and 125HR retrievals. To determine the regularization strength α, we tune it so that the retrieved DOF is similar to the DOF obtained when retrieving N2O with the optimal estimation method (Steck, 2002) and where the a priori covariance matrix (Sa) is derived from the WACCM monthly means. The DOF of N2O profile retrievals from 125HR spectra is about 2.5 derived by the optimal estimation method (OEM), so we set the α to 4000 to obtain a similar DOF with the Tikhonov method.
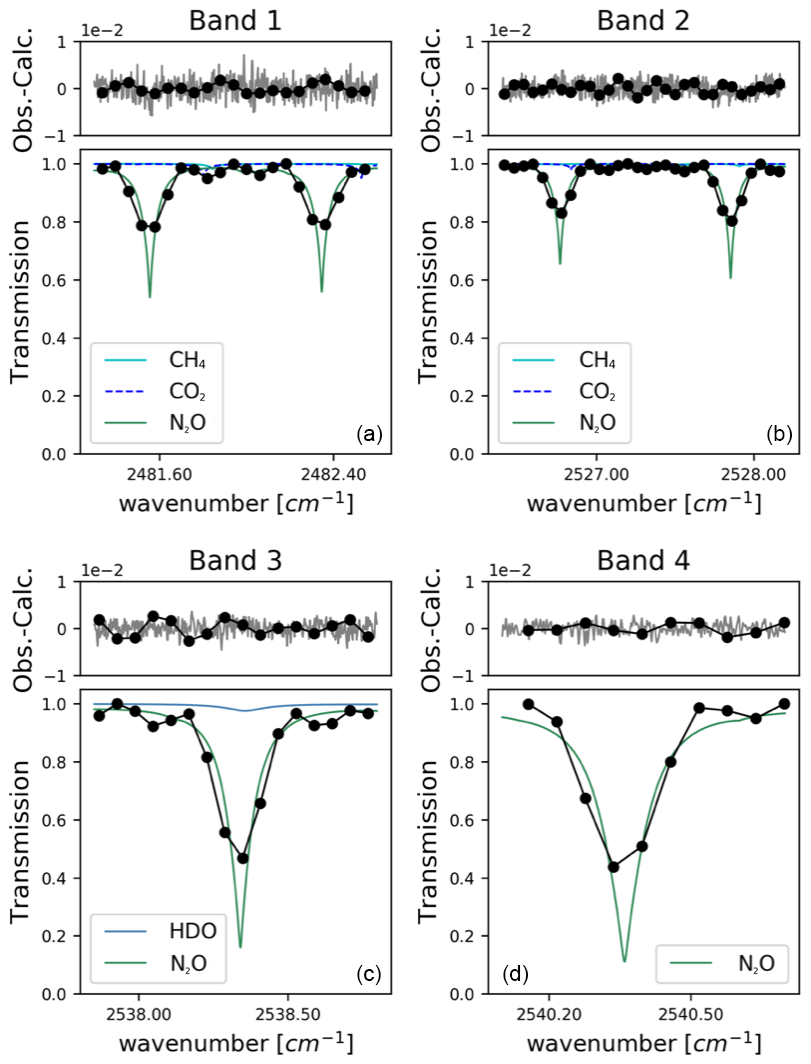
Figure 2The four microwindows used for N2O retrieval. In each band, the transmittances from atmospheric species, together with the VERTEX 70 typical spectra, are shown in the upper part of each panel, and the typical residuals for the VERTEX 70 (black) and 125HR (grey) spectra at Sodankylä are presented in the lower part of each panel.
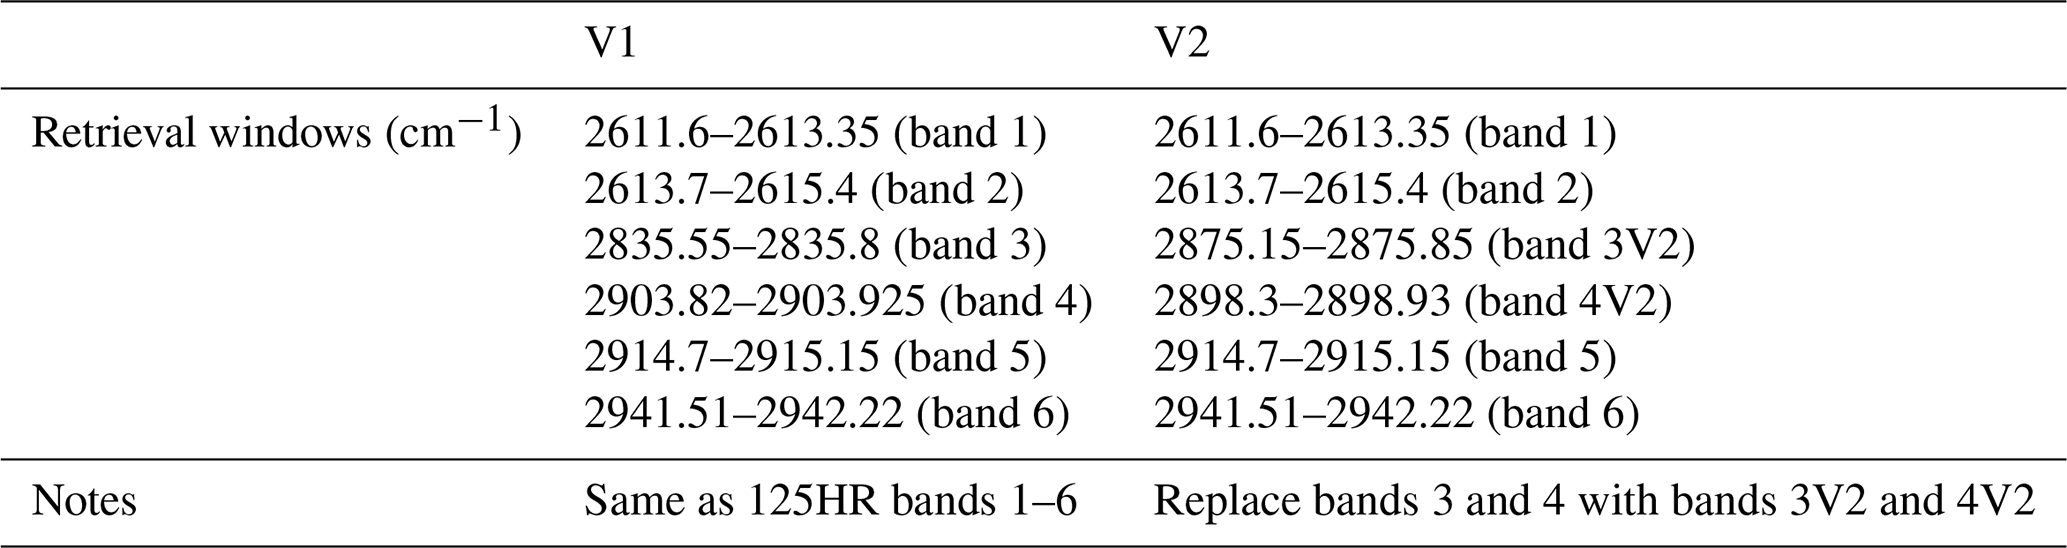
Table 2The retrieval windows of the two VERTEX 70 CH4 retrieval strategies.
3.1.2 CH4
First, we apply the standard NDACC retrieval strategy for CH4 from 125HR spectra. Six microwindows (2611.6–2613.35, 2613.7–2615.4, 2835.55–2835.8, 2903.82–2903.925, 2914.7–2915.15, and 2941.51–2942.22 cm−1; bands 1–6) are used (Sepúlveda et al., 2014; Zhou et al., 2018), and the columns of H2O, HDO, and CO2 are retrieved together with the CH4 profile. Figure 3 shows the typical transmittances from the atmospheric species for CH4 retrievals at Sodankylä, together with the fitting residuals for VERTEX 70 and 125HR spectra in each window. However, there are only four and two samples in wavenumber space in bands 3 and 4, respectively, for the VERTEX 70 low-spectral-resolution spectra, and the signals in bands 3 and 4 for the VERTEX 70 low-spectral-resolution spectra are 2–3 times weaker as compared to the high-spectral-resolution spectra. Therefore, we also apply two other relatively broad windows, including stronger CH4 absorption lines, to provide more information. As a result, we apply two window settings for VERTEX 70 CH4 retrieval (Table 2): (i) band 1–band 6 (same as the 125HR), named V1, and (ii) replacing band 3 and band 4 with band 3V2 (2875.15–2875.85 cm−1) and band 4V2 (2898.3–2898.93 cm−1), named V2. Regarding the spectroscopic data, several line lists have been tested for CH4 retrievals within the NDACC-IRWG community. Currently, ATM19 and HITRAN01 are two recommended line lists (Chesnokova et al., 2020). In this study, we take the atmospheric line list ATM19 for CH4 retrieval. The fitting residuals in the 3V2 and 4V2 bands are comparable to other windows (bands 1, 2, 5, 6) for VERTEX 70. In fact, we have tested many microwindows in addition to bands 3V2 and 4V2, but these two bands offer us the best result (close to 125HR retrievals; see Sect. 4.2). Note that the observed spectrum with a high spectral resolution (125HR) is not well fitted in band 3V2. Therefore, we do not apply the V2 retrieval strategy for 125HR spectra. As with the N2O retrieval, the a priori profiles of CH4 and CO2 are created as the average WACCM monthly mean between 1980 and 2020, and the a priori profiles of H2O and HDO are derived from the NCEP 6-hourly reanalysis data with interpolation to the measurement time. The SNR of the spectra is calculated from the observations. The regularization matrix R for the CH4 retrieval is also created with the Tikhonov L1 method, with α=10 000, leading to a mean DOF of 2.1 for 125HR retrievals.
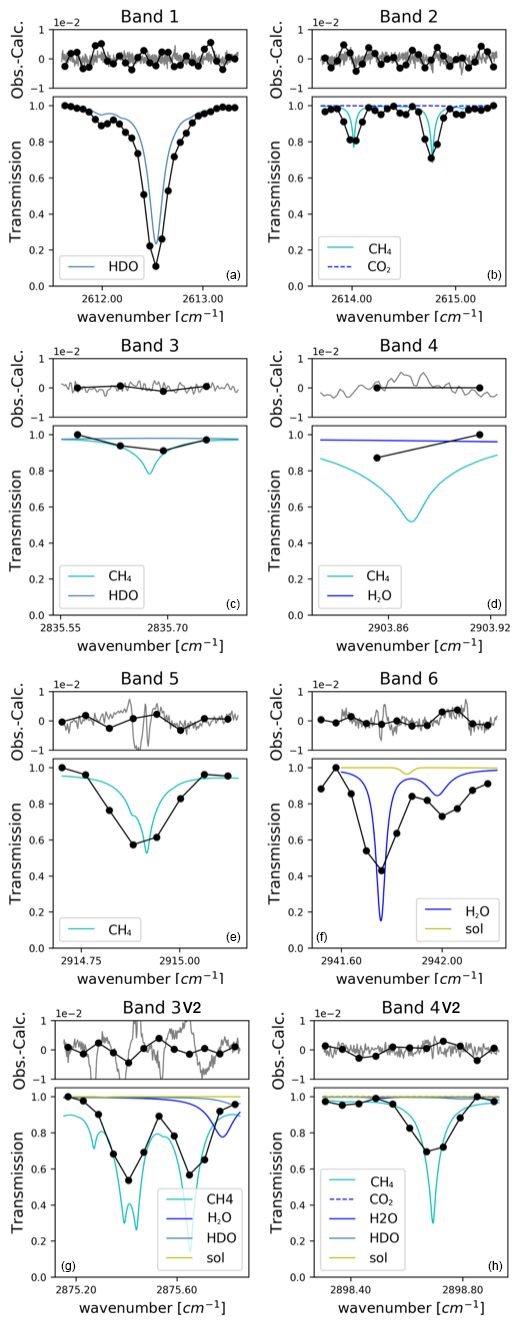
Figure 3The six microwindows (bands 1–6) used for 125HR and VERTEX 70 V1 CH4 retrieval, together with the other two microwindows used for VERTEX 70 V2 CH4 retrieval. In each band, the transmittances from atmospheric species, together with the VERTEX 70 typical spectra, are shown in the lower part of each panel, and the typical residuals for the VERTEX 70 (black) and 125HR (grey) spectra at Sodankylä are presented in the upper part of each panel.
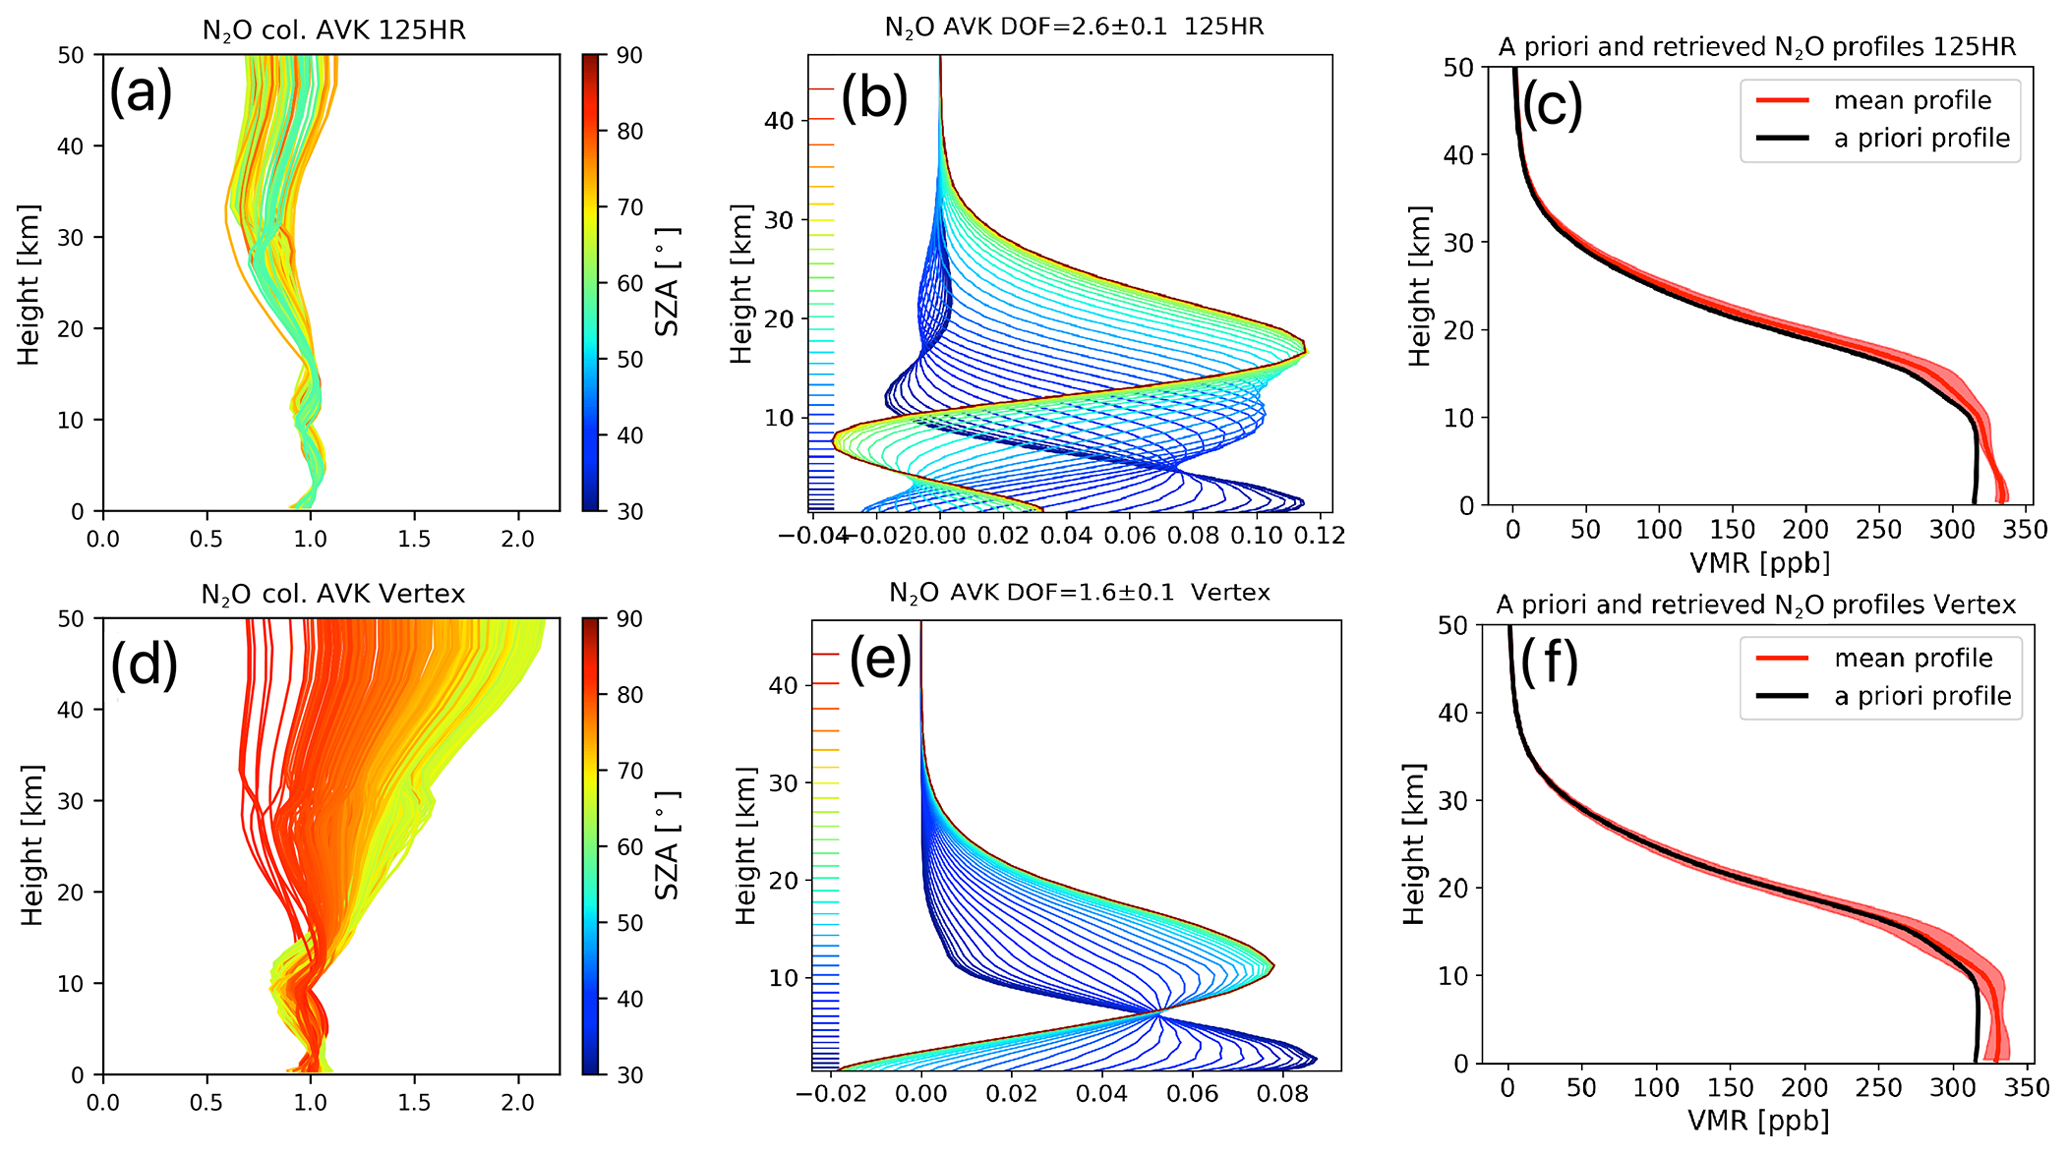
Figure 4N2O retrievals: the column averaging kernels' variation with solar zenith angles (in units of ), the typical averaging kernel matrix (in units of , where “vmr” denotes the volume mixing ratio), and the a priori profile (black) and retrieved profiles (mean: solid red line; 1σ: red-shaded area) between the surface and 50 km for 125HR retrievals (a–c) and for VERTEX 70 retrievals (d–f).
3.2 Retrieval vertical sensitivity
3.2.1 N2O
Figure 4 shows both the CAVK and the AVK together with the a priori and retrieved N2O vertical profiles for 125HR and VERTEX 70. The mean and standard deviation (SD) of the DOF are 2.6 ± 0.1 for 125 HR and 1.6 ± 0.1 for VERTEX 70. As expected, more vertical information is derived from the high-spectral-resolution spectra (125HR) as compared to the low-spectral-resolution spectra (VERTEX 70). The typical AVKs show that the retrieved N2O profile from the 125HR has a good sensitivity between the surface and 25 km, while the retrieved N2O profile from the VERTEX 70 is mainly sensitive to the vertical range between the surface and 20 km. The CAVK of 125HR is close to 1 in the whole vertical range and hardly varies with solar zenith angle (SZA). The CAVK of VERTEX 70 is close to 1 in the whole vertical range at a large SZA (> 70∘), but it starts deviating from 1 above 20 km at a relatively small SZA. Since the partial column of N2O above 20 km makes up only about 1.5 % of the total column, such deviation in the CAVK of VERTEX 70 does not affect the retrieved N2O total column strongly, and the smoothing error of the N2O total column is very small (see Sect. 3.3). The retrieved N2O vertical profiles from the 125HR and VERTEX 70 are similar but not exactly the same. Due to the limited vertical information, we will focus on the partial columns or the total column instead of the vertical profile (see Sect. 4).
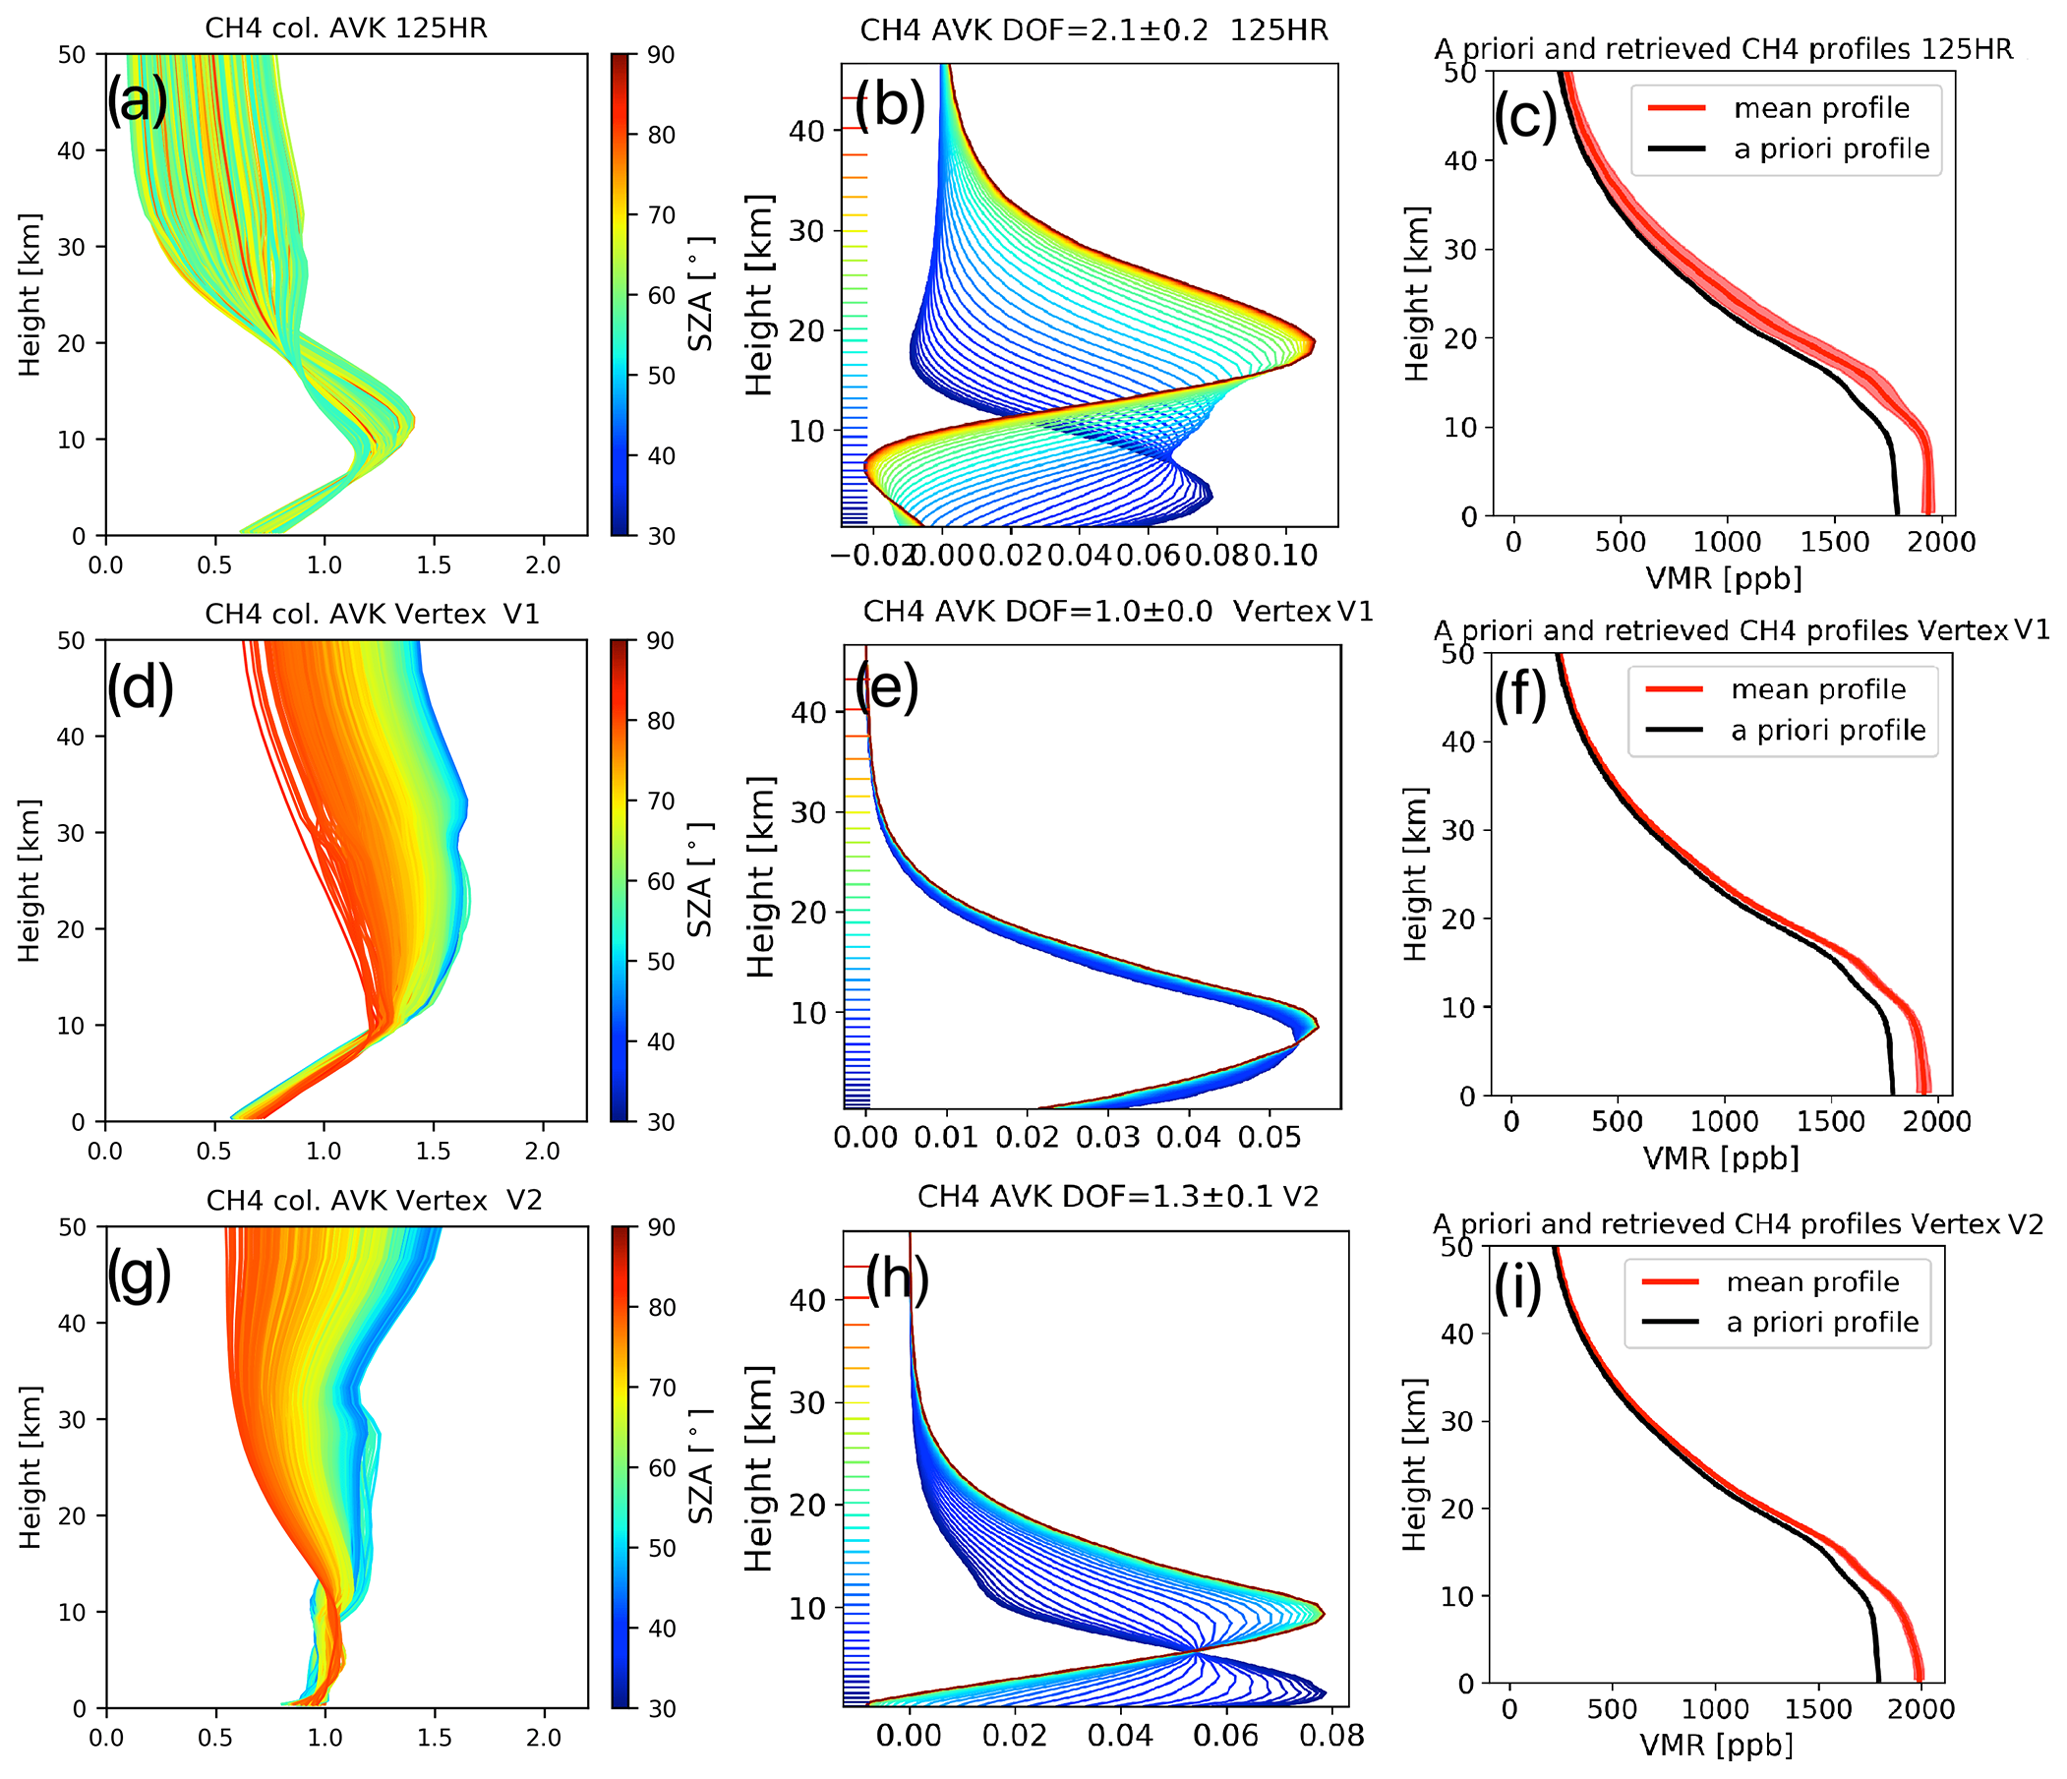
Figure 5CH4 retrievals: the column averaging kernels' variation with solar zenith angles (in units of ), the typical averaging kernel matrix (in units of ), and the a priori profile (black) and retrieved profiles (mean: solid red line; 1σ: red-shaded area) between the surface and 50 km for 125HR retrievals (a–c), for VERTEX 70 V1 (d–f), and for VERTEX 70 V2 (g–i) retrievals.
3.2.2 CH4
The CAVK, AVK, and retrieved profiles from the 125HR and VERTEX 70 (V1 and V2) are shown in Fig. 5. The vertical sensitivities of the retrieved CH4 total column from the 125HR and VERTEX 70 V1 are similar, since they use the same retrieval windows. There is no obvious SZA dependence in the CAVK for the 125HR CH4 retrievals. However, for both VERTEX 70 V1 and VERTEX 70 V2 retrievals, the CAVK varies with SZA, especially above 10 km. The mean DOF from 125HR CH4 retrievals is 2.1, which is about twice than that from the VERTEX 70 V1 retrievals (DOF ∼ 1.0). As for the N2O retrievals, more vertical information can be obtained with a higher spectral resolution. The CAVK of the VERTEX 70 V2 retrieval shows that the retrieved CH4 total column has better sensitivity in the lower troposphere as compared to the VERTEX 70 V1 retrieval, and the mean DOF is 1.3. The vertical information obtained in the VERTEX 70 V2 retrieval is higher than that in the VERTEX 70 V1 retrieval. Still, the DOFs indicate that we must focus on the CH4 total columns for both the VERTEX 70 V1 and the VERTEX 70 V2 retrievals.
3.3 Retrieval uncertainty
According to Rodgers (2000), the retrieval uncertainty of xr can be written as
where Gy is the contribution matrix, K is the Jacobian matrix, is the best estimate of the forward-model parameter, bt is the true forward- model parameter, and ϵnoise is the noise of the observed spectra. The items on the right side of Eq. (4) are the smoothing error (first), the model parameter error (second), and the measurement error (third).
Regarding the smoothing error, the systematic uncertainty of (xt−xa) for both N2O and CH4 is set to 5 %, and the random uncertainty of (xt−xa) is created from the covariance matrix from the WACCM monthly means between 1980 and 2020. The important model parameters are the spectroscopy, temperature, SZA, and zero-level shift (zshift). The systematic uncertainties of the N2O and CH4 line intensities are set to 3 %, and the systematic uncertainties of the spectroscopic temperature and pressure broadening parameters are set to 5 % (Rothman et al., 2009; Gordon et al., 2017). It is assumed that there is no random uncertainty associated with the spectroscopic parameters. The systematic and random uncertainties of the temperature profiles are evaluated by calculating the mean differences and SD, respectively, of ERA5 and NCEP temperature profiles in 2019. The systematic and random uncertainties of SZA are set to 0.1 % and 0.5 %, respectively. The systematic and random uncertainties of zshift are both set to 0.1 % (Zhou et al., 2016; García et al., 2021). We assume that the measurement noise has only a random uncertainty component and evaluate it as , with SNR the calculated signal-to-noise ratio of the spectra.
Table 3The relative uncertainties (%) of N2O total column retrievals from 125HR and VERTEX 70 spectra at Sodankylä. “–” indicates zero uncertainty contribution. See text for the interpretation of SD (± 1 h noon). The time zone throughout the text and figures where applicable is local time.
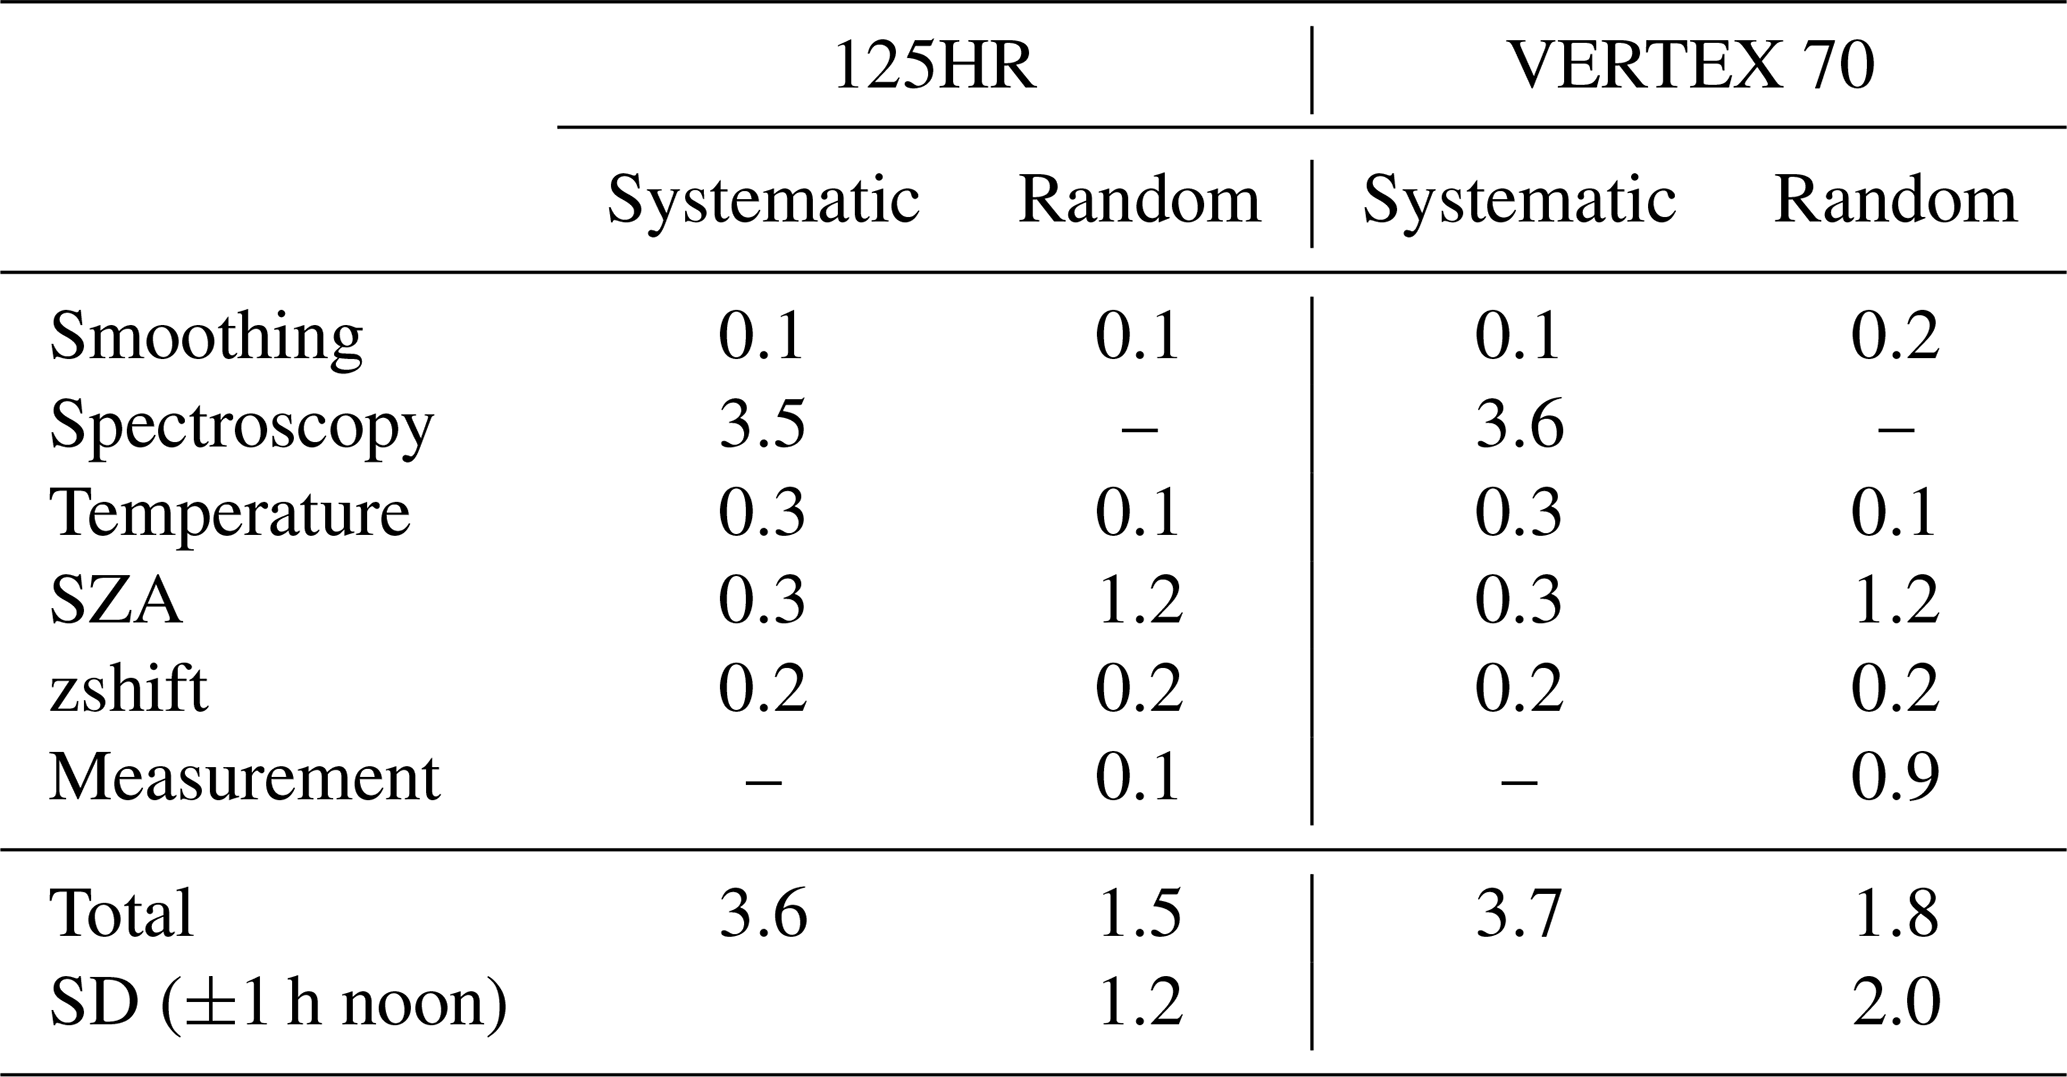
Table 4Same as Table 3 but for the relative uncertainties (%) of CH4 total columns from 125HR and VERTEX 70 V1 and V2 retrievals at Sodankylä.
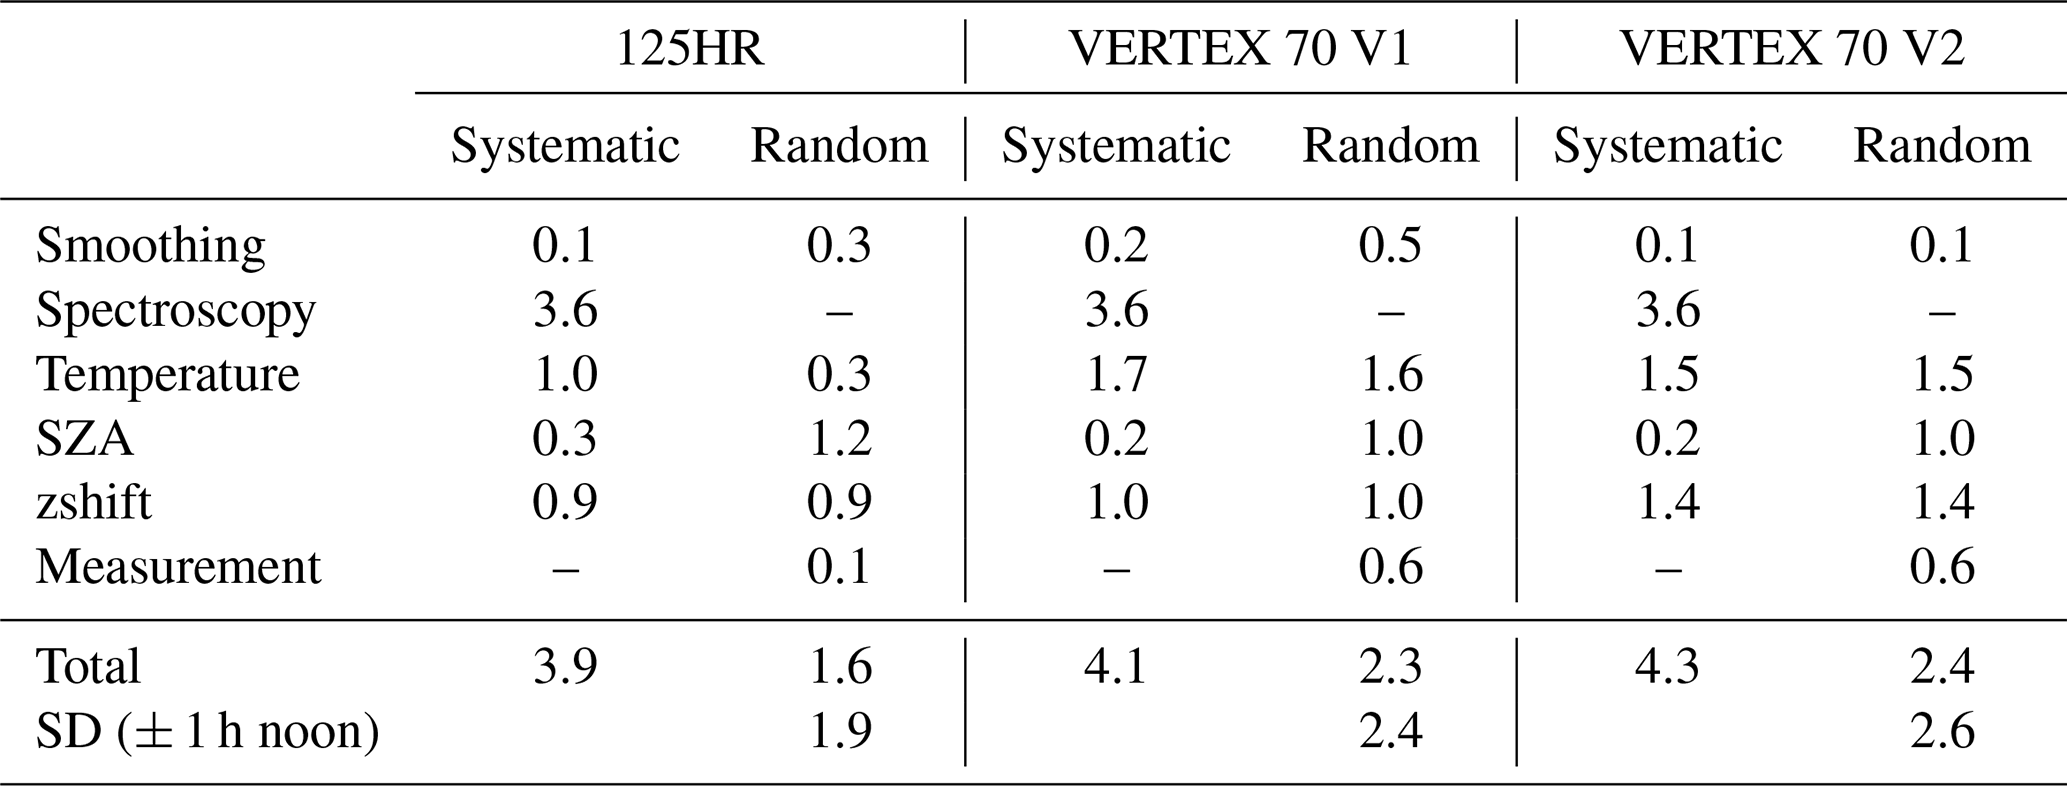
The systematic and random retrieval uncertainties of the retrieved N2O and CH4 columns retrieved from 125HR and VERTEX 70 spectra are then evaluated according to Eq. (4) with the above assumptions and are listed in Tables 3 and 4, respectively. The systematic and random retrieval uncertainties of the N2O total column are 3.6 % and 1.5 % for retrievals from 125HR spectra and 3.7 % and 1.8 % for retrievals from VERTEX 70 spectra. The systematic and random retrieval uncertainties of the CH4 total column are 3.9 % and 1.6 % for 125HR spectra retrievals, 4.1 % and 2.3 % for VERTEX 70 spectra V1 retrievals, and 4.3 % and 2.4 % for VERTEX 70 spectra V2 retrievals. For both N2O and CH4 retrievals, the dominant systematic uncertainties come from the spectroscopy. According to our estimations, the random uncertainties in N2O retrievals between 125HR and VERTEX 70 are dominated by the SZA and measurement error, while the random uncertainties in CH4 retrievals from 125HR and VERTEX 70 spectra are dominated by the SZA, temperature, zshift, and measurement error. To assess the estimated random uncertainty, we calculate the mean of all the standard deviations (SDs) of the retrieved N2O or CH4 total columns within ±1 h around noon (at least two available retrievals) on each measurement day. We find a good agreement with the estimated random uncertainties for both 125HR and VERTEX 70 retrievals, indicating that our estimated random uncertainties are reasonable. The estimated random uncertainties of retrievals from 125HR spectra are smaller than those from VERTEX 70 spectra for both N2O and CH4 retrievals, and this is confirmed by the SDs of the retrieved total columns.
4.1 N2O
4.1.1 Total column
The time series of all the individual N2O total columns retrieved from the 125HR and VERTEX 70 are shown in Fig. 6, together with the relative differences ((VERTEX − 125HR) 125HR × 100 %) between the coincident hourly means. The mean difference is −0.3 % (1σ = 0.7 %), which is within the retrieval uncertainties of 125HR and VERTEX 70 (Table 2). To reduce the impact of the vertical sensitivities from the 125HR and VERTEX 70, we smooth the retrieved N2O 125HR profile by the VERTEX 70 averaging kernel. The results with and without smoothing correction are very close to each other, with a relative difference of less than 0.1 %, because the smoothing error is very small. Low-N2O total columns in spring are observed by both 125HR and VERTEX 70 measurements. There is no clear seasonal variation in the relative differences. Figure 7 shows that the Pearson correlation coefficient (R) between the coincident daily means is 0.93. The correlation coefficient R between the H2O total columns and the relative differences is −0.02 and between the SZAs and the relative differences is 0.05, thus demonstrating that there are no water vapor or SZA dependences in the relative differences.
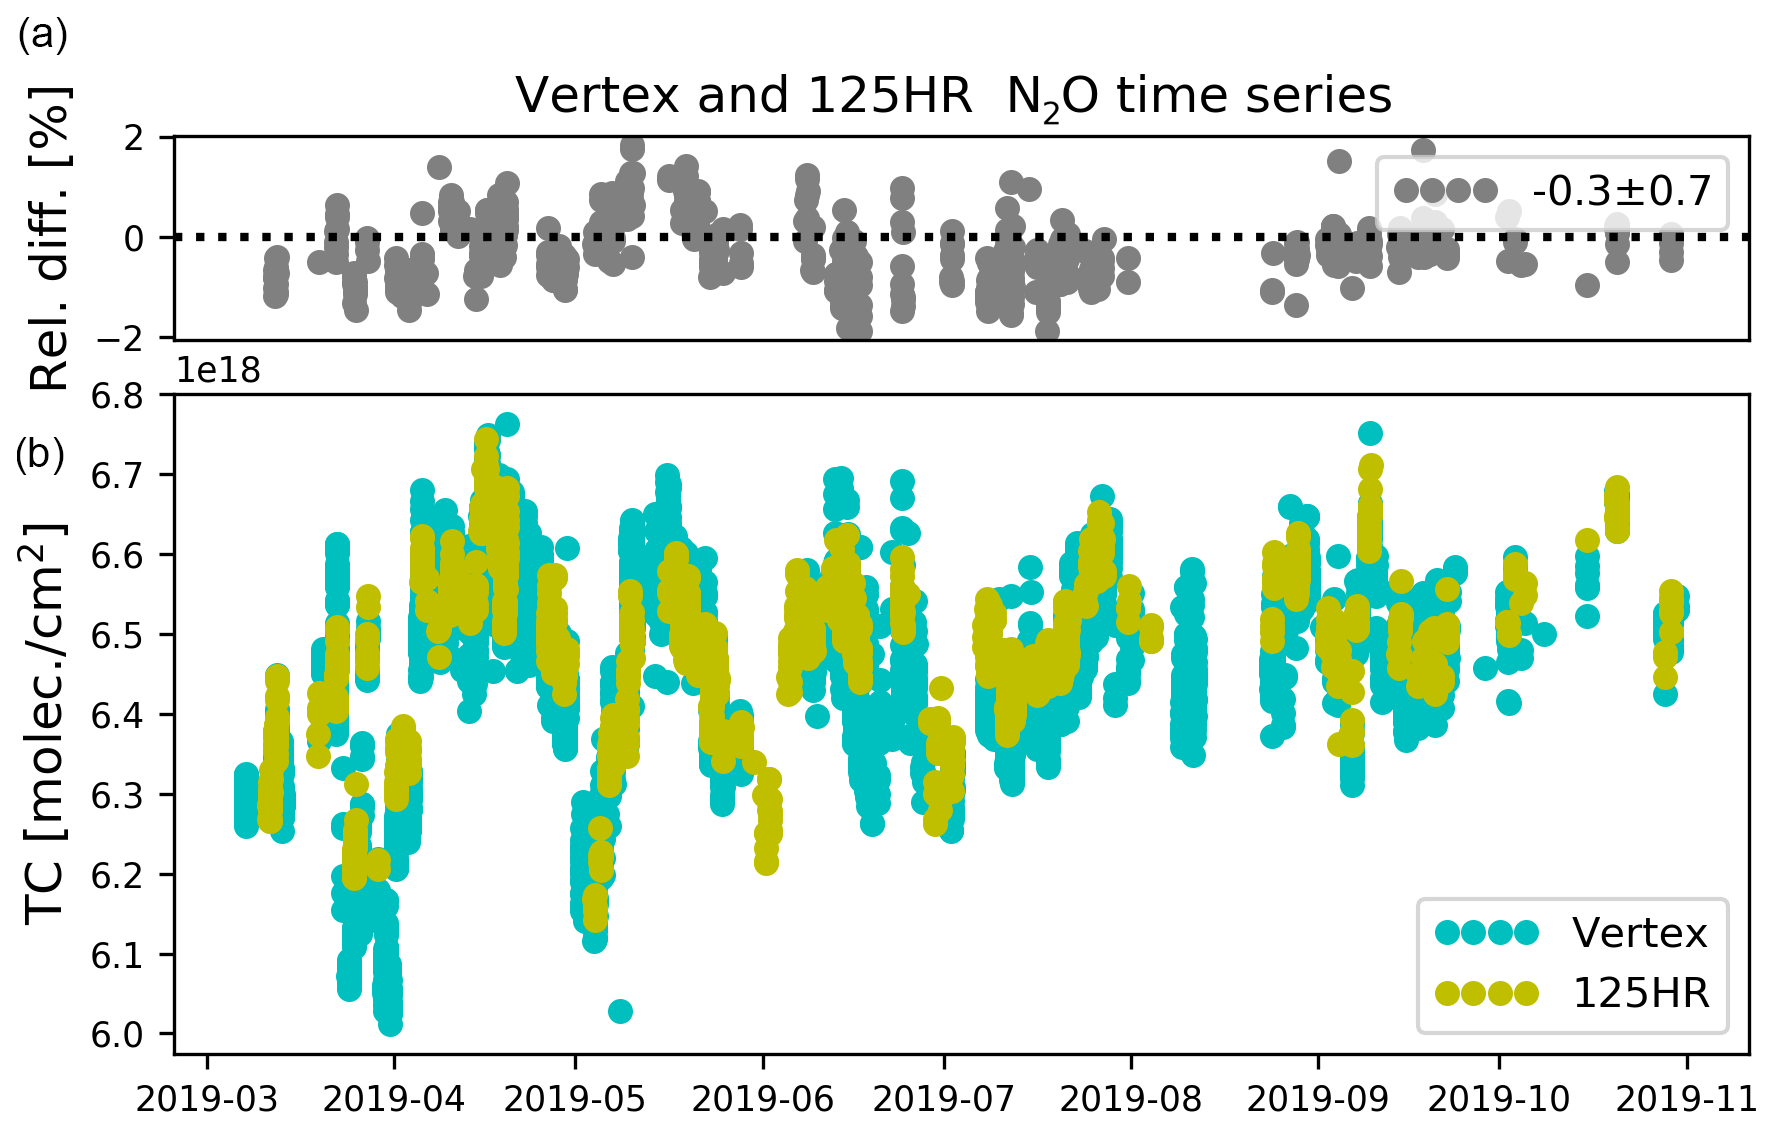
Figure 6The time series of the N2O total columns retrieved from the 125HR and VERTEX 70, together with the differences between their coincident hourly means. The time format here and in Figs. 8 and 9 is year-month.
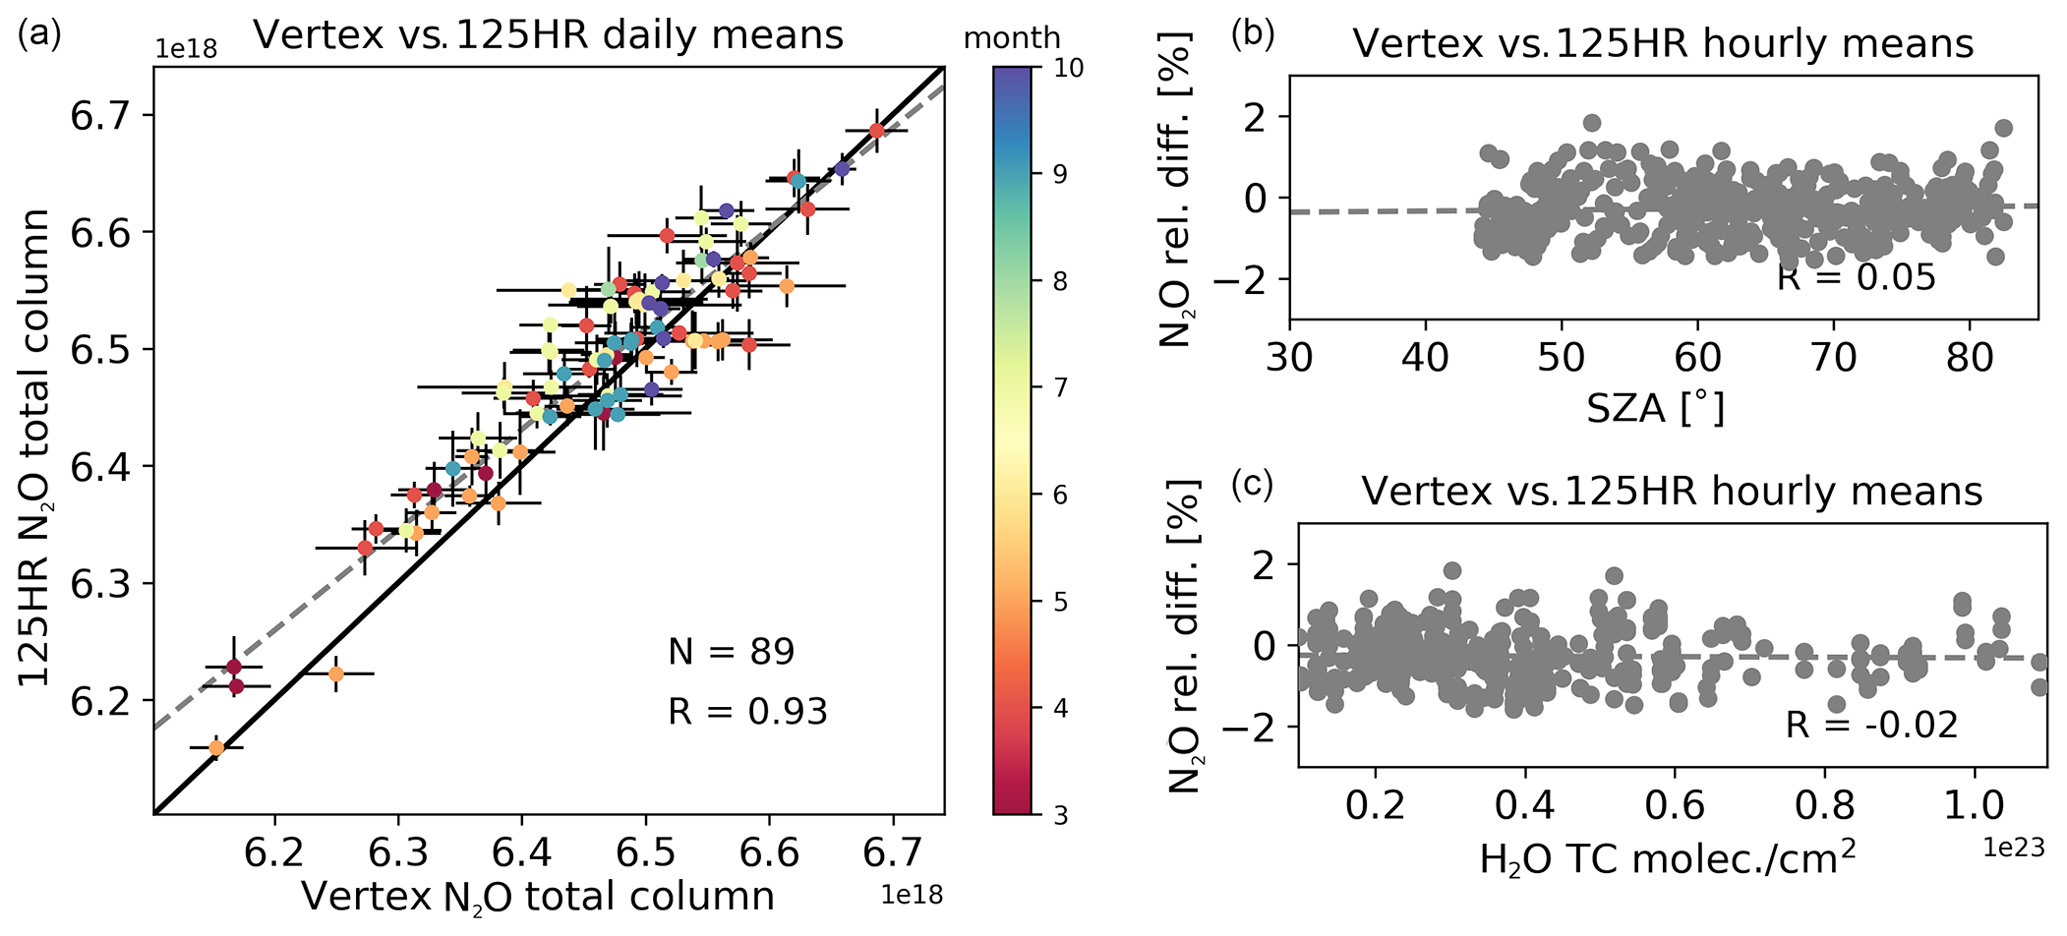
Figure 7(a) The correlation plot between the coincident 125HR- and VERTEX 70-retrieved N2O daily mean total columns, colored by the measurement month. The error bar represents the daily SD. (b, c) The variations in the hourly relative differences with the SZA and water vapor total column. R is the correlation coefficient, and N is the number of coincident days.
4.1.2 Partial columns
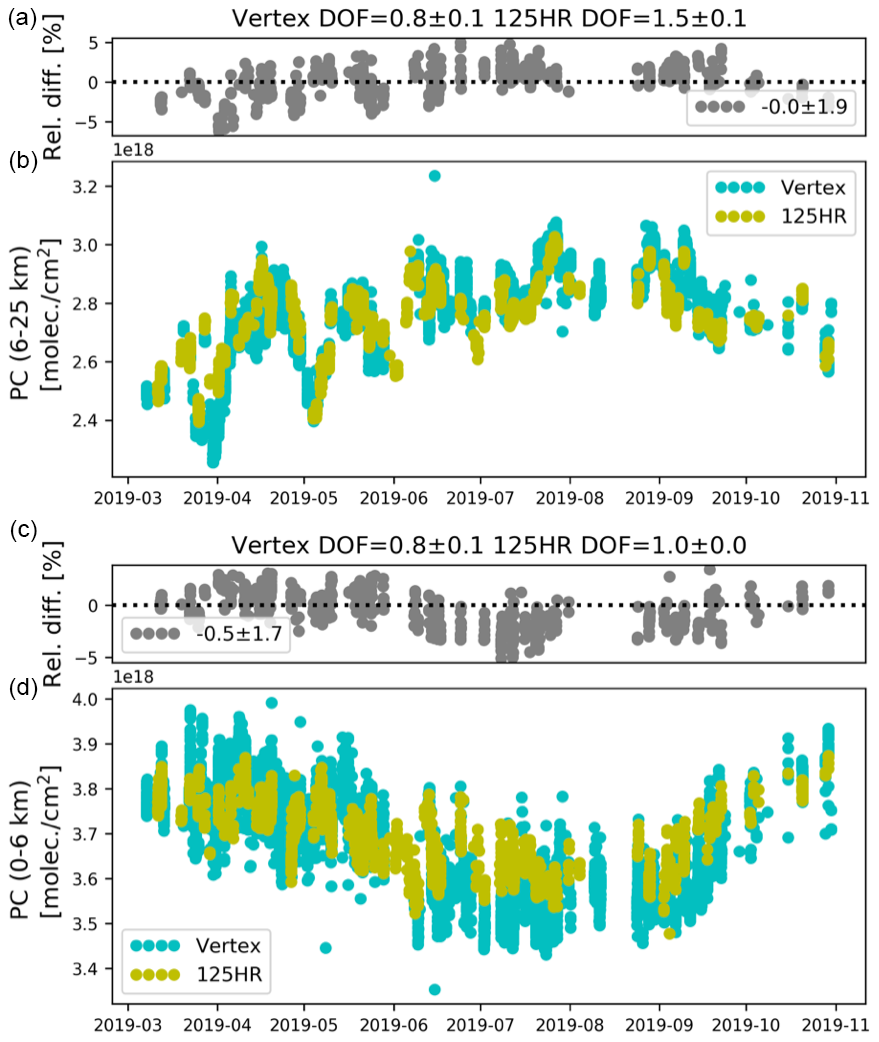
Apart from the total column, we also compare the 125HR and VERTEX 70 N2O retrievals in two partial columns (lower layer: 0–6 km; upper layer: 6–25 km). The two partial columns are selected as we can get a DOF of 0.8 in each layer for the VERTEX 70 N2O retrievals. The DOFs of the 125HR N2O are 1.0 and 1.5 for the lower and upper partial columns, respectively.
The correlation coefficients between the 125HR and VERTEX 70 coincident N2O partial column daily means are 0.86 and 0.94 for the lower and upper layers, respectively (not shown). The time series of the N2O partial columns retrieved from the 125HR and VERTEX 70, together with their relative differences, are shown in Fig. 8. Seasonal variations in N2O partial columns observed by 125HR and VERTEX 70 retrievals are consistent in both layers. The low N2O values in the upper layer due to the polar vortex in spring (Zhou et al., 2019b) are well captured by 125HR and VERTEX 70 retrievals. The mean (± SD) of the differences between the 125HR and VERTEX 70 is 0.0±1.9 % in the partial column between 6 and 25 km and % between the surface and 6 km. The mean differences in the partial columns are close to that in the total column. However, the SDs of the differences in the partial columns are larger than that in the total column. Moreover, it is found that there is a seasonal variation in the relative differences for both layers; e.g., the 125HR-retrieved N2O is larger/lower than the VERTEX 70-retrieved N2O in spring/summer between 6 and 25 km. As the seasonal variations in the relative differences in the two layers are opposed, they compensate for each other in the total column, for which there is almost no seasonal variation in the relative difference. Keep in mind that the DOFs of the two partial columns (0–6 km and 6–25 km) of N2O derived from the VERTEX 70 spectra are both 0.8, indicating that neither layer is truly independent. In summary, the partial columns (0–6 km and 6–25 km) of N2O can be derived from the VERTEX 70 spectra but with a larger uncertainty as compared to the 125HR retrievals.
4.2 CH4
4.2.1 Total column
Since the mean DOF of the VERTEX 70 CH4 retrievals is relatively small (1.0 for V1 and 1.3 for V2), we only look at the CH4 total columns retrieved from the 125HR and VERTEX 70 spectra. As for the previous comparisons, the 125HR CH4 profile is smoothed with the VERTEX 70 AVK to reduce the impact of the different vertical sensitivities of 125HR and VERTEX 70 retrievals. The time series of the retrieved CH4 total columns from the 125HR and VERTEX 70 V1 and V2 are shown in Fig. 9. The mean difference between the 125HR and VERTEX 70 V1 CH4 total columns is −1.3 ± 1.1 %. The VERTEX 70 V1 CH4 total column is much lower than the 125HR-retrieved CH4 in summer. The mean difference between the 125HR and VERTEX 70 V2 CH4 total columns is 0.0 ± 0.8 %.
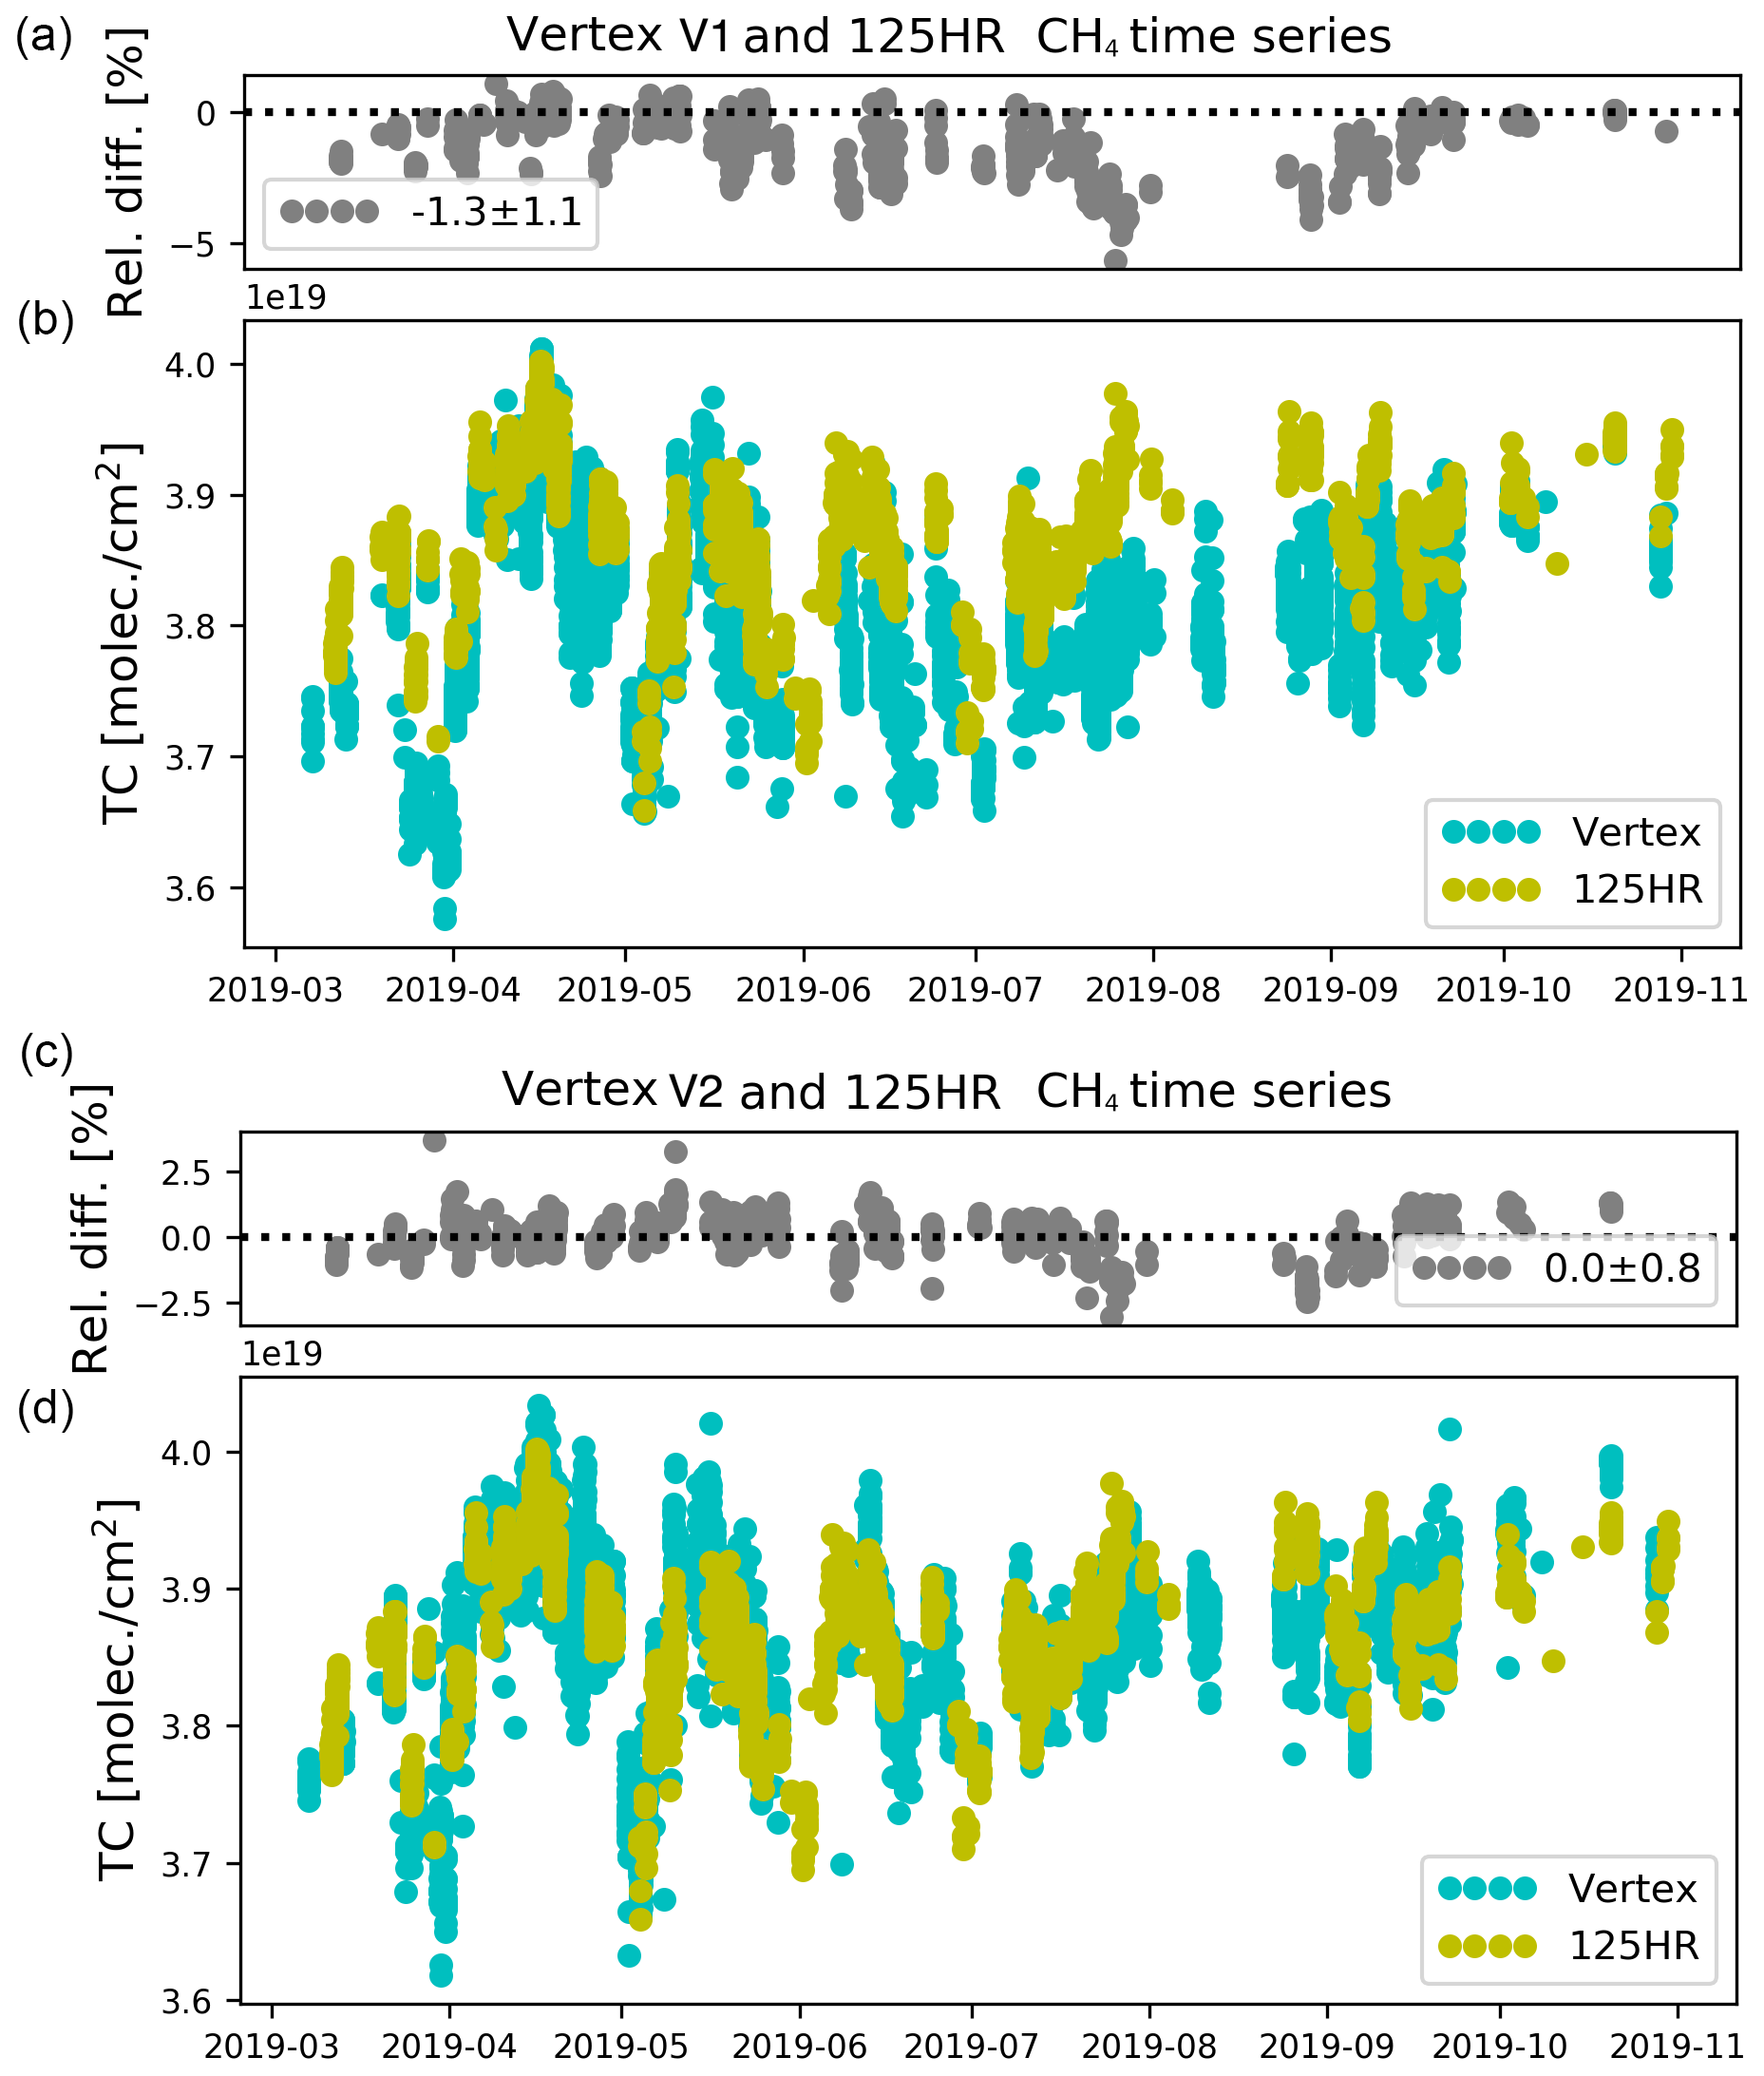
Figure 9Same as Fig. 6 but for the comparison between 125HR and VERTEX 70 V1 CH4 total columns (a, b) and between 125HR and VERTEX 70 V2 CH4 total columns (c, d).
The scatterplots (Fig. 10) confirm that the VERTEX 70 V2 CH4 total columns are much closer to the 125HR retrievals as compared to the VERTEX 70 V1 results. The correlation coefficients between 125HR and VERTEX 70 coincident CH4 total column daily means are 0.77 for VERTEX 70 V1 and 0.87 for VERTEX 70 V2. The relative differences between 125HR and VERTEX 70 V1 CH4 total columns vary with the SZA (R=0.42) and H2O total column (). The relative differences between 125HR and VERTEX 70 V2 CH4 total columns have almost no SZA dependence (). Besides, the linear regression between the relative differences and SZA total column show that the slope of the regression line for V2 is very close to zero as compared to the V1 value of 0.41 . In addition, the correlation with the H2O total column is strongly reduced (). The linear regression between the relative differences and H2O total column shows that the slope of the regression line for V2 is % molec. cm−2, which is about 2.5 times less that for V1 with % molec. cm−2.
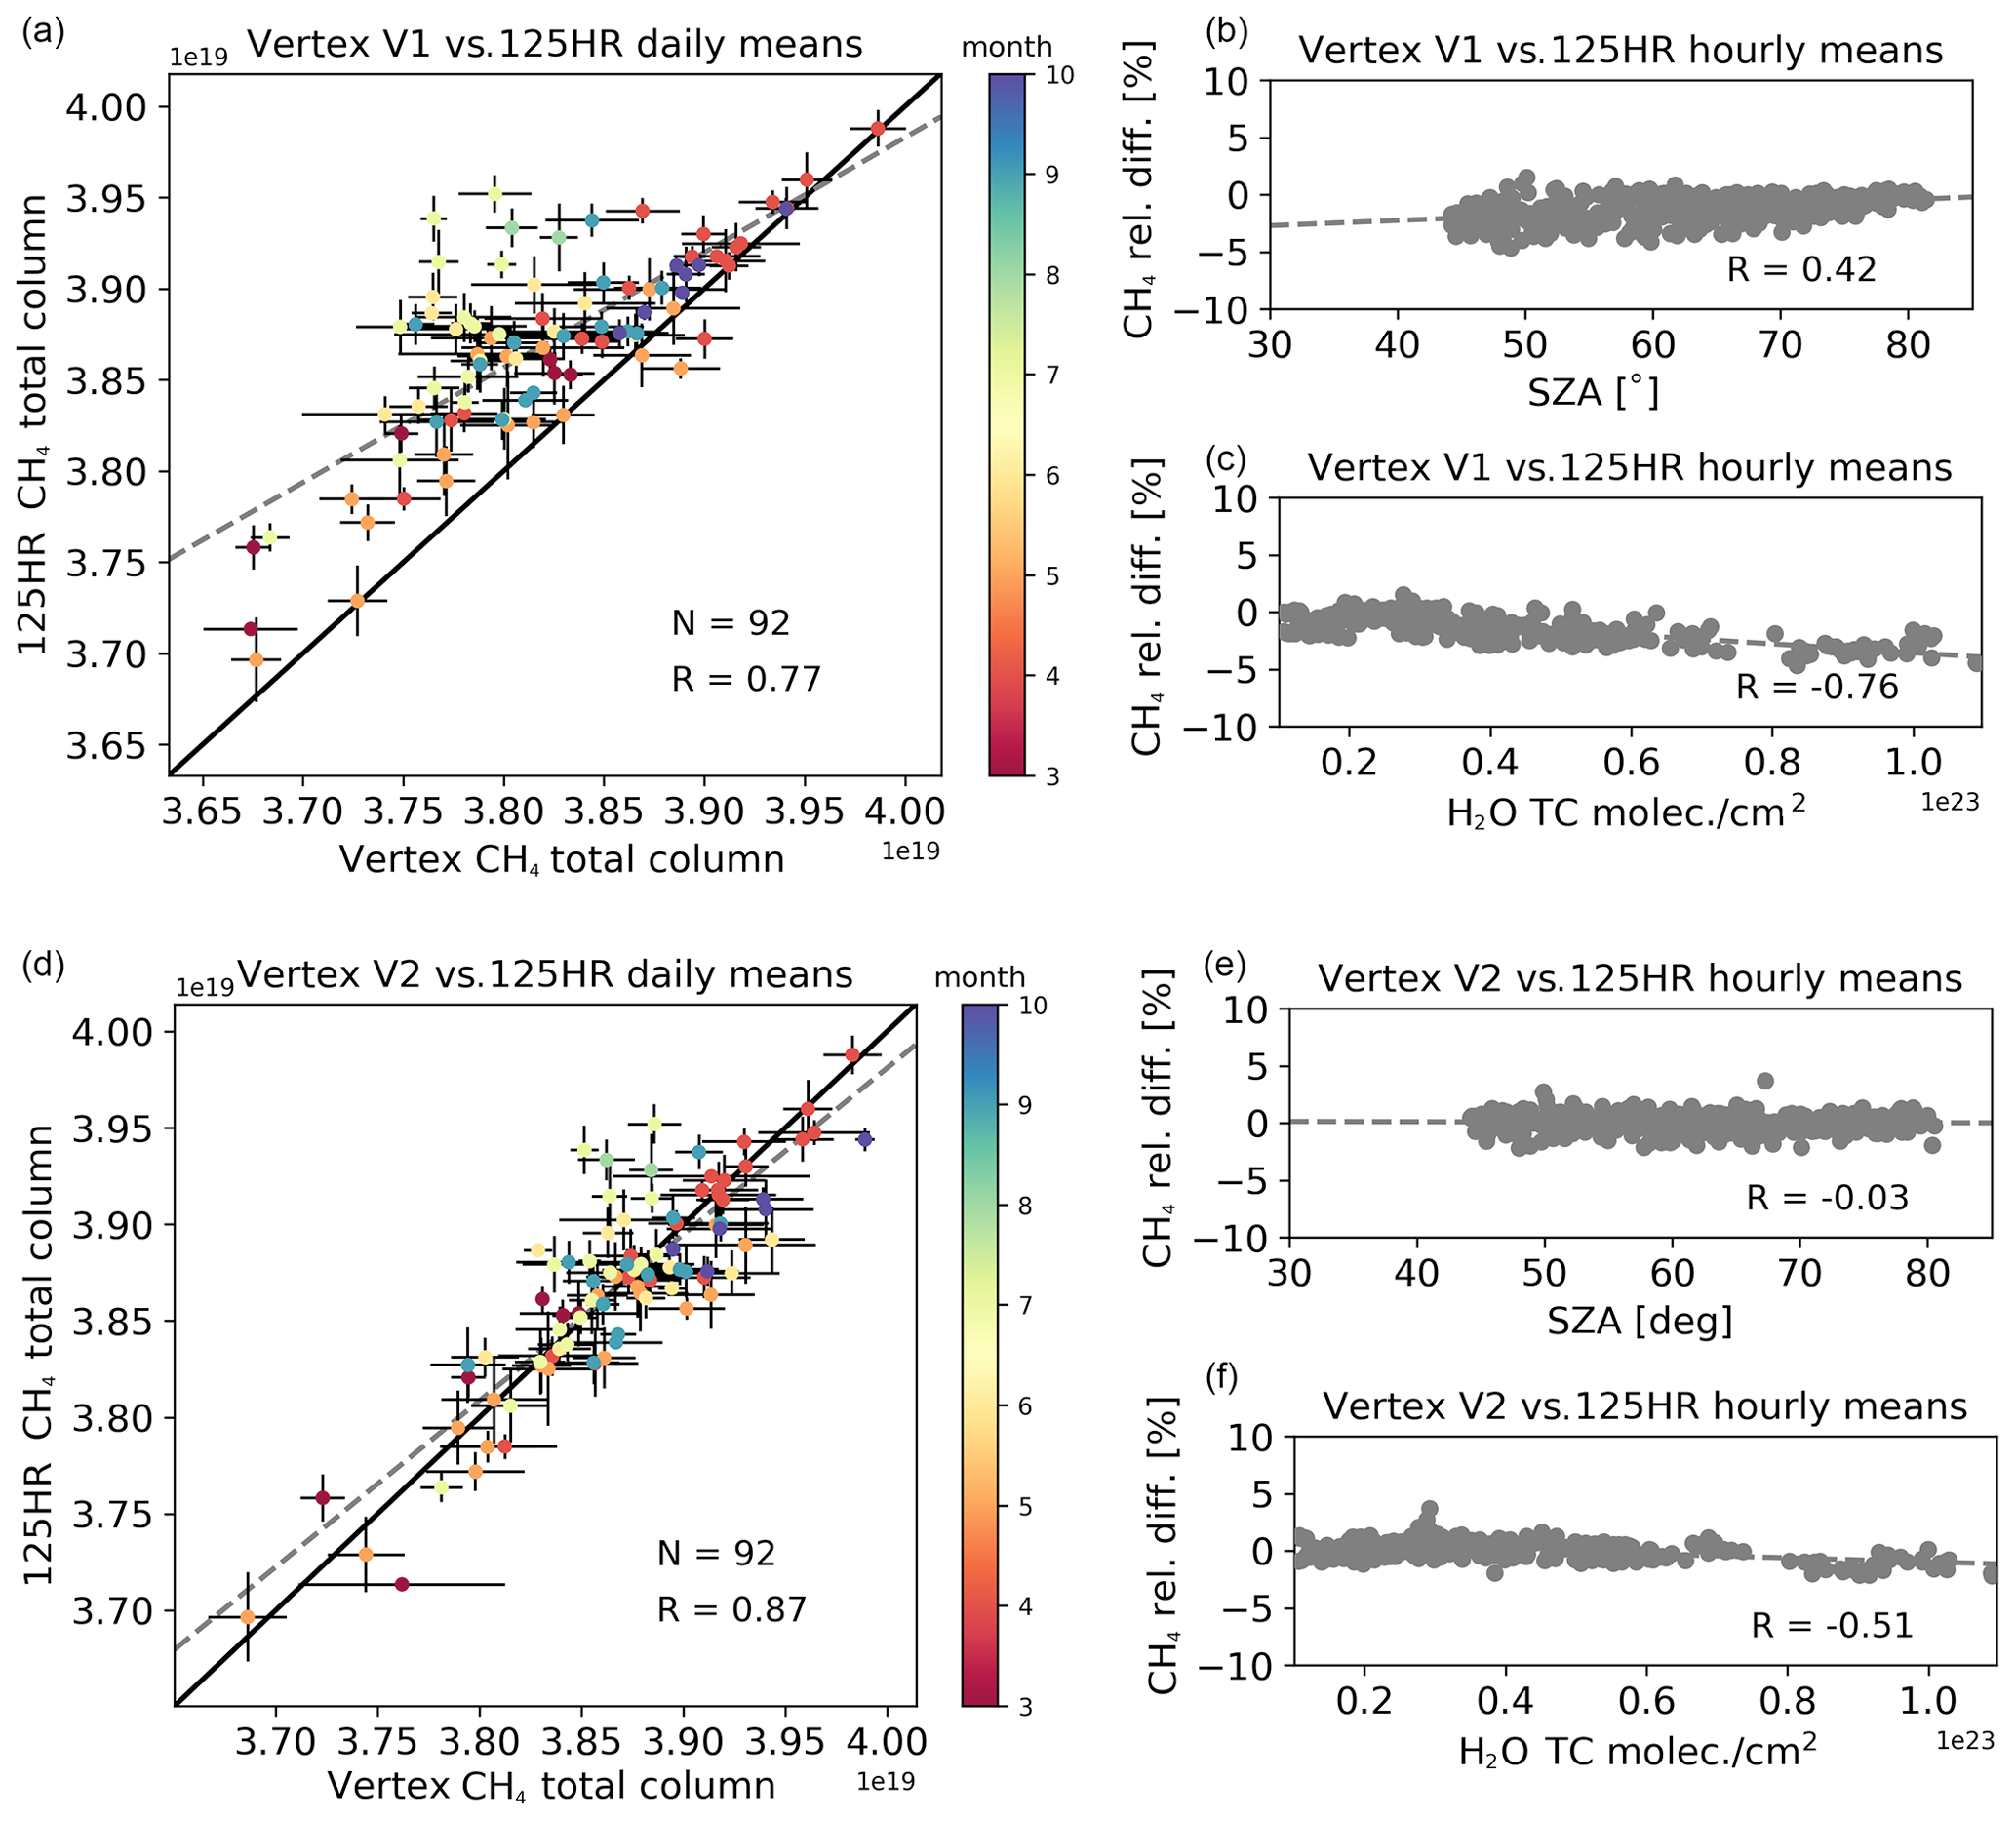
Figure 10Same as Fig. 7 but for the coincident 125HR and VERTEX 70 V1 (a–c) or V2 (d–f) CH4 retrievals.
4.2.2 Comparison with AirCore measurements
AirCore consists of a long tube system that ascends with a balloon to reach the mid-stratosphere (∼ 25–30 km). It starts collecting the surrounding air when descending from the high altitude to the surface. After landing, the sampled air inside the long tube is passed through a gas analyzer and represents a vertical profile of the atmospheric components if the analysis is performed before the air becomes mixed by diffusion. For more information about the AirCore system, we refer to Karion et al. (2010). AirCore launches have been regularly operated by FMI at Sodankylä since 2013, and the data have been used to compare with coincident FTIR and satellite measurements (Zhou et al., 2019a; Tu et al., 2020; Sha et al., 2020). There were six AirCore measurements in 2019 performed in the framework of the FRM4GHG campaign. For the moment, only CO2, CH4, and CO are observed by the AirCore system at Sodankylä.
Table 5The daily mean FTIR-retrieved CH4 total columns (1019 ) and their relative differences against smoothed AirCore, (FTIR − AirCore) AirCore × 100 %.
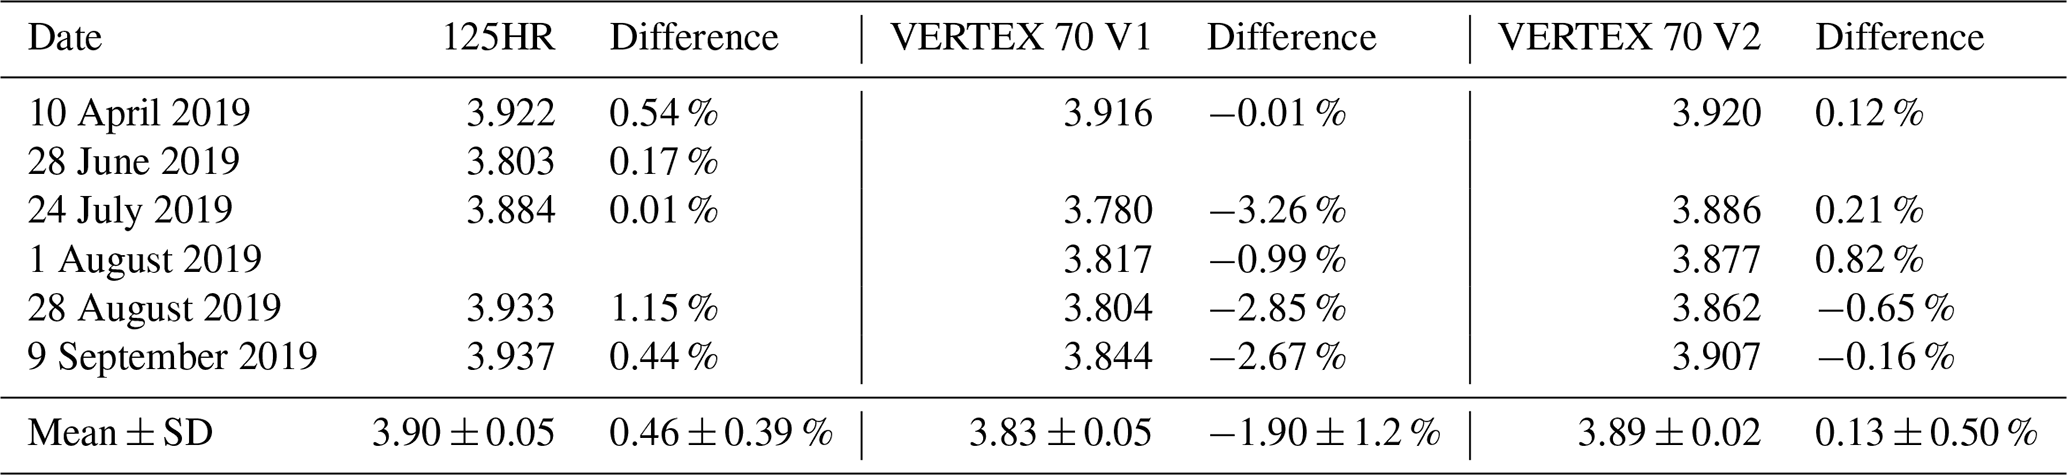
On the AirCore launch days, the daily mean FTIR-retrieved CH4 columns and the relative differences between the FTIR-retrieved CH4 total column and AirCore measurements are listed in Table 5. There is no VERTEX 70 measurement on 28 June 2019 and no 125HR measurement on 1 August 2019. To account for the limited vertical sensitivity of the FTIR retrievals, we smooth the AirCore profile with the corresponding FTIR averaging kernels (Rodgers and Connor, 2003).
where xcore,s is the smoothed AirCore profile, xcore is the extended AirCore profile, xa is the a priori profile of the FTIR retrieval, and A is the FTIR averaging kernel matrix (125HR, VERTEX 70 V1 or V2). Note that the original AirCore profile is extended with a scaled FTIR a priori profile above its maximum height to obtain the xcore. The scaling factor is calculated by the ratio of the observed AirCore CH4 and FTIR a priori CH4 mean mole fractions between 20 km and the AirCore profile's maximum height.
The mean relative differences between the FTIR-retrieved CH4 total columns and the smoothed AirCore measurements are 0.46 %, −1.90 %, and 0.13 % for 125HR, VERTEX 70 V1, and VERTEX 70 V2, respectively. Consistent with the results shown in Fig. 9, the VERTEX 70-V1-retrieved CH4 total columns are generally close to the 125HR retrievals in spring, but they become much lower than the 125HR retrievals in summer. As an example, the VERTEX 70-V1-retrieved CH4 daily mean is 3.26 % less than the smoothed AirCore on 24 July 2019. Several tests have been carried out to understand why there is an underestimation in VERTEX 70 V1 retrievals on that day: (i) using ERA5 reanalysis data instead of NCEP for the water vapor and temperature a prior profiles; (ii) using the coincident AirCore measurement instead of WACCM as the a priori CH4 profile; (iii) using the VERTEX 70-V2-retrieved CO2, H2O, and HDO instead of WACCM as the a priori interfering species; and (iv) using HITRAN2001 or HITRAN2016 instead of ATM19 for the spectroscopy. However, all these parameters only have a small impact on the VERTEX 70-V1-retrieved CH4 total column, with a relative difference of less than 0.2 %. So far, it remains unclear to us why the VERTEX 70 V1 retrievals underestimate the total columns as observed by the coincident AirCore measurements, but a similar bias is observed with respect to the 125HR retrievals. For the moment, we recommend using the V2 CH4 retrieval strategy for analyzing the VERTEX 70 MIR low-spectral-resolution spectra.
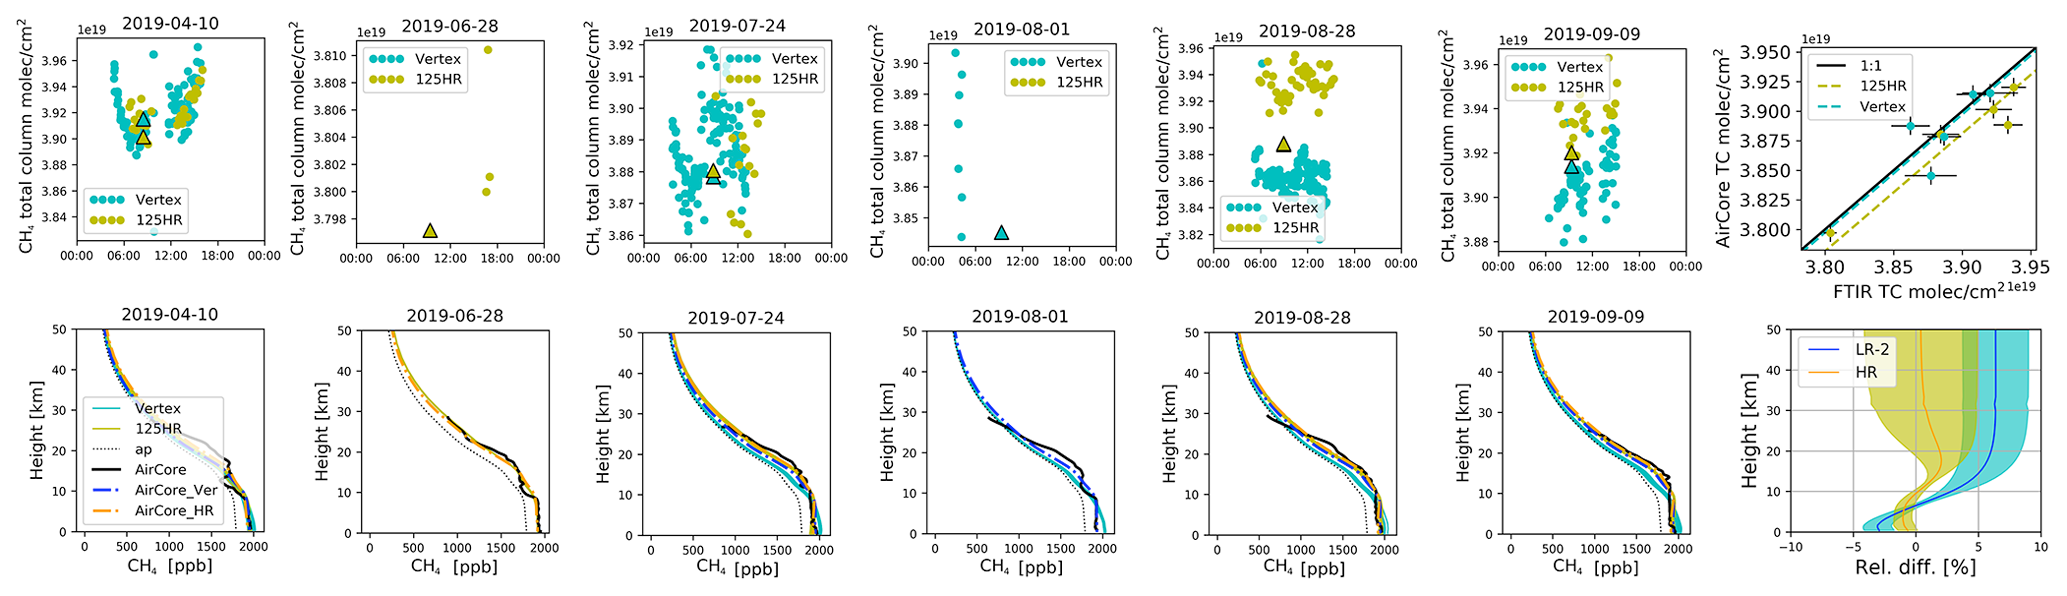
Figure 11Upper panels: the time series of the CH4 total columns retrieved from the 125HR (light green) and VERTEX 70 V2 (cyan), together with their corresponding smoothed AirCore total columns (triangle) on the six dates. The rightmost plot is the scatterplot between the smoothed AirCore and FTIR CH4 total columns. Note that there is no VERTEX 70 measurement on 28 June 2019 and no 125HR measurement on 1 August 2019. On 28 August 2019, the smoothed AirCore (with 125HR and VERTEX 70 V2) CH4 total columns are very close to each other, so we can only see one triangle. Lower panels: the CH4 vertical profiles from 125HR and VERTEX 70 V2 retrievals, together with the AirCore measurements and the smoothed AirCore profiles. The rightmost plot shows the mean and SD of the relative differences between the smoothed AirCore and FTIR CH4 vertical profiles.
Figure 11 shows the CH4 total columns retrieved from the 125HR and VERTEX 70 V2, together with the AirCore measurements on these six dates. We fit the coincident AirCore and FTIR data pairs using y=ax. The slope is 0.9952±0.0041 for 125HR and 0.9990±0.0048 for VERTEX 70 V2. In terms of the vertical profiles, the mean relative difference between the smoothed AirCore and 125HR-retrieved CH4 is within 2 % for all heights. However, the mean relative difference between the smoothed AirCore and VERTEX 70-V2-retrieved CH4 is about −3.0 % in the lower troposphere and larger than 5.0 % in the stratosphere. The low DOF value (1.3) suggests that we could only get the total column of CH4 from the VERTEX 70 V2 retrieval, and the AirCore measurements confirm that the CH4 vertical profile of the 125HR retrieval is closer to the observed one as compared to the VERTEX 70 V2 retrieval.
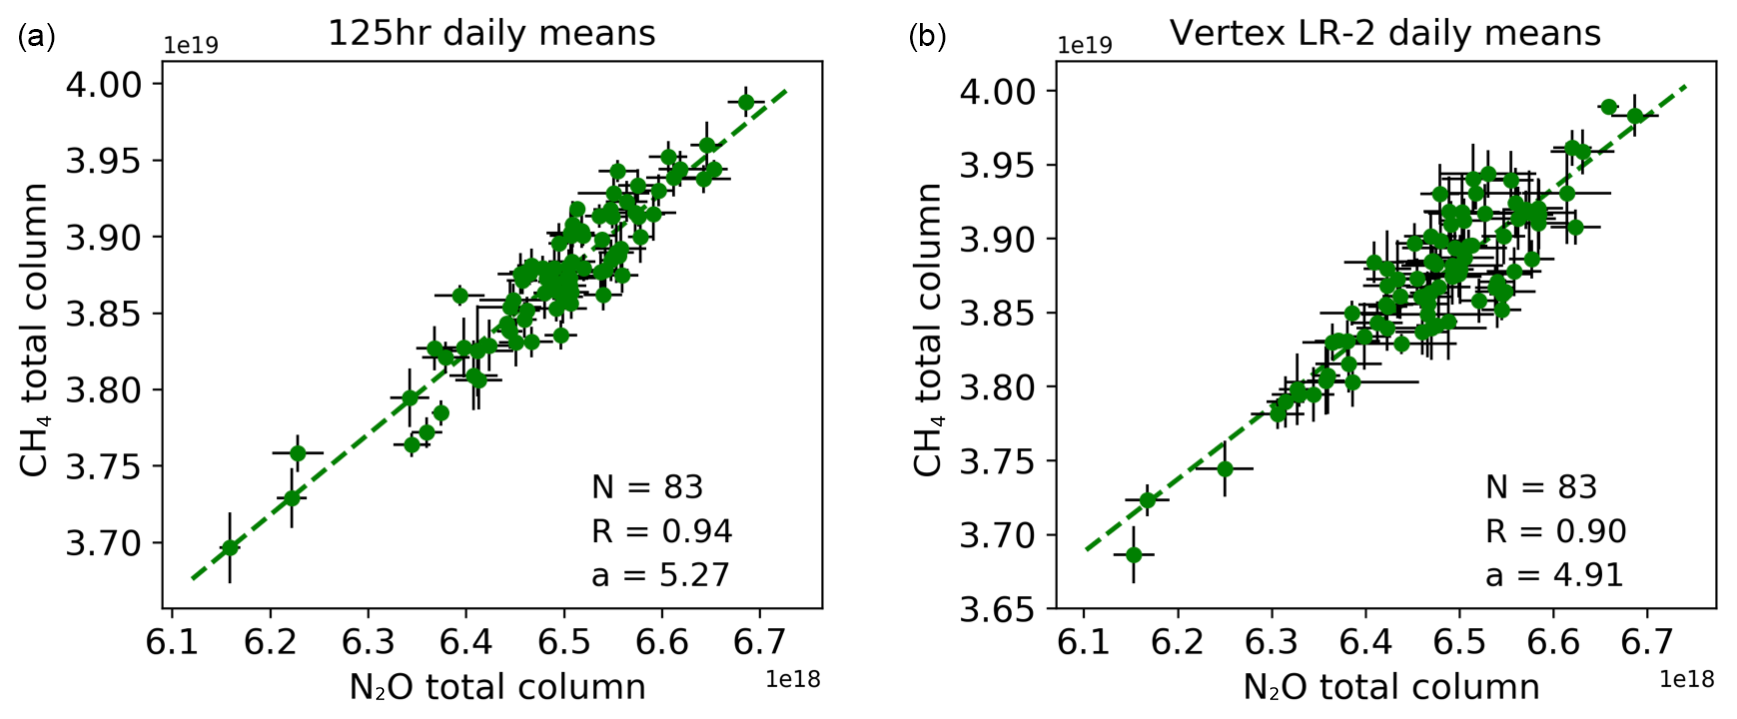
Figure 12The correlation plot between the N2O and CH4 total column daily means from the 125HR (a) and VERTEX 70 V2 (b). The error bar is the daily SD. N is the number of days, R is the correlation coefficient, and a is the slope of the linear fit.
4.3 N2O vs. CH4
The vertical profile shapes of N2O and CH4 are similar: a high but relatively constant mole fraction in the troposphere and decreasing with altitude in the stratosphere. Most of the N2O and CH4 emissions are near the surface, so the mole fractions of these two species are high in the troposphere. The N2O and CH4 molecules are transported from the troposphere to the stratosphere via the Brewer–Dobson circulation. The long lifetimes of N2O and CH4 cause a compact correlation between their abundances in the stratosphere, as has been confirmed by balloon, aircraft, and satellite measurements (Herman et al., 1998; Sawa et al., 2015; Wang et al., 2014). The 125HR and VERTEX 70 measurements show that the N2O and CH4 total columns have a positive correlation (Fig. 12), with an R value larger than 0.9. To reduce the sampling uncertainty, we select the days for which both 125HR and VERTEX 70 retrievals are available (83 in total). A larger scatter exists in the N2O and CH4 total columns from the VERTEX 70 as compared to 125HR, because of the larger random uncertainties in VERTEX 70 retrievals (Tables 3 and 4). The slope of the linear regression () is 5.27±0.20 from the 125HR retrievals and 4.91±0.29 from the VERTEX 70 retrievals. The uncertainty in the slope is calculated by the bootstrapping method (Fox, 2008) using the daily SD as the random variability. The difference in the slopes between the N2O and CH4 total columns observed by the 125HR and VERTEX 70 measurements is within their combined uncertainties. To conclude, the high correlations between N2O and CH4 total columns at Sodankylä are confirmed by the 125HR and VERTEX 70 retrievals.
In this study, the atmospheric abundances of N2O and CH4 are retrieved from low-resolution (0.2 cm−1) MIR solar absorption spectra recorded by the Bruker VERTEX 70 spectrometer in 2019 at Sodankylä and are compared with standard NDACC retrievals from coincident 125HR spectra with a spectral resolution of 0.005 cm−1. Moreover, the CH4 retrievals from the 125HR and VERTEX 70 spectra are also compared with the coincident in situ AirCore measurements.
We find that the standard NDACC retrieval strategy works well for the VERTEX 70 N2O retrieval as well. The relative differences between the N2O total columns retrieved from the 125HR and VERTEX 70 spectra are −0.3 ± 0.7 %. The correlation between the N2O total columns retrieved from 125HR and VERTEX 70 spectra is 0.93, and the relative differences are almost independent of SZA or water vapor content. However, the retrieval uncertainties of the N2O total columns from the VERTEX 70 spectra are larger than those of the total columns retrieved from 125HR spectra due especially to a higher measurement noise. What's more, the mean DOF of the N2O retrievals from the VERTEX 70 spectra is 1.6, which is less than the DOF of 2.6 obtained for the retrievals from the 125HR spectra. This agrees with the expectation that less vertical information can be derived from the spectra with a lower spectral resolution. Inspection of the N2O partial columns (0–6 and 6–25 km) confirms that this vertical information is captured by the VERTEX 70 measurements, albeit with a larger uncertainty than what is obtained from the 125HR measurements.
Unlike N2O, the recommended NDACC retrieval strategy does not perform well for the CH4 retrievals from VERTEX 70 spectra. Using the same retrieval windows (V1 retrieval strategy), the relative differences between the CH4 total columns retrieved from the 125HR and VERTEX 70 spectra are −1.3 ± 1.1 %, and they show a seasonal variation: in spring the VERTEX 70-V1-retrieved CH4 total columns are close to the ones retrieved from the 125HR spectra, but in summer they are about 3.0 % smaller than the 125HR retrievals. In addition, these relative differences vary with the SZA and water vapor content. The DOF of V1-retrieved CH4 profiles from VERTEX 70 spectra is 1.0. The correlation coefficient between the CH4 total columns retrieved from 125HR and VERTEX 70 spectra is 0.77. The underestimation of the VERTEX 70-V1-retrieved CH4 columns in summer is confirmed by the coincident AirCore profiles. In this study, we propose to replace two microwindows of the recommended NDACC retrieval strategy (2835.55–2835.8 and 2903.82–2903.925 cm−1) with two alternative ones, namely 2875.15–2875.85 and 2898.3–2898.93 cm−1, including stronger CH4 absorption lines, to perform the CH4 profile retrievals from the VERTEX 70 spectra (V2 retrieval strategy). The DOF of VERTEX 70 V2 CH4 retrievals is 1.3, providing more vertical information as compared to VERTEX 70 V1 retrievals. The relative differences between the CH4 total columns retrieved from 125HR and VERTEX 70 spectra are 0.0 ± 0.8 %, with a much reduced seasonal variation. The correlation coefficient between the CH4 total columns retrieved from 125HR and VERTEX 70 spectra increases to 0.87. The relative differences between the CH4 total columns from the coincident AirCore and VERTEX 70 V2 retrievals are 0.13 ± 0.50 %.
The NIR vs. MIR and low- vs. high-resolution performance differences comprise an interesting measurement technique topic to characterize, including how performance differences have evolved over time, with various technological and retrieval advancements. In the framework of the ESA FRM4GHG 2.0 project, we intend to design a compact solar tracker system and enclosure to make the Bruker VERTEX 70 even more convenient to transport and operate autonomously. More campaigns will be carried out to better understand the performances of the CH4 and N2O VERTEX 70 retrievals with different conditions, such as at a humid or a low-latitude site. Such kind of portable FTIR instruments will help to fill the gaps of the NDACC network for CH4 and N2O observations and contribute effectively to satellite validation, model verification, and other scientific studies. In the future, it is also planned to investigate the retrieval of additional tropospheric species from the Bruker VERTEX 70 low-resolution MIR spectra.
The Bruker 125HR retrievals at Sodankylä are publicly available at the NDACC archive (http://www.ndacc.org, InfraRed Working Group, 2023). The VERTEX 70 retrievals and AirCore profiles are available upon request to the authors.
MZ wrote the manuscript. MZ, MKS, BL, JN, and MDM designed the experiment. CH, RK, PH, and CP contributed to the FTIR measurements at Sodankylä. RK and HC provided the AirCore measurements. All the authors read and commented on the manuscript.
At least one of the (co-)authors is a member of the editorial board of Atmospheric Measurement Techniques. The peer-review process was guided by an independent editor, and the authors also have no other competing interests to declare.
Publisher's note: Copernicus Publications remains neutral with regard to jurisdictional claims made in the text, published maps, institutional affiliations, or any other geographical representation in this paper. While Copernicus Publications makes every effort to include appropriate place names, the final responsibility lies with the authors.
The authors would like to thank all FRM4GHG and FRM4GHG 2.0 colleagues for the measurement campaign and discussions in between.
This study is supported by the National Natural Science Foundation of China (42205140) and the European Space Agency projects FRM4GHG and FRM4GHG 2.0, which received research funding from ESA's FRM program under grant agreement nos. 4000117640/16/I-LG and 4000136108/21/I-DT-lr.
This paper was edited by Dietrich G. Feist and reviewed by Dietrich G. Feist and one anonymous referee.
Angelbratt, J., Mellqvist, J., Blumenstock, T., Borsdorff, T., Brohede, S., Duchatelet, P., Forster, F., Hase, F., Mahieu, E., Murtagh, D., Petersen, A. K., Schneider, M., Sussmann, R., and Urban, J.: A new method to detect long term trends of methane (CH4) and nitrous oxide (N2O) total columns measured within the NDACC ground-based high resolution solar FTIR network, Atmos. Chem. Phys., 11, 6167–6183, https://doi.org/10.5194/acp-11-6167-2011, 2011. a
Bader, W., Bovy, B., Conway, S., Strong, K., Smale, D., Turner, A. J., Blumenstock, T., Boone, C., Collaud Coen, M., Coulon, A., Garcia, O., Griffith, D. W. T., Hase, F., Hausmann, P., Jones, N., Krummel, P., Murata, I., Morino, I., Nakajima, H., O'Doherty, S., Paton-Walsh, C., Robinson, J., Sandrin, R., Schneider, M., Servais, C., Sussmann, R., and Mahieu, E.: The recent increase of atmospheric methane from 10 years of ground-based NDACC FTIR observations since 2005, Atmos. Chem. Phys., 17, 2255–2277, https://doi.org/10.5194/acp-17-2255-2017, 2017. a
Barret, B., Gouzenes, Y., Le Flochmoen, E., and Ferrant, S.: Retrieval of Metop-A/IASI N2O Profiles and Validation with NDACC FTIR Data, Atmosphere, 12, 219, https://doi.org/10.3390/atmos12020219, 2021. a
Chesnokova, T., Makarova, M., Chentsov, A., Kostsov, V., Poberovskii, A., Zakharov, V., and Rokotyan, N.: Estimation of the impact of differences in the CH4 absorption line parameters on the accuracy of methane atmospheric total column retrievals from ground-based FTIR spectra, J. Quant. Spectrosc. Ra., 254, 107187, https://doi.org/10.1016/j.jqsrt.2020.107187, 2020. a
De Mazière, M., Thompson, A. M., Kurylo, M. J., Wild, J. D., Bernhard, G., Blumenstock, T., Braathen, G. O., Hannigan, J. W., Lambert, J.-C., Leblanc, T., McGee, T. J., Nedoluha, G., Petropavlovskikh, I., Seckmeyer, G., Simon, P. C., Steinbrecht, W., and Strahan, S. E.: The Network for the Detection of Atmospheric Composition Change (NDACC): history, status and perspectives, Atmos. Chem. Phys., 18, 4935–4964, https://doi.org/10.5194/acp-18-4935-2018, 2018. a
Fox, J.: Applied Regression Analysis and Generalized Linear Models, SAGE Publications, http://books.google.ch/books?id=GKkn3LSSHFsC (last access: 1 January 2023), 2008. a
García, O. E., Schneider, M., Sepúlveda, E., Hase, F., Blumenstock, T., Cuevas, E., Ramos, R., Gross, J., Barthlott, S., Röhling, A. N., Sanromá, E., González, Y., Gómez-Peláez, Á. J., Navarro-Comas, M., Puentedura, O., Yela, M., Redondas, A., Carreño, V., León-Luis, S. F., Reyes, E., García, R. D., Rivas, P. P., Romero-Campos, P. M., Torres, C., Prats, N., Hernández, M., and López, C.: Twenty years of ground-based NDACC FTIR spectrometry at Izaña Observatory – overview and long-term comparison to other techniques, Atmos. Chem. Phys., 21, 15519–15554, https://doi.org/10.5194/acp-21-15519-2021, 2021. a
Gordon, I., Rothman, L., Hill, C., Kochanov, R., Tan, Y., Bernath, P., Birk, M., Boudon, V., Campargue, A., Chance, K., Drouin, B., Flaud, J.-M., Gamache, R., Hodges, J., Jacquemart, D., Perevalov, V., Perrin, A., Shine, K., Smith, M.-A., Tennyson, J., Toon, G., Tran, H., Tyuterev, V., Barbe, A., Császár, A., Devi, V., Furtenbacher, T., Harrison, J., Hartmann, J.-M., Jolly, A., Johnson, T., Karman, T., Kleiner, I., Kyuberis, A., Loos, J., Lyulin, O., Massie, S., Mikhailenko, S., Moazzen-Ahmadi, N., Müller, H., Naumenko, O., Nikitin, A., Polyansky, O., Rey, M., Rotger, M., Sharpe, S., Sung, K., Starikova, E., Tashkun, S., Auwera, J. V., Wagner, G., Wilzewski, J., Wcisło, P., Yu, S., and Zak, E.: The HITRAN2016 molecular spectroscopic database, J. Quant. Spectrosc. Ra., 203, 3–69, https://doi.org/10.1016/j.jqsrt.2017.06.038, hITRAN2016 Special Issue, 2017. a
Hall, B. D., Dutton, G. S., and Elkins, J. W.: The NOAA nitrous oxide standard scale for atmospheric observations, J. Geophys. Res. Atmos., 112, D09305, https://doi.org/10.1029/2006JD007954, 2007. a
Hase, F., Hannigan, J., Coffey, M., Goldman, A., Höpfner, M., Jones, N., Rinsland, C., and Wood, S.: Intercomparison of retrieval codes used for the analysis of high-resolution, ground-based FTIR measurements, J. Quant. Spectrosc. Ra., 87, 25–52, https://doi.org/10.1016/j.jqsrt.2003.12.008, 2004. a
Herman, R. L., Scott, D. C., Webster, C. R., May, R. D., Moyer, E. J., Salawitch, R. J., Yung, Y. L., Toon, G. C., Sen, B., Margitan, J. J., Rosenlof, K. H., Michelsen, H. A., and Elkins, J. W.: Tropical entrainment time scales inferred from stratospheric N2O and CH4 observations, Geophys. Res. Lett., 25, 2781–2784, https://doi.org/10.1029/98GL02109, 1998. a
InfraRed Working Group: NDACC datasets, NDACC, http://www.ndacc.org, last access: 1 January 2023. a
IPCC: Climate change 2013: The physical science basis. Contribution of Working Group I to the Fifth Assessment Report of the Intergovernmental Panel on Climate Change, Cambridge University Press, Cambridge, United Kingdom and New York, NY, USA, 2013. a
Karion, A., Sweeney, C., Tans, P., and Newberger, T.: AirCore: An innovative atmospheric sampling system, J. Atmos. Ocean. Tech., 27, 1839–1853, https://doi.org/10.1175/2010JTECHA1448.1, 2010. a
Kirschke, S., Bousquet, P., Ciais, P., Saunois, M., Canadell, J. G., Dlugokencky, E. J., Bergamaschi, P., Bergmann, D., Blake, D. R., Bruhwiler, L., Cameron-Smith, P., Castaldi, S., Chevallier, F., Feng, L., Fraser, A., Heimann, M., Hodson, E. L., Houweling, S., Josse, B., Fraser, P. J., Krummel, P. B., Lamarque, J.-F., Langenfelds, R. L., Le Quéré, C., Naik, V., O'Doherty, S., Palmer, P. I., Pison, I., Plummer, D., Poulter, B., Prinn, R. G., Rigby, M., Ringeval, B., Santini, M., Schmidt, M., Shindell, D. T., Simpson, I. J., Spahni, R., Steele, L. P., Strode, S. A., Sudo, K., Szopa, S., van der Werf, G. R., Voulgarakis, A., van Weele, M., Weiss, R. F., Williams, J. E., and Zeng, G.: Three decades of global methane sources and sinks, Nat. Geosci., 6, pages 813–823, https://doi.org/10.1038/ngeo1955, 2013. a
Kivi, R. and Heikkinen, P.: Fourier transform spectrometer measurements of column CO2 at Sodankylä, Finland, Geosci. Instrum. Method. Data Syst., 5, 271–279, https://doi.org/10.5194/gi-5-271-2016, 2016. a
Kivi, R., Kyrö, E., Turunen, T., Harris, N. R., von der Gathen, P., Rex, M., Andersen, S. B., and Wohltmann, I.: Ozonesonde observations in the Arctic during 1989-2003: Ozone variability and trends in the lower stratosphere and free troposphere, J. Geophys. Res.-Atmos., 112, D08306, https://doi.org/10.1029/2006JD007271, 2007. a
Ostler, A., Sussmann, R., Rettinger, M., Deutscher, N. M., Dohe, S., Hase, F., Jones, N., Palm, M., and Sinnhuber, B.-M.: Multistation intercomparison of column-averaged methane from NDACC and TCCON: impact of dynamical variability, Atmos. Meas. Tech., 7, 4081–4101, https://doi.org/10.5194/amt-7-4081-2014, 2014. a
Park, S., Croteau, P., Boering, K. A., Etheridge, D. M., Ferretti, D., Fraser, P. J., Kim, K. R., Krummel, P. B., Langenfelds, R. L., Van Ommen, T. D., Steele, L. P., and Trudinger, C. M.: Trends and seasonal cycles in the isotopic composition of nitrous oxide since 1940, Nat. Geosci., 5, 261–265, https://doi.org/10.1038/ngeo1421, 2012. a
Pougatchev, N. S., Connor, B. J., and Rinsland, C. P.: Infrared measurements of the ozone vertical distribution above Kitt Peak, J. Geophys. Res., 100, 16689, https://doi.org/10.1029/95JD01296, 1995. a
Rodgers, C. D.: Inverse Methods for Atmospheric Sounding – Theory and Practice, Series on Atmospheric Oceanic and Planetary Physics, vol. 2, World Scientific Publishing Co. Pte. Ltd, Singapore, https://doi.org/10.1142/9789812813718, 2000. a, b
Rodgers, C. D. and Connor, B. J.: Intercomparison of remote sounding instruments, J. Geophys. Res., 108, 46–48, https://doi.org/10.1029/2002JD002299, 2003. a
Rothman, L. S., Gordon, I. E., Barbe, A., Benner, D. C., Bernath, P. F., Birk, M., Boudon, V., Brown, L. R., Campargue, A., Champion, J. P., Chance, K., Coudert, L. H., Dana, V., Devi, V. M., Fally, S., Flaud, J. M., Gamache, R. R., Goldman, A., Jacquemart, D., Kleiner, I., Lacome, N., Lafferty, W. J., Mandin, J. Y., Massie, S. T., Mikhailenko, S. N., Miller, C. E., Moazzen-Ahmadi, N., Naumenko, O. V., Nikitin, A. V., Orphal, J., Perevalov, V. I., Perrin, A., Predoi-Cross, A., Rinsland, C. P., Rotger, M., Šimečková, M., Smith, M. A., Sung, K., Tashkun, S. A., Tennyson, J., Toth, R. A., Vandaele, A. C., and Vander Auwera, J.: The HITRAN 2008 molecular spectroscopic database, J. Quant. Spectrosc. Ra., 110, 533–572, https://doi.org/10.1016/j.jqsrt.2009.02.013, 2009. a, b
Saunois, M., Stavert, A. R., Poulter, B., Bousquet, P., Canadell, J. G., Jackson, R. B., Raymond, P. A., Dlugokencky, E. J., Houweling, S., Patra, P. K., Ciais, P., Arora, V. K., Bastviken, D., Bergamaschi, P., Blake, D. R., Brailsford, G., Bruhwiler, L., Carlson, K. M., Carrol, M., Castaldi, S., Chandra, N., Crevoisier, C., Crill, P. M., Covey, K., Curry, C. L., Etiope, G., Frankenberg, C., Gedney, N., Hegglin, M. I., Höglund-Isaksson, L., Hugelius, G., Ishizawa, M., Ito, A., Janssens-Maenhout, G., Jensen, K. M., Joos, F., Kleinen, T., Krummel, P. B., Langenfelds, R. L., Laruelle, G. G., Liu, L., Machida, T., Maksyutov, S., McDonald, K. C., McNorton, J., Miller, P. A., Melton, J. R., Morino, I., Müller, J., Murguia-Flores, F., Naik, V., Niwa, Y., Noce, S., O'Doherty, S., Parker, R. J., Peng, C., Peng, S., Peters, G. P., Prigent, C., Prinn, R., Ramonet, M., Regnier, P., Riley, W. J., Rosentreter, J. A., Segers, A., Simpson, I. J., Shi, H., Smith, S. J., Steele, L. P., Thornton, B. F., Tian, H., Tohjima, Y., Tubiello, F. N., Tsuruta, A., Viovy, N., Voulgarakis, A., Weber, T. S., van Weele, M., van der Werf, G. R., Weiss, R. F., Worthy, D., Wunch, D., Yin, Y., Yoshida, Y., Zhang, W., Zhang, Z., Zhao, Y., Zheng, B., Zhu, Q., Zhu, Q., and Zhuang, Q.: The Global Methane Budget 2000–2017, Earth Syst. Sci. Data, 12, 1561–1623, https://doi.org/10.5194/essd-12-1561-2020, 2020. a
Sawa, Y., Machida, T., Matsueda, H., Niwa, Y., Tsuboi, K., Murayama, S., Morimoto, S., and Aoki, S.: Seasonal changes of CO2, CH4, N2O, and SF6 in the upper troposphere/lower stratosphere over the Eurasian continent observed by commercial airliner, Geophys. Res. Lett., 42, 2001–2008, https://doi.org/10.1002/2014GL062734, 2015. a
Schwietzke, S., Sherwood, O. A., Bruhwiler, L. M. P., Miller, J. B., Etiope, G., Dlugokencky, E. J., Michel, S. E., Arling, V. A., Vaughn, B. H., White, J. W. C., and Tans, P. P.: Upward revision of global fossil fuel methane emissions based on isotope database, Nature, 538, 88–91, https://doi.org/10.1038/nature19797, 2016. a
Sepúlveda, E., Schneider, M., Hase, F., Barthlott, S., Dubravica, D., García, O. E., Gomez-Pelaez, A., González, Y., Guerra, J. C., Gisi, M., Kohlhepp, R., Dohe, S., Blumenstock, T., Strong, K., Weaver, D., Palm, M., Sadeghi, A., Deutscher, N. M., Warneke, T., Notholt, J., Jones, N., Griffith, D. W. T., Smale, D., Brailsford, G. W., Robinson, J., Meinhardt, F., Steinbacher, M., Aalto, T., and Worthy, D.: Tropospheric CH4 signals as observed by NDACC FTIR at globally distributed sites and comparison to GAW surface in situ measurements, Atmos. Meas. Tech., 7, 2337–2360, https://doi.org/10.5194/amt-7-2337-2014, 2014. a
Sha, M. K., De Mazière, M., Notholt, J., Blumenstock, T., Chen, H., Dehn, A., Griffith, D. W. T., Hase, F., Heikkinen, P., Hermans, C., Hoffmann, A., Huebner, M., Jones, N., Kivi, R., Langerock, B., Petri, C., Scolas, F., Tu, Q., and Weidmann, D.: Intercomparison of low- and high-resolution infrared spectrometers for ground-based solar remote sensing measurements of total column concentrations of CO2, CH4, and CO, Atmos. Meas. Tech., 13, 4791–4839, https://doi.org/10.5194/amt-13-4791-2020, 2020. a, b, c
Sha, M. K., Langerock, B., Blavier, J.-F. L., Blumenstock, T., Borsdorff, T., Buschmann, M., Dehn, A., De Mazière, M., Deutscher, N. M., Feist, D. G., García, O. E., Griffith, D. W. T., Grutter, M., Hannigan, J. W., Hase, F., Heikkinen, P., Hermans, C., Iraci, L. T., Jeseck, P., Jones, N., Kivi, R., Kumps, N., Landgraf, J., Lorente, A., Mahieu, E., Makarova, M. V., Mellqvist, J., Metzger, J.-M., Morino, I., Nagahama, T., Notholt, J., Ohyama, H., Ortega, I., Palm, M., Petri, C., Pollard, D. F., Rettinger, M., Robinson, J., Roche, S., Roehl, C. M., Röhling, A. N., Rousogenous, C., Schneider, M., Shiomi, K., Smale, D., Stremme, W., Strong, K., Sussmann, R., Té, Y., Uchino, O., Velazco, V. A., Vigouroux, C., Vrekoussis, M., Wang, P., Warneke, T., Wizenberg, T., Wunch, D., Yamanouchi, S., Yang, Y., and Zhou, M.: Validation of methane and carbon monoxide from Sentinel-5 Precursor using TCCON and NDACC-IRWG stations, Atmos. Meas. Tech., 14, 6249–6304, https://doi.org/10.5194/amt-14-6249-2021, 2021. a, b, c
Steck, T.: Methods for determining regularization for atmospheric retrieval problems, Appl. Optics, 41, 1788–1797, https://doi.org/10.1364/AO.41.001788, 2002. a
Taylor, J. R., Wunch, D., Midwinter, C., Wiacek, A., Drummond, J. R., and Strong, K.: An extended intercomparison of simultaneous ground-based Fourier transform infrared spectrometer measurements at the Toronto Atmospheric Observatory, J. Quant. Spectrosc. Ra., 109, 2244–2260, https://doi.org/10.1016/j.jqsrt.2008.03.011, 2008. a
Tian, H., Xu, R., Canadell, J. G., Thompson, R. L., Winiwarter, W., Suntharalingam, P., Davidson, E. A., Ciais, P., Jackson, R. B., Janssens-Maenhout, G., Prather, M. J., Regnier, P., Pan, N., Pan, S., Peters, G. P., Shi, H., Tubiello, F. N., Zaehle, S., Zhou, F., Arneth, A., Battaglia, G., Berthet, S., Bopp, L., Bouwman, A. F., Buitenhuis, E. T., Chang, J., Chipperfield, M. P., Dangal, S. R. S., Dlugokencky, E., Elkins, J. W., Eyre, B. D., Fu, B., Hall, B., Ito, A., Joos, F., Krummel, P. B., Landolfi, A., Laruelle, G. G., Lauerwald, R., Li, W., Lienert, S., Maavara, T., MacLeod, M., Millet, D. B., Olin, S., Patra, P. K., Prinn, R. G., Raymond, P. A., Ruiz, D. J., van der Werf, G. R., Vuichard, N., Wang, J., Weiss, R. F., Wells, K. C., Wilson, C., Yang, J., and Yao, Y.: A comprehensive quantification of global nitrous oxide sources and sinks, Nature, 586, 248–256, 2020. a
Tikhonov, A. N.: Solution of Incorrectly Formulated Problems and the Regularisation Method, Soviet. Math. Dokl., 4, 1035–1038, 1963. a
Tu, Q., Hase, F., Blumenstock, T., Kivi, R., Heikkinen, P., Sha, M. K., Raffalski, U., Landgraf, J., Lorente, A., Borsdorff, T., Chen, H., Dietrich, F., and Chen, J.: Intercomparison of atmospheric CO2 and CH4 abundances on regional scales in boreal areas using Copernicus Atmosphere Monitoring Service (CAMS) analysis, COllaborative Carbon Column Observing Network (COCCON) spectrometers, and Sentinel-5 Precursor satellite observations, Atmos. Meas. Tech., 13, 4751–4771, https://doi.org/10.5194/amt-13-4751-2020, 2020. a
Turner, A. J., Frankenberg, C., Wennberg, P. O., and Jacob, D. J.: Ambiguity in the causes for decadal trends in atmospheric methane and hydroxyl, P. Natl. Acad. Sci. USA, 114, 5367–5372, https://doi.org/10.1073/PNAS.1616020114, 2017. a
Wang, Z., Deutscher, N. M., Warneke, T., Notholt, J., Dils, B., Griffith, D. W. T., Schmidt, M., Ramonet, M., and Gerbig, C.: Retrieval of tropospheric column-averaged CH4 mole fraction by solar absorption FTIR-spectrometry using N2O as a proxy, Atmos. Meas. Tech., 7, 3295–3305, https://doi.org/10.5194/amt-7-3295-2014, 2014. a
WMO: WMO Greenhouse Gas Bulletin, World Meteorological Organization, WMO Bull., ISSN 2078-0796, 2020. a
Worden, J. R., Bloom, A. A., Pandey, S., Jiang, Z., Worden, H. M., Walker, T. W., Houweling, S., and Röckmann, T.: Reduced biomass burning emissions reconcile conflicting estimates of the post-2006 atmospheric methane budget, Nat. Commun., 8, 2227, https://doi.org/10.1038/s41467-017-02246-0, 2017. a
Wunch, D., Toon, G. C., Sherlock, V., Deutscher, N. M., Liu, C., Feist, D. G., and Wennberg, P. O.: The Total Carbon Column Observing Network's GGG2014 Data Version, Tech. rep., California Institute of Technology, Pasadena, CA, https://doi.org/10.14291/tccon.ggg2014.documentation.R0/1221662, 2015. a
Zhou, M., Vigouroux, C., Langerock, B., Wang, P., Dutton, G., Hermans, C., Kumps, N., Metzger, J.-M., Toon, G., and De Mazière, M.: CFC-11, CFC-12 and HCFC-22 ground-based remote sensing FTIR measurements at Réunion Island and comparisons with MIPAS/ENVISAT data, Atmos. Meas. Tech., 9, 5621–5636, https://doi.org/10.5194/amt-9-5621-2016, 2016. a
Zhou, M., Langerock, B., Vigouroux, C., Sha, M. K., Ramonet, M., Delmotte, M., Mahieu, E., Bader, W., Hermans, C., Kumps, N., Metzger, J.-M., Duflot, V., Wang, Z., Palm, M., and De Mazière, M.: Atmospheric CO and CH4 time series and seasonal variations on Reunion Island from ground-based in situ and FTIR (NDACC and TCCON) measurements, Atmos. Chem. Phys., 18, 13881–13901, https://doi.org/10.5194/acp-18-13881-2018, 2018. a, b
Zhou, M., Langerock, B., Sha, M. K., Kumps, N., Hermans, C., Petri, C., Warneke, T., Chen, H., Metzger, J.-M., Kivi, R., Heikkinen, P., Ramonet, M., and De Mazière, M.: Retrieval of atmospheric CH4 vertical information from ground-based FTS near-infrared spectra, Atmos. Meas. Tech., 12, 6125–6141, https://doi.org/10.5194/amt-12-6125-2019, 2019a. a
Zhou, M., Langerock, B., Wells, K. C., Millet, D. B., Vigouroux, C., Sha, M. K., Hermans, C., Metzger, J.-M., Kivi, R., Heikkinen, P., Smale, D., Pollard, D. F., Jones, N., Deutscher, N. M., Blumenstock, T., Schneider, M., Palm, M., Notholt, J., Hannigan, J. W., and De Mazière, M.: An intercomparison of total column-averaged nitrous oxide between ground-based FTIR TCCON and NDACC measurements at seven sites and comparisons with the GEOS-Chem model, Atmos. Meas. Tech., 12, 1393–1408, https://doi.org/10.5194/amt-12-1393-2019, 2019b. a, b, c
Zhou, M., Ni, Q., Cai, Z., Langerock, B., Jiang, J., Che, K., Wang, J., Nan, W., Liu, Y., and Wang, P.: Ground-Based Atmospheric CO2, CH4, and CO Column Measurements at Golmud in the Qinghai Tibetan Plateau and Comparisons with TROPOMI/S5P Satellite Observations, Adv. Atmos. Sci., 40, 223–234, https://doi.org/10.1007/s00376-022-2116-0, 2023. a