the Creative Commons Attribution 4.0 License.
the Creative Commons Attribution 4.0 License.
 | 22 Nov 2023
A new reference-quality precipitation gauge wind shield
John Kochendorfer
Tilden P. Meyers
Mark E. Hall
Scott D. Landolt
Justin Lentz
Howard J. Diamond
Gauge-based precipitation measurements suffer from undercatch due to the effects of wind, with solid-precipitation measurements especially susceptible to such errors. When it is snowing and windy, unshielded precipitation gauges can catch less than half of the amount of precipitation of a gauge that is protected from the wind. For this reason, the US Climate Reference Network (USCRN) developed a large, double-layer, wooden wind shield called the Small Double Fence Intercomparison Reference (SDFIR). In past studies, the SDFIR has been demonstrated to be the most effective wind shield in use in any weather or climate network, reducing solid-precipitation undercatch to less than 10 % in wind speeds up to 8 m s−1. However, the wooden SDFIRs are subject to decay, they are difficult to replace and maintain, and they hinder access to maintaining the gauge. For these reasons, a new precipitation gauge wind shield called the Low Porosity Double Fence (LPDF) has been developed for use in the USCRN. Tested at three separate sites chosen for prevalent windy and snowy weather, the precipitation measurements recorded within the LPDF compared well to the SDFIR. After more than 2 years of measurements, the total precipitation recorded by the LPDF at each individual site differed by ±1.2 %, and the total LPDF accumulation from all sites was 0.03 % greater than the SDFIR accumulation. For the measurement of solid precipitation, the LPDF-shielded measurements were statistically indistinguishable from those in the SDFIR shield, and the time series of accumulation from precipitation gauges shielded by the SDFIR and the LPDF were almost identical. This new wind shield is much smaller and easier to install and maintain than any other reference-quality wind shield for the measurement of solid precipitation and may be of use within other meteorological, hydrological, and climate networks. It could also serve as a secondary reference precipitation measurement for precipitation intercomparisons held in remote locations where the construction of a full-sized Double Fence Intercomparison Reference (DFIR) shield is not feasible.
- Article
(1334 KB) - Full-text XML
-
Supplement
(408 KB) - BibTeX
- EndNote


No weather phenomenon is as destructive or as essential in all seasons as precipitation: in abundance it causes floods, avalanches, and landslides, and a lack of precipitation can lead to devastating droughts by impacting the source of drinking water and growing food. Since all terrestrial life relies on it, humans have been developing methods to best quantify, understand, and predict precipitation for thousands of years. Accurate precipitation measurements are required for the development and improvement of modern climate, weather, and hydrologic models (e.g., Buisán et al., 2020; Køltzow et al., 2020; Larson and Peck, 1974; Widmann and Bretherton, 2000; Tapiador et al., 2017; Rozante et al., 2010). Reference-quality precipitation measurements are required in order to calibrate and validate precipitation products such as remotely sensed and gridded precipitation measurements (Chen et al., 2008; Rajulapati et al., 2020; Adam and Lettenmaier, 2003; Henn et al., 2018; Kluver et al., 2016; Newman et al., 2015; Shi et al., 2017; Larson and Peck, 1974; Poméon et al., 2017). The detection and monitoring of precipitation trends associated with climate change also require reliable and bias-free precipitation measurements. Because the phase of precipitation is predicted to change in some regions (e.g., Trenberth et al., 2003; Trenberth, 2011; Prein and Heymsfield, 2020; Coats, 2010), measurement errors that are affected by precipitation phase may be especially difficult to disentangle from changes in precipitation amount as Earth's climate warms. This makes it especially important to record accurate, climate-quality measurements of precipitation amount, irrespective of whether the precipitation occurs as rain (liquid precipitation), mixed phase, or snow (solid precipitation).
Solid-precipitation measurements are subject to significant undercatch caused by wind (Goodison, 1978; Golubev, 1986; Sevruk et al., 1991; Groisman and Legates, 1994; Yang et al., 1995, 1999; Goodison et al., 1998; Macdonald and Pomeroy, 2007; Smith, 2009; Nitu et al., 2019; Cauteruccio et al., 2021; Leroux et al., 2021; Thériault et al., 2021). Because pit gauges cannot be used in areas where it snows, wind shields are used to help reduce the wind speed around the gauge and improve the accuracy of precipitation measurements (e.g., Alter, 1937; Groisman et al., 1991; Nitu et al., 2019; Baghapour and Sullivan, 2017; Colli et al., 2016; Wolff et al., 2015; Goodison, 1978). The World Meteorological Organization Solid Precipitation Intercomparison Experiment (WMO-SPICE) established a new reference for the automated measurement of solid precipitation, which includes a large, three-layered wind shield around the gauge called the Double Fence Automated Reference (DFAR). The DFAR is essentially comprised of the same two outer fences as the Double Fence Intercomparison Reference (DFIR) shield originally designed for manual solid-precipitation reference measurements, with a single Alter shield and an automated weighing gauge at its center (Nitu, 2012; Rasmussen et al., 2012; Nitu et al., 2019). Testing performed as part of the WMO-SPICE also demonstrated that wind shielding is the most significant determinant of solid-precipitation errors, with different weighing gauges performing similarly when they were similarly shielded (or unshielded) (Kochendorfer et al., 2018; Nitu et al., 2019). This testing included unshielded gauges and gauges shielded within the US Climate Reference Network (USCRN) Small DFIR (SDFIR), the Belfort double Alter shield, the double Alter shield, and the single Alter shield. In addition to establishing and quantifying the importance of shielding, this work indicates that the porosity of the wind shield plays an important role in determining its efficacy. Based on wind break and turbulence research (Wilson, 1985, 1987; Hagen and Skidmore, 1971; Heisler and Dewalle, 1988; Středová et al., 2012), Belfort designed a new double Alter shield with a porosity of 25 %, which is in contrast to the 50 % porosity of most other wind shields. Due to its lowered porosity, the Belfort double Alter was found to be almost as effective as the much larger SDFIR (Kochendorfer et al., 2017b). Porosity is defined as the amount of the surface area that is open, allowing air to pass through, divided by the total amount of surface area.
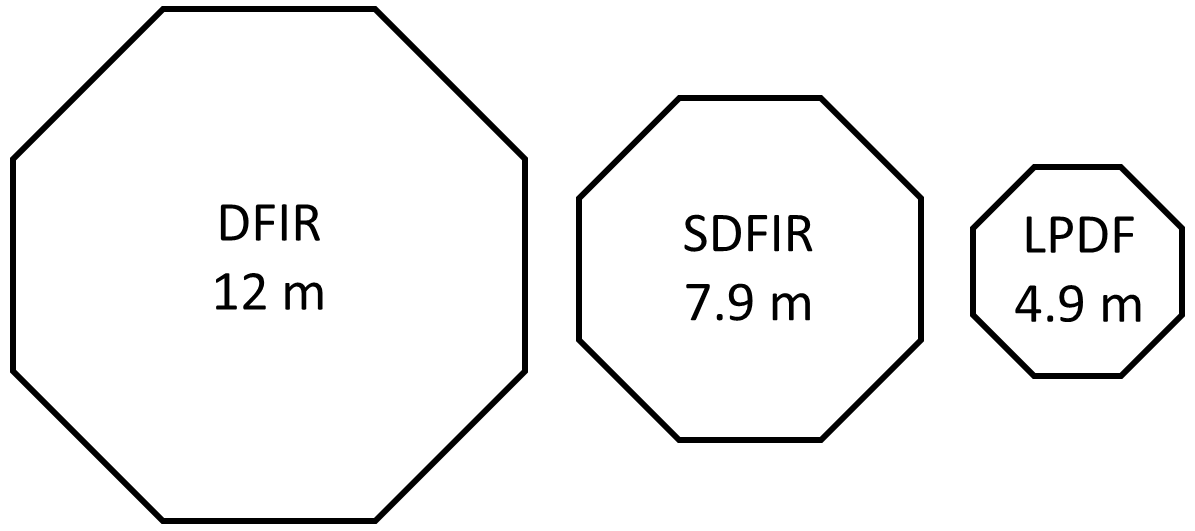
Due to the size (12 m diameter and 3 m tall) of the Double Fence Intercomparison Reference (DFIR) wind shield and the amount of material and labor required to construct and maintain it, this shield is not appropriate for use in operational networks. For this reason, a smaller version of the DFIR, called the Small DFIR (SDFIR) is used by the USCRN at 114 sites throughout the contiguous United States. Like the DFIR shield, the outer two shields of the SDFIR are made of wood and require regular maintenance. The USCRN was established over 20 years ago (Diamond et al., 2013), and many of the SDFIRs within the network now need to be replaced. Due to its size (7.9 m diameter), the SDFIR is also difficult to install in remote locations.
Based on the success of the Belfort double Alter wind shield, which is only 2 m in diameter, we hypothesized that a shield with a lowered porosity that is smaller than the SDFIR but larger than the Belfort double Alter would be as effective as the SDFIR. To validate this hypothesis, a smaller (4.9 m diameter) Low Porosity Double Fence (LPDF) wind shield was designed and tested for use in the USCRN. The LPDF wind shield is described here, along with the results of a field experiment designed to evaluate the LPDF at three separate sites.
2.1 Shield design
In addition to decreasing the size of the wind shield, other goals for the new shield design included using more durable materials, reducing the amount of labor required to construct the shield, and allowing easier access to the precipitation gauge within the shield. Improving gauge access was a priority in part because each USCRN site is typically only visited annually for routine maintenance, so volunteer site hosts are occasionally called upon to partially drain the 600 or 1000 mm capacity Geonor weighing gauges (model T-200B-3, Geonor, Norway) employed by the network.
The new LPDF is constructed using chain link gate panels, which are widely available throughout the United States. Each panel is 1.83 m wide and 1.22 m tall. Eight panels are used to form the outer octagonal shield, and four panels are used to create a concentric square inner shield (Fig. 1). Some of the construction details such as bracing are still under development, but the Supplement lists the LPDF components, including the standard chain link hardware used to mount the fixed panels and the two hinged openable panels (one on the interior fence and one on the exterior fence). The clamps used to attach the panels to the supporting poles should be reinforced using metal screws to keep the clamps in place and prevent movement in high winds.
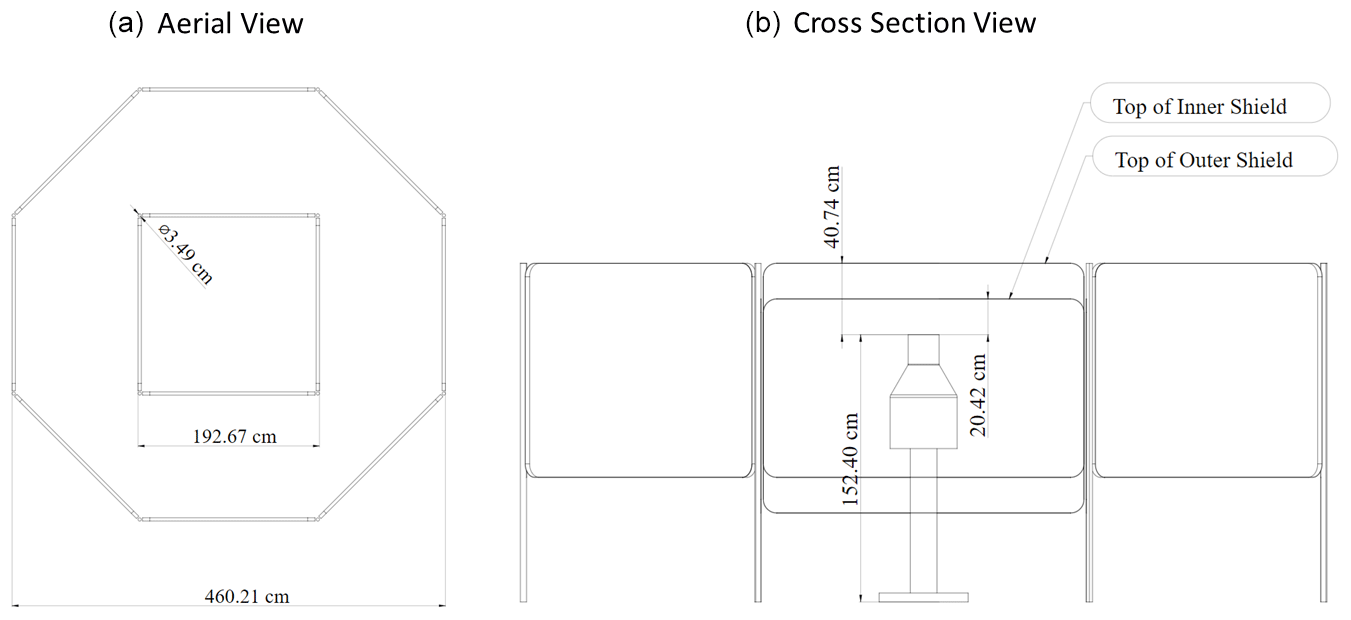
Figure 1Drawings of the LPDF showing the aerial or plan view (a) and the cross-section view (b).
Unlike the SDFIR and the DFIR, which have a single Alter shield within two outer wooden fences, the LPDF is comprised of only two shields. A comparison of the relative sizes of the outer shields of the DFIR, SDFIR, and LPDF is shown in Fig. 2. Vinyl slats (EZ slats®, Just Slats Co.) typically used to provide privacy and/or wind protection are installed within the chain link fence panels, providing a porosity of ∼25, with the porosity calculated as the amount of fence panel surface area that was open (i.e., not blocked by slats and wire), divided by the total surface area of the fence panel. The slats were installed per the manufacturer's instructions and easily slid and locked into place. They are vinyl and designed to be outdoors indefinitely, so weathering is not anticipated to be a significant problem. Furthermore, the slats can be replaced easily if they are damaged or subject to weathering over time. The panels are mounted on galvanized poles using clamps designed for chain link fencing and gates, and one panel on both the inner and outer shields is hinged to allow easy access to the gauge.
The height of the top of the inner shield is 0.20 m above the gauge inlet, and the top of the outer shield is 0.40 m above the gauge inlet. Shield heights are determined with respect to the top of the precipitation gauge inlet, because gauge inlet heights vary depending on the maximum snow depth and the prevalence of drifting snow at a site. The design of the LPDF allows it to be raised much more easily than a DFIR or SDFIR; raising a shield is necessary when its initial installation height is too low, allowing drifting snow to accumulate within and around the shield. The panels are attached to the poles by clamps that can be loosened, allowing the height of the fence to be adjusted by sliding the loosened clamps up or down the poles. Once the desired height is reached, the clamps are tightened and additionally screwed in place. No concrete was used in the construction of the LPDF – the shield was designed to sit on top of the soil surface. Each pole supporting the panels sits on a reinforced 30 cm×30 cm section of Geoblock. This is in part to ease installation, but it also minimizes the effects of frost heave. After the LPDF is assembled and braced, it is rigid and is held in place by short guy wires anchored in the ground. Anchors can be concreted in place or screw-in anchors can be used, and the anchoring methods may require modification based on the ground structure at the site.
The cost of the materials to build the LPDF is low (∼USD 2000), but it is higher than the cost of materials required to build the larger SDFIR (∼USD 1400). However, the amount of labor required to build the LPDF (8 h) is significantly less than is needed for the SDFIR (24 h). The cost of SDFIR maintenance (which varies considerably by site), eventual disposal (entailing ∼900 kg of wood), and replacement must also be considered when comparing the use of the two shields.
2.2 Site selection
In addition to evaluating the LPDF at the National Center for Atmospheric Research (NCAR) Marshall, CO Field Instrument Test Site (Rasmussen et al., 2012; Baghapour et al., 2017), two USCRN sites with SDFIRs were chosen to test the LPDF. These USCRN sites were selected for their potentially high wind speeds and frequent solid precipitation. The goal was to select sites where precipitation gauge shielding was critical to accurate precipitation measurement. Because of this, differences found between the LPDF- and the SDFIR-shielded measurements at the selected USCRN sites would presumably be much larger than found at more representative sites.
Using 8 years (2008–2016) of daily precipitation, air temperature, and wind speed data recorded from USCRN stations, all 114 USCRN sites with SDFIRs were evaluated for potential inclusion in this study. “Snow days” were defined as days with a total precipitation greater than 1 mm and mean air temperature less than −2 ∘C. For every site, the total annual amount of solid precipitation recorded during snow days was calculated, along with the number of snow days per year. In addition, the number of days with mean wind speeds greater than 3.5 m s−1 was determined. Based on the daily statistics, the wind speed distribution of the snow days was also plotted for 10 of the snowiest and windiest USCRN sites (e.g., Fig. 3, which also includes the wind speed distribution of the Marshall, CO, site). The Boulder, CO, USCRN site (40.0353∘ N, −105.5407∘ W) was chosen as the location to test the LPDF at, as it was clearly the windiest and snowiest site in the network. The Chatham, MI, site (46.3346∘ N, 86.9199∘ W) was selected as the second USCRN site due to the prevalence of all phases of precipitation, relatively high wind speeds during snowfall, and the opportunity to test the LPDF in a different, non-alpine climate. A map (Fig. 4) shows the location of the sites, and photos of all three sites are shown in Fig. 5.
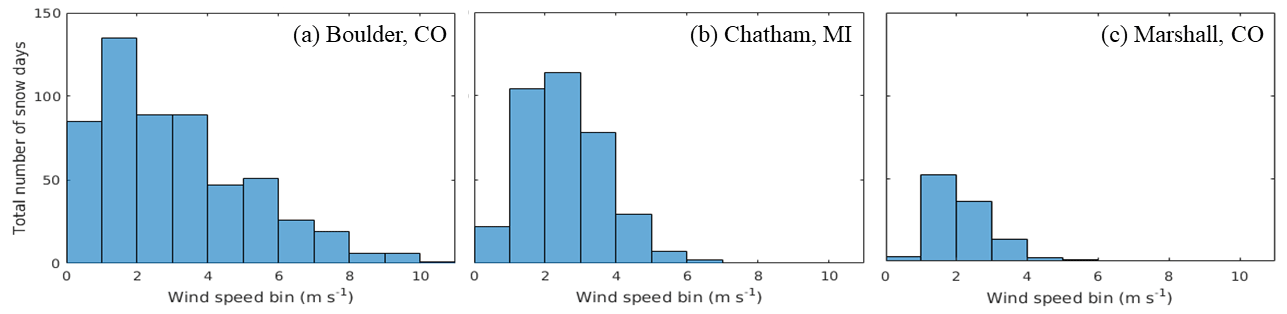
Figure 3Wind speed distribution of snow days at the Boulder, CO (a); Chatham, MI (b); and Marshall, CO (c) sites.
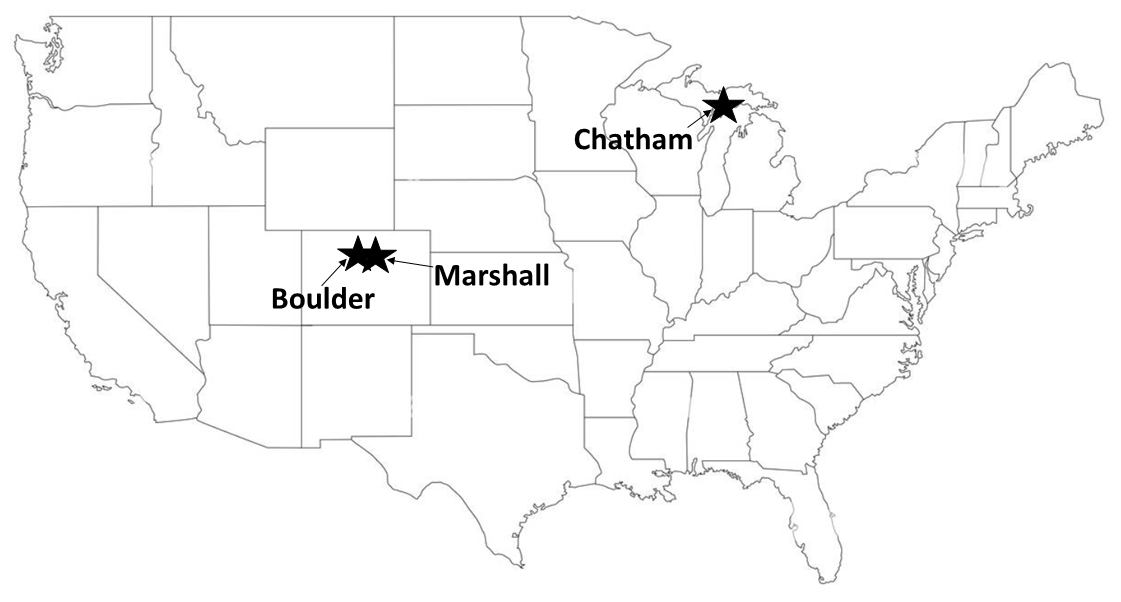
Figure 4US map showing the locations of LPDF evaluation sites.
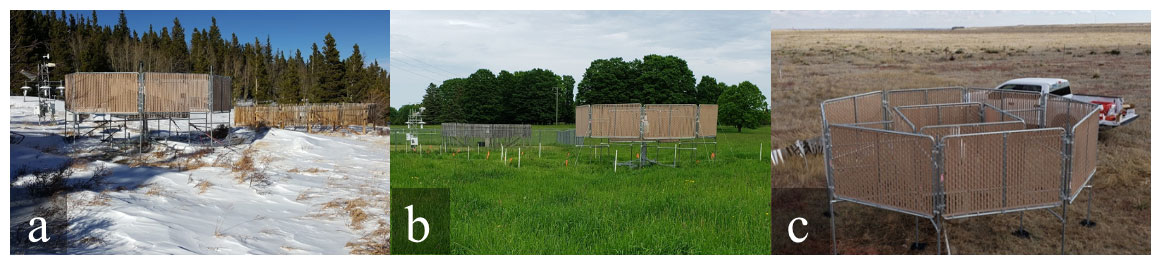
Figure 5Photos of Low Porosity Double Fence (LPDF) shields installed at the Boulder, CO (a); Chatham, MI (b); and Marshall, CO (c) sites.
2.3 Installation
An LPDF was installed at the Marshall, CO, test bed on 1 November 2018. This site was unique among the three LPDF evaluation sites because in addition to a SDFIR shield, it also included a DFIR. The LPDF at the Boulder, CO, USCRN site was installed on 28 November 2018, with the gauge inlet at a height of 1.77 m. The LPDF at the Chatham, MI, site was installed on 23 June 2019 at a height of 2.13 m. Each of the two USCRN sites had pre-existing SDFIR shields. All of the shields included in this evaluation contained heated Geonor weighing gauges (Geonor T-200B-3 All-weather precipitation gauge), with one exception; at the Marshall, CO, site, there were several periods when the Geonor gauge within the DFIR malfunctioned, and measurements from an OTT-Pluvio2 within a separate DFIR shield were used instead. These two precipitation gauge models were previously shown to be interchangeable, and they were both used as references throughout the WMO-SPICE (Nitu et al., 2019). All of the Geonors were 600 mm capacity gauges, with the exception of the gauge within the Chatham, MI, SDFIR, which had a 1000 mm capacity. Each of the Geonors also had three vibrating wires. All of the precipitation gauge orifices were heated, with the heaters activating only when the inlet temperature and the air temperature were both less than 2 ∘C.
Among the pre-existing meteorological measurements available at the Marshall, CO, test bed, the sensor measurements included in the present evaluation included three fan-aspirated (Met One Instruments, 076B Fan Aspirated Radiation Shield) air temperature measurements (Thermometrics Corporation, PT1000 Platinum Resistance Thermometer) at a height of 1.5 m and wind speed measurements (RM Young Model 05103 Wind Monitor) at heights of 3 and 10 m. The Chatham, MI, and Boulder, CO, USCRN sites included the same fan-aspirated triplicate air temperature measurements as the Marshall, CO, test bed, which were also installed at a height of 1.5 m. The USCRN sites also included a cup anemometer wind speed measurement (Met-One Model 014A) at a height of 1.5 m. For a more in-depth description of the standard suite of USCRN measurements see Diamond et al. (2013). In addition to the LPDF, Geonor weighing gauge, data logger, and communications, an additional wind speed sensor (RM Young Model 05103 Wind Monitor) was installed at a height of 3.25 m at both USCRN sites for this intercomparison. All of the sites also included a precipitation detector (Vaisala Rain Detector, DRD11A), which was used to help identify periods when precipitation occurred.
The Marshall, CO, measurements were recorded every minute, and the Chatham, MI, and Boulder, CO, measurements were recorded every 5 min. All of the measurements were transferred and archived in near-real time. The Marshall, CO, field evaluation concluded on 26 September 2021; the Chatham, MI, field evaluation concluded on 19 December 2021; and the Boulder, CO, field evaluation concluded on 20 August 2021.
2.4 Data analysis
2.4.1 Multi-seasonal and hourly precipitation
Due to the effects of gauge uncertainty and small-scale spatial variability in precipitation, comparisons of hourly and even daily precipitation measurements recorded at the same site are subject to significant and seemingly random differences (Nitu et al., 2019). When comparing identical precipitation measurement configurations, these differences are not typically associated with significant biases. Uncertainties in 30 or 60 min measurements make it more difficult to identify and quantify the biases associated with different types of wind shielding, particularly for measurements of solid precipitation, most of which are associated with low precipitation rates (<0.5 mm h−1) (Kochendorfer et al., 2017b). For hydrology research, seasonal accumulations of solid precipitation are used to estimate the snow water equivalent of snow on the ground and to predict runoff and streamflow (Fekete et al., 2004; Boudhar et al., 2009). Because of this, longer-term seasonal- or annual-scale accumulations can be preferable for the comparison of different precipitation measurements and adjustments (e.g., Smith et al., 2020), and they have even been used to develop and optimize precipitation gauge transfer functions (Kochendorfer et al., 2020). The comparison of long-term accumulations is in many ways a more demanding and representative test of different precipitation measurement configurations than the comparison of hourly or daily precipitation accumulations. For all of these reasons, time series of precipitation measurements accumulated over the entire length of the field campaign were central to the LPDF evaluations.
Long-term seasonal and annual precipitation accumulations were derived from the available gauge depths. The long-term precipitation accumulation time series must be developed with care, as the effects of evaporation, gauge maintenance, and missing data must be identified and treated appropriately. Typically, the three separate Geonor gauge depths recorded in each gauge were averaged together, but in some cases an individual noisy Geonor vibrating wire would be excluded from the average. During periods when the OTT-Pluvio2 data were used, only one precipitation gauge depth measurement was available. The 1 min (Marshall, CO) or 5 min (Boulder, CO, and Chatham, MI) gauge depth measurements were then examined to identify unrealistically large changes. In addition, based on the precipitation detector measurements, changes in gauge depth that did not coincide with precipitation were discarded. At the Marshall, CO, test bed several measurement gaps occurred due to a loss of communications between the data loggers and NCAR. During these periods the gauges continued to function and accumulate precipitation but without outputting their data in real time. These data were processed carefully so that the accumulated precipitation that occurred when the gauge data were not recorded was included in the long-term accumulations. This was possible in part because all of the gauges had oil added to their collection buckets to minimize the evaporation of water and anti-freeze, so it was not necessary to identify and remove periods when evaporation was occurring. The long-term precipitation accumulations were used to evaluate the total accumulation and the seasonal course of precipitation accumulated within the different shield configurations. These long-term accumulations included all phases of precipitation.
In addition, hourly precipitation was calculated as the hourly change in the gauge depth. The mean hourly air temperature (Tair) was used to estimate the precipitation phase; every hourly precipitation measurement was classified as solid (), mixed (), or liquid () based on Tair (Wolff et al., 2015; Kochendorfer et al., 2017b). The hourly data were used to estimate separate phase-specific long-term accumulations for solid, mixed, and liquid precipitation.
The hourly solid- and mixed-precipitation measurements were also used to evaluate the LPDF catch efficiency (CE), which was the ratio of the amount of precipitation recorded by the LPDF-shielded gauge to the amount of precipitation recorded by the SDFIR-shielded gauge. For the evaluation of CE, when the mean hourly wind speed was unavailable (or equal to 0.0 m s−1) the hourly precipitation values were discarded. In addition, hourly precipitation values less than 0.25 mm were discarded; when either the LPDF-shielded gauge or the SDFIR-shielded gauge measured less than 0.25 mm in an hour, the entire hour was excluded from the CE analysis. This was done mainly due to the well-documented increases in CE uncertainty for small values of precipitation (e.g., Kochendorfer et al., 2017b; Nitu et al., 2019).
2.4.2 Wind speed
At the Marshall, CO, test bed site, the gauge height wind speed (Ugh) was estimated using the 2 m height wind speed. During periods when this was equal to 0.0 m s−1 the 3 m height wind speed was used, with the 3 m height wind speed divided by 1.09 to approximate Ugh. The value of 1.09 was determined by comparing the available 3 and 2 m wind speeds during precipitation. At the two USCRN stations, the cup anemometer measurements recorded at a height of 1.5 m were used to estimate Ugh based on a logarithmic vertical wind profile, the inlet heights, and the relationship between the 1.5 and 3.05 m high anemometer measurements (e.g., Kochendorfer et al., 2017a; Thom, 1972). Using this approach, the wind speed at the inlet height was estimated to equal the 1.5 m height wind speed multiplied by 1.01 and 1.08 at the Boulder, CO, and Chatham, MI, sites, respectively; these values differed from each other due to the exposure of the two sites and the installation height of the LPDF-shielded Geonors (1.77 m at Boulder, CO, and 2.13 m at Chatham, MI). Average wind speeds were recorded every 1 min (Marshall, CO) or 5 min (Boulder, CO, and Chatham, MI) and averaged in 1 h intervals to correspond to the precipitation measurements.
2.4.3 Blowing snow
The effects of blowing snow were apparent in the preliminary CE evaluations, with CE values becoming unpredictable above gauge height wind speeds of 9 or 10 m s−1. Many factors affect the threshold wind speed above which snow on the ground breaks loose, initiating saltation and lofting. Among them are the liquid water content of the snow and the age of the snowpack (Schmidt, 1980, 1982). Values of the 10 m height wind speed threshold therefore vary widely, ranging from 4 to 14 m s−1 on the Canadian Prairies, but for dry snow they average about 8 m s−1 (Li and Pomeroy, 1997). For the present work, to conserve as many of the available measurements as possible, hourly precipitation measurements with Ugh>9 m s−1 were excluded from the comparisons of the different precipitation gauge configurations.
3.1 Marshall, CO, precipitation test bed
At the Marshall, CO, precipitation test bed, the LPDF- and the SDFIR-shielded measurements compared well to each other. The time series of the LPDF and SDFIR accumulations were almost indistinguishable from each other (Fig. 6). Over the entire 2.9-year long intercomparison, the total LPDF precipitation differed by only 1 % (−12 mm) of the total SDFIR precipitation. As expected, the DFIR-shielded gauge (1309 mm) accumulated a little more than the LPDF- and the SDFIR-shielded gauges (1253 mm and 1265 mm, respectively).
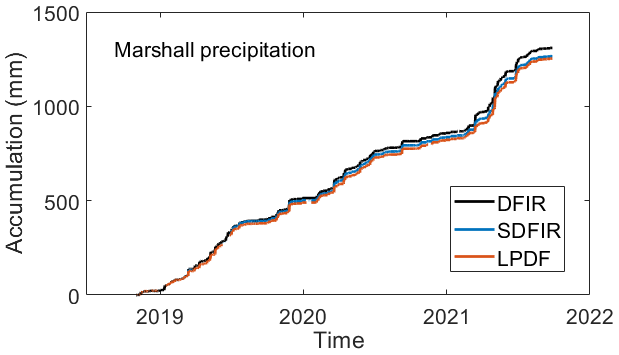
Figure 6Accumulation of all precipitation from the DFIR, SDFIR, and LPDF at the Marshall, CO, precipitation test bed.
As described in the Methods section, hourly precipitation accumulations were also classified as solid, mixed, or liquid and accumulated separately over the course of the field experiment. The Marshall, CO, DFIR measurements were excluded from these phase-specific accumulations because they were not always available at the same time as the other two gauges, and their inclusion compromised the LPDF evaluation by diminishing the number of hours of precipitation available for comparison to the SDFIR; because the LPDF is under evaluation as a replacement for the SDFIR within the USCRN, the comparison to the SDFIR was prioritized over the comparison to the DFIR. The time series of the solid- and mixed-precipitation accumulations demonstrated excellent agreement between the LPDF- and the SDFIR-shielded gauges (Fig. 7a and b). As expected, the liquid-precipitation measurements also compared well to each other (Fig. 7c).
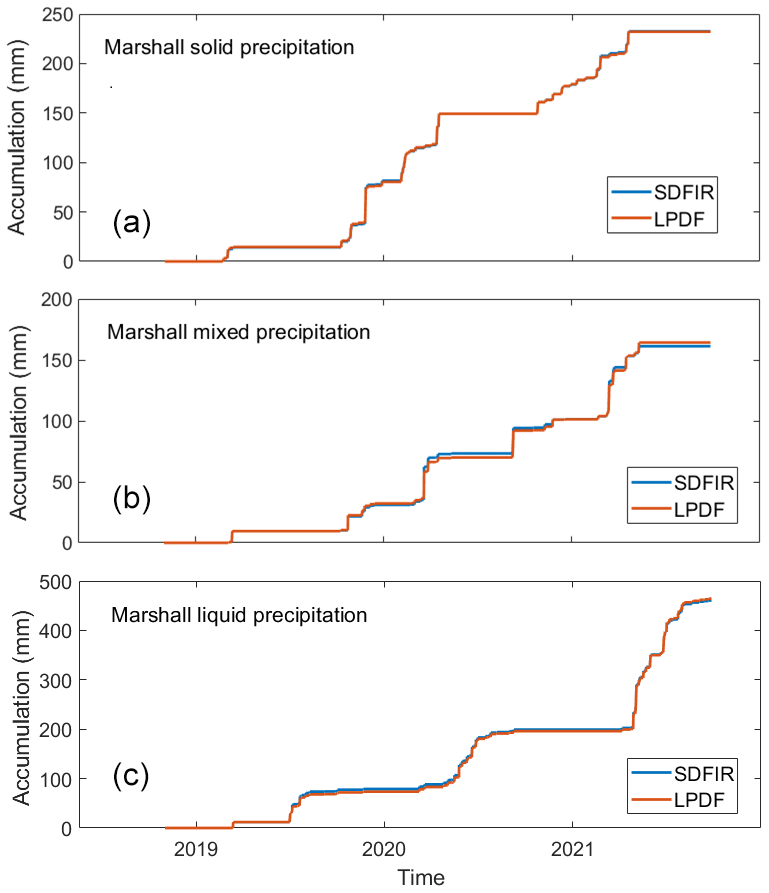
Figure 7Accumulated solid (a), mixed (b), and liquid (c) precipitation from the SDFIR and LPDF at the Marshall, CO, precipitation.
The total of the phase-discriminated accumulations (Fig. 7) was less than the total of all the precipitation shown in Fig. 6. This is because the phase-discriminated measurements were subject to the additional requirement that the LPDF and the SDFIR gauges were recording simultaneously, and communication lapses at the Marshall, CO, site caused data losses in the hourly phase-discriminated measurements that did not affect the total accumulations.
3.2 Chatham, MI, USCRN site
Subject to 2600 mm of precipitation, the LPDF- and SDFIR-shielded precipitation measurements at the Chatham, MI, site compared quite well to each other. The total accumulations differed by only 1.01 % (29 mm), and they tracked each other closely throughout the measurement campaign (Fig. 8). When separated by precipitation type, the solid, mixed, and liquid-precipitation accumulations also compared quite closely to each other (Fig. 9). Most of the precipitation at this site occurred as rain, but it still experienced a significant amount of solid precipitation; the total amounts of solid precipitation captured within the LPDF (348 mm) and the SDFIR (352 mm) were well within the margin of error for identical precipitation measurement configurations (Kochendorfer et al., 2017b).
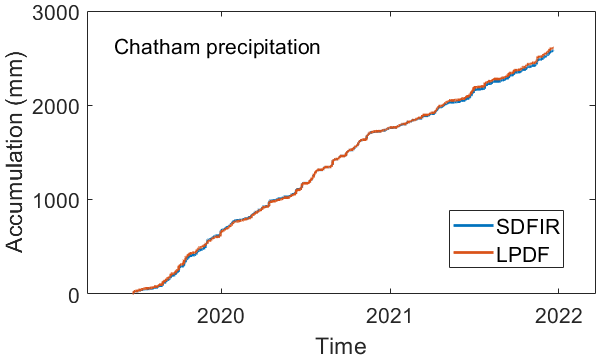
Figure 8Accumulation of all precipitation from the SDFIR and LPDF at the Chatham, MI, USCRN site.
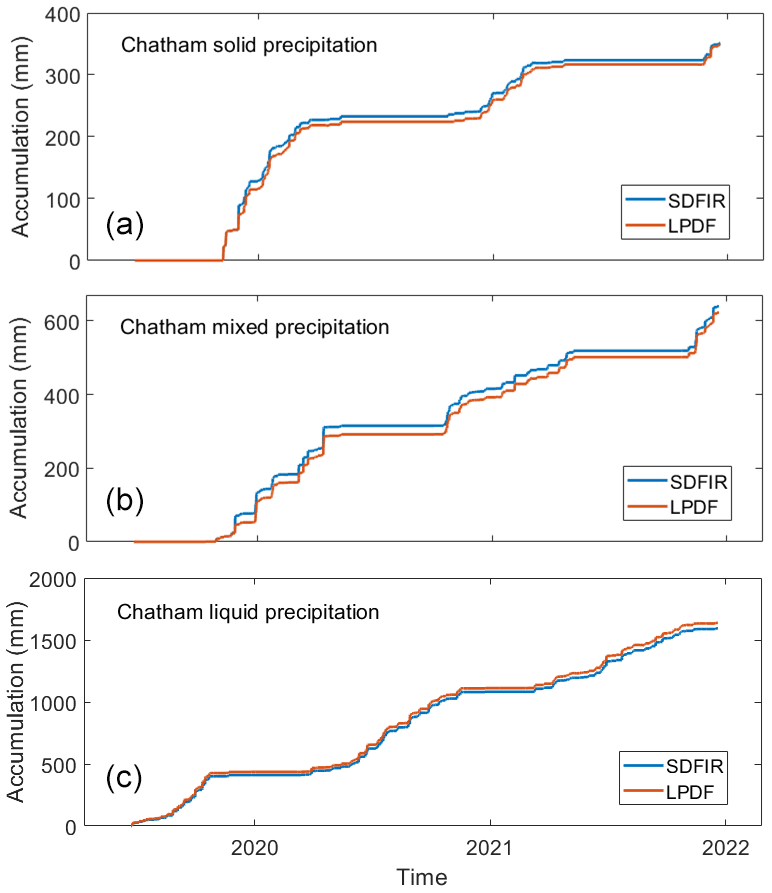
Figure 9Accumulated solid (a), mixed (b), and liquid (c) precipitation from the SDFIR and LPDF at the Chatham, MI, USCRN site.
3.3 Boulder, CO, USCRN site
As predicted from the site selection analysis, the Boulder, CO, site experienced a significant amount of solid precipitation. About 65 % of the total accumulation of all precipitation types at the site was from solid precipitation. Despite these demanding conditions, the total accumulations from the LPDF (1786 mm) and SDFIR (1802 mm) were within 1 % of each other. The solid-precipitation accumulation from the LPDF (1147 mm) was 1.4 % less than the SDFIR accumulation (1164 mm) at this site, and this was mainly due to one event early in 2019 when the LPDF was clogged with wet snow, decreasing its porosity and potentially its performance. The time series of the precipitation accumulations from the LPDF mimicked that of the SDFIR quite well (Figs. 10 and 11). The site did not experience a lot of mixed precipitation, but the LPDF measurements of mixed precipitation compared quite well to the corresponding SDFIR measurements (Fig. 11b).
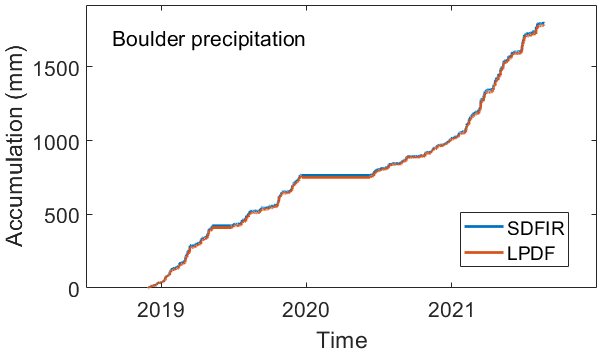
Figure 10Accumulation of all precipitation from the SDFIR and LPDF at the Boulder, CO, USCRN site.
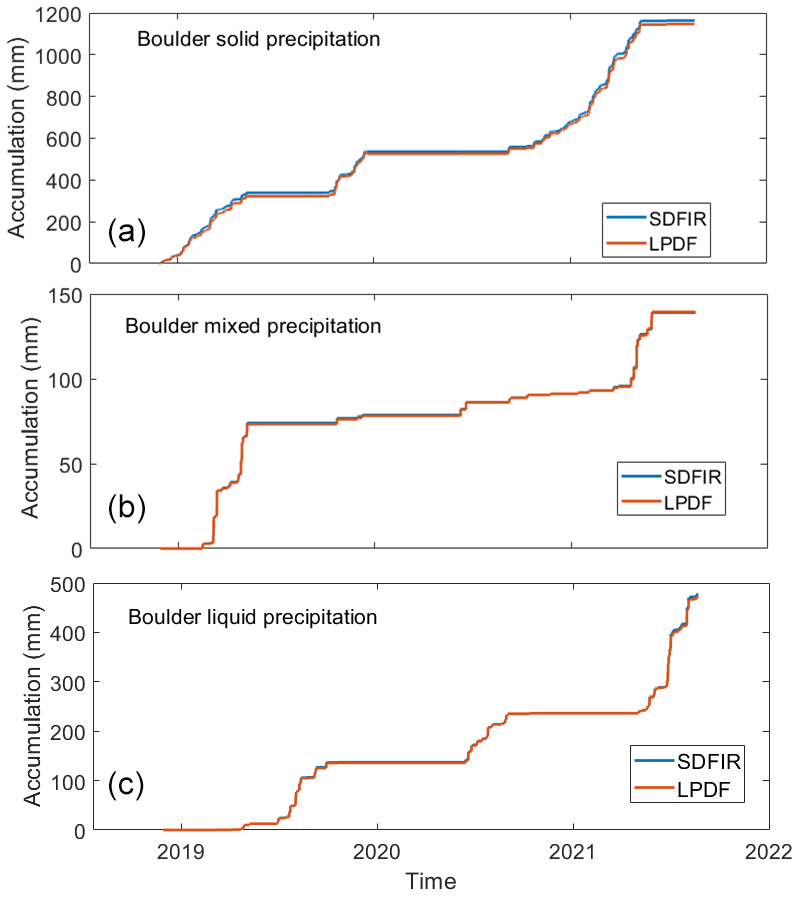
Figure 11Accumulated solid (a), mixed (b), and liquid (c) precipitation from the SDFIR and LPDF at the Boulder, CO, USCRN site.
3.4 Catch efficiency
Measurements of the LPDF CE from all three sites were evaluated for their dependence on wind speed. The hourly CE measurements from all three sites were pooled together, and the mixed- and solid-precipitation measurements were evaluated separately. Despite the well-documented effects of CE uncertainty (e.g., Hoover et al., 2021), the CE measurements for both solid and mixed precipitation were close to 1.0 even at high wind speeds, indicating that the CE of the LPDF does not decrease significantly with wind speed (Figs. 12 and 13). Additionally, a t test was performed to determine the probability that the differences between the hourly SDFIR- and LPDF-shielded solid-precipitation measurements had a mean equal to zero. The t test determined that there was no difference between the two datasets, with a 5 % significance level and a 0.21 % probability that the results were incorrect.
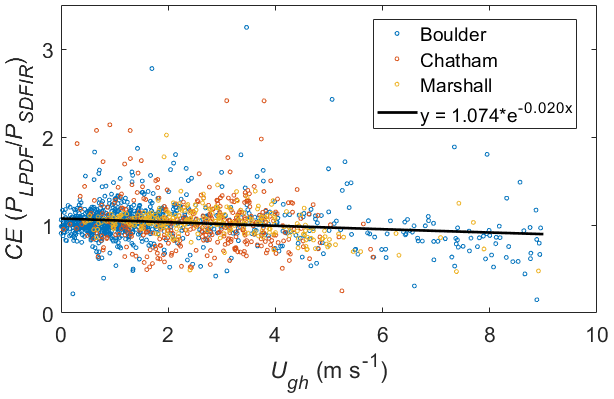
Figure 12Solid-precipitation catch efficiency (CE) plotted against the gauge height wind speed (Ugh).
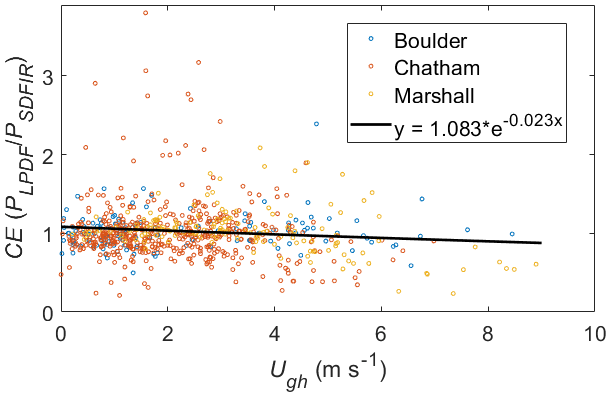
Figure 13Mixed-precipitation catch efficiency (CE) plotted against the gauge height wind speed (Ugh).
A new wind shield, the LPDF, has been designed for reference-quality precipitation measurements. It is smaller than both the original DFIR and the SDFIR used in the USCRN. The LPDF is also constructed out of more durable materials than the wooden DFIR and SDFIR shields. For all of these reasons, the LPDF is more suitable for long-term and remote measurements. Spanning over 2 years of measurements at three separate sites, the hourly LPDF- and SDFIR-shielded measurements of solid precipitation were statistically indistinguishable from each other, and the long-term precipitation accumulations were remarkably similar to each other. Based on these analyses, the LPDF performed well and can be used to replace the SDFIR without introducing any new biases or inhomogeneities.
Future research may reveal alternative designs that result in improved results while simultaneously meeting different design constraints. We did not have the resources to test different variants of the shield; testing many variants of the shield over the course of several years at three different sites would be a significant undertaking. Instead, we designed and tested a shield that met the USCRN design criteria using materials that are widely available in the United States. A full examination of the effects of porosity, slat width, shield size, and shield height (with respect to the gauge inlet) was beyond the scope of this paper. However, clearly the results of the evaluation of the LPDF and the Belfort double Alter shield indicate that this is a worthwhile subject of more in-depth study. Numerical modeling could also be used to aid in initial efforts to experiment with different wind shield designs.
All data are available on request.
The supplement related to this article is available online at: https://doi.org/10.5194/amt-16-5647-2023-supplement.
JK helped lead the intercomparison, prepared the results, and wrote most of the manuscript. He also helped design the LPDF. TPM helped discover the effects of porosity on wind shield efficacy, helped conceive of and design the LPDF, and helped complete the manuscript. MEH built the first LPDF, helped conceive of and design the LPDF, and coordinated the construction of the LPDFs and the maintenance of the measurements at the two USCRN sites. SDL was responsible for the measurements at the Marshall, CO, site and for the installation of many of the wind shields and sensors at the Marshall, CO, site. He also contributed to the writing of the manuscript. JL supported the Marshall, CO, measurements and created the technical drawing of the LPDF. HJD provided guidance, support, and insight throughout the project. He also contributed to the writing of the manuscript.
The contact author has declared that none of the authors has any competing interests.
Publisher's note: Copernicus Publications remains neutral with regard to jurisdictional claims made in the text, published maps, institutional affiliations, or any other geographical representation in this paper. While Copernicus Publications makes every effort to include appropriate place names, the final responsibility lies with the authors.
Alec Sczepanski from the University of North Dakota provided guidance on the relationship between blowing snow and wind speed.
This paper was edited by Maximilian Maahn and reviewed by two anonymous referees.
Adam, J. C. and Lettenmaier, D. P.: Adjustment of global gridded precipitation for systematic bias, J. Geophys. Res.-Atmos., 108, 4257, https://doi.org/10.1029/2002jd002499, 2003.
Alter, J. C.: Shielded storage precipitaiton gages, Mon. Weather Rev., 65, 262–265, https://doi.org/10.1175/1520-0493(1937)65<262:SSPG>2.0.CO;2, 1937.
Baghapour, B. and Sullivan, P. E.: A CFD study of the influence of turbulence on undercatch of precipitation gauges, Atmos. Res., 197, 265–276, https://doi.org/10.1016/j.atmosres.2017.07.008, 2017.
Baghapour, B., Wei, C., and Sullivan, P. E.: Numerical simulation of wind-induced turbulence over precipitation gauges, Atmos. Res., 189, 82–98, https://doi.org/10.1016/j.atmosres.2017.01.016, 2017.
Boudhar, A., Hanich, L., Boulet, G., Duchemin, B., Berjamy, B., and Chehbouni, A.: Evaluation of the Snowmelt Runoff Model in the Moroccan High Atlas Mountains using two snow-cover estimates, Hydrolog. Sci. J., 54, 1094–1113, https://doi.org/10.1623/hysj.54.6.1094, 2009.
Buisán, S. T., Smith, C. D., Ross, A., Kochendorfer, J., Collado, J. L., Alastrué, J., Wolff, M., Roulet, Y.-A., Earle, M. E., Laine, T., Rasmussen, R., and Nitu, R.: The potential for uncertainty in Numerical Weather Prediction model verification when using solid precipitation observations, Atmos. Sci. Lett., 21, e976, https://doi.org/10.1002/asl.976, 2020.
Cauteruccio, A., Brambilla, E., Stagnaro, M., Lanza, L. G., and Rocchi, D.: Experimental evidence of the wind-induced bias of precipitation gauges using particle image velocimetry and particle tracking in the wind tunnel, J. Hydrol., 600, 126690, https://doi.org/10.1016/j.jhydrol.2021.126690, 2021.
Chen, M., Shi, W., Xie, P., Silva, V. B. S., Kousky, V. E., Higgins, R. W., and Janowiak, J. E.: Assessing objective techniques for gauge-based analyses of global daily precipitation, J. Geophys. Res.-Atmos., 113, D04110, https://doi.org/10.1029/2007JD009132, 2008.
Coats, R.: Climate change in the Tahoe basin: regional trends, impacts and drivers, Climatic Change, 102, 435–466, 2010.
Colli, M., Lanza, L. G., Rasmussen, R., and Theriault, J. M.: The Collection Efficiency of Shielded and Unshielded Precipitation Gauges. Part II: Modeling Particle Trajectories, J. Hydrometeorol., 17, 245–255, https://doi.org/10.1175/jhm-d-15-0011.1, 2016.
Diamond, H. J., Karl, T. R., Palecki, M. A., Baker, C. B., Bell, J. E., Leeper, R. D., Easterling, D. R., Lawrimore, J. H., Meyers, T. P., Helfert, M. R., Goodge, G., and Thorne, P. W.: U. S. Climate Reference Network after One Decade of Operations: Status and Assessment, B. Am. Meteorol. Soc., 94, 485–498, https://doi.org/10.1175/BAMS-D-12-00170.1, 2013.
Fekete, B. M., Vörösmarty, C. J., Roads, J. O., and Willmott, C. J.: Uncertainties in Precipitation and Their Impacts on Runoff Estimates, J. Climate, 17, 294–304, https://doi.org/10.1175/1520-0442(2004)017<0294:Uipati>2.0.Co;2, 2004.
Golubev, V. S.: On the problem of standard condition for precipitation gauge installation, Proc. International Workshop on the Correction of Precipitation Measurements, Geneva, Switzerland, 1–3 April 1985, OCLC No.: 17383737, 57–59, 1986.
Goodison, B., Louie, P., and Yang, D.: The WMO solid precipitation measurement intercomparison, World Meteorological Organization, WMO/TD-No. 872, 65–70, https://library.wmo.int/idurl/4/28336 (last access: 18 November 2023), 1998.
Goodison, B. E.: Accuracy of Canadian snow gauge measurements, J. Appl. Meteorol., 17, 1542–1548, https://doi.org/10.1175/1520-0450(1978)017<1542:aocsgm>2.0.co;2, 1978.
Groisman, P. Y. and Legates, D. R.: The accuracy of United-Sates precipitaiton data, B. Am. Meteorol. Soc., 75, 215–227, https://doi.org/10.1175/1520-0477(1994)075<0215:taousp>2.0.co;2, 1994.
Groisman, P. Y., Koknaeva, V. V., Belokrylova, T. A., and Karl, T. R.: Overcoming biases of precipitation measurement – a history of the USSR experience, B. Am. Meteorol. Soc., 72, 1725–1733, https://doi.org/10.1175/1520-0477(1991)072<1725:obopma>2.0.co;2, 1991.
Hagen, L. and Skidmore, E.: Windbreak Drag as Influenced by Porosity, T. ASAE, 14, 0464–0465, https://doi.org/10.13031/2013.38315, 1971.
Heisler, G. M. and Dewalle, D. R.: 2. Effects of windbreak structure on wind flow, Agr. Ecosyst. Environ., 22–23, 41–69, https://doi.org/10.1016/0167-8809(88)90007-2, 1988.
Henn, B., Newman, A. J., Livneh, B., Daly, C., and Lundquist, J. D.: An assessment of differences in gridded precipitation datasets in complex terrain, J. Hydrol., 556, 1205–1219, https://doi.org/10.1016/j.jhydrol.2017.03.008, 2018.
Hoover, J., Earle, M. E., Joe, P. I., and Sullivan, P. E.: Unshielded precipitation gauge collection efficiency with wind speed and hydrometeor fall velocity, Hydrol. Earth Syst. Sci., 25, 5473–5491, https://doi.org/10.5194/hess-25-5473-2021, 2021.
Kluver, D., Mote, T., Leathers, D., Henderson, G. R., Chan, W., and Robinson, D. A.: Creation and Validation of a Comprehensive 1∘ by 1∘ Daily Gridded North American Dataset for 1900–2009: Snowfall, J. Atmos. Ocean. Tech., 33, 857–871, https://doi.org/10.1175/jtech-d-15-0027.1, 2016.
Kochendorfer, J., Nitu, R., Wolff, M., Mekis, E., Rasmussen, R., Baker, B., Earle, M. E., Reverdin, A., Wong, K., Smith, C. D., Yang, D., Roulet, Y.-A., Buisan, S., Laine, T., Lee, G., Aceituno, J. L. C., Alastrué, J., Isaksen, K., Meyers, T., Brækkan, R., Landolt, S., Jachcik, A., and Poikonen, A.: Analysis of single-Alter-shielded and unshielded measurements of mixed and solid precipitation from WMO-SPICE, Hydrol. Earth Syst. Sci., 21, 3525–3542, https://doi.org/10.5194/hess-21-3525-2017, 2017a.
Kochendorfer, J., Rasmussen, R., Wolff, M., Baker, B., Hall, M. E., Meyers, T., Landolt, S., Jachcik, A., Isaksen, K., Brækkan, R., and Leeper, R.: The quantification and correction of wind-induced precipitation measurement errors, Hydrol. Earth Syst. Sci., 21, 1973–1989, https://doi.org/10.5194/hess-21-1973-2017, 2017b.
Kochendorfer, J., Nitu, R., Wolff, M., Mekis, E., Rasmussen, R., Baker, B., Earle, M. E., Reverdin, A., Wong, K., Smith, C. D., Yang, D., Roulet, Y.-A., Meyers, T., Buisan, S., Isaksen, K., Brækkan, R., Landolt, S., and Jachcik, A.: Testing and development of transfer functions for weighing precipitation gauges in WMO-SPICE, Hydrol. Earth Syst. Sci., 22, 1437–1452, https://doi.org/10.5194/hess-22-1437-2018, 2018.
Kochendorfer, J., Earle, M. E., Hodyss, D., Reverdin, A., Roulet, Y.-A., Nitu, R., Rasmussen, R., Landolt, S., Buisán, S., and Laine, T.: Undercatch Adjustments for Tipping-Bucket Gauge Measurements of Solid Precipitation, J. Hydrometeorol., 21, 1193–1205, https://doi.org/10.1175/jhm-d-19-0256.1, 2020.
Køltzow, M., Casati, B., Haiden, T., and Valkonen, T.: Verification of Solid Precipitation Forecasts from Numerical Weather Prediction Models in Norway, Weather Forecast., 35, 2279–2292, https://doi.org/10.1175/waf-d-20-0060.1, 2020.
Larson, L. W. and Peck, E. L.: Accuracy of Precipitation Measurements for Hydrologic Modeling, Water Resour. Res., 10, 857–863, https://doi.org/10.1029/WR010i004p00857, 1974.
Leroux, N. R., Thériault, J. M., and Rasmussen, R.: Improvement of Snowgauge Collection Efficiency through a knowledge of solid precipitation fallspeed, J. Hydrometeorol., 22, 997–1006, https://doi.org/10.1175/jhm-d-20-0147.1, 2021.
Li, L. and Pomeroy, J.: Estimates of Threshold Wind Speeds for Snow Transport Using Meteorological Data, J. Appl. Meteorol., 36, 205–213, https://doi.org/10.1175/1520-0450(1997)036<0205:EOTWSF>2.0.CO;2, 1997.
Macdonald, J. and Pomeroy, J.: Gauge undercatch of two common snowfall gauges in a prairie environment, in: Proceedings of the 64th Eastern Snow Conference, St. John's, NL, Canada, 29 May–1 June 2007, 119–126, ISBN 0-920081-29-0, 2007.
Newman, A. J., Clark, M. P., Craig, J., Nijssen, B., Wood, A., Gutmann, E., Mizukami, N., Brekke, L., and Arnold, J. R.: Gridded ensemble precipitation and temperature estimates for the contiguous United States, J. Hydrometeorol., 16, 2481–2500, https://doi.org/10.1175/JHM-D-15-0026.1, 2015.
Nitu, R.: Proposed configuration of intercomparison sites and of the field references, Second session of the international organization committee for the WMO solid precipitation intercomparison experiment, World Meteorological Organization, Boulder, CO, United States, 11–15 June 2012, p. 74, https://library.wmo.int/idurl/4/48574 (last access: 18 November 2023), 2012.
Nitu, R., Roulet, Y.-A., Wolff, M., Earle, M., Reverdin, A., Smith, C., Kochendorfer, J., Morin, S., Rasmussen, R., Wong, K., Alastrué, J., Arnold, L., Baker, B., Buisán, S., Collado, J. L., Colli, M., Collins, B., Gaydos, A., Hannula, H.-R., Hoover, J., Joe, P., Kontu, A., Laine, T., Lanza, L., Lanzinger, E., Lee, G., Lejeune, Y., Leppänen, L., Mekis, E., Panel, J.-M., Poikonen, A., Ryu, S., Sabatini, F., Theriault, J., Yang, D., Genthon, C., van den Heuvel, F., Hirasawa, N., Konishi, H., Motoyoshi, H., Nakai, S., Nishimura, K., Senese, A., and Yamashita, K.: WMO Solid Precipitation Intercomparison Experiment (SPICE) (2012–2015), WMO, IOM No. 131, https://library.wmo.int/idurl/4/56317 (last access: 18 November 2023), 2019.
Poméon, T., Jackisch, D., and Diekkrüger, B.: Evaluating the performance of remotely sensed and reanalysed precipitation data over West Africa using HBV light, J. Hydrol., 547, 222–235, https://doi.org/10.1016/j.jhydrol.2017.01.055, 2017.
Prein, A. F. and Heymsfield, A. J.: Increased melting level height impacts surface precipitation phase and intensity, Nat. Clim. Change, 10, 771–776, 2020.
Rajulapati, C. R., Papalexiou, S. M., Clark, M. P., Razavi, S., Tang, G., and Pomeroy, J. W.: Assessment of Extremes in Global Precipitation Products: How Reliable Are They?, J. Hydrometeorol., 21, 2855–2873, https://doi.org/10.1175/jhm-d-20-0040.1, 2020.
Rasmussen, R., Baker, B., Kochendorfer, J., Meyers, T., Landolt, S., Fischer, A. P., Black, J., Theriault, J. M., Kucera, P., Gochis, D., Smith, C., Nitu, R., Hall, M., Ikeda, K., and Gutmann, E.: How Well Are We Measuring Snow: The NOAA/FAA/NCAR Winter Precipitation Test Bed, B. Am. Meteorol. Soc., 93, 811–829, https://doi.org/10.1175/bams-d-11-00052.1, 2012.
Rozante, J. R., Moreira, D. S., de Goncalves, L. G. G., and Vila, D. A.: Combining TRMM and surface observations of precipitation: technique and validation over South America, Weather Forecast., 25, 885–894, 2010.
Schmidt, R. A.: Threshold Wind-Speeds and Elastic Impact in Snow Transport, J. Glaciol., 26, 453–467, https://doi.org/10.3189/S0022143000010972, 1980.
Schmidt, R. A.: Vertical profiles of wind speed, snow concentration, and humidity in blowing snow, Bound.-Lay. Meteorol., 23, 223–246, https://doi.org/10.1007/bf00123299, 1982.
Sevruk, B., Hertig, J.-A., and Spiess, R.: The effect of a precipitation gauge orifice rim on the wind field deformation as investigated in a wind tunnel, Atmos. Environ. A-Gen., 25, 1173–1179, 1991.
Shi, H., Li, T., and Wei, J.: Evaluation of the gridded CRU TS precipitation dataset with the point raingauge records over the Three-River Headwaters Region, J. Hydrol., 548, 322–332, https://doi.org/10.1016/j.jhydrol.2017.03.017, 2017.
Smith, C. D.: The relationship between snowfall catch efficiency and wind speed for the Geonor T-200B precipitation gauge utilizing various wind shield configurations, Proceedings 77th Western Snow Conference, Canmore, Alberta, 20–23 April 2009, 115–121, https://doi.org/10.1007/978-3-540-73936-4_10 2009.
Smith, C. D., Ross, A., Kochendorfer, J., Earle, M. E., Wolff, M., Buisán, S., Roulet, Y.-A., and Laine, T.: Evaluation of the WMO Solid Precipitation Intercomparison Experiment (SPICE) transfer functions for adjusting the wind bias in solid precipitation measurements, Hydrol. Earth Syst. Sci., 24, 4025–4043, https://doi.org/10.5194/hess-24-4025-2020, 2020.
Středová, H., Podhrázská, J., Litschmann, T., Středa, T., and Rožnovský, J.: Aerodynamic Parameters of Windbreak Based on its Optical Porosity, Contributions to Geophysics and Geodesy, 42, 213–226, https://doi.org/10.2478/v10126-012-0008-5, 2012.
Tapiador, F. J., Navarro, A., Levizzani, V., García-Ortega, E., Huffman, G. J., Kidd, C., Kucera, P. A., Kummerow, C. D., Masunaga, H., Petersen, W. A., Roca, R., Sánchez, J. L., Tao, W. K., and Turk, F. J.: Global precipitation measurements for validating climate models, Atmos. Res., 197, 1–20, https://doi.org/10.1016/j.atmosres.2017.06.021, 2017.
Thériault, J. M., Leroux, N. R., and Rasmussen, R. M.: Improvement of Solid Precipitation Measurements Using a Hotplate Precipitation Gauge, J. Hydrometeorol., 22, 877–885, https://doi.org/10.1175/jhm-d-20-0168.1, 2021.
Thom, A. S.: Momentum, mass and heat exchange of vegetation, Q. J. Roy. Meteor. Soc., 98, 124–134, https://doi.org/10.1002/qj.49709841510, 1972.
Trenberth, K. E.: Changes in precipitation with climate change, Clim. Res., 47, 123–138, 2011.
Trenberth, K. E., Dai, A., Rasmussen, R. M., and Parsons, D. B.: The changing character of precipitation, B. Am. Meteorol. Soc., 84, 1205–1217, https://doi.org/10.1175/bams-84-9-1205, 2003.
Widmann, M. and Bretherton, C. S.: Validation of Mesoscale Precipitation in the NCEP Reanalysis Using a New Gridcell Dataset for the Northwestern United States, J. Climate, 13, 1936–1950, https://doi.org/10.1175/1520-0442(2000)013<1936:vompit>2.0.co;2, 2000.
Wilson, J. D.: Numerical studies of flow through a windbreak, J. Wind Eng. Ind. Aerod., 21, 119–154, https://doi.org/10.1016/0167-6105(85)90001-7, 1985.
Wilson, J. D.: On the choice of a windbreak porosity profile, Bound.-Lay. Meteorol., 38, 37–49, https://doi.org/10.1007/BF00121553, 1987.
Wolff, M. A., Isaksen, K., Petersen-Øverleir, A., Ødemark, K., Reitan, T., and Brækkan, R.: Derivation of a new continuous adjustment function for correcting wind-induced loss of solid precipitation: results of a Norwegian field study, Hydrol. Earth Syst. Sci., 19, 951–967, https://doi.org/10.5194/hess-19-951-2015, 2015.
Yang, D. Q., Goodison, B. E., Metcalfe, J. R., Golubev, V. S., Elomaa, E., Gunther, T., Bates, R., Pangburn, T., Hanson, C. L., Emerson, D., Copaciu, V., and Miklovic, J.: Accuracy of Tretyakov precipitation gauge: Result of WMO intercomparison, Hydrol. Process., 9, 877–895, https://doi.org/10.1002/hyp.3360090805, 1995.
Yang, D. Q., Goodison, B. E., Metcalfe, J. R., Louie, P., Leavesley, G., Emerson, D., Hanson, C. L., Golubev, V. S., Elomaa, E., Gunther, T., Pangburn, T., Kang, E., and Milkovic, J.: Quantification of precipitation measurement discontinuity induced by wind shields on national gauges, Water Resour. Res., 35, 491–508, https://doi.org/10.1029/1998wr900042, 1999.