the Creative Commons Attribution 4.0 License.
the Creative Commons Attribution 4.0 License.
 | 30 Jan 2023
Theoretical assessment of the ability of the MicroCarb satellite city-scan observing mode to estimate urban CO2 emissions
Kai Wu
Denis Jouglet
Liang Feng
We assess the theoretical capability of the upcoming France–UK MicroCarb satellite, which has a city-scan observing mode, to determine integrated urban emissions of carbon dioxide (CO2). To achieve this we report results from a series of closed-loop numerical experiments that use an atmospheric transport model with anthropogenic and biogenic fluxes to determine the corresponding changes in atmospheric CO2 column, accounting for changes in measurement coverage due to cloud loading. We use a maximum a posteriori inverse method to infer the CO2 fluxes based on the measurements and the a priori information. Using an urban CO2 inversion system, we explore the relative performance of alternative two-sweep and three-sweep city observing strategies to quantify CO2 emissions over the cities of Paris and London in different months when biospheric fluxes vary in magnitude. We find that both the two-sweep and three-sweep observing modes are able to reduce a priori flux errors by 20 %–40 % over Paris and London. The three-sweep observing strategy, which generally outperforms the two-sweep mode by virtue of its wider scan area that typically yields more cloud-free observations, can retrieve the total emissions of the truth within 7 % over Paris and 21 % over London. The performance of the limited-domain city-mode observing strategies is sensitive to cloud coverage and particularly sensitive to the prevailing wind direction. We also find that seasonal photosynthetic uptake of CO2 by the urban biosphere weakens atmospheric CO2 gradients across both cities, thereby reducing the sensitivity of urban CO2 enhancements and subsequently compromising the ability of MicroCarb to reduce bias in estimating urban CO2 emissions. This suggests that additional trace gases co-emitted with anthropogenic CO2 emissions, but unaffected by the land biosphere, are needed to quantify sub-city scale CO2 emissions during months when the urban biosphere is particularly active.
- Article
(13556 KB) - Full-text XML
- BibTeX
- EndNote


Urban areas account for about 70 % of global energy-related anthropogenic CO2 emissions (including Scope 1 and 2 emissions), while they comprise only 3 % of Earth’s surface area (Turnbull et al., 2018). Recent studies have empirically related city-scale CO2 emission estimates with urban population density (Wu et al., 2020; Yang et al., 2020). With urbanization rates projected to increase to 68 % by 2050 (Chaouad and Verzeroli, 2018), urban CO2 emissions have become a focus of emission mitigation efforts to limit global warming to 1.5 ∘C above pre-industrial levels and to achieve carbon neutrality by 2050 (Masson-Delmotte et al., 2018, 2021). Satellite-based measurements of atmospheric CO2 are dedicated to support the monitoring of surface CO2 fluxes (Crisp et al., 2017). Here, we explore the theoretical potential of the city-scan observing mode of the upcoming France–UK MicroCarb satellite to quantify urban emissions of CO2.
Quantifying urban-scale greenhouse gas emissions is currently limited to individual and networks of ground-based (in situ) instruments (Lopez et al., 2013; Bréon et al., 2015; Turner et al., 2016; Helfter et al., 2016; Lauvaux et al., 2016; Davis et al., 2017; Verhulst et al., 2017; Sargent et al., 2018; Kunik et al., 2019) and to sensors on mobile platforms (Pitt et al., 2019; Mallia et al., 2020; Ionov et al., 2021; Makarova et al., 2021). Emissions of CO2 from the largest emission hotspots, including cities, can already be observed along individual orbits using existing low-Earth-orbiting satellites of GOSAT (Yokota et al., 2009; Morino et al., 2011; Kort et al., 2012; Janardanan et al., 2016) and OCO-2 (Hakkarainen et al., 2016; Schwandner et al., 2017; Crisp et al., 2017; Eldering et al., 2017; Chevallier et al., 2022) either directly as , the atmospheric column-averaged dry-air mole fraction of CO2 (Ye et al., 2020; Zheng et al., 2020; Lei et al., 2021), or via monitoring tropospheric NO2 (Konovalov et al., 2016; Goldberg et al., 2019; Reuter et al., 2019; Hakkarainen et al., 2021; Park et al., 2021; Finch et al., 2022). The main advantage of using data from low-Earth-orbiting satellites is their global coverage, subject to cloud cover (Massie et al., 2017) and elevated atmospheric aerosol loading (O'Dell et al., 2018). The current generation of satellites employ instruments with small ground footprints and relatively long revisit time (3 to 16 d), resulting in a low probability of sampling clear skies over individual cities. This capability continues with GOSAT-2 (Suto et al., 2021) and TanSat (Cai et al., 2014; Liu et al., 2018; Yang et al., 2018) and in the near future by the Copernicus CO2 Monitoring Mission that includes cross-track sampling (Kuhlmann et al., 2020; Sierk et al., 2021) that will increase the probability of clear-sky data being collected over cities.
The NASA Orbiting Carbon Observatory 3 (OCO-3), installed on the International Space Station in 2019 (Eldering et al., 2019; Taylor et al., 2020), has an external pointing mirror assembly that facilitates Snapshot Area Maps (SAMs) that describe fore and aft sampling of a limited area of interest on the ground such as a large city. Early analysis of OCO-3 data over the Los Angeles Basin (Kiel et al., 2021) revealed intra-urban gradients, reflecting the mosaic of emission types and magnitudes across the region, thereby illustrating the value of these sampling approaches. Using a limited number of SAMs, this study reported elevated values have a median value of 2 ppm, ranging from 0 to 6 ppm. A recent study has combined OCO-3 data with carbon monoxide (CO) retrievals from the TROPOspheric Monitoring Instrument over Los Angeles and Shanghai, Baotou, and Zibo in China to attribute and contrast intra-city gradients of CO2 using inferred estimates of combustion efficiency (D. Wu et al., 2022).
MicroCarb, due for launch in early 2024, will be the first European satellite dedicated to measuring atmospheric CO2 with sufficient precision to detect the changes associated with surface fluxes across the world (https://microcarb.cnes.fr/en, last access: 19 January 2023). Data from MicroCarb will ensure continuity with other satellites collecting atmospheric CO2 from low Earth orbit, e.g. GOSAT, OCO-2, TanSat, and GOSAT-2. The instrument is a passive spectrometer that uses an echelle grating to disperse reflected sunlight (Pascal et al., 2017) into four short-wave infrared bands sensitive to changes in atmospheric CO2 (1.61 and 2.06 µm) and O2 (0.76 and 1.27 µm) used as a proxy for the atmospheric path length accounting for changes in, for example, orography, aerosols, and clouds (Bertaux et al., 2020). MicroCarb will employ three observing modes: (1) nadir measurements over land, which have a ground pixel size of 4.5 km (across track) × 8.9 km (along track); (2) sunglint measurements over oceans and lakes with a variable footprint size but with the same order of magnitude as the nadir configuration; and (3) city-mode observations that collect a series of fore and aft measurements of atmospheric CO2 at a spatial resolution of 2.25 km × 2.25 km as the satellite passes over a target region, e.g. a city or a calibration reference point collocated with a ground-based remote sensing instrument, e.g. Total Carbon Column Observing Network (TCCON) (Wunch et al., 2011, 2017).
We use a series of closed-loop numerical experiments (i.e. observing system simulation experiments) to evaluate the theoretical ability of MicroCarb city-mode measurements to estimate integrated city-wide CO2 emissions over Paris and London, considering a realistic instrument noise model. We quantify the impacts of different observing modes, random measurement errors, cloud cover, and biogenic fluxes on inferring urban fossil fuel CO2 emissions using synthetic MicroCarb observations. We report results in three different months, accounting for differences in cloud cover, prevailing wind patterns, and biospheric CO2 fluxes. We also compare the performance of two proposed sampling strategies being considered by MicroCarb involving two and three measurement sweeps across a city. In the next section, we describe our modelling approach and provide details about how we simulate synthetic MicroCarb observations. In Sect. 3, we report our results, including a sensitivity analysis. We conclude the study in Sect. 4, including a discussion of our results and how we anticipate they will be used when MicroCarb is launched.
Here we describe the MicroCarb instrument and its city-mode sampling strategy, as well as the individual components of the closed-loop numerical experiments (Fig. 1) focused on Paris and London during April, July, and December 2018.
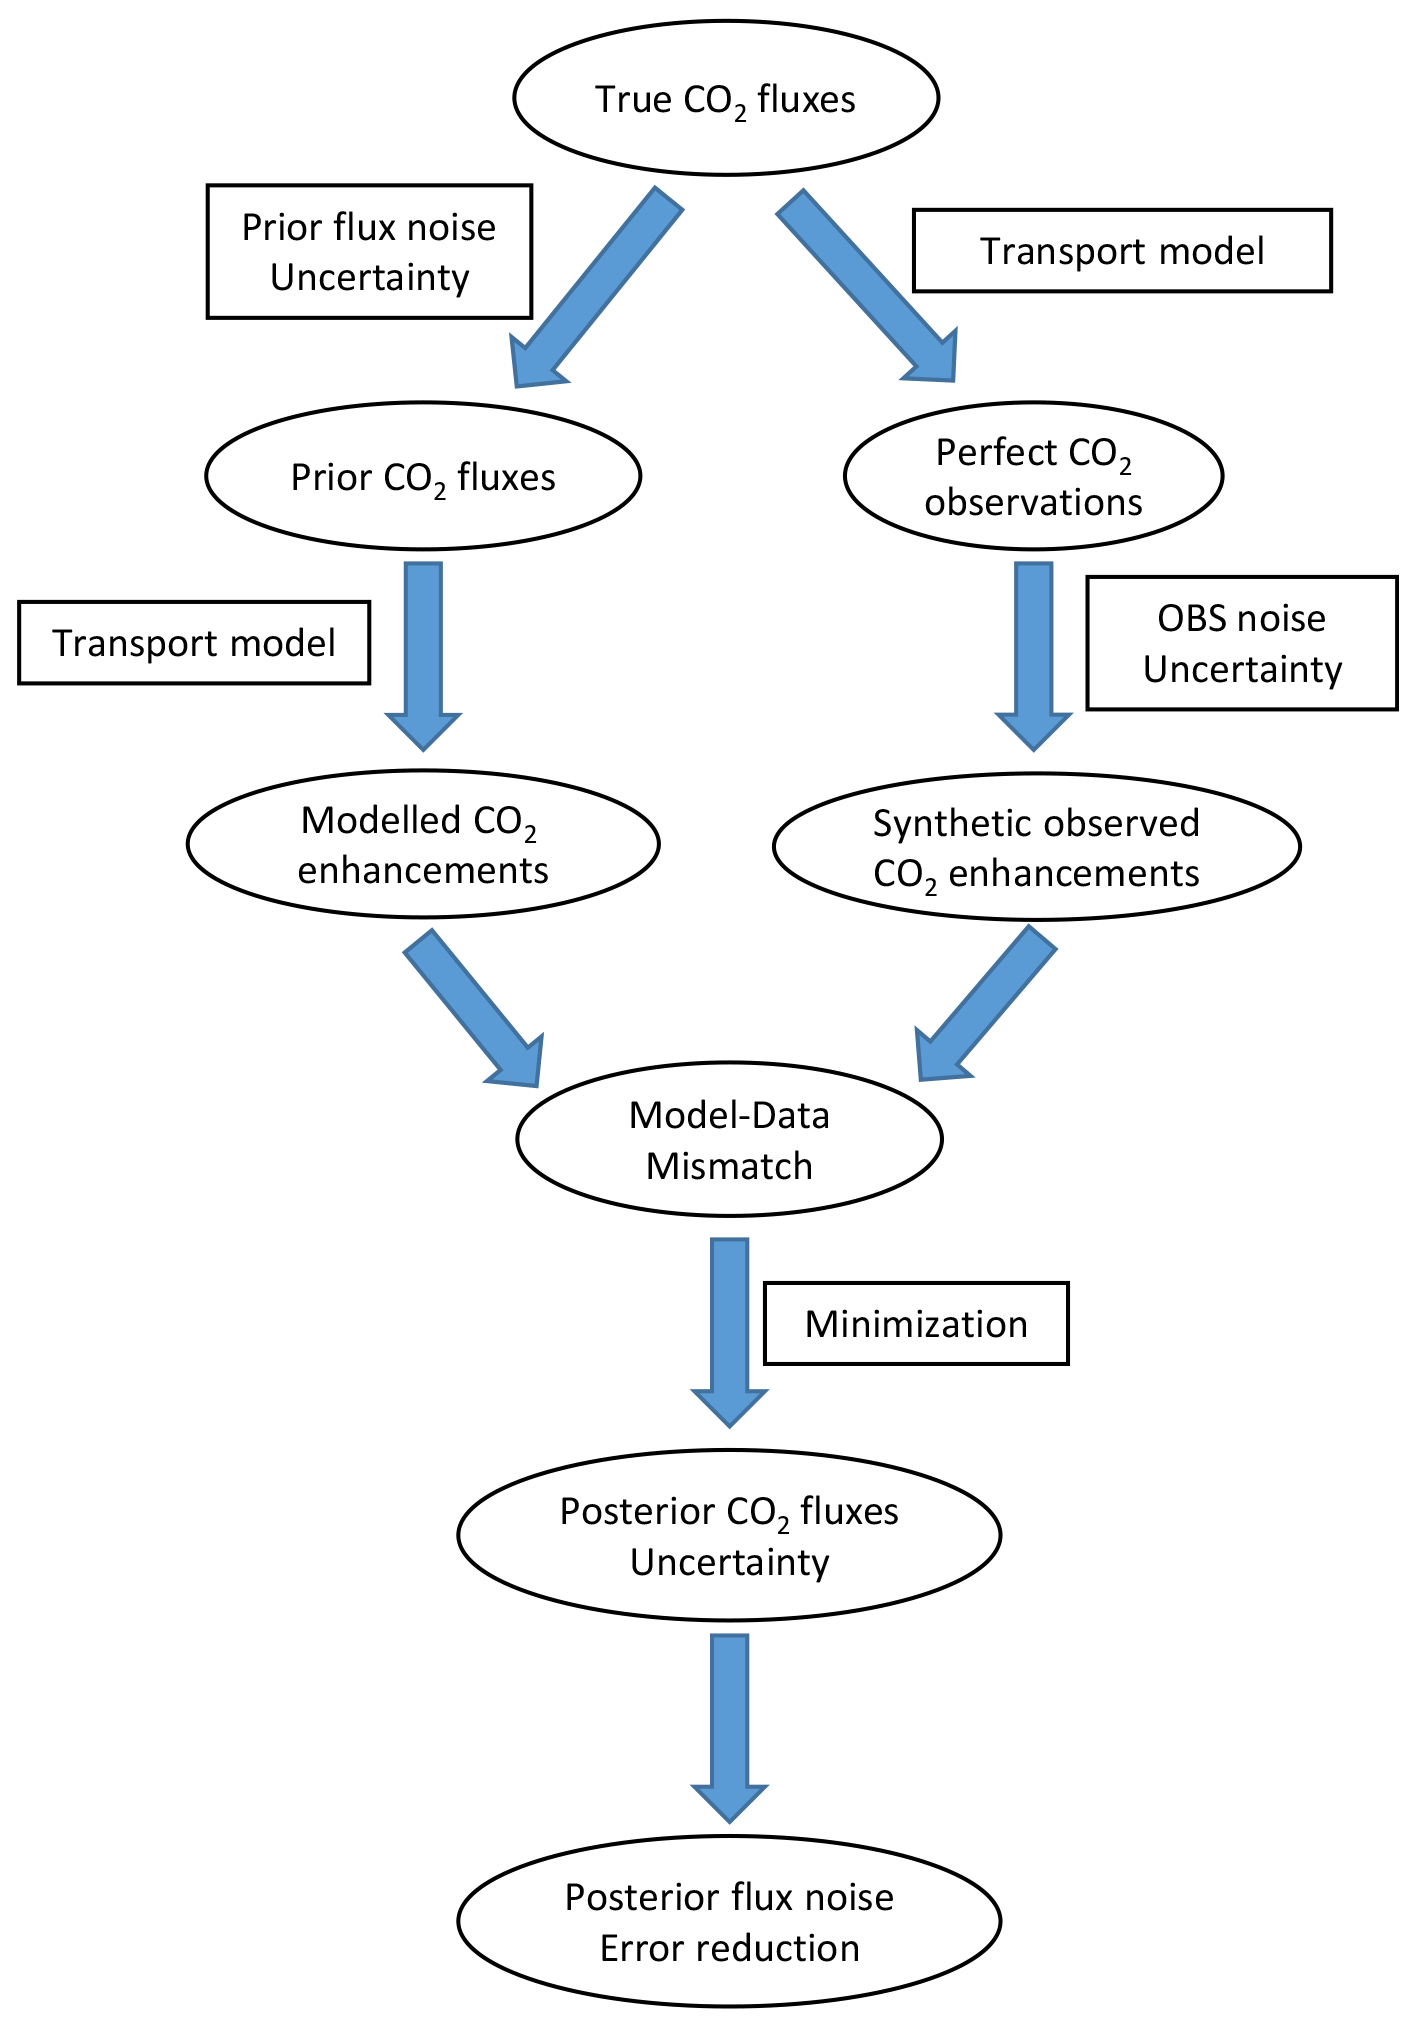
Figure 1Flow chart of the Observing System Simulation Experiment (OSSE) for urban CO2 inversion.
2.1 MicroCarb city-mode configuration
The two-sweep and three-sweep city-scan sampling configurations (Fig. 2) are being considered by the MicroCarb science team. Both city-scan configurations cover a city the size of Paris or London. For any acquisition mode, the spatial across-track (ACT) swath is acquired by a detector that has 90 pixels in the spatial dimension and 1024 pixels that collect spectral information for the four infrared bands described above. In the nominal nadir mode of MicroCarb, each individual ACT sounding results from the binning of 30 ACT pixels. The spatial along-track (ALT) dimension is determined by the satellite velocity during the 1.3 s measurement integration time, which leads to the nominal pattern of three soundings of 4.5 km ACT × 8.9 km ALT, leading to a 13.5 km ACT swath and a continuous ALT sampling. The city mode differs from the nominal nadir pattern in three ways: (1) the satellite makes a permanent pitch rotation to slow the projection of the line of sight on the ground, leading to an ALT footprint size of 2.25 km (for the same 1.3 s measurement integration time); (2) each individual ACT footprint results from the binning of 15 ACT pixels, leading to six ACT footprints each with an ACT size of 2.25 km; and (3) the ACT swath of the complete city-mode measurement configuration is constructed by the juxtaposition of two or three ALT sweeps, enabled by satellite pitch manoeuvres before and after flying over the target that provides forward and backward viewing of the target. Each successive sweep is shifted by 13.5 km ACT using a roll-axis pointing mirror to get contiguous spatial observations. The roll-axis pointing mirror also provides the opportunity to centre the city-mode sampling pattern over cities that lie aside of the satellite track. Further instrument details that enable the city-scale mode can be found in Jouglet et al. (2021).

Figure 2MicroCarb city-mode sampling patterns for the two-sweep and three-sweep modes in Paris (a, b) and London (c, d). Samplings are marked by quality flag (QF) using ERA5 total cloud cover at 12:00 UTC on 15 April 2018. QF = 0 means the samplings are cloud-free, and QF = 1 means the samplings are cloud-contaminated. Numbers in the parentheses are the number of observations and the percentage relative to the total number of observations for the two-sweep (228) and three-sweep (342) modes. The red star marks the city centre. The satellite moves from northeast to southwest, and wind comes from southwest.
We study two configurations in the MicroCarb satellite city-scan observing mode (Fig. 2): (1) the two-sweep configuration has only forward and backward observations, leading to a ∼ 40 km ACT swath (2 × 13.5 km including the off-nadir pointing footprint deformation); and (2) the three-sweep configuration has forward, nadir, and backward observations, leading to a ∼ 60 km ACT swath. These are typical values including off-nadir centred city modes. For a city mode centred at nadir, the ACT swath is 34 km for the two-sweep mode and 52 km for the three-sweep mode. The allowed duration of each sweep mode leads to an ALT swath of ∼ 40 km.
2.2 Cloud screening
The MicroCarb science team will use ECMWF cloud forecasts to program city-mode measurements, in order to maximize the success of cloud-free observations. However, the cloud forecast has a limited precision, and small-scale clouds may not be predicted. Here, to realistically describe (and remove) observations contaminated by clouds on the spatial scale of the observations, we use ERA5 total cloud cover reanalysis data at 0.25∘ × 0.25∘ resolution (Hersbach et al., 2018) for the expected satellite equatorial overpass time (12:00 UTC) of MicroCarb. We use a downscaling method that assumes the dependence of the probability (f) of a cloud-free observation to its pixel size (s) and large-scale cloud cover (P) (Palmer et al., 2011):
where g is defined as a constant factor for alignment between the instrument pixel and the cloud-free subgrid region, which we choose to be 1. The pixel size (s) of MicroCarb city-scan observing mode is approximately 2 km × 2 km. Using a constant alignment factor (g) will cause an overestimation of the probability for cloud-free observations at high cloud cover and an underestimation at low cloud cover. Fp(s) is the penalty function accounting for the adverse effects on cloud-free probability when the effective instrument pixel size is larger than the nominal 1 km2 (Boesch et al., 2011):
For each individual measurement pixel, we calculate its cloud-free probability (f in Eq. 1) based on ERA5 total cloud cover reanalysis data at 0.25∘ × 0.25∘ resolution, and then we generate a random number for each measurement to compare with its cloud-free probability (f) and determine whether a measurement is cloud-free. The first step is related to the organization of cloud distribution based on the ERA5 data, and the second step is related to the randomness of the impact of cloud on satellite measurements.
We report our results over Paris and London for three arbitrary days (5th, 15th, and 25th) from the months of April, July, and December 2018 (Fig. A1). For some of these days (five for Paris and three for London), we find that the cloud cover is 100 %. In these cases, we arbitrarily halve the cloud cover to 50 % to generate cloud-free observations (Table A1). Out of the total 228 (two-sweep mode) and 342 (three-sweep mode) individual observations over Paris and London, our method assigns 72 (two-sweep mode) and 124 (three-sweep mode) samplings to be cloud-free in Paris and 69 (two-sweep mode) and 119 (three-sweep mode) cloud-free samplings in London at 12:00 UTC on 15 April 2018, respectively (Fig. 2).
2.3 Anthropogenic CO2 emissions
We use the Open-source Data Inventory for Anthropogenic CO2 (ODIAC, 2019 version) for monthly mean fossil fuel emissions of CO2 in Paris and London at a spatial resolution of 1 km × 1 km (Oda and Maksyutov, 2011; Oda et al., 2018). The data product uses satellite observations of nighttime light and power plant profiles (including emissions intensity and geographical location) to distribute country-level CO2 emission estimates from fossil fuel combustion. We use ODIAC to guide our broader study domains for Paris and London, ensuring we include anthropogenic source regions that lie outside the spatial extent of MicroCarb city-mode configurations (Fig. 3a and b). For our calculations, we exclude a small number of extremely large emissions sources (e.g. power plants and some industrial emissions) that are more than 100 times larger than other (areal and point sources) emission pixels but have lower uncertainties. In total, we exclude 9 pixels over Paris (about 0.1 % of 10 080 pixels), and 22 pixels are excluded in London (about 0.2 % of 10 368 pixels). We exclude these sources because (1) the atmospheric transport model is not sufficiently accurate and precise to infer the location and emissions strength of these sources and errors in the locations of these point sources diminish the ability to infer sub-city scale emissions (Oda et al., 2017; Roten et al., 2022) and (2) these anomalously large emissions complicate the matrix-based inverse method calculation. We acknowledge that real measurements will likely detect these large emission sources, subject to changes in cloud cover and wind direction and speed. For meteorological circumstances where the resulting plume takes the form of thin, anomalously large CO2 enhancement, only very high-resolution models will be able to describe the plume and estimate its parent emissions with fidelity. Paris emissions of CO2 (1.71 t CO2 s−1 in April 2018) are concentrated in the city centre, home to about 2.17 million people (The National Institute of Statistics and Economic Studies). They are 1.4 times the size of those from London (1.25 t CO2 s−1), home to about 8.9 million people (United Nations World Population Prospects), where emissions are aligned in the east–west direction along the River Thames.
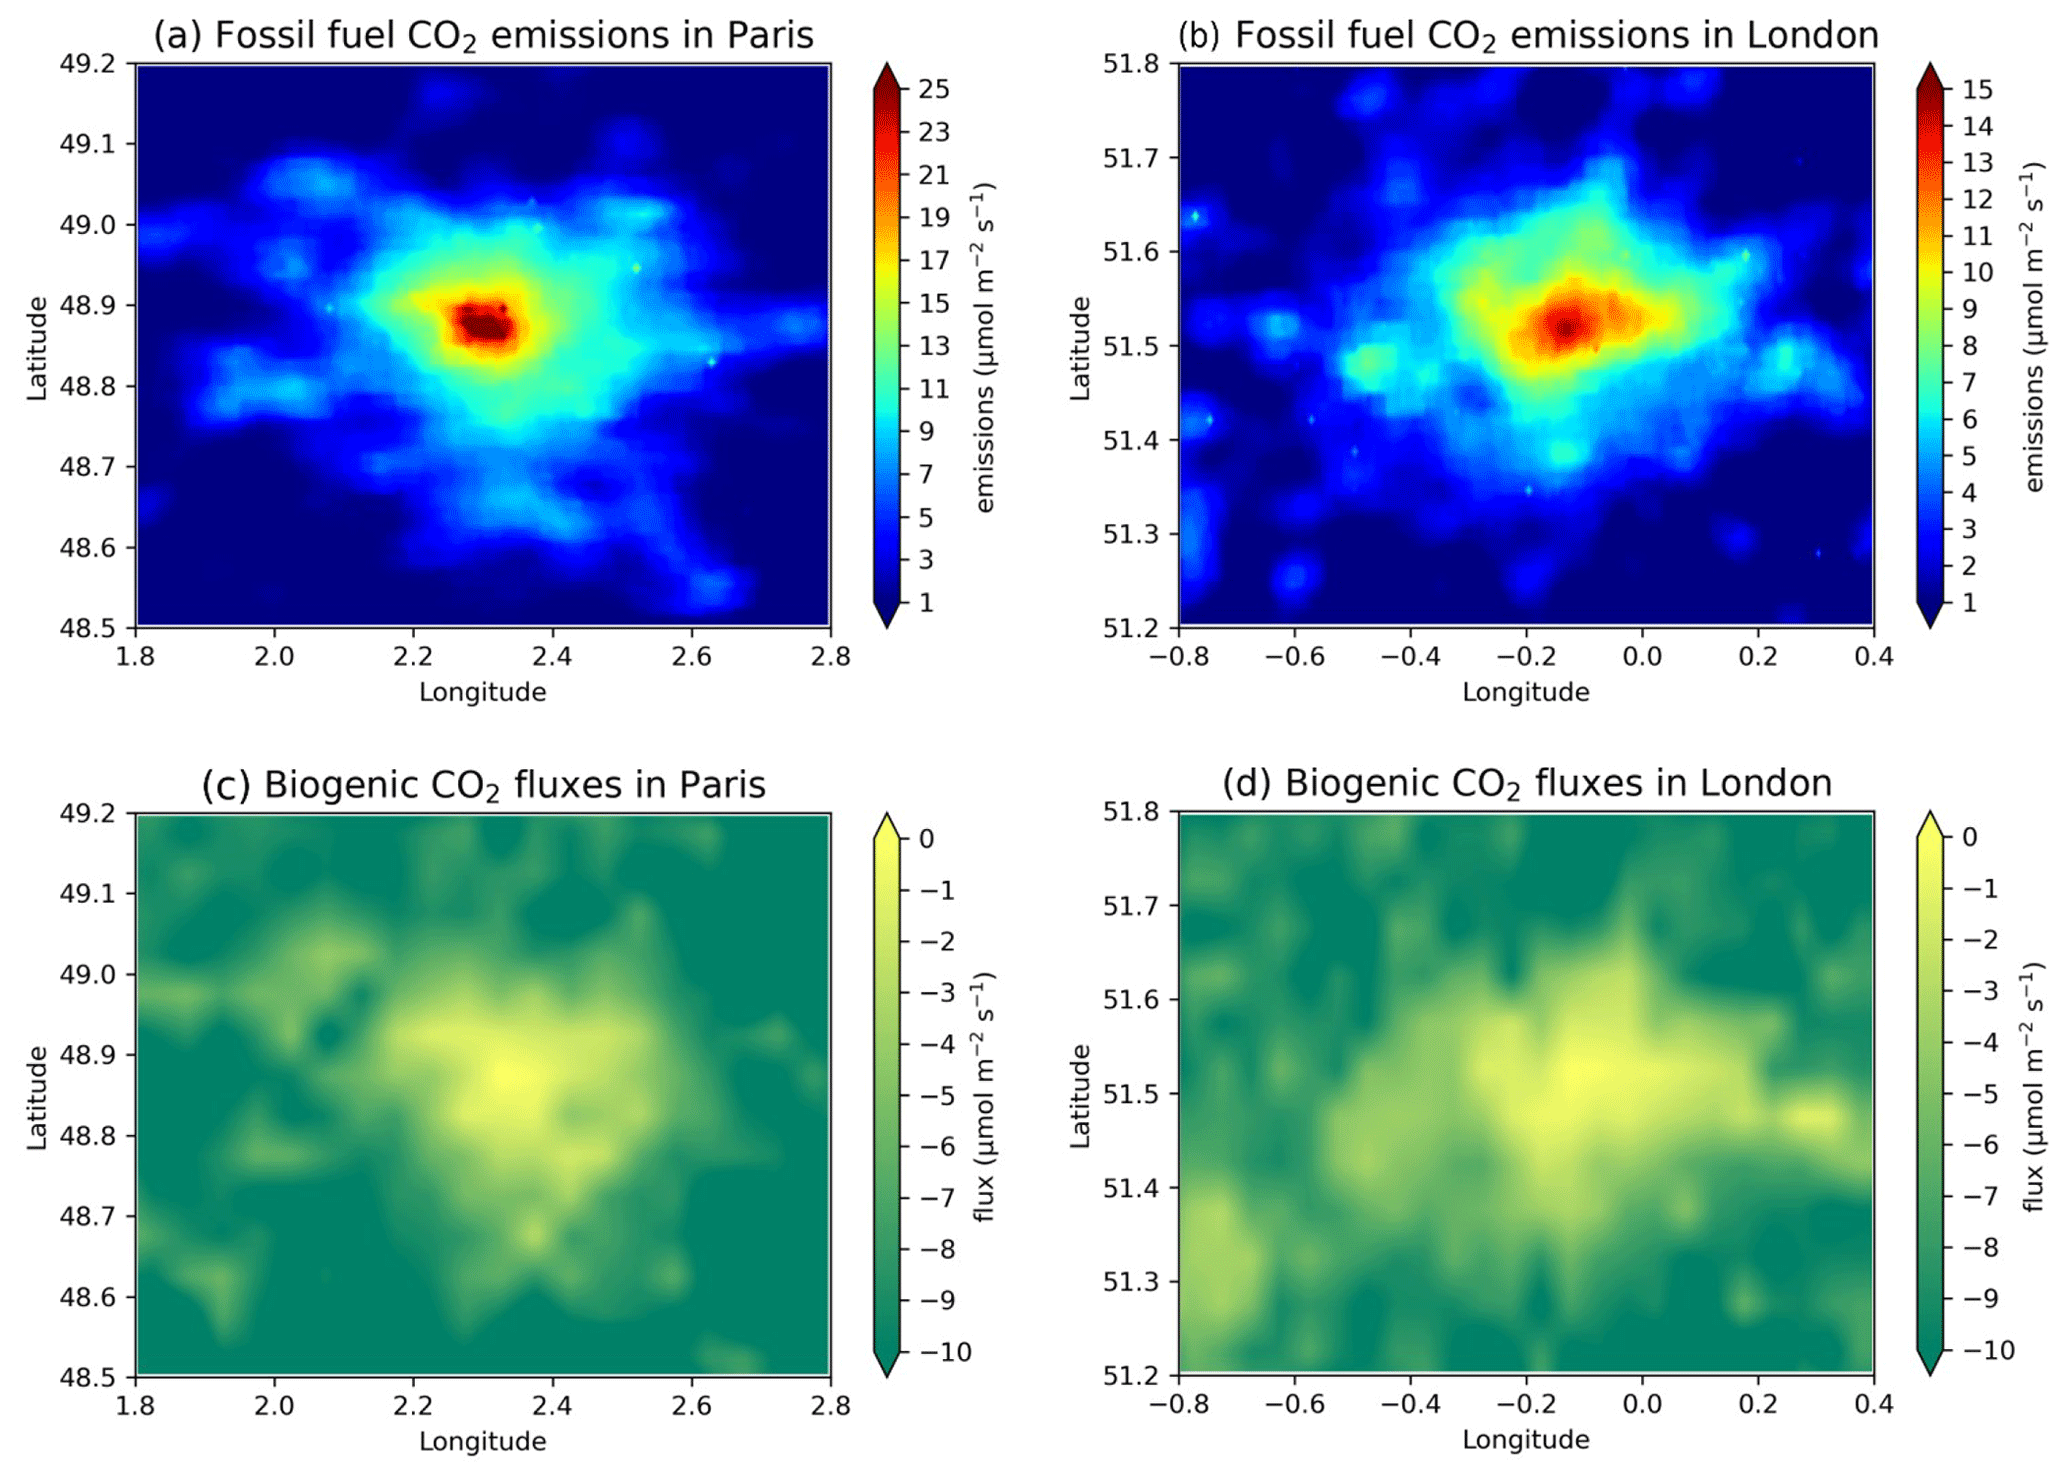
Figure 3Monthly mean fossil fuel CO2 emissions in April 2018 from ODIAC in Paris (a) and London (b). Biogenic CO2 fluxes at 12:00 UTC on 15 April 2018 simulated by the SMUrF model in Paris (c) and London (d).
2.4 Urban biosphere CO2 fluxes
We use the SMUrF (Solar-Induced Fluorescence for Modeling Urban biogenic Fluxes) model (Wu et al., 2021) to estimate the net ecosystem exchange (NEE) across Paris and London. SMUrF estimates gross primary productivity (GPP) using OCO-2-derived solar-induced chlorophyll fluorescence (SIF) (Zhang et al., 2018) and neural networks to determine the relationship between ecosystem respiration and air and soil temperatures and GPP. SMUrF determines biome-specific model parameters by aggregating multiple flux tower sites from similar biomes across the globe to describe urban biogenic fluxes. We interpolate NEE values to the same grid used by ODIAC.
We evaluate SMUrF NEE estimates in France and UK by using eddy-covariance flux measurements from the European Fluxes Database Cluster: five sites in France (FR-Aur, FR-Hes, FR-Lam, FR-LGt, and FR-Pue) and two sites in the UK (UK-AMo and UK-EBu). Details of each site can be found at http://www.europe-fluxdata.eu/home/sites-list (last access: 19 January 2023). These flux sites correspond to a variety of land types, including croplands (CRO), deciduous broadleaf forests (DBF), permanent wetlands (WET), evergreen broadleaf forests (EBF), and grasslands (GRA). We acknowledge these sites are not located in urban areas due to the lack of sufficient urban biosphere flux measurements (only one urban flux site in London and the data are not public); thus, this evaluation provides us with limited confidence to understand the gradients in atmospheric CO2 across these cities. All flux data in France are from 2018 (same year as our model meteorology). In the absence of UK flux data from 2018 we use data from 2015 (UK-AMo) and 2011 (UK-EBu).
The seasonal-mean NEEs simulated by SMUrF in July 2018 agree reasonably with the eddy-covariance flux data (slope = 1.07 for the ensemble mean of all sites, and the cumulative seasonal-mean NEE is −12 g m−2 d−1 for the simulated flux and −10 g m−2 d−1 for the flux data), indicating that the simulated biogenic CO2 fluxes are in a realistic range, although there are differences between site-specific model and observed photosynthetic uptake due to random errors, interpolation errors, and different spatial and temporal scales (Fig. A2). Figure 3c and d show the spatial distribution of urban biosphere CO2 fluxes on the 15 April 2018. We find substantial biospheric uptake over Paris and London during this month, comparable to the magnitude of fossil fuel emissions but with peak values located in contrasting regions. As we discuss below, these different emission distributions have implications for inferring fossil fuel combustion fluxes from atmospheric data.
2.5 Atmospheric transport model
We use the column version of the Stochastic Time-Inverted Lagrangian Transport model (X-STILT) (D. Wu et al., 2018; Fasoli et al., 2018; Lin et al., 2003) to link surface CO2 fluxes to variations of atmospheric CO2 mole fractions at the locations of satellite soundings (Figs. A3 and A4). X-STILT traces the movement of air parcels backwards in time for 24 h. For the purposes of this study, we use a typical averaging kernel profile of OCO-2 that describes the vertical sensitivity of the column observations to changes in CO2 in the column. We apply this averaging kernel and pressure weighting functions to the model fields to describe the footprints of satellite-based atmospheric CO2 observations. The footprints describe the sensitivity of CO2 columns at the receptors (locations where the satellite observes the atmosphere) to upwind surface fluxes.
To drive air parcels in X-STILT we use Global Forecast System meteorological data with a horizontal resolution of 0.25∘ (GFS0.25) (National Centers for Environmental Prediction, National Weather Service, NOAA, U.S. Department of Commerce, 2015). At the receptor, 3000 air parcels evenly distributed from the surface to 3 km height are released from the atmospheric column of each observation. We simulate footprints for the cloud-free observations sampled by MicroCarb. The sum of the convolution of footprints and the ODIAC and SMUrF fluxes represents the urban CO2 enhancements from upwind CO2 fluxes, as sampled by air parcels arriving at the locations of each observation.
2.6 Maximum a posteriori inverse method
We use the maximum a posteriori (MAP) inverse method (Enting, 2002; Tarantola, 2004; Feng et al., 2009) in which we solve for a posteriori CO2 emissions by minimizing a cost function that describes the mismatch between the model-calculated enhancements and the measurements, accounting for a priori and measurement uncertainties. Minimizing the cost function results in the following expressions:
where and denote the a posteriori state of grid-based CO2 emission estimates across a city and the associated error covariance matrix, respectively. x0 and B denote the a priori emissions and the associated error covariance matrix. The measurement vector y includes the atmospheric CO2 column enhancements, with the associated errors described by the observation error covariance matrix R (including measurement errors and atmospheric transport errors). H denotes the Jacobian matrix that describes the sensitivity of atmospheric CO2 column enhancements to changes in CO2 emissions.
To evaluate the theoretical performance of the MicroCarb city-mode data on improving a priori knowledge of urban CO2 emissions over Paris and London, we use an error reduction metric (η) that takes into account differences between the a priori and a posteriori error covariance matrices (Palmer et al., 2000):
where the subscripts denote the diagonal elements of the error covariance matrices. The larger the value of η the larger the reduction in uncertainty of CO2 emissions due to using the atmospheric CO2 measurements.
2.7 Closed-loop numerical experiments
Figure 1 describes the experimental approach we take to assess the theoretical ability of MicroCarb city-scan mode measurements to quantify urban emissions of CO2 from Paris and London. Here, we discuss the individual steps involved, following K. Wu et al. (2018). We use the ODIAC emissions and the SMUrF fluxes, described above, as the true state. We optimize individual flux components as separate state vector elements. The spatial resolution of fluxes is 1 km × 1 km, and the temporal resolution is monthly. In Paris, the size of the state vector is 10 080 × 1 for only the fossil component and 20 160 × 1 when including fossil and biogenic fluxes. The introduction of biogenic fluxes doubles the size of the state vector because we optimize them separately. The corresponding CO2 column enhancements are generated from the true fluxes by the column-mean X-STILT transport model, as described above.
We then add realistic observation noise to each cloud-free scene (determined by the cloud coverage) based on estimates from detailed simulations of the MicroCarb measurement error budget. These simulations transfer the instrumental performances (signal-to-noise ratio, spectral sampling, and spectral band positions) to random measurement error using the gain matrix formalism from Rodgers (2000). Only the radiometric noise has been included here. The measurement random error is expressed as the standard deviation of a Gaussian probability distribution law, which is computed for each footprint given its Sentinel-2 L1C reflectance, solar zenith angles, and atmospheric profiles for temperature, H2O, and CO2. The random measurement errors range 0.4–1.6 ppm with a mean value of 0.93 ppm for both the two-sweep and three-sweep configurations over Paris and mean values of 0.88 ppm (two-sweep) and 0.91 ppm (three-sweep) over London (Fig. A5). We add an assumed additional 20 % random error to the urban CO2 column enhancement to account for atmospheric transport errors (Deng et al., 2017; Lauvaux et al., 2019), assuming the transport model is unbiased. A more formal estimation of atmospheric transport errors would suggest more confidence than we have in our estimate of the uncertainty in the X-STILT model. We will examine the impacts of different transport errors (described by the observation error covariance matrix) on the error reduction (η) of flux inversion. Based on these error estimates in the observation error covariance matrix (R), we generate synthetic observed CO2 enhancements, which are assumed to be unbiased.
Evaluating our ability to reduce a priori flux errors (including systematic and random errors) is the primary objective of this study. We respectively assume a mean systematic and random flux error of 2 µmol m−2 s−1 (about 34 %) for fossil fuel emissions (Oda et al., 2019; K. Wu et al., 2018). The mean random error of the biological fluxes is estimated as 25 % (which is an approximately mean value of the standard deviations of the seasonally averaged biogenic CO2 fluxes) based on the eddy-covariance flux measurements at the ecosystem sites described above. The total systematic and random flux errors are constrained by the chi-square test that should be close to one. We use an eigenvalue decomposition method to generate a priori flux noise from the flux error covariance matrix (B). The vector of flux noise is calculated by multiplying the eigenvector of the flux error covariance matrix (after considering the spatial correlation of errors) with a normal distribution vector characterizing the systematic and random flux errors. The flux errors are spatially correlated with an exponentially decaying function of the distance between emission grids, and the spatial correlation length is assumed to be 10 km (Saide et al., 2011; Wu et al., 2011). We then sample the resulting a priori distribution of CO2 column enhancements where there are cloud-free measurements and use the MAP inverse method to infer the a posteriori flux estimates and associated uncertainties over Paris and London. We can assess the ability of using the synthetic measurements to retrieve the true urban emissions from Paris and London at different times throughout the year.
We report our results over Paris and London for three arbitrary days (5th, 15th, and 25th) from the months of April, July, and December 2018. This allows us to investigate the impacts of different cloud cover and wind fields on the flux inversion of the proposed MicroCarb sampling strategies and to understand how seasonal changes in the urban biosphere will influence our ability to determine urban anthropogenic emissions of CO2. In total, we report the results of nine scenarios (3 d per month for 3 months). In terms of structuring our results, we first use the results on 15 April 2018 to demonstrate the effectiveness of the inversion system and then generalize these results for all nine scenarios. We firstly only include the fossil component and focus on estimating fossil fuel CO2 emissions (Sect. 3.1 and 3.2) and then extend the inversion system to include the biogenic component (Sect. 3.3 and 3.4).
3.1 Flux estimates on 15 April 2018
Figure 4a, b, e, and f show the spatial distribution of the true and a priori fossil fuel CO2 fluxes over Paris and London. Application of our random and systematic errors, as part of the closed-loop experimental configuration, introduces a significant difference between the truth and a priori emissions (Figs. A6a and A7a). We use cloud-free satellite measurements to sample urban CO2 enhancements that correspond to these emissions, as observed by MicroCarb using its proposed two-sweep and three-sweep city-mode configurations (Fig. 2). The number of cloud-free data over Paris at 12:00 UTC on 15 April 2018 using the two-sweep and three-sweep observing modes is 72 and 124, respectively. The corresponding number of cloud-free data over London is 69 and 119, respectively. The a posteriori CO2 fluxes over Paris (Fig. 4c and d) and London (Fig. 4g and h) illustrate that cloud-free MicroCarb observations can broadly retrieve the spatial structure and magnitude of the true emissions. The a posteriori emission optimized by the two-sweep configuration can retrieve the true integrated emission for Paris within 18 % from an a priori state of 52 % larger than the truth. Similarly, this configuration results in an a posteriori emission estimate for London that is within 28 % of the true value from an initial a priori difference of 74 %. The three-sweep mode performs better to retrieve the total emissions of the truth within 7 % (Paris) and 21 % (London). For both cities, the a posteriori uncertainty is approximately half that of its a priori value. The three-sweep configuration outperforms the two-sweep configuration due to a higher number of cloud-free observations. For this day, the X-STILT footprints, describing the sensitivity of column-averaged CO2 measurements to urban emissions, come from south of both Paris (Fig. A3b) and London (Fig. A4b). Consequently, sizeable flux correction and error reduction are shown in the south of Paris (Fig. A6) and London (Fig. A7). The error reduction is more significant for the three-sweep configuration due to more cloud-free observations.
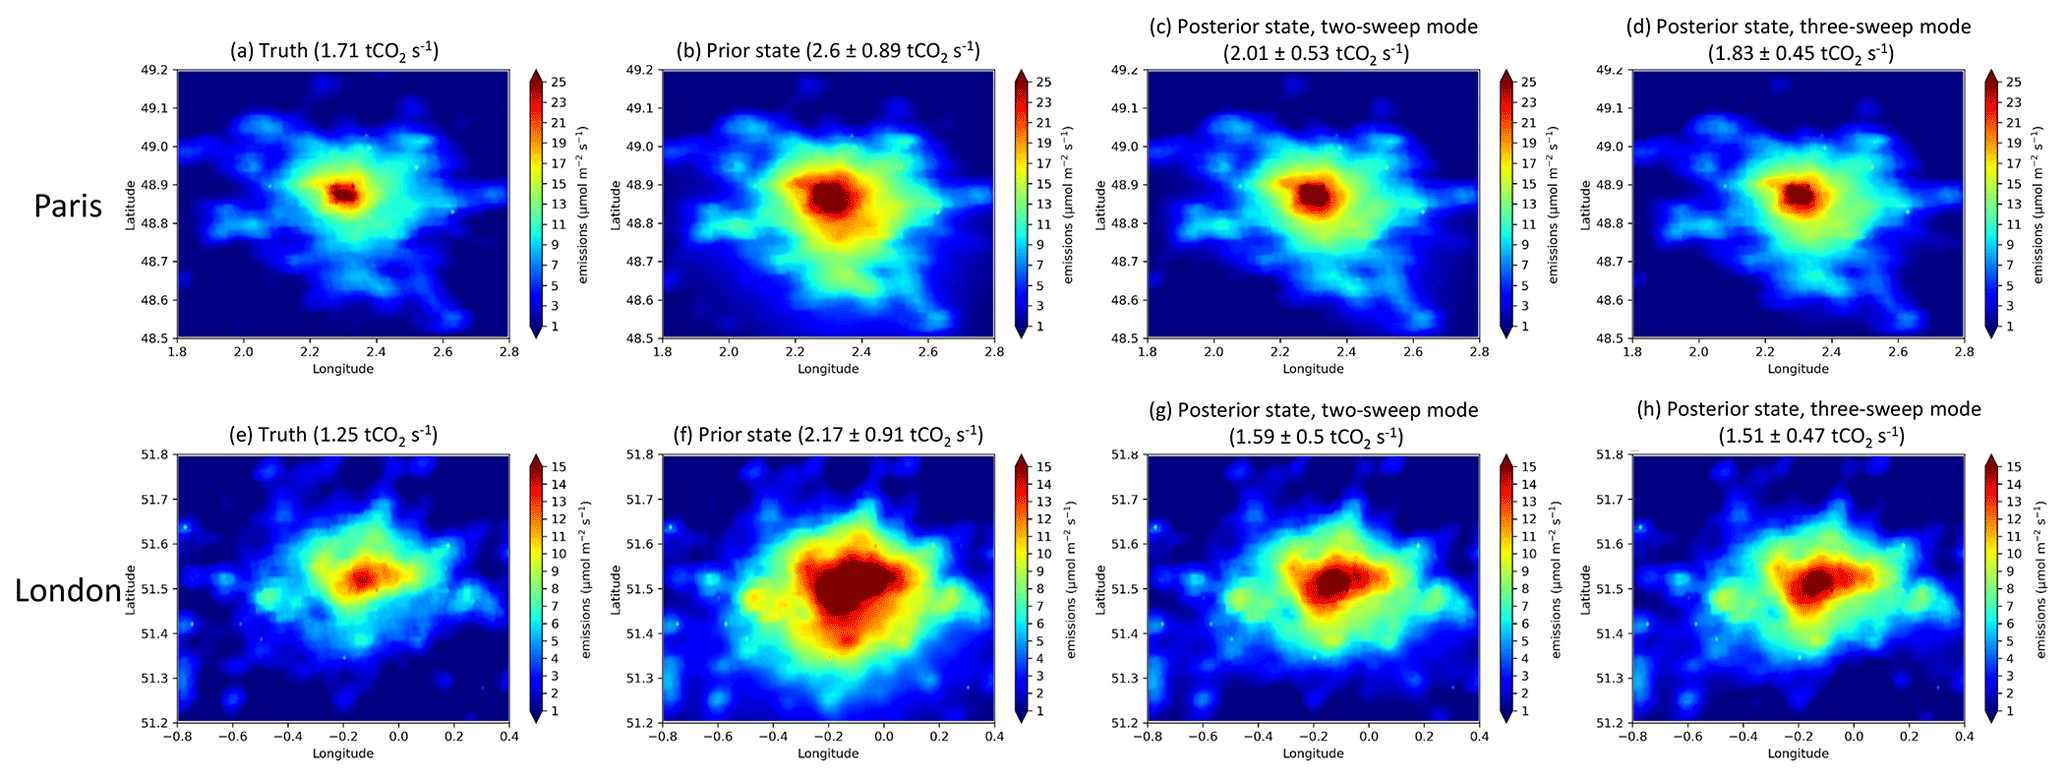
Figure 4Truth, prior state, and posterior state based on the cloud-free samplings of the two-sweep and three-sweep modes in Paris (a–d) and London (e–h) at 12:00 UTC on 15 April 2018. The values in parentheses are the total CO2 emissions within the domain and its uncertainty.
Figure 5 shows the urban CO2 column enhancements that correspond to the true, a priori, and a posteriori emissions. The a posteriori CO2 enhancements are closer to the “perfect” observations (OBS), which are generated from the true emissions, demonstrating the effectiveness of using the MicroCarb city-mode samplings to correct flux errors and improve the estimation of urban CO2 enhancements. The prior and posterior column CO2 enhancements for Paris and London on 15 April 2018 range 0–4 ppm, with mean values of the perfect observations of 1.28 ± 0.71 ppm over Paris and 0.67 ± 0.46 ppm over London for the two-sweep mode, consistent with previous studies on other cities (Kort et al., 2012; Hedelius et al., 2017, 2018; Kiel et al., 2021). Variation in enhancements reflects the spatial distribution of emissions across the cities and the footprints related to local meteorological conditions.
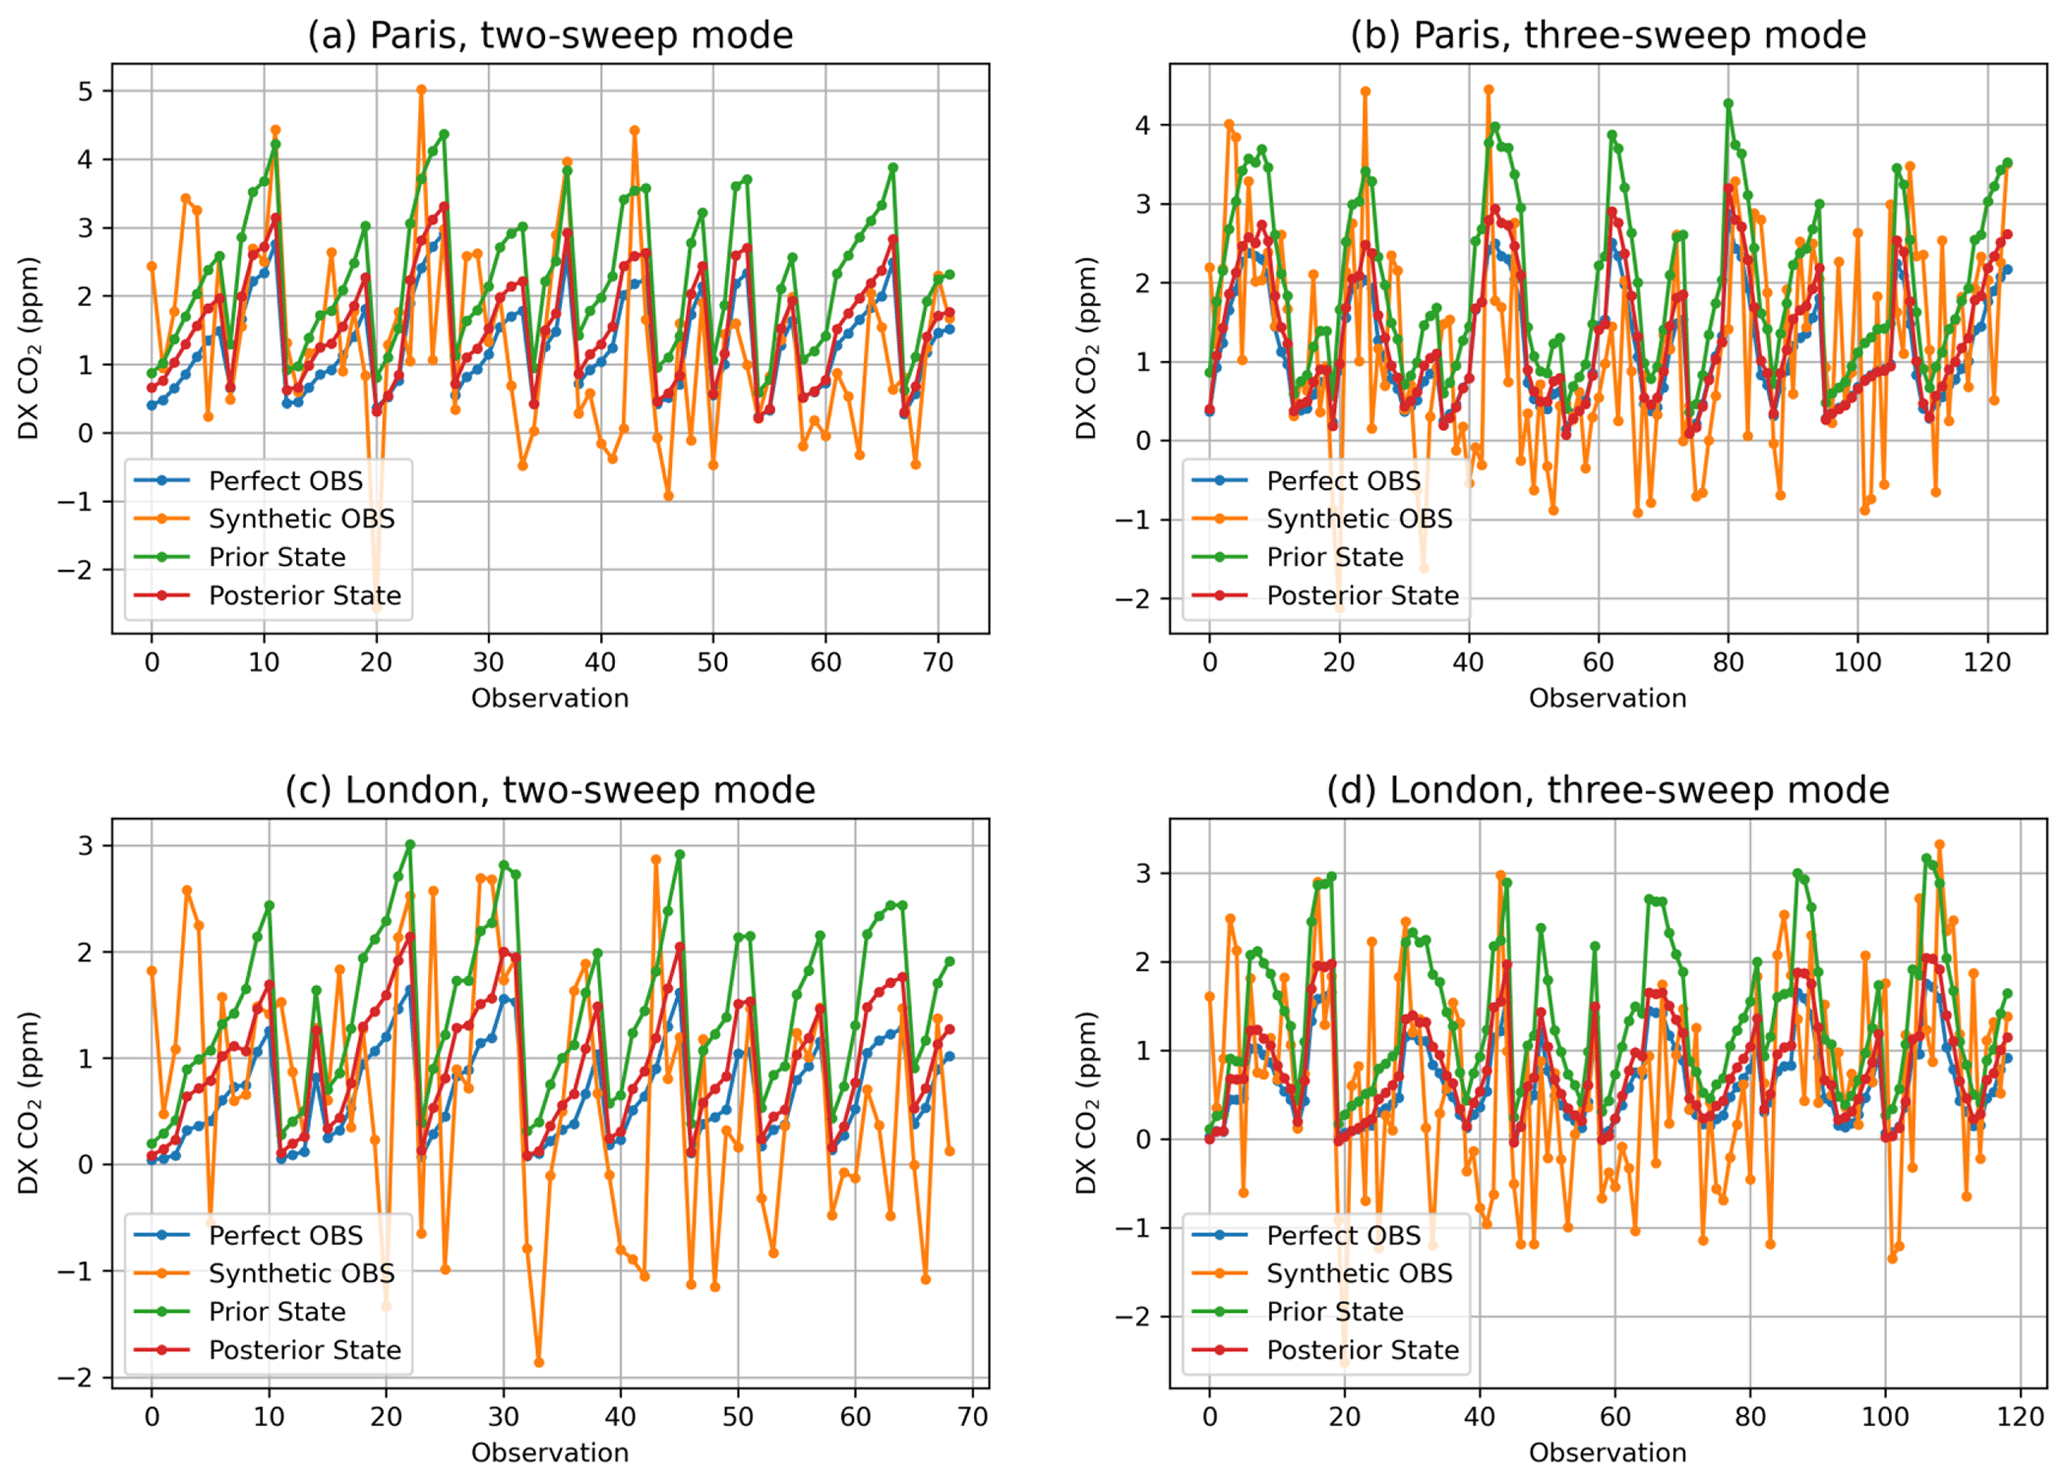
Figure 5Urban CO2 enhancements for the two-sweep and three-sweep modes in Paris (a, b) and London (c, d).
3.2 Sensitivity to cloud cover and measurement uncertainty
We estimate the sensitivity of flux error reduction to observation uncertainties (including atmospheric transport errors) and the data availability to a different number of cloud-free observations within the three-sweep configuration (Fig. 6). The peak spatially averaged error reduction is approximately 18 % with the observation uncertainty of 0.5 ppm and the largest number of measurements. The lowest error reduction is for the minimal data availability with 80 % cloud cover. Moreover, the scenario of all data (342 OBS) with 1.25 ppm observation uncertainty shows similar error reduction to the scenario of clear sky with 1 ppm observation uncertainty for both Paris and London, indicating better measurement precision can partially compensate for fewer measurements. For both cities, the sensitivity of error reduction to changes in the observation uncertainty is similar for different cloud coverage, with increasing cloud coverage resulting in a near-uniform decrease in the flux error reduction.
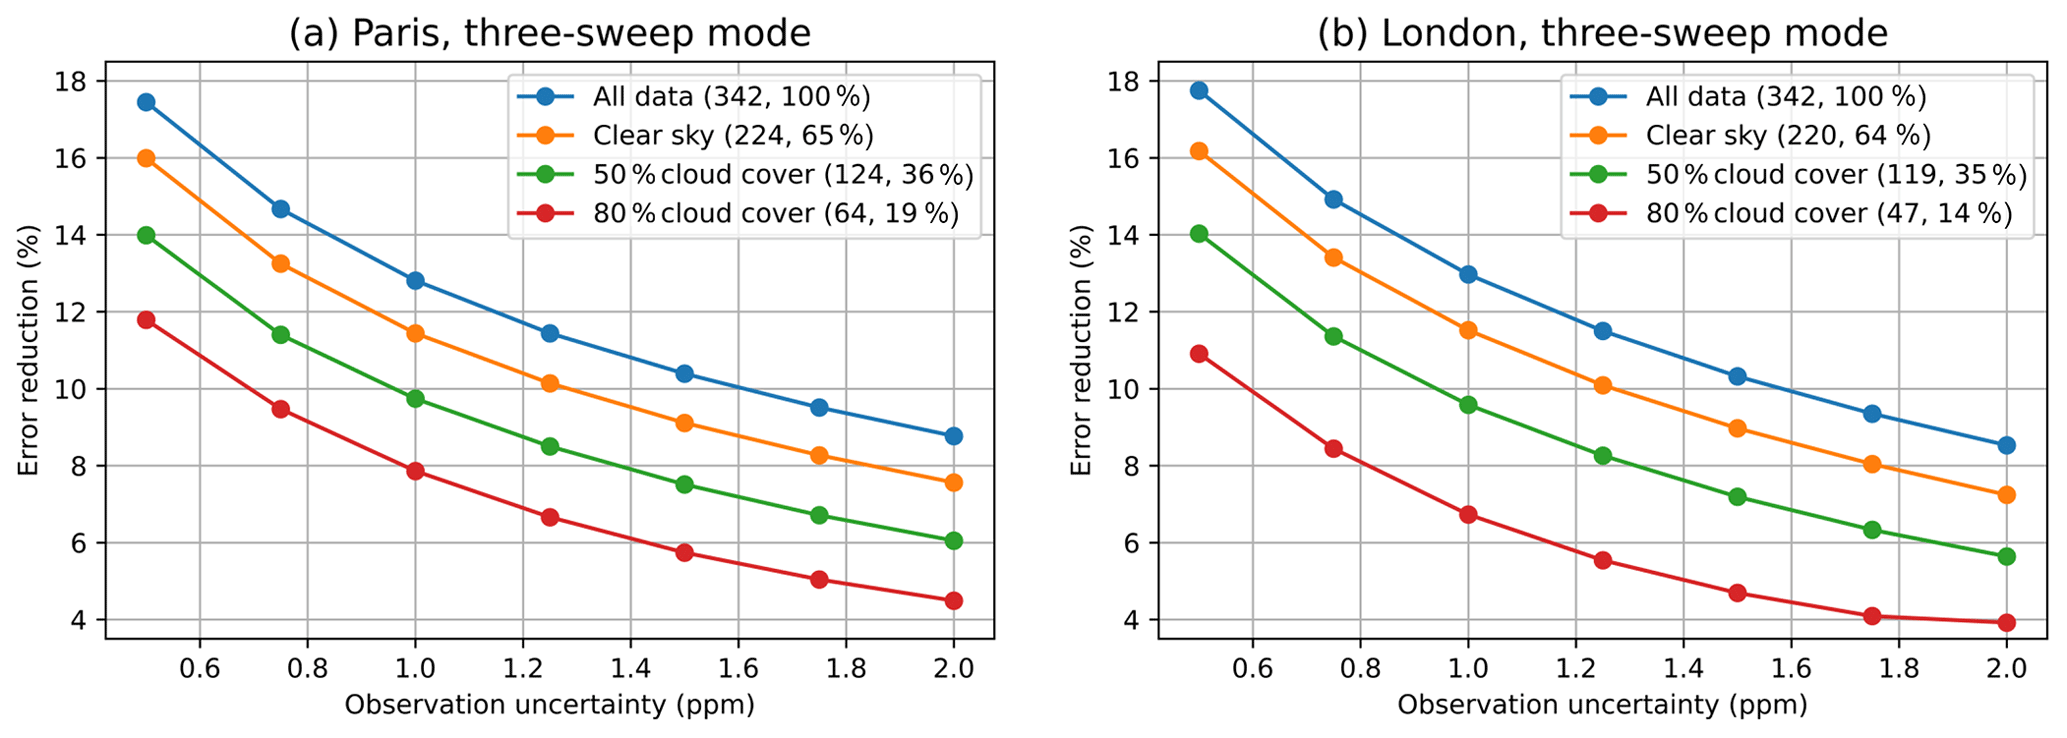
Figure 6Spatially averaged flux error reduction with the change of observation uncertainty under different sampling scenarios in Paris (a) and London (b). Numbers in parentheses are the number of observations and the percentage relative to the total number of observations for the three-sweep mode (342).
3.3 Influence of biogenic CO2 fluxes
Figure 7 shows how the introduction of biospheric CO2 fluxes can influence the ability to infer anthropogenic CO2 emissions. For this calculation we use the same true and a priori fields for the anthropogenic emissions of CO2 over Paris on 15 April 2018 (Fig. 4a and b). The effect of adding biospheric CO2 fluxes is to reduce the urban CO2 enhancements. These smaller column enhancements, within the context of the measurement uncertainties, limit our ability to reduce the random and systematic flux errors we impose as part of our closed-loop experiment and consequently to quantify correctly anthropogenic CO2 emissions. The total a posteriori anthropogenic emission estimate over Paris inferred using the three-sweep mode is 2.19 t CO2 s−1 (Fig. 7a), which is further from the true state than the emission estimate for the same scenario but in the absence of biospheric fluxes (Fig. 4d). The a posteriori uncertainty increases by 51 % from 0.45 to 0.68 t CO2 s−1 relative to the scenario without biospheric fluxes. The a posteriori flux noise is larger (Fig. 7b) with a degraded error reduction (Fig. 7c) relative to the scenario without biospheric fluxes (Fig. A6f and g). Although the random error correction of the fossil component is only related to the random error of the biogenic component, we find that biospheric uptake reduces the signal-to-noise ratio in satellite measurements (Fig. 7d), which limits the ability to reduce bias in the a priori anthropogenic CO2 emissions. The degree of the influence from biosphere is subject to the uncertainty of a priori biogenic fluxes, the separation of anthropogenic signals from net CO2 measurements, and the scale of inverted fluxes.
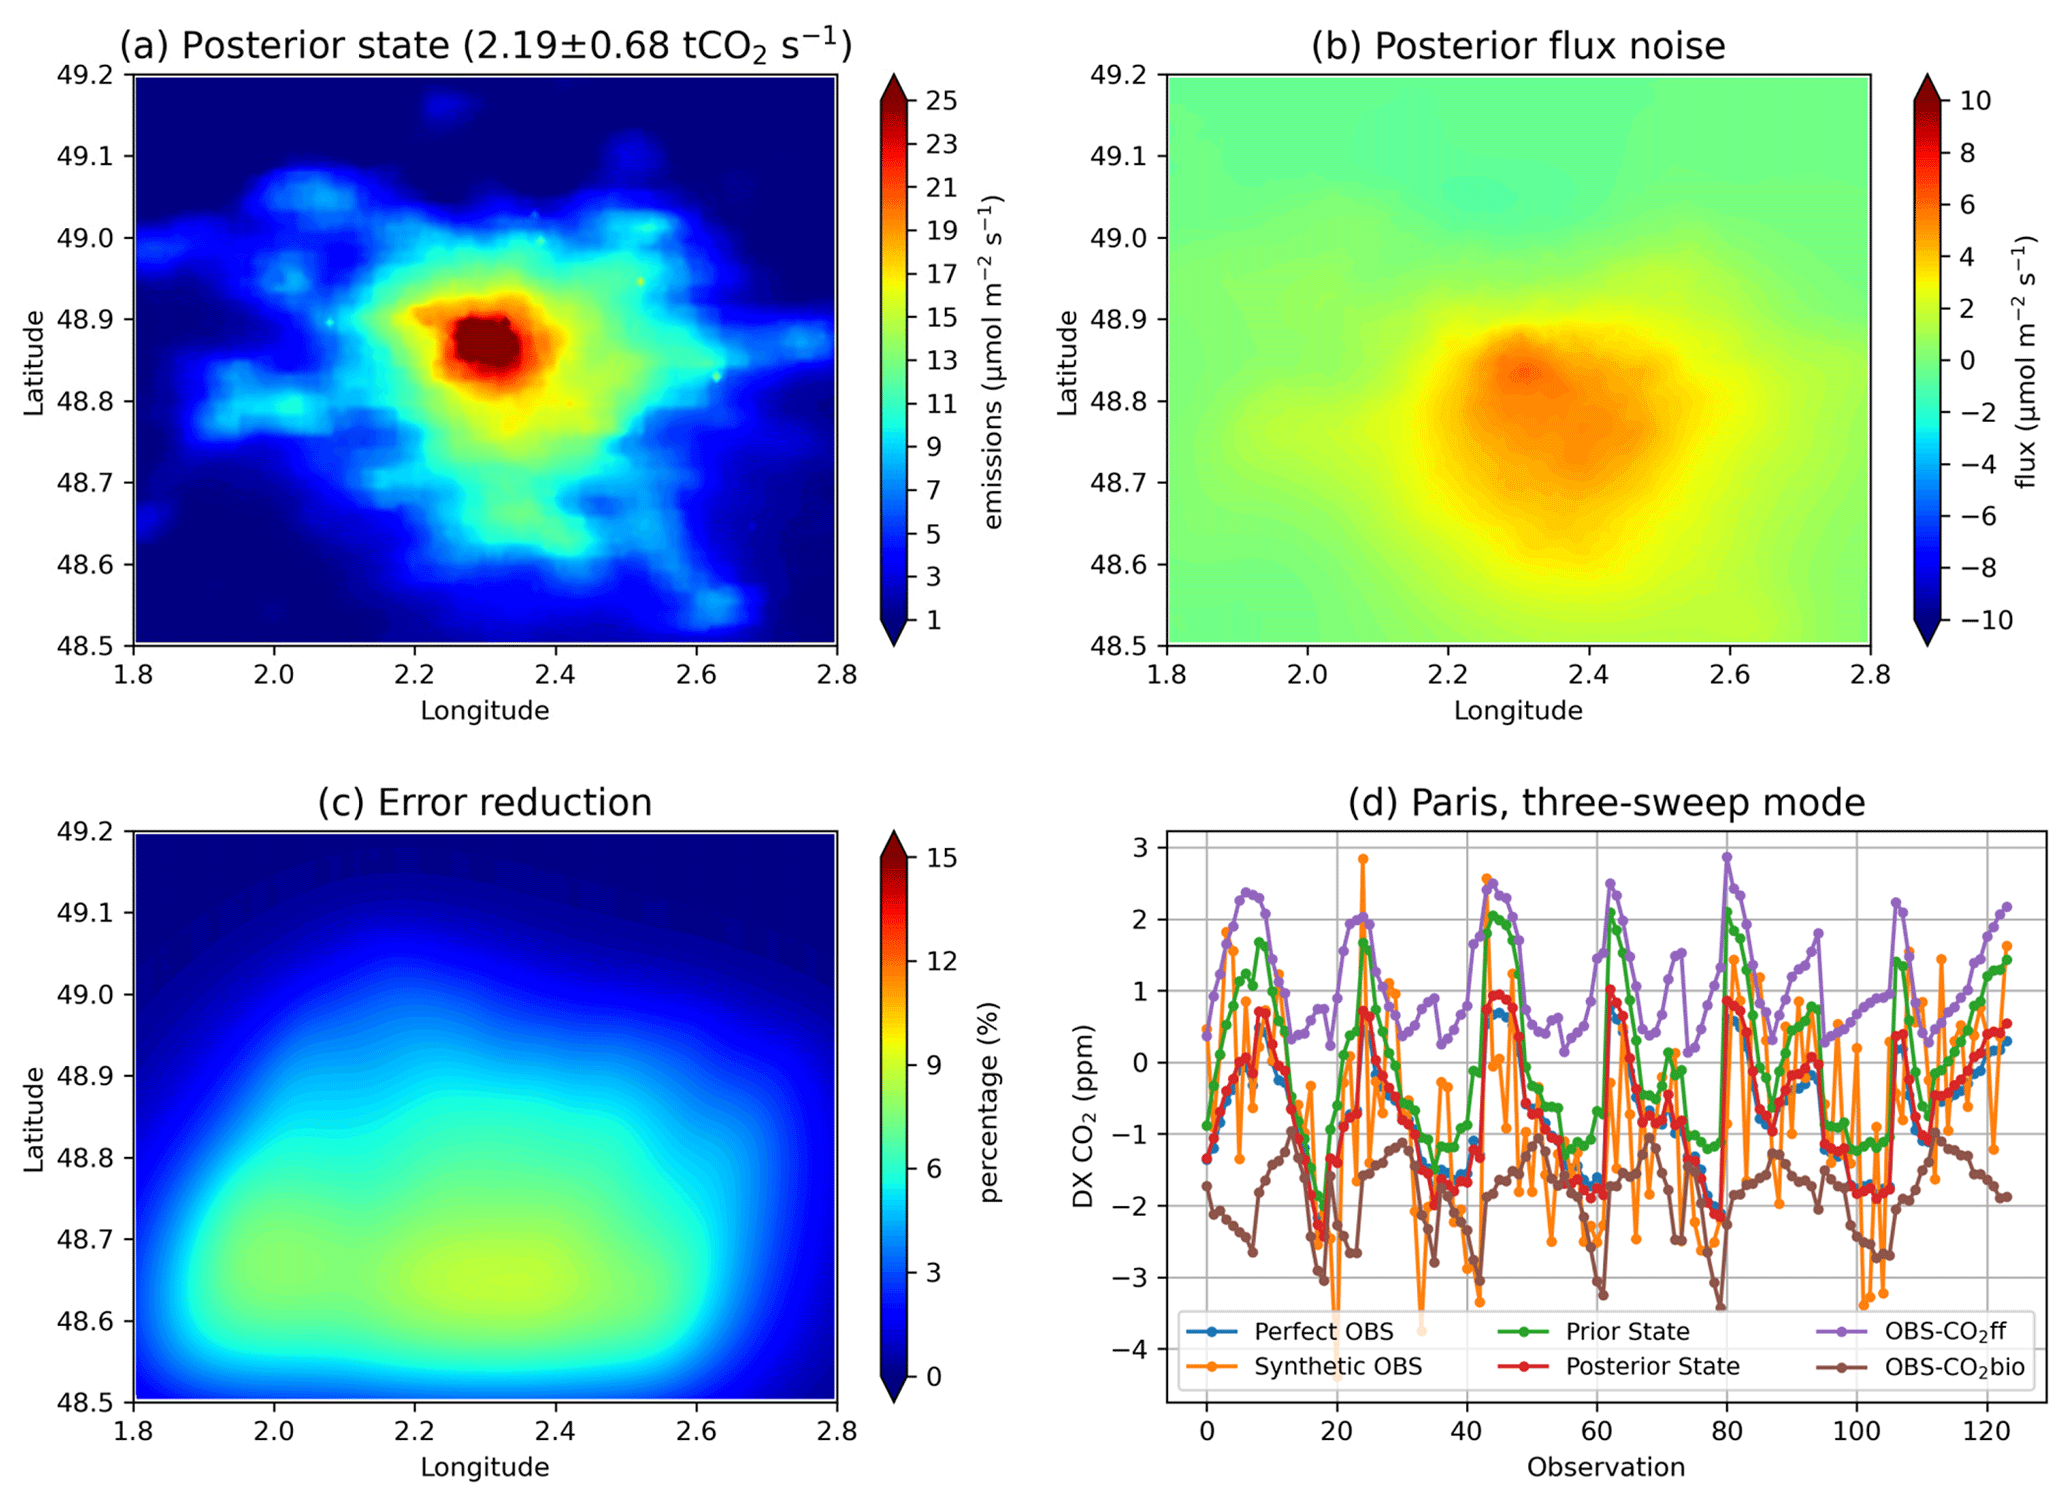
Figure 7Posterior fossil fuel CO2 fluxes (a), posterior flux noise (b), flux error reduction (c), and urban CO2 enhancements (d) after including biogenic CO2 fluxes in Paris for the three-sweep mode. The values in parentheses are the total emissions within the domain and its uncertainty.
3.4 Ensemble analysis of Paris and London scenes
We generalize the results for nine individual scenarios over Paris and London, distributed evenly between April, July, and December 2018 (Figs. 8 and 9). The nine scenes differ because of different biospheric fluxes and meteorological conditions, including cloud cover and prevailing wind, that impact the data availability and footprints. In general, all configurations improve the a priori estimate, the extent of which is determined by the number of cloud-free observations over each city, the sweep configuration used, and the introduction of seasonal biospheric CO2 fluxes. This general discussion is consistent with our analysis from the 15 April 2018, described above. The three-sweep observing mode results in the most accurate reproduction of true urban emissions over Paris and London due to a higher number of cloud-free observations (Fig. 8). Ignoring the impact of biospheric CO2 fluxes, the mean values of error reduction (including systematic and random error corrections) are 39 % (two-sweep) and 46 % (three-sweep) for Paris, and those values are 44 % (two-sweep) and 50 % (three-sweep) for London (Fig. 9a and c). In Paris, the scenario that results in the largest improvement to the a priori estimate is on 25th December 2018. This is due to a greater number of cloud-free observations (Table A1) and weakly dispersed footprints from the south of Paris (Fig. A3i) that are correlated with the distribution of the a priori flux noise (Fig. A6a). A contrasting scenario, associated with weak improvement to the a priori estimate, is over Paris on 5 July 2018. This is mainly due to the footprint originating from the north of the city (Fig. A3d) and therefore insensitive to the a priori flux noise. Generally, scenarios associated with the weakest improvements are associated with the lowest number of cloud-free observations, e.g. 25 April 2018 over Paris (Table A1). We find similar results over London. Our analysis suggests that cloud cover and prevailing wind (speed and direction) are both determinants of city-scan observations being able to infer accurately urban anthropogenic emissions of CO2.
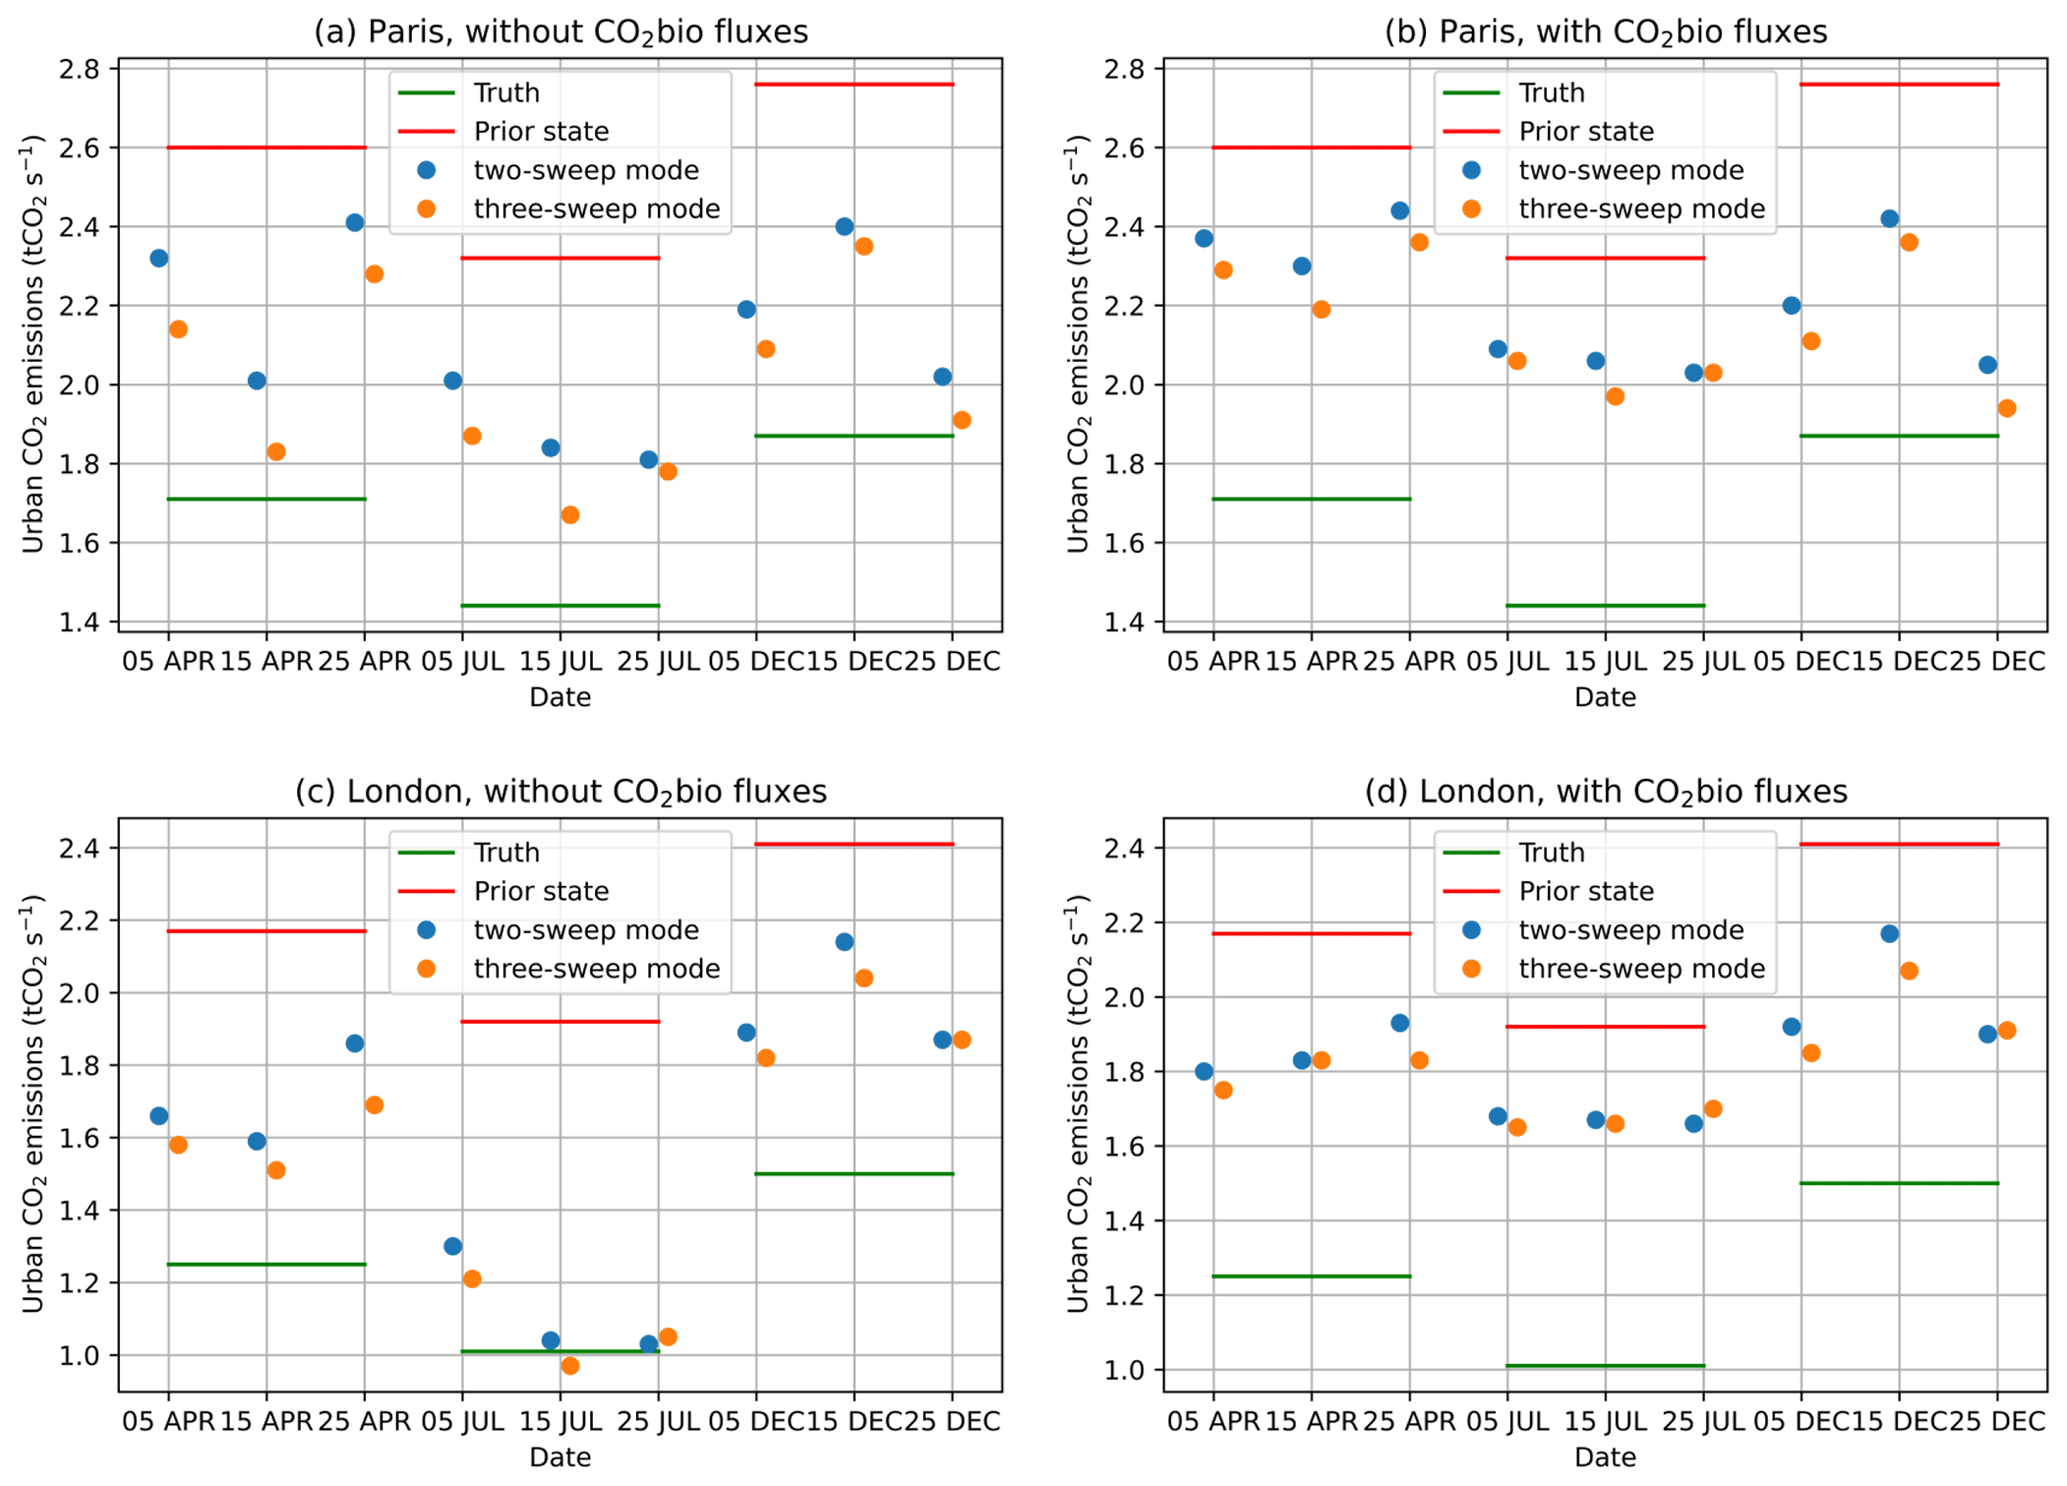
Figure 8Total fossil fuel CO2 emissions within the domain in Paris (a, b) and London (c, d) for different sampling scenarios. Panels (a) and (c) do not include the biogenic CO2 flux component, while panels (b) and (d) include the biogenic fluxes.
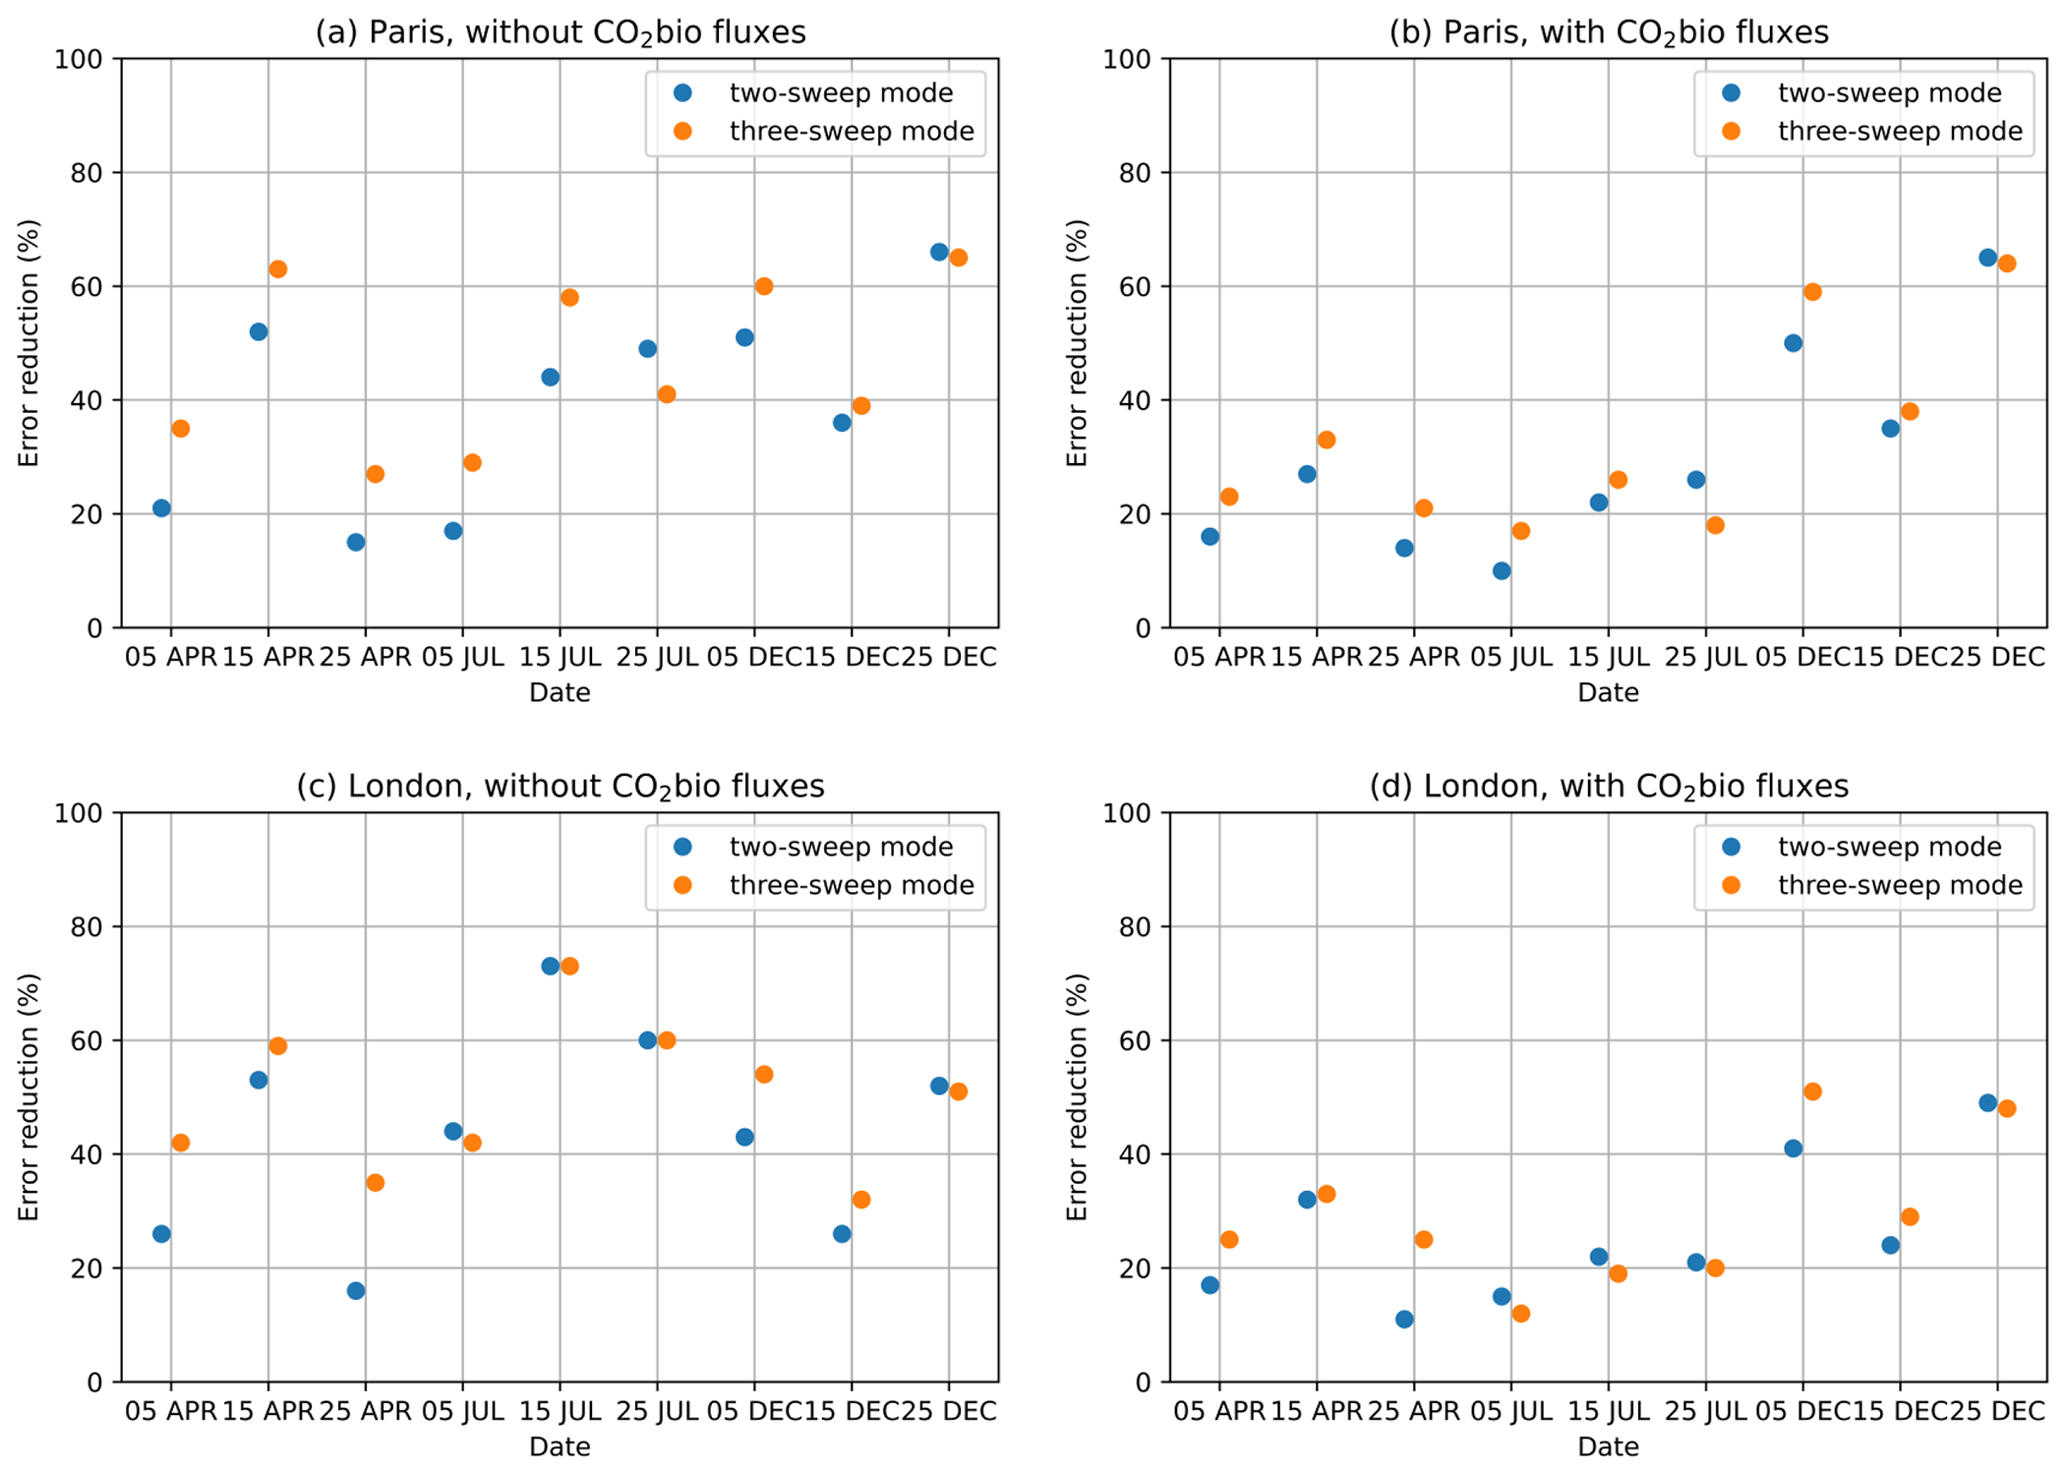
Including the impact of seasonal biospheric CO2 fluxes (with the associated uncertainties) generally reduces the urban CO2 column enhancements and consequently limits the ability to reduce systematic and random errors in the fossil component (Fig. 8b and d), particularly during April and July when the biosphere is more active and the flux error reductions are 20 %–40 % over Paris and London (Fig. 9b and d). We acknowledge our results are dependent on the uncertainties estimated for these biospheric fluxes. Decreasing the uncertainty of the a priori biospheric CO2 fluxes will strengthen the relationship between the data and simulated urban CO2 enhancements that consequently contributes to accurately quantifying anthropogenic CO2 emissions.
We evaluate the ability of MicroCarb city-scan observing modes to infer sub-city scale anthropogenic CO2 emissions with sufficient measurement accuracy and density. Both the two-sweep and three-sweep observing modes are able to reduce a priori flux errors for 20 %–40 % over Paris and London and retrieve the emission spatial structures of the truth. The three-sweep mode generally outperforms the two-sweep mode due to a wider scan area and a higher number of cloud-free observations. Cloud cover and prevailing wind are two determinants of city-scan observations for inferring accurately urban anthropogenic emissions of CO2. The inversion system corrects more flux errors when there is less cloud cover and the footprints cover the area correlated to the distribution of a priori flux noise. The column-averaged urban CO2 enhancements are 0–4 ppm for the cities we examined, with mean values of 1.28 ± 0.71 ppm over Paris and 0.67 ± 0.46 ppm over London. Quantifying sub-city scale emissions requires improving the accuracy and precision of satellite-based CO2 measurements. Moreover, the presence of biospheric CO2 fluxes diminishes the ability to estimate anthropogenic CO2 emissions. Combining additional trace gases that are emitted with CO2 during combustion (e.g. CO or NO2) can help to infer urban CO2 emissions (Konovalov et al., 2016; Reuter et al., 2019; Hakkarainen et al., 2021; Park et al., 2021; D. Wu et al., 2022), especially during the growing season when the land biosphere absorbs atmospheric CO2.
We demonstrate the ability of using synthetic unbiased MicroCarb data to infer urban CO2 emissions, but there are additional limitations and uncertainties introduced by using real data that will have systematic and random errors (Broquet et al., 2018). Reducing random errors can be achieved by increasing the number of independent measurements. Addressing regional systematic errors is more difficult. For example, we find that column-averaged urban CO2 enhancements are typically less than 1 % of the atmospheric background column concentration (about 415 ppm), so that a regionally varying systematic measurement error of the order of 1 ppm would significantly degrade emission estimates inferred from the data. We expect that larger-scale systematic errors would be identified and corrected by ground-based remote sensing instruments (e.g. TCCON). Establishing city-scale ground-based atmospheric remote sensing networks would help correct regional systematic errors.
Estimating the regional background CO2 column concentration is important for quantifying the magnitude of urban CO2 enhancements due to net urban emissions, including anthropogenic and biospheric CO2 fluxes. A range of methods have been employed in different studies to quantify regional background values (Kort et al., 2012; Ye et al., 2020; Kiel et al., 2021). Here, we have sidestepped this issue by taking advantage of the closed-loop experiment configuration. To estimate city-scale CO2 emissions from real MicroCarb data, we will need to consider the additional uncertainty associated with the calculation of the elevated CO2 column. Here, we find that the three-sweep observing mode outperforms the two-sweep mode because of the larger number of observations that help to reduce random errors. The three-sweep mode also has a wider scan outside the urban plume that will help to reduce bias in estimating regional background CO2 values.
This study assumes unbiased and uncorrelated atmospheric transport errors. However, these errors are likely to be correlated at the sub-city scale. We acknowledge that X-STILT used in the study is not tuned for simulating elevated emissions given the use of a vertically integrated 2-D footprint. Future work will include the use of the vertically resolved footprint associated with each air parcel, and the vertical profiles of sector-specific emissions to improve the hyper-near-field simulations of point sources following prior approaches (Maier et al., 2022; Mallia et al., 2018). Also, relatively low (high) wind speed will produce the strong (weak) urban enhancement signals but are associated with relatively large (small) transport errors. Better understanding atmospheric transport and a priori flux errors is essential to improve the accuracy and precision of high-resolution urban a posteriori CO2 flux estimates. Our assumptions about atmospheric transport errors likely result in the best-case scenario for error reduction that can be achieved by the MicroCarb city-scan observing modes.
As with other polar-orbiting satellites, MicroCarb provides a limited amount of data over urban areas due to seasonal cloud cover (especially for mid-to-high-latitude cities) and elevated aerosol loading in urban areas, as well as because of their orbital configuration. As a result, the instrument will not see CO2 immediately overhead of some parts of the city, and some cloud-free pixels, particularly between cloud breaks, will likely have a bias due to 3-D cloud radiation effects (Massie et al., 2017). Table A1 lists the number and percentage of cloud-free data over our test cities. In Paris, 4 of the 9 d collect cloud-free data (the other 5 d are covered by cloud at 12:00 UTC). For these 4 d, only 40 %–50 % of the data are cloud-free. Lei et al. (2021) found only 17 % of OCO-2 soundings over the 70 most populated cities are of high quality, consistent with our calculations (18 %–22 %). The number of available measurements is reduced further considering the effective footprints over urban areas. Using satellites to collect data throughout the day over a particular location can only be achieved with a constellation of satellites or with a satellite in a geostationary orbit; neither solution is currently planned.
Seasonal biospheric uptake of CO2 within and around major cities will weaken observed CO2 gradients across cities that would otherwise be determined by anthropogenic emissions. The use of 14C isotope and CO has been demonstrated to separate fossil and biogenic fluxes inferred by ground-based atmospheric CO2 measurements (Turnbull et al., 2015; Basu et al., 2020; Miller et al., 2020; K. Wu et al., 2022). There are number of candidate approaches to alleviate this challenge for satellite-based CO2 inversions but none have been proven extensively. A coupled assimilation of CO2 with other trace gases that are co-emitted with anthropogenic CO2 emissions such as CO or NO2 provides constraints of the activity rates of individual anthropogenic sectors but still requires sector-based knowledge of emission factors. Likewise, being able to reliably relate net biospheric fluxes to data products observed from satellites could also help to isolate fossil fuel emissions of CO2 from natural fluxes over cities.
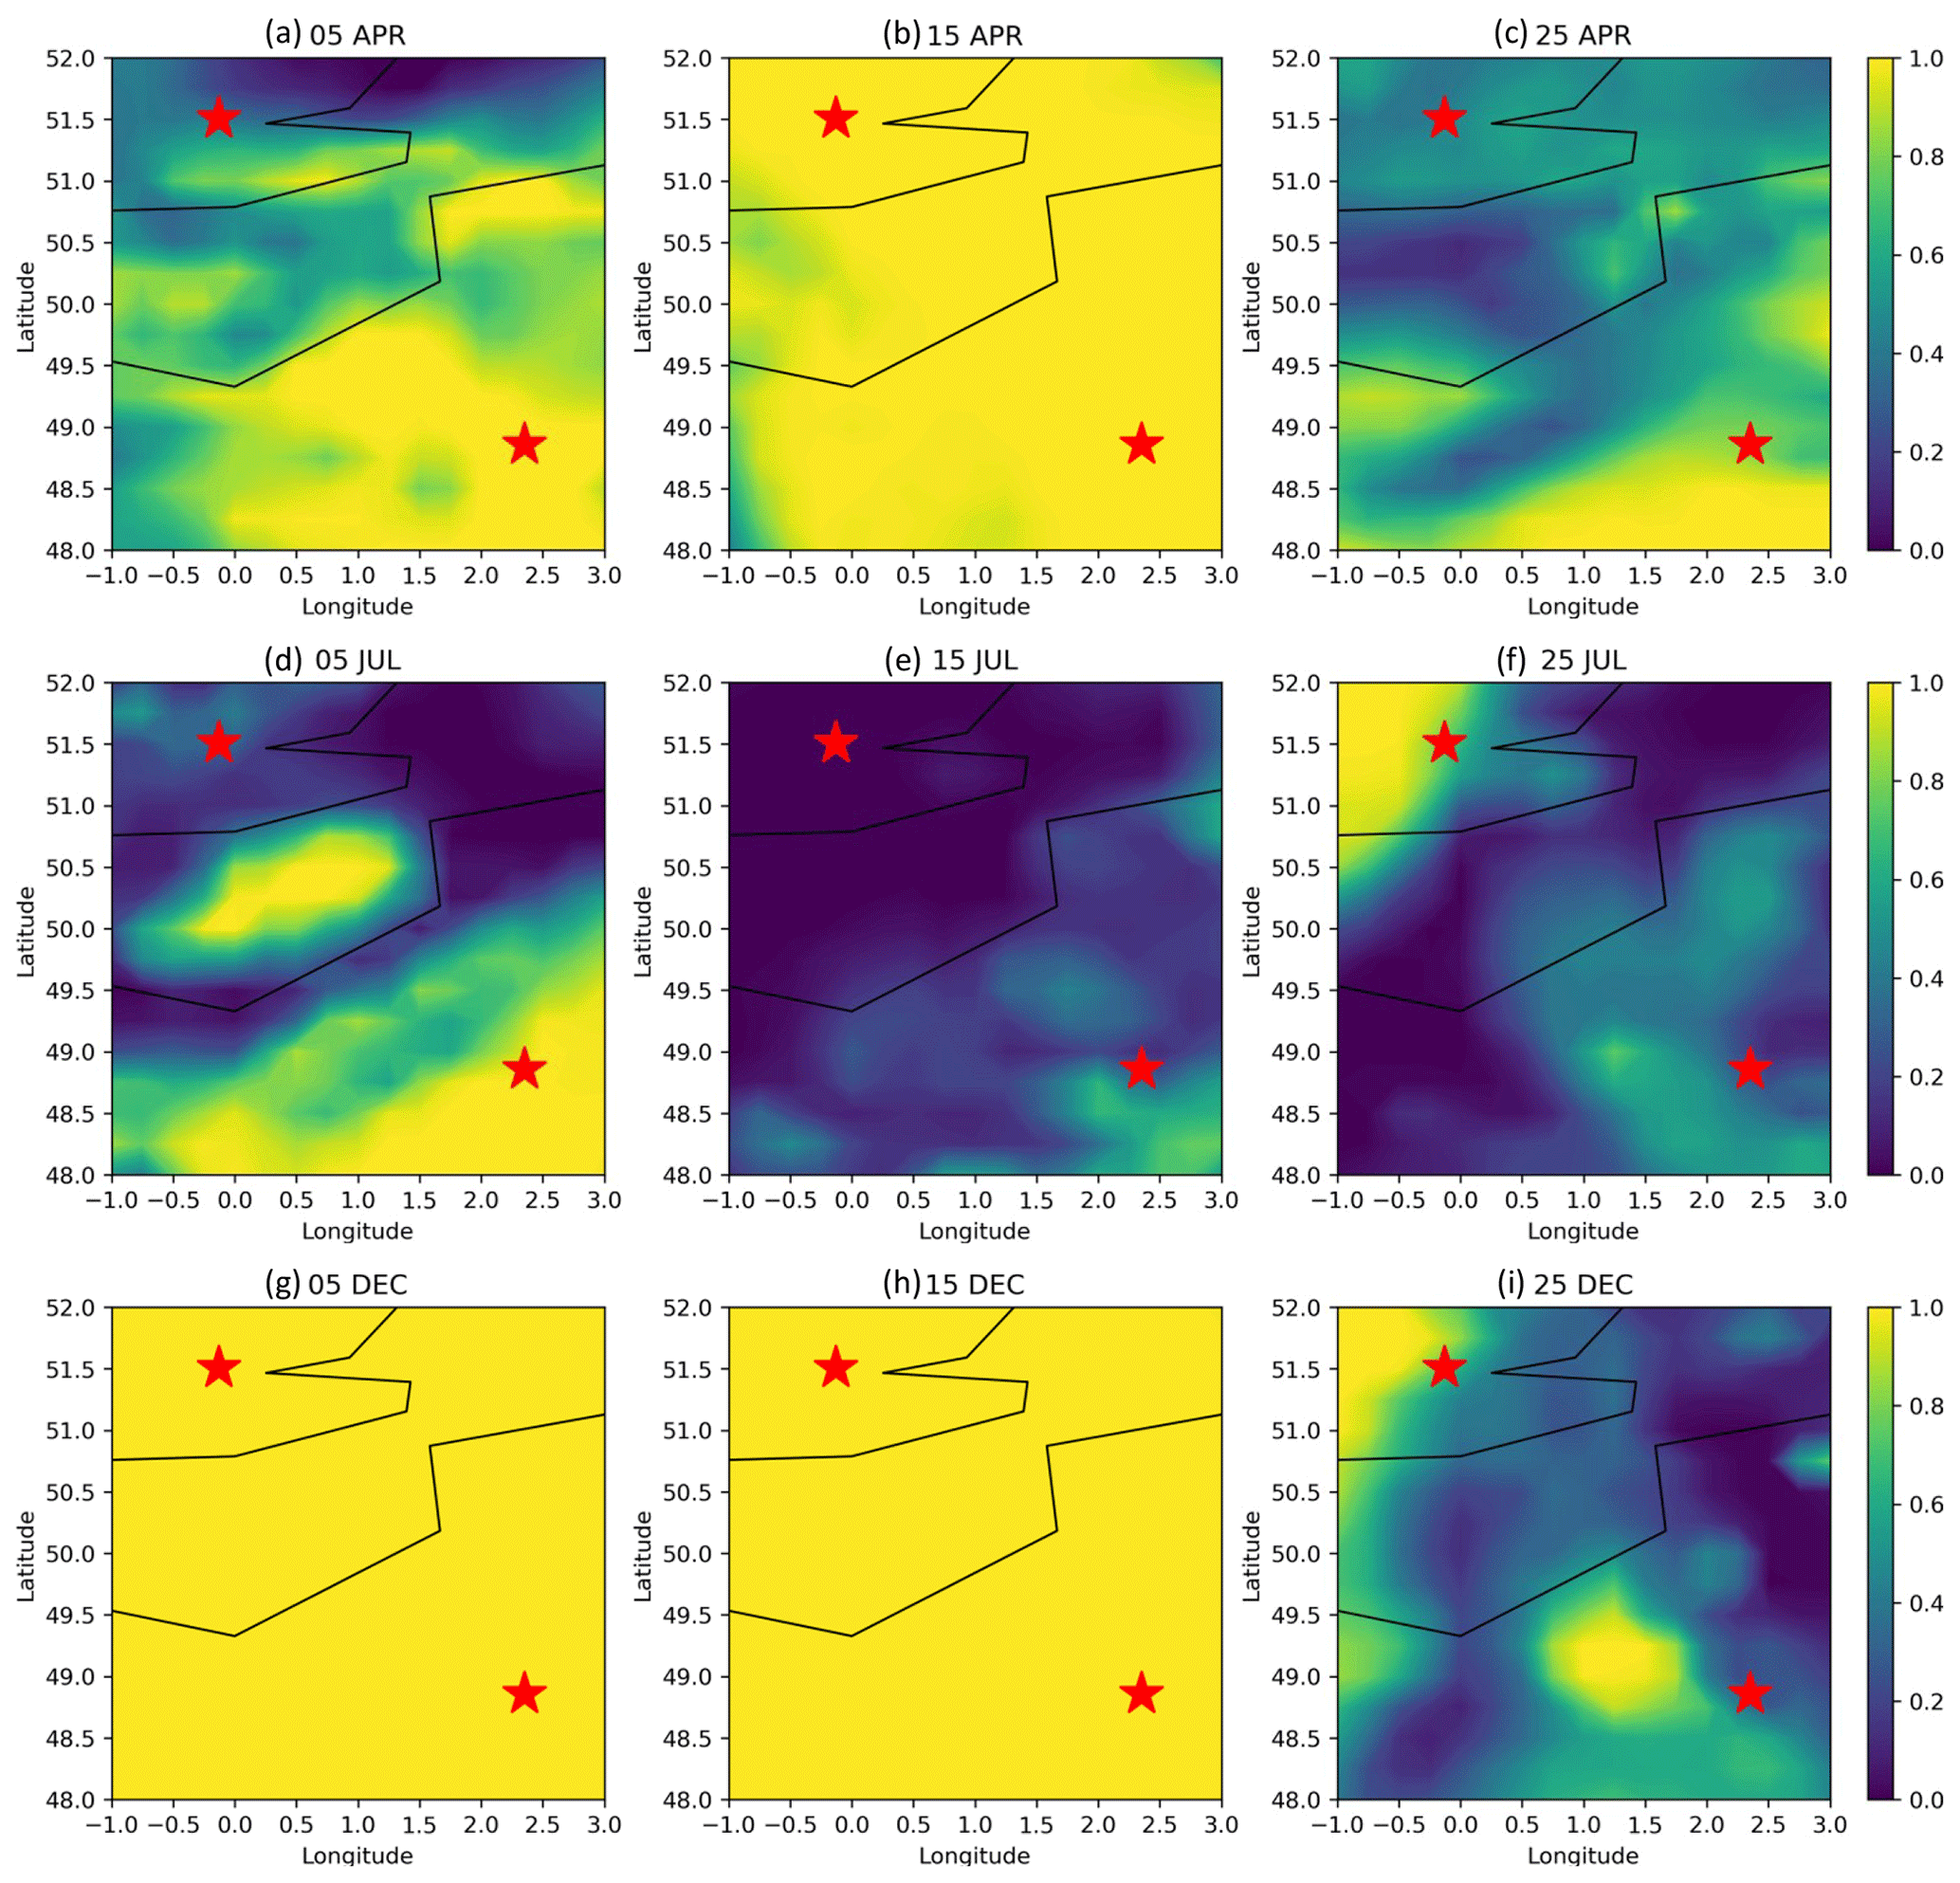
Figure A1ERA5 total cloud cover at 12:00 UTC on the 5th, 15th, and 25th in April, July, and December 2018 over Paris and London. The black lines are the coastline, and the red stars mark the city centre of Paris and London.
Table A1The number of cloud-free observations and their percentage relative to the total number of observations for the two-sweep (228) and three-sweep (342) modes in Paris and London. Bold numbers mark the dates that we artificially halve the cloud cover from 1 to 0.5; otherwise, there are no cloud-free samplings at 12:00 UTC on those dates.
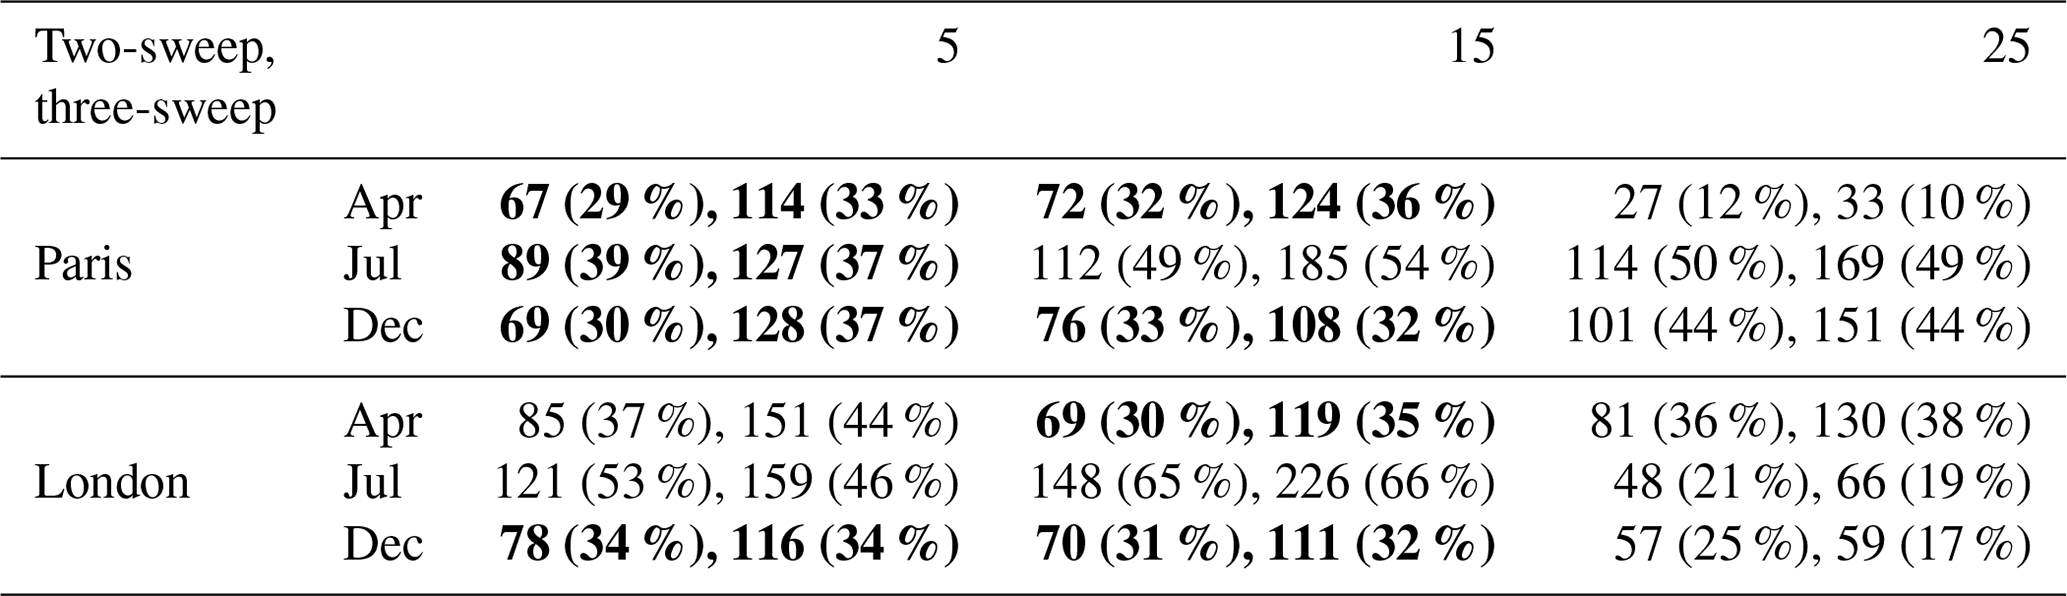
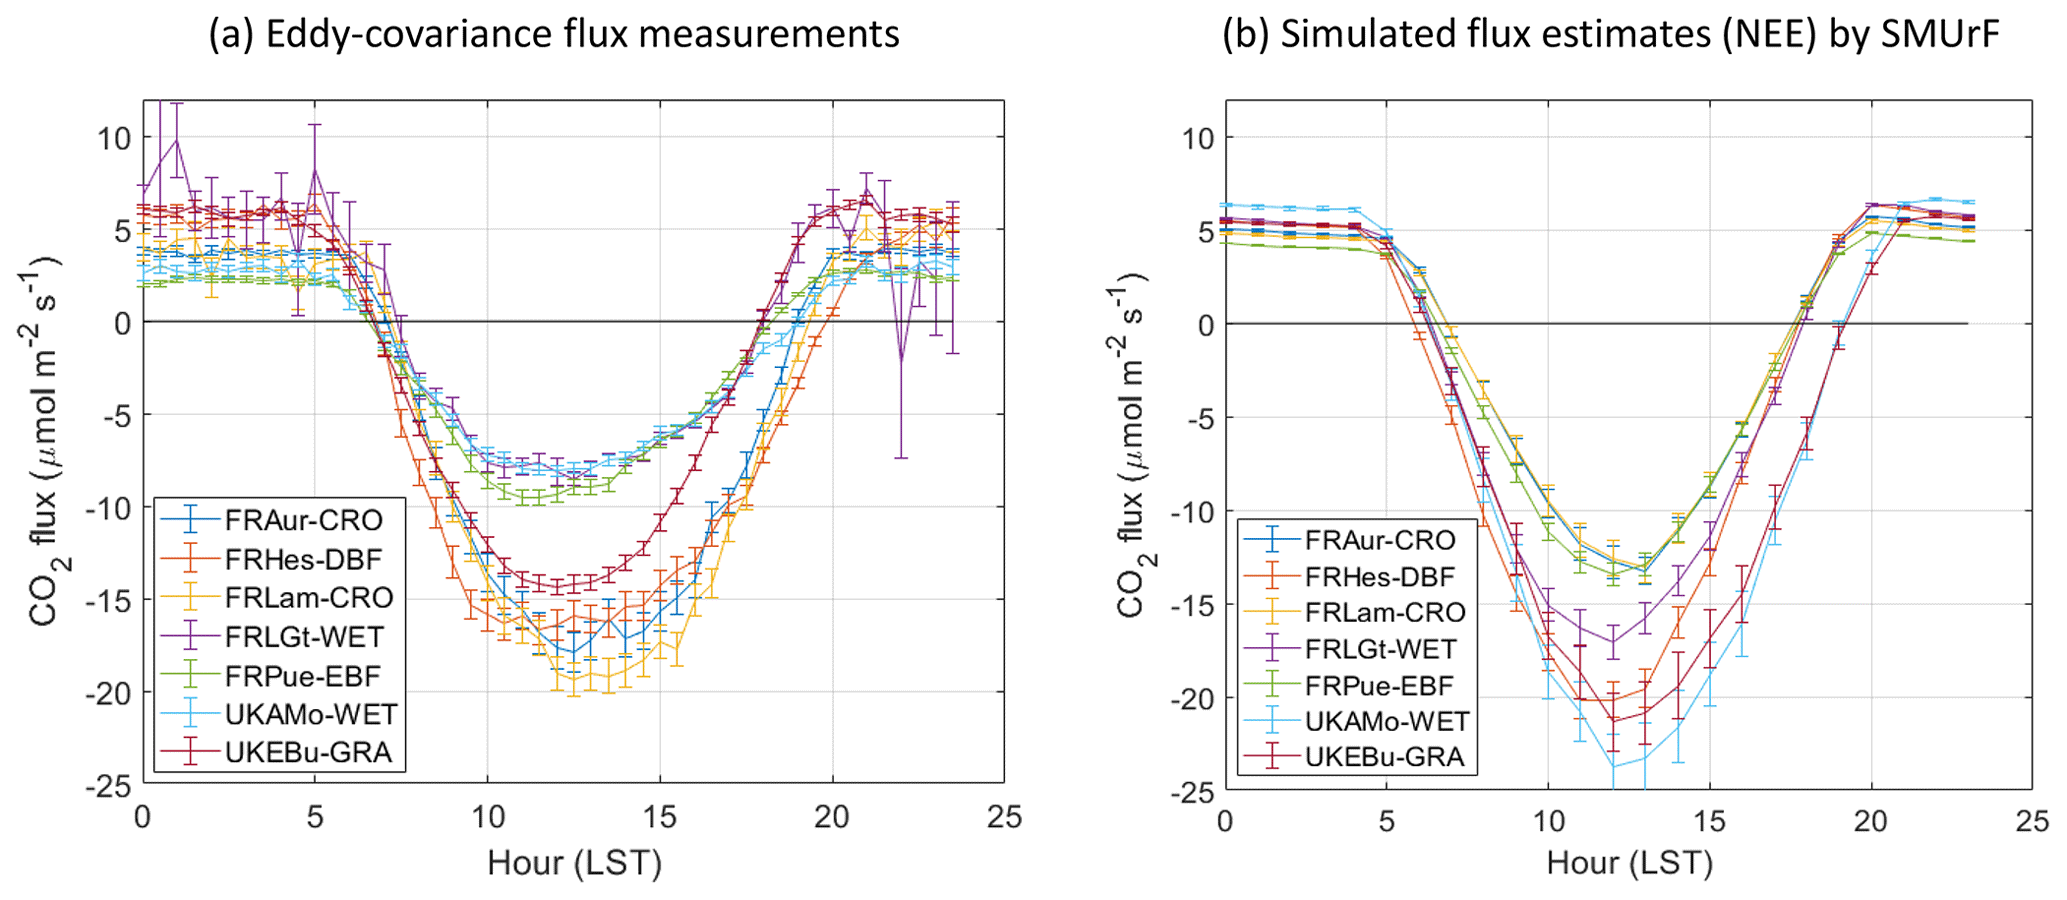
Figure A2Diurnal variation of seasonally averaged eddy-covariance flux measurements (a) and net ecosystem exchange (NEE) simulated by the SMUrF model (b). Error bars are the standard errors of the seasonal means. Flux data are downloaded from the European Fluxes Database Cluster, with five sites in France (FR-Aur, FR-Hes, FR-Lam, FR-LGt, and FR-Pue) and two sites in the UK (UK-AMo and UK-EBu). Site information is described on the website (http://www.europe-fluxdata.eu/home/sites-list). The land types are croplands (CRO), deciduous broadleaf forests (DBF), permanent wetlands (WET), evergreen broadleaf forests (EBF), and grasslands (GRA).
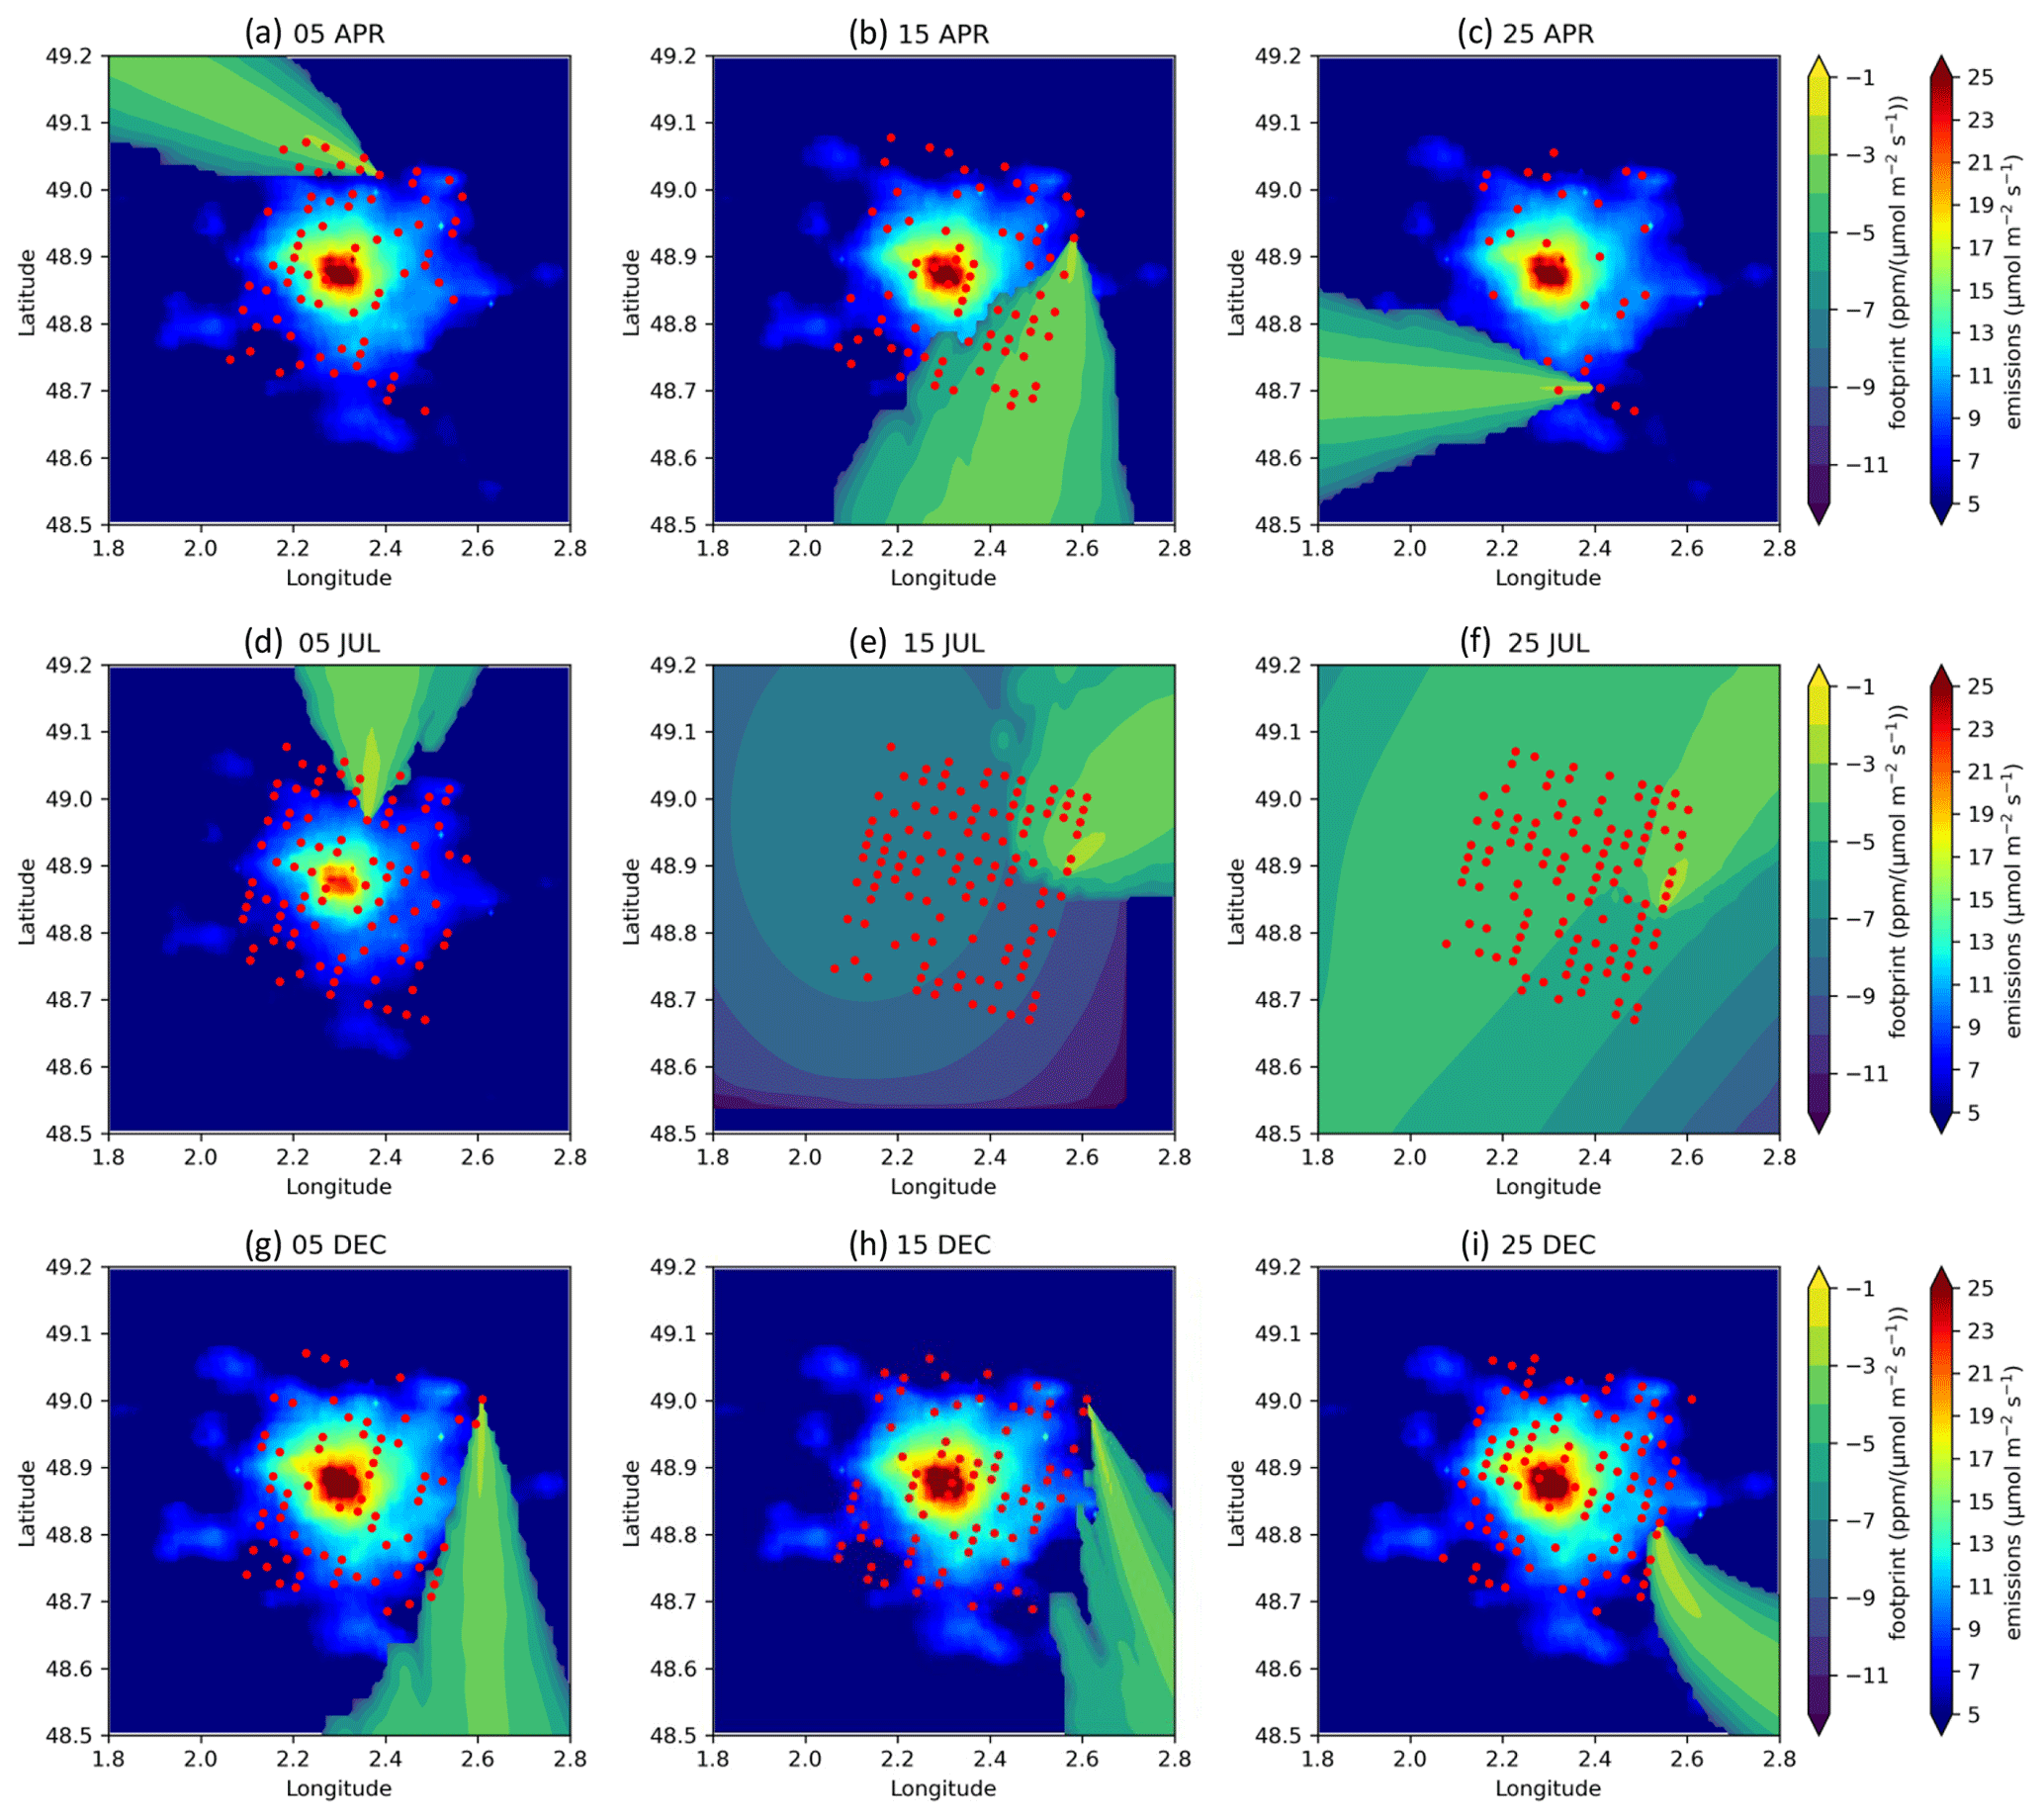
Figure A3Monthly mean ODIAC emissions and the simulated footprint of a cloud-free sampling in the two-sweep mode at 12:00 UTC on the 5th, 15th, and 25th in April, July, and December 2018 over Paris. The values for the footprint are displayed on a logarithmic colour scale.
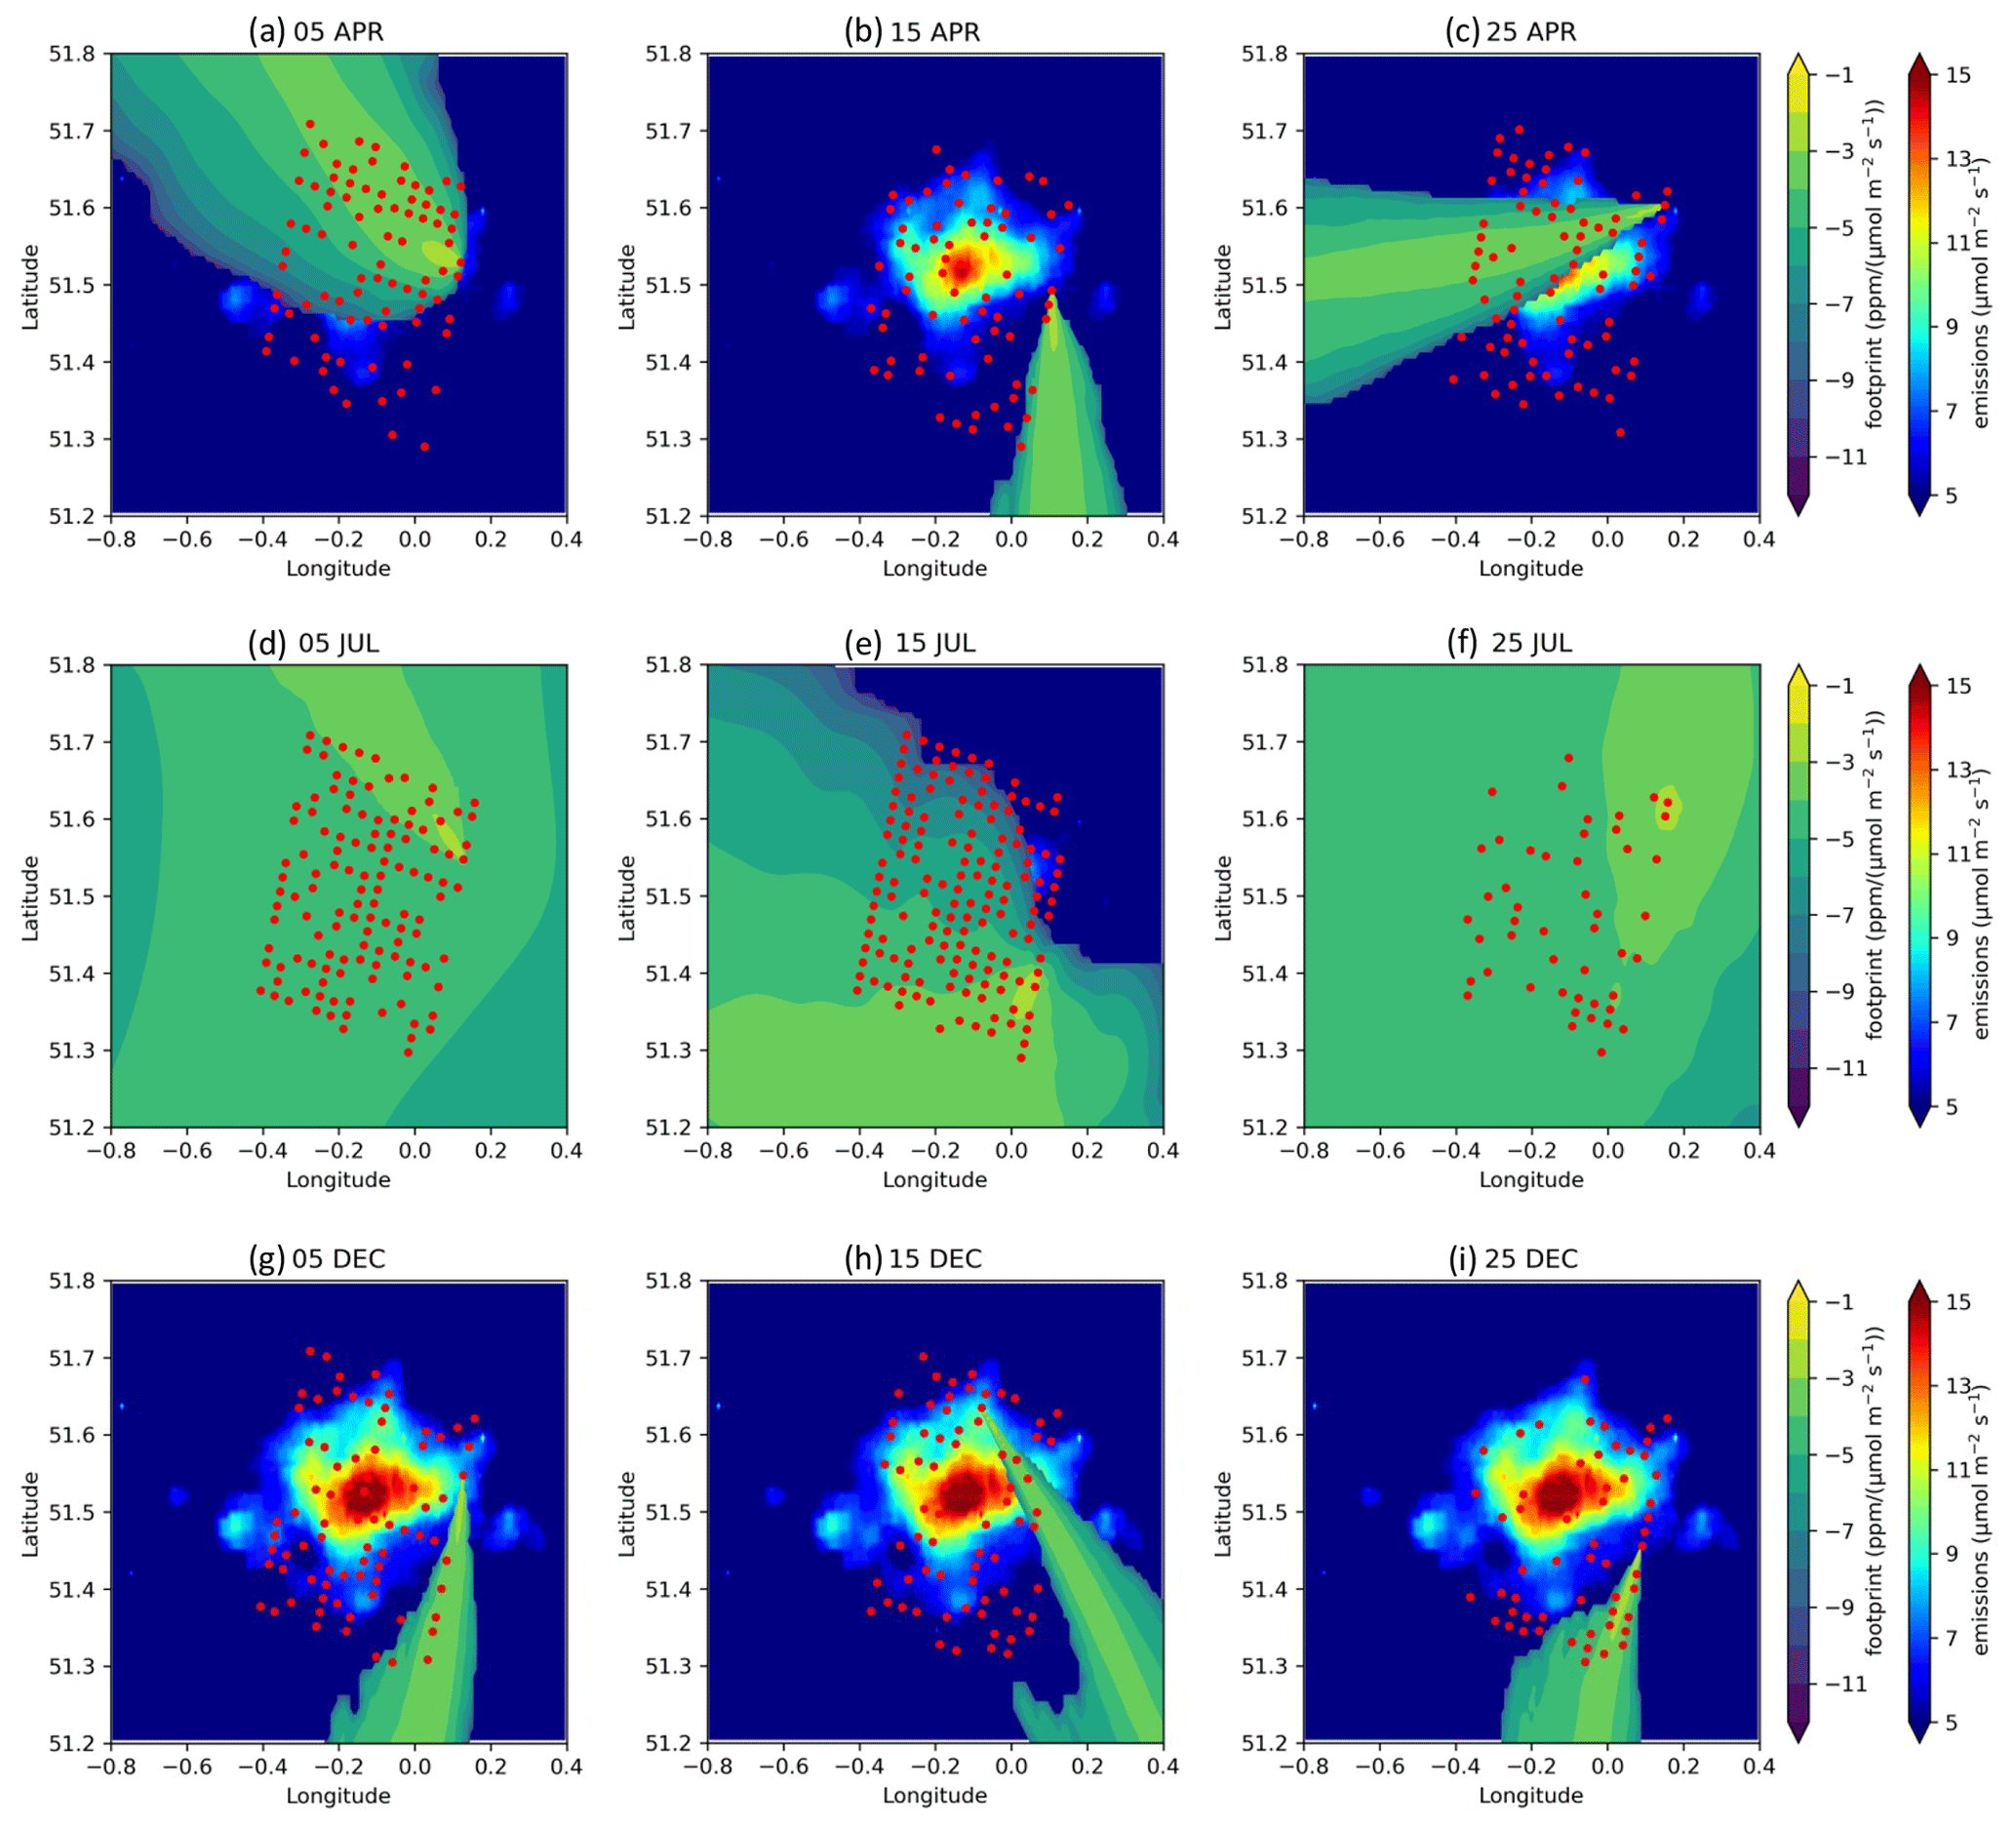
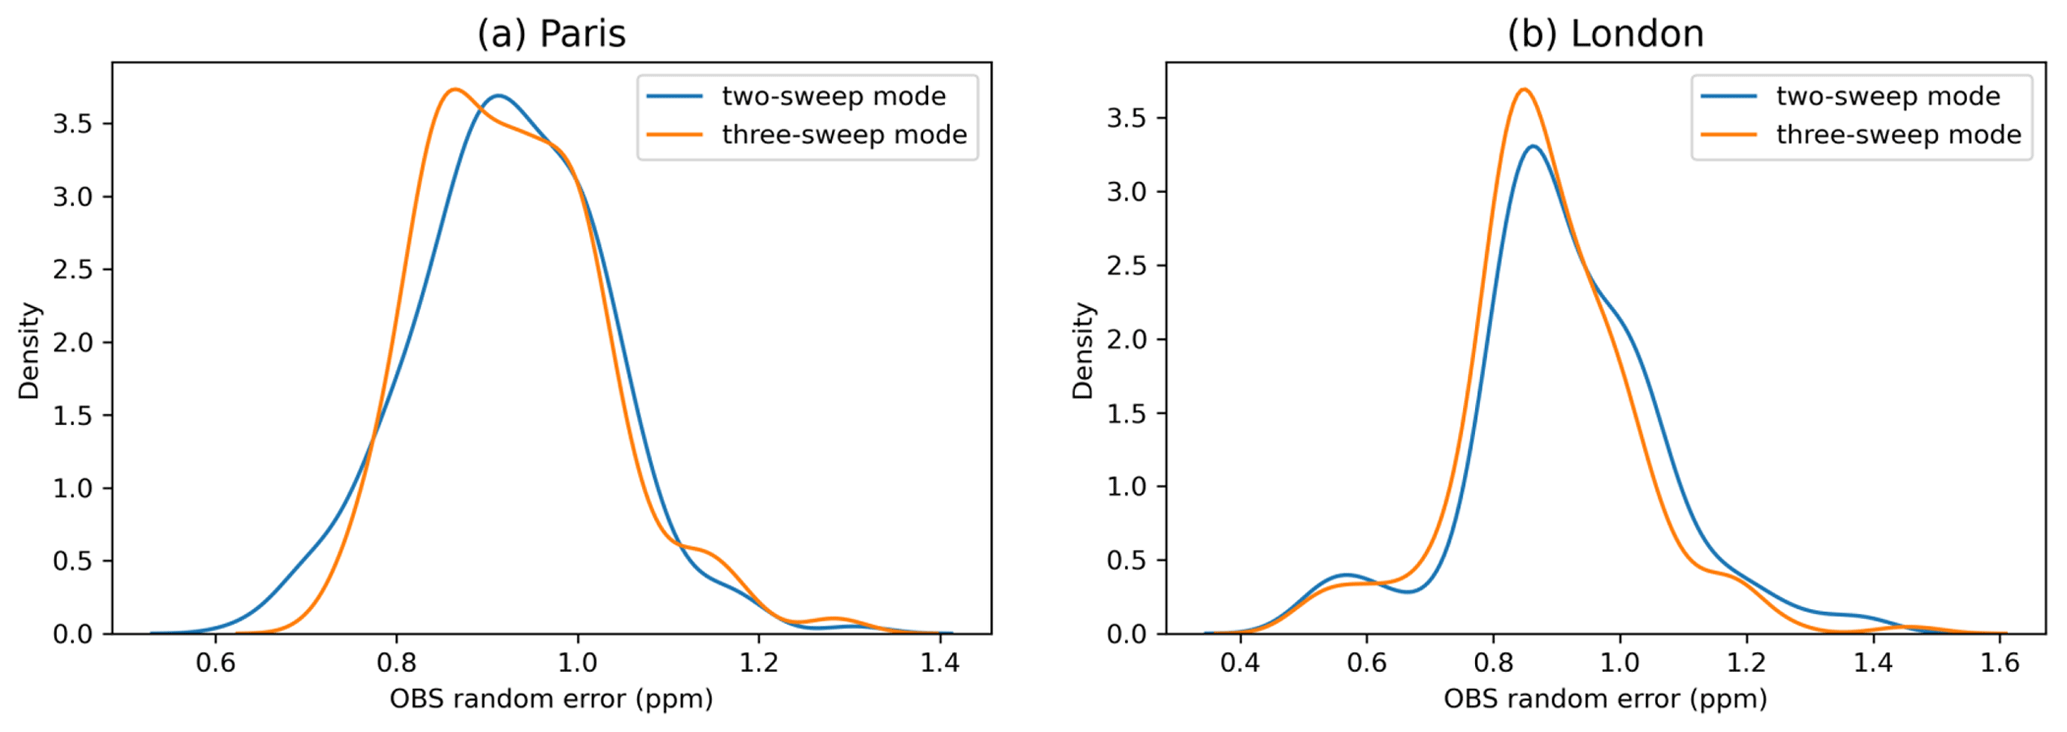
Figure A5Probability density of the observation uncertainty (random measurement error) in Paris (a) and London (b).
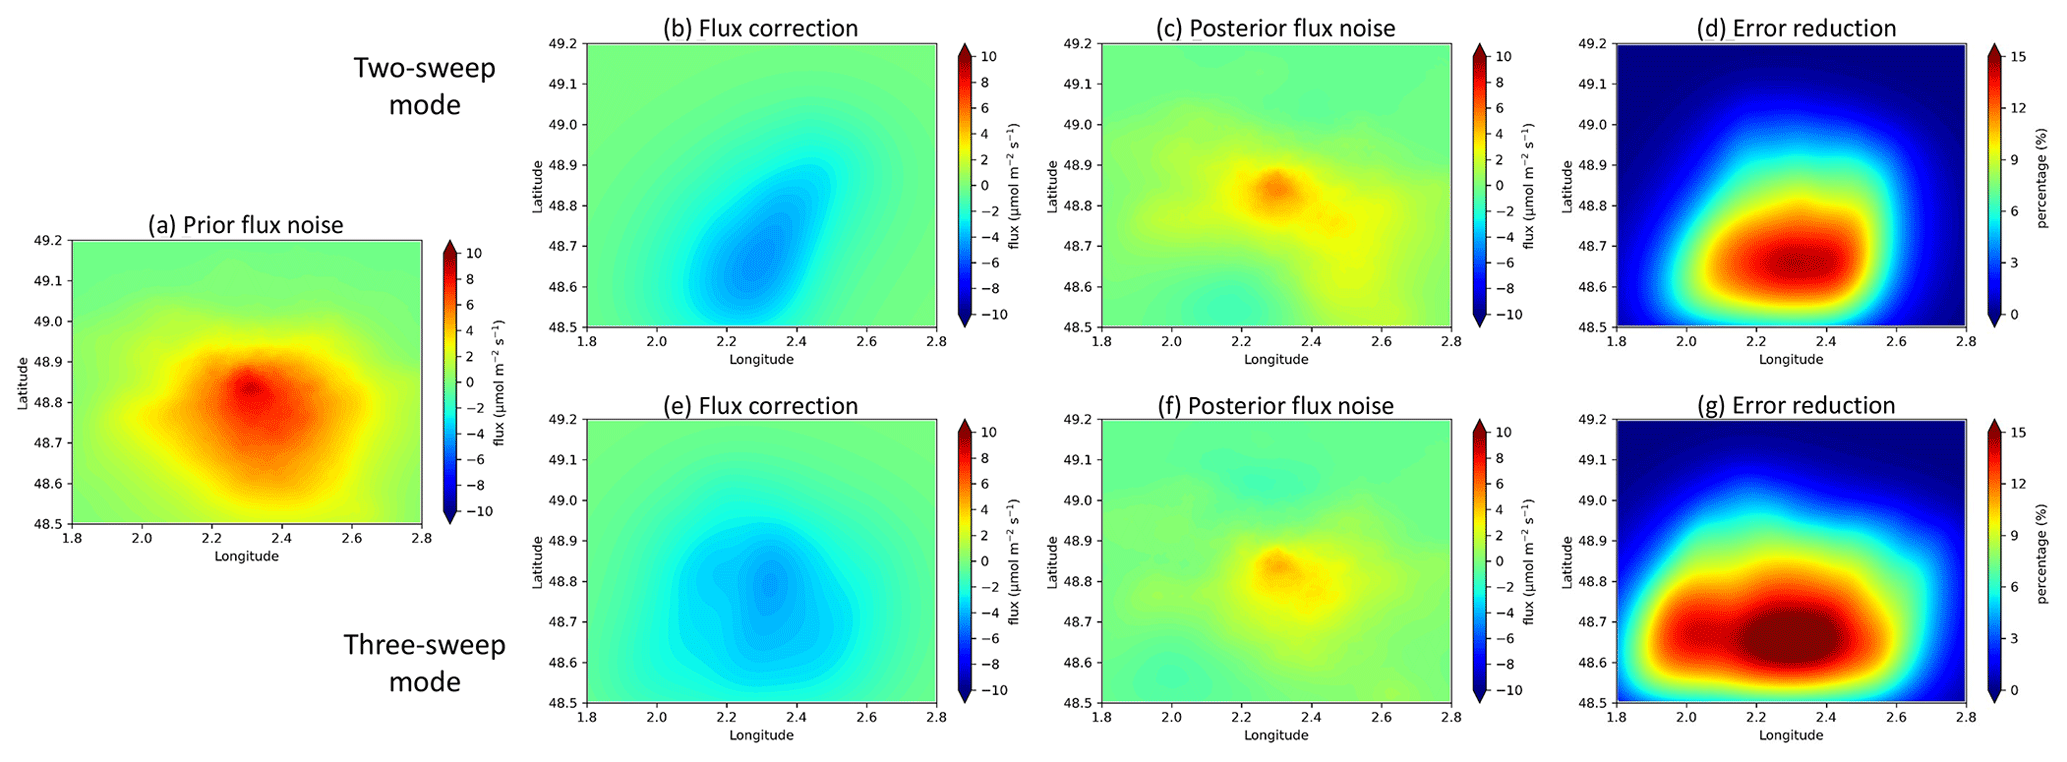
Figure A6Prior flux noise (prior state minus truth), flux correction (posterior minus prior state), posterior flux noise (posterior state minus truth), and flux error reduction using the cloud-free samplings of the two-sweep (b–d) and three-sweep (e–g) modes in Paris (considering only anthropogenic emissions.).

The ODIAC emission inventory is available at https://doi.org/10.17595/20170411.001 (Oda and Maksyutov, 2015), hosted by the Center for Global Environmental Research, National Institute for Environmental Studies (https://db.cger.nies.go.jp/dataset/ODIAC/, last access: 19 January 2023). Biogenic CO2 flux estimates from SMUrF are available at https://doi.org/10.3334/ORNLDAAC/1899 (Wu and Lin, 2021). The X-STILT model is available at https://doi.org/10.5281/zenodo.1241514 (Wu and Lin, 2022). Codes of this study are available upon request.
KW and PIP designed the experiments; KW conducted the calculations using the X-STILT model and input data provided by DW, DJ, and TO; LF provided suggestions in the cloud screening section; and KW and PIP analysed the results and wrote the paper, with comments from all co-authors.
The contact author has declared that none of the authors has any competing interests.
Publisher’s note: Copernicus Publications remains neutral with regard to jurisdictional claims in published maps and institutional affiliations.
We thank two anonymous reviewers for providing constructive comments. Paul I. Palmer acknowledges support from the UK National Centre for Earth Observation funded by the National Environment Research Council (NE/R016518/1).
This research has been supported by the UK Space Agency and the UK National Centre for Earth Observation funded by the National Environment Research Council (grant no. NE/R016518/1).
This paper was edited by Andre Butz and reviewed by two anonymous referees.
Basu, S., Lehman, S. J., Miller, J. B., Andrews, A. E., Sweeney, C., Gurney, K. R., Xu, X., Southon, J., and Tans, P. P.: Estimating US fossil fuel CO2 emissions from measurements of 14C in atmospheric CO2, P. Natl. Acad. Sci. USA, 117, 13300–13307, 2020. a
Bertaux, J.-L., Hauchecorne, A., Lefèvre, F., Bréon, F.-M., Blanot, L., Jouglet, D., Lafrique, P., and Akaev, P.: The use of the 1.27 µm O2 absorption band for greenhouse gas monitoring from space and application to MicroCarb, Atmos. Meas. Tech., 13, 3329–3374, https://doi.org/10.5194/amt-13-3329-2020, 2020. a
Boesch, H., Baker, D., Connor, B., Crisp, D., and Miller, C.: Global characterization of CO2 column retrievals from shortwave-infrared satellite observations of the Orbiting Carbon Observatory-2 mission, Remote Sens., 3, 270–304, 2011. a
Bréon, F. M., Broquet, G., Puygrenier, V., Chevallier, F., Xueref-Remy, I., Ramonet, M., Dieudonné, E., Lopez, M., Schmidt, M., Perrussel, O., and Ciais, P.: An attempt at estimating Paris area CO2 emissions from atmospheric concentration measurements, Atmos. Chem. Phys., 15, 1707–1724, https://doi.org/10.5194/acp-15-1707-2015, 2015. a
Broquet, G., Bréon, F.-M., Renault, E., Buchwitz, M., Reuter, M., Bovensmann, H., Chevallier, F., Wu, L., and Ciais, P.: The potential of satellite spectro-imagery for monitoring CO2 emissions from large cities, Atmos. Meas. Tech., 11, 681–708, https://doi.org/10.5194/amt-11-681-2018, 2018. a
Cai, Z., Liu, Y., and Yang, D.: Analysis of retrieval sensitivity using simulated Chinese Carbon Satellite (TanSat) measurements, Sci. China Earth Sci., 57, 1919–1928, 2014. a
Chaouad, R. and Verzeroli, M.: The urbanization of the world: Facts and challenges, Revue internationale et strategique, 112, 47–65, https://doi.org/10.3917/ris.112.0047, 2018. a
Chevallier, F., Broquet, G., Zheng, B., Ciais, P., and Eldering, A.: Large CO2 emitters as seen from satellite: comparison to a gridded global emission inventory, Geophys. Res. Lett., 49, e2021GL097540, https://doi.org/10.1029/2021GL097540, 2022. a
Crisp, D., Pollock, H. R., Rosenberg, R., Chapsky, L., Lee, R. A. M., Oyafuso, F. A., Frankenberg, C., O'Dell, C. W., Bruegge, C. J., Doran, G. B., Eldering, A., Fisher, B. M., Fu, D., Gunson, M. R., Mandrake, L., Osterman, G. B., Schwandner, F. M., Sun, K., Taylor, T. E., Wennberg, P. O., and Wunch, D.: The on-orbit performance of the Orbiting Carbon Observatory-2 (OCO-2) instrument and its radiometrically calibrated products, Atmos. Meas. Tech., 10, 59–81, https://doi.org/10.5194/amt-10-59-2017, 2017. a, b
Davis, K. J., Deng, A., Lauvaux, T., Miles, N. L., Richardson, S. J., Sarmiento, D. P., Gurney, K. R., Hardesty, R. M., Bonin, T. A., Brewer, A. W., Lamb, B. K., Shepson, P. B., Harvey, R. M., Cambaliza, M. O., Sweeney, C., Turnbull, J. C., Whetstone, J., and Karion, A.: The Indianapolis Flux Experiment (INFLUX): a test-bed for developing urban greenhouse gas emission measurements, Elem. Sci. Anth., 5, 21, https://doi.org/10.1525/elementa.188, 2017. a
Deng, A., Lauvaux, T., Davis, K. J., Gaudet, B. J., Miles, N. L., Richardson, S. J., Wu, K., Sarmiento, D. P., Hardesty, R. M., Bonin, T. A., Brewer, A. W., and Gurney, K. R.: Toward reduced transport errors in a high resolution urban CO2 inversion system, Elem. Sci. Anth., 5, 20, https://doi.org/10.1525/elementa.133, 2017. a
Eldering, A., Wennberg, P. O., Crisp, D., Schimel, D. S., Gunson, M. R., Chatterjee, A., Liu, J., Schwandner, F. M., Sun, Y., O’Dell, C. W., Frankenberg, C., Taylor, T., Fisher, B., Osterman, G. B., Wunch, D., Hakkarainen, J., Tamminen, J., and Weir, B.: The Orbiting Carbon Observatory-2 early science investigations of regional carbon dioxide fluxes, Science, 358, eaam5745, https://doi.org/10.1126/science.aam5745, 2017. a
Eldering, A., Taylor, T. E., O'Dell, C. W., and Pavlick, R.: The OCO-3 mission: measurement objectives and expected performance based on 1 year of simulated data, Atmos. Meas. Tech., 12, 2341–2370, https://doi.org/10.5194/amt-12-2341-2019, 2019. a
Enting, I. G.: Inverse Problems in Atmospheric Constituent Transport, Cambridge University Press, Cambridge, UK, https://doi.org/10.1017/CBO9780511535741, 2002. a
Fasoli, B., Lin, J. C., Bowling, D. R., Mitchell, L., and Mendoza, D.: Simulating atmospheric tracer concentrations for spatially distributed receptors: updates to the Stochastic Time-Inverted Lagrangian Transport model's R interface (STILT-R version 2), Geosci. Model Dev., 11, 2813–2824, https://doi.org/10.5194/gmd-11-2813-2018, 2018. a
Feng, L., Palmer, P. I., Bösch, H., and Dance, S.: Estimating surface CO2 fluxes from space-borne CO2 dry air mole fraction observations using an ensemble Kalman Filter, Atmos. Chem. Phys., 9, 2619–2633, https://doi.org/10.5194/acp-9-2619-2009, 2009. a
Finch, D. P., Palmer, P. I., and Zhang, T.: Automated detection of atmospheric NO2 plumes from satellite data: a tool to help infer anthropogenic combustion emissions, Atmos. Meas. Tech., 15, 721–733, https://doi.org/10.5194/amt-15-721-2022, 2022. a
Goldberg, D. L., Lu, Z., Oda, T., Lamsal, L. N., Liu, F., Griffin, D., McLinden, C. A., Krotkov, N. A., Duncan, B. N., and Streets, D. G.: Exploiting OMI NO2 satellite observations to infer fossil-fuel CO2 emissions from US megacities, Sci. Total Environ., 695, 133805, https://doi.org/10.1016/j.scitotenv.2019.133805, 2019. a
Hakkarainen, J., Ialongo, I., and Tamminen, J.: Direct space-based observations of anthropogenic CO2 emission areas from OCO-2, Geophys. Res. Lett., 43, 11–400, 2016. a
Hakkarainen, J., Szeląg, M. E., Ialongo, I., Retscher, C., Oda, T., and Crisp, D.: Analyzing nitrogen oxides to carbon dioxide emission ratios from space: A case study of Matimba Power Station in South Africa, Atmos. Environ. X, 10, 100110, https://doi.org/10.1016/j.aeaoa.2021.100110, 2021. a, b
Hedelius, J. K., Feng, S., Roehl, C. M., Wunch, D., Hillyard, P. W., Podolske, J. R., Iraci, L. T., Patarasuk, R., Rao, P., O'Keeffe, D., Gurney, K. R., Lauvaux, T., and Wennberg, P. O.: Emissions and topographic effects on column CO2 () variations, with a focus on the Southern California Megacity, J. Geophys. Res.-Atmos., 122, 7200–7215, 2017. a
Hedelius, J. K., Liu, J., Oda, T., Maksyutov, S., Roehl, C. M., Iraci, L. T., Podolske, J. R., Hillyard, P. W., Liang, J., Gurney, K. R., Wunch, D., and Wennberg, P. O.: Southern California megacity CO2, CH4, and CO flux estimates using ground- and space-based remote sensing and a Lagrangian model, Atmos. Chem. Phys., 18, 16271–16291, https://doi.org/10.5194/acp-18-16271-2018, 2018. a
Helfter, C., Tremper, A. H., Halios, C. H., Kotthaus, S., Bjorkegren, A., Grimmond, C. S. B., Barlow, J. F., and Nemitz, E.: Spatial and temporal variability of urban fluxes of methane, carbon monoxide and carbon dioxide above London, UK, Atmos. Chem. Phys., 16, 10543–10557, https://doi.org/10.5194/acp-16-10543-2016, 2016. a
Hersbach, H., Bell, B., Berrisford, P., Biavati, G., Horányi, A., Muñoz Sabater, J., Nicolas, J., Peubey, C., Radu, R., Rozum, I., Schepers, D., Simmons, A., Soci, C., Dee, D., and Thépaut, J.-N.: ERA5 hourly data on single levels from 1979 to present, Copernicus Climate Change Service (C3S) Climate Data Store (CDS) [data set], https://doi.org/10.24381/cds.adbb2d47, 2018. a
Ionov, D. V., Makarova, M. V., Hase, F., Foka, S. C., Kostsov, V. S., Alberti, C., Blumenstock, T., Warneke, T., and Virolainen, Y. A.: The CO2 integral emission by the megacity of St Petersburg as quantified from ground-based FTIR measurements combined with dispersion modelling, Atmos. Chem. Phys., 21, 10939–10963, https://doi.org/10.5194/acp-21-10939-2021, 2021. a
Janardanan, R., Maksyutov, S., Oda, T., Saito, M., Kaiser, J. W., Ganshin, A., Stohl, A., Matsunaga, T., Yoshida, Y., and Yokota, T.: Comparing GOSAT observations of localized CO2 enhancements by large emitters with inventory-based estimates, Geophys. Res. Lett., 43, 3486–3493, 2016. a
Jouglet, D., Landiech, P., Breon, F.-M., and the MicroCarb team: MicroCarb, first European program for CO2 monitoring: nearing development conclusion before launch, IWGGMS-17 virtual meeting, 14–17 June 2021, NASA, https://cce-datasharing.gsfc.nasa.gov/files/conference_presentations/Talk_Jouglet_35_25.pdf (last access: 30 January 2023), 2021. a
Kiel, M., Eldering, A., Roten, D. D., Lin, J. C., Feng, S., Lei, R., Lauvaux, T., Oda, T., Roehl, C. M., Blavier, J.-F., and Iraci, L. T.: Urban-focused satellite CO2 observations from the Orbiting Carbon Observatory-3: A first look at the Los Angeles megacity, Remote Sens. Environ., 258, 112314, https://doi.org/10.1016/j.rse.2021.112314, 2021. a, b, c
Konovalov, I. B., Berezin, E. V., Ciais, P., Broquet, G., Zhuravlev, R. V., and Janssens-Maenhout, G.: Estimation of fossil-fuel CO2 emissions using satellite measurements of “proxy” species, Atmos. Chem. Phys., 16, 13509–13540, https://doi.org/10.5194/acp-16-13509-2016, 2016. a, b
Kort, E. A., Frankenberg, C., Miller, C. E., and Oda, T.: Space-based observations of megacity carbon dioxide, Geophys. Res. Lett., 39, L17806, https://doi.org/10.1029/2012GL052738, 2012. a, b, c
Kuhlmann, G., Brunner, D., Broquet, G., and Meijer, Y.: Quantifying CO2 emissions of a city with the Copernicus Anthropogenic CO2 Monitoring satellite mission, Atmos. Meas. Tech., 13, 6733–6754, https://doi.org/10.5194/amt-13-6733-2020, 2020. a
Kunik, L., Mallia, D. V., Gurney, K. R., Mendoza, D. L., Oda, T., and Lin, J. C.: Bayesian inverse estimation of urban CO2 emissions: results from a synthetic data simulation over Salt Lake City, UT, Elem. Sci. Anth., 7, 36, https://doi.org/10.1525/elementa.375, 2019. a
Lauvaux, T., Miles, N. L., Deng, A., Richardson, S. J., Cambaliza, M. O., Davis, K. J., Gaudet, B., Gurney, K. R., Huang, J., O'Keefe, D., Song, Y., Karion, A., Oda, T., Patarasuk, R., Razlivanov, I., Sarmiento, D., Shepson, P., Sweeney, C., Turnbull, J., and Wu, K.: High-resolution atmospheric inversion of urban CO2 emissions during the dormant season of the Indianapolis Flux Experiment (INFLUX), J. Geophys. Res.-Atmos., 121, 5213–5236, 2016. a
Lauvaux, T., Díaz-Isaac, L. I., Bocquet, M., and Bousserez, N.: Diagnosing spatial error structures in CO2 mole fractions and XCO2 column mole fractions from atmospheric transport, Atmos. Chem. Phys., 19, 12007–12024, https://doi.org/10.5194/acp-19-12007-2019, 2019. a
Lei, R., Feng, S., Danjou, A., Broquet, G., Wu, D., Lin, J. C., O'Dell, C. W., and Lauvaux, T.: Fossil fuel CO2 emissions over metropolitan areas from space: A multi-model analysis of OCO-2 data over Lahore, Pakistan, Remote Sens. Environ., 264, 112625, https://doi.org/10.1016/j.rse.2021.112625, 2021. a, b
Lin, J., Gerbig, C., Wofsy, S., Andrews, A., Daube, B., Davis, K., and Grainger, C.: A near-field tool for simulating the upstream influence of atmospheric observations: The Stochastic Time-Inverted Lagrangian Transport (STILT) model, J. Geophys. Res.-Atmos., 108, 4493, https://doi.org/10.1029/2002JD003161, 2003. a
Liu, Y., Wang, J., Yao, L., Chen, X., Cai, Z., Yang, D., Yin, Z., Gu, S., Tian, L., Lu, N., and Lyu, D.: The TanSat mission: preliminary global observations, Sci. Bull., 63, 1200–1207, 2018. a
Lopez, M., Schmidt, M., Delmotte, M., Colomb, A., Gros, V., Janssen, C., Lehman, S. J., Mondelain, D., Perrussel, O., Ramonet, M., Xueref-Remy, I., and Bousquet, P.: CO, NOx and 13CO2 as tracers for fossil fuel CO2: results from a pilot study in Paris during winter 2010, Atmos. Chem. Phys., 13, 7343–7358, https://doi.org/10.5194/acp-13-7343-2013, 2013. a
Maier, F., Gerbig, C., Levin, I., Super, I., Marshall, J., and Hammer, S.: Effects of point source emission heights in WRF–STILT: a step towards exploiting nocturnal observations in models, Geosci. Model Dev., 15, 5391–5406, https://doi.org/10.5194/gmd-15-5391-2022, 2022. a
Makarova, M. V., Alberti, C., Ionov, D. V., Hase, F., Foka, S. C., Blumenstock, T., Warneke, T., Virolainen, Y. A., Kostsov, V. S., Frey, M., Poberovskii, A. V., Timofeyev, Y. M., Paramonova, N. N., Volkova, K. A., Zaitsev, N. A., Biryukov, E. Y., Osipov, S. I., Makarov, B. K., Polyakov, A. V., Ivakhov, V. M., Imhasin, H. Kh., and Mikhailov, E. F.: Emission Monitoring Mobile Experiment (EMME): an overview and first results of the St. Petersburg megacity campaign 2019, Atmos. Meas. Tech., 14, 1047–1073, https://doi.org/10.5194/amt-14-1047-2021, 2021. a
Mallia, D. V., Kochanski, A. K., Urbanski, S. P., and Lin, J. C.: Optimizing smoke and plume rise modeling approaches at local scales, Atmosphere, 9, 166, https://doi.org/10.3390/atmos9050166, 2018. a
Mallia, D. V., Mitchell, L. E., Kunik, L., Fasoli, B., Bares, R., Gurney, K. R., Mendoza, D. L., and Lin, J. C.: Constraining urban CO2 emissions using mobile observations from a light rail public transit platform, Environ. Sci. Technol., 54, 15613–15621, 2020. a
Massie, S. T., Sebastian Schmidt, K., Eldering, A., and Crisp, D.: Observational evidence of 3-D cloud effects in OCO-2 CO2 retrievals, J. Geophys. Res.-Atmos., 122, 7064–7085, 2017. a, b
Masson-Delmotte, V., Zhai, P., Pörtner, H.-O., Roberts, D., Skea, J., Shukla, P. R., Pirani, A., Moufouma-Okia, W., Péan, C., Pidcock, R., and the IPCC team: Global warming of 1.5 ∘C, An IPCC Special Report on the impacts of global warming of 1.5 ∘C, IPCC, 1, 43–50, https://doi.org/10.1017/9781009157940, 2018. a
Masson-Delmotte, V., Zhai, P., Pirani, A., Connors, S. L., Péan, C., Berger, S., Caud, N., Chen, Y., Goldfarb, L., Gomis, M. I., Huang, M., Leitzell, K., Lonnoy, E., Matthews, J. B. R., Maycock, T. K., Waterfield, T., Yelekçi, O., Yu, R., and Zhou, B.: Climate change 2021: the physical science basis, Contribution of working group I to the sixth assessment report of the intergovernmental panel on climate change, Cambridge University Press, Cambridge, 2391 pp., https://www.ipcc.ch/report/ar6/wg1/ (last access: 30 January 2023), 2021. a
Miller, J. B., Lehman, S. J., Verhulst, K. R., Miller, C. E., Duren, R. M., Yadav, V., Newman, S., and Sloop, C. D.: Large and seasonally varying biospheric CO2 fluxes in the Los Angeles megacity revealed by atmospheric radiocarbon, P. Natl. Acad. Sci. USA, 117, 26681–26687, 2020. a
Morino, I., Uchino, O., Inoue, M., Yoshida, Y., Yokota, T., Wennberg, P. O., Toon, G. C., Wunch, D., Roehl, C. M., Notholt, J., Warneke, T., Messerschmidt, J., Griffith, D. W. T., Deutscher, N. M., Sherlock, V., Connor, B., Robinson, J., Sussmann, R., and Rettinger, M.: Preliminary validation of column-averaged volume mixing ratios of carbon dioxide and methane retrieved from GOSAT short-wavelength infrared spectra, Atmos. Meas. Tech., 4, 1061–1076, https://doi.org/10.5194/amt-4-1061-2011, 2011. a
National Centers for Environmental Prediction, National Weather Service, NOAA, U.S. Department of Commerce: NCEP GFS 0.25 Degree Global Forecast Grids Historical Archive, Research Data Archive at the National Center for Atmospheric Research, Computational and Information Systems Laboratory, https://doi.org/10.5065/D65D8PWK, 2015. a
Oda, T. and Maksyutov, S.: A very high-resolution (1 km × 1 km) global fossil fuel CO2 emission inventory derived using a point source database and satellite observations of nighttime lights, Atmos. Chem. Phys., 11, 543–556, https://doi.org/10.5194/acp-11-543-2011, 2011. a
Oda, T. and Maksyutov, S.: ODIAC Fossil Fuel CO2 Emissions Dataset (Version name: ODIAC2020b), Center for Global Environmental Research, National Institute for Environmental Studies [data set], https://doi.org/10.17595/20170411.001, 2015. a
Oda, T., Lauvaux, T., Lu, D., Rao, P., Miles, N. L., Richardson, S. J., and Gurney, K. R.: On the impact of granularity of space-based urban CO2 emissions in urban atmospheric inversions: A case study for Indianapolis, IN, Elem. Sci. Anth., 5, 28, https://doi.org/10.1525/elementa.146, 2017. a
Oda, T., Maksyutov, S., and Andres, R. J.: The Open-source Data Inventory for Anthropogenic CO2, version 2016 (ODIAC2016): a global monthly fossil fuel CO2 gridded emissions data product for tracer transport simulations and surface flux inversions, Earth Syst. Sci. Data, 10, 87–107, https://doi.org/10.5194/essd-10-87-2018, 2018. a
Oda, T., Bun, R., Kinakh, V., Topylko, P., Halushchak, M., Marland, G., Lauvaux, T., Jonas, M., Maksyutov, S., Nahorski, Z., Lesiv, M., Danylo, O., and Horabik-Pyzel, J.: Errors and uncertainties in a gridded carbon dioxide emissions inventory, Mitig. Adapt. Strat. Gl., 24, 1007–1050, 2019. a
O'Dell, C. W., Eldering, A., Wennberg, P. O., Crisp, D., Gunson, M. R., Fisher, B., Frankenberg, C., Kiel, M., Lindqvist, H., Mandrake, L., Merrelli, A., Natraj, V., Nelson, R. R., Osterman, G. B., Payne, V. H., Taylor, T. E., Wunch, D., Drouin, B. J., Oyafuso, F., Chang, A., McDuffie, J., Smyth, M., Baker, D. F., Basu, S., Chevallier, F., Crowell, S. M. R., Feng, L., Palmer, P. I., Dubey, M., García, O. E., Griffith, D. W. T., Hase, F., Iraci, L. T., Kivi, R., Morino, I., Notholt, J., Ohyama, H., Petri, C., Roehl, C. M., Sha, M. K., Strong, K., Sussmann, R., Te, Y., Uchino, O., and Velazco, V. A.: Improved retrievals of carbon dioxide from Orbiting Carbon Observatory-2 with the version 8 ACOS algorithm, Atmos. Meas. Tech., 11, 6539–6576, https://doi.org/10.5194/amt-11-6539-2018, 2018. a
Palmer, P. I., Barnett, J., Eyre, J., and Healy, S.: A nonlinear optimal estimation inverse method for radio occultation measurements of temperature, humidity, and surface pressure, J. Geophys. Res.-Atmos., 105, 17513–17526, 2000. a
Palmer, P. I., Feng, L., and Bösch, H.: Spatial resolution of tropical terrestrial CO2 fluxes inferred using space-borne column CO2 sampled in different earth orbits: the role of spatial error correlations, Atmos. Meas. Tech., 4, 1995–2006, https://doi.org/10.5194/amt-4-1995-2011, 2011. a
Park, H., Jeong, S., Park, H., Labzovskii, L. D., and Bowman, K. W.: An assessment of emission characteristics of Northern Hemisphere cities using spaceborne observations of CO2, CO, and NO2, Remote Sens. Environ., 254, 112246, https://doi.org/10.1016/j.rse.2020.112246, 2021. a, b
Pascal, V., Buil, C., Loesel, J., Tauziede, L., Jouglet, D., and Buisson, F.: An improved microcarb dispersive instrumental concept for the measurement of greenhouse gases concentration in the atmosphere, in: International Conference on Space Optics – ICSO 2014, 7–10 October 2014, Tenerife, Spain, SPIE, vol. 10563, 1028–1036, https://doi.org/10.1117/12.2304219, 2017. a
Pitt, J. R., Allen, G., Bauguitte, S. J.-B., Gallagher, M. W., Lee, J. D., Drysdale, W., Nelson, B., Manning, A. J., and Palmer, P. I.: Assessing London CO2, CH4 and CO emissions using aircraft measurements and dispersion modelling, Atmos. Chem. Phys., 19, 8931–8945, https://doi.org/10.5194/acp-19-8931-2019, 2019. a
Reuter, M., Buchwitz, M., Schneising, O., Krautwurst, S., O'Dell, C. W., Richter, A., Bovensmann, H., and Burrows, J. P.: Towards monitoring localized CO2 emissions from space: co-located regional CO2 and NO2 enhancements observed by the OCO-2 and S5P satellites, Atmos. Chem. Phys., 19, 9371–9383, https://doi.org/10.5194/acp-19-9371-2019, 2019. a, b
Rodgers, C. D.: Inverse methods for atmospheric sounding: theory and practice, World Scientific, https://doi.org/10.1142/3171, 2000. a
Roten, D., Lin, J. C., Kunik, L., Mallia, D., Wu, D., Oda, T., and Kort, E. A.: The Information Content of Dense Carbon Dioxide Measurements from Space: A High-Resolution Inversion Approach with Synthetic Data from the OCO-3 Instrument, Atmos. Chem. Phys. Discuss. [preprint], https://doi.org/10.5194/acp-2022-315, in review, 2022. a
Saide, P., Bocquet, M., Osses, A., and Gallardo, L.: Constraining surface emissions of air pollutants using inverse modelling: method intercomparison and a new two-step two-scale regularization approach, Tellus B, 63, 360–370, 2011. a
Sargent, M., Barrera, Y., Nehrkorn, T., Hutyra, L. R., Gately, C. K., Jones, T., McKain, K., Sweeney, C., Hegarty, J., Hardiman, B., Wang, J. A., and Wofsy, S. C.: Anthropogenic and biogenic CO2 fluxes in the Boston urban region, P. Natl. Acad. Sci. USA, 115, 7491–7496, 2018. a
Schwandner, F. M., Gunson, M. R., Miller, C. E., Carn, S. A., Eldering, A., Krings, T., Verhulst, K. R., Schimel, D. S., Nguyen, H. M., Crisp, D., O'Dell, C.W., Osterman, G. B., Iraci, L. T., and Podolske, J. R.: Spaceborne detection of localized carbon dioxide sources, Science, 358, eaam5782, https://doi.org/10.1126/science.aam5782, 2017. a
Sierk, B., Fernandez, V., Bézy, J.-L., Meijer, Y., Durand, Y., Courrèges-Lacoste, G. B., Pachot, C., Löscher, A., Nett, H., Minoglou, K., Boucher, L., Windpassinger, R., Pasquet, A., Serre, D., and te Hennepe, F.: The Copernicus CO2M mission for monitoring anthropogenic carbon dioxide emissions from space, in: International Conference on Space Optics – ICSO 2020, 30 March–2 April 2021, virtual meeting, SPIE, vol. 11852, 1563–1580, https://doi.org/10.1117/12.2599613, 2021. a
Suto, H., Kataoka, F., Kikuchi, N., Knuteson, R. O., Butz, A., Haun, M., Buijs, H., Shiomi, K., Imai, H., and Kuze, A.: Thermal and near-infrared sensor for carbon observation Fourier transform spectrometer-2 (TANSO-FTS-2) on the Greenhouse gases Observing SATellite-2 (GOSAT-2) during its first year in orbit, Atmos. Meas. Tech., 14, 2013–2039, https://doi.org/10.5194/amt-14-2013-2021, 2021. a
Tarantola, A.: Inverse Problem Theory and Methods for Model Parameter Estimation, SIAM, https://doi.org/10.1137/1.9780898717921, 2004. a
Taylor, T. E., Eldering, A., Merrelli, A., Kiel, M., Somkuti, P., Cheng, C., Rosenberg, R., Fisher, B., Crisp, D., Basilio, R., Bennett, M., Cervantes, D., Chang, A., Dang, L., Frankenberg, C., Haemmerle, V. R., Keller, G. R., Kurosu, T., Laughner, J. L., Lee, R., Marchetti, Y., Nelson, R. R., O’Dell, C.W., Osterman, G., Pavlick, R., Roehl, C., Schneider, R., Spiers, G., To, C., Wells, C., Wennberg, P. O., Yelamanchili, A., and Yu, S.: OCO-3 early mission operations and initial (vEarly) and SIF retrievals, Remote Sens. Environ., 251, 112032, https://doi.org/10.1016/j.rse.2020.112032, 2020. a
Turnbull, J. C., Sweeney, C., Karion, A., Newberger, T., Lehman, S. J., Tans, P. P., Davis, K. J., Lauvaux, T., Miles, N. L., Richardson, S. J., Cambaliza, M. O., Shepson, P. B., Gurney, K., Patarasuk, R., and Razlivanov, I.: Toward quantification and source sector identification of fossil fuel CO2 emissions from an urban area: results from the INFLUX experiment, J. Geophys. Res.-Atmos., 120, 292–312, 2015. a
Turnbull, J., Karion, A., Davis, K. J., Lauvaux, T., Miles, N. L., Richardson, S. J., Sweeney, C., McKain, K., Lehman, S. J., Gurney, K. R., Patarasuk, R., Liang, J., Shepson, P. B., Heimburger, A., Harvey, R., and Whetstone, J.: Synthesis of Urban CO2 Emission Estimates from Multiple Methods from the Indianapolis Flux Project (INFLUX), Environ. Sci. Technol., 53, 287–295, 2018. a
Turner, A. J., Shusterman, A. A., McDonald, B. C., Teige, V., Harley, R. A., and Cohen, R. C.: Network design for quantifying urban CO2 emissions: assessing trade-offs between precision and network density, Atmos. Chem. Phys., 16, 13465–13475, https://doi.org/10.5194/acp-16-13465-2016, 2016. a
Verhulst, K. R., Karion, A., Kim, J., Salameh, P. K., Keeling, R. F., Newman, S., Miller, J., Sloop, C., Pongetti, T., Rao, P., Wong, C., Hopkins, F. M., Yadav, V., Weiss, R. F., Duren, R. M., and Miller, C. E.: Carbon dioxide and methane measurements from the Los Angeles Megacity Carbon Project – Part 1: calibration, urban enhancements, and uncertainty estimates, Atmos. Chem. Phys., 17, 8313–8341, https://doi.org/10.5194/acp-17-8313-2017, 2017. a
Wu, D. and Lin, J. C.: Urban Biogenic CO2 fluxes: GPP, Reco and NEE Estimates from SMUrF, 2010–2019, ORNL DAAC, Oak Ridge, Tennessee, USA [data set], https://doi.org/10.3334/ORNLDAAC/1899, 2021. a
Wu, D. and Lin, J.: uataq/X-STILT: X-STILT for TROPOMI and OCO-2/3 (v1.5), Zenodo [code], https://doi.org/10.5281/zenodo.1241514, 2022. a
Wu, D., Lin, J. C., Fasoli, B., Oda, T., Ye, X., Lauvaux, T., Yang, E. G., and Kort, E. A.: A Lagrangian approach towards extracting signals of urban CO2 emissions from satellite observations of atmospheric column CO2 (XCO2): X-Stochastic Time-Inverted Lagrangian Transport model (“X-STILT v1”), Geosci. Model Dev., 11, 4843–4871, https://doi.org/10.5194/gmd-11-4843-2018, 2018. a
Wu, D., Lin, J. C., Oda, T., and Kort, E. A.: Space-based quantification of per capita CO2 emissions from cities, Environ. Res. Lett., 15, 035004, https://doi.org/10.1088/1748-9326/ab68eb, 2020. a
Wu, D., Lin, J. C., Duarte, H. F., Yadav, V., Parazoo, N. C., Oda, T., and Kort, E. A.: A model for urban biogenic CO2 fluxes: Solar-Induced Fluorescence for Modeling Urban biogenic Fluxes (SMUrF v1), Geosci. Model Dev., 14, 3633–3661, https://doi.org/10.5194/gmd-14-3633-2021, 2021. a
Wu, D., Liu, J., Wennberg, P. O., Palmer, P. I., Nelson, R. R., Kiel, M., and Eldering, A.: Towards sector-based attribution using intra-city variations in satellite-based emission ratios between CO2 and CO, Atmos. Chem. Phys., 22, 14547–14570, https://doi.org/10.5194/acp-22-14547-2022, 2022. a, b
Wu, K., Lauvaux, T., Davis, K. J., Deng, A., Coto, I. L., Gurney, K. R., and Patarasuk, R.: Joint inverse estimation of fossil fuel and biogenic CO2 fluxes in an urban environment: An observing system simulation experiment to assess the impact of multiple uncertainties, Elem. Sci. Anth., 6, 17, https://doi.org/10.1525/elementa.138, 2018. a, b
Wu, K., Davis, K. J., Miles, N. L., Richardson, S. J., Lauvaux, T., Sarmiento, D. P., Balashov, N. V., Keller, K., Turnbull, J., Gurney, K. R., Liang, J., and Roest, G.: Source decomposition of eddy-covariance CO2 flux measurements for evaluating a high-resolution urban CO2 emissions inventory, Environ. Res. Lett., 17, 074035, https://doi.org/10.1088/1748-9326/ac7c29, 2022. a
Wu, L., Bocquet, M., Lauvaux, T., Chevallier, F., Rayner, P., and Davis, K.: Optimal representation of source-sink fluxes for mesoscale carbon dioxide inversion with synthetic data, J. Geophys. Res.-Atmos., 116, D21304, https://doi.org/10.1029/2011JD016198, 2011. a
Wunch, D., Toon, G. C., Blavier, J.-F. L., Washenfelder, R. A., Notholt, J., Connor, B. J., Griffith, D. W., Sherlock, V., and Wennberg, P. O.: The total carbon column observing network, Philos. T. Roy. Soc. A, 369, 2087–2112, 2011. a
Wunch, D., Wennberg, P. O., Osterman, G., Fisher, B., Naylor, B., Roehl, C. M., O'Dell, C., Mandrake, L., Viatte, C., Kiel, M., Griffith, D. W. T., Deutscher, N. M., Velazco, V. A., Notholt, J., Warneke, T., Petri, C., De Maziere, M., Sha, M. K., Sussmann, R., Rettinger, M., Pollard, D., Robinson, J., Morino, I., Uchino, O., Hase, F., Blumenstock, T., Feist, D. G., Arnold, S. G., Strong, K., Mendonca, J., Kivi, R., Heikkinen, P., Iraci, L., Podolske, J., Hillyard, P. W., Kawakami, S., Dubey, M. K., Parker, H. A., Sepulveda, E., García, O. E., Te, Y., Jeseck, P., Gunson, M. R., Crisp, D., and Eldering, A.: Comparisons of the Orbiting Carbon Observatory-2 (OCO-2) measurements with TCCON, Atmos. Meas. Tech., 10, 2209–2238, https://doi.org/10.5194/amt-10-2209-2017, 2017. a
Yang, D., Liu, Y., Cai, Z., Chen, X., Yao, L., and Lu, D.: First global carbon dioxide maps produced from TanSat measurements, Adv. Atmos. Sci., 35, 621–623, https://doi.org/10.1007/s00376-018-7312-6, 2018. a
Yang, E. G., Kort, E. A., Wu, D., Lin, J. C., Oda, T., Ye, X., and Lauvaux, T.: Using space-based observations and Lagrangian modeling to evaluate urban carbon dioxide emissions in the Middle East, J. Geophys. Res.-Atmos., 125, e2019JD031922, https://doi.org/10.1029/2019JD031922, 2020. a
Ye, X., Lauvaux, T., Kort, E. A., Oda, T., Feng, S., Lin, J. C., Yang, E. G., and Wu, D.: Constraining fossil fuel CO2 emissions from urban area using OCO-2 observations of total column CO2, J. Geophys. Res.-Atmos., 125, e2019JD030528, https://doi.org/10.1029/2019JD030528, 2020. a, b
Yokota, T., Yoshida, Y., Eguchi, N., Ota, Y., Tanaka, T., Watanabe, H., and Maksyutov, S.: Global concentrations of CO2 and CH4 retrieved from GOSAT: First preliminary results, Sola, 5, 160–163, 2009. a
Zhang, Y., Joiner, J., Alemohammad, S. H., Zhou, S., and Gentine, P.: A global spatially contiguous solar-induced fluorescence (CSIF) dataset using neural networks, Biogeosciences, 15, 5779–5800, https://doi.org/10.5194/bg-15-5779-2018, 2018. a
Zheng, B., Chevallier, F., Ciais, P., Broquet, G., Wang, Y., Lian, J., and Zhao, Y.: Observing carbon dioxide emissions over China's cities and industrial areas with the Orbiting Carbon Observatory-2, Atmos. Chem. Phys., 20, 8501–8510, https://doi.org/10.5194/acp-20-8501-2020, 2020. a