the Creative Commons Attribution 4.0 License.
the Creative Commons Attribution 4.0 License.
 | 13 Dec 2023
Continuous observations from horizontally pointing lidar, weather parameters and PM2.5: a pre-deployment assessment for monitoring radioactive dust in Fukushima, Japan
Nofel Lagrosas
Kosuke Okubo
Hitoshi Irie
Yutaka Matsumi
Tomoki Nakayama
Yutaka Sugita
Takashi Okada
Tatsuo Shiina
A horizontally pointing lidar is planned for deployment with other instruments in Fukushima, Japan, to continuously monitor and characterize the optical properties of radioactive aerosols and dust in an uninhabited area. Prior to installation, the performance of the lidar is tested at Chiba University. Data from the continuous operation of the lidar from August 2021 to February 2022 are analyzed for extinction and volume linear depolarization ratio. These are compared with the weather sensor and particulate matter (PM2.5) measurements to quantify the relationships between atmospheric conditions and optical properties of near-ground aerosols. The results show that the lidar data's extinction coefficient and depolarization ratio can have a quantifiable relationship with relative humidity (RH), absolute humidity, rain rate, wind speed, wind direction and PM2.5 concentration. Analysis of the 7-month data shows that the optical properties of aerosol and dust depend on the combined effects of the weather parameters. An increase in RH or PM2.5 concentration does not imply an increase in radioactive aerosols. The average extinction coefficient and depolarization ratio of aerosols and dust, originating from the land and ocean, show different values and opposing trends, which can aid in determining the occurrence of ground-based radioactive dust and aerosols. The information obtained from analyzing the inter-relationship among lidar, weather parameters and PM2.5 concentration is essential in assessing the occurrence of radioactive aerosols and characterizing local aerosol–weather relationships in a radioactive area. This result provides essential information in describing radioactive aerosols in Fukushima.
- Article
(2981 KB) - Full-text XML
- BibTeX
- EndNote


Aerosols are solid and liquid particles suspended in the air and are composed of organic compounds, inorganic salts, trace elements, black carbon, water and other substances (Reggente et al., 2019). Aerosols can be transported from their sources, which include natural (e.g., volcanos, dust, ocean) and anthropogenic emissions, to different locations and are susceptible to environmental and weather conditions. Other studies have shown that aerosols and their optical properties in a particular area show seasonality (Humphries et al., 2023; Orikasa et al., 2020; Jain et al., 2020; Cigánková et al., 2021).
In some cases, in radioactive areas, radioactive aerosols and dust that come from the ground are also transported. Radioactive aerosols are particulates that have been exposed to nuclear radiation and thus have become radioactive. In a place where the unprecedented release of nuclear radiation brings about radioactive aerosols, these can pose a risk to nearby inhabitants. Past studies have evaluated radiation using gamma-ray detectors and measured radiation dose rates at different sites to analyze radiation values from dust and infer the radioactive dust's wind transport (Allott et al., 1992; Takagi et al., 2019; Yamauchi, 2012). These techniques are adequate, especially when evaluating the safety of an area exposed to radiation to know when people can return (Matsuo et al., 2019). However, since the atmosphere is dynamic, the wind transports these radioactive aerosols to different places. Monitoring this transport in a higher temporal scale can be an essential observation to assess radioactivity in an area. Remote sensing instruments, like lidars, that can perform continuous and automated measurements, gathering data with minimal human interference, are valuable in monitoring radioactive aerosols. In this work, the authors will show that the horizontal lidar can be used for this kind of monitoring.
Lidar networks are used to monitor vertical distributions of dust and aerosols in the atmosphere (Campbell et al., 2002; Kawai et al., 2018; Pappalardo et al., 2014) and validate satellite measurements (Kim et al., 2008; Whiteman et al., 1990; Gusmão et al., 2020). But lidar systems, together with other in situ instruments, can be deployed in radioactive areas and operated continuously with less human intervention and operation. Such applications are the main focus of this paper. Theoretically, the continuous detection of these radioactive aerosols and dust, using lidar, can reveal valuable information in understanding and inferring temporal or diurnal evolution, the effect of seasonal changes, and the relationship between meteorological and optical parameters on observed naturally occurring local aerosols and dust. Lidar can also provide information on the transport of radioactive aerosols. In Chiba, the seasonality of aerosols has been reported (Fukagawa et al., 2006), while in Fukushima, the seasonality of aerosols is still to be quantified.
After the radiation incident in the Fukushima area in 2011, places near the radioactive meltdown have become uninhabited (Hidaka et al., 2022). However, years after the incident, radioactivity has declined. Still, many of the inhabitants have a hard time returning due to various reasons such as absences of family members and neighbors and insufficient radiation decontamination (Matsuo et al., 2019). In our previous study, the horizontal lidar was operated near an interim storage facility for a few days in Fukushima, Japan, in 2018 to monitor the optical scattering of dust during the storage operation or working conditions (Shiina et al., 2018). The study showed that dust smaller than 20 µm in diameter carries more radioactivity (∼ 2 × 10⁻⁸ Bq cm−3) than larger dust particles (Shiina et al., 2018). This amount is much lower than the accepted safe limit of 10 × 10−5 Bq cm−3. However, continuous observations of aerosols in radioactive areas are still essential to determine the amount of daily inhalable radioactive dust to reassure residents that radioactivity levels from inhalable aerosols are safe and to promote safe everyday-life activities in these communities. Previous studies indicate that inhaled radioactive aerosols with a dust concentration under 1 × 10⁻⁴ g m−3 can have an effective dose of just 5.6 µSv received in 20 years by an adult with light activity. This dosage is smaller than the total effective dose of 9.9 and 48.8 µSv for adults with moderate and vigorous activities, respectively, during the same number of years at an air dust concentration of 1.5 × 10⁻⁴ g m−3 (Hanfi et al., 2021; Valentin, 2002). As people gradually return to evacuated places in Fukushima, the continuous monitoring of natural radioactive aerosols assists in assessing these areas' environmental and living conditions. The discussion of monitoring radioactive aerosols and dust, the phenomenological aspect of monitoring, and the data acquisition and interpretation provide essential insights into the current and future detection of radioactive aerosols. Furthermore, having a dataset of optical properties of local aerosols and quantified aerosol–weather relationships helps us understand the local transport of these aerosols and aids us in analyzing the radiative forcing, air quality, health impacts on the residents, precipitation patterns, atmospheric dynamics and validation of other remote sensing data, and it can be used for validating and improving local climate models. Combining these data with the data from ancillary instruments, which include weather monitors, aerosol samplers and chemical analysis, allows us to analyze the monitoring of the flow of radioactive aerosols to infer possible locations of hot spots.
The main objective of this work is to provide an overview of the results obtained during the demonstration experiment phase of the project. This work has the following objectives: (1) to present continuous data from a near-ground horizontally pointing lidar system, (2) to analyze temporal changes in the optical properties of local aerosols, and (3) to quantify the relationship between the observed aerosol optical properties and other meteorological parameters (e.g., relative humidity (RH), wind speed, particulate matter (PM2.5).
The lidar is operated on the ninth floor (∼ 65 m above sea level and 54 m above the ground) of the Engineering building at Chiba University (35.6278∘ N, 140.1031∘ E). The observation site is located in an urban area 3 km from Tokyo Bay. Within a 10 km radius, the north and east sides are urban areas. In contrast, the west and south areas comprise urban lands and Tokyo Bay (Fig. 1). The landmass and water locations make the observation site a strategic place for measuring the optical properties of aerosols coming from different directions.
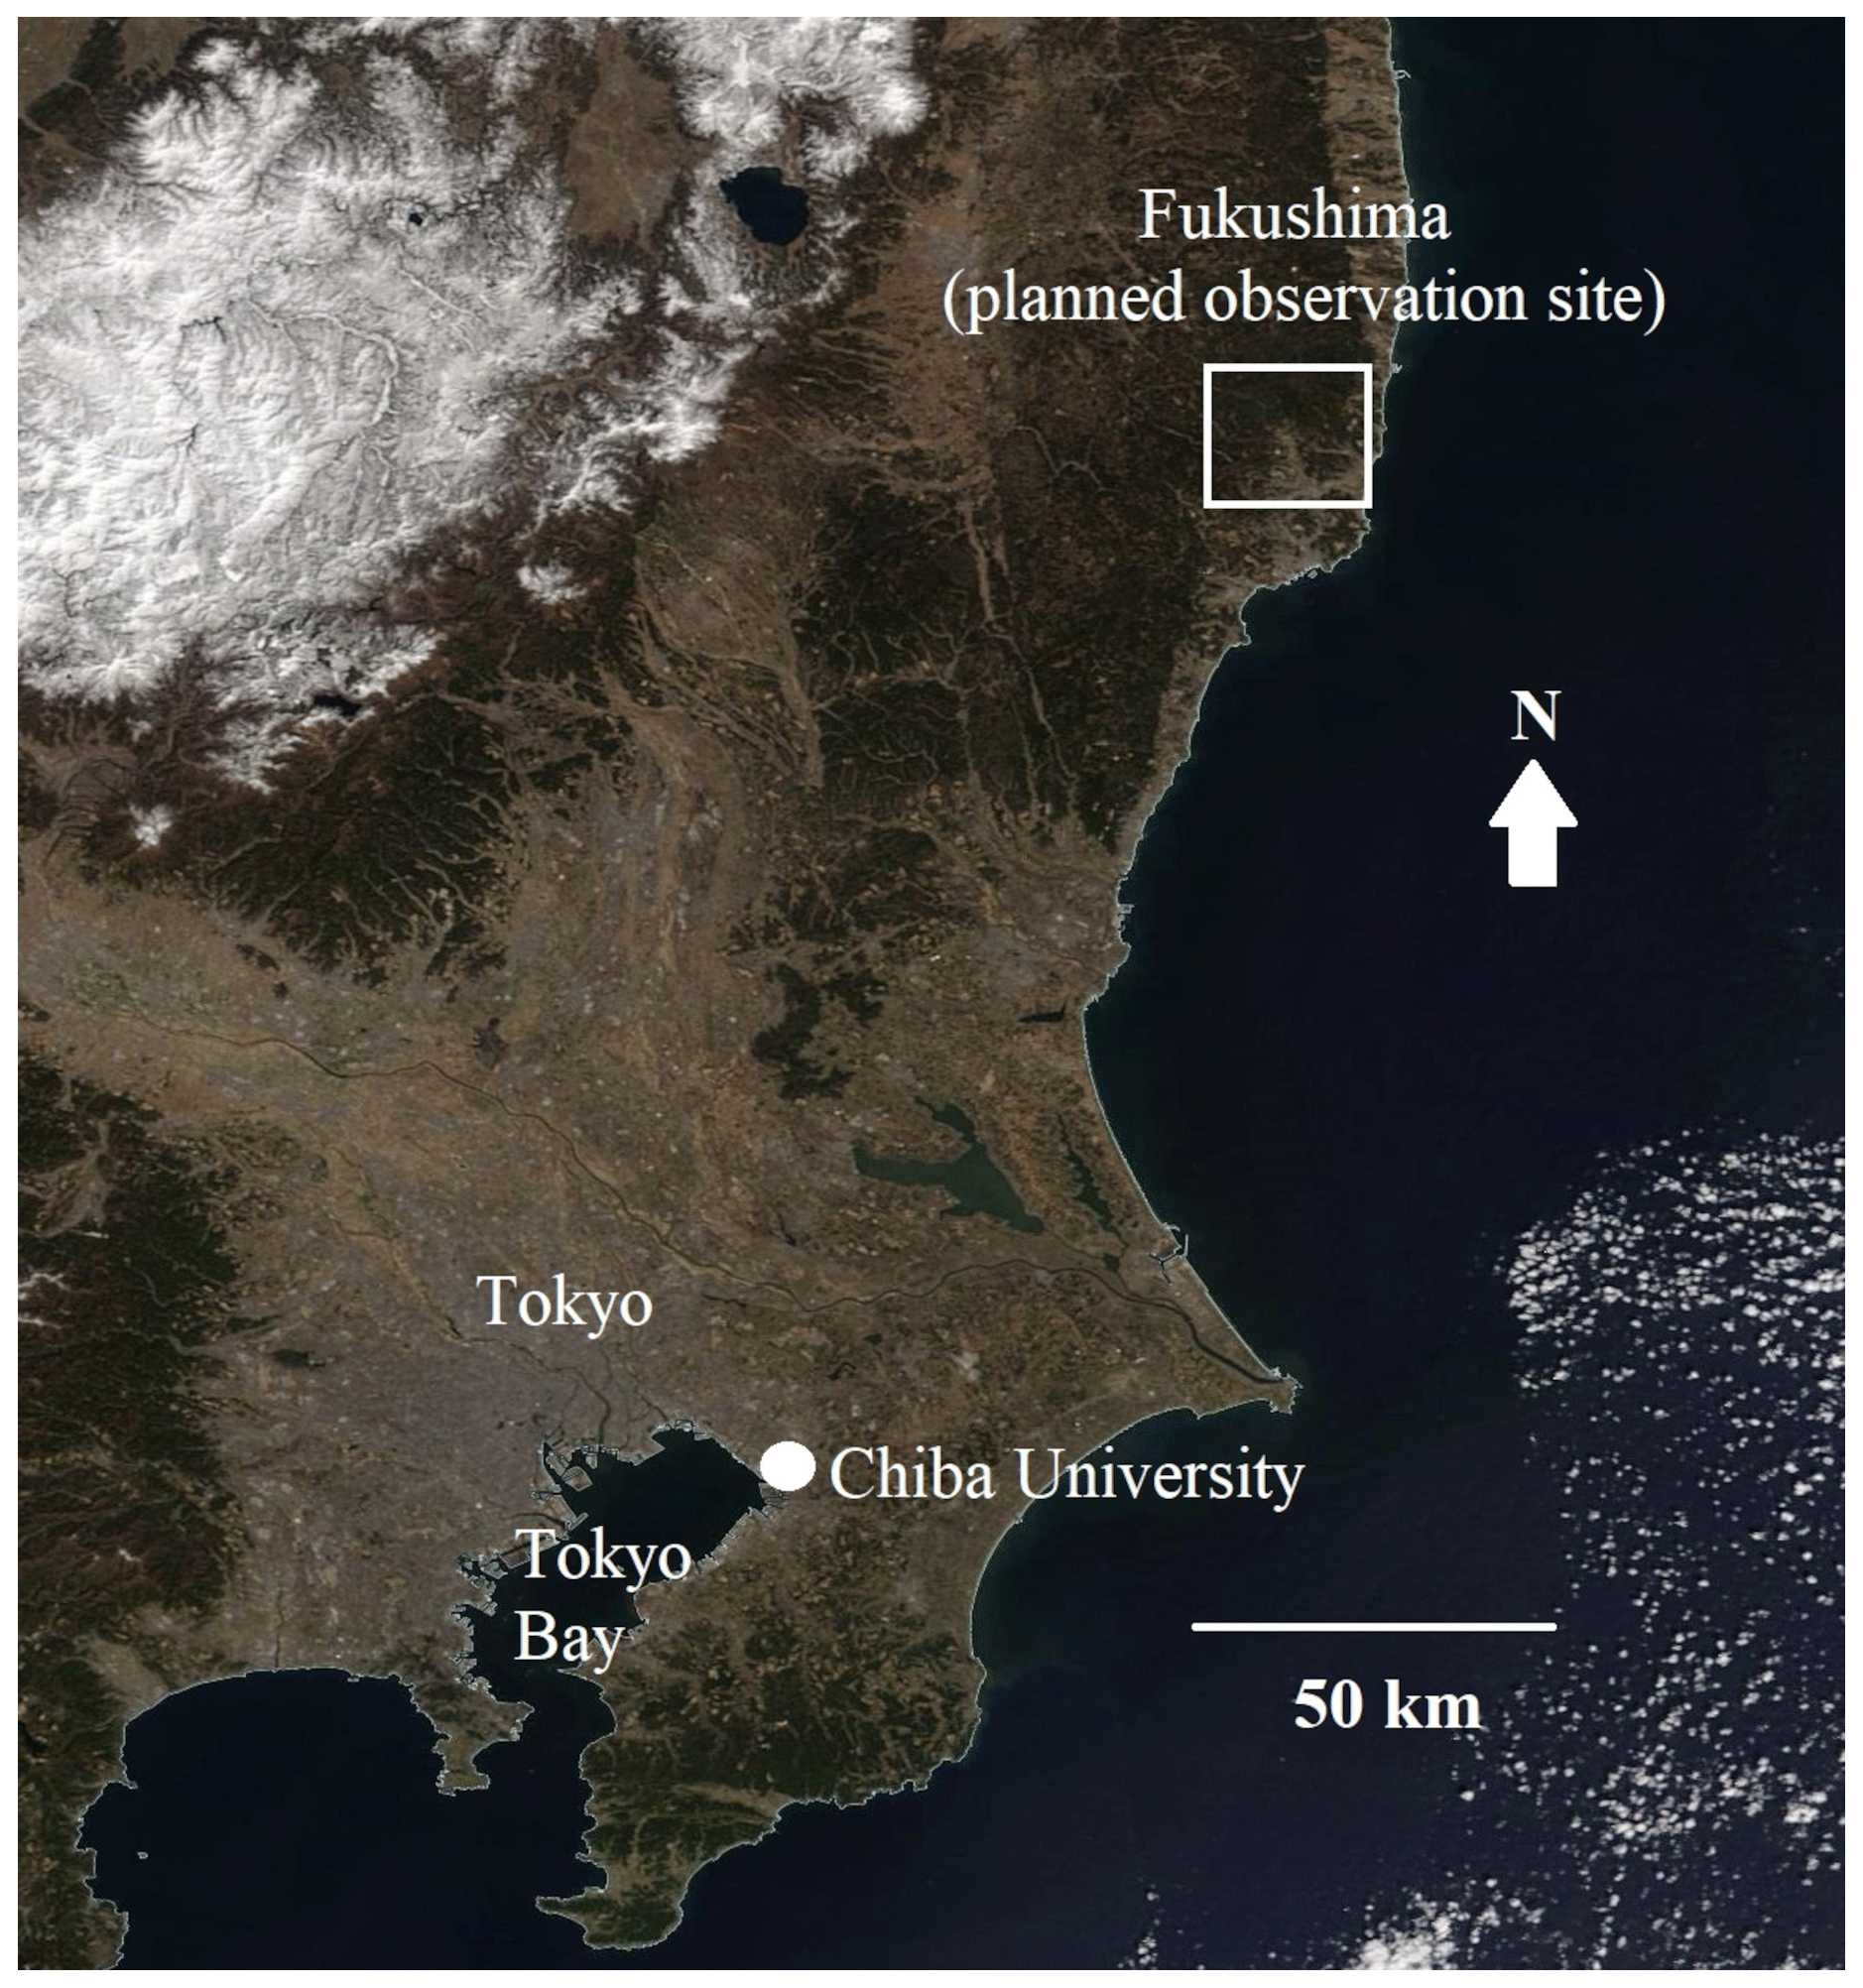
Figure 1Location of Chiba University, the current observation site, with respect to Tokyo and Tokyo Bay. The next planned observation site will be in Fukushima (https://worldview.earthdata.nasa.gov/, last access: 11 November 2023).
The planned observation site will be in Fukushima, northeast of and ∼ 165 km from Chiba. The specific site location will be decided in the future, but the site will be between uninhabited and inhabited areas. In Fukushima, the east side of the site is looking at the Pacific Ocean. The north and west sides are surrounded by landmasses. The south side is covered by both land and sea. The aerosol optical properties derived from the data from the long-term monitoring of aerosols in this area are expected to be affected by winds coming from the sea and the land, similar to the case in Chiba.
In this work, a horizontal lidar, a weather monitor and a particulate matter (PM2.5) sampler are simultaneously and continuously operated. The data from these instruments are processed and compared to infer the relationship between lidar-derived aerosol optical and meteorological parameters. The robust fitting method is employed to infer quantitative relationship trends while ignoring outlier points to quantify the effect of weather on the optical properties of near-ground aerosols. The variation of each optical and weather parameter can be considerable due to the high variability of atmospheric conditions, but trends can be observed. In some cases, using robust fitting can result in computational complexity and efficiency loss. However, these were not encountered when analyzing the data.
3.1 Horizontal lidar
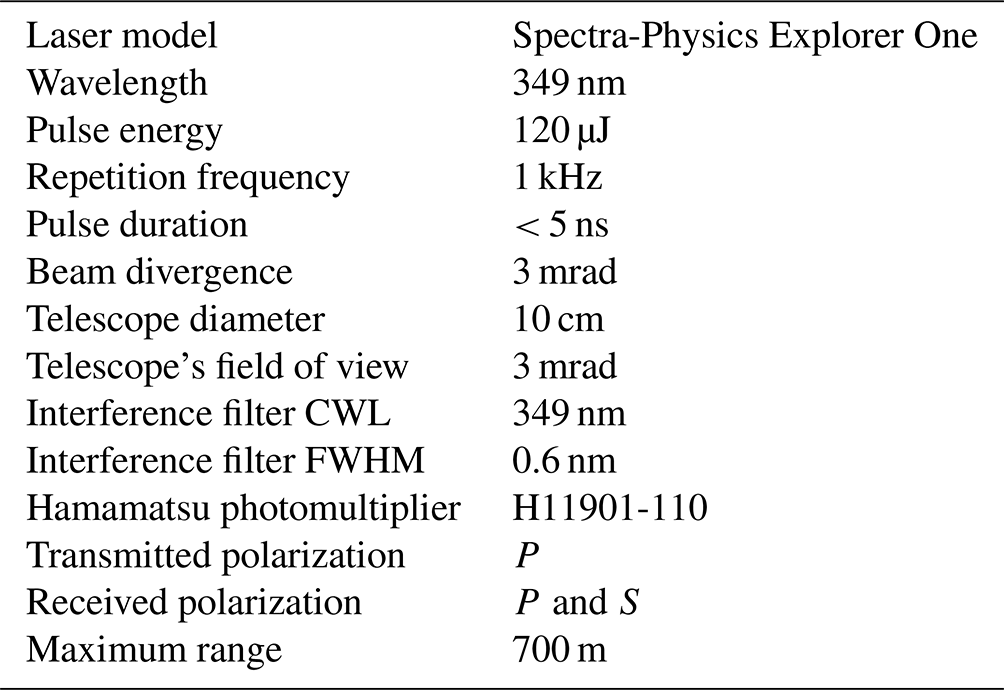
The horizontal lidar was operated continuously from August 2021 to February 2022 on the ninth floor of the Engineering building at Chiba University (35.63∘ N, 140.1∘ E) to monitor near-ground aerosols and dust. The lidar system gathers data every 1 s and is only stopped for a few minutes when the lidar is reset once every other day. The lidar is set in a perfectly horizontal position and is pointing in the west-northwest direction. In Fukushima, the lidar will be mounted closer to the ground (∼ 1 m). Table 1 shows the specifications of the horizontal lidar system. A diode-pumped solid-state (DPSS) laser is used as a light source, and it emits a maximum pulse energy of 120 µJ at a repetition frequency of 1 kHz at 349 nm, with a full beam divergence of 3 mrad prior to expansion. The transmitted beam is expanded to 30 mm in diameter and is considered unsafe at near distances. The full overlap of the laser and telescope is around 50 m from the lidar. The transmitted and received signals are P-polarized and P- and S-polarized, respectively. The lidar data are then processed for the extinction coefficient and depolarization ratio.
Table 1Specification of the DPSS horizontal lidar system. CWL: center wavelength. FWHM: full width at half maximum.
Since the horizontal lidar has a maximum range of around 700 m, we assume that the aerosol properties do not significantly vary in a few hundred meters in the horizontal direction. From this assumption, the aerosol extinction coefficient between 100 and 300 m can be derived using the slope method (Kunz and de Leeuw, 1993). The slope method is used by fitting a line between the maximum and minimum of the natural logarithm of the range-corrected signal between 100 and 300 m. A homogeneous atmosphere can be assumed during the observation period in this horizontal range. This method is similar to our group's work that examined the relationship between the horizontal lidar and weather effects from continuous lidar observations in November 2017 and in the winter of 2018 (Ong et al., 2019; Xiafukaiti et al., 2020).
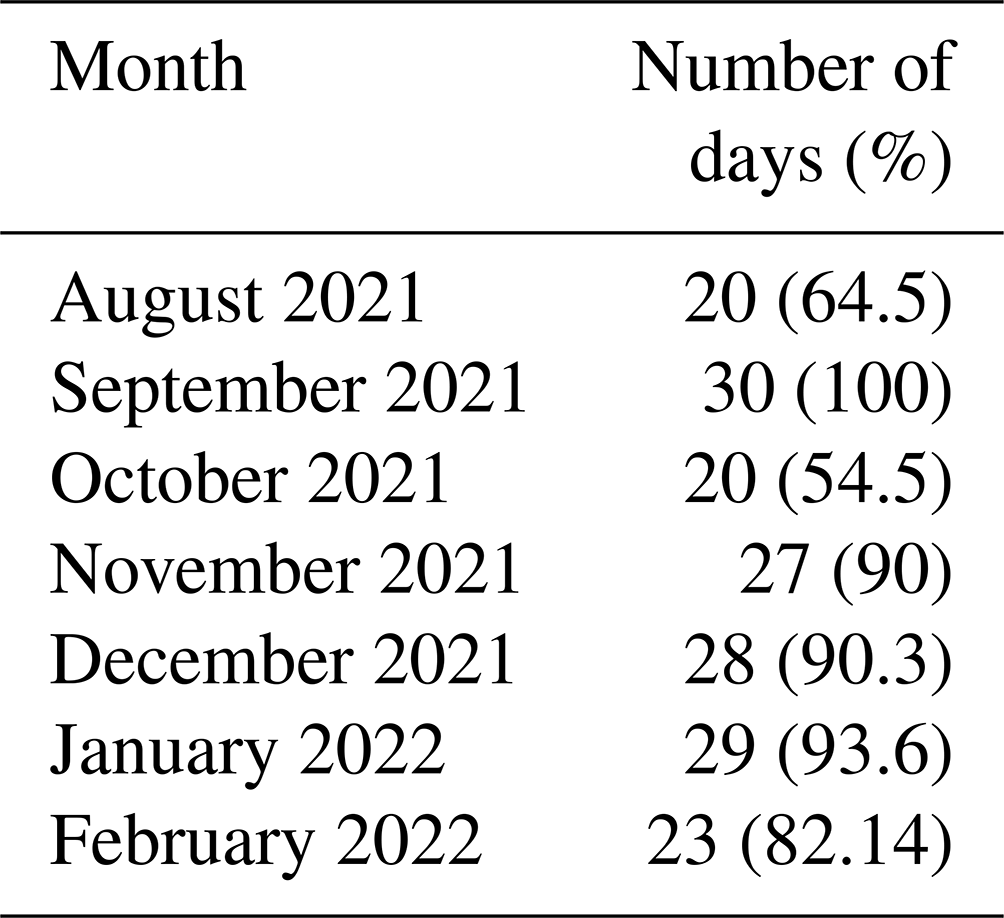
The volume linear depolarization ratio (VLDR) from the lidar signals is calculated as the ratio of the S and P signals (Freudenthaler et al., 2009; Comerón et al., 2018) multiplied by the ratio of the gains of the channels. Burton et al. (2015) and Xu et al. (2022) presented a method to measure the ratio of the gains of the channels, and this method is applied in this work. The gain is obtained by measuring the signals from each channel when the polarizer is oriented at the parallel and perpendicular positions. Table 2 shows the days in a month when the horizontal lidar continuously gathers data.
Table 2Number of days of continuous operation of horizontal lidar.
3.2 Weather data
A weather monitor (Davis, Vantage Pro 2) is mounted on the rooftop (∼ 46 m above sea level) of the Center for Environmental Remote Sensing (CEReS). The weather monitor is installed at around 74 m horizontally and 19 m from the lidar system. It logs data on weather parameters (RH, temperature, wind speed, wind direction and rain rate) every 5 min. The absolute humidity can be derived from the RH and temperature data (Seinfeld and Pandis, 2016). This parameter, which provides the amount of water vapor per unit volume of air, can be compared with the optical parameters from the lidar.
3.3 PM2.5 data
PM2.5 data are obtained using a compact PM2.5 instrument (Nakayama et al., 2018; Damiani et al., 2021). This instrument is programmed to get PM2.5 data every 1 min on the ninth floor of the Engineering building at Chiba University as part of the international observation network activities of the sky radiometer network (SKYNET) (Nakajima et al., 2020; Hashimoto et al., 2012) and aerosol and sky research remote sensing (A-SKY) network. The SKYNET uses the PREDE POM-01 and POM-02 as in situ sky radiometers. The PM2.5 instrument does not show hygroscopic effects for RH < 70 %.
Weather conditions affect aerosols' optical and radiative properties (Makar et al., 2015, 2021; Mao et al., 2018). In this work, the effect of the weather on aerosol optical properties can be quantified using the data from the horizontal lidar and weather monitors. The following section shows the temporal changes of and the quantified relationships between the lidar and weather monitors obtained by applying robust fitting on the parameters.
4.1 Observed temporal trends
During the 7 months of continuous operation of the horizontal lidar, average extinction coefficients and the depolarization ratio show decreasing and increasing monthly trends, respectively (Fig. 2a and b). These results indicate the optical parameters' dependence on seasons. This seasonal dependence was also observed in previous studies, using a chemical sampler, a chemical analysis, weather data and a sun photometer (Fukagawa et al., 2006). In this work, the temporal trend of the mean extinction coefficient near the ground slightly decreases during cold months (November to February). The distribution of extinction coefficients during the cold months also tends to be skewed towards higher values due to high outlier values. For all collected datasets, the observed median and average extinction coefficients of aerosols within the 100 to 300 m range are below 0.005 m−1. The mean extinction coefficient value is around 0.0025 (±0.00048) m−1. The histogram of the extinction coefficient values is shown in Fig. 2c and suggests a two-mode distribution. A simple bimodal Gaussian fit of the distribution (not shown) indicates mean extinction coefficients of 0.0024 and 0.0027 m−1. These very close mean extinction coefficients can be attributed to the effect of relative humidity (RH), as discussed in the succeeding paragraph. The extinction coefficient values presented in this work are roughly 10 times greater than previously reported works (Ong et al., 2019; Xiafukaiti et al., 2020). In these previous works, a laser inclined 4∘ above the horizontal was used to observe near-horizontal aerosols. In this configuration, the laser traverses the atmosphere with a vertical path, encountering fewer aerosols along its path. The extinction coefficient is measured up to 5 km by accumulating the signals over 5 min and continuously operated in the months of November 2017 (Ong et al., 2019) and November and December 2018 (Xiafukaiti et al., 2020). The current horizontal lidar does not have this property. The number of aerosol particles does not significantly vary between the 100 and 300 m horizontal range, leading to higher extinction coefficient values.
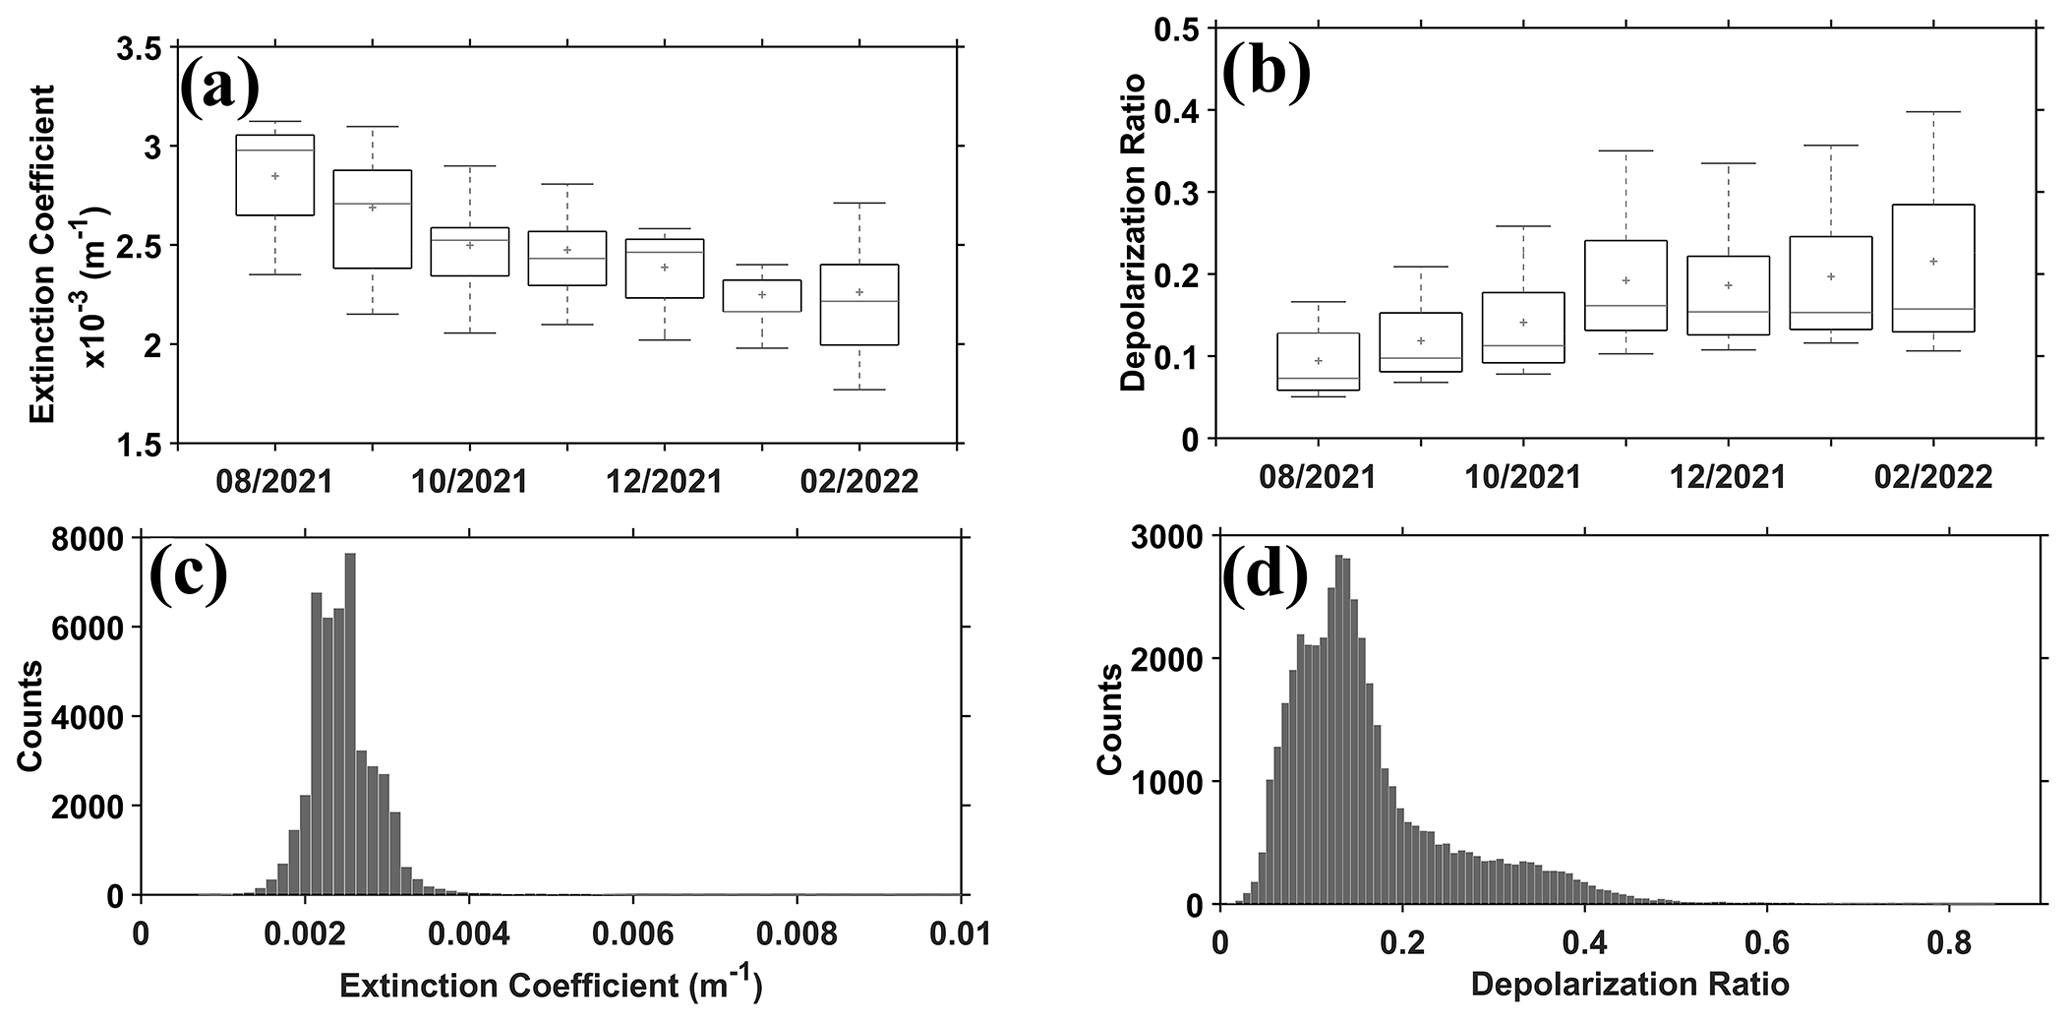
Figure 2Boxplots of the monthly (a) extinction coefficient and (b) depolarization ratio derived from the horizontal lidar in the 100 to 300 m range and the corresponding histogram of the (c) extinction coefficient and (d) depolarization ratio.
The mean depolarization ratio values increase from summer to winter (Fig. 2b). The mean depolarization ratio is 0.161 (±0.095). The histogram of the depolarization values is shown in Fig. 2d. Between the depolarization range of 0 and 0.2, a bimodal distribution can be observed. The result of applying a bimodal Gaussian fitting of the distribution reveals a mean depolarization of 0.12 and 0.14. These mean values approximate the local depolarization ratio values during high- and low-humidity conditions. The mean depolarization ratio between 0.35 and 0.4 can be attributed to highly non-spherical dust. The mean depolarization values between 0.1 and 0.35 are similar to the results obtained from dual-polarization (volume linear depolarization ratio) lidar measurements (Qi et al., 2021) and from laboratory measurements (linear depolarization ratio) of mineral dust fitted with a homogeneous spheroid model (Kahnert et al., 2020). In the latter, an increase in the depolarization ratio can be attributed to the increase in the aspect ratio of the dust for a constant size parameter. Previous works on dust observations have reported particle linear and volume depolarization ratios from 0.2 to 0.4 at 355 nm (Haarig et al., 2022; Huang et al., 2023). In real conditions, this effect can occur when RH is low and the prevailing aspect ratio of dust is not equal to unity.
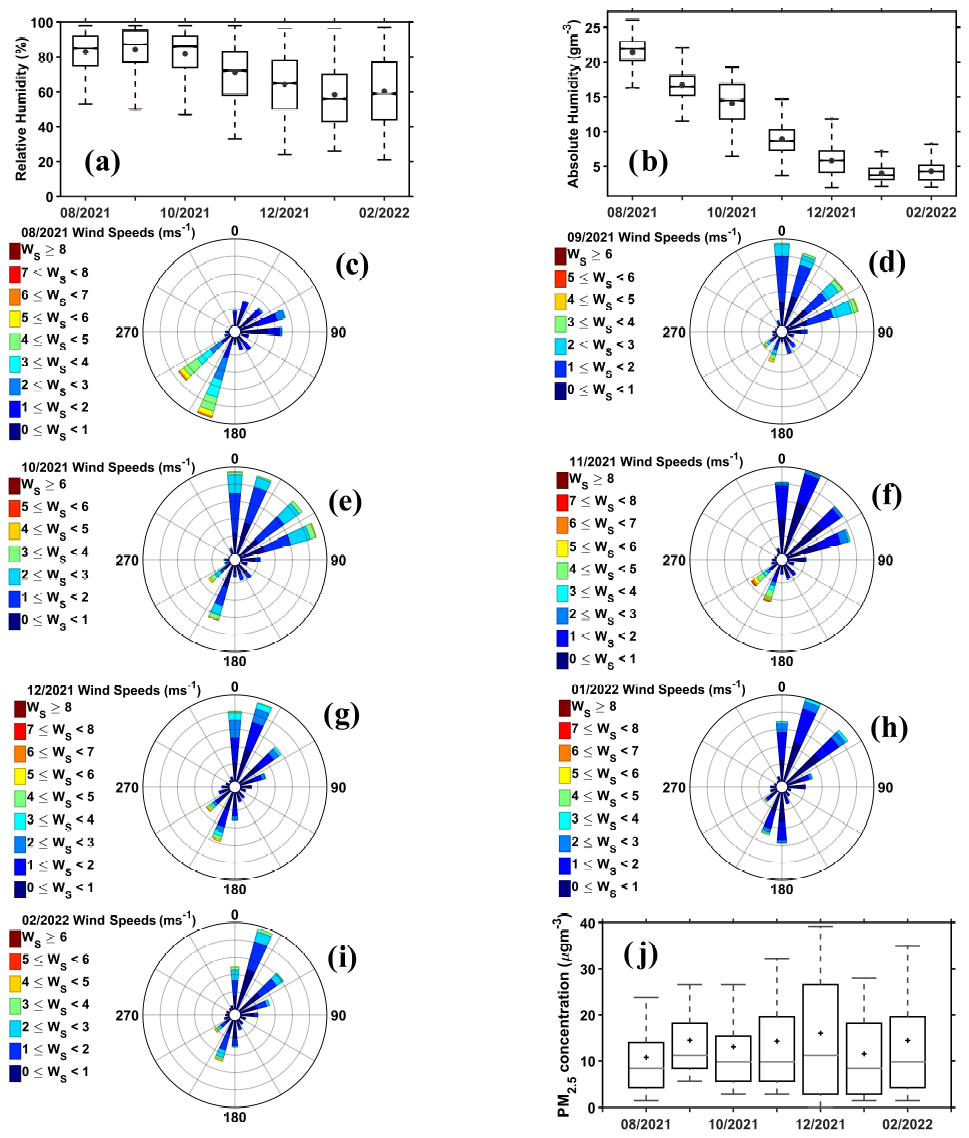
Figure 3Monthly distribution of (a) RH and (b) absolute humidity and rose graph of wind speed and direction for (c) August, (d) September, (e) October, (f) November and (g) December 2021 and (h) January and (i) February 2022. Monthly distribution of (j) average PM2.5 concentration shows values less than 20 µg m−3.
From the weather monitor data, continuous measurements of relative humidity (RH) from August to February show a decrease in average RH from 80 % to 60 % (Fig. 3a). This corresponds to the reduction in absolute humidity from 22 to 4 g m−3 in the same period (Fig. 3b). In August, the dominant wind directions are from the south and southwest (Tokyo Bay direction), carrying more moisture and marine-type aerosols (Fig. 3c). In the subsequent months, the prevailing wind directions drastically shift from southwest to northeast and north (Fig. 3d–i). Winds from the north come from the land, and the aerosols can be considered an urban type (Fukagawa et al., 2006). The observed mean PM2.5 concentration is below 20 µg m−3 (Fig. 3j). It is worth mentioning here that during the observation period no nearby volcanic eruption occurred. Pollen usually occurs during springtime. Thus, to the knowledge of the authors, the sources of non-spherical aerosols during the observation period are from dust, sea salt and snow.
The wind direction plays a critical role in interpreting the aerosol data from areas affected by radioactivity. In Chiba, the dominant winds from the south and southwest indicate the presence of marine-type aerosols. On the other hand, when the wind is blowing from the east to the west in Fukushima, it is anticipated that the observed aerosols will primarily consist of marine-type aerosols, assuming that radioactive aerosols originate from land-based sources. Properly evaluating the impact of wind direction on aerosol presence and distribution is crucial for obtaining accurate insights into the atmospheric conditions in the area and interpreting the aerosol data effectively.
4.2 Relationship between lidar-derived optical parameters (depolarization ratio and extinction coefficient), weather parameters (RH, absolute humidity, wind speed, wind direction) and PM2.5 concentration
The overall data from ground observations of near-ground aerosols indicate that the depolarization ratio decreases exponentially as the extinction coefficient increases as shown in the orange circles in Fig. 4a. This relationship between the two optical parameters indicates that aerosols grow in size as a response to increasing RH. As the aerosols grow in size, the sphericity is also affected since water uptake results in more spherical particles as a result of water covering or diluting the condensation nucleus (Tang et al., 1997, 2019; Wang et al., 2022). The high depolarization ratio (> 0.3), with extinction coefficients from 0.003 to 0.006 m−1 (black circles in Fig. 4a), is primarily from the days when snowflakes fell and when wind speed was high (> 0.5 m), bringing in local dust. Snow was observed in Chiba on 6 January 2022 (15:00–00:00 JST), 7 January 2022 (01:00-13:00 JST), 2–3 February 2022 (22:00–11:00 JST) and 14 February 2022 (00:00–07:00 JST). Just before snow conditions, the observed data suggest that the depolarization ratio decreased exponentially from 0.4 to 0.1 when the extinction coefficient changed from 0.002 to 0.003 m−1. When the extinction coefficient is greater than 0.003 m−1, the depolarization ratio varies from 0.002 to 0.8, suggesting the formation of different snowflake shapes. Changes in the depolarization ratio for aerosols tend to follow the exponential decrease with the extinction coefficient. Dust is also found to follow the exponential decrease with extinction coefficient (black points coexisting with the orange points when the extinction coefficient is less than 0.003 m−1). The high depolarization ratio and low extinction coefficient can be attributed to the contribution of marine-type aerosols, as will be shown later when these optical parameters are compared with wind direction. The quantified relationship between the depolarization ratio and extinction coefficient serves two purposes. First, the quantified results provide, for the first time, a measured relationship between the two parameters, local and near-ground aerosols. Second, the results provide an essential understanding of how radioactive near-ground aerosols can be observed as they change shape due to the effect of the weather. Previous results have made indirect comparisons among vertically pointing lidars; i.e., no quantitative relationship is provided (Groß et al., 2011; Haarig et al., 2017, 2022; Sakai et al., 2006).
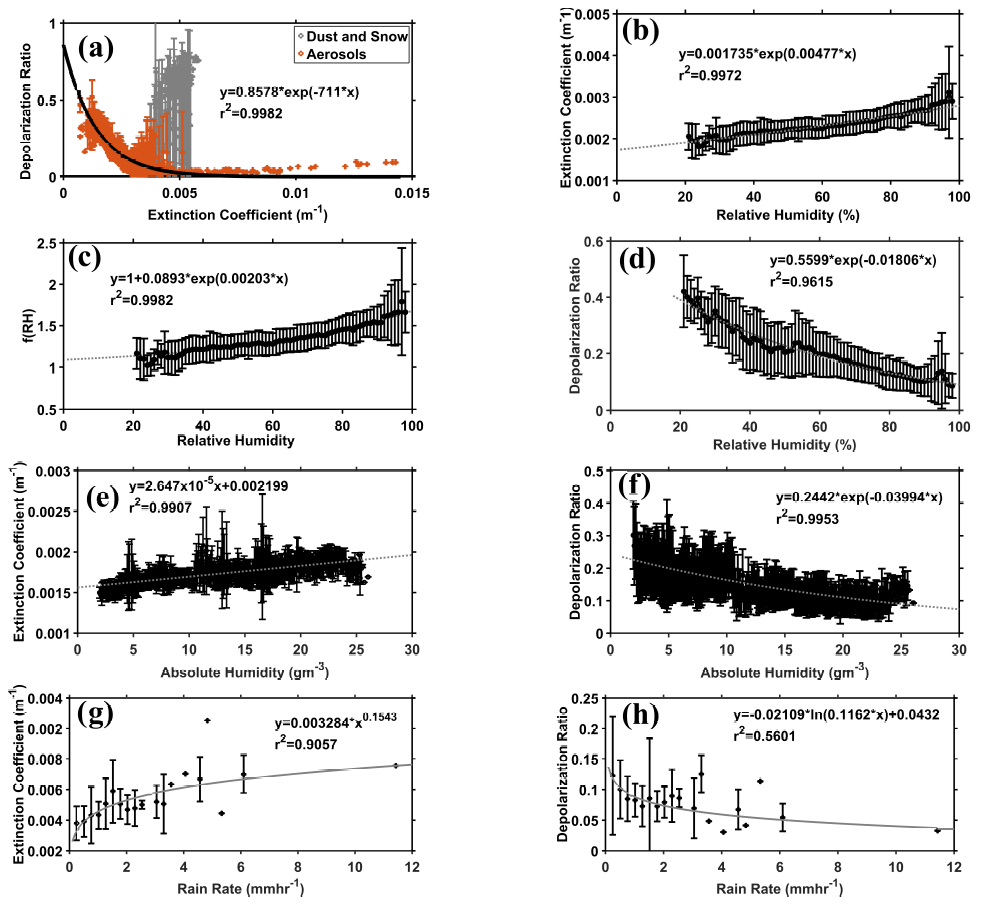
Figure 4Observed relationship between (a) depolarization ratio and extinction coefficient; trends of (b) extinction coefficient, (c) f(RH), and (d) depolarization ratio with RH; measured dependencies of (e) extinction coefficient and (f) depolarization with absolute humidity; and variations of (g) extinction coefficient and (h) depolarization ratio with rain rate.
When the extinction coefficient is compared with RH (Fig. 4b), an exponential function can be used to construct the relationship between the two parameters for aerosols and dust near the ground. This result is expected, because when RH increases, the optical properties of the scatterers change, making these scatterers have a greater extinction cross-section that causes high attenuation of light (Tang et al., 1997, 2019). Other studies have shown that the extinction coefficient and RH relationship can be modeled using a power law applied to RH 100 or (1 − RH 100) (Skupin et al., 2016; Düsing et al., 2021). According to these studies, a high extinction coefficient at high RH does not mean high wind speed but it depends on the aerosol type. For example, at 90 % RH, the extinction coefficient and growth rate of marine-type aerosols are higher than those of dust (Zieger et al., 2013). However, for near-ground aerosols, the exponential function better fits the 7-month observation.
The extinction enhancement factor f(RH), defined as the ratio of the extinction coefficient at a specific RH to the extinction coefficient at dry RH, is related to the hygroscopic growth of aerosols under increasing RH (Haarig et al., 2017; Skupin et al., 2016; Zhang et al., 2022). Previous studies use only the scattering coefficient of aerosols to determine f(RH) to characterize the hygroscopic properties of aerosols (Burgos et al., 2019; Jung et al., 2021; Lagrosas et al., 2019; Zieger et al., 2011, 2013). The extinction coefficients provide the trend of the effect of RH on near-ground aerosols. In this work, the f(RH) values (Fig. 4c), measured at 349 nm, range from 1 to 2 and do not show a steep exponential increase with RH. This range of values is smaller than the f(RH) values at 550 nm (Jung et al., 2021; Liu et al., 2023; Zieger et al., 2014) and is consistent with the f(RH) values at 355 nm reported by Haarig et al. (2017). Earlier measurements of dry and wet marine aerosols also have f(RH) of 1.94 ± 0.94 between 40 % and 80 % RH at 355 nm (Haarig et al., 2017). In this case, for pure aerosol types, such as the case of marine aerosols, f(RH) is higher than the values shown in Fig. 4c in the same RH range. The result presented in Fig. 4c represents Chiba's unique ambient near-surface f(RH) from different aerosol types.
The mean depolarization ratio of near-surface aerosols shows a monotonic decrease as RH increases (Fig. 4d). The results suggest that water vapor in the atmosphere can control, to some extent, the shapes of near-ground aerosols and dust by making them approach a spherical shape as RH increases. An exponential function is found to provide the best fit and, thus, models the relationship between the depolarization ratio and RH. The variation of the depolarization ratio when RH < 60 % is higher than the variation when RH > 60 %. This observation implies that various aerosols with different non-spherical morphologies in dry conditions (RH < 60 %) are observed. As deliquescence sets in, condensing water vapor molecules change the morphological structure of the aerosols. Around RH = 100 %, the mean depolarization ratio is around 0.1. This result is expected since the horizontal lidar observes near-ground aerosols. Furthermore, the 0.1 average depolarization ratio indicates the limiting value for near-ground aerosols and implies that they cannot possess a perfectly spherical shape even when coated with water at high RH. This result provides new insight into how radioactive aerosols can be affected by RH, especially when the lidar system is placed near the ground, as will be the case in Fukushima.
The quantified relationship between the extinction coefficient and depolarization ratio with RH can be further explored by linking these lidar-derived optical parameters with the amount of water vapor in the atmosphere by employing absolute humidity. Absolute humidity is the parameter that measures the actual amount of water vapor regardless of the air's temperature. A linear relationship between the extinction coefficient and absolute humidity is expected, since the extinction coefficient can be linked with the aerosol's mass using the mass extinction efficiency parameter (Cheng et al., 2017; Latimer and Martin, 2019; Lagrosas et al., 2005). The quantified relationship between the extinction coefficient and absolute humidity from lidar and weather monitor measurements is the first to be reported from the authors' knowledge. Previous works usually employed the use of the hygroscopic growth factor f(RH) to describe and quantify the change in the extinction coefficient with relative humidity (Chen et al., 2019; Dawson et al., 2020; Jefferson et al., 2017; Lagrosas et al., 2019; Ming and Russell, 2001; Noh et al., 2011; Shingler et al., 2016; Vu et al., 2021; Zieger et al., 2011, 2013). The 7-month measurements have shown that extinction coefficients increase from 0.002 to 0.004 m−1 when absolute humidity increases from 3 to 25 g m−3 (Fig. 4e). The aerosol extinction coefficient therefore increases by 2.647 × 10⁻⁵ per 1 g m−3 increase in water vapor. On the other hand, the change in the depolarization ratio with absolute humidity can be modeled as an exponential function, indicating that near-ground aerosols are sensitive to condensing water vapor (Fig. 4f). These relationships provide insights into the amount of water vapor that can effectively change the optical characteristics of aerosols. The previously reported classification of aerosols in Chiba by air sampling has shown that hydrophilic aerosols (sea salt, ammonium nitrate and ammonium sulfate) are dominant during summer months, while elemental carbon is the dominant aerosol during winter months (Fukagawa et al., 2006). These aerosols can potentially have strong or weak interactions with water vapor in the atmosphere.
During rainy conditions, the extinction coefficient values derived from lidar data vary from 0.003 to 0.005 m−1 as the rain rate increases (Fig. 4g). Depolarization ratio values decrease from 0.12 to 0.003, as expected, with increasing rain rate (Fig. 4h). These extinction coefficients and depolarization ratio values also coincide with the same set of points at the bottom portion of Fig. 4a just before the depolarization ratio goes variably high (black points). This result implies that these values can be considered the threshold values before the water freezes and forms snowflakes.
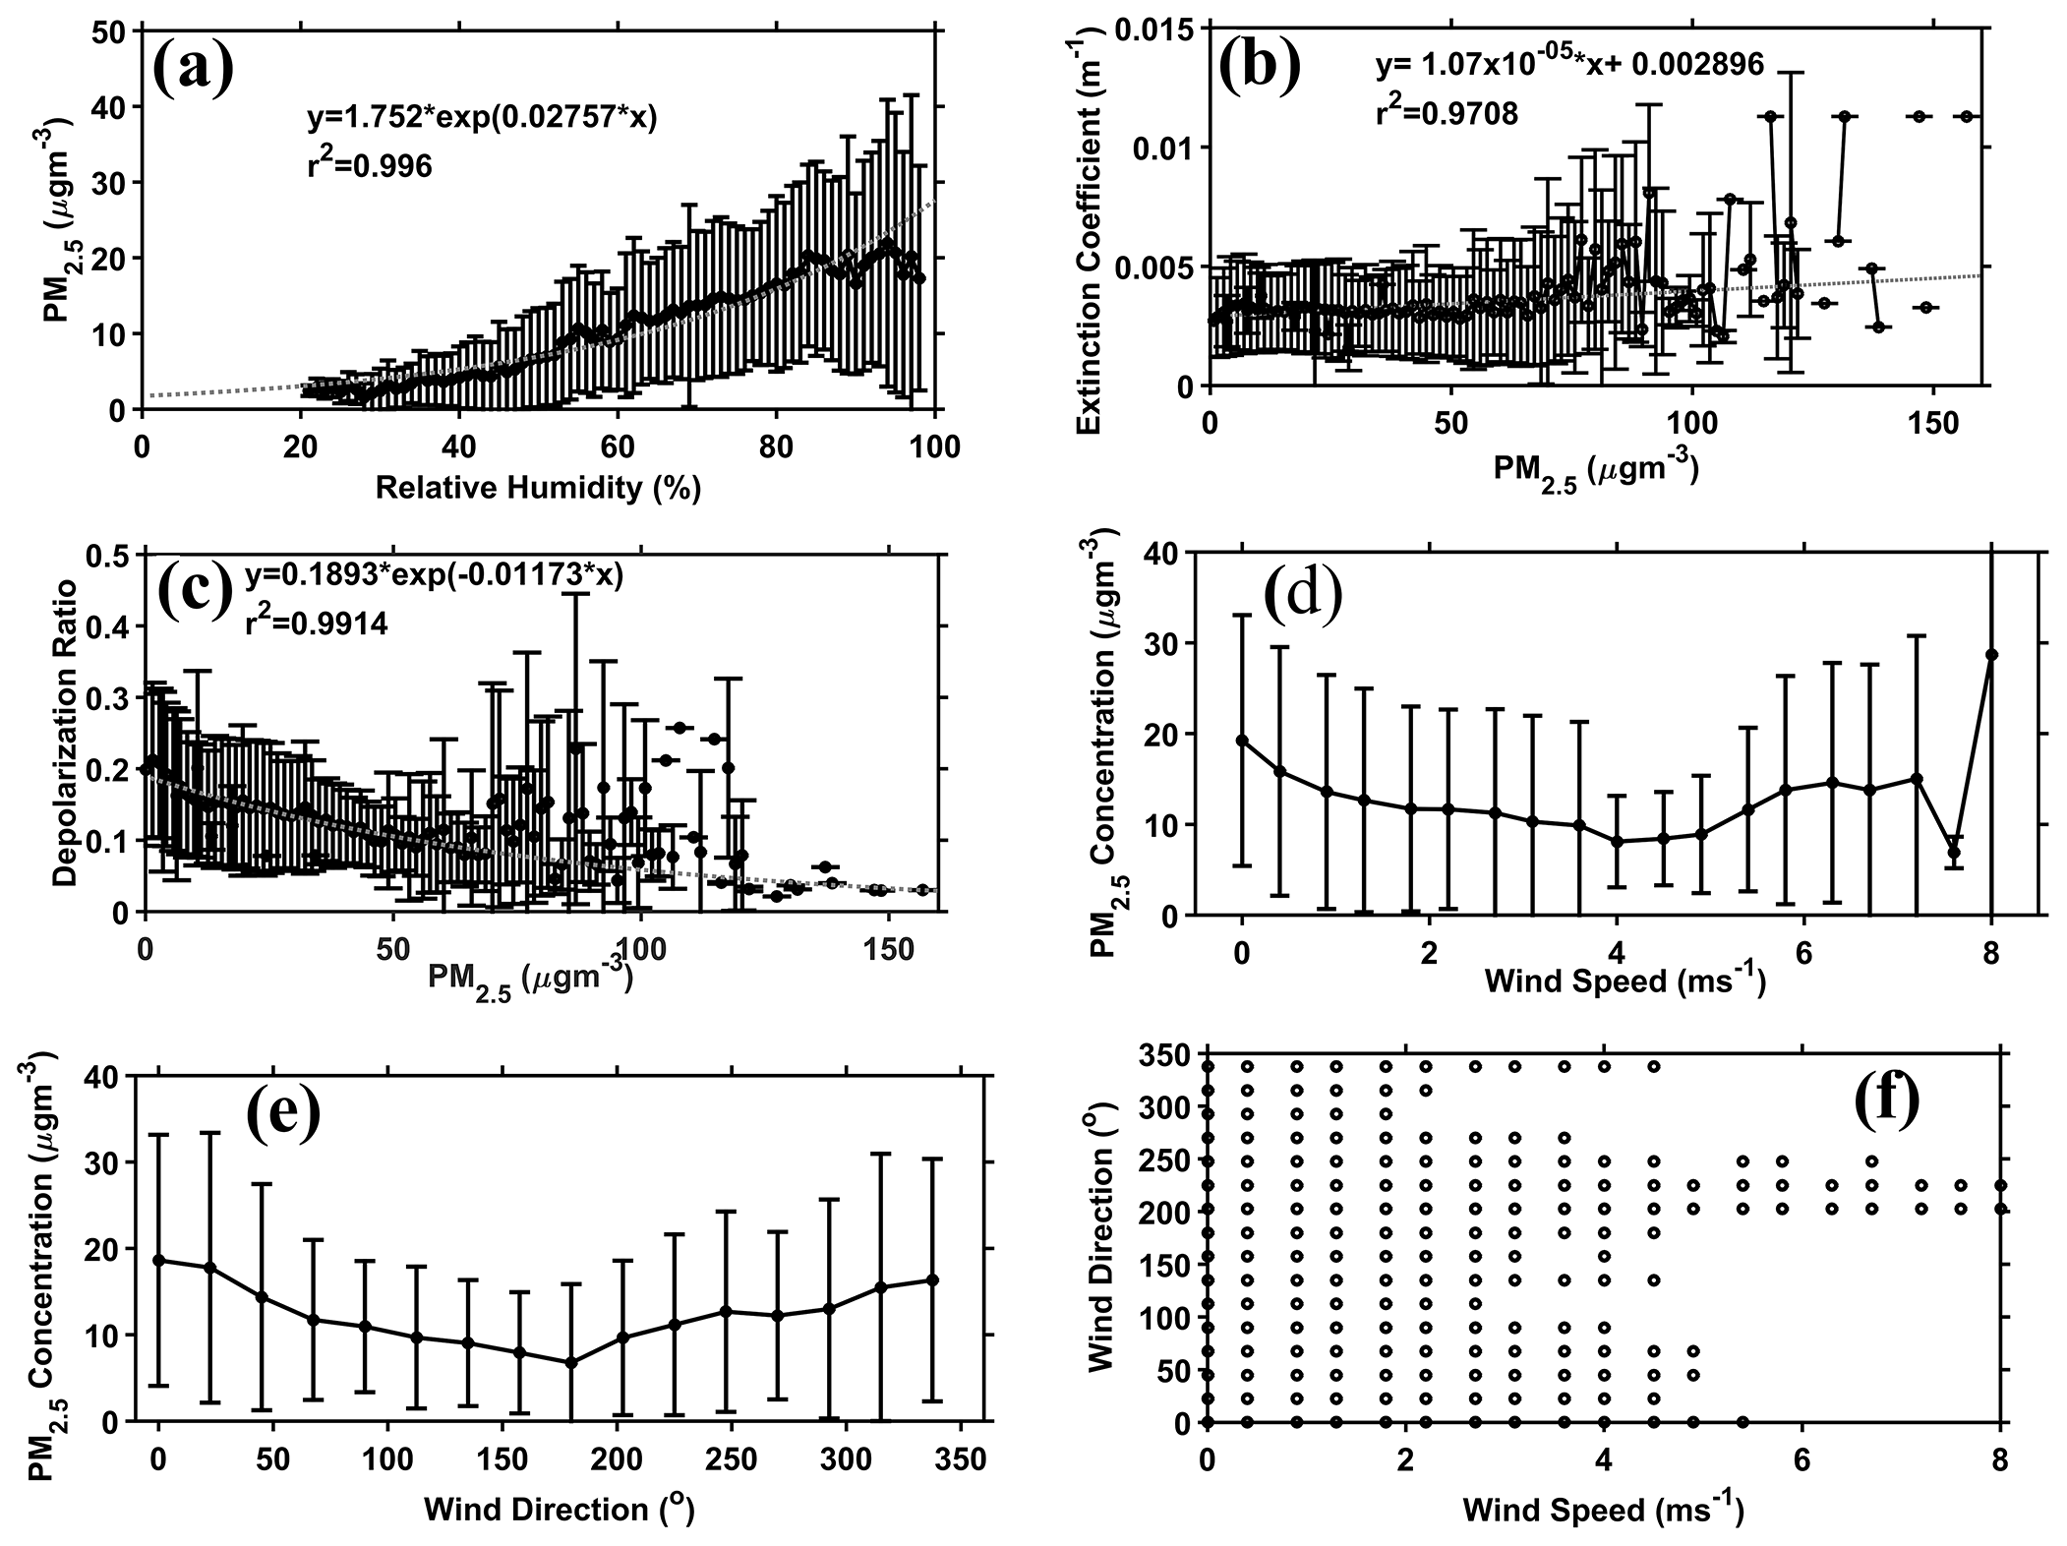
Figure 5(a) Observed relationship between PM2.5 and RH and (b) extinction coefficient and depolarization ratio with PM2.5 and the corresponding trend of PM2.5 with (d) wind speed and (e) wind direction and (f) wind direction with wind speed.
The PM2.5 concentration measured during the 7-month observation shows increasing concentration as RH increases (Fig. 5a). At RH > 80 %, the mean PM2.5 concentration deviates from the trend. This observation can be attributed to the fact that the PM2.5 values for high RH (> 70 %) are affected by hygroscopic growth (Nakayama et al., 2018). Previous works have observed this deviation at RH = 70 % (Lou et al., 2017; Wang and Ogawa, 2015; Zalakeviciute et al., 2018) and have attributed this to the effects of rain and hygroscopic growth that leads to reducing PM2.5 concentrations. Even though this result implies that in an area where radioactive aerosols exist, the increase in PM2.5 concentration can be due to the increase in RH and not necessarily an increase in radioactive aerosols unless the water vapor is also radioactive or when the prevailing wind comes from the land, which is the source of radioactive aerosols and dust. When the horizontal lidar continuously observes aerosols nearer the ground, as will be the case in Fukushima, a similar relationship between PM2.5 and RH is expected. It is worth mentioning that the fitted equations in the figures are only valid in the measured range of values, e.g., 20 µg m−3 < PM2.5 < 160 µg m−3. When the extinction coefficient is compared to the PM2.5 concentration (Fig. 5b), a linear fit can be anticipated, since the extinction coefficient is also proportional to the exponent of RH, and the PM2.5 concentration is linearly proportional to the extinction coefficient. The extinction coefficient from previous studies shows a linear relationship with PM2.5 with a zero offset. This result is expected because corrections from contributions from nitrogen dioxide to PM2.5 and PM10 concentrations are applied (Cheng et al., 2017; Gramsch et al., 2004; Yao et al., 2021). On the other hand, without any corrections applied to the data, other results show a similar non-zero intercept relationship between PM2.5 and aerosol optical parameters (aerosol optical depth, absorption and extinction coefficients) (Kong et al., 2017; Mei et al., 2017; Yang et al., 2019). In this work, no corrections are implemented, since this study focuses on the atmospheric effects on ambient aerosols and dust. This quantified relationship enables the approximate conversion of the measured PM2.5 and extinction coefficient.
The depolarization ratio from observed local aerosols decreases with increasing PM2.5 and can be modeled using an exponential function (Fig. 5c). Increased PM2.5 concentrations indicate aerosol growth by deliquescence, i.e., formation of more near-spherically shaped aerosols with sizes less than 2.5 µm. However, higher depolarization values are observed for PM2.5 concentrations greater than 60 µg m−3, deviating from the observed trend. These conditions are generally detected when wind speeds are high (> 0.5 m s−1). This result is also observed in the extinction coefficient and PM2.5 graph (Fig. 5b). Wind speeds greater than 0.5 m s−1 are associated with different PM2.5 concentrations. The observations in Chiba show that the distribution of PM2.5 with wind speed has a V-like structure, with the wind speed 4 m s−1 serving as the inflection point, and further indicates a bimodal distribution (Fig. 5d). PM2.5 values peak in the range from 1 to 2 m s−1 and from 5.5 to 7.5 m s−1. This information shows that the wind easily carries small dust near the ground, and it is dispersed as the wind speed increases. The second peak indicates increased PM2.5 concentrations from local or long transport. PM2.5 concentrations also have a bimodal distribution with wind direction (Fig. 5e). PM2.5 concentrations peak when the wind comes from the northeast, the location of a major highway, and from the south-southwest, the location of Tokyo Bay and partly urban land. Most wind speeds greater than 5 m s−1 also come from the south-southwest direction (Fig. 5f). The increase in PM2.5 concentration at higher wind speeds implies the abundance of local or coated aerosols from the water vapor coming from Tokyo Bay. The 7-month observation shows land-based PM2.5 concentrations are higher by ∼ 50 µg m−3 than Tokyo Bay-based aerosols.
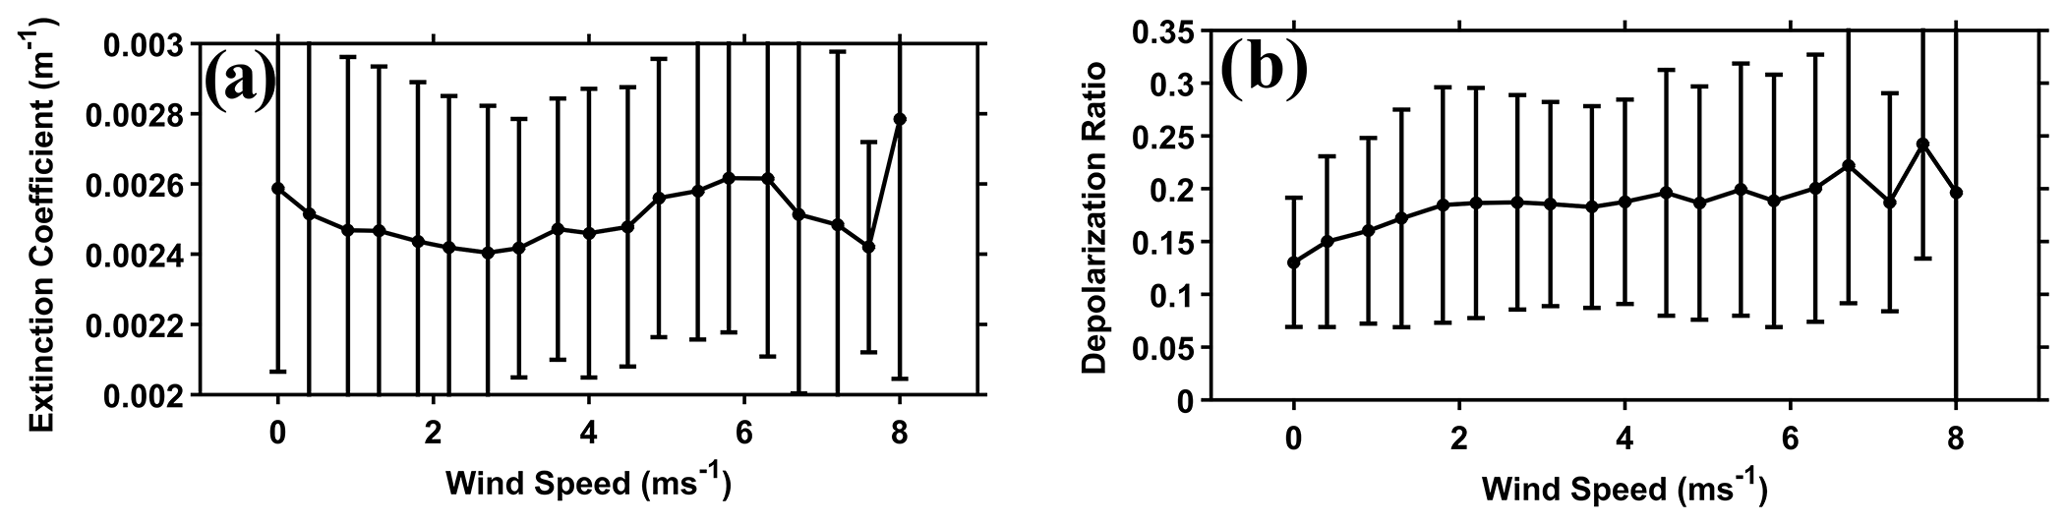
Figure 6Variation of average (a) extinction coefficient and (b) depolarization ratio with wind speed.
When average extinction coefficients and depolarization ratios are compared with the wind speed, patterns of the average values are noticeable, even though high variations exist (Fig. 6a and b). These high variations are expected when long-term atmospheric data are analyzed. The average extinction coefficient tends to have a bimodal distribution with wind speed similar to that of the PM2.5 concentration with wind speed. Average extinction coefficients are observed to peak when wind speed is less than 0.5 m s−1 and between 5 and 7 m s−1 (Fig. 6a). The first peak can be attributed to local aerosols near the lidar system, while the second peak can be attributed to both marine-type aerosols and dust. Wind speed greater than 5 m s−1 indicates wind directions from 200 to 250∘. This result is anticipated, since the extinction coefficient is shown to have a linear relationship with PM2.5. Similarly, the values of the average depolarization ratio increase with wind speed (Fig. 6b). The relationship between the average depolarization ratio and wind speed demonstrates that the wind effectively carries more non-spherical dust in the atmosphere, and in Chiba, a wind speed increase of 1 m s−1 increases the average depolarization ratio by approximately 0.008. This result is consistent with the previous discussion, wherein it was ascertained that an increase in the depolarization ratio indicates a decrease in PM2.5, and a reduction in PM2.5 concentration suggests a more likely increase in wind speed.
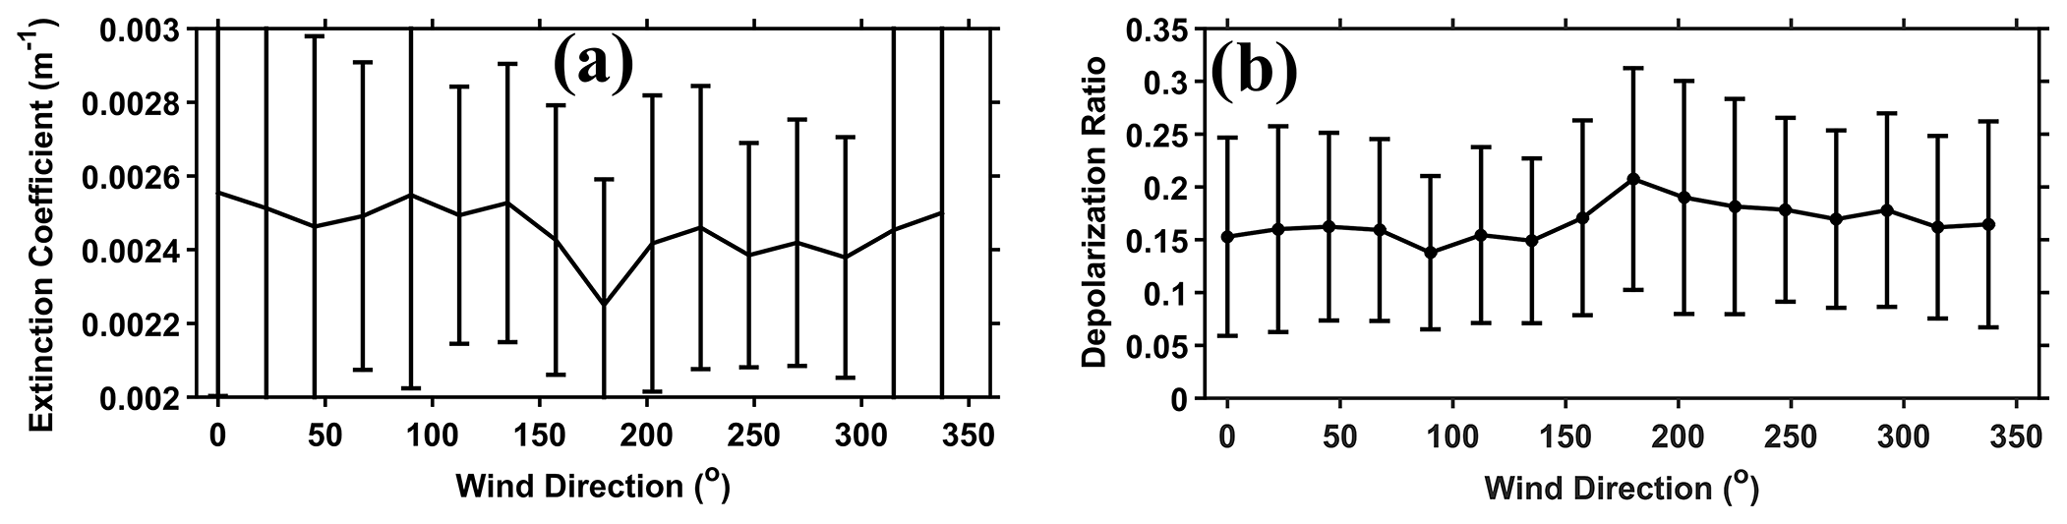
Figure 7Variation of average (a) extinction coefficient and (b) depolarization ratio with wind direction.
When the average extinction coefficient is compared with the wind direction, a slight decrease in the average extinction coefficient with wind direction can be observed from 0 to 315∘ (Fig. 7a). This decrease is approximately −3.3 × 10⁻⁷ m−1 per degree. Conversely, the average depolarization ratio moderately increases with wind direction at a rate of 6.8 × 10⁻⁵ per degree (Fig. 7b). Between 0 and 150∘, both parameters show slight changes in values. The average extinction coefficient decreases a bit from 2.4 × 10⁻³ to 2.2 × 10⁻³ m−1 when the wind direction is from 180 to 225∘, i.e., from Tokyo Bay. The average depolarization ratio increases by 0.05 in the same wind direction range, and this high average depolarization ratio (∼ 0.2) implies the dominance of marine-type aerosols in the atmosphere. The corresponding decrease in the average extinction coefficient when the wind is from Tokyo Bay suggests that marine-type aerosols have a lower extinction coefficient value (∼ 0.0023 m−1) than land-based aerosols. Wind directions between 225 and 315∘ carry aerosols with lower extinction coefficients than aerosols from 0 to 150∘. Conversely, the average depolarization ratio shows a relatively higher value (∼ 0.2) when the wind direction is between 225 and 315∘ than aerosols from 0 to 150∘ and can probably be attributed to the higher wind speeds between 200 and 250∘ that can be responsible for transporting more aerosols either from local or farther places.
These overall results provide information and insights into how the lidar-derived optical properties of aerosols are affected by atmospheric parameters (RH, absolute humidity, wind speed, wind direction) and PM2.5. The quantified relationships can aid and provide a general understanding of Fukushima's aerosol–weather relationship. When operated in Fukushima, the horizontal lidar can observe aerosols from the land and sea, and we expect that lidar weather parameters can also be quantified. As mentioned in Sect. 2, the left and right sides of the deployment site are land and the Pacific Ocean, respectively. Sources of radioactive aerosols are the aerosols from the land. Wind direction and speed will be the essential weather parameters that can be used to determine whether the observed aerosols come from the land or the Pacific Ocean. The observations in Chiba show that aerosols from Tokyo Bay have lower extinction coefficients and higher depolarization ratios than the aerosols from the land. Data from Fukushima observations are expected to follow this trend and can be used to classify which aerosols carry radioactivity. The aerosol concentrations will be measured using aerosol samplers. The data from the samplers, weather instruments and lidar can be compared to determine the extent to which aerosols are from the land and the Pacific Ocean. From the amount of land-based aerosols, the radioactivity level of inhalable aerosols can be regularly assessed. The proximity of the deployment site to the Pacific Ocean indicates that when the dominant wind comes from the ocean, nonradioactive marine-type aerosols dominate. Water vapor concentration is expected to increase, and the observed extinction coefficient will also increase. However, marine-type aerosols should have a lower extinction coefficient and higher depolarization ratio than land-based aerosols. By using PM2.5 data, the V-like structure relationship with wind direction can also aid in inferring whether the observed aerosols are land or sea based.
This work has shown that the data from continuously operated horizontal lidar, weather monitor and PM2.5 measurements can be used to describe and quantify the relationships among the optical properties of aerosols, weather parameters and PM2.5 concentrations. The results have shown that extinction coefficients of dust and aerosols increase with the RH, rain rate, PM2.5 amount, wind speed and absolute humidity. The same parameter decreases with both the depolarization ratio and wind direction. The lidar-derived depolarization ratio, on the other hand, increases with wind speed and wind direction and decreases with the extinction coefficient, RH, rain rate, PM2.5 concentration and absolute humidity. Quantified relationships between lidar-derived parameters (extinction coefficient and depolarization ratio) and weather parameters have been established from the 7-month data, providing an understanding of how the optical properties can change with each weather parameter. PM2.5 concentrations are observed to increase with RH, but a decreasing mean PM2.5 concentration is observed for RH > 80 %. In previous work, this decrease is observed when RH > 70 %, implying a different type of aerosol is observed in Chiba.
From these quantified relationships, trends can be inferred, and these can be used to analyze the data when the horizontal lidar is deployed in Fukushima. A similar methodology treatment on the data from continuous observations in Fukushima can be used. The results from the analysis of combined lidar, weather and sampling measurements can provide an assessment of the air quality and the amount of inhalable radioactive aerosols in the area.
In a radioactive area, the wind direction can dictate the level of radioactive aerosols. In Fukushima, when the dominant wind comes from the land, the prevalent aerosols and dust are expected to carry a traceable amount of radioactivity. When the prevailing wind direction is from the Pacific Ocean, marine-type aerosols that do not carry radioactivity will be dominant. Therefore, an increase in PM2.5 concentrations with RH does not imply an increase in the aerosol number concentration (and an increase in the radioactive level of inhalable aerosols). The increase in the extinction coefficient with RH and absolute humidity also does not indicate an increase in radioactive aerosols. The increase in extinction (or the decrease in depolarization ratio) when RH or absolute humidity increases suggests that water vapor is just condensing on radioactive aerosols.
The horizontal lidar is scheduled for deployment to an uninhabited area in Fukushima. The lidar will be operated continuously to detect radioactive aerosols and dust in conjunction with weather instruments and air samplers. The preliminary results from this work have provided qualitative and quantitative insights into the lidar, weather and PM2.5 concentration relationship that is valuable in assessing the occurrence of radioactive aerosols and dust in the atmosphere.
Will the data from this measurement be relevant from a global perspective and remote sensing point of view? Ideally, the same instruments must be deployed at different strategic locations to investigate local aerosol–weather relationships at various international locations. The data from this observation and the corresponding results presented in this work characterize and define the local aerosol–weather relationship. The dataset can potentially be used for global climate models to assess results from downscaling experiments.
Data used in this study are available upon request (shiina@faculty.chiba-u.jp and nofel@civil.kyushu-u.ac.jp).
The project was conceptualized and supervised by TS, YS and TO. Formal analysis of the data and writing and editing of the manuscript were carried out by NL. Data curation and system maintenance were done by NL and KO. PM2.5 data were curated by HI, YM and TN.
The contact author has declared that none of the authors has any competing interests.
Publisher's note: Copernicus Publications remains neutral with regard to jurisdictional claims made in the text, published maps, institutional affiliations, or any other geographical representation in this paper. While Copernicus Publications makes every effort to include appropriate place names, the final responsibility lies with the authors.
This research is partly funded by the Japan Environmental Storage and Safety Corporation (JESCO).
This paper was edited by Meng Gao and reviewed by Nikolaos Siomos and three anonymous referees.
Allott, R. W., Kelly, M., and Hewitt, C. N.: Behavior of urban dust contaminated by Chernobyl fallout: environmental half-lives and transfer coefficients, Environ. Sci. Technol., 26, 2142–2147, https://doi.org/10.1021/es00035a011, 1992. a
Burgos, M., Andrews, E., Titos, G., Alados-Arboledas, L., Baltensperger, U., Day, D., Jefferson, A., Kalivitis, N., Mihalopoulos, N., Sherman, S., Sun, J., Weingartner, E., and Zieger, P.: A global view on the effect of water uptake on aerosol particle light scattering, Scientific Data, 6, 157, https://doi.org/10.1038/s41597-019-0158-7, 2019. a
Burton, S. P., Hair, J. W., Kahnert, M., Ferrare, R. A., Hostetler, C. A., Cook, A. L., Harper, D. B., Berkoff, T. A., Seaman, S. T., Collins, J. E., Fenn, M. A., and Rogers, R. R.: Observations of the spectral dependence of linear particle depolarization ratio of aerosols using NASA Langley airborne High Spectral Resolution Lidar, Atmos. Chem. Phys., 15, 13453–13473, https://doi.org/10.5194/acp-15-13453-2015, 2015. a
Campbell, J. R., Hlavka, D. L., Welton, E. J., Flynn, C. J., Turner, D. D., Spinhirne, J. D., Scott, V. S., and Hwang, I. H.: Full-Time, Eye-Safe Cloud and Aerosol Lidar Observation at Atmospheric Radiation Measurement Program Sites: Instruments and Data Processing, J. Atmos. Ocean. Tech., 19, 431–442, https://doi.org/10.1175/1520-0426(2002)019<0431:FTESCA>2.0.CO;2, 2002. a
Chen, J., Li, Z., Lv, M., Wang, Y., Wang, W., Zhang, Y., Wang, H., Yan, X., Sun, Y., and Cribb, M.: Aerosol hygroscopic growth, contributing factors, and impact on haze events in a severely polluted region in northern China, Atmos. Chem. Phys., 19, 1327–1342, https://doi.org/10.5194/acp-19-1327-2019, 2019. a
Cheng, Z., Ma, X., He, Y., Jiang, J., Wang, X., Wang, Y., Sheng, L., Hu, J., and Yan, N.: Mass extinction efficiency and extinction hygroscopicity of ambient PM2.5 in urban China, Environ. Res., 156, 239–246, https://doi.org/10.1016/j.envres.2017.03.022, 2017. a, b
Cigánková, H., Mikuška, P., Hegrová, J., Pokorná, P., Schwarz, J., and Krajčovič, J.: Seasonal Variation and Sources of Elements in Urban Submicron and Fine Aerosol in Brno, Czech Republic, Aerosol Air Qual. Res., 21, 200556, https://doi.org/10.4209/aaqr.2020.09.0556, 2021. a
Comerón, A., Rodríguez-Gómez, A., Sicard, M., Barragán, R., Muñoz-Porcar, C., Rocadenbosch, F., and Granados-Muñoz, M.: Considerations about the Determination of the Depolarization Calibration Profile of a Two-Telescope Lidar and Its Implications for Volume Depolarization Ratio Retrieval, Sensors, 18, 1807, https://doi.org/10.3390/s18061807, 2018. a
Damiani, A., Irie, H., Yamaguchi, K., Hoque, H. M. S., Nakayama, T., Matsumi, Y., Kondo, Y., and Silva, A. D.: Variabilities in PM2.5 and black carbon surface concentrations reproduced by aerosol optical properties estimated by in-situ data, ground based remote sensing and modeling, Remote Sens., 13, 3163, https://doi.org/10.3390/rs13163163, 2021. a
Dawson, K., Ferrare, R., Moore, R., Clayton, M., Thorsen, T., and Eloranta, E.: Ambient aerosol hygroscopic growth from combined Raman lidar and HSRL, J. Geophys. Res.-Atmos., 125, e2019JD031708, https://doi.org/10.1029/2019JD031708, 2020. a
Düsing, S., Ansmann, A., Baars, H., Corbin, J. C., Denjean, C., Gysel-Beer, M., Müller, T., Poulain, L., Siebert, H., Spindler, G., Tuch, T., Wehner, B., and Wiedensohler, A.: Measurement report: Comparison of airborne, in situ measured, lidar-based, and modeled aerosol optical properties in the central European background – identifying sources of deviations, Atmos. Chem. Phys., 21, 16745–16773, https://doi.org/10.5194/acp-21-16745-2021, 2021. a
Freudenthaler, V., Esselborn, M., Wiegner, M., Heese, B., Tesche, M., Ansmann, A., Müller, D., Althausen, D., Wirth, M., Fix, A., Ehret, G., Knippertz, P., Toledano, C., Gasteiger, J., Garhammer, M., and Seefeldner, M.: Depolarization ratio profiling at several wavelengths in pure Saharan dust during SAMUM 2006, Tellus B, 61, 165–179, https://doi.org/10.1111/j.1600-0889.2008.00396.x, 2009. a
Fukagawa, S., Kuze, H., Bagtasa, G., Naito, S., Yabuki, M., Takamura, T., and Takeuchi, N.: Characterization of seasonal variation of tropospheric aerosols in Chiba, Japan, Atmos. Environ., 40, 2160–2168, https://doi.org/10.1016/j.atmosenv.2005.11.056, 2006. a, b, c, d
Gramsch, E., Ormeño, I., Palma, G., Cereceda-Balic, F., and Oyola, P.: Use of the light absorption coefficient to monitor elemental carbon and PM2.5-Example of Santiago de Chile, J. Air Waste Manage. Assoc., 54, 799–808, https://doi.org/10.1080/10473289.2004.10470956, 2004. a
Groß, S., Tesche, M., Freudenthaler, V., Toledano, C., Wiegner, M., Ansmann, A., Althausen, D., and Seefeldner, M.: Characterization of Saharan dust, marine aerosols and mixtures of biomass-burning aerosols and dust by means of multi-wavelength depolarization and Raman lidar measurements during SAMUM 2, Tellus B, 63, 706–724, https://doi.org/10.1111/j.1600-0889.2011.00556.x, 2011. a
Gusmão, G. F., Barbosa, C. R. H., and Raposo, A. B.: Development and Validation of LiDAR Sensor Simulators Based on Parallel Raycasting, Sensors, 20, 7186, https://doi.org/10.3390/s20247186, 2020. a
Haarig, M., Ansmann, A., Gasteiger, J., Kandler, K., Althausen, D., Baars, H., Radenz, M., and Farrell, D. A.: Dry versus wet marine particle optical properties: RH dependence of depolarization ratio, backscatter, and extinction from multiwavelength lidar measurements during SALTRACE, Atmos. Chem. Phys., 17, 14199–14217, https://doi.org/10.5194/acp-17-14199-2017, 2017. a, b, c, d
Haarig, M., Ansmann, A., Engelmann, R., Baars, H., Toledano, C., Torres, B., Althausen, D., Radenz, M., and Wandinger, U.: First triple-wavelength lidar observations of depolarization and extinction-to-backscatter ratios of Saharan dust, Atmos. Chem. Phys., 22, 355–369, https://doi.org/10.5194/acp-22-355-2022, 2022. a, b
Hanfi, M. Y., Yarmoshenko, I. V., and Zhukovsky, M. V.: Assessment of radiation dose from inhalation of outdoor dust containing natural radionuclides, Radiat. Prot. Dosim., 196, 184–189, https://doi.org/10.1093/rpd/ncab148, 2021. a
Hashimoto, M., Nakajima, T., Dubovik, O., Campanelli, M., Che, H., Khatri, P., Takamura, T., and Pandithurai, G.: Development of a new data-processing method for SKYNET sky radiometer observations, Atmos. Meas. Tech., 5, 2723–2737, https://doi.org/10.5194/amt-5-2723-2012, 2012. a
Hidaka, T., Kasuga, H., Kakamu, T., Endo, S., Masuishi, Y., and Fukushima, T.: Concerns related to returning home to a “difficult-to-return zone” after a long-term evacuation due to Fukushima Nuclear Power Plant Accident: A qualitative study, PLOS ONE, 17, e0273684, https://doi.org/10.1371/journal.pone.0273684, 2022. a
Huang, Z., Shen, X., Tang, S., Zhou, T., Dong, Q., Zhang, S., Li, M., and Wang, Y.: Simulated depolarization ratios for dust and smoke at laser wavelengths: implications for lidar application, Opt. Express, 31, 10541, https://doi.org/10.1364/OE.484335, 2023. a
Humphries, R. S., Keywood, M. D., Ward, J. P., Harnwell, J., Alexander, S. P., Klekociuk, A. R., Hara, K., McRobert, I. M., Protat, A., Alroe, J., Cravigan, L. T., Miljevic, B., Ristovski, Z. D., Schofield, R., Wilson, S. R., Flynn, C. J., Kulkarni, G. R., Mace, G. G., McFarquhar, G. M., Chambers, S. D., Williams, A. G., and Griffiths, A. D.: Measurement report: Understanding the seasonal cycle of Southern Ocean aerosols, Atmos. Chem. Phys., 23, 3749–3777, https://doi.org/10.5194/acp-23-3749-2023, 2023. a
Jain, S., Sharma, S., Vijayan, N., and Mandal, T.: Seasonal characteristics of aerosols (PM2.5 and PM10) and their source apportionment using PMF: A four year study over Delhi, India, Environ. Pollut., 262, 114337, https://doi.org/10.1016/j.envpol.2020.114337, 2020. a
Jefferson, A., Hageman, D., Morrow, H., Mei, F., and Watson, T.: Seven years of aerosol scattering hygroscopic growth measurements from SGP: Factors influencing water uptake, J. Geophys. Res.-Atmos., 122, 9451–9466, https://doi.org/10.1002/2017JD026804, 2017. a
Jung, C. H., Yoon, Y. J., Um, J., Lee, S. S., Han, K. M., Shin, H. J., Lee, J. Y., and Kim, Y. P.: Approximated expression of the hygroscopic growth factor for polydispersed aerosols, J. Aerosol Sci., 151, 105670, https://doi.org/10.1016/j.jaerosci.2020.105670, 2021. a, b
Kahnert, M., Kanngießer, F., Järvinen, E., and Schnaiter, M.: Aerosol-optics model for the backscatter depolarisation ratio of mineral dust particles, J. Quant. Spectrosc. Ra., 254, 107177, https://doi.org/10.1016/j.jqsrt.2020.107177, 2020. a
Kawai, K., Kai, K., Jin, Y., Sugimoto, N., and Batdorj, D.: Lidar Network Observation of Dust Layer Development over the Gobi Desert in Association with a Cold Frontal System on 22–23 May 2013, J. Meteorol. Soc. Jpn. Ser. II, 96, 255–268, https://doi.org/10.2151/jmsj.2018-023, 2018. a
Kim, S.-W., Berthier, S., Raut, J.-C., Chazette, P., Dulac, F., and Yoon, S.-C.: Validation of aerosol and cloud layer structures from the space-borne lidar CALIOP using a ground-based lidar in Seoul, Korea, Atmos. Chem. Phys., 8, 3705–3720, https://doi.org/10.5194/acp-8-3705-2008, 2008. a
Kong, L., Xin, J., Liu, Z., Zhang, K., Tang, G., Zhang, W., and Wang, Y.: The PM2.5 threshold for aerosol extinction in the Beijing megacity, Atmos. Environ., 167, 458–465, https://doi.org/10.1016/j.atmosenv.2017.08.047, 2017. a
Kunz, G. J. and de Leeuw, G.: Inversion of lidar signals with the slope method, Appl. Optics, 32, 3249, https://doi.org/10.1364/AO.32.003249, 1993. a
Lagrosas, N., Kuze, H., Takeuchi, N., Fukagawa, S., Bagtasa, G., Yoshii, Y., Naito, S., and Yabuki, M.: Correlation study between suspended particulate matter and portable automated lidar data, J. Aerosol Sci., 36, 439–454, https://doi.org/10.1016/j.jaerosci.2004.10.007, 2005. a
Lagrosas, N., Bagtasa, G., Manago, N., and Kuze, H.: Influence of ambient relative humidity on seasonal trends of the scattering enhancement factor for aerosols in Chiba, Japan, Aerosol Air Qual. Res., 19, 1856–1871, https://doi.org/10.4209/aaqr.2018.07.0267, 2019. a, b
Latimer, R. N. C. and Martin, R. V.: Interpretation of measured aerosol mass scattering efficiency over North America using a chemical transport model, Atmos. Chem. Phys., 19, 2635–2653, https://doi.org/10.5194/acp-19-2635-2019, 2019. a
Liu, H., Pei, X., Zhang, F., Song, Y., Kuang, B., Xu, Z., and Wang, Z.: Relative Humidity Dependence of Growth Factor and Real Refractive Index for Sea Salt/Malonic Acid Internally Mixed Aerosols, J. Geophys. Res.-Atmos., 128, e2022JD037579, https://doi.org/10.1029/2022JD037579, 2023. a
Lou, C., Liu, H., Li, Y., Peng, Y., Wang, J., and Dai, L.: Relationships of relative humidity with PM2.5 and PM10 in the Yangtze River Delta, China, Environ. Monit. Assess., 189, 582, https://doi.org/10.1007/s10661-017-6281-z, 2017. a
Makar, P., Gong, W., Milbrandt, J., Hogrefe, C., Zhang, Y., Curci, G., Žabkar, R., Im, U., Balzarini, A., Baró, R., Bianconi, R., Cheung, P., Forkel, R., Gravel, S., Hirtl, M., Honzak, L., Hou, A., Jiménez-Guerrero, P., Langer, M., Moran, M., Pabla, B., Pérez, J., Pirovano, G., José, R. S., Tuccella, P., Werhahn, J., Zhang, J., and Galmarini, S.: Feedbacks between air pollution and weather, Part 1: Effects on weather, Atmos. Environ., 115, 442–469, https://doi.org/10.1016/j.atmosenv.2014.12.003, 2015. a
Makar, P. A., Akingunola, A., Chen, J., Pabla, B., Gong, W., Stroud, C., Sioris, C., Anderson, K., Cheung, P., Zhang, J., and Milbrandt, J.: Forest-fire aerosol–weather feedbacks over western North America using a high-resolution, online coupled air-quality model, Atmos. Chem. Phys., 21, 10557–10587, https://doi.org/10.5194/acp-21-10557-2021, 2021. a
Mao, Q., Huang, C., Zhang, H., Chen, Q., and Yuan, Y.: Aerosol optical properties and radiative effect under different weather conditions in Harbin, China, Infrared Phys. Techn., 89, 304–314, https://doi.org/10.1016/j.infrared.2018.01.024, 2018. a
Matsuo, M., Taira, Y., Orita, M., Yamada, Y., Ide, J., Yamashita, S., and Takamura, N.: Evaluation of Environmental Contamination and Estimated Radiation Exposure Dose Rates among Residents Immediately after Returning Home to Tomioka Town, Fukushima Prefecture, Int. J. Env. Res. Pub. He., 16, 1481, https://doi.org/10.3390/ijerph16091481, 2019. a, b
Mei, L., Guan, P., Yang, Y., and Kong, Z.: Atmospheric extinction coefficient retrieval and validation for the single-band Mie-scattering Scheimpflug lidar technique, Opt. Express, 25, A628, https://doi.org/10.1364/OE.25.00A628, 2017. a
Ming, Y. and Russell, L. M.: Predicted hygroscopic growth of sea salt aerosol, J. Geophys. Res.-Atmos., 106, 28259–28274, https://doi.org/10.1029/2001JD000454, 2001. a
Nakajima, T., Campanelli, M., Che, H., Estellés, V., Irie, H., Kim, S.-W., Kim, J., Liu, D., Nishizawa, T., Pandithurai, G., Soni, V. K., Thana, B., Tugjsurn, N.-U., Aoki, K., Go, S., Hashimoto, M., Higurashi, A., Kazadzis, S., Khatri, P., Kouremeti, N., Kudo, R., Marenco, F., Momoi, M., Ningombam, S. S., Ryder, C. L., Uchiyama, A., and Yamazaki, A.: An overview of and issues with sky radiometer technology and SKYNET, Atmos. Meas. Tech., 13, 4195–4218, https://doi.org/10.5194/amt-13-4195-2020, 2020. a
Nakayama, T., Matsumi, Y., Kawahito, K., and Watabe, Y.: Development and evaluation of a palm-sized optical PM2.5 sensor, Aerosol Sci. Tech., 52, 2–12, https://doi.org/10.1080/02786826.2017.1375078, 2018. a, b
Noh, Y. M., Müller, D., Mattis, I., Lee, H., and Kim, Y. J.: Vertically resolved light-absorption characteristics and the influence of relative humidity on particle properties: Multiwavelength Raman lidar observations of East Asian aerosol types over Korea, J. Geophys. Res., 116, D06206, https://doi.org/10.1029/2010JD014873, 2011. a
Ong, P. M., Lagrosas, N., Shiina, T., and Kuze, H.: Surface aerosol properties studied using a near-horizontal lidar, Atmosphere, 11, 36, https://doi.org/10.3390/atmos11010036, 2019. a, b, c
Orikasa, N., Saito, A., Yamashita, K., Tajiri, T., Zaizen, Y., Kuo, T.-H., Kuo, W.-C., and Murakami, M.: Seasonal Variations of Atmospheric Aerosol Particles Focused on Cloud Condensation Nuclei and Ice Nucleating Particles from Ground-Based Observations in Tsukuba, Japan, SOLA, 16, 212–219, https://doi.org/10.2151/sola.2020-036, 2020. a
Pappalardo, G., Amodeo, A., Apituley, A., Comeron, A., Freudenthaler, V., Linné, H., Ansmann, A., Bösenberg, J., D'Amico, G., Mattis, I., Mona, L., Wandinger, U., Amiridis, V., Alados-Arboledas, L., Nicolae, D., and Wiegner, M.: EARLINET: towards an advanced sustainable European aerosol lidar network, Atmos. Meas. Tech., 7, 2389–2409, https://doi.org/10.5194/amt-7-2389-2014, 2014. a
Qi, S., Huang, Z., Ma, X., Huang, J., Zhou, T., Zhang, S., Dong, Q., Bi, J., and Shi, J.: Classification of atmospheric aerosols and clouds by use of dual-polarization lidar measurements, Opt. Express, 29, 23461, https://doi.org/10.1364/OE.430456, 2021. a
Reggente, M., Dillner, A. M., and Takahama, S.: Analysis of functional groups in atmospheric aerosols by infrared spectroscopy: systematic intercomparison of calibration methods for US measurement network samples, Atmos. Meas. Tech., 12, 2287–2312, https://doi.org/10.5194/amt-12-2287-2019, 2019. a
Sakai, T., Orikasa, N., Nagai, T., Murakami, M., Kusunoki, K., Mori, K., Hashimoto, A., Matsumura, T., and Shibata, T.: Optical and microphysical properties of upper clouds measured with the Raman lidar and hydrometeor videosonde: A case study on 29 March 2004 over Tsukuba, Japan, J. Atmos. Sci., 63, 2156–2166, https://doi.org/10.1175/JAS3736.1, 2006. a
Seinfeld, J. H. and Pandis, S. N.: Atmospheric Chemistry and Physics: From Air Pollution to Climate Change, 3rd edn., Wiley, ISBN 9781118947401, 2016. a
Shiina, T., Peng, Z., Okada, T., Sugita, Y., Yokozawa, T., and Shinozaki, T.: Distribution estimation of radioactivity concentration by compact polarization lidar in Fukushima, in: Lidar Technologies, Techniques, and Measurements for Atmospheric Remote Sensing XIV, edited by: Singh, U. N. and Tzeremes, G. D., International Society for Optics and Photonics, SPIE, vol. 10791, 107910C, https://doi.org/10.1117/12.2325600, 2018. a, b
Shingler, T., Sorooshian, A., Ortega, A., Crosbie, E., Wonaschütz, A., Perring, A. E., Beyersdorf, A., Ziemba, L., Jimenez, J. L., Campuzano‐Jost, P., Mikoviny, T., Wisthaler, A., and Russell, L. M.: Ambient observations of hygroscopic growth factor and f(RH) below 1: Case studies from surface and airborne measurements, J. Geophys. Res.-Atmos., 121, 13661–13677, https://doi.org/10.1002/2016JD025471, 2016. a
Skupin, A., Ansmann, A., Engelmann, R., Seifert, P., and Müller, T.: Four-year long-path monitoring of ambient aerosol extinction at a central European urban site: dependence on relative humidity, Atmos. Chem. Phys., 16, 1863–1876, https://doi.org/10.5194/acp-16-1863-2016, 2016. a, b
Takagi, M., Tanaka, A., and Nakayama, S. F.: Estimation of the radiation dose via indoor dust in the Ibaraki and Chiba prefectures, 150–200 km south from the Fukushima Daiichi Nuclear Power Plant, Chemosphere, 236, 124778, https://doi.org/10.1016/j.chemosphere.2019.124778, 2019. a
Tang, I. N., Tridico, A. C., and Fung, K. H.: Thermodynamic and optical properties of sea salt aerosols, J. Geophys. Res.-Atmos., 102, 23269–23275, https://doi.org/10.1029/97JD01806, 1997. a, b
Tang, M., Chan, C. K., Li, Y. J., Su, H., Ma, Q., Wu, Z., Zhang, G., Wang, Z., Ge, M., Hu, M., He, H., and Wang, X.: A review of experimental techniques for aerosol hygroscopicity studies, Atmos. Chem. Phys., 19, 12631–12686, https://doi.org/10.5194/acp-19-12631-2019, 2019. a, b
Valentin, J.: Guide for the Practical Application of the ICRP Human Respiratory Tract Model, Ann. ICRP, 32, 13–14, https://doi.org/10.1016/S0146-6453(03)00011-3, 2002. a
Vu, T. V., Shi, Z., and Harrison, R. M.: Estimation of hygroscopic growth properties of source-related sub-micrometre particle types in a mixed urban aerosol, npj Climate and Atmospheric Science, 4, 21, https://doi.org/10.1038/s41612-021-00175-w, 2021. a
Wang, J. and Ogawa, S.: Effects of Meteorological Conditions on PM2.5 Concentrations in Nagasaki, Japan, Int. J. Env. Res. Pub. He., 12, 9089–9101, https://doi.org/10.3390/ijerph120809089, 2015. a
Wang, N., Zhang, K., Shen, X., Wang, Y., Li, J., Li, C., Mao, J., Malinka, A., Zhao, C., Russell, L. M., Guo, J., Gross, S., Liu, C., Yang, J., Chen, F., Wu, L., Chen, S., Ke, J., Xiao, D., Zhou, Y., Fang, J., and Liu, D.: Dual-field-of-view high-spectral-resolution lidar: Simultaneous profiling of aerosol and water cloud to study aerosol–cloud interaction, P. Natl. Acad. Sci. USA, 119, e2110756119, https://doi.org/10.1073/pnas.2110756119, 2022. a
Whiteman, D., Melfi, S. H., McGee, T. J., Ferrare, R. A., Butler, J. J., and Burris, J.: Lidar Data Validation Techniques, Optica Publishing Group, WD21, https://doi.org/10.1364/ORSA.1990.WD21, 1990. a
Xiafukaiti, A., Lagrosas, N., Ong, P. M., Saitoh, N., Shiina, T., and Kuze, H.: Comparison of aerosol properties derived from sampling and near-horizontal lidar measurements using Mie scattering theory, Appl. Optics, 59, 8014, https://doi.org/10.1364/AO.398673, 2020. a, b, c
Xu, X., Xie, J., Li, Y., Miao, S., and Fan, S.: Measurement report: Vehicle-based multi-lidar observational study of the effect of meteorological elements on the three-dimensional distribution of particles in the western Guangdong–Hong Kong–Macao Greater Bay Area, Atmos. Chem. Phys., 22, 139–153, https://doi.org/10.5194/acp-22-139-2022, 2022. a
Yamauchi, M.: Secondary wind transport of radioactive materials after the Fukushima accident, Earth Planets Space, 64, e1–e4, https://doi.org/10.5047/eps.2012.01.002, 2012. a
Yang, Q., Yuan, Q., Yue, L., Li, T., Shen, H., and Zhang, L.: The relationships between PM2.5 and aerosol optical depth (AOD) in mainland China: About and behind the spatio-temporal variations, Environ. Pollut., 248, 526–535, https://doi.org/10.1016/j.envpol.2019.02.071, 2019. a
Yao, L., Kong, S., Zheng, H., Chen, N., Zhu, B., Xu, K., Cao, W., Zhang, Y., Zheng, M., Cheng, Y., Hu, Y., Zhang, Z., Yan, Y., Liu, D., Zhao, T., Bai, Y., and Qi, S.: Co-benefits of reducing PM2.5 and improving visibility by COVID-19 lockdown in Wuhan, npj Climate and Atmospheric Science, 4, 40, https://doi.org/10.1038/s41612-021-00195-6, 2021. a
Zalakeviciute, R., López-Villada, J., and Rybarczyk, Y.: Contrasted Effects of Relative Humidity and Precipitation on Urban PM2.5 Pollution in High Elevation Urban Areas, Sustainability, 10, 2064, https://doi.org/10.3390/su10062064, 2018. a
Zhang, Z., Liu, L., Wang, B., Tan, H., Lan, C., Wang, Y., and Chan, P.: Impact of aerosol mixing state and hygroscopicity on the lidar ratio, Remote Sens., 14, 1554, https://doi.org/10.3390/rs14071554, 2022. a
Zieger, P., Weingartner, E., Henzing, J., Moerman, M., de Leeuw, G., Mikkilä, J., Ehn, M., Petäjä, T., Clémer, K., van Roozendael, M., Yilmaz, S., Frieß, U., Irie, H., Wagner, T., Shaiganfar, R., Beirle, S., Apituley, A., Wilson, K., and Baltensperger, U.: Comparison of ambient aerosol extinction coefficients obtained from in-situ, MAX-DOAS and LIDAR measurements at Cabauw, Atmos. Chem. Phys., 11, 2603–2624, https://doi.org/10.5194/acp-11-2603-2011, 2011. a, b
Zieger, P., Fierz-Schmidhauser, R., Weingartner, E., and Baltensperger, U.: Effects of relative humidity on aerosol light scattering: results from different European sites, Atmos. Chem. Phys., 13, 10609–10631, https://doi.org/10.5194/acp-13-10609-2013, 2013. a, b, c
Zieger, P., Fierz-Schmidhauser, R., Poulain, L., Müller, T., Birmili, W., Spindler, G., Wiedensohler, A., Baltensperger, U., and Weingartner, E.: Influence of water uptake on the aerosol particle light scattering coefficients of the Central European aerosol, Tellus B, 66, 22716, https://doi.org/10.3402/tellusb.v66.22716, 2014. a