the Creative Commons Attribution 4.0 License.
the Creative Commons Attribution 4.0 License.
 | 09 Feb 2023
The CALIPSO version 4.5 stratospheric aerosol subtyping algorithm
Jason L. Tackett
Jayanta Kar
Mark A. Vaughan
Brian J. Getzewich
Man-Hae Kim
Jean-Paul Vernier
Ali H. Omar
Brian E. Magill
Michael C. Pitts
David M. Winker
The accurate classification of aerosol types injected into the stratosphere is important to properly characterize their chemical and radiative impacts within the Earth climate system. The updated stratospheric aerosol subtyping algorithm used in the version 4.5 (V4.5) release of the Cloud Aerosol Lidar with Orthogonal Polarization (CALIOP) level 2 data products now delivers more comprehensive and accurate classifications than its predecessor. The original algorithm identified four aerosol subtypes for layers detected above the tropopause: volcanic ash, smoke, sulfate/other, and polar stratospheric aerosol (PSA). In the revised algorithm, sulfates are separately identified as a distinct, homogeneous subtype, and the diffuse, weakly scattering layers previously assigned to the sulfate/other class are recategorized as a fifth “unclassified” subtype. By making two structural changes to the algorithm and revising two thresholds, the V4.5 algorithm improves the ability to discriminate between volcanic ash and smoke from pyrocumulonimbus injections, improves the fidelity of the sulfate subtype, and more accurately reflects the uncertainties inherent in the classification process. The 532 nm lidar ratio for volcanic ash was also revised to a value more consistent with the current state of knowledge. This paper briefly reviews the previous version of the algorithm (V4.1 and V4.2) then fully details the rationale and impact of the V4.5 changes on subtype classification frequency for specific events where the dominant aerosol type is known based on the literature. Classification accuracy is best for volcanic ash due to its characteristically high depolarization ratio. Smoke layers in the stratosphere are also classified with reasonable accuracy, though during the daytime a substantial fraction are misclassified as ash. It is also possible for mixtures of ash and sulfate to be misclassified as smoke. The V4.5 sulfate subtype accuracy is less than that for ash or smoke, with sulfates being misclassified as smoke about one-third of the time. However, because exceptionally tenuous layers are now assigned to the unclassified subtype and the revised algorithm levies more stringent criteria for identifying an aerosol as sulfate, it is more likely that layers labeled as this subtype are in fact sulfate compared to those assigned the sulfate/other classification in the previous data release.
- Article
(14001 KB) - Full-text XML
-
Supplement
(3329 KB) - BibTeX
- EndNote


Injections of aerosols into the stratosphere have important impacts on the chemistry in the upper atmosphere and affect the Earth's radiative energy balance (Kremser et al., 2016). Explosive volcanic eruptions can inject large amounts of ash and sulfur dioxide (SO2) gas into the lower and middle stratosphere. Ash, which is most often composed of silicates, can remain in the atmosphere for weeks or, in extreme cases, months, as in the case of the 2014 Kelud eruption (Vernier et al., 2016). SO2 reacts with the hydroxyl radical OH in the stratosphere through photochemistry, forming sulfuric acid (H2SO4) nuclei which grow by condensation and coagulation into larger sulfate aerosols (Kremser et al., 2016). The radiative and chemical impacts of sulfate in the stratosphere can be significant (e.g., Stone et al., 2017). A third aerosol type in the upper troposphere and lower stratosphere (UTLS) is becoming widely recognized as important: smoke from pyrocumulonimbus (pyroCb) events within intense wildfires (Fromm et al., 2010). PyroCb events inject smoke to altitudes of 20 km or higher due to the buoyancy from the intense heat of the fire and meteorological conditions that favor the development of deep convection, specifically moisture at mid-levels, which accelerates the upward motion (Peterson et al., 2017; Fromm et al., 2019). Evidence exists that absorption of solar radiation can cause smoke to self-loft even higher (de Laat et al., 2012; Khaykin et al., 2020; Yu et al., 2019). The amount of smoke injected by pyroCb activity into the UTLS is comparable to volcanic levels (Peterson et al., 2018). Recent evidence also suggests that self-lofting caused smoke from Siberian wildfires to enter the UTLS in the summer–autumn of 2019 without the need for pyroconvection (Ohneiser et al., 2021), though this possibility is still under investigation among the community (e.g., Boone et al., 2022). Finally, ammonium nitrate particles can reach the UTLS within the Asian Tropopause Aerosol Layer by way of convection in the Asian monsoon region (Vernier et al., 2018; Höpfner et al., 2019).
The Cloud Aerosol Lidar with Orthogonal Polarization (CALIOP) on board the Cloud-Aerosol Lidar and Infrared Pathfinder Satellite Observation (CALIPSO) platform was launched in April 2006 and is well suited to observing aerosols in the lower stratosphere (Winker et al., 2009; Vernier et al., 2009). Being a vertical-profiling lidar operating at two wavelengths (532 and 1064 nm), CALIOP can measure plume altitudes with high precision; data are reported at vertical resolutions of 60–300 m for stratospheric altitudes (Hunt et al., 2009). Depolarization ratio measurements at 532 nm also provide critical information on particle shape, of which the CALIOP cloud–aerosol discrimination and aerosol subtyping algorithms take full advantage (Kim et al., 2018; Liu et al., 2019). There are two important reasons for CALIOP level 2 algorithms to accurately discriminate between stratospheric aerosol types. First, identifying different aerosol types allows researchers to characterize the abundance of these types and to quantify their disparate radiative, chemical, and dynamical impacts – the scientific motivation. Second, the CALIOP retrieval scheme relies on its aerosol subtyping algorithm to select an appropriate lidar ratio, which is required to accurately retrieve extinction and to correct for overlying attenuation when retrieving optical properties of underlying layers – the algorithmic motivation.
Given these compelling motivations, the CALIPSO project included new stratospheric aerosol subtypes for aerosol layers detected above the tropopause in the 2016 release of the version 4.1 level 2 data products (V4.1). These subtypes included volcanic ash, sulfate/other, smoke, and polar stratospheric aerosol (PSA). Details of the initial stratospheric aerosol subtyping algorithm are given in Kim et al. (2018). In short, the algorithm discriminated between volcanic ash, smoke, and “sulfate/other” based on empirically derived thresholds of the estimated particulate depolarization ratio at 532 nm and the total attenuated backscatter color ratio (the ratio of attenuated backscatters at 1064 and 532 nm). Volcanic ash particles, aspherical in nature, exhibit a higher depolarization signature than sulfate aerosols, which are spherical (Pueschel, 1996), yielding low depolarization ratios (Vernier et al., 2013). Smoke observed in the stratosphere from pyroCb events can also be depolarizing (Haarig et al., 2018; Ohneiser et al., 2020) but to a lesser degree than ash. Layers with low 532 nm integrated attenuated backscatter (i.e., less than 0.001 sr−1) were classified as sulfate/other. These tenuous layers represent the “other” fraction of the combined class. They were combined with sulfates under the assumption that the long residence time of sulfate aerosols would eventually yield low attenuated backscatter returns. Meanwhile, layers classified as aerosol at exceptionally low temperatures over the polar regions during polar stratospheric cloud (PSC) season were classified as PSA.
Since the initial release of the V4.1 level 2 data products, it became clear that some refinements were necessary. One significant example is the poor accuracy of discriminating between volcanic ash and smoke. During the massive Pacific Northwest (PNW) event in August 2017 (Peterson et al., 2018), smoke injected into the lower stratosphere was highly depolarizing (Haarig et al., 2018), exceeding the depolarization threshold used by the V4.1 algorithm to separate smoke and ash. As a consequence, over 58 % of the aerosol layers detected from this event were misclassified as volcanic ash. An example CALIOP observation of one of the earliest smoke plumes detected from the event (Torres et al., 2020) is shown in Fig. 1, illustrating the dominance of ash misclassification.
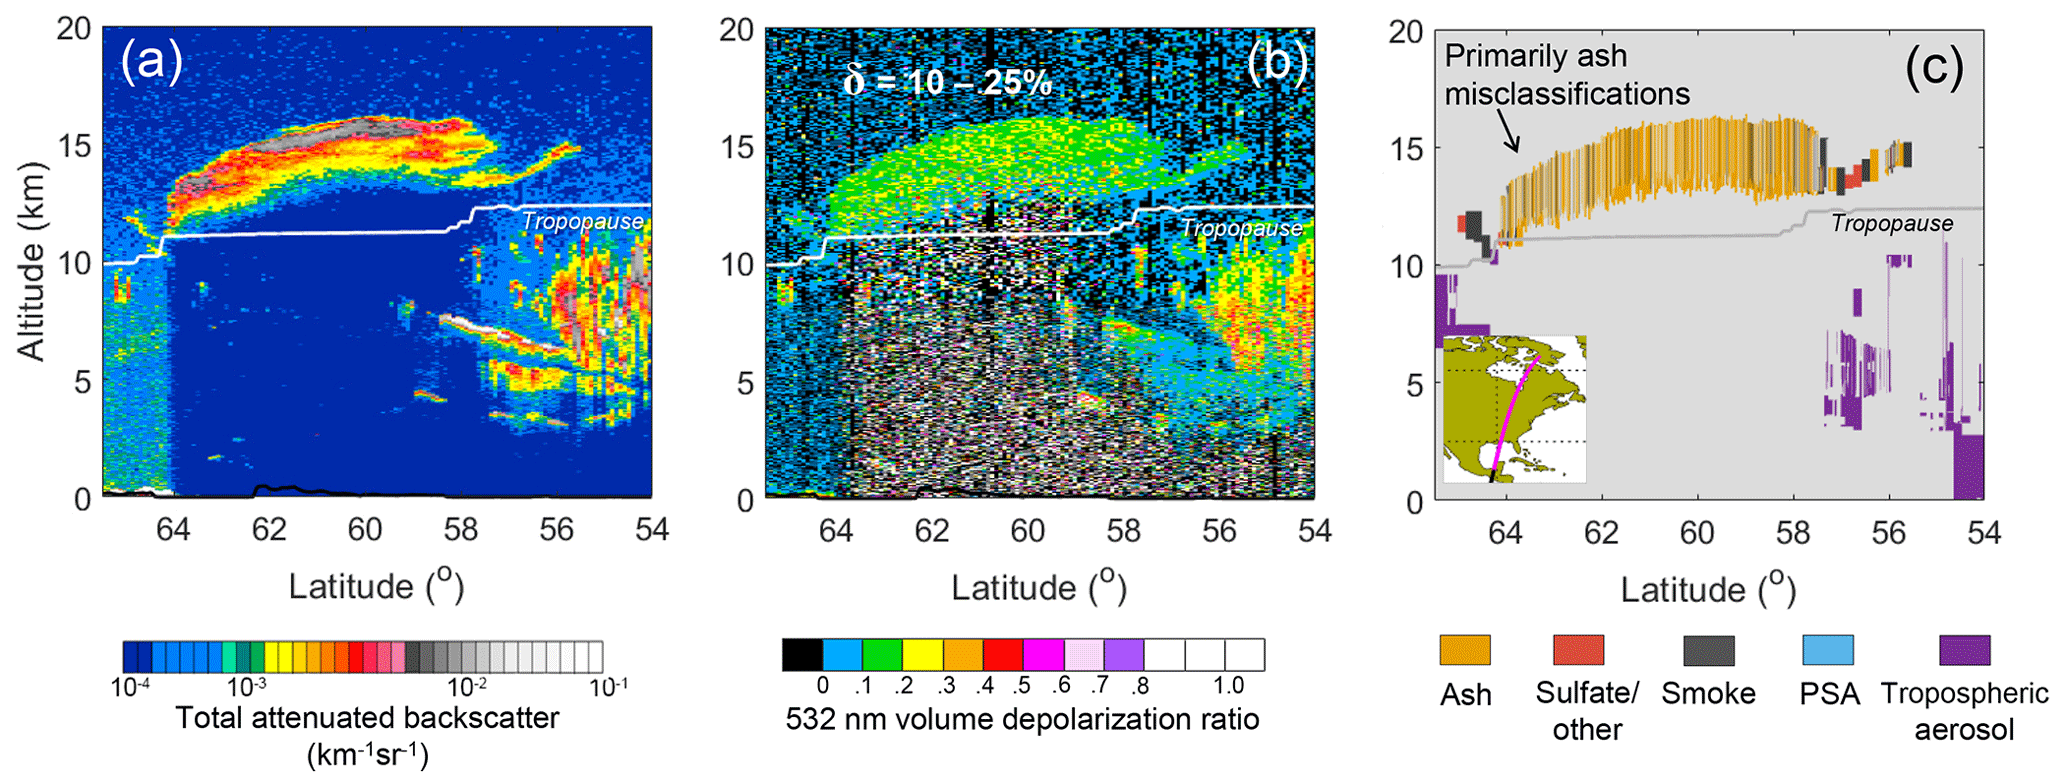
Figure 1PyroCb smoke plume from the PNW event on 18 August 2017 at ∼07:45 UTC over Quebec Province, Canada: (a) 532 nm total attenuated backscatter, (b) 532 nm volume depolarization ratio, and (c) V4.1 aerosol subtype classification from the level 2 vertical feature mask. Inset map shows the CALIOP ground track.
Another area needing refinement was the sulfate/other class. This subtype is ambiguous for practical applications because it is shared by layers that could legitimately be sulfate and weakly scattering layers that could be any aerosol type. In addition, the 532 nm integrated attenuated backscatter ( threshold used to identify these weakly scattering layers was too high for the features commonly detected in the stratosphere by CALIOP. Some 75 % of all stratospheric aerosol layers detected in V4.1 were classified as sulfate/other due to this threshold. For example, Fig. 2 shows several plumes from the June 2011 Puyehue-Cordón Caulle eruption where the layer depolarization ratios are elevated, indicating the presence of ash. However, some portions are classified as sulfate/other because their integrated attenuated backscatter falls below the threshold. A more reasonable classification for these layers would be ash.
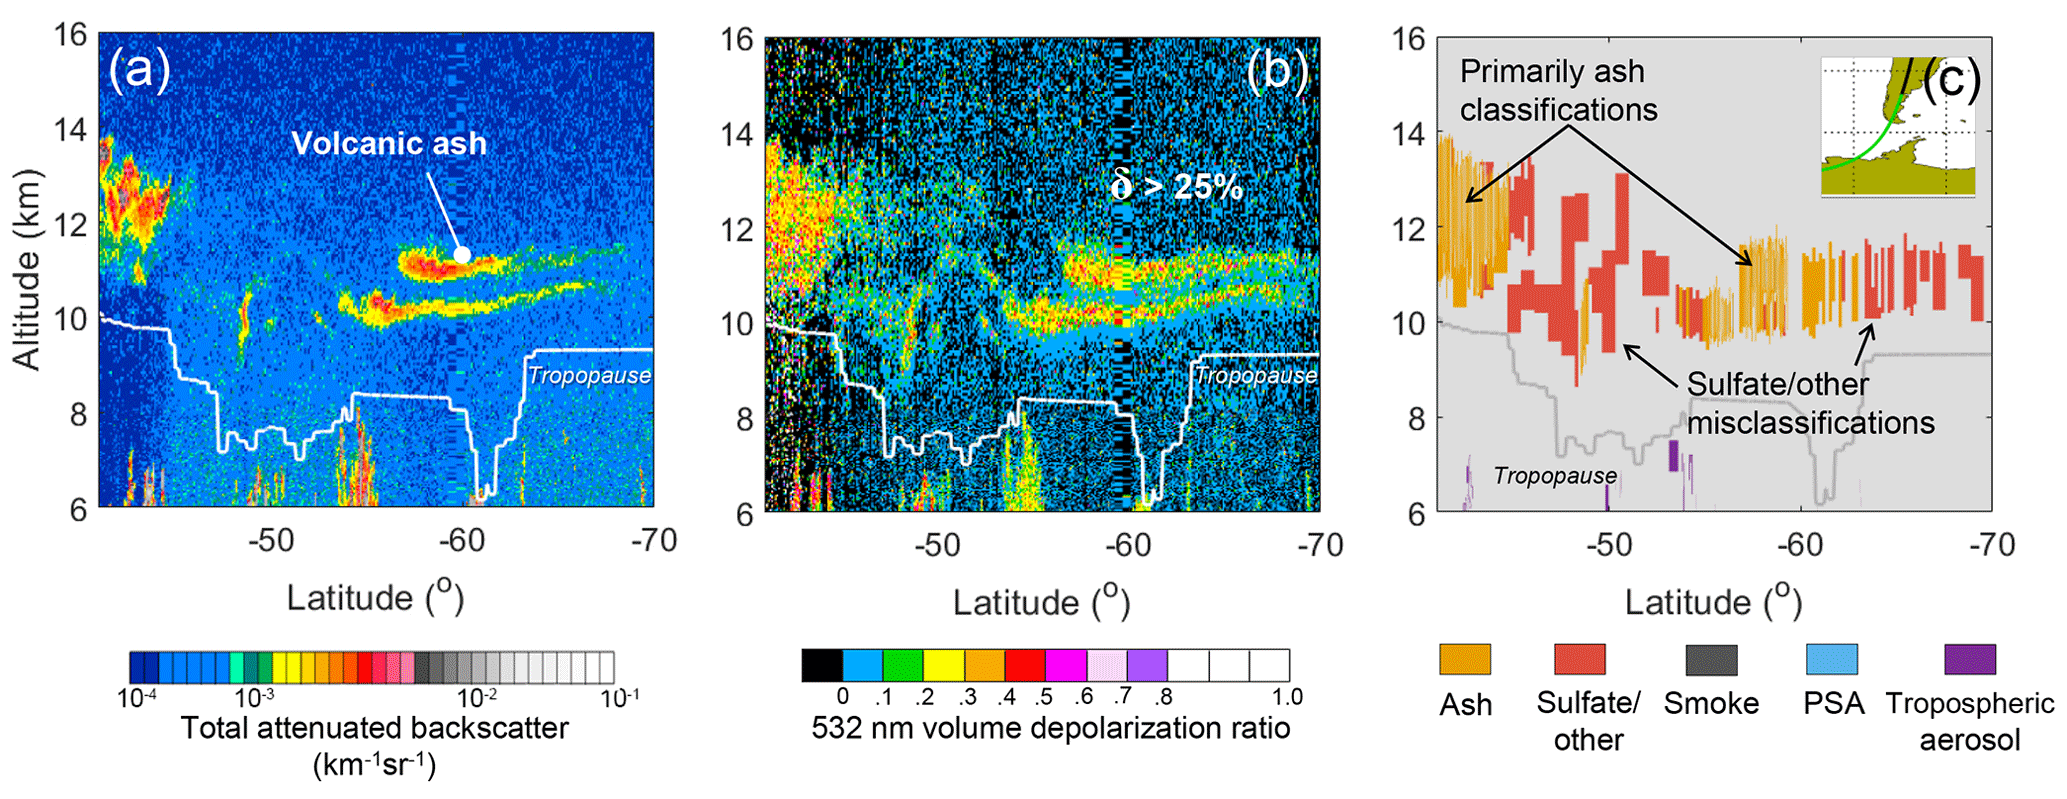
Figure 2Volcanic ash plume from the June 2011 Puyehue-Cordón Caulle eruption observed on 16 June 2011 at ∼05:45 UTC, southwest of Argentina: (a) 532 nm total attenuated backscatter, (b) 532 nm volume depolarization ratio, and (c) V4.1 aerosol subtype classification from the level 2 vertical feature mask. Inset map shows the CALIOP ground track.
Finally, studies have shown that the most common lidar ratio for volcanic ash may be larger than the default lidar ratio used for the ash subtype in V4.1 (e.g., Prata et al., 2017). Based on these observations, the stratospheric aerosol subtyping algorithm and lidar ratio assignments have been updated for the V4.5 level 2 data release.
The organization of this paper is as follows. First, we describe the data sets used for our analysis in Sect. 2. Next, we review the V4.1/V4.2 stratospheric aerosol subtyping algorithm in Sect. 3, and then in Sect. 4, we describe the changes implemented to the algorithm for V4.5. We provide a statistical summary of layer classifications between the versions in Sect. 4.6 to demonstrate the improvements of the revised algorithm. Section 5 is a performance assessment for select events dominated by volcanic ash, sulfate, and smoke to explore the classification fidelity. Concluding remarks are given in Sect. 6.
The data used for our analysis are from CALIOP on board CALIPSO, which has been operating since June 2006. CALIOP is an elastic backscatter lidar measuring vertical profiles of attenuated backscatter at 532 and 1064 nm, with depolarization capability at 532 nm (Hunt et al., 2009; Winker et al., 2009). Level 2 retrievals detect features using a threshold-based algorithm after averaging the lidar backscatter signal to multiple horizontal resolutions (Vaughan et al., 2009). The horizontal averaging resolutions for layer detection are , 1, 5, 20, and 80 km. Following detection, the cloud–aerosol discrimination (CAD) algorithm classifies each layer as either cloud or aerosol based on the layer geolocation and measured optical properties (Liu et al., 2019). Layers classified as aerosol are further classified as either tropospheric aerosol or stratospheric aerosol, depending on their altitudes with respect to the tropopause, which is obtained from the Modern-Era Retrospective analysis for Research Applications, version 2 (MERRA-2) meteorological reanalysis product (Gelaro et al., 2017). Specifically, aerosol layers that have a 532 nm attenuated backscatter centroid below the tropopause are identified as one of seven different tropospheric aerosol subtypes: clean marine, dust, polluted continental/smoke, clean continental, polluted dust, elevated smoke, or dusty marine (Kim et al., 2018). Aerosol layers that have a centroid above the tropopause are assigned to one of the stratospheric aerosol subtypes that are the subject of this paper.
CALIOP level 2 retrievals are reported in a variety of data products. The stratospheric aerosol subtyping algorithm is derived from layer properties reported in the level 2 aerosol layer product, and it is this same product that we primarily use to evaluate the performance of the algorithm. The level 2 vertical feature mask, level 2 aerosol profile, and level 1B products are also used for demonstrating individual case studies.
To characterize the performance of the previous V4.1 stratospheric aerosol subtyping algorithm, we use the V4.2 level 2 data products. The V4.1 level 2 data products were replaced with V4.2 in 2018 to add a new science data set (SDS) reporting the minimum laser energy in each 80 km horizontal segment (the fundamental level 2 processing interval). This new SDS was added to assist in quality-screening data affected by low laser energy shots which began occurring primarily over the South Atlantic Anomaly (SAA) region in mid-2016 (CALIPSO Data Advisory Page, 2018). To reliably exclude affected level 2 retrievals in our analysis of V4.1 and V4.5 data, we use this SDS to impose the requirement that all laser pulses have at least 60 mJ within any 80 km horizontal segment. Note that beyond adding the new SDS, there is no difference between V4.1 and V4.2 in these level 2 products. In particular, the stratospheric aerosol subtyping algorithm is identical in both data releases. Because V4.1 level 2 data are no longer publicly distributed, for the remainder of the paper we will refer only to V4.2.
To assess the performance of the revised algorithm, we use a pre-release test version of the V4.5 level 2 products. This test version accurately reflects the behavior of stratospheric aerosol subtyping in the official V4.5 level 2 release, planned for early 2023. Updates to the V4.5 level 2 algorithms – beyond those described in this paper – are primarily related to tropospheric feature classification, boundary layer cloud clearing, and optical depth retrievals that are fully independent of aerosol subtyping (Tackett et al., 2021, 2022; Ryan et al., 2022). These updates have no impact on our analysis of stratospheric aerosol detections. The V4.51 level 1B data used as input for the V4.5 level 2 products also contain several updates relative to the previous release, described in the CALIPSO Lidar Level 1 V4.51 Data Quality Statement (2022). Specifically, the 532 nm daytime and 1064 nm calibration algorithms now mitigate the influence of low-energy laser shots on the derived calibration coefficients. This corrects biases and reduces calibration uncertainty in these channels at SAA latitudes (∼ 15 to 30∘ S) since the onset of low-energy shots in mid-2016. Small corrections have also been made to the 1064 nm baseline shape (the shape of the profile measured by the detectors when the laser is not firing); these have negligible impacts on the current analysis. Lastly, adjustments have been made to the polarization gain ratios to properly account for day and night differences rather than using the same value regardless of lighting conditions. The primary impact of these adjustments is to increase nighttime depolarization ratios by ∼ 4 % and to decrease daytime depolarization ratios by ∼ 1 %.
As a final note, we emphasize that the “layers” discussed throughout this paper are those detected by CALIOP at 5, 20, and 80 km resolutions. Each layer is only counted once regardless of horizontal extent because our intention is to characterize the classification frequencies for the unique layers that are input to the subtyping algorithm. As such, the true geospatial extent of aerosols from each event is not explicitly represented.
The V4.2 stratospheric aerosol subtyping algorithm, documented by Kim et al. (2018), evaluates several CALIOP measurables to identify four subtypes: volcanic ash, sulfate/other, smoke, and polar stratospheric aerosol (PSA). The method for discriminating between volcanic ash, sulfate, and smoke is based on an empirical analysis of joint distributions of the estimated particulate depolarization ratio and features the integrated attenuated backscatter color ratio derived from the level 2 aerosol layer product for manually classified aerosol layers from specific events where the dominant aerosol type is well documented in the literature. Whereas manual classification is far more error-prone in the troposphere, where multiple aerosol types often coexist, stratospheric aerosol events such as volcanic eruptions and large pyroCb injections tend to be episodic, and their compositions are characterized by various independent methods. The events selected for the joint distributions are the only significant contributors to stratospheric aerosol loading at the time they are sampled, typically during the first 30 d after event initiation. Plumes are tracked manually in CALIOP imagery over successive days and their latitude–longitude–altitude boundaries are recorded for each CALIOP granule. The “plume boundaries” we select are rectangles of altitude × along-track distance that encompass the plume, plus a ∼ 1 km buffer of “clear air” where no other features are detected. In order to avoid cloud contamination, plumes near or in contact with high-altitude cirrus or overshooting cloud tops are excluded. All layers detected in the level 2 aerosol layer product within the rectangular plume boundaries contribute to the joint distributions. The full list of CALIOP granules and plume boundaries for all events analyzed for V4.2 and V4.5 development is reported in the Supplement.
The first dimension of the joint distribution relies on the depolarization sensitivity of CALIOP. An elevated depolarization ratio is an excellent discriminator for identifying non-spherical particles such as volcanic ash, dust, and cirrus relative to spherical particles such as sulfate aerosols. Volume depolarization ratio (δv) is calculated from the ratio of CALIOP measurements of attenuated backscatter, , measured perpendicular and parallel to the plane of the emitted pulse, which was originally linearly polarized:
Attenuated backscatter is comprised of molecular and particulate backscatter (βm and βp) and two-way transmittances due to molecular, ozone, and particulate extinction (, , and .
Because δv contains contributions from both molecular and particulate backscattering, it can under-represent the particulate depolarization of weakly scattering features. In order to correct for the molecular contribution, CALIOP aerosol subtyping uses an estimated particulate depolarization ratio ( according to Eq. (2) (Omar et al., 2009). Here, the mean attenuated scattering ratio (Kar et al., 2018) is defined as , where the angle brackets indicate averaging over the vertical extent of a layer. The molecular attenuated backscatter, , is computed from the MERRA-2 model, and the molecular depolarization ratio, δm, is 0.00366 at 532 nm (Hostetler et al., 2006).
This is an estimate of the true particulate ratio δp because Eq. (2) uses the R′ term that still contains the two-way particulate transmittance within the layer: , where . The true δp can be calculated from Eq. (2) if R is used rather than R′ (e.g., Cairo et al., 1999). However, the value of cannot be retrieved at the point in CALIOP data processing where layer classification occurs because retrieving requires a lidar ratio which is assigned only after layer classification is complete. Therefore, as shown in Fig. 3a, will overestimate δp primarily for strongly attenuating layers with high depolarization. The overestimate is particularly acute for layers with low scattering ratios.
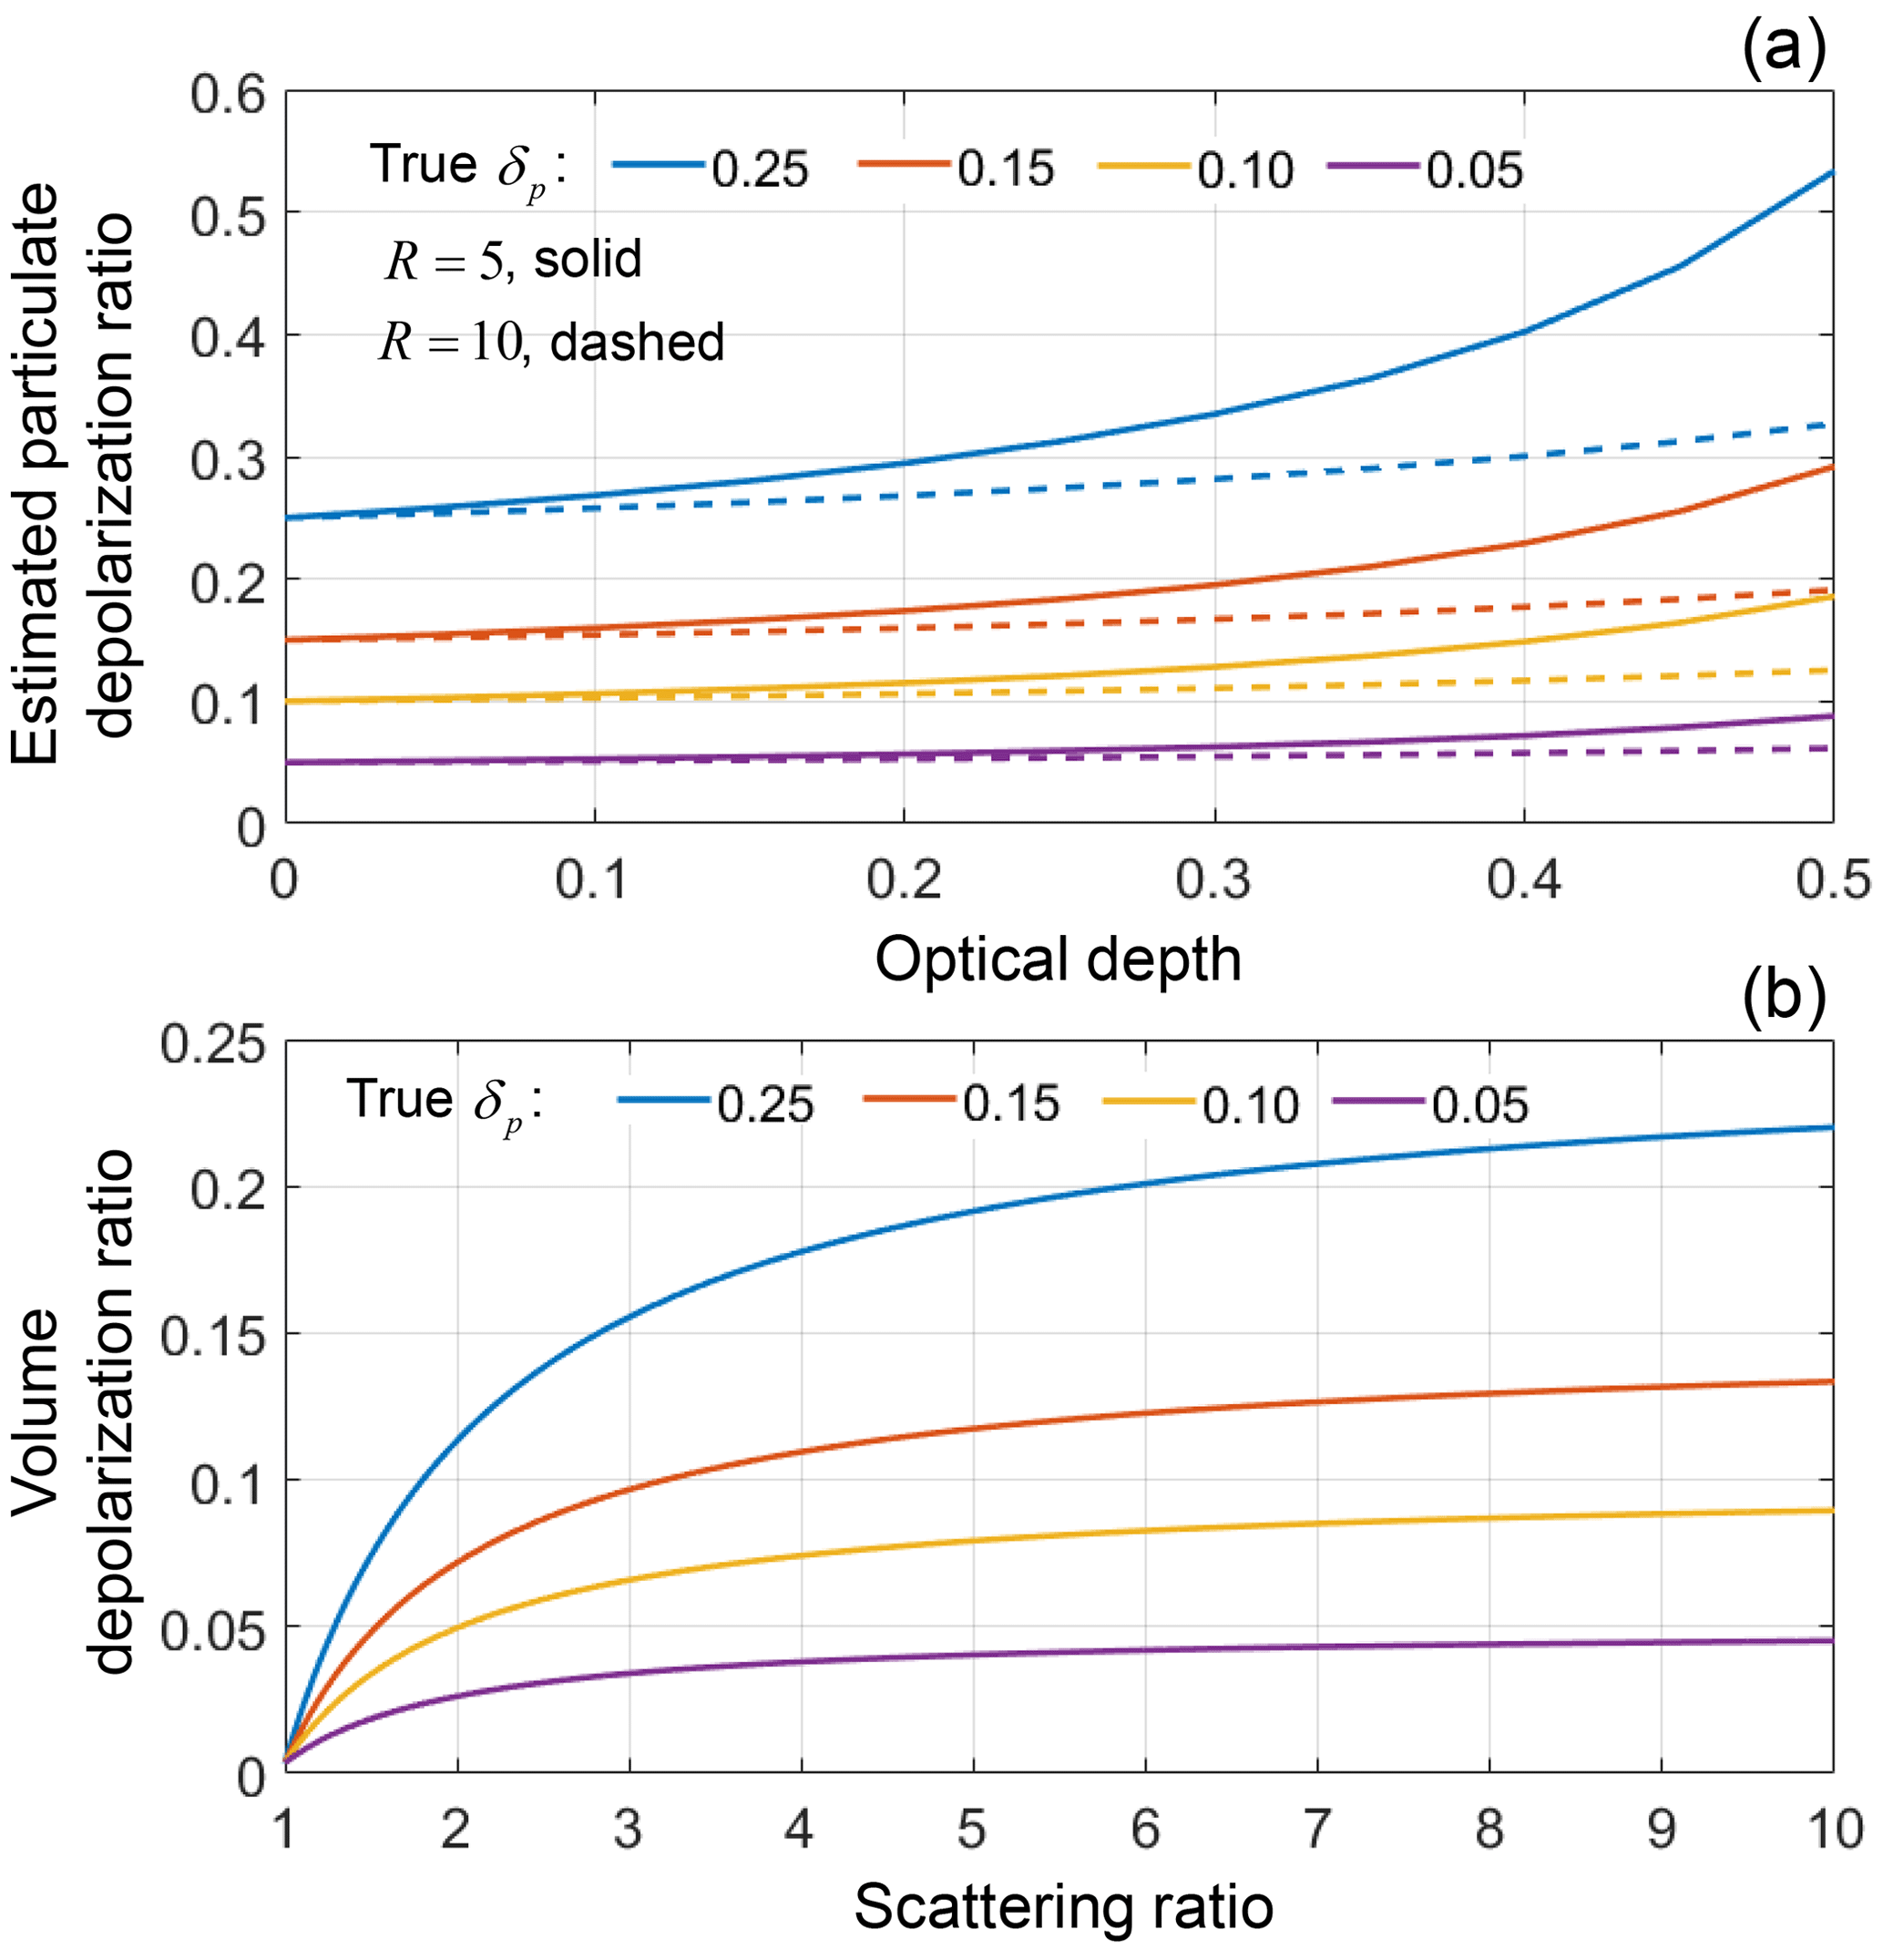
Figure 3(a) Estimated particulate depolarization ratio as a function of optical depth for four values of the true particulate depolarization ratio in layers with unattenuated scattering ratios of 5 (solid lines) and 10 (dashed lines). (b) Volume depolarization ratio as a function of scattering ratio for four values of true particulate depolarization ratio.
The primary benefit of using instead of δv for aerosol classification is demonstrated by Fig. 3b. At low scattering ratios, the molecular contribution dominates δv, causing large underestimates of the true δp, particularly for strongly depolarizing layers. A sizable fraction of depolarizing aerosol layers is susceptible to underestimation in the CALIOP data record. For example, 50 % of stratospheric volcanic ash layers considered in this paper have at night, which would yield underestimates of >50 % in δp, leading to difficulty in differentiating between aerosols with lower and higher depolarizations. The compromise of using instead of δv is that additional systematic and random errors are propagated into (primarily random errors in R′), which can cause errors in aerosol subtyping for weakly scattering layers. Despite this, the CALIOP level 2 algorithms use for aerosol subtyping to overcome the known underestimate that would arise from the molecular contribution to Eq. (1).
The second dimension of the joint distribution is feature-integrated attenuated backscatter color ratio, χ′, which can give qualitative information about particle size. This quantity is the ratio of the feature-integrated attenuated backscatters (, computed separately at both lidar wavelengths between layer top and base; it is derived as follows:
This formulation corrects the attenuated backscatter coefficients for molecular and ozone attenuation and applies an approximate correction for molecular scattering (Vaughan et al., 2005), which is important for low optical-depth layers typically found in the stratosphere. Molecular and ozone two-way transmittances and are obtained from the MERRA-2 model.
The joint distributions used for the V4.2 release are shown in Fig. 4, and the contributing events are documented in Table 1. Note that only a subset of the events in Table 1 contributed to the V4.2 analysis; more events were added for V4.5 (discussed in Sect. 4). The contributions for volcanic ash and sulfate in V4.2 were dominated by the June 2011 Puyehue-Cordón Caulle eruption and the August 2008 Kasatochi eruption, respectively. Very few stratospheric smoke events had been observed when these distributions were first constructed in 2015 during development for the V4.2 release. The primary contributor was the February 2009 “Black Saturday” bushfires in Australia, where smoke reached altitudes of 19 km in the southern mid-latitudes (Siddaway and Petelina, 2011). In order to more fully sample and χ′ for smoke, several high-altitude, yet not stratospheric, smoke events were included in the joint distributions. From this, two populations emerged: smoke with low depolarization in the troposphere and with higher depolarization in the stratosphere (Fig. 4). As we shall discuss later, enhanced depolarization is a common feature of smoke reaching the stratosphere associated with pyroCb activity, though we did not fully appreciate this fact during the V4.2 development.
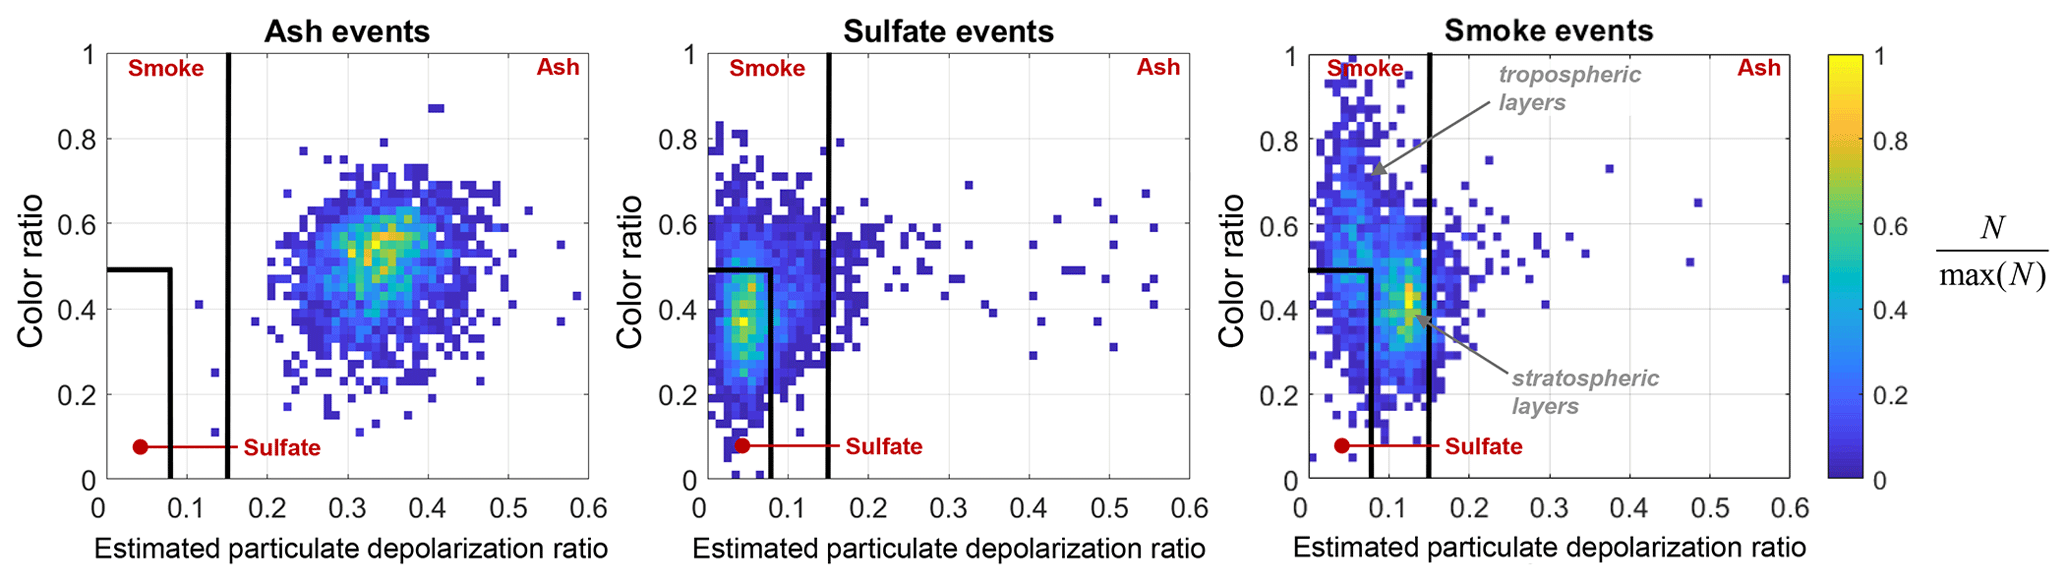
Figure 4Joint distributions used in V4.2 development: estimated particulate depolarization ratio ( and feature-integrated attenuated backscatter color ratio (χ′) for manually classified layers during events dominated by the aerosol type indicated in the title. Only layers with sr−1 contribute. Histograms of layer numbers (N) are min–max normalized. Black lines indicate discrimination thresholds in V4.2, and red text indicates the algorithm classification.
Table 1Manually classified events used to establish thresholds to discriminate between volcanic ash, volcanic sulfate, and smoke in V4.5. The number of unique stratospheric aerosol layers detected in V4.5 is given along with the fraction of these layers in night granules and the dominant aerosol type. Only layers with sr−1 contribute. The individual CALIOP granule names and the latitude–longitude–altitude information for these layers are given in the Supplement.
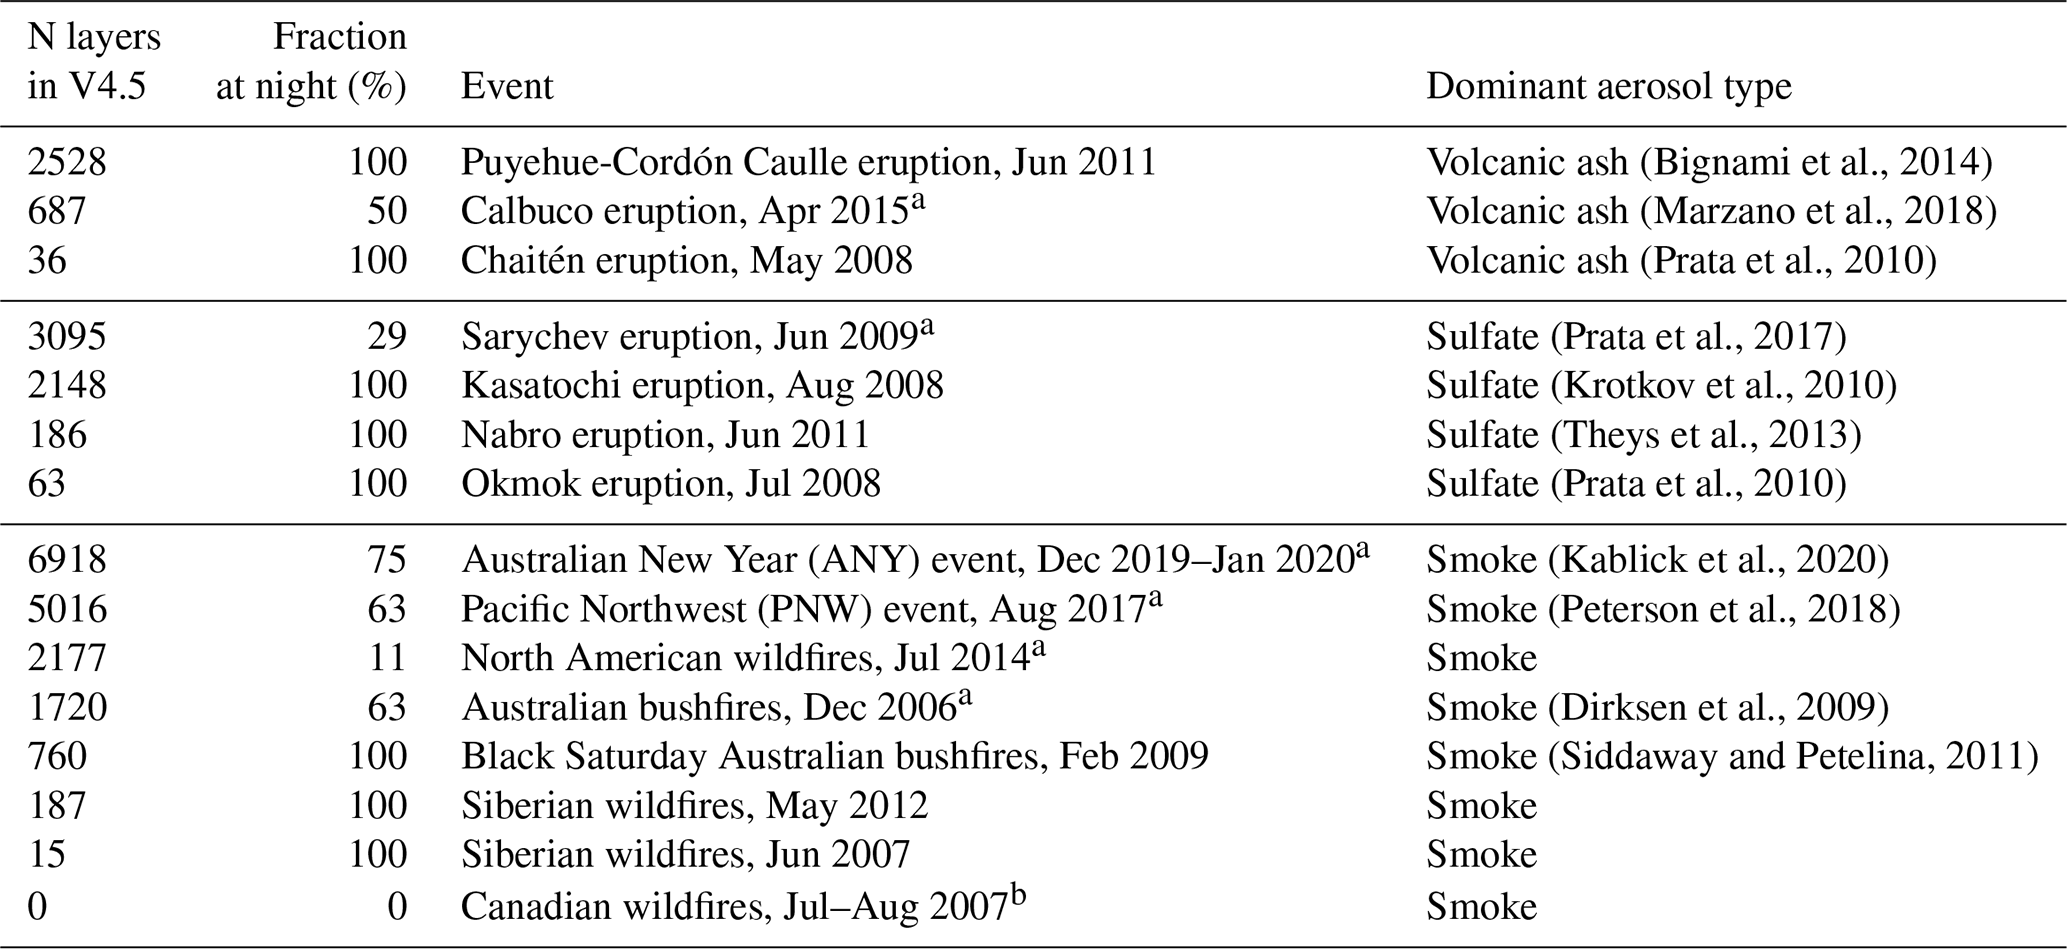
a New events added since the V4.2 development of the stratospheric aerosol typing algorithm described in Kim et al. (2018). b Event is exclusively comprised of tropospheric layers used in V4.2 development but not in V4.5.
Using the joint distributions in Fig. 4, thresholds were established for ash, sulfate, and smoke that minimized their overlap in measurement space. The flowchart in Fig. 5 shows how these thresholds are used in the V4.2 release. Stratospheric aerosol layers that have are classified as ash. Separate branches exist to capture smoke with low depolarization () and with high depolarization (), depending on the layer color ratio. Sulfate is identified for layers that have low and low χ′.
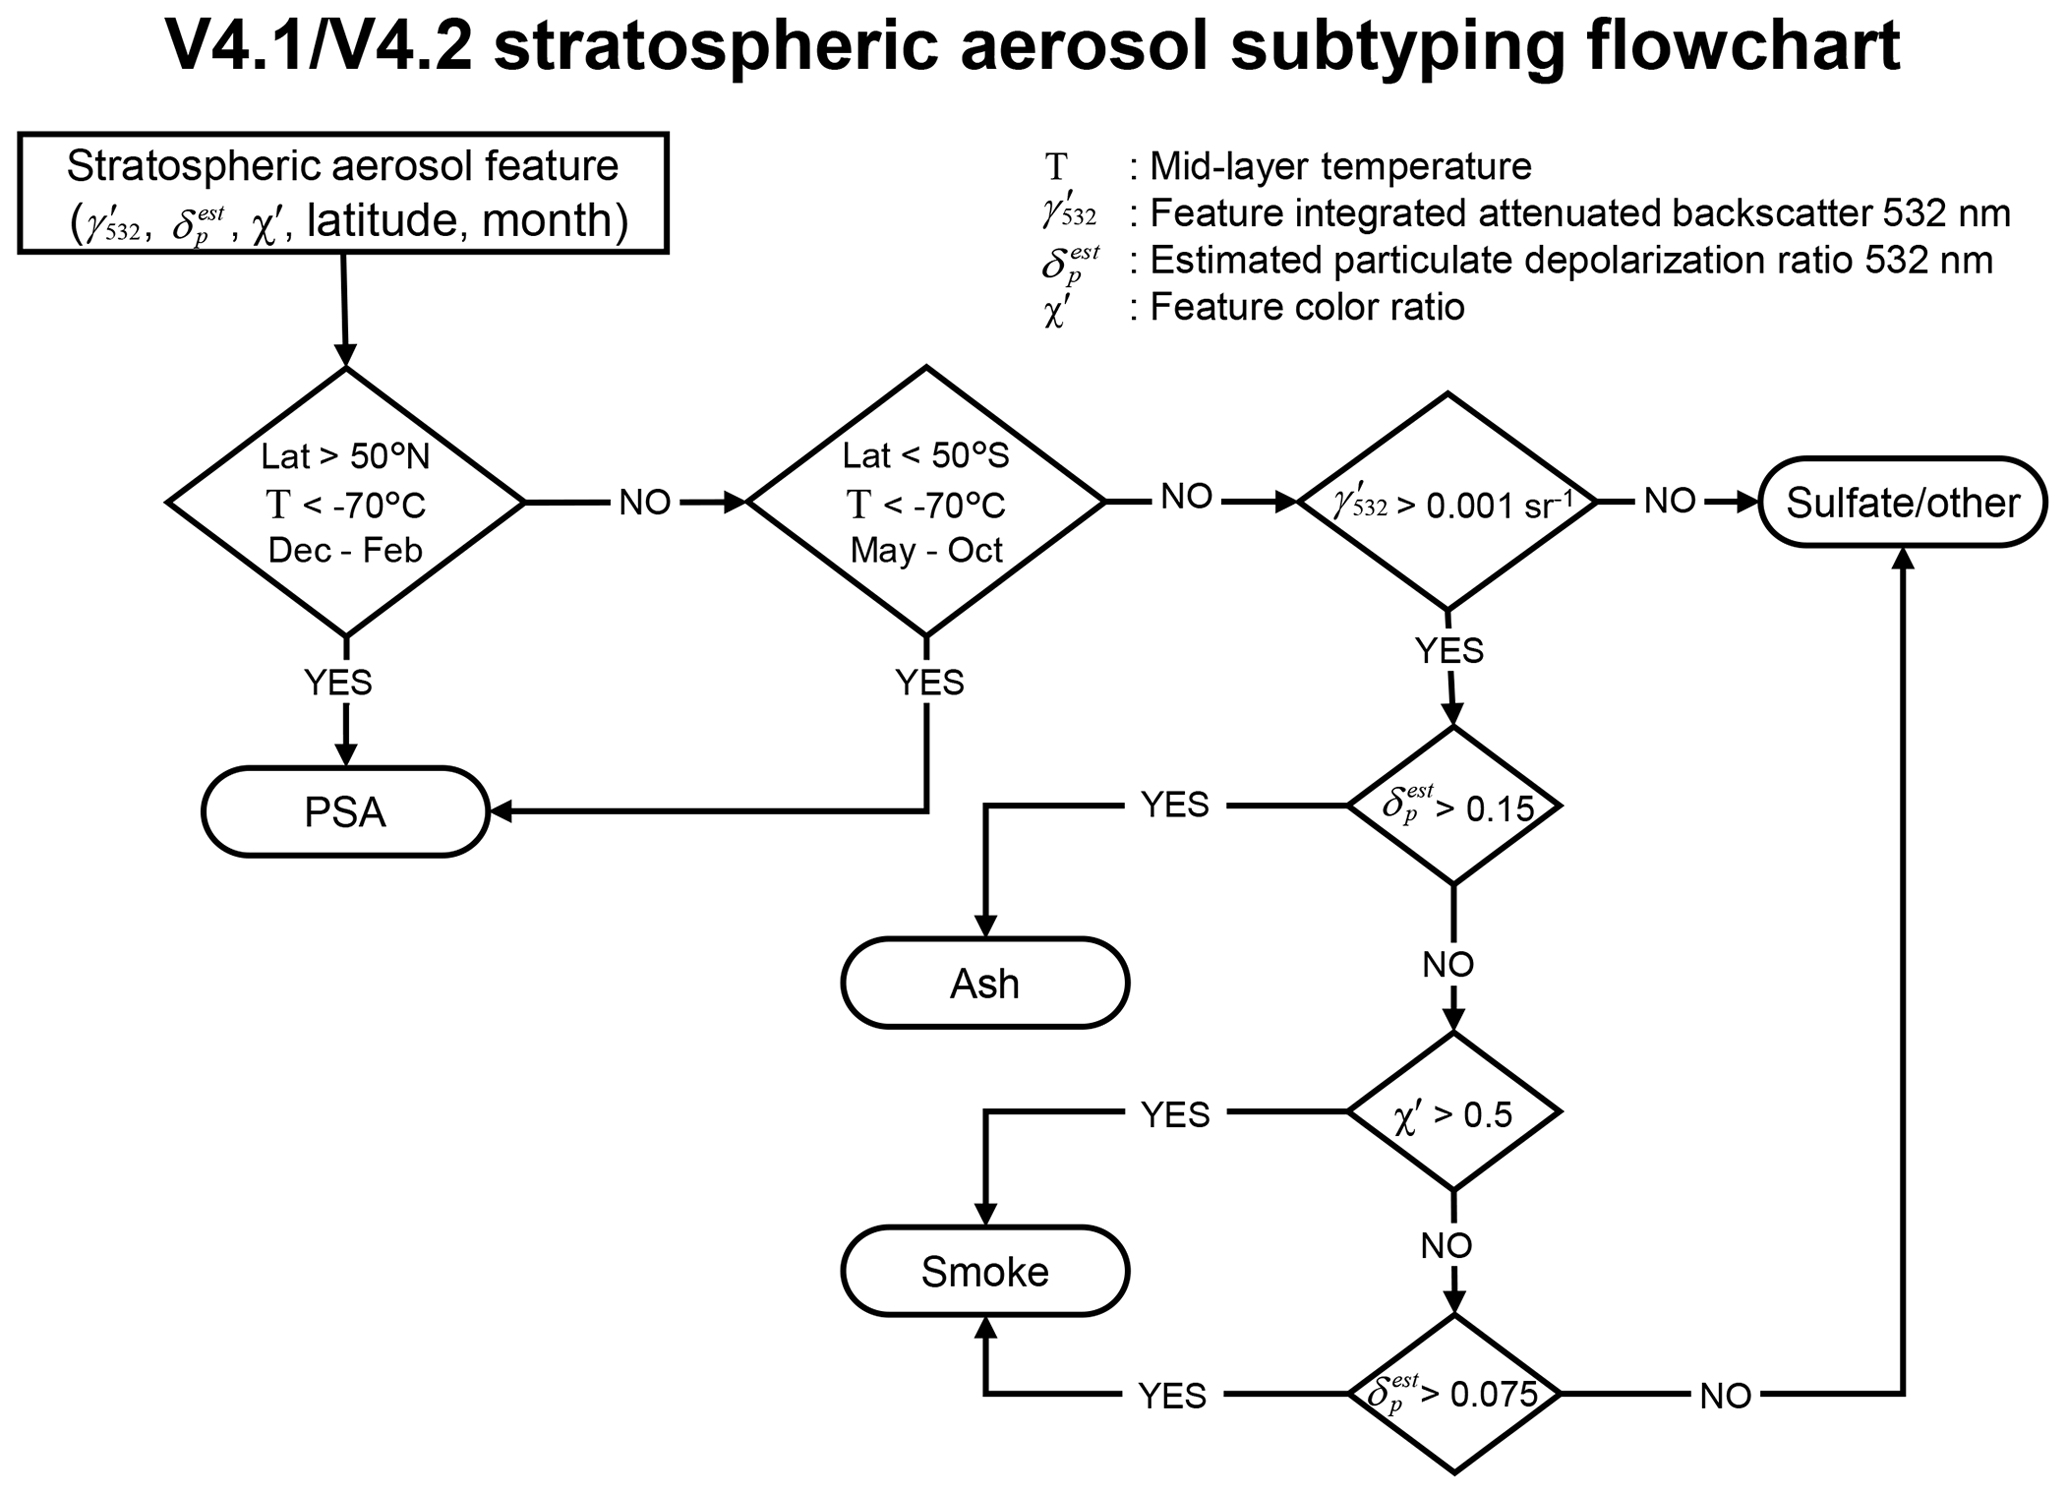
Note that the name given to the V4.2 subtype containing sulfate is “sulfate/other”. The “other” contributions to this subtype are layers that have low integrated attenuated backscatter. The ability to accurately discriminate between aerosol types using depolarization and color ratio requires measurements that have sufficient backscatter magnitudes. This is especially relevant in the stratosphere where exceptionally low optical depths are common. Therefore, a test was placed prior to the determination of ash, sulfate, or smoke in the V4.2 flowchart (Fig. 5) to weed out weakly scattering features using the feature-integrated attenuated backscatter at 532 nm ( defined by Eq. (5).
In the V4.2 data release, all stratospheric aerosol layers that have sr−1 (hereafter named “low-γ′ layers”) that were not previously classified as PSA are assigned to the sulfate/other subtype. The rationale for combining sulfate and low-γ′ layers was because we assumed that volcanic sulfate would eventually become weakly scattering over time, since this aerosol type tends to persist in the stratosphere for weeks to months after injection, all the while becoming increasingly diffuse and hence decreasing in optical depth.
The fourth subtype assigned by the stratospheric aerosol subtyping algorithm is for polar stratospheric aerosol. The PSA type is meant to assign a reasonable classification for aerosol layers identified in regions where PSC formation is likely. The method to identify PSA is identical for both the V4.2 and V4.5 releases, so it is only briefly summarized here. PSA layers are identified first by evaluating the layer midpoint temperature for stratospheric aerosol layers during polar-winter PSC seasons. Based on the climatology of Poole and Pitts (1994), PSC season is assumed to be December to February for the Arctic and May to October for the Antarctic. A latitude threshold of 50∘ confines PSA classifications to the appropriate pole and encompasses the expected range of PSC and PSA formation. Temperature information is provided by the MERRA-2 model. The −70 ∘C layer midpoint temperature maximum is based on the midpoint temperatures of stratospheric aerosol layers detected by CALIOP in these regions and seasons (see Fig. 5 of Kim et al., 2018). It also agrees with the observed temperatures for PSC formation of Rosen et al. (1997).
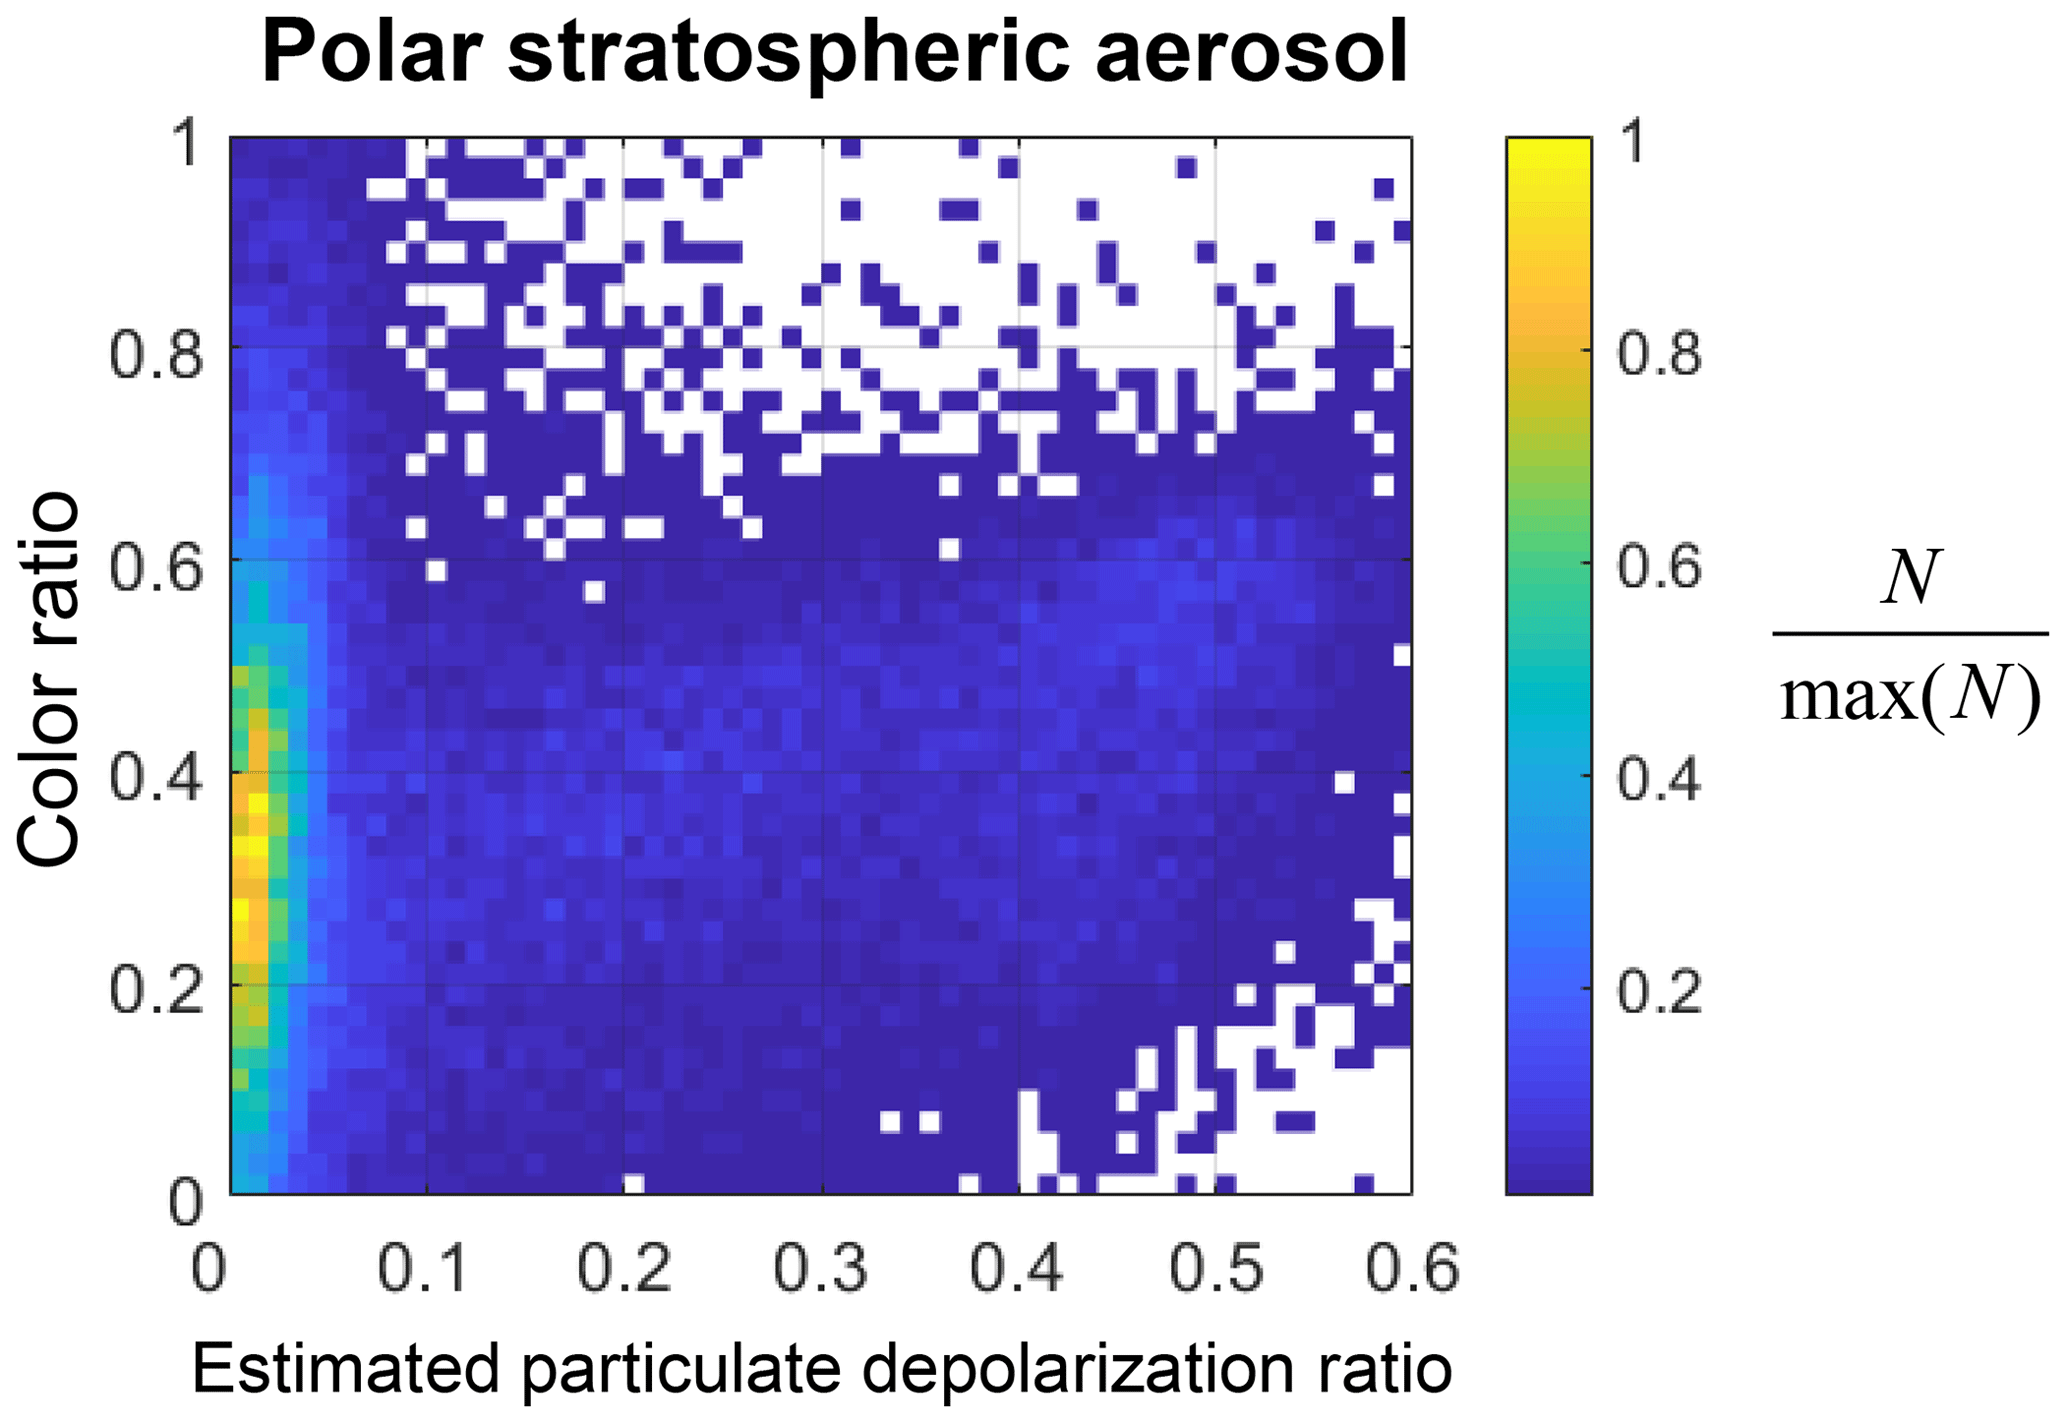
Figure 6Same joint distributions as Fig. 4 but for layers classified as PSA in the Southern Hemisphere in 2013, based on V4.5 data.
The classification of PSA is the first decision in the stratospheric aerosol typing flowchart in Fig. 5. This step confines the PSA classification to only those geographical regions and seasons where they are expected to exist. These layers are often detected adjacent to features classified as cloud and have depolarization levels that overlap with the expected ranges for sulfate, smoke, and ash (Fig. 6). It is quite possible that some fraction of these are CAD misclassifications along the fringes of clouds rather than legitimate aerosols (Liu et al., 2019). The PSA classification prevents these layers from being misclassified as volcanic ash or sulfate when none exists. The flip side of this is that when true volcanic aerosol enters these regions during PSC season, it may not be classified correctly. An example is considered in Sect. 5.1. The confidence in the PSA classification is considered to be low at this time, and its accuracy is not evaluated further in this paper. Users investigating PSC observations by CALIOP are instead referred to the level 2 polar stratospheric cloud mask product which is specialized for this purpose (NASA/LARC/SD/ASDC, 2016a; Pitts et al., 2018).
We now turn our attention to the changes made to the stratospheric aerosol subtyping algorithm for the V4.5 release and how they improve the shortcomings in the previous V4.2 release.
In Sect. 1, we highlighted the need to improve several aspects of the stratospheric aerosol subtyping algorithm. The goals of the revisions implemented in V4.5 are therefore to
-
improve discrimination between volcanic ash and smoke in the stratosphere,
-
remove the ambiguity in the sulfate/other subtype,
-
reduce the number of layers classified as low-γ′,
-
update the volcanic ash lidar ratio.
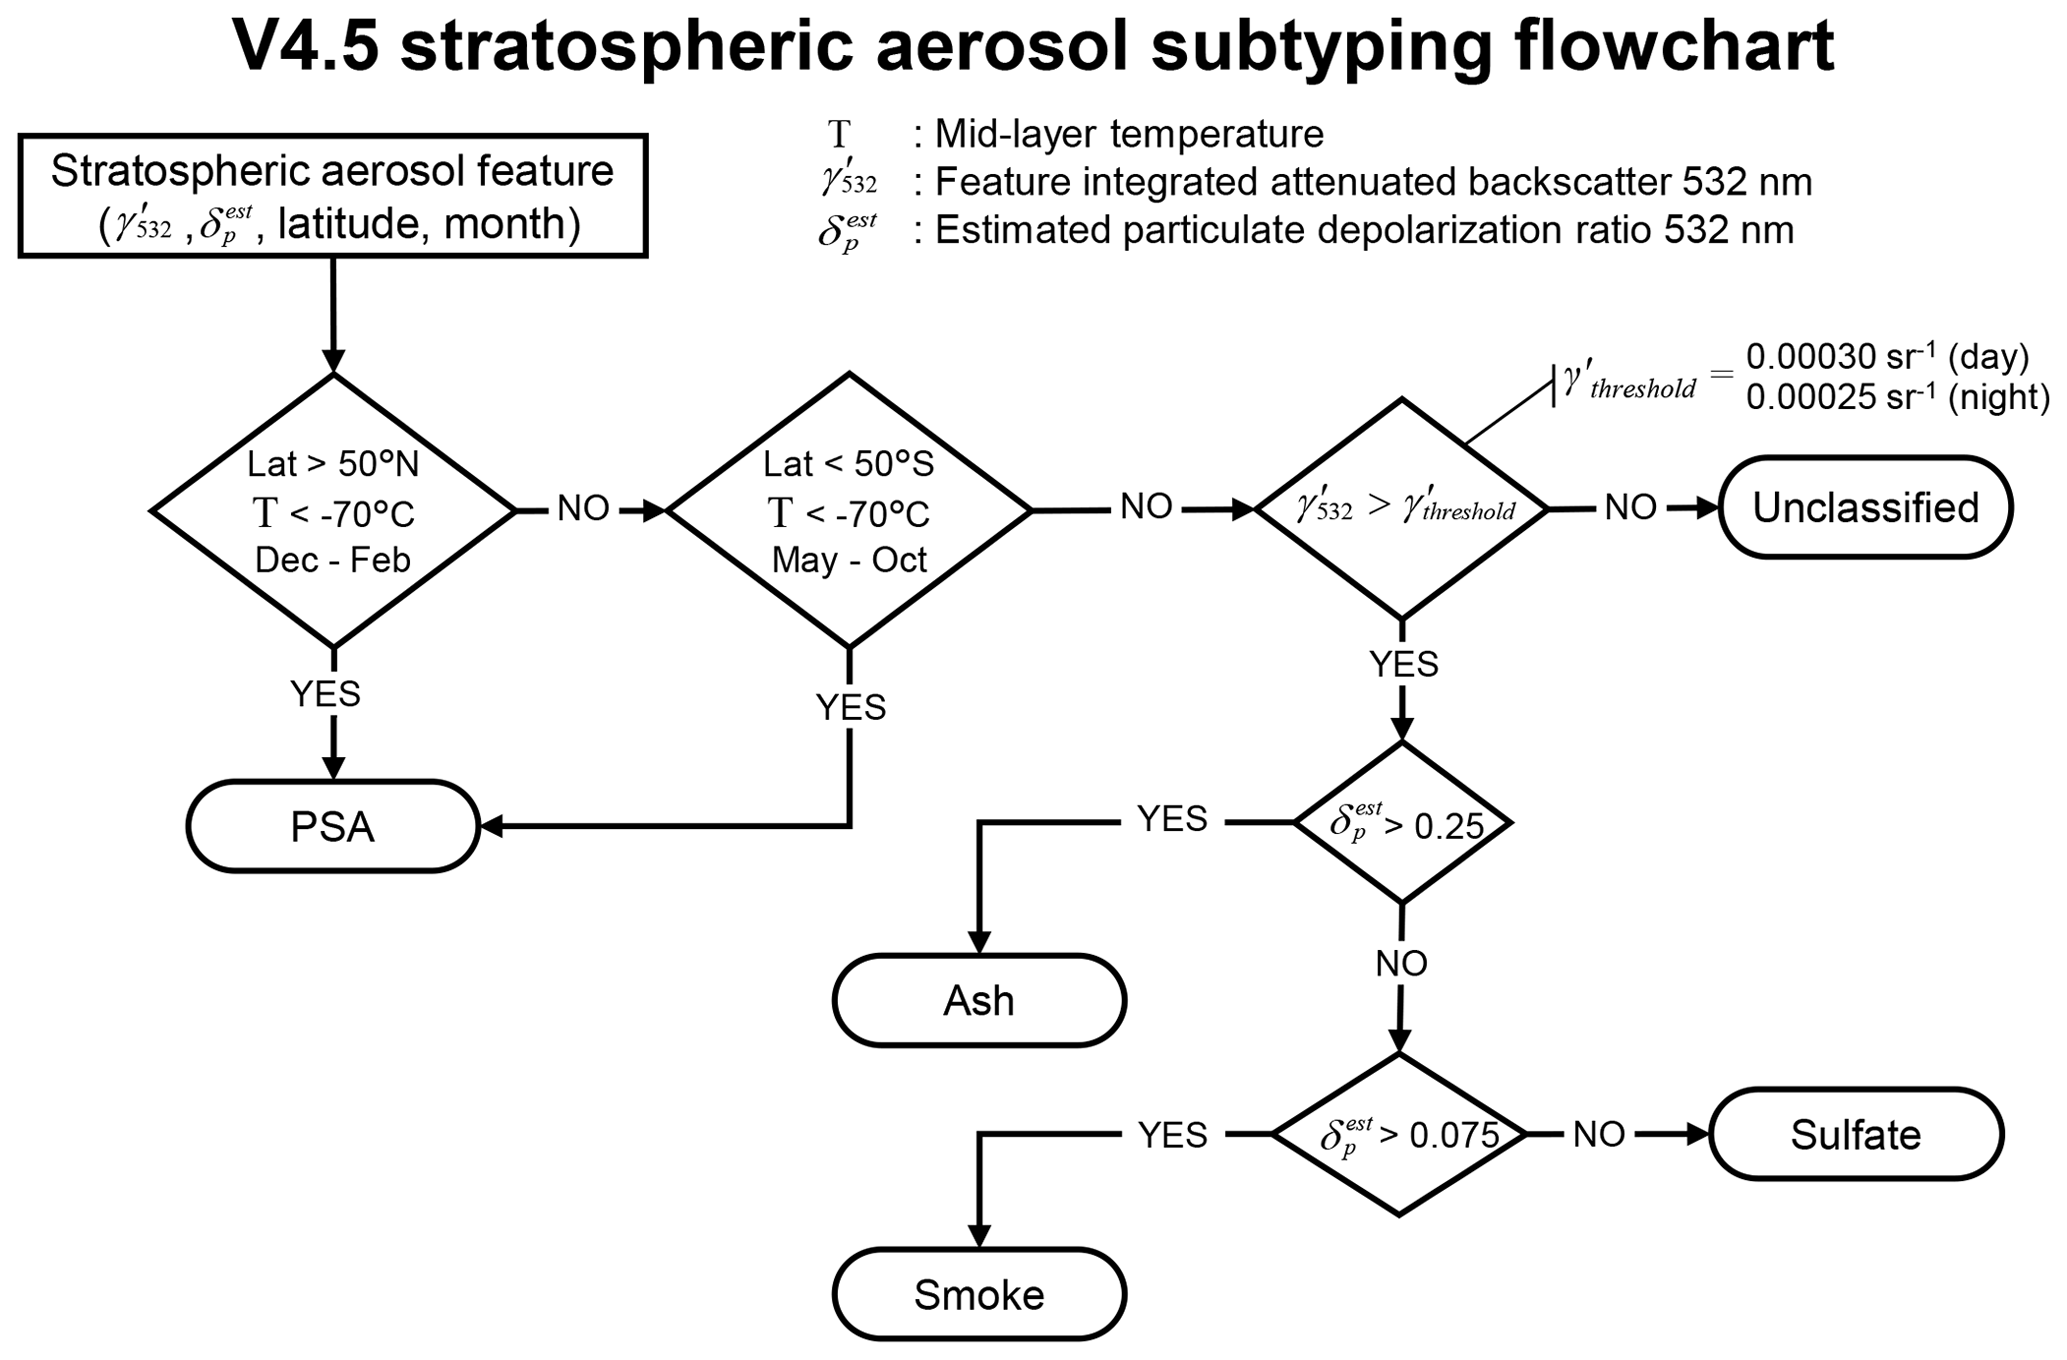
In order to accomplish this, two structural changes were made to the algorithm, and two thresholds were adjusted. The new flowchart for V4.5 is shown in Fig. 7. As in the previous release, discrimination between volcanic ash, sulfate, and smoke is determined by an empirical analysis of the joint distributions of depolarization and color ratios from events where the aerosol type is known. The joint distributions used for the V4.5 analysis are shown in Fig. 8. More events have been added since the V4.2 analysis so that we can better characterize the depolarization and color ratio for these types (see the footnotes in Table 1). The new events include two volcanic eruptions: sulfate layers from the July 2009 Sarychev Peak eruption and ash layers from the April 2015 Mount Calbuco eruption. The plume of volcanic aerosols from Sarychev Peak primarily consisted of sulfate based on Atmospheric Infrared Sounder (AIRS) retrievals and in situ aircraft measurements (Prata et al., 2017; Andersson et al., 2013). The Mount Calbuco eruption, discussed in detail in Sect. 4.1, injected large quantities of ash and a lesser amount of SO2 into the atmosphere (Marzano et al., 2018), resulting in sulfate formation about a month after the eruption (Bègue et al., 2017). To sample the ash component in the joint distribution, we only selected layers within the first 2 weeks of the eruption; the CALIOP depolarization was elevated for these layers, consistent with ash. Four new wildfire events were also added, which had a critical influence on the revisions that were made: in particular, smoke layers from the August 2017 Pacific Northwest (PNW) event and the December 2019–January 2020 Australian New Year (ANY) event. These events injected large amounts of depolarizing smoke into the stratosphere (Peterson et al., 2018; Hu et al., 2019; Ohneiser et al., 2020). Stratospheric smoke layers were also added from the December 2006 Australian bushfires (Dirksen et al., 2009) and from the July 2014 North American wildfires. The much larger number of stratospheric smoke layers now contributing to the joint distribution analysis allows us to exclude the tropospheric smoke layers that previously influenced the V4.2 threshold selections.
4.1 Color ratio test for smoke removed
The new joint distributions in Fig. 8 show that excluding tropospheric smoke layers from the sample population had an important impact: the population of smoke with low depolarization and higher color ratio is no longer prominent (notice that the secondary mode labeled “tropospheric smoke” in Fig. 4 is not evident in Fig. 8). Recent literature has confirmed the enhanced depolarization from smoke lofted by pyroCb events. The analysis of Christian et al. (2020) demonstrated increased depolarization and decreased color ratio for fresh pyroCb plumes at high altitudes compared to lower altitudes. This is corroborated by Fig. 9, which shows higher values of for stratospheric smoke layers used for the V4.5 joint distribution compared to the tropospheric smoke layers contributing to the V4.2 joint distribution.
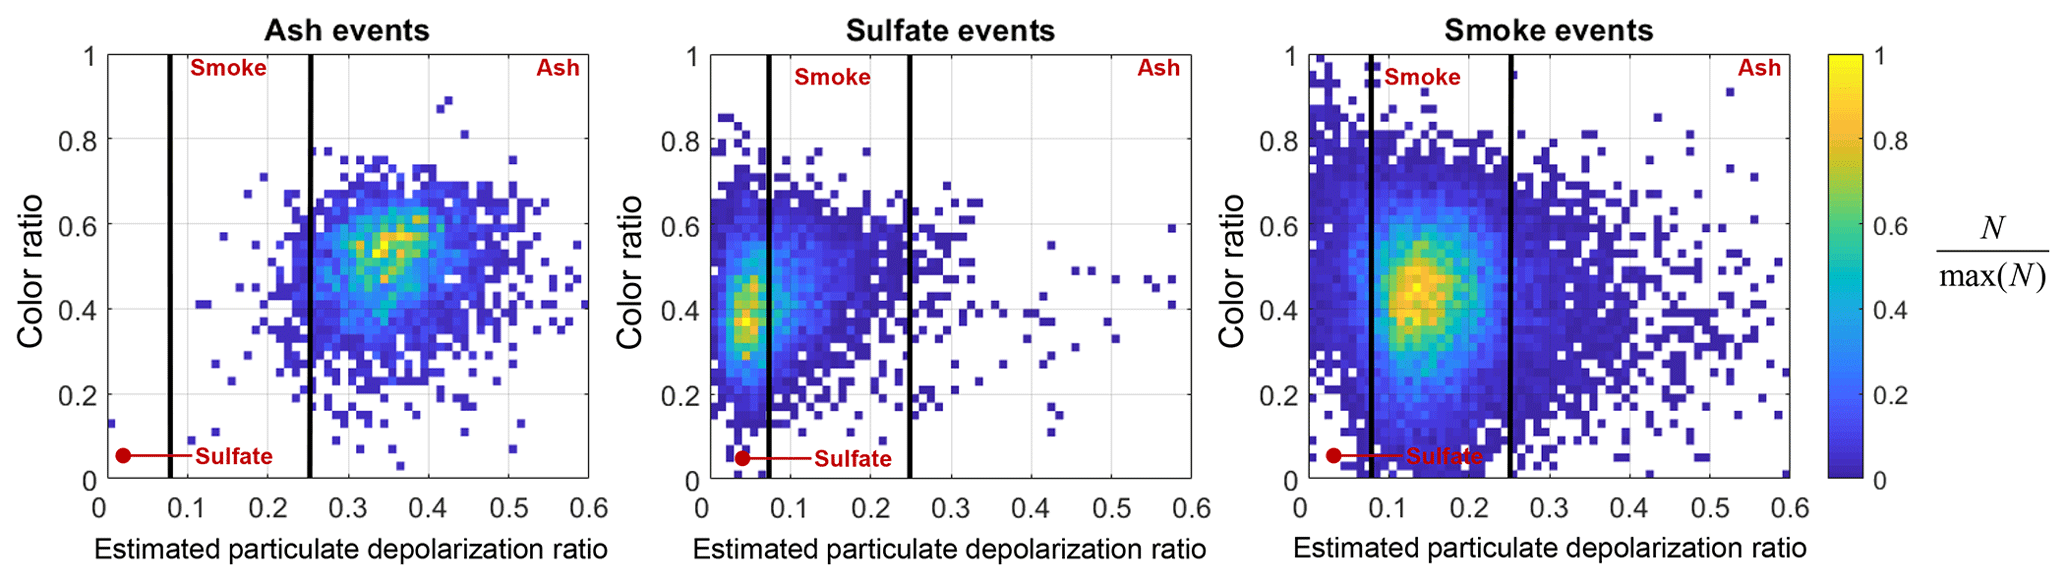
Figure 8Joint distributions used in V4.5 development; same description as Fig. 4, but only stratospheric aerosol layers with sr−1 contribute. Black lines indicate discrimination thresholds in V4.5, and red text indicates the algorithm classification.
These observations, primarily representing pyroCb events, suggest that smoke injected to extremely high altitudes contains particles that are aspherical and smaller (based on enhanced depolarization and lower color ratios, respectively) compared to smoke injected to lower altitudes. The cause of aspherical particles in smoke plumes from these pyroCb events is an active area of research (e.g., Gialitaki et al., 2020; Haarig et al., 2018; Kablick et al., 2018; Sicard et al., 2019). However, the message is clear. Smoke reaching the stratosphere in these events typically depolarizes the CALIOP backscatter signal more than smoke that is confined to the troposphere. Based on this information, we removed the color ratio test, which previously was employed to capture the low depolarization, higher color ratio smoke that is characteristic of tropospheric events. Because smoke layers that have low depolarization and high color ratio are not routinely observed in the stratosphere, there is no need to search for them. This marks the first structural change. The V4.5 stratospheric aerosol subtyping algorithm now strictly relies on the depolarization ratio to discriminate between ash, sulfate, and smoke.
A caveat is the possibility of misclassification by relying solely on the depolarization ratio to discriminate between sulfate and smoke. Recent research by Ohneiser et al. (2021) hypothesizes that smoke from Siberian wildfires in 2019 self-lofted from the troposphere into the UTLS. Because this smoke was aged and not of pyroCb origin, its depolarization was low (<0.05), causing the CALIOP V4.2 stratospheric aerosol subtyping algorithm to misclassify these smoke layers as sulfate (Ansmann et al., 2021). The subtyping algorithm will continue to struggle in these cases in V4.5 due to the similarly low depolarization ratios of tropospheric smoke and sulfate. It is currently unknown how often smoke plumes reach the UTLS exclusively by self-lifting.
Removing the color ratio test has the benefit of allowing more sulfate layers to be classified correctly as sulfate rather than smoke. This improves the accuracy of the retrieved extinction for these sulfate layers because the correct lidar ratio of 50 sr will be selected rather than 70 sr (Sect. 4.5), thereby avoiding a 40 % overestimate in aerosol optical depth (AOD). Conversely, there will be smoke layers misclassified as sulfate due to the overlap in the distributions for these two types, yielding a 40 % underestimate in AOD due to selecting the lower lidar ratio. The relative frequencies of correct and incorrect classifications for sulfate and smoke will be evaluated in Sect. 4.6.
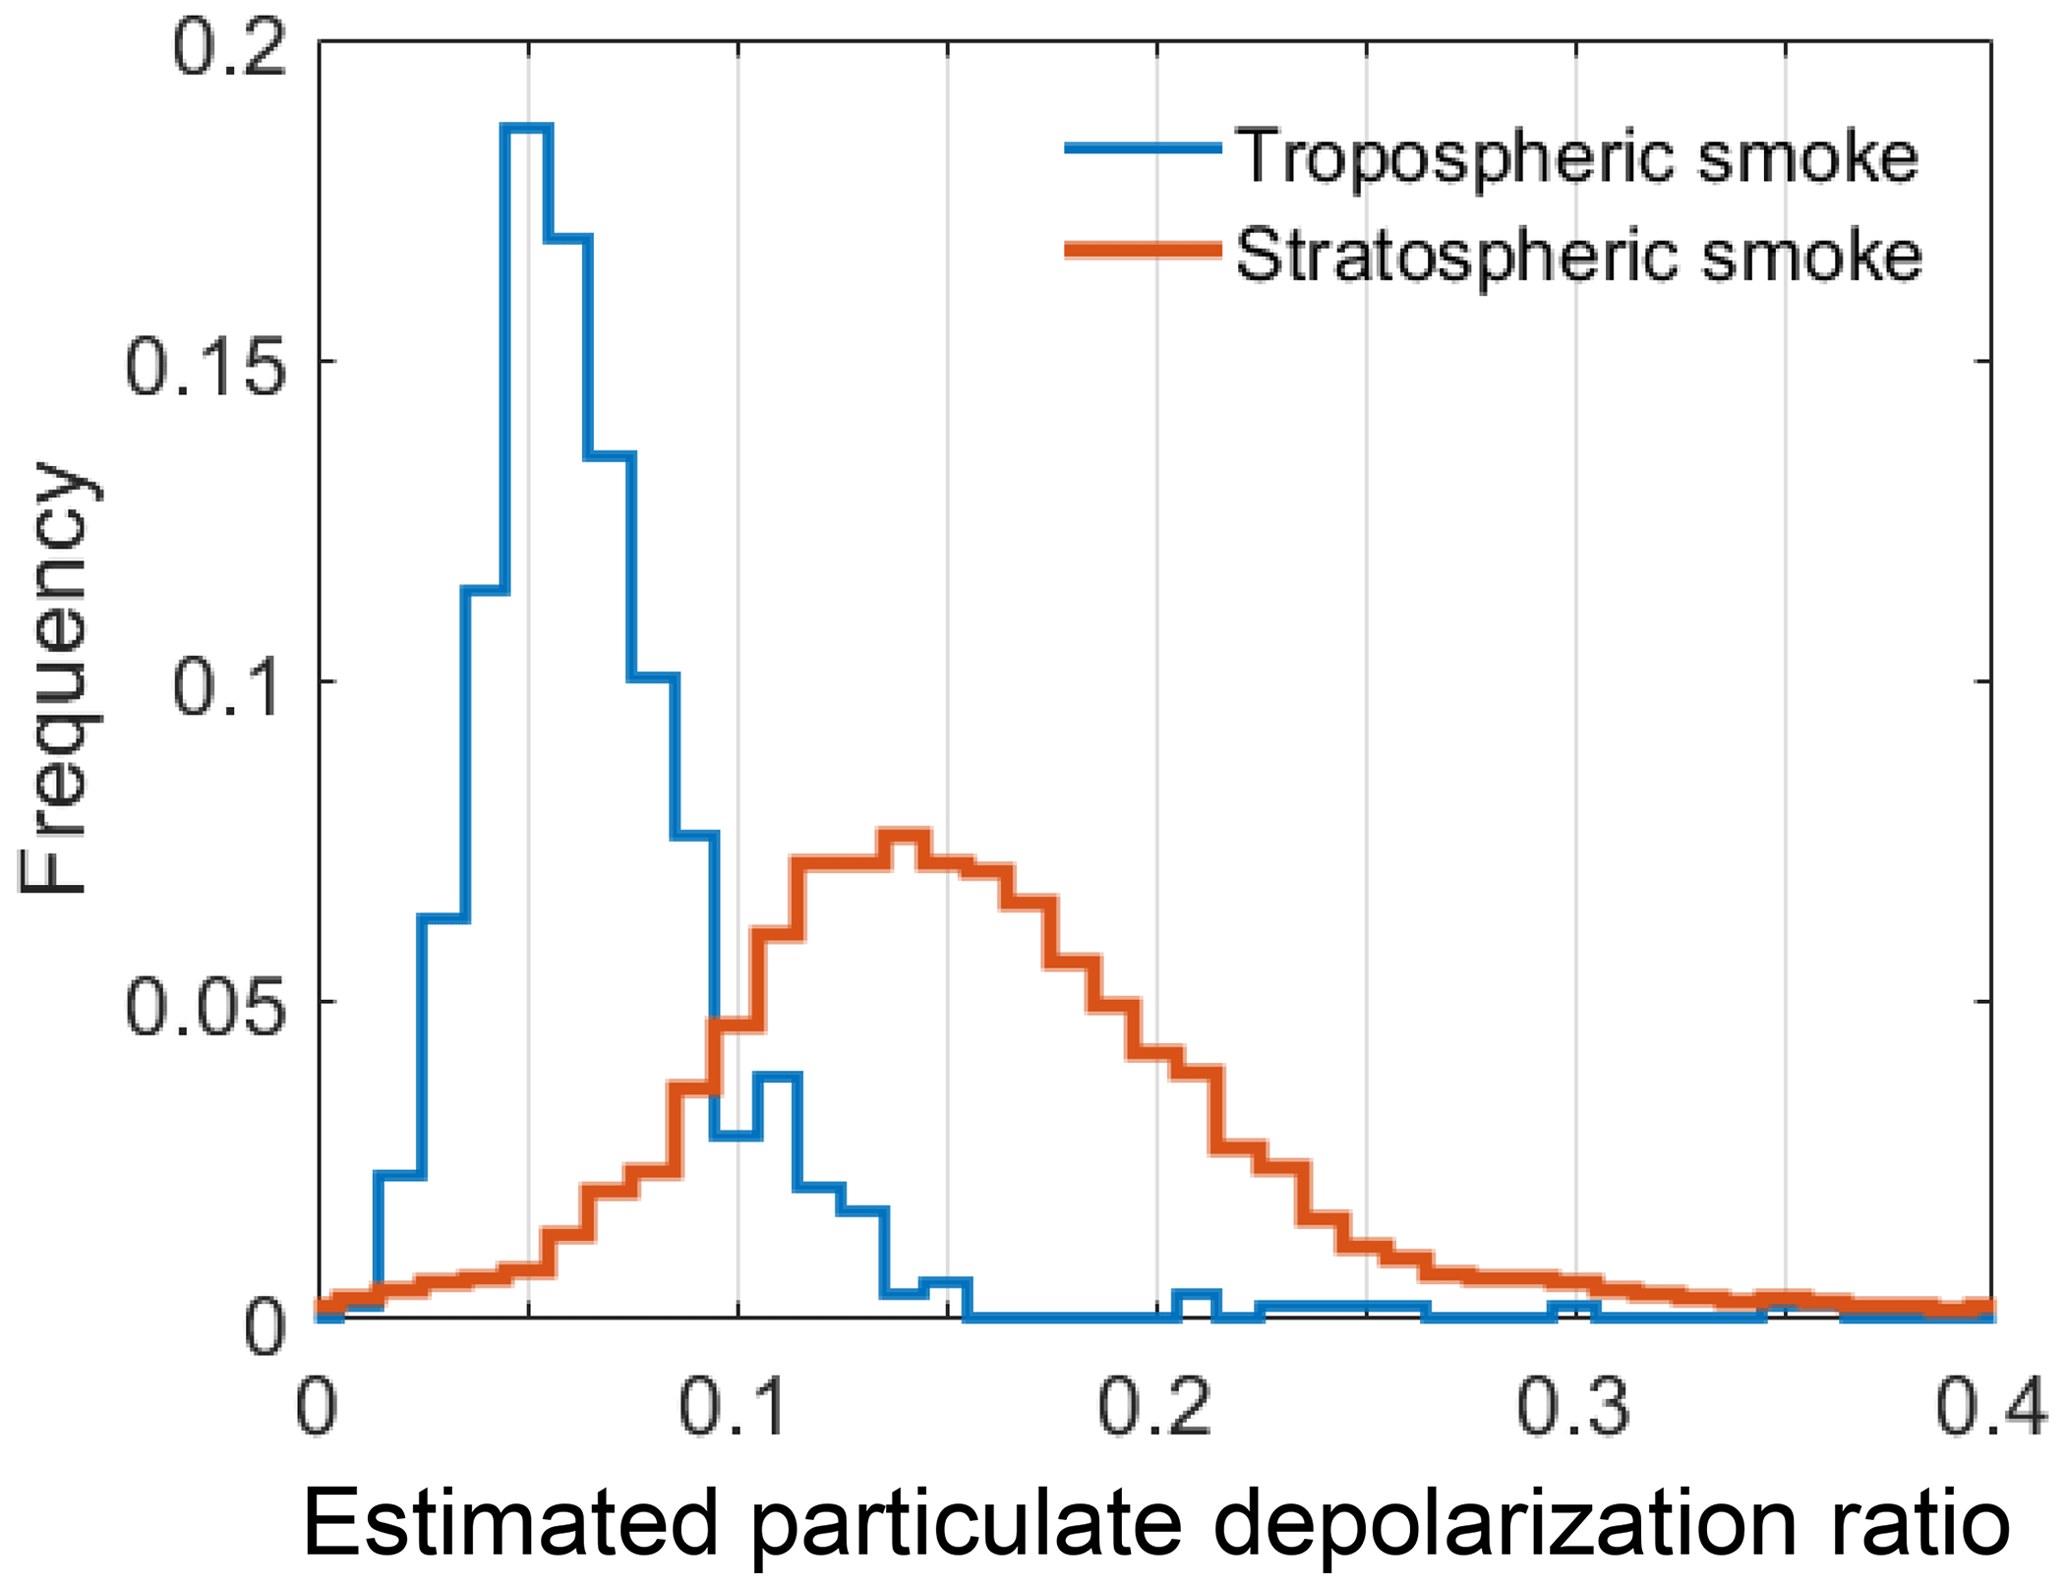
Figure 9Frequency distributions of estimated particulate depolarization ratio ( for stratospheric smoke layers in Table 1 (red) and tropospheric smoke layers contributing to the V4.2 joint distributions (496 layers from the May 2012 Siberian wildfires and 36 layers from July–August 2007 Canadian wildfires). Only layers with sr−1 contribute.
4.2 Depolarization ratio threshold between smoke and ash increased
The estimated particulate depolarization ratio ( threshold to discriminate between ash and smoke was 0.15 in the V4.2 release. This threshold worked well for the 2009 Black Saturday Australian bushfires, which had particulate depolarization ratios around 0.10 to 0.15. However, depolarization ratios were higher for stratospheric smoke layers from the PNW event in August 2017 (Fig. 10a). European lidar systems observed 532 nm particulate depolarization ratios ranging from 0.15 to 0.2 in the 2 weeks following the event (Ansmann et al, 2018; Haarig et al., 2018; Khaykin et al., 2018; Hu et al., 2019). Figure 10b shows the distributions of CALIOP-estimated particulate depolarization for all manually classified stratospheric smoke and volcanic ash events listed in Table 1. The markedly larger depolarization of layers from the PNW event compared to previous stratospheric smoke events caused a large frequency of misclassification in V4.2: whereas ∼ 25 % of all smoke events, excluding the PNW event, are misclassified as volcanic ash with the 0.15 threshold, a whopping 58 % of the smoke layers detected during the PNW event were misclassified as ash.
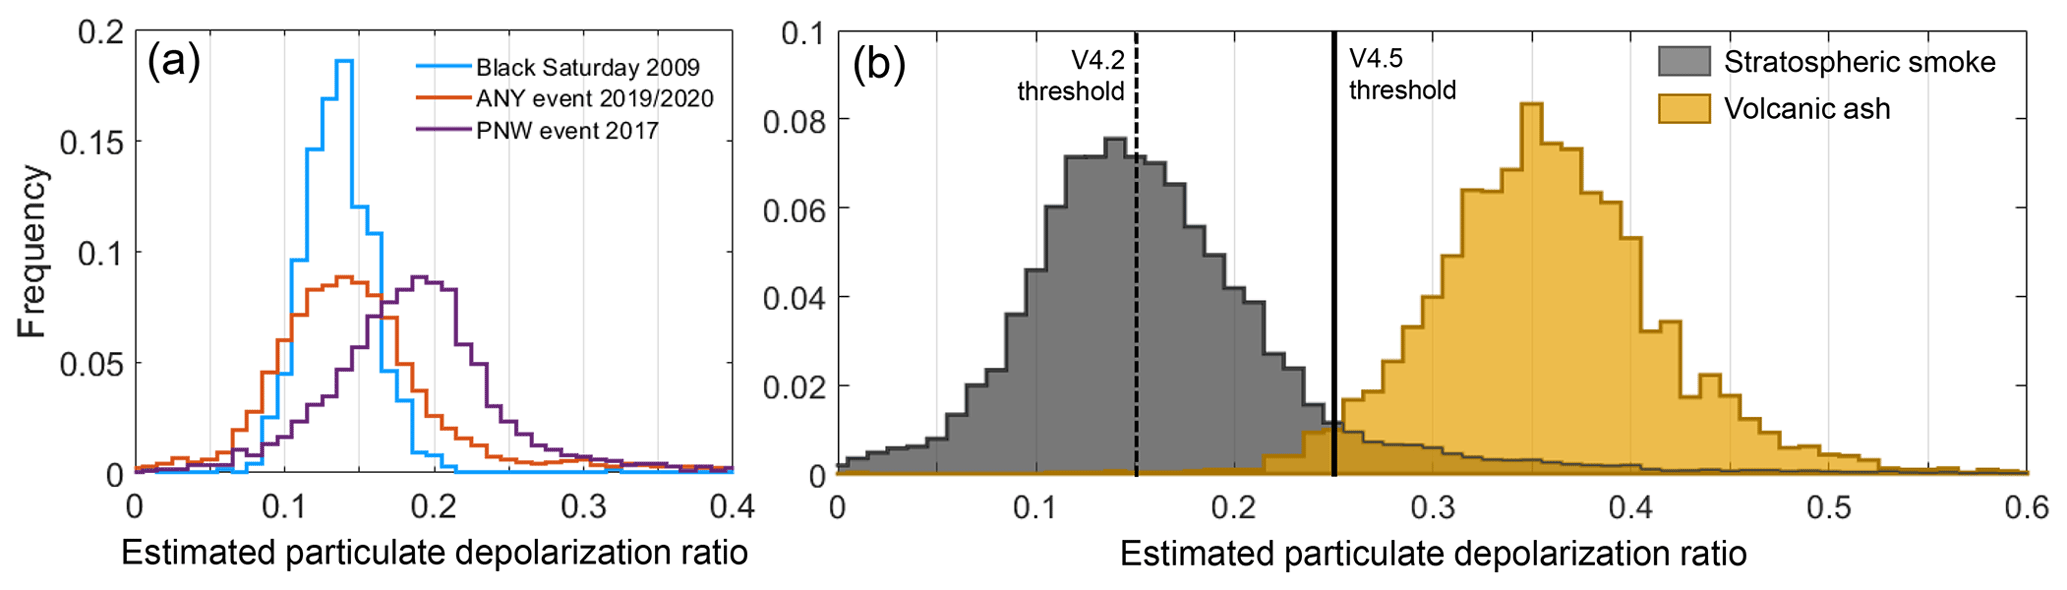
Figure 10Frequency distributions of estimated particulate depolarization ratio ( for layers identified in Table 1, comparing three major stratospheric smoke events (a) and all stratospheric smoke events (b) to all volcanic ash events. Only layers with sr−1 contribute.
In order to better discriminate between stratospheric smoke and volcanic ash in V4.5, the threshold between these types was increased from 0.15 to 0.25. This is roughly the minimum overlap between the distributions in Fig. 10b. Doing so reduces the amount of smoke layers misclassified as ash in the PNW event to 9 % (Sect. 4.6). The example from this event in Fig. 11a shows that the dominant classification is now smoke rather than ash (compare with Fig. 1). A more thorough assessment of the classification performance is given in Sect. 5.
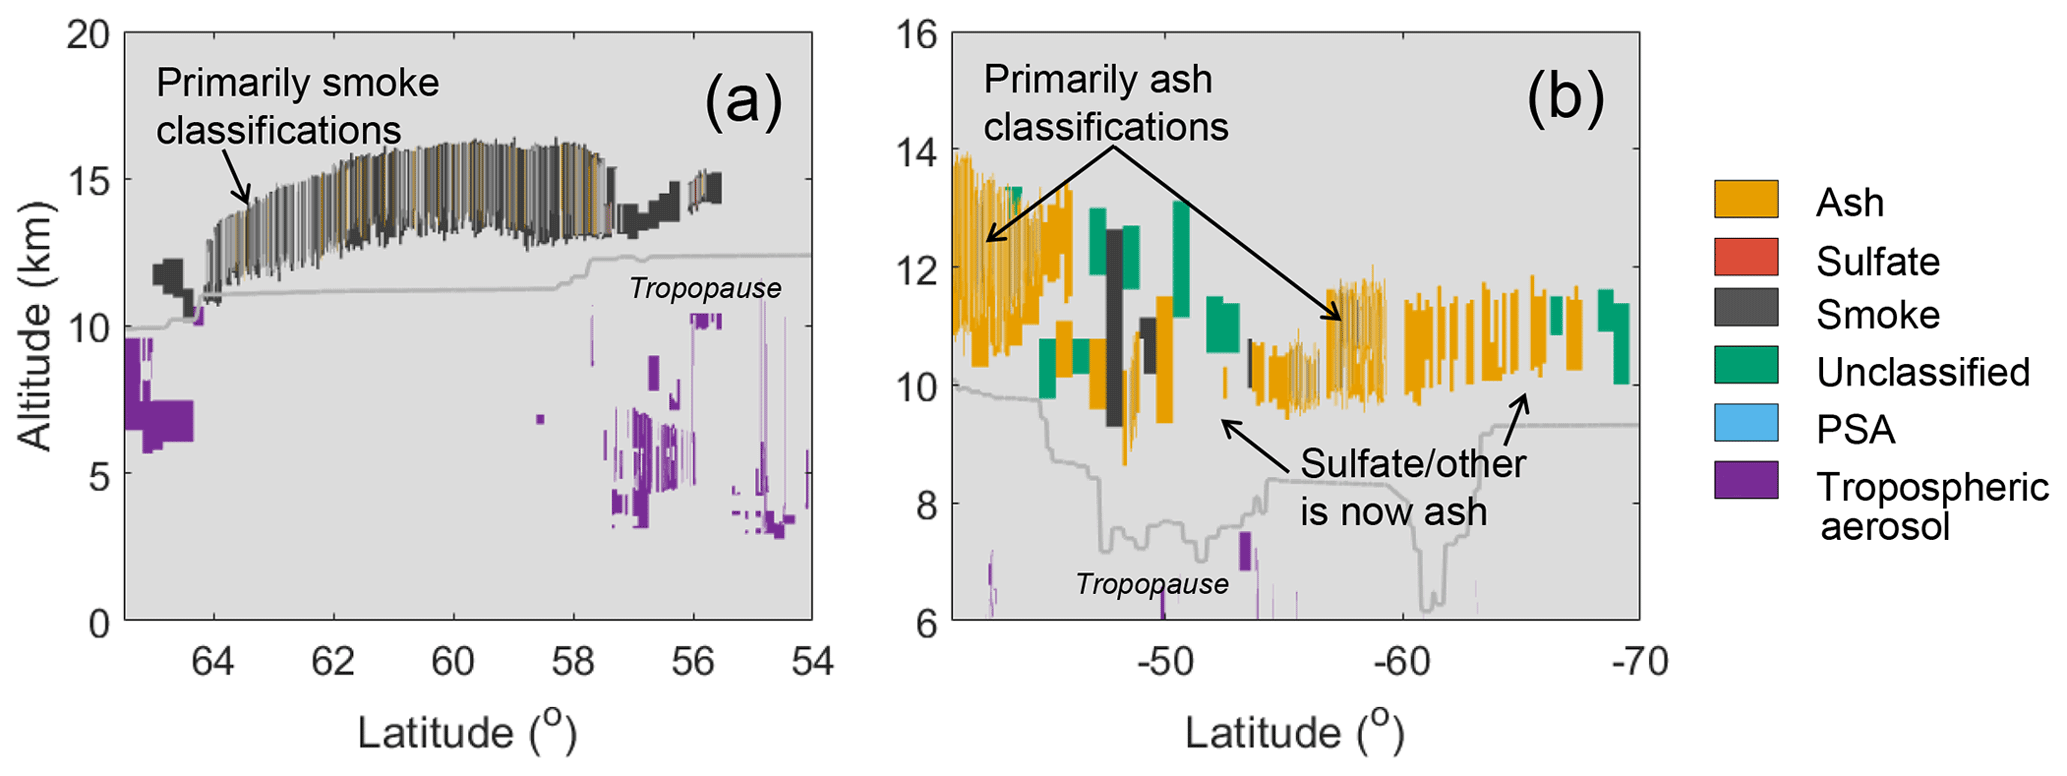
Figure 11Aerosol subtyping after V4.5 revisions for (a) pyroCb smoke plume from the PNW event (compare with Fig. 1) and (b) volcanic ash plume from the June 2011 Puyehue-Cordón Caulle eruption (compare with Fig. 2).
4.3 Sulfate/other separated into two types: sulfate and unclassified
The second structural change to the stratospheric aerosol subtyping algorithm is the separation of the “sulfate/other” classification into two separate types: sulfate and “unclassified”. Previously, both low-γ′ layers and layers meeting the sulfate criteria were assigned the sulfate/other classification. This hampered the ability to easily identify volcanic sulfate layers because low-γ′ layers can be any aerosol type, provided is sufficiently low. Returning to the example in the introduction, Fig. 11b shows that the majority of the ash plume is now correctly classified, whereas before it was classified as sulfate/other (compare with Fig. 2). This is a result of separating the low-γ′ branch and also lowering the threshold (discussed next). The nomenclature for the low-γ′ branch has also changed to unclassified to emphasize that no attempt has been made to classify the subtype based on its depolarization. This subtype serves as a catchall for aerosols that have insufficient backscatter to yield confident classifications of volcanic ash, sulfate, or smoke. We will characterize unclassified layers in Sect. 5.4.
4.4 Low-γ′ threshold decreased
The second threshold adjustment was for low-γ′ layers, now identified as “unclassified”. At low signal levels, becomes prone to increases in systematic and random errors along with the increased risk of overestimates, as discussed in Sect. 3. Previously, the threshold was sr−1, which caused 75 % of all stratospheric aerosol layers detected from June 2006–December 2018 to be classified as sulfate/other. In the V4.5 release, this threshold has been lowered to assign the unclassified subtype to layers having in the lowest quartile of the June 2006–December 2018 stratospheric aerosol distribution, corresponding to sr−1 during the day and sr−1 at night. The lowest-quartile metric was selected based on the rapid increase in relative uncertainty in as a function of decreasing (Fig. 12). Based on the low-γ′ thresholds in V4.5, the average relative uncertainty in is less than 250 % for layers classified as ash, sulfate, and smoke at all detection resolutions – except for layers detected at 80 km resolution in the daytime, which typically have uncertainties of ∼ 400 %. Classifications for daytime, 80 km resolution stratospheric aerosol layers that are not assigned the unclassified subtype, should be interpreted with caution. The average relative uncertainty for stratospheric layers detected at 5 km resolution is <50 %.

Figure 12Average relative uncertainty in estimated particulate depolarization ratios as a function of layer-integrated attenuated backscatter ( for all stratospheric aerosol layers detected between June 2006–December 2018, segregated by horizontal averaging required for detection. Solid lines are nighttime detections, and dashed lines are daytime detections. Layers classified as PSA, |CAD Score| < 20 (indicating no confidence in cloud–aerosol discrimination), or top altitudes above 20 km are excluded.
For reference, the average relative uncertainty in was less than 200 % for stratospheric aerosol layers that had above the previous low-γ′ threshold in V4.2. With the new thresholds, layers detected at 5 and 20 km horizontal resolution, regarded as robustly scattering features, will almost certainly be subtyped as something other than unclassified, as will approximately half of the 80 km resolution layers. This reduces the frequency of unclassified aerosol layers to 25 %, with a corresponding increase of 50 percentage points in the relative uncertainty of , which is not expected to noticeably degrade the fidelity of the subtyping algorithm. Rather, we have decided that the increase in opportunities to classify stratospheric aerosol layers outweighs the increase in uncertainty.
If we assume a lidar ratio of 50 sr for sulfates (i.e., as in Kim et al., 2018), we can translate the thresholds into approximate optical-depth thresholds. Using the V4.2 threshold of 0.001 sr−1 caused all layers with optical depths less than ∼ 0.053 to be classified as sulfate/other. By contrast, the revised threshold of 0.0003 sr−1 translates into an optical depth threshold of ∼ 0.015 so that only those layers with optical depths less than ∼ 0.015 are identified as unclassified.
4.5 Lidar ratio for ash increased
As emphasized in the introduction, the algorithmic motivation for improving aerosol subtyping is to ensure that a representative lidar ratio is selected for each subtype, thereby yielding accurate extinction retrievals. Because CALIOP retrievals operate from top down, any errors in the retrieved extinction due to incorrect lidar ratio selection will propagate into underlying layers. The previous subsections described the improvements we made to increase the likelihood that the correct stratospheric aerosol subtype (i.e., correct lidar ratio) will be selected. However, it is also important that the lidar ratio for these subtypes are representative of what is observed in nature. A full, detailed accounting of error propagation in CALIOP extinction retrievals is given in Young et al. (2013), including the impacts of incorrect lidar ratio selection. One key take-away from that paper is that the relative error in retrieved AOD equals the relative error in the lidar ratio for layers that have low optical depths, typical of aerosols. A second key take-away is that the error in retrieved AOD due to incorrect lidar ratio selection behaves as a systematic bias in the retrieval of optical depth for underlying layers. The magnitude of the error in AOD for the underlying layer depends on its R′, AOD, and the magnitude of the error in the lidar ratio of the overlying layer. In general, though, the sign of the AOD bias in the underlying layer is the same as the sign of the error in the lidar ratio selection of the overlying layer (i.e., selecting too low of a lidar ratio causes an underestimate in the AOD retrieved for layers at lower altitudes). Feature detection accuracy for lower layers can also be degraded if overlying attenuation is not correctly accounted for. Clearly, accurate lidar ratio selection is critical for elastic backscatter lidar retrievals.
The stratospheric aerosol lidar ratios assignments for V4.5 are shown in Table 2. The same values were used in V4.2 for sulfate (previously sulfate/other), smoke, and PSA, as justified by Kim et al. (2018). The lidar ratio for the unclassified subtype is based on extinction retrieval considerations. As discussed in Sect. 4.3, unclassified layers can be any subtype, provided their is sufficiently low. In order to reduce the impact of extinction retrieval errors that propagate into underlying layers, it is better to use a lidar ratio that is too low rather than too high when accurate knowledge of the subtype is unavailable (Young et al., 2013). Therefore, the unclassified subtype shares the same lidar ratios as sulfate because these are the lowest lidar ratios expected for non-PSA stratospheric aerosol layers.
Table 2Lidar ratios for stratospheric aerosol subtypes in V4.5.

The 532 nm lidar ratio for ash was increased in V4.5. In the previous release, the default lidar ratio for volcanic ash was set to 44 sr at both 532 and 1064 nm, matching the lidar ratios of the tropospheric dust subtype (Kim et al., 2018). This choice was motivated by similarities between the size distributions of volcanic ash and dust (Winker et al., 2012) and to avoid discontinuities in extinction retrievals between ash above and below the tropopause (because ash and dust are depolarizing, volcanic ash will be misclassified as dust in the troposphere). However, several analyses suggest that the 532 nm lidar ratio for ash is higher. Ash plumes from the April 2010 Eyjafjallajökull eruption, observed by EARLINET (European Aerosol Research Lidar Network) lidar measurements, revealed 532 nm lidar ratios over Germany from 45–60 sr (Ansmann et al., 2010; Groß et al., 2012). Higher 532 nm lidar ratios for the plume were observed over Italy, ranging from 50–92 sr (Mona et al., 2012), and over Greece, ranging from 44 to 88 sr (Kokkalis et al., 2013). These latter studies suggest that relative humidity and/or aging may have played a role in the variability. Prata et al. (2017) used CALIOP constrained retrievals to characterize ash 532 nm lidar ratios from the 2011 Puyehue-Cordón Caulle eruption. The constrained retrieval method computes transmittance if there is clear air above and below a feature, thus allowing a measurement of the layer lidar ratio at 532 nm. Their analysis reveals a median ash 532 nm lidar ratio of 67 sr for this event.
Based on the growing consensus in the literature that the 532 nm lidar ratio for volcanic ash is typically larger than the value used in V4.2, we have revised the 532 nm lidar ratio in the V4.5 release. Following the method of Prata et al. (2017), Fig. 13 shows the 532 nm lidar ratios from CALIOP constrained retrievals for ash layers from several eruptions, including the Puyehue-Cordón Caulle (2011), Kelud (2014), Sarychev (2009), and Calbuco (2015). In order to remove no-confidence retrievals and any possible cloud contamination, only layers with retrieved lidar ratio uncertainty <100 % and |CAD score| > 20 contribute to the histogram. Using the mean and standard deviation of lidar ratios derived from this analysis, the default 532 nm lidar ratio is increased to 61 ± 17 sr, consistent with values reported in the literature. This will increase the retrieved AOD for ash layers by ∼ 39 % and prevent underestimates of optical depth for underlying layers. Because knowledge of 1064 nm lidar ratios is not as broad in the literature, the default 1064 nm lidar ratio for ash will not be changed for the V4.5 release.

Figure 13Distribution of 532 nm lidar ratios retrieved from constrained retrievals of ash layers from several volcanic events (see text). Lines indicate default values for ash in V4.2 and V4.5.
Recent ground-based lidar and lidar-photometer retrievals of smoke arising from pyroCb events have measured higher 1064 nm lidar ratios than the default value used by CALIOP (30 sr), with values ranging from 80–120 sr (Haarig et al., 2018; Ohneiser et al., 2022). The 1064 nm lidar ratio used for all smoke layers in V4.2, and carried forward into V4.5, is based on AERONET (AErosol RObotic NETwork) retrievals of tropospheric smoke (Sayer et al., 2014). Microphysical differences likely exist between smoke injected into the stratosphere from pyroCb events and smoke residing in the troposphere from less-explosive events, so lidar ratio differences are plausible. We plan to reevaluate 1064 nm lidar ratios for stratospheric smoke and ash in a future data release.
4.6 Change in classifications between V4.2 and V4.5
The changes in classifications due to V4.5 revisions are summarized in Fig. 14 based on all the manually classified events in Table 1. Here we are comparing unique layers detected within the plume boundaries reported in the Supplement. Because each rectangular boundary contains a buffer of clear-air around the actual plume (Sect. 3), it is not necessary to perfectly match layer top and base altitudes between versions. We are only concerned with the classifications within those boundaries, and the buffer allows for any differences in layer detection that may occur. The hatched bars in Fig. 14 indicate low-γ′ features (“other” in V4.2 and unclassified in V4.5). One obvious change for ash-dominant events is the radical reduction of the sulfate/other subtype and the accompanying increase in ash classifications. This is a direct consequence of reducing the threshold for low-γ′ layers; the new ash layers have somewhere between the old and new qualifying thresholds. Evidently, is still an excellent discriminator for ash, even as decreases, bolstering our confidence in our decision to reduce the threshold. There is a minor increase in smoke misclassifications where for some ash layers is just low enough to resemble that of depolarizing smoke.

Figure 14Stratospheric aerosol subtype classification frequency for events dominated by ash, sulfate, and smoke for V4.2 (a, c, e) and V4.5 (b, d, f) based on manually identified layers in Table 1. Low-γ′ layers, based on the γ′ threshold for the relevant version, are indicated by hatched bars.
For the sulfate-dominant events in V4.2, a substantial fraction of sulfate/other classifications were low-γ′ layers (hatched bars in Fig. 14). A small number of these low-γ′ layers became unclassified in V4.5 after separating the sulfate/other class. Meanwhile, a larger number became classified as sulfate because reducing the threshold and removing the color ratio test allowed more opportunities for the sulfate classification. The net effect is that sulfate is the dominant subtype assigned for these events. There is a small increase in smoke misclassification for at least three reasons. (1) These layers could be mixtures of sulfate and ash, yielding moderate values of (discussed further in Sect. 5.2). (2) The increased variability in due to the greater influence of random and systematic errors for layers that have in between the old and new low-γ′ thresholds allows more opportunities for sulfate layers to exceed the threshold. (3) A small number of ash classifications changed to smoke due to the increase in the threshold separating these types. Even though smoke misclassification increases for these sulfate-dominant events, eliminating the color ratio test improved the accuracy. For all the sulfate-dominant events shown in Fig. 14, the V4.5 classification frequency for sulfate and smoke is 70 % and 28 %, respectively. Retaining the color ratio test would have yielded classification frequencies of 58 % and 41 %, respectively. Given the limited CALIOP observables, discriminating sulfate from smoke will always be a challenge; hence, this seemingly modest improvement represents a welcome and useful increase in classification accuracy. There remains a substantial overlap in the distributions for these two types, which inherently reduces the ability to distinguish sulfate with a high degree of accuracy.
Classifications for pyroCb-smoke-dominated events show a marked improvement. The frequency of layers classified as smoke increased, while misclassifications as other types decreased. As previously mentioned, layers from the PNW event were primarily misclassified as ash in V4.2 (∼ 58 %). Now smoke is the dominant classification (∼ 85 %), with an ash misclassification rate around 9 %. A similar reduction in ash misclassification occurs in the other stratospheric smoke events highlighted in Fig. 14. Lowering the low-γ′ threshold also improves smoke classification by moving many layers previously classified as sulfate/other to the smoke subtype. Just as with volcanic ash, the elevated depolarization ratios permit recognition of these layers as depolarizing smoke despite having lower . There is a small increase in sulfate misclassifications for smoke layers that have due to the removal of the color ratio test.
We now take a closer look at the geographical and time evolution of classifications for specific stratospheric aerosol events to assess the performance of the algorithm. Whereas the previous section summarized classifications for manually identified volcanic ash, sulfate, and smoke layers, we now evaluate the classifications for all aerosol layers detected in the stratosphere following major aerosol injections. As before, we have selected events where the dominant aerosol subtype is known based on sources from the literature. Broadening our evaluation to include all aerosol layers detected in the stratosphere rather than manually identified layers gives a sense of the fidelity of the algorithm in the wide range of scenes that CALIPSO encounters. Subtype classification frequencies and depolarization ratio statistics are for night and day layer detections collectively unless otherwise noted.
5.1 Ash-dominated events
The stratospheric aerosol typing algorithm performs exceptionally well at identifying volcanic ash. One event dominates the CALIPSO record for this aerosol type: the Puyehue-Cordón Caulle eruption on 4 June 2011. Located in southern Chile (40.6∘ S, 72.1∘ W), the volcano injected an estimated ∼ 0.4 Tg of ash into the atmosphere of the Southern Hemisphere (Bignami et al., 2014) to altitudes of 12–14 km (Ulke et al., 2016). The plume circumnavigated the globe, affecting air traffic in multiple countries (Wunderman, 2012). A strong signature of ash was evident based on elevated CALIOP depolarization ratios and ash retrievals by MODIS and IASI (Klüser et al., 2013; Vernier et al., 2013; Bignami et al., 2014; Maes et al., 2016; Prata et al., 2017, 2021; Christian et al., 2020).
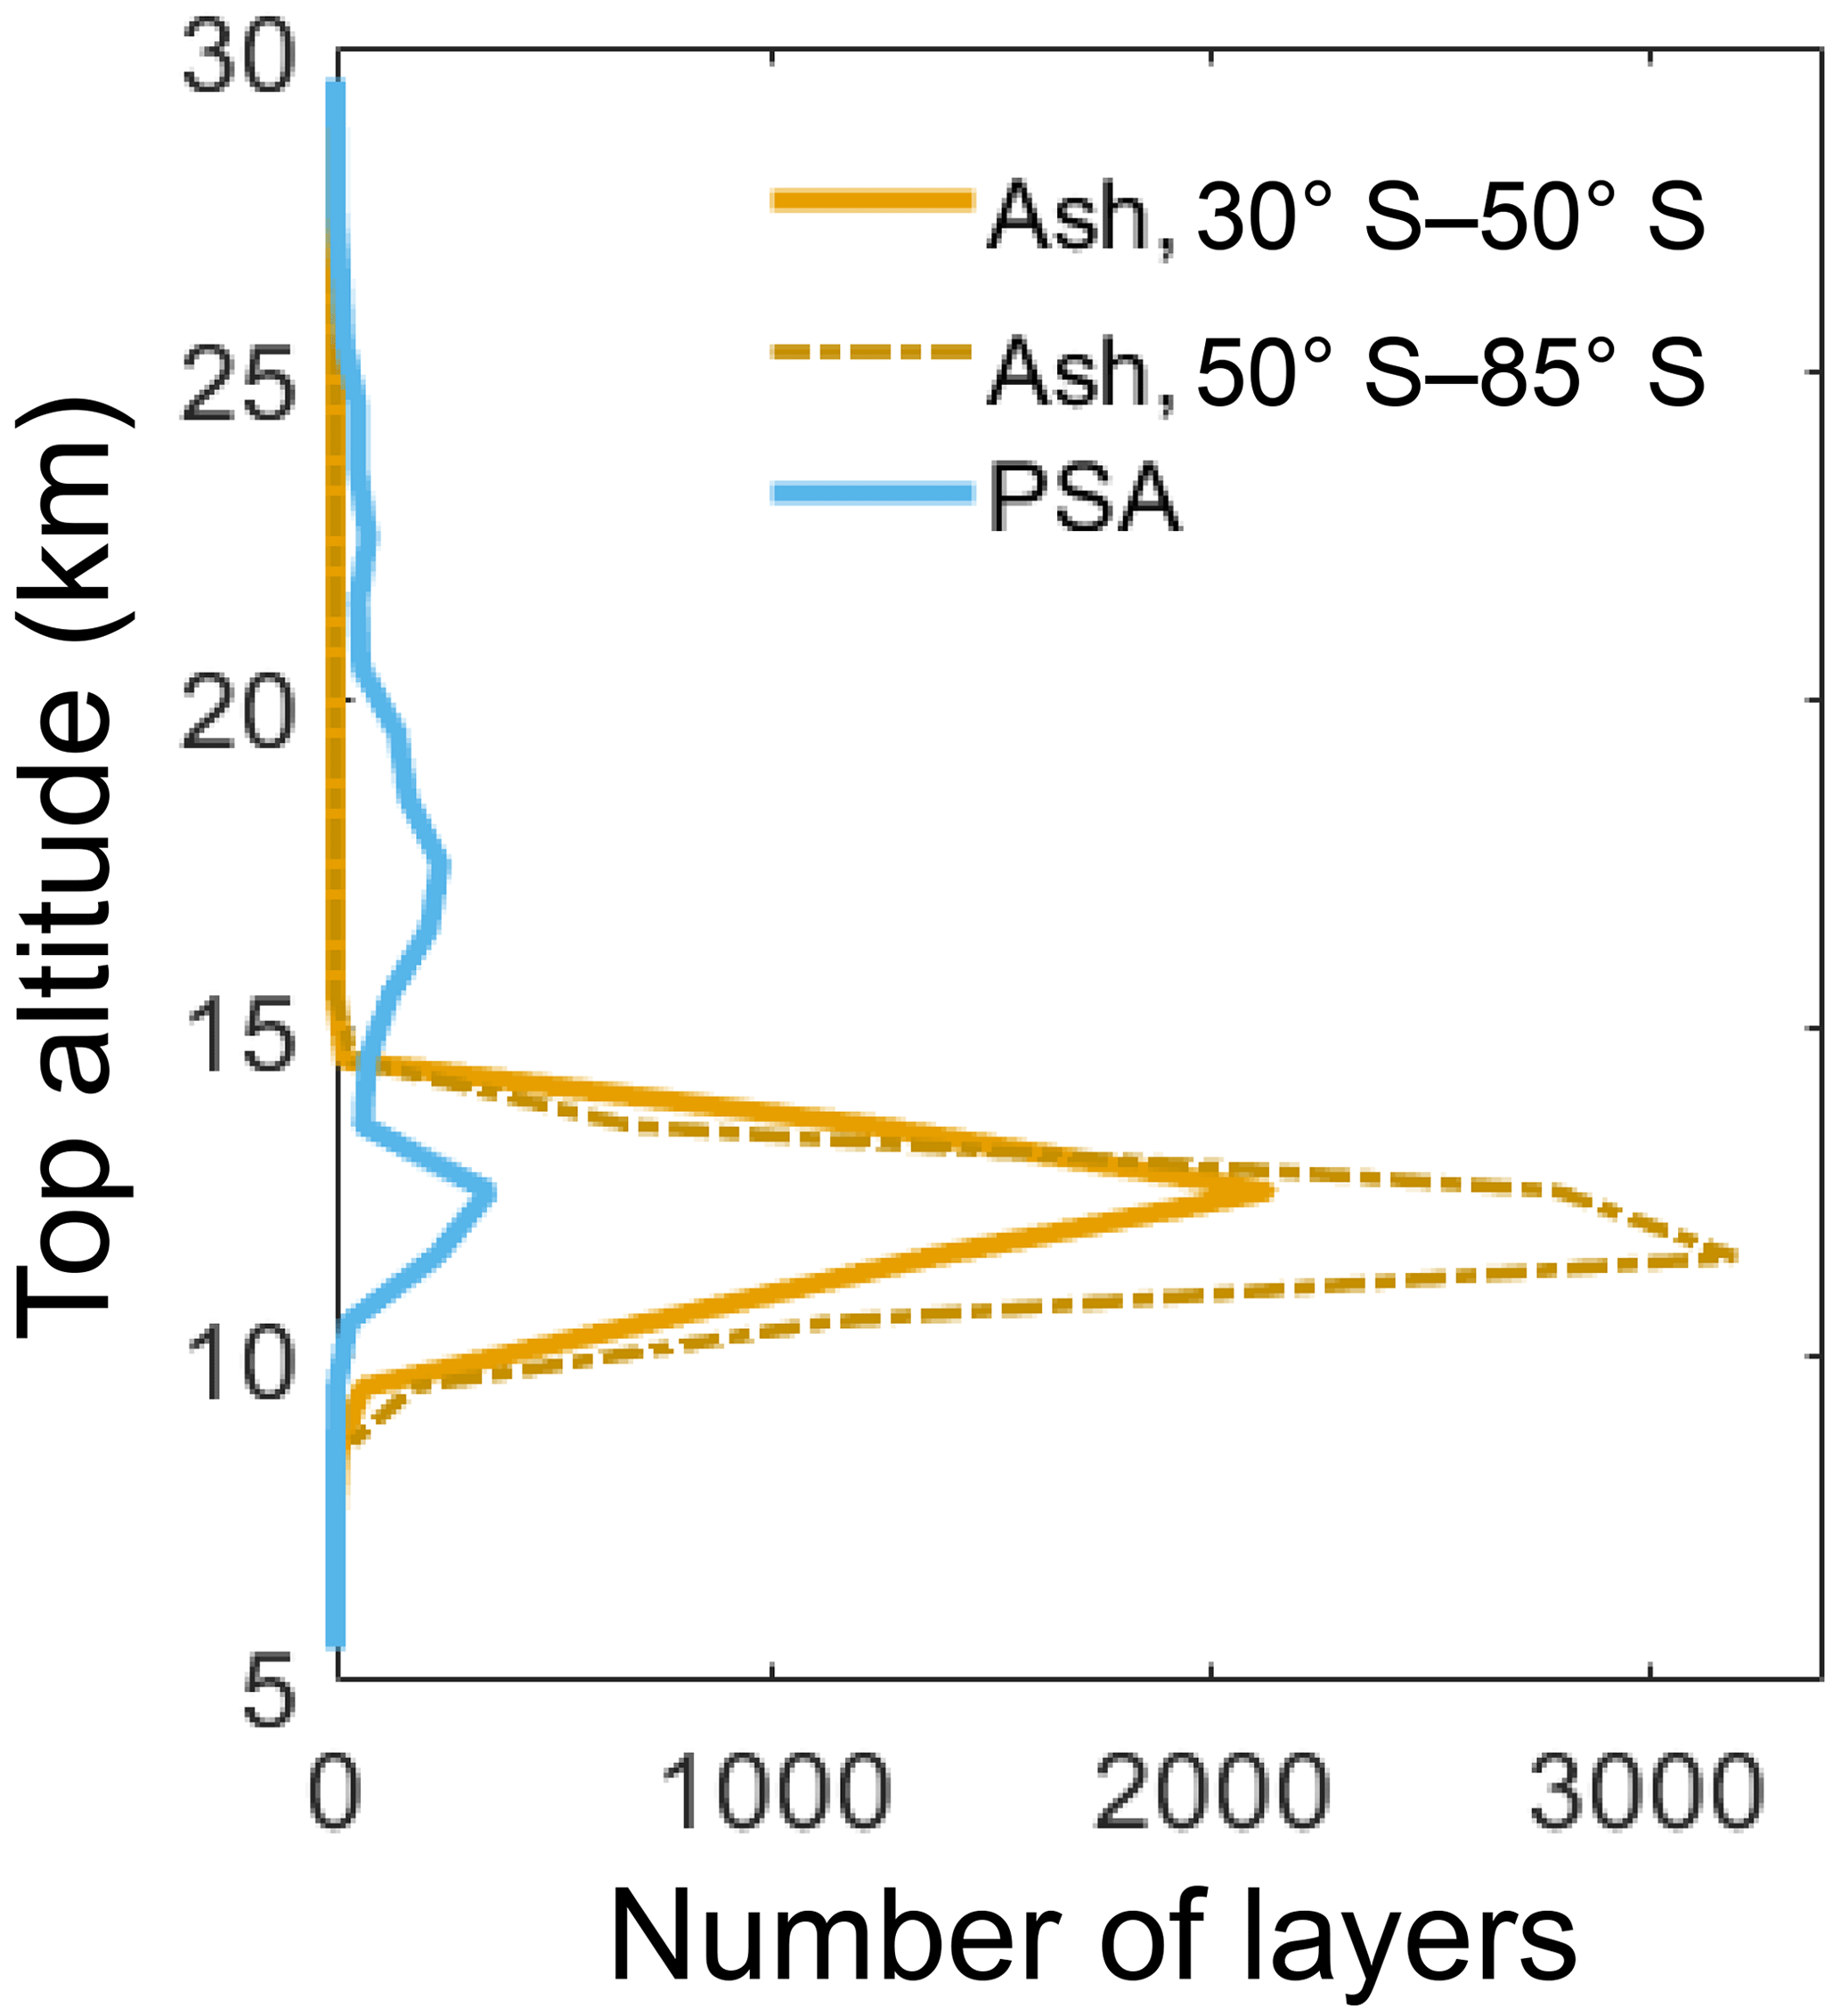
CALIOP detected ash primarily after 15 June 2011 (the CALIPSO payload was turned off due to adverse space weather during 6–15 June). Stratospheric aerosol layer detections in Fig. 15a show that the layers detected during 15–28 June 2011 span all longitudes, primarily south of 30∘ S. These layers were mainly detected from 8 to 14 km (Fig. S1a). The median is 0.34 for all stratospheric aerosol layers in the Southern Hemisphere (Fig. 16), excluding those assigned the PSA subtype. Therefore, ash is the dominant subtype assigned at a frequency of 84.3 %, with smoke and sulfate classifications at rates of 3.3 % and 0.2 %, respectively. Smoke misclassifications are expected as well, given the overlap in distributions of between the volcanic ash and depolarizing smoke regimes. In addition, the daily median of detected layers steadily decreased from 0.35 to 0.25 during days +15 to +45 after 4 June (−0.02 per week), possibly contributing to the number of smoke misclassifications. Nonetheless, ash remained the dominant aerosol subtype classification for over 45 d past the eruption (Fig. 15b).
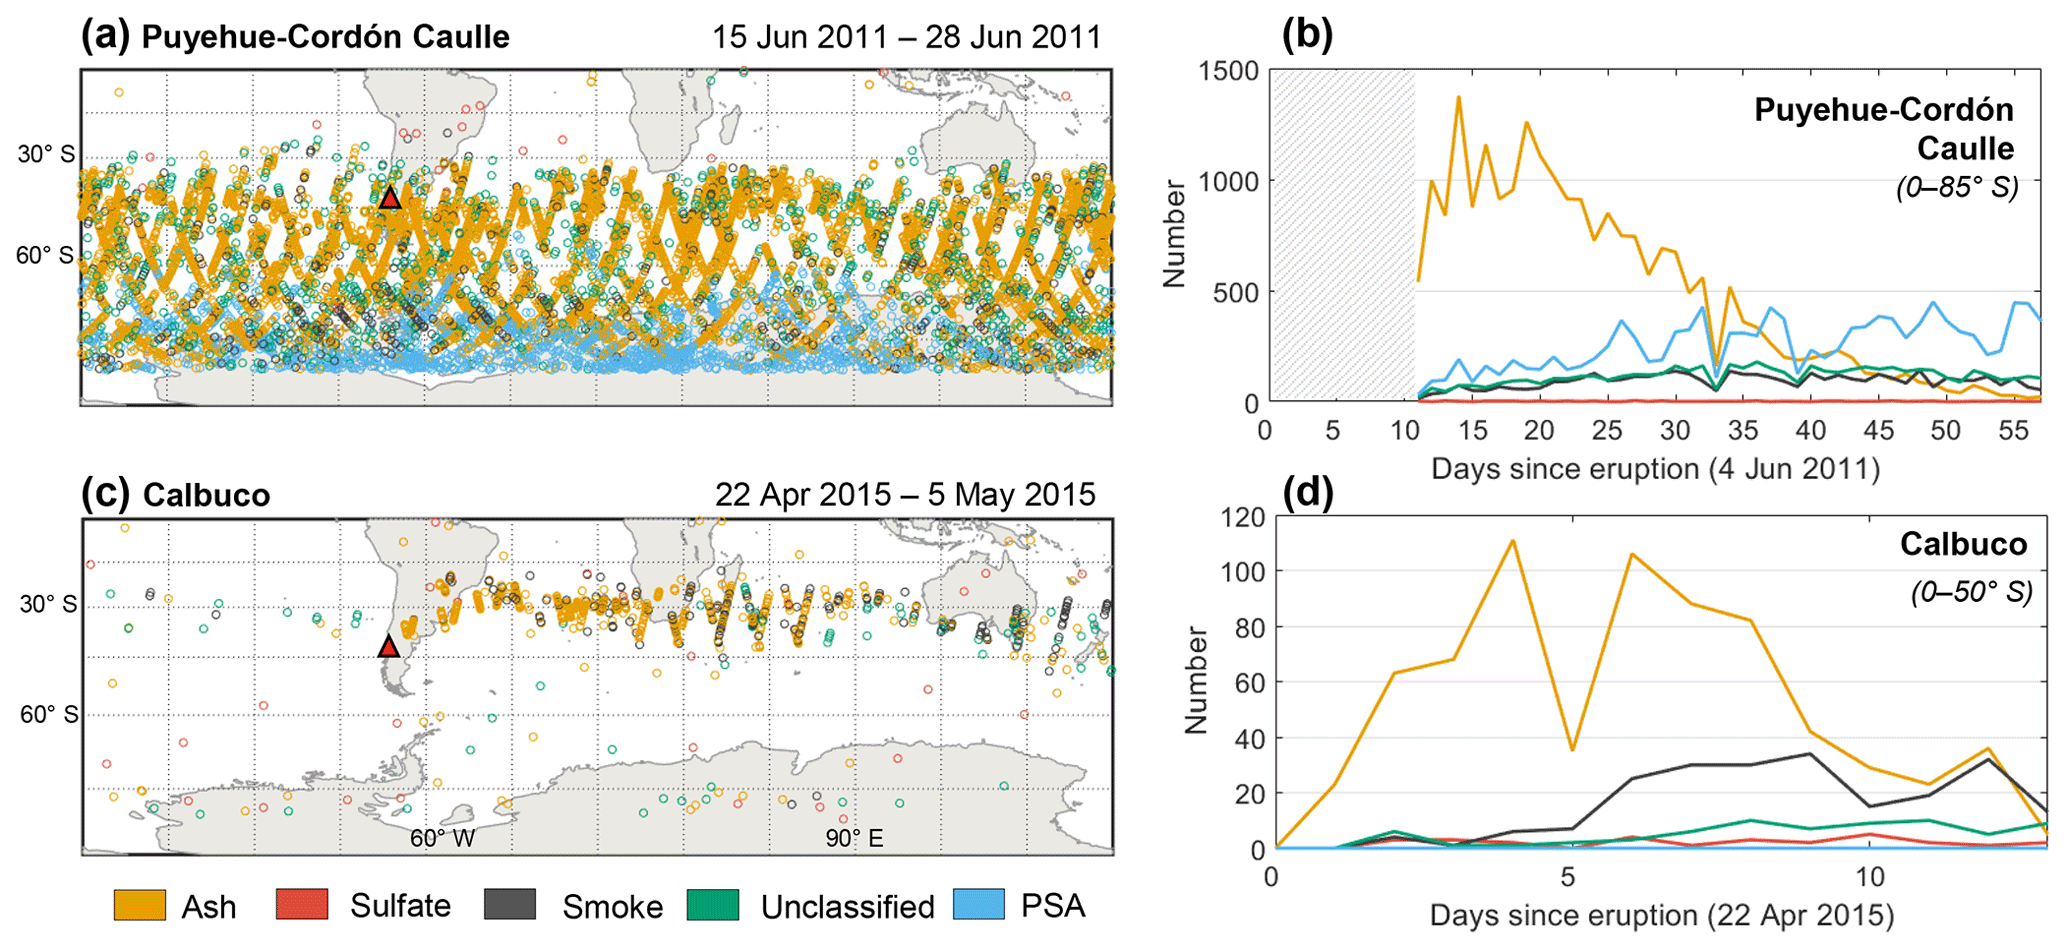
Figure 15For ash-dominated events in V4.5: (a) locations of subtype classifications following first CALIOP detection, and (b) time history summation of subtype classifications. Volcano locations are denoted by red triangles. Hatched areas indicate missing CALIOP data. The payload was down for testing and spacecraft maneuvers during part of 27 April 2015, causing the reduced number of layer detections on that date in panel (d).
The time period of the Puyehue-Cordón Caulle eruption coincided with the beginning of PSC season over Antarctica, and many PSA classifications are evident in Fig. 15a. During the first 2 weeks after the main eruption, the volcanic ash and PSA classifications were mostly separated in altitude. Figure 17 compares the layer top altitudes of ash classifications south and north of 50∘ S to that of PSA classifications which can only be south of 50∘ S. Ash layers are confined below 14 km, whereas 64 % of the PSA classifications are above this altitude. These higher-altitude layers are likely legitimate PSA classifications due to their low temperatures (−70 ∘C) and low depolarization ratios (median ∼ 0.02), consistent with liquid supercooled ternary solution droplets (Pitts et al., 2011). The accuracy is questionable for the remaining 36 % of PSA classifications below 14 km, accounting for 5 % of all layers detected at these altitudes. These layers have a median depolarization of 0.32, consistent with ash, though some mixtures of PSC particles also have elevated depolarization ratios (Pitts et al., 2011). Given the coincident altitude with the ash plume, some of these layers are likely to be ash misclassified as PSA.
The second major volcanic ash event we evaluate is the Mount Calbuco eruption on 22–23 April 2015. Also a Chilean volcano, Mount Calbuco (41.3∘ S, 72.6∘ W) injected an estimated 3 Tg of volcanic ash (Marzano et al., 2018) and 0.2–0.4 Tg of SO2, with initial plume heights reaching 18–21 km (Pardini et al., 2018; Zhu et al., 2018). Lidar and AERONET observations from São Paulo acquired just days after the eruption indicated the presence of both sulfate and ash (Lopes et al., 2019), though the bulk of sulfate formation did not complete until the second half of May (Bègue et al., 2017). During the first 2 weeks, however, the presence of volcanic ash in the plume was confirmed by elevated lidar depolarization ratios (Klekociuk et al., 2020) and by negative 10.06–12.05 µm brightness temperature differences (Prata, 1989) measured by the Imaging Infrared Radiometer, also on board the CALIPSO platform (Fig. S2).
CALIOP detections of stratospheric aerosol layers during this time are primarily along 30∘ ± 10∘ S from Chile to the western coast of Australia (Fig. 15c). Most of these layers were detected between 12 and 22 km (Fig. S1b). The median for stratospheric aerosol layers from Calbuco was slightly lower than Puyehue-Cordón Caulle at 0.31 for the first 2 weeks (Fig. 16). These layers experienced a more rapid decline in depolarization of −0.10 per week. This decline was also observed by the Cloud–Aerosol Transport System (CATS) lidar at 1064 nm (Christian et al., 2020). Ash classifications are the dominant CALIOP subtype identified during this event at 69.4 % (Fig. 15d). Sulfate classifications accounted for 2.7 % of layers detected during these 2 weeks, which is reasonable based on AERONET observations consistent with sulfate over Chile (Lopes et al., 2019). Due in part to the broader distribution of compared to Puyehue-Cordón Caulle, smoke misclassifications occur at a higher frequency of 21.1 %, beginning ∼ 5 d following the eruption. Notably, while the median decreased in days +1 to +5 following the eruption compared to days +6 to +10, the breadth of the distribution remained roughly the same (median absolute deviation (MAD) of 0.057 and 0.053, respectively). It is possible that these smoke misclassifications are mixtures of ash and sulfate in the same air mass measured by CALIOP, resulting in intermediate values between the two aerosol types. However, this cannot be definitively established with CALIOP measurements alone.
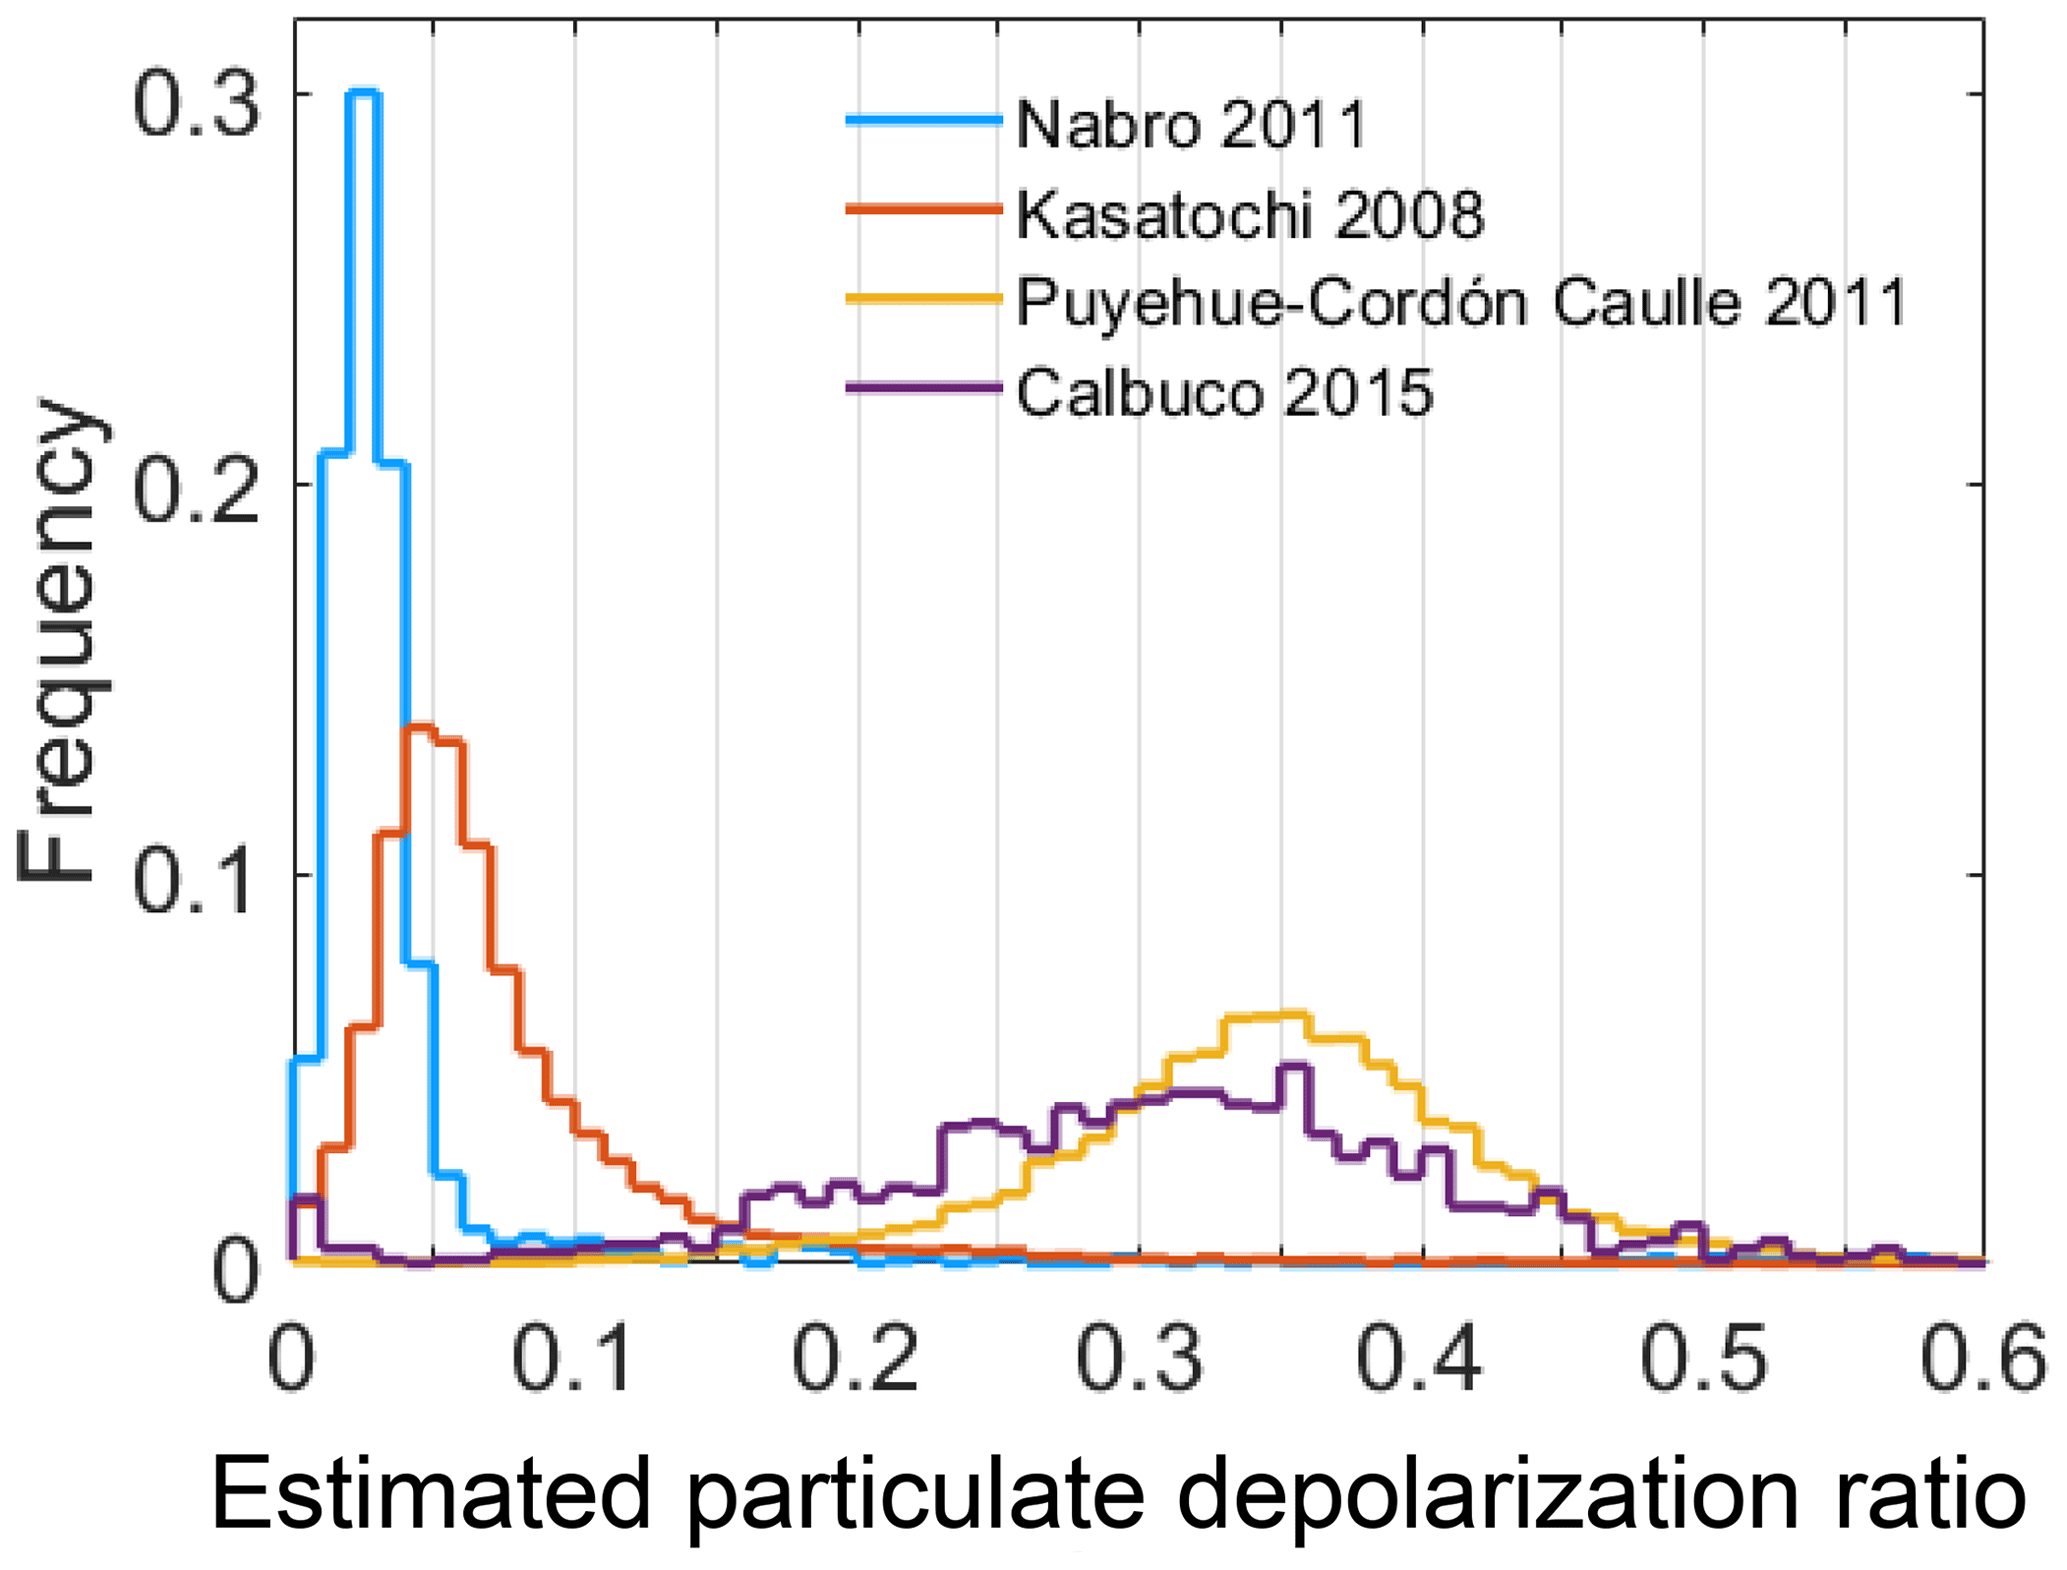
Figure 16Estimated particulate depolarization ratio for all unique stratospheric aerosol layers detected in the first 2 weeks following the first CALIOP observation of the volcanic plume. PSA and layers with |CAD score| < 20 are excluded.
5.2 Sulfate-dominated events
Two major stratospheric sulfate events are selected for assessment. The first is the Nabro stratovolcano in Eritrea (13.37∘ N, 41.7∘ E), which erupted on 12–13 June 2011, injecting an estimated 1.5 Tg of SO2 into the upper troposphere–lower stratosphere (Clarisse et al., 2014). A second injection into the stratosphere on 16 June was inferred based on geostationary and limb-profiling satellite data (Fromm et al., 2014). The SO2 plume initially traveled east and then followed the Asian summer monsoon anticyclonic circulation over northern Africa, the Middle East, and Asia for the first 2 weeks (Fairlie et al., 2014). Sulfate aerosols were then transported to the rest of the Northern Hemisphere over July and August.
We focus on the region shown in Fig. 18a. CALIOP detected the majority of the stratospheric plume between 13 to 19 km during the 2 weeks following the initial eruption (Fig. S3a). The median for these layers is the smallest of all volcanic events evaluated at 0.021 (Fig. 16), consistent with various ground-based lidars that also measured small depolarization from the Nabro plume (Zhuang and Yi, 2016; Noh et al., 2017). This is indicative of sulfate aerosols. Due to the low , CALIOP classifies 82.6 % of these layers as sulfate. Smoke and ash classifications account for 5.4 % and 1.7 %, respectively, consistent with observations suggesting only a small ash component to the eruption (Clarisse et al., 2014).
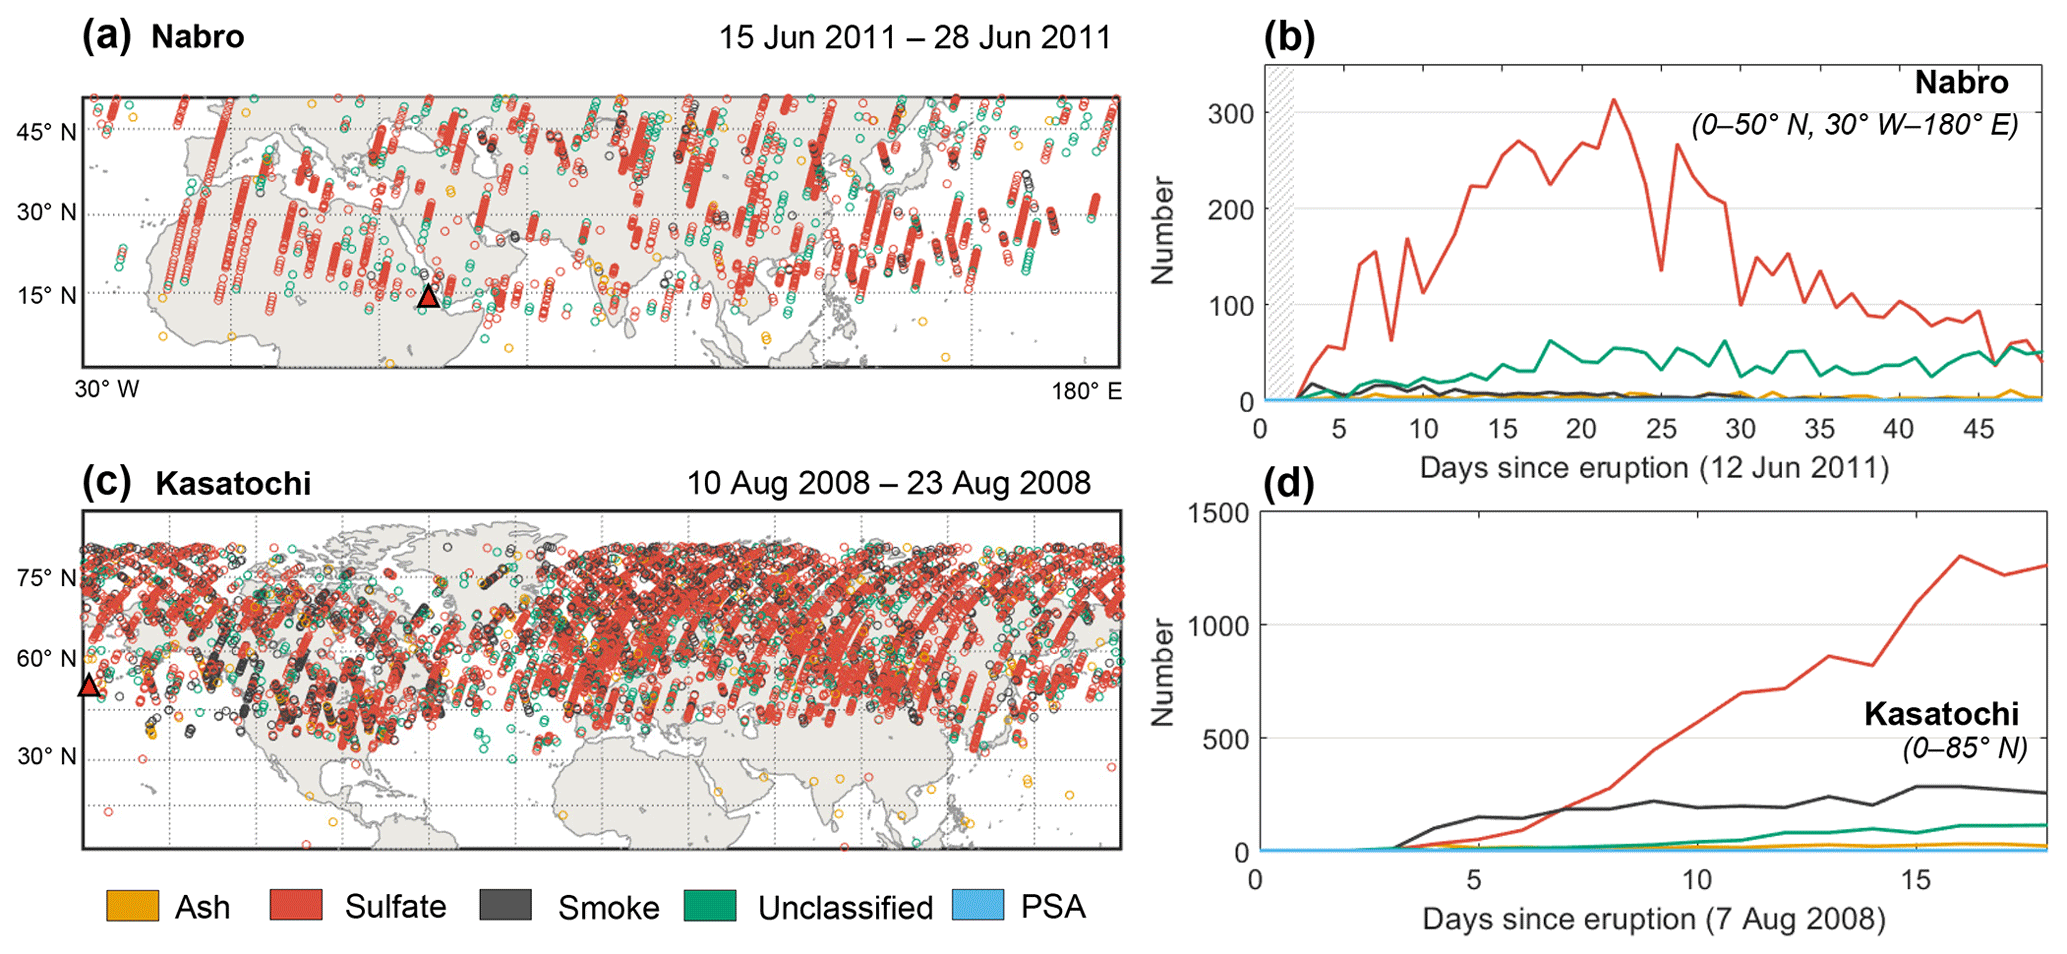
Figure 18Same as Fig. 15 but for sulfate-dominated events.
The second sulfate-dominated event we evaluate had a slightly larger ash component. Kasatochi, an island volcano along the Aleutian arc (52.17∘ N, 175.51∘ W), erupted on 7–9 August 2008, injecting SO2 and ash up to ∼ 15 km in altitude (Waythomas et al., 2010). In subsequent days, signatures of volcanic ash and SO2 were observed spreading eastward over the Pacific by MODIS, AVHRR, AIRS, and OMI (Corradini et al., 2010; Krotkov et al., 2010). An analysis of AIRS measurements by Prata et al. (2010) suggests that the total ash mass injected was approximately 25 % smaller than the mass of SO2. Based on passive imager retrievals and modeling analyses, the greatest fraction of this ash is believed to have settled out of the plume during the first week following the eruption (Martinsson et al., 2009; Guffanti et al., 2010; Langmann et al., 2010). The most long-lasting component of the emission was SO2 and subsequent sulfate aerosols that persisted for over two months. At the time, it was the largest injection of SO2 into the atmosphere in over 17 years, with SO2 mass estimates of 1.2–1.7 Tg (Kristiansen et al., 2010; Prata et al., 2010).
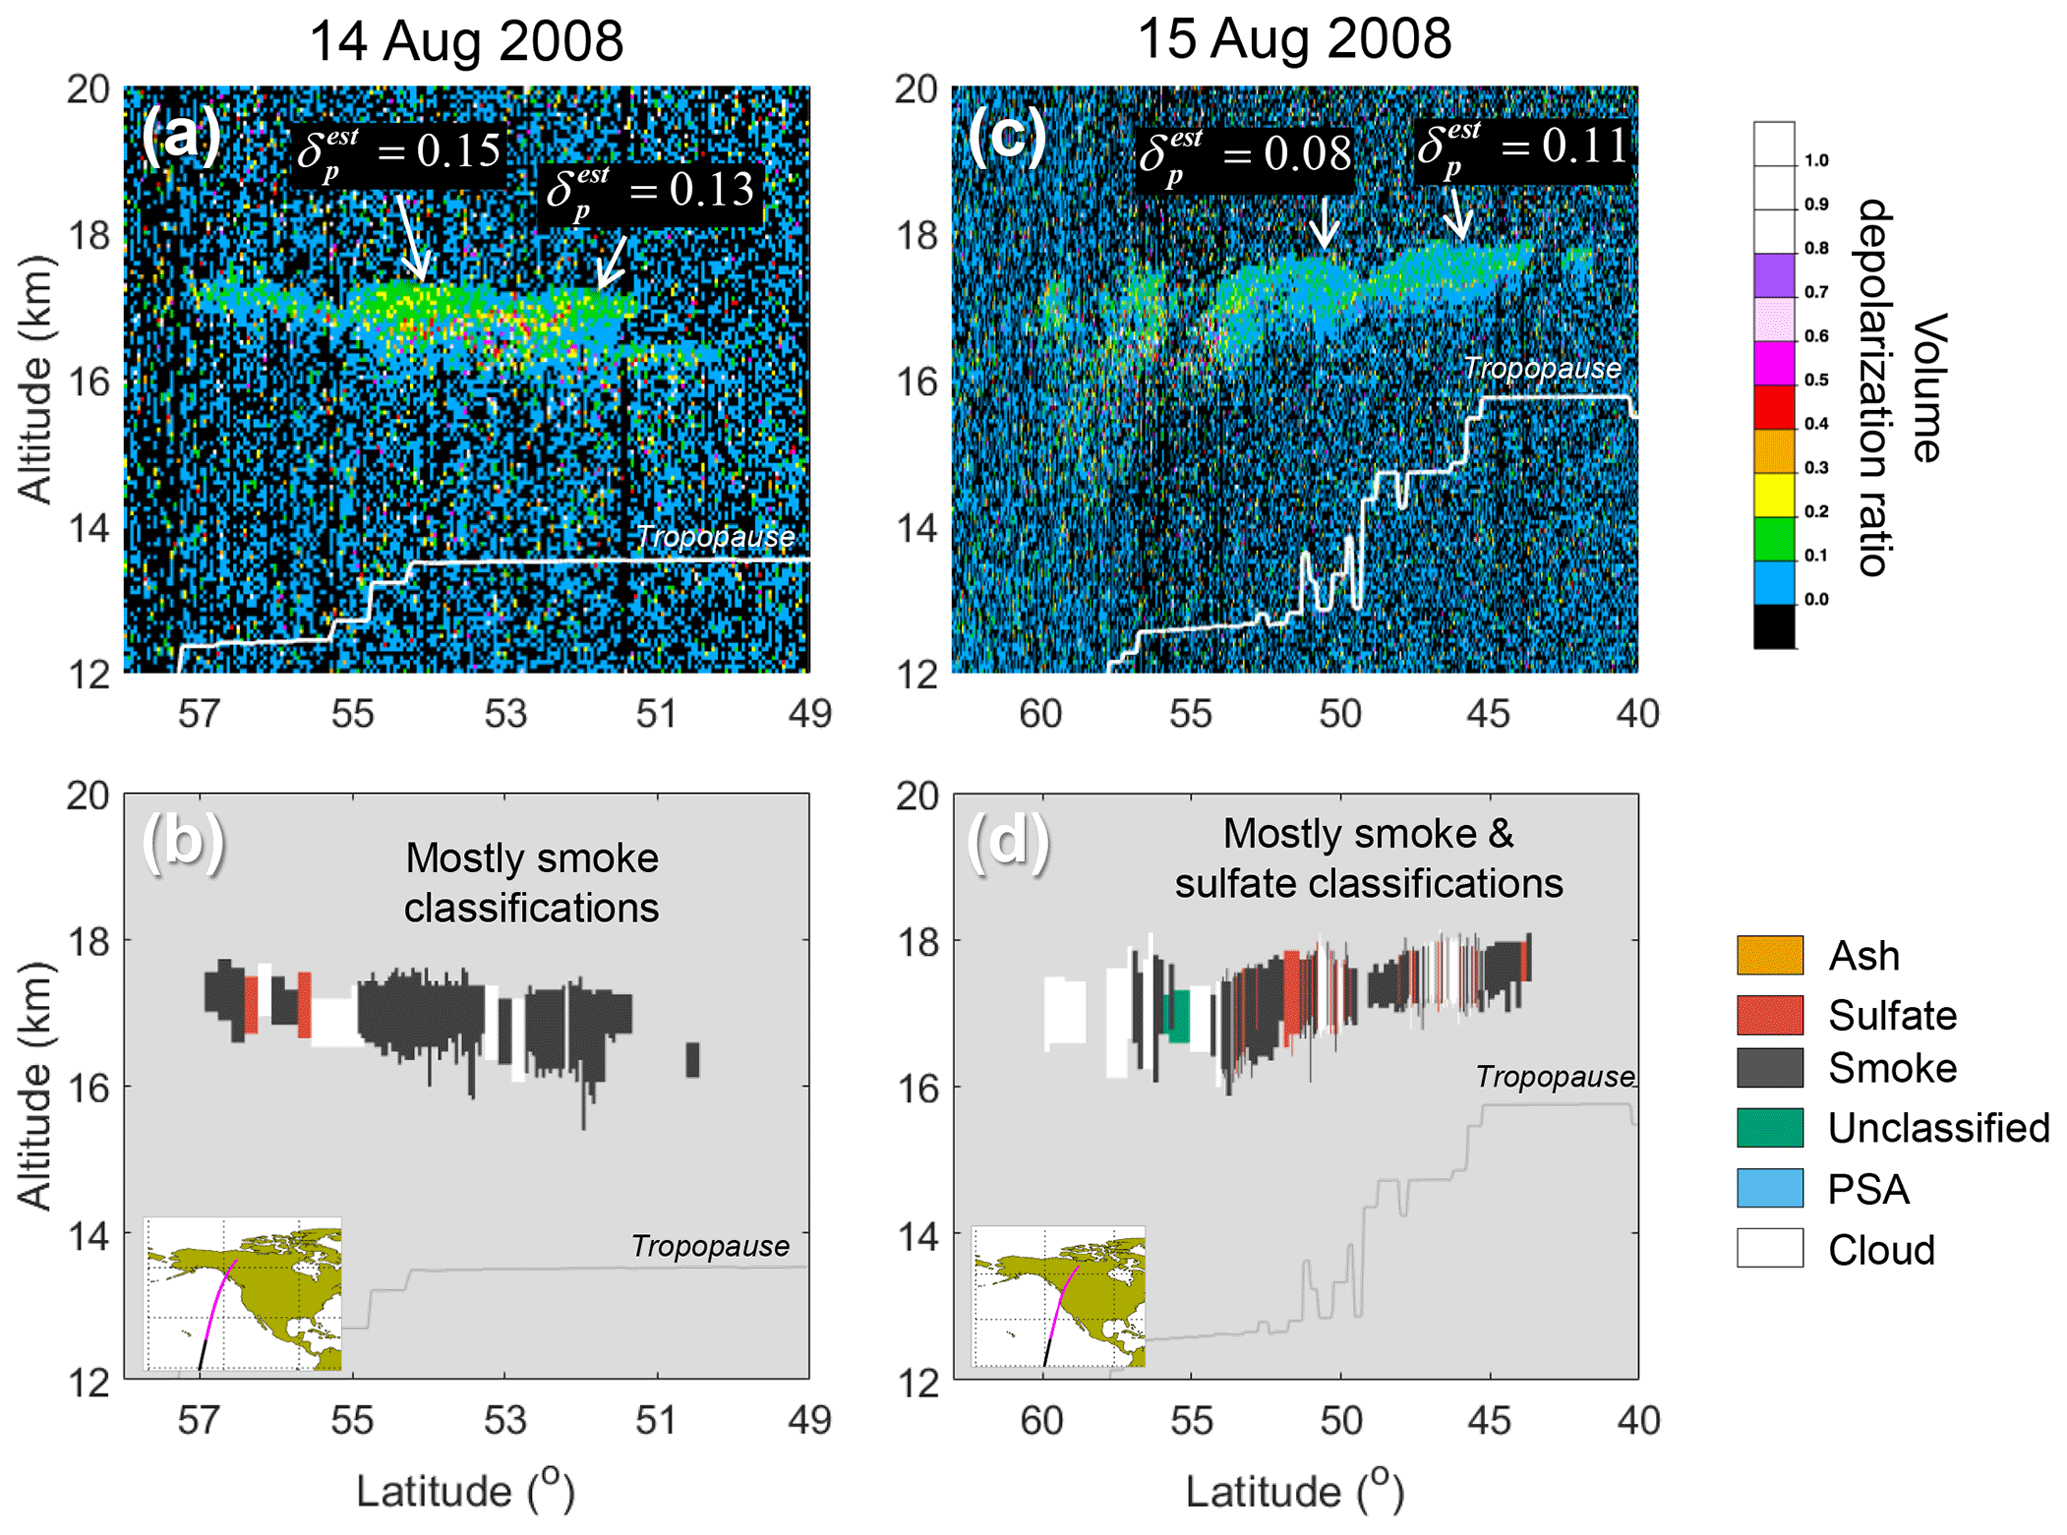
Figure 19Possible ash–sulfate mixtures from the 2008 Kasatochi eruption; 532 nm volume depolarization ratio and V4.5 aerosol type classifications from the level 2 aerosol profile product on (a, b) 14 August 2008 at ∼11:30 UTC and (c, d) 15 August 2008 at ∼10:30 UTC. Estimated particulate depolarization ratios for select layers are indicated by call-outs in upper panels. Inset maps show CALIOP ground track.
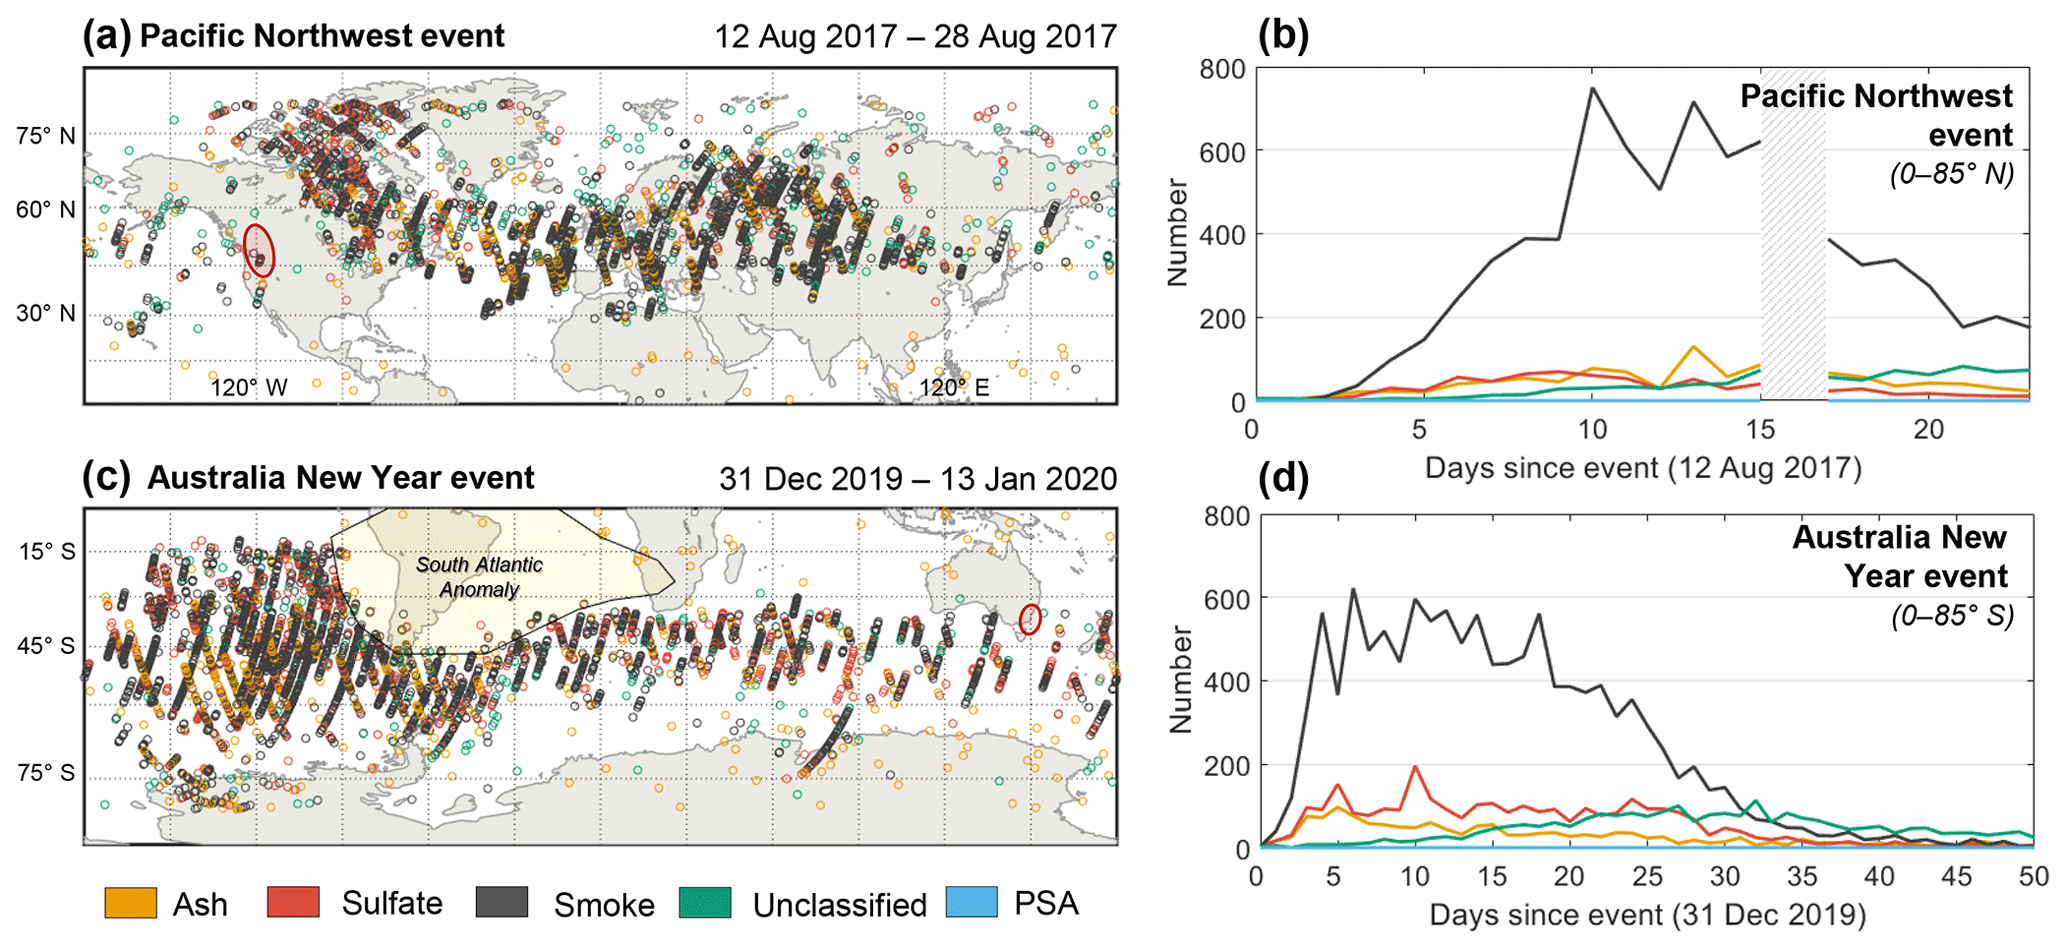
Figure 20Same as Fig. 15 but for smoke-dominated events. PyroCb locations are denoted by red ovals. Approximate area affected by SAA is denoted by the yellow polygon.
The majority of stratospheric aerosol layers detected by CALIOP in the 2 weeks following its first detection of the plume on 10 August were above 30∘ N (Fig. 18c) at altitudes of 9–14 km (Fig. S3b). The median of layers in this altitude range is around 0.052, leading to a sulfate classification rate of 67.6 %. The smoke and ash classification rates are 24.4 % and 5.8 %, respectively. A secondary peak with a smaller number of layers around 16 to 18 km was also detected (Fig. S3b). These layers have a somewhat higher median of ∼ 0.062, yielding sulfate, smoke, and ash classification rates of 52.3 %, 37.8 %, and 3.3 %, respectively. Figure 19 shows two examples of these higher-altitude plumes over the eastern Pacific on 14 and 15 August, having median values of 0.161 and 0.109. Due to these elevated depolarization ratios, the dominant classification was smoke, but it is likely that these are mixtures of ash and sulfate, with the ash component being larger in the 14 August observation. All told, the time series of stratospheric aerosol classification shows an appearance of smoke classifications coincident in time with the appearance of sulfate classifications (Fig. 18d). The altitudes of layers assigned these classifications are also the same (Fig. S3b), suggesting that these plumes are from the same event. Taken together with a broader distribution compared to the 2011 Nabro eruption (Fig. 16), these smoke classifications could indicate mixtures of ash and sulfate.
5.3 Smoke-dominated events
In recent years, two major wildfire events demonstrated the massive influence pyroCb activity can have on stratospheric aerosol loading. On 12 August 2017, a series of pyroCbs occurred in northern Washington State, United States, and in British Columbia, Canada. Dubbed the “Pacific Northwest (PNW) event”, Peterson et al. (2018) estimated that 0.1–0.3 Tg of aerosol mass was injected into the stratosphere on this day. CALIPSO initially measured the plume at 12–14 km on 14 August over northeastern Canada. Several lidar systems over Europe detected the plume over Europe by as early as 10 d later at altitudes spanning 15 to 20 km (Ansmann et al., 2018; Haarig et al., 2018; Khaykin et al., 2018; Hu et al., 2019). Analysis of CALIPSO observations by Khaykin et al. (2018) showed that the smoke plume had circumnavigated the globe by 30 August, affecting the stratosphere in the entire Northern Hemisphere above 30∘ N.
During the first 2 weeks of the PNW event, the CALIOP median was 0.157 for all stratospheric aerosol layers detected in the Northern Hemisphere. Consequently, for night and day, 76.6 % were classified as smoke, with 9.1 % and 10.4 % misclassified as sulfate and ash, respectively. During this timeframe, these stratospheric smoke layers were primarily detected over northeast Canada, across the north Atlantic, and well into northern Asia (Fig. 20a) at altitudes of 9 to 19 km (Fig. S4a). The time series of smoke layers classification shows a maximum 10–15 d after the initial event (Fig. 20b). Ash misclassifications primarily occur in daytime orbits, where additional solar noise broadens the variability of , more than doubling the MAD (Fig. 21a). As a result, 22.1 % of ash misclassifications occur during the day compared to 1.8 % at night. Smoke classifications fare much better at night at a frequency of 90.1 %.
A second major wildfire event occurred just 2.5 years later in southeastern Australia. From 29 December 2019–4 January 2020, a series of massive pyroCbs injected smoke as high as 16 km (Kablick et al., 2020). Dubbed the 2019–2020 Australian New Year (ANY) event, preliminary estimates of the injected aerosol mass are even larger than the PNW event, ranging from 0.2–0.9 Tg (Peterson et al., 2019; Khaykin et al., 2020). The smoke plumes primarily traveled eastward during the first month, ultimately ascending to heights of over 30 km in February as the smoke absorbed solar radiation, heating the surrounding air and affecting atmospheric dynamics locally (Allen et al., 2020; Kablick et al., 2020). Depolarization of the pyroCb plume from the ANY event was also elevated relative to tropospheric smoke. A Raman lidar in Punta Arenas, Chile, measured 532 nm depolarization ratios of 0.14–0.22 during January 2020 (Ohneiser et al., 2020), with indications of an increase in depolarization with time (Christian et al., 2020).
During the first 2 weeks of January 2020, CALIOP detected stratospheric smoke layers primarily over the southern Pacific Ocean, yet spanning all longitudes (Fig. 20c), at altitudes of 11 to 22 km (Fig. S4b). Median was 0.125 for stratospheric aerosol layers in the Southern Hemisphere, which is somewhat smaller than the Raman lidar measurements in Chile. However, the distributions of are quite broad, particularly during daytime (Fig. 21b). Owing to the elevated values of , the night-and-day stratospheric smoke classification frequency was 73.1 %, with misclassification frequencies of 15.5 % and 9.2 % for sulfate and ash, respectively. As with the PNW event, the daytime distribution was broader compared to that of the nighttime, with a strong skew toward larger values. Consequently, ash misclassifications for the ANY event are more frequent in the daytime at a rate of 26.9 % compared to 0.6 % at night. The most influential factor driving the broader daytime distribution is sunlight reflecting from high-albedo targets at lower altitudes, such as stratocumulus in the planetary boundary layer and snow-covered surfaces (e.g., Antarctica in the ANY event). This reflected sunlight enhances noise throughout the profile overhead, thereby increasing the variability of depolarization ratio measurements. The nighttime distributions of in Fig. 21 are expected to more closely resemble natural variability, the cause of which is an active area of research (Haarig et al., 2018).
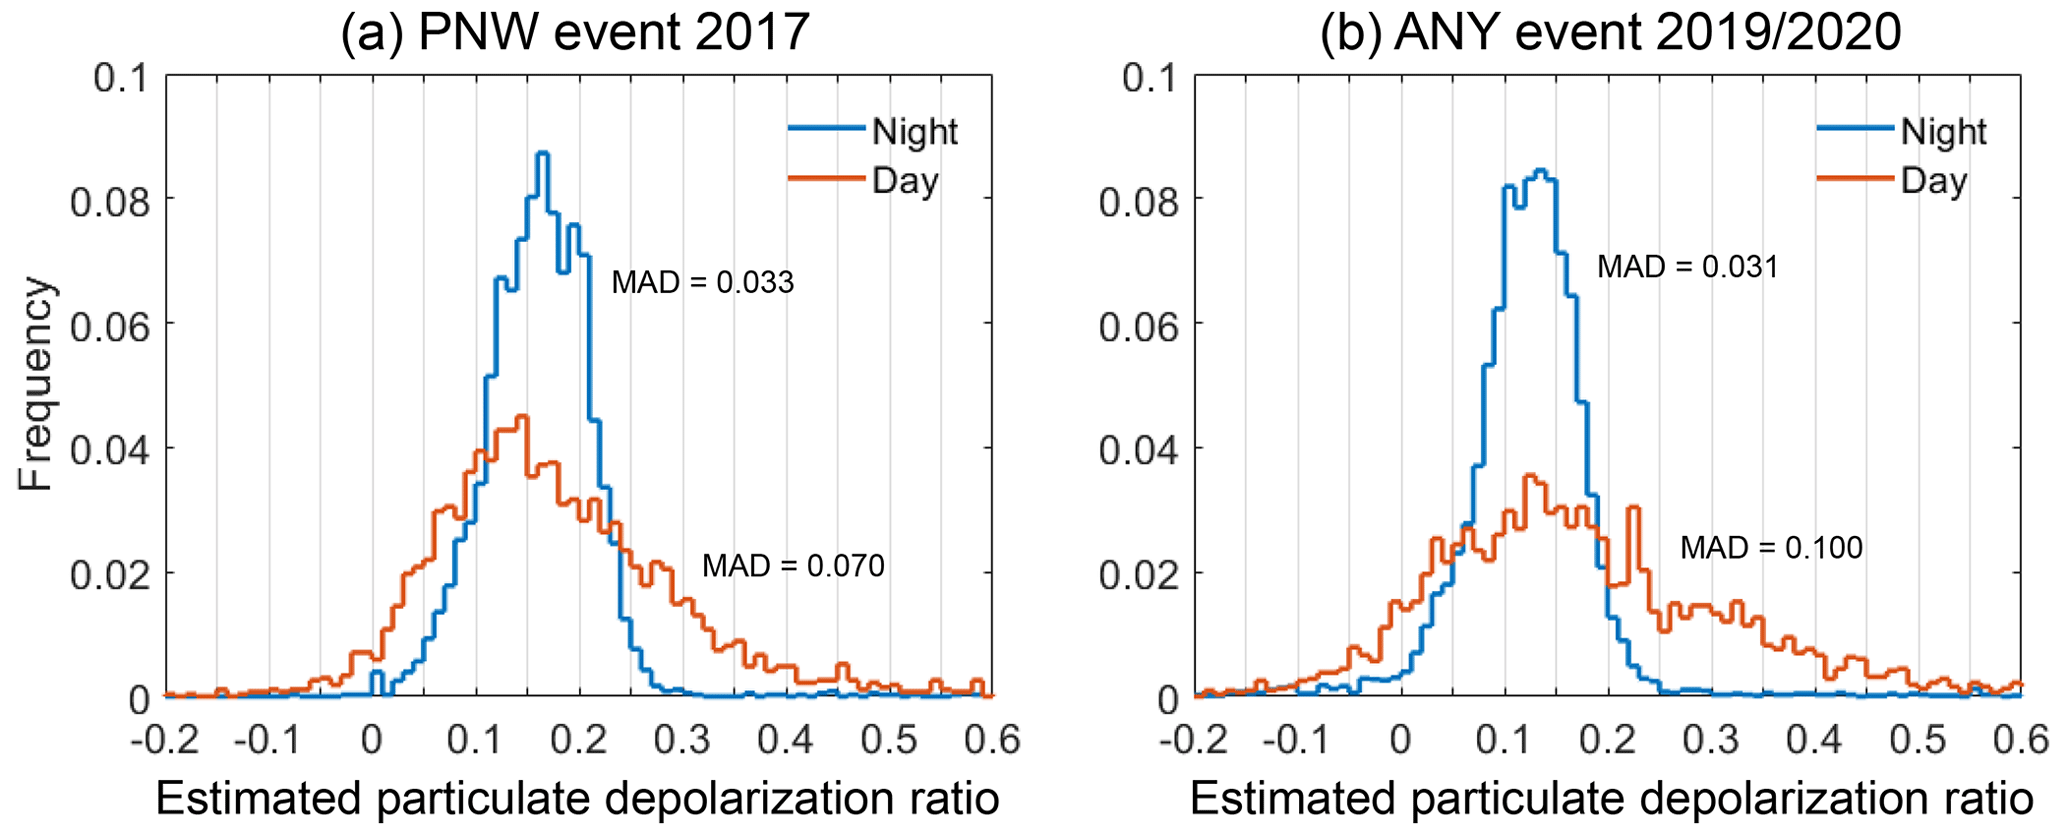
Figure 21Nighttime- and daytime-estimated particulate depolarization ratio distributions for all stratospheric aerosol layers detected during the first 2 weeks after (a) the PNW event (Northern Hemisphere) and (b) the ANY event (Southern Hemisphere). Low-γ′, PSA, and layers with |CAD score| < 20 are excluded.

Figure 22PyroCb smoke plume from ANY event, 31 January 2020 at ∼06:30 UTC: (a) 532 nm total attenuated backscatter, (b) 532 nm volume depolarization ratio, and (c) V4.5 aerosol subtype and cloud classification from the level 2 aerosol profile product. Inset map shows CALIOP ground track.
Returning to the geographic distribution of smoke from the ANY event, the map in Fig. 20c shows that, during the first 2 weeks, most smoke layers were detected over the southern Pacific Ocean as far north as the Equator, though most were detected south of 30∘ S at all longitudes. Note that the majority of layers detected in the SAA are excluded from our analysis by the minimum laser energy requirement (Sect. 2) we impose to avoid the detrimental influence of low laser energy shots that have been prevalent in this region since mid-2016 (CALIPSO Data Advisory Page, 2018). The maximum number of smoke classifications occurs during the first 4 weeks, with an increase in unclassified low-γ′ layers (Fig. 20d). These low-γ′ layers become the dominant classification in early February 2020. However, the depolarization ratios remained notable. Figure 22 shows the coherent “bubble” of smoke southwest of the southern tip of Chile on 31 January that was examined by Allen et al. (2020) and Khaykin et al. (2020). They found that this bubble rose to 35 km in subsequent months due to dynamics associated with absorption of solar radiation. The CALIOP CAD algorithm struggled with this scene, classifying much of the feature as ice cloud due to the elevated depolarization and spread in moderate color ratio values (median ± MAD of 0.44 ± 0.23). The CAD probability density functions have a fair amount of overlap in the color ratio dimension for features with elevated depolarization ratios at high altitudes (Liu et al., 2019), thereby contributing to these CAD errors. However, most of the layers classified as aerosol in V4.5 are correctly assigned the smoke subtype (65 %), whereas ash was the dominant subtype assigned in V4.2, with 8 % smoke.
5.4 Unclassified layers and false-positive feature detections
For features identified as stratospheric aerosols by the CALIOP CAD algorithm, the frequency of unclassified layers is bound by the low-γ′ threshold at the high end and by the feature detection sensitivity at the low end. Regardless of the actual aerosol type, all stratospheric aerosol layers can be assigned this classification because eventually, due to sedimentation and diffusion, their concentrations in the atmosphere will decline until they are no longer detectable by the CALIOP feature finder. By design, the lowest-quartile metric causes 25 % of stratospheric aerosol layers in the CALIOP data record to be unclassified, on average (Sect. 4.4). Though the number of unclassified stratospheric aerosols peaks legitimately during major events, there is a “background” number reported during quiescent periods associated with false layer detections (Fig. 23). As a first-order estimate, during the year 2013 when there were no major stratospheric aerosol injections, suspected false-positive feature detections (any layer detected above 20 km, excluding PSA) occurred in 0.4 % of profiles at night and in 1 % of profiles during the day, globally. These layers are primarily located inside the SAA. Outside the SAA, a relatively small number of layers are randomly distributed over the globe (Fig. S5). Because they do not occur within specific latitude bands, as legitimate layers associated with specific events would, they are likely due to false layer detections caused by radiation-induced current spikes in the 532 nm channel detectors (Hunt et al., 2009; e.g., Fig. S6) or enhanced background noise from sunlight reflecting off of underlying clouds in the daytime (e.g., Fig. S7). The aerosol subtypes of these false layer detections at night are 54 % ash, 30 % sulfate, 5 % smoke, and 11 % unclassified. During the day, these frequencies change to 84 % ash, <1 % sulfate, 3 % smoke, and 13 % unclassified. The propensity for ash classification is due to excess solar background noise broadening the distribution of depolarization values to create artificially high values and from cases of radiation-induced current spikes, which only affect the 532 nm perpendicular channel and not the parallel channel. False layer detections above 20 km have characteristically low CAD scores: 97 % have |CAD| < 20, indicating no confidence in cloud–aerosol discrimination accuracy, which is expected, since these layers are caused by noise excursions and, being neither aerosol nor cloud, receive a low CAD score. They can be readily rejected using the CAD score, as we have done throughout this paper.
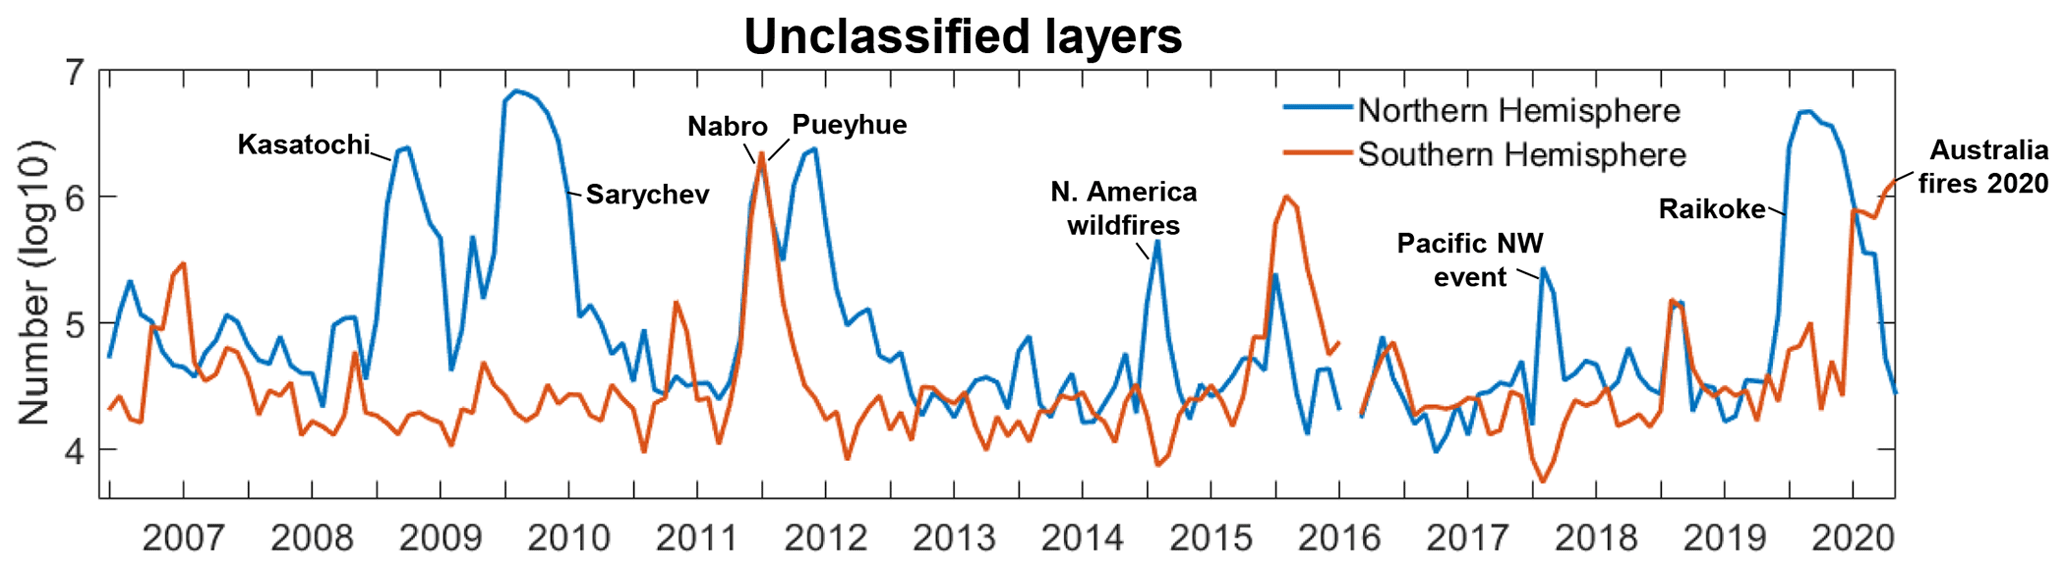
Figure 23Number of unclassified layers in the Northern Hemisphere (blue) and Southern Hemisphere (red), excluding the SAA and layers with |CAD score| < 20. Computed using V4.2 integrated attenuated backscatter with V4.5 low-γ′ thresholds, so the figure serves as a close approximation to V4.5.
The stratospheric aerosol subtyping algorithm has been updated for the V4.5 release of the CALIOP level 2 data products. Following the previous V4.2 release, it became clear that several aspects of the newly introduced stratospheric aerosol subtyping algorithm needed further refinement. This paper describes the changes the CALIPSO project has implemented to improve aerosol subtyping in the stratosphere and characterized the performance of the refined algorithm based on well-documented events. The changes include the following: removing the use of integrated attenuated backscatter color ratio so that the algorithm now discriminates between volcanic ash, sulfate, and smoke solely based on depolarization; increasing the depolarization threshold to discriminate between volcanic ash and smoke; separating the V4.2 sulfate/other subtype into sulfate and unclassified subtypes; lowering the low-γ′ threshold for identifying weakly scattering, unclassified layers; and increasing the 532 nm lidar ratio for volcanic ash to a value consistent with the current state of knowledge. As a consequence, these changes improve the discrimination capability between volcanic ash and smoke by better accounting for the depolarizing nature of smoke often observed for layers associated with pyroCb activity. Sulfate classifications now solely identify layers that have low depolarization ratios, a characteristic of sulfate aerosols. Our analysis also postulates that volcanic layers classified as smoke can indicate mixtures of sulfate and ash. Finally, weakly backscattering features have been relegated to a new unclassified subtype for which the signal-to-noise ratio is considered insufficient to reliably discern the true type.
The performance of the revised algorithm is very good for volcanic ash layers, with 84 % correctly classified during the ash-dominated Puyehue-Cordón Caulle eruption of 2011. This is no surprise, given the strongly depolarizing nature of volcanic ash. Sulfate classifications are also dominant for events that have a strong sulfate component. However, the interpretation of the CALIOP stratospheric aerosol classification requires some extra care for sulfate-dominated scenes with some ash components. Sulfate–ash mixtures are misclassified as smoke for nearly one-third of these layers, and there exists the possibility of legitimate smoke layers being misclassified as sulfate due to the overlap in the depolarization ratio distributions for these two types (a combination of natural variability and measurement noise). Smoke classification performance for events dominated by pyroCb activity was also very good, with most layers classified as smoke. There remains a moderate number of smoke layers that are misclassified as sulfate and ash. In particular, misclassification frequencies of smoke as volcanic ash are substantially higher during the day than at night (∼ 27 % vs. 1 %, respectively) due to reflected sunlight from lower-altitude high-albedo features that adds substantial noise to the column, broadening the distribution of depolarization ratios. Additionally, any smoke transported from the troposphere into the UTLS by self-lofting rather than pyroCb activity will likely be misclassified as sulfate due to their similarly low values of depolarization. Researchers should be aware of these potential artifacts when performing automated analyses with CALIOP V4.5 level 2 data.
It is important to recognize that, although the aerosol subtyping algorithm performs very well for ash, sulfate, and depolarizing smoke in the stratosphere, aerosol subtyping is less satisfactory for these same aerosol types below the tropopause, largely because no attempt is made to identify them in the troposphere. There, volcanic ash will inexorably be misclassified as dust, depolarizing smoke will mostly be misclassified as polluted dust, and volcanic sulfate will be misclassified as elevated smoke (Kim et al., 2018). These misclassifications occur because it is difficult to discriminate among these aerosol types in a robust, automated manner given the limited number of CALIOP observables. The critical information for the CALIOP stratospheric aerosol subtyping algorithm is the high altitude of the tropopause, which most often rules out the possibility of all but a few subtypes. More sophisticated instrumentation will improve discrimination capability in the troposphere – for example, high-spectral-resolution lidar with depolarization sensitivity at 355, 532, and 1064 nm (e.g., as in Burton et al., 2015) or combined lidar plus passive instrument retrievals. Additionally, combining SO2 and CO measurements from other sensors could help differentiate between ash–sulfate mixtures and smoke. Given the aviation hazards posed by volcanic ash and the climate implications of sulfate and stratospheric smoke injections, space-based lidar retrievals stand to provide valuable vertically resolved information to disaster response agencies and climate modelers. Our hope is that this work provides a meaningful steppingstone toward more sophisticated solutions in future missions.
CALIOP data are available through the NASA Langley Research Center Atmospheric Science Data Center (ASDC), https://asdc.larc.nasa.gov/ (last access: 7 January 2022): V4.1 level 1B (https://doi.org/10.5067/CALIOP/CALIPSO/LID_L1-STANDARD-V4-10, NASA/LARC/SD/ASDC, 2016b); V4.2 level 2 aerosol layer, aerosol profile, and vertical feature mask products (https://doi.org/10.5067/CALIOP/CALIPSO/LID_L2_05KMALAY-STANDARD-V4-20, https://doi.org/10.5067/CALIOP/CALIPSO/LID_L2_05KMAPRO-STANDARD-V4-20, https://doi.org/10.5067/CALIOP/CALIPSO/LID_L2_VFM-STANDARD-V4-20, NASA/LARC/SD/ASDC, 2018a, b, c); V4.5 level 1B (https://doi.org/10.5067/CALIOP/CALIPSO/CAL_LID_L1-Standard-V4-51, NASA/LARC/SD/ASDC, 2022). The V4.5 level 2 aerosol layer, aerosol profile, and vertical feature mask products will be released in early 2023 and made available through the ASDC.
The supplement related to this article is available online at: https://doi.org/10.5194/amt-16-745-2023-supplement.
The CALIPSO stratospheric aerosol subtyping algorithm described in this paper was conceived by JT, MV, JK, AO, and DW, with contributions from the CALIPSO mission team, JV, MP, and Lamont Poole. Formal analysis and visualizations were prepared by JT, except for Sect. 4.5, which was prepared by JK. Writing was led by JT, with extensive contributions by MV, JK, MK, and JV. All V4.5 pre-release data were generated by BG. CALIPSO V4.5 level 2 software modifications for the stratospheric aerosol subtyping algorithm were performed by BM with support from the CALIPSO Data Management Team.
The contact author has declared that none of the authors has any competing interests.
Publisher’s note: Copernicus Publications remains neutral with regard to jurisdictional claims in published maps and institutional affiliations.
Volcano geographic locations were acquired from the Smithsonian Institution National Museum of Natural History Global Volcanism Program https://volcano.si.edu/ (last access: 2 February 2023). We sincerely thank Sharon Burton and the anonymous referees for their thorough assessment, which helped improve the clarity of the paper.
This paper was edited by Daniel Perez-Ramirez and reviewed by Sharon Burton and two anonymous referees.
Allen, D. R., Fromm, M. D., Kablick III, G. P., and Nedoluha, G. E.: Smoke with Induced Rotation and Lofting (SWIRL) in the Stratosphere, J. Atmos. Sci., 77, 4297–4316, https://doi.org/10.1175/JAS-D-20-0131.1, 2020.
Andersson, S. M., Martinsson, B. G., Friberg, J., Brenninkmeijer, C. A. M., Rauthe-Schöch, A., Hermann, M., van Velthoven, P. F. J., and Zahn, A.: Composition and evolution of volcanic aerosol from eruptions of Kasatochi, Sarychev and Eyjafjallajökull in 2008–2010 based on CARIBIC observations, Atmos. Chem. Phys., 13, 1781–1796, https://doi.org/10.5194/acp-13-1781-2013, 2013.
Ansmann, A., Tesche, M., Groß, S., Freudenthaler, V., Seifert, P., Hiebsch, A., Schmidt, J., Wandinger, U., Mattis, I., Müller, D., and Wiegner, M.: The 16 April 2010 major volcanic ash plume over Central Europe: EARLINET lidar and AERONET photometer observations at Leipzig and Munich, Germany, Geophys. Res. Lett., 37, L13810, https://doi.org/10.1029/2010GL043809, 2010.
Ansmann, A., Baars, H., Chudnovsky, A., Mattis, I., Veselovskii, I., Haarig, M., Seifert, P., Engelmann, R., and Wandinger, U.: Extreme levels of Canadian wildfire smoke in the stratosphere over central Europe on 21–22 August 2017, Atmos. Chem. Phys., 18, 11831–11845, https://doi.org/10.5194/acp-18-11831-2018, 2018.
Ansmann, A., Ohneiser, K., Chudnovsky, A., Baars, H., and Engelmann, R.: CALIPSO aerosol-typing scheme misclassified stratospheric fire smoke: case study from the 2019 Siberian wildfire season, Front. Environ. Sci., 21, 769852, https://doi.org/10.3389/fenvs.2021.769852, 2021.
Bègue, N., Vignelles, D., Berthet, G., Portafaix, T., Payen, G., Jégou, F., Benchérif, H., Jumelet, J., Vernier, J.-P., Lurton, T., Renard, J.-B., Clarisse, L., Duverger, V., Posny, F., Metzger, J.-M., and Godin-Beekmann, S.: Long-range transport of stratospheric aerosols in the Southern Hemisphere following the 2015 Calbuco eruption, Atmos. Chem. Phys., 17, 15019–15036, https://doi.org/10.5194/acp-17-15019-2017, 2017.
Bignami, C., Corradini, S., Merucci, L., de Michele, M., Raucoules, D., de Astis, G., Stramondo, S., and Piedra, J.: Multisensor satellite monitoring of the 2011 Puyehue-Cordón Caulle eruption, IEEE J. Sel. Top. Appl. Earth Obs. Remote Sens., 7, 2786–2796, https://doi.org/10.1109/JSTARS.2014.2320638, 2014.
Boone, C., Bernath, P. F., Labelle, K., and Crouse, J.: Stratospheric Aerosol Composition Observed by the Atmospheric Chemistry Experiment Following the 2019 Raikoke Eruption, J. Geophys. Res.-Atmos., 127, e2022JD036600, https://doi.org/10.1029/2022JD036600, 2022.
Burton, S. P., Hair, J. W., Kahnert, M., Ferrare, R. A., Hostetler, C. A., Cook, A. L., Harper, D. B., Berkoff, T. A., Seaman, S. T., Collins, J. E., Fenn, M. A., and Rogers, R. R.: Observations of the spectral dependence of linear particle depolarization ratio of aerosols using NASA Langley airborne High Spectral Resolution Lidar, Atmos. Chem. Phys., 15, 13453–13473, https://doi.org/10.5194/acp-15-13453-2015, 2015.
Cairo, F., Di Donfrancesco, G., Adriani, A., Pulvirenti, L., and Fierli, F.: Comparison of various linear depolarization parameters measured by lidar, Appl. Opt., 38, 4425–4432, https://doi.org/10.1364/AO.38.004425, 1999.
CALIPSO Data Advisory Page: https://www-calipso.larc.nasa.gov/resources/calipso_users_guide/advisory.php (last access: 3 October 2022), 2018.
CALIPSO Lidar Level 1 V4.51 Data Quality Statement: https://www-calipso.larc.nasa.gov/resources/calipso_users_guide/qs/cal_lid_l1_v4-51_qs.php, last access: 3 October 2022.
Christian, K., Yorks, J., and Das, S.: Differences in the Evolution of Pyrocumulonimbus and Volcanic Stratospheric Plumes as Observed by CATS and CALIOP Space-Based Lidars, Atmosphere, 11, 1035, https://doi.org/10.3390/atmos11101035, 2020.
Clarisse, L., Coheur, P.-F., Theys, N., Hurtmans, D., and Clerbaux, C.: The 2011 Nabro eruption, a SO2 plume height analysis using IASI measurements, Atmos. Chem. Phys., 14, 3095–3111, https://doi.org/10.5194/acp-14-3095-2014, 2014.
Corradini, S., Merucci, L., Prata, A. J., and Piscini, A.: Volcanic ash and SO2 in the 2008 Kasatochi eruption: Retrievals comparison from different IR satellite sensors, J. Geophys. Res., 115, D00L21, https://doi.org/10.1029/2009JD013634, 2010.
de Laat, A. T. J., Stein Zweers, D. C., Boers, R., and Tuinder, O. N. E.: A solar escalator: Observational evidence of the self-lifting of smoke and aerosols by absorption of solar radiation in the February 2009 Australian Black Saturday plume, J. Geophys. Res., 117, D04204, https://doi.org/10.1029/2011JD017016, 2012.
Dirksen, R. J., Boersma, K. F., de Laat, A. T. J., Stammes, P., van der Werf, G. R., Val Martin, M., and Kelder, H. M.: An aerosol boomerang: rapid around-the-world transport of smoke from the December 2006 Australian forest fires observed from space, J. Geophys. Res., 114, D21201, https://doi.org/10.1029/2009JD012360, 2009.
Fairlie, T. D., Vernier, J.-P., Natarajan, M., and Bedka, K. M.: Dispersion of the Nabro volcanic plume and its relation to the Asian summer monsoon, Atmos. Chem. Phys., 14, 7045–7057, https://doi.org/10.5194/acp-14-7045-2014, 2014.
Fromm, M., Lindsey, D. T., Servranckx, R., Yue, G., Trickl, T., Sica, R., Doucet, P., and Godin-Beekmann, S. E.: The untold story of pyrocumulonimbus, B. Am. Meteorol. Soc., 91, 1193–1209, https://doi.org/10.1175/2010bams3004.1, 2010.
Fromm, M., Kablick III, G., Nedoluha, G., Carboni, E., Grainger, R., Campbell, J., and Lewis, J.: Correcting the record of volcanic stratospheric aerosol impact: Nabro and Sarychev Peak, J. Geophys. Res.-Atmos., 119, 10343–10364, https://doi.org/10.1002/2014JD021507, 2014.
Fromm, M., Peterson D., and Di Girolamo, L.: The primary convective pathway for observed wildfire emissions in the upper troposphere and lower stratosphere: a targeted reinterpretation, J. Geophys. Res.-Atmos., 124, 13254–13272, https://doi.org/10.1029/2019JD031006, 2019.
Gelaro, R., McCarty, W., Suarez, M. J., Todling, R., Molod, A., Takacs, L., Randles, C. A., Darmenov, A., Bosilovich, M. G., Reichle, R., Wargan, K., Coy, L., Cullather, R., Draper, C., Akella, S., Buchard, V., Conaty, A., Da Silva, A. M., Gu, W., Kim, G.-K., Koster, R., Lucchesi, R., Markova, D., Nielsen, J. E., Partyka, G., Pawson, S., Putman, W., Rienecker, M., Schubert, S. C., Sienkiewicz, M., and Zhao, B.: The Modern-Era Retrospective Analysis for Research and Applications, Version 2 (MERRA-2), J. Climate, 30, 5419–5454, https://doi.org/10.1175/JCLI-D-16-0758.1, 2017.
Gialitaki, A., Tsekeri, A., Amiridis, V., Ceolato, R., Paulien, L., Kampouri, A., Gkikas, A., Solomos, S., Marinou, E., Haarig, M., Baars, H., Ansmann, A., Lapyonok, T., Lopatin, A., Dubovik, O., Groß, S., Wirth, M., Tsichla, M., Tsikoudi, I., and Balis, D.: Is the near-spherical shape the “new black” for smoke?, Atmos. Chem. Phys., 20, 14005–14021, https://doi.org/10.5194/acp-20-14005-2020, 2020.
Groß, S., Freudenthaler, V., Wiegner, M., Gasteiger, J., Geiß, A., and Schnell, F.: Dual-wavelength linear depolarization ratio of volcanic aerosols: Lidar measurements of the Eyjafjallajökull plume over Maisach, Germany, Atmos. Environ., 48, 85–96, https://doi.org/10.1016/j.atmosenv.2011.06.017, 2012.
Guffanti, M., Schneider, D. J., Wallace, K. L., Hall, T., Bensimon, D. R., and Salinas, L. J.: Aviation response to a widely dispersed volcanic ash and gas cloud from the August 2008 eruption of Kasatochi, Alaska, USA, J. Geophys. Res., 115, D00L19, https://doi.org/10.1029/2010JD013868, 2010.
Haarig, M., Ansmann, A., Baars, H., Jimenez, C., Veselovskii, I., Engelmann, R., and Althausen, D.: Depolarization and lidar ratios at 355, 532, and 1064 nm and microphysical properties of aged tropospheric and stratospheric Canadian wildfire smoke, Atmos. Chem. Phys., 18, 11847–11861, https://doi.org/10.5194/acp-18-11847-2018, 2018.
Höpfner, M., Ungermann, J., Borrmann, S., Wagner, R., Spang, R., Riese, M., Stiller, G., Appel, O., Batenburg, A. M., Bucci, S., Cairo, F., Dragoneas, A., Friedl-Vallon, F., Hünig, A., Johansson, S., Krasauskas, L., Legras, B., Leisner, T., Mahnke, C., Möhler, O., Molleker, S., Müller, R., Neubert, T., Orphal, J., Preusse, P., Rex, M., Saathoff, H., Stroh, F., Weigel, R., and Wohltmann, I.: Ammonium nitrate particles formed in upper troposphere from ground ammonia sources during Asian monsoons, Nat. Geosci., 12, 608–612, https://doi.org/10.1038/s41561-019-0385-8, 2019.
Hostetler, C. A., Liu, Z., Reagan, J., Vaughan, M., Winker, D., Osborn, M., Hunt, W. H., Powell, K. A., and Trepte, C.: CALIOP Algorithm Theoretical Basis Document, Calibration and Level 1 Data Products, PC-SCI-201, NASA Langley Research Center, Hampton, VA 23681, 66 pp., http://www-calipso.larc.nasa.gov/resources/project_documentation.php (last access: 3 September 2021), 2006.
Hu, Q., Goloub, P., Veselovskii, I., Bravo-Aranda, J.-A., Popovici, I. E., Podvin, T., Haeffelin, M., Lopatin, A., Dubovik, O., Pietras, C., Huang, X., Torres, B., and Chen, C.: Long-range-transported Canadian smoke plumes in the lower stratosphere over northern France, Atmos. Chem. Phys., 19, 1173–1193, https://doi.org/10.5194/acp-19-1173-2019, 2019.
Hunt, W., Winker, D., Vaughan, M., Powell, K., Lucker, P., and Weimer, C.: CALIPSO lidar description and performance assessment, J. Atmos. Ocean. Tech., 26, 1214–1228, https://doi.org/10.1175/2009JTECHA1223.1, 2009.
Kablick, G. P., Fromm, M. D., Miller, S. D., Partain, P., Peterson, D., Lee, S., Zhang, Y., Lambert, A., and Li, Z.: The Great Slave Lake pyroCb of 5 August 2014: Observations, simulations, comparisons with regular convection, and impact on UTLS water vapor, J. Geophys. Res.-Atmos., 123, 12332–12352, https://doi.org/10.1029/2018JD028965, 2018.
Kablick, G. P., Allen, D. R., Fromm, M. D., and Nedoluha, G. E.: Australian pyroCb smoke generates synoptic-scale stratospheric anticyclones, Geophys. Res. Lett., 47, e2020GL088101, https://doi.org/10.1029/2020GL088101, 2020.
Kar, J., Vaughan, M. A., Lee, K.-P., Tackett, J. L., Avery, M. A., Garnier, A., Getzewich, B. J., Hunt, W. H., Josset, D., Liu, Z., Lucker, P. L., Magill, B., Omar, A. H., Pelon, J., Rogers, R. R., Toth, T. D., Trepte, C. R., Vernier, J.-P., Winker, D. M., and Young, S. A.: CALIPSO lidar calibration at 532 nm: version 4 nighttime algorithm, Atmos. Meas. Tech., 11, 1459–1479, https://doi.org/10.5194/amt-11-1459-2018, 2018.
Khaykin, S. M., Godin-Beekmann, S., Hauchecorne, A., Pelon, J., Ravetta, F., and Keckut, P.: Stratospheric smoke with unprecedentedly high backscatter observed by lidars above southern France, Geophys. Res. Lett., 45, 1639–1646, https://doi.org/10.1002/2017GL076763, 2018.
Khaykin, S., Legras, B., Bucci, S., Sellitto, P., Isaksen, L., Tence, F., Bekki, S., Bourassa, A. E., Rieger, L. A., Zawada, D., Jumelet, J., and Godin-Beekmann, S.: The 2019/20 Australian wildfires generated a persistent smoke-charged vortex rising up to 35 km altitude, Commun. Earth Environ., 1, 22, https://doi.org/10.1038/s43247-020-00022-5, 2020.
Kim, M.-H., Omar, A. H., Tackett, J. L., Vaughan, M. A., Winker, D. M., Trepte, C. R., Hu, Y., Liu, Z., Poole, L. R., Pitts, M. C., Kar, J., and Magill, B. E.: The CALIPSO version 4 automated aerosol classification and lidar ratio selection algorithm, Atmos. Meas. Tech., 11, 6107–6135, https://doi.org/10.5194/amt-11-6107-2018, 2018.
Klekociuk, A. R., Ottaway, D. J., MacKinnon, A. D., Reid, I. M., Twigger, L. V., and Alexander, S. P.: Australian Lidar Measurements of Aerosol Layers Associated with the 2015 Calbuco Eruption, Atmosphere, 11, 124, https://doi.org/10.3390/atmos11020124, 2020.
Klüser, L., Erbertseder, T., and Meyer-Arnek, J.: Observation of volcanic ash from Puyehue–Cordón Caulle with IASI, Atmos. Meas. Tech., 6, 35–46, https://doi.org/10.5194/amt-6-35-2013, 2013.
Kokkalis, P., Papayannis, A., Amiridis, V., Mamouri, R. E., Veselovskii, I., Kolgotin, A., Tsaknakis, G., Kristiansen, N. I., Stohl, A., and Mona, L.: Optical, microphysical, mass and geometrical properties of aged volcanic particles observed over Athens, Greece, during the Eyjafjallajökull eruption in April 2010 through synergy of Raman lidar and sunphotometer measurements, Atmos. Chem. Phys., 13, 9303–9320, https://doi.org/10.5194/acp-13-9303-2013, 2013.
Kremser, S., Thomason, L. W., Hobe, M., Hermann, M., Deshler, T., Timmreck, C., Toohey, M., Stenke, A., Schwarz, J. P., Weigel, R., Fueglistaler, S., Prata, F. J., Vernier, J.-P., Schlager, H., Barnes, E. J., Antuna-Marrero, J.-C., Fairlie, D., Palm, M., Mahieu, E., Notholt, J., Rex, M., Bingen, C., Vanhellemont, F., Bourassa, A., Plane, J. M. C., Klocke, D., Carn, S. A., Clarisse, L., Trickl, T., Neely, R. D., James, A., Rieger, L., Wilson, C. J., and Meland, B.: Stratospheric aerosol – Observations, processes, and impact on climate, Rev. Geophys., 54, 278–335, https://doi.org/10.1002/2015RG000511, 2016.
Kristiansen, N. I., Stohl, A., Prata, A. J., Richter, A., Eckhardt, S., Seibert, P., Hoffmann, A., Ritter, C., Bitar, L., Duck, T. J., and Stebel, K.: Remote sensing and inverse transport modelling of the Kasatochi eruption sulphur dioxide cloud, J. Geophys. Res., 115, D00L16, https://doi.org/10.1029/2009JD013286, 2010.
Krotkov, N. A., Schoeberl, M. R., Morris, G. A., Carn, S., and Yang, K.: Dispersion and lifetime of the SO2 cloud from the August 2008 Kasatochi eruption, J. Geophys. Res., 115, D00L20, https://doi.org/10.1029/2010JD013984, 2010.
Langmann, B., Zaksek, K., and Hort, M.: Atmospheric distribution and removal of volcanic ash after the eruption of Kasatochi volcano: A regional model study, J. Geophys. Res., 115, D00L06, https://doi.org/10.1029/2009JD013298, 2010.
Liu, Z., Kar, J., Zeng, S., Tackett, J., Vaughan, M., Avery, M., Pelon, J., Getzewich, B., Lee, K.-P., Magill, B., Omar, A., Lucker, P., Trepte, C., and Winker, D.: Discriminating between clouds and aerosols in the CALIOP version 4.1 data products, Atmos. Meas. Tech., 12, 703–734, https://doi.org/10.5194/amt-12-703-2019, 2019.
Lopes, F. J. S., Silva, J. J., Antuña Marrero, J. C., Taha, G., and Landulfo, E.: Synergetic Aerosol Layer Observation After the 2015 Calbuco Volcanic Eruption Event, Remote Sens., 11, 195, https://doi.org/10.3390/rs11020195, 2019.
Maes, K., Vandenbussche, S., Klüser, L., Kumps, N., and De Mazière, M.: Vertical Profiling of Volcanic Ash from the 2011 Puyehue Cordón Caulle Eruption Using IASI, Remote Sens., 8, 103, https://doi.org/10.3390/rs8020103, 2016.
Martinsson, B. G., Brenninkmeijer, C. A. M., Carn, S. A., Hermann, M., Heue, K.-P., Velthoven, P. F. J. V., and Zahn, A.: Influence of the 2008 Kasatochi volcanic eruption on sulfurous and carbonaceous aerosol constituents in the lower stratosphere, Geophys. Res. Lett., 36, L12813, https://doi.org/10.1029/2009GL038735, 2009.
Marzano, F., Corradini, S., Mereu, L., Kylling, A., Montopoli, M., Cimini, D., Merucci, L., and Stelitano, D.: Multisatellite Multisensor Observations of a Sub-Plinian Volcanic Eruption: The 2015 Calbuco Explosive Event in Chile, IEEE Trans. Geosci. Remote Sens., 56, 2597–2612, https://doi.org/10.1109/TGRS.2017.2769003, 2018.
Mona, L., Amodeo, A., D'Amico, G., Giunta, A., Madonna, F., and Pappalardo, G.: Multi-wavelength Raman lidar observations of the Eyjafjallajökull volcanic cloud over Potenza, southern Italy, Atmos. Chem. Phys., 12, 2229–2244, https://doi.org/10.5194/acp-12-2229-2012, 2012.
NASA/LARC/SD/ASDC: CALIPSO Lidar Level 2 Polar Stratospheric Clouds (PSC) Mask, Provisional V1-11. NASA Langley Atmospheric Science Data Center DAAC, http://10.5067/CALIOP/CALIPSO/CAL_LID_L2_PSCMask-Prov-V1-11, 2016a.
NASA/LARC/SD/ASDC: CALIPSO Lidar Level 1B profile data, V4-10, NASA Langley Atmospheric Science Data Center DAAC [data set], https://doi.org/10.5067/CALIOP/CALIPSO/LID_L1-STANDARD-V4-10, 2016b.
NASA/LARC/SD/ASDC: CALIPSO Lidar Level 2 5 km Aerosol Layer Data, V4-20, NASA Langley Atmospheric Science Data Center DAAC [data set], http://10.5067/CALIOP/CALIPSO/LID_L2_05KMALAY-STANDARD-V4-20, 2018a.
NASA/LARC/SD/ASDC: CALIPSO Lidar Level 2 Aerosol Profile, V4-20, NASA Langley Atmospheric Science Data Center DAAC [data set], http://10.5067/CALIOP/CALIPSO/LID_L2_05KMAPRO-STANDARD-V4-20, 2018b.
NASA/LARC/SD/ASDC: CALIPSO Lidar Level 2 Vertical Feature Mask (VFM), V4-20, NASA Langley Atmospheric Science Data Center DAAC [data set], https://doi.org/10.5067/CALIOP/CALIPSO/LID_L2_VFM-STANDARD-V4-20, 2018c.
NASA/LARC/SD/ASDC: CALIPSO Lidar Level 1B profile data, V4-51, NASA Langley Atmospheric Science Data Center DAAC [data set], https://doi.org/10.5067/CALIOP/CALIPSO/CAL_LID_L1-Standard-V4-51, 2022.
Noh, Y. M., Dong, H. S., and Müller, D.: Variation of the vertical distribution of Nabro volcano aerosol layers in the stratosphere observed by LIDAR, Atmos. Environ., 154, 1–8, https://doi.org/10.1016/j.atmosenv.2017.01.033, 2017.
Ohneiser, K., Ansmann, A., Baars, H., Seifert, P., Barja, B., Jimenez, C., Radenz, M., Teisseire, A., Floutsi, A., Haarig, M., Foth, A., Chudnovsky, A., Engelmann, R., Zamorano, F., Bühl, J., and Wandinger, U.: Smoke of extreme Australian bushfires observed in the stratosphere over Punta Arenas, Chile, in January 2020: optical thickness, lidar ratios, and depolarization ratios at 355 and 532 nm, Atmos. Chem. Phys., 20, 8003–8015, https://doi.org/10.5194/acp-20-8003-2020, 2020.
Ohneiser, K., Ansmann, A., Chudnovsky, A., Engelmann, R., Ritter, C., Veselovskii, I., Baars, H., Gebauer, H., Griesche, H., Radenz, M., Hofer, J., Althausen, D., Dahlke, S., and Maturilli, M.: The unexpected smoke layer in the High Arctic winter stratosphere during MOSAiC 2019–2020 , Atmos. Chem. Phys., 21, 15783–15808, https://doi.org/10.5194/acp-21-15783-2021, 2021.
Ohneiser, K., Ansmann, A., Kaifler, B., Chudnovsky, A., Barja, B., Knopf, D. A., Kaifler, N., Baars, H., Seifert, P., Villanueva, D., Jimenez, C., Radenz, M., Engelmann, R., Veselovskii, I., and Zamorano, F.: Australian wildfire smoke in the stratosphere: the decay phase in 2020/2021 and impact on ozone depletion, Atmos. Chem. Phys., 22, 7417–7442, https://doi.org/10.5194/acp-22-7417-2022, 2022.
Omar, A. H., Winker, D. M., Vaughan, M. A., Hu, Y., Trepte, C. R., Ferrare, R. A., Lee, K. P., Hostetler, C. A., Kittaka, C., Rogers, R. R., and Kuehn, R. E.: The CALIPSO Automated Aerosol Classification and Lidar Ratio Selection Algorithm, J. Atmos. Ocean. Technol., 26, 1994–2014, https://doi.org/10.1175/2009JTECHA1231.1, 2009.
Pardini, F., Burton, M., Arzilli, F., La Spina, G., and Polacci, M.: SO2 emissions, plume heights and magmatic processes inferred from satellite data: The 2015 Calbuco eruptions, J. Volcanol. Geoth. Res., 361, 12–24, https://doi.org/10.1016/j.jvolgeores.2018.08.001, 2018.
Peterson, D. A., Campbell, J. R., Hyer, E. J., Fromm, M. D., Kablick, G. P., Cossuth, J. H., and DeLand, M. T.: Wildfire-driven thunderstorms cause a volcano-like stratospheric injection of smoke, Clim. Atmos. Sci., 1, 30, https://doi.org/10.1038/s41612-018-0039-3, 2018.
Peterson, D. A., Hyer, E., Campbell, J., Fromm, M., Bennese, C., Berman, M., and Van, T.: Quantifying the impact of intense pyroconvection on stratospheric aerosol loading. American Geophysical Union 2019 Fall Meeting, San Francisco, CA, 9–13 December 2019, Abstract GC11F-1150, https://agu.confex.com/agu/fm19/meetingapp.cgi/Paper/510480 (last access: 2 February 2023), 2019.
Peterson, D. A., Hyer, E. J., Campbell, J. R., Solbrig, J. E., and Fromm, M. D.: A conceptual model for development of intense pyrocumulonimbus in western North America, Mon. Weather Rev., 145, 2235–2255, https://doi.org/10.1175/MWR-D-16-0232.1, 2017.
Pitts, M. C., Poole, L. R., Dörnbrack, A., and Thomason, L. W.: The 2009–2010 Arctic polar stratospheric cloud season: a CALIPSO perspective, Atmos. Chem. Phys., 11, 2161–2177, https://doi.org/10.5194/acp-11-2161-2011, 2011.
Pitts, M. C., Poole, L. R., and Gonzalez, R.: Polar stratospheric cloud climatology based on CALIPSO spaceborne lidar measurements from 2006 to 2017, Atmos. Chem. Phys., 18, 10881–10913, https://doi.org/10.5194/acp-18-10881-2018, 2018.
Poole, L. R. and Pitts, M. C.: Polar stratospheric cloud climatology based on Stratospheric Aerosol Measurement II observations from 1978 to 1989, J. Geophys. Res., 99, 13083–13089, https://doi.org/10.1029/94JD00411, 1994.
Prata, A. J.: Infrared radiative transfer calculations for volcanic ash clouds, Geophys. Res. Lett., 16, 1293–1296, 1989
Prata, A. J., Gangale, G., Clarisse, L., and Karagulian, F.: Ash and sulfur dioxide in the 2008 eruptions of Okmok and Kasatochi: Insights from high spectral resolution satellite measurements, J. Geophys. Res., 115, D00L18, https://doi.org/10.1029/2009JD013556, 2010.
Prata, A. T., Young, S. A., Siems, S. T., and Manton, M. J.: Lidar ratios of stratospheric volcanic ash and sulfate aerosols retrieved from CALIOP measurements, Atmos. Chem. Phys., 17, 8599–8618, https://doi.org/10.5194/acp-17-8599-2017, 2017.
Prata, A. T., Mingari, L., Folch, A., Macedonio, G., and Costa, A.: FALL3D-8.0: a computational model for atmospheric transport and deposition of particles, aerosols and radionuclides – Part 2: Model validation, Geosci. Model Dev., 14, 409–436, https://doi.org/10.5194/gmd-14-409-2021, 2021.
Pueschel, R. F.: Stratospheric aerosols: Formation, properties, effects, J. Aerosol Sci., 27, 383–402, https://doi.org/10.1016/0021-8502(95)00557-9, 1996.
Rosen, J. M., Kjome, N. T., Larsen, N., Knudsen, B. M., Kyrö, E., Kivi, R., Karhu, J., Neuber, R., and Beninga, I.: Polar stratospheric cloud threshold temperatures in the 1995–1996 arctic vortex, J. Geophys. Res., 102, 28195–28202, https://doi.org/10.1029/97JD02701, 1997.
Ryan, R., Vaughan, M., Rodier, S. D., Getzewich, B. J., and Winker, D. M.: Column Optical Depths (COD) Derived from CALIOP Ocean Surface Returns, 30th International Laser Radar Conference, Virtual, 26 June–1 July 2022, Paper S01_P09_Ryan, https://meeting-info.org/wp-content/uploads/elementor/forms/6299271aeacb2.pptx?6bfec1&6bfec1, last access: 4 October 2022.
Sayer, A. M., Hsu, N. C., Eck, T. F., Smirnov, A., and Holben, B. N.: AERONET-based models of smoke-dominated aerosol near source regions and transported over oceans, and implications for satellite retrievals of aerosol optical depth, Atmos. Chem. Phys., 14, 11493–11523, https://doi.org/10.5194/acp-14-11493-2014, 2014.
Sicard, M., Granados-Muñoz, M. J., Alados-Arboledas, L., Barragán, R., Bedoya-Velásquez, A. E., Benavent-Oltra, J. A., Bortoli, D., Comerón, A., Córdoba-Jabonero, C., Costa, M. J., del Águila, A., Fernández, A. J., Guerrero-Rascado, J. L., Jorba, O., Molero, F., Muñoz-Porcar, C., Ortiz-Amezcua, P., Papagiannopoulos, N., Potes, M., Pujadas, M., Rocadenbosch, F., Rodríguez-Gomez, A., Román, R., Salgado, R., Salgueiro, V., Sola, Y., and Yela, M.: Ground/space, passive/active remote sensing observations coupled with particle dispersion modelling to understand the inter-continental transport of wildfire smoke plumes, Remote Sens. Environ., 232, 111294, https://doi.org/10.1016/j.rse.2019.111294, 2019.
Siddaway, J. M. and Petelina, S. V.: Transport and evolution of the 2009 Australian Black Saturday bushfire smoke in the lower stratosphere observed by OSIRIS on Odin, J. Geophys. Res., 116, D06203, https://doi.org/10.1029/2010JD015162, 2011.
Stone, K. A., Solomon, S., Kinnison, D. E., Pitts, M. C., Poole, L. R., Mills, M. J., Schmidt, A., Neely III, R. R., Ivy, D., Schwartz, M. J., Vernier, J. P., Johnson, B. J., Tully, M. B., Klekocius, A. R., König-Langlo, G., and Hagiya, S.: Observing the impact of Calbuco volcanic aerosols on south polar ozone depletion in 2015, J. Geophys. Res.-Atmos., 122, 11862–11879, https://doi.org/10.1002/2017JD026987, 2017.
Tackett, J. L., Vaughan, M. A., Lee, K.-P. A., Kar, J., and Trepte, C. R.: Improvements in CALIOP Smoke Optical Depth over Clouds, American Meteorological Society 101st Annual Meeting, Virtual, 10–15 January 2021, Paper 381852, https://ams.confex.com/ams/101ANNUAL/meetingapp.cgi/Paper/381852 (last access: 4 October 2022), 2021.
Tackett, J., Vaughan, M., Lambeth, J., and Garnier, A.: Critical Improvements to CALIOP Boundary Layer Cloud-Clearing in Version 4.5, CloudSat/CALIPSO Annual Science Program Review, Fort Collins, CO, 12–14 September 2022, Paper 10 Day 1, https://sites.google.com/view/ccstm-2022/home, last access 4 October 2022.
Theys, N., Campion, R., Clarisse, L., Brenot, H., van Gent, J., Dils, B., Corradini, S., Merucci, L., Coheur, P.-F., Van Roozendael, M., Hurtmans, D., Clerbaux, C., Tait, S., and Ferrucci, F.: Volcanic SO2 fluxes derived from satellite data: a survey using OMI, GOME-2, IASI and MODIS, Atmos. Chem. Phys., 13, 5945–5968, https://doi.org/10.5194/acp-13-5945-2013, 2013.
Torres, O., Bhartia, P. K., Taha, G., Jethva, H., Das, S., Colarco, P., Krotkov, N., Omar, A., and Ahn, C.: Stratospheric Injection of Massive Smoke Plume from Canadian Boreal Fires in 2017 as seen by DSCOVR-EPIC, CALIOP and OMPS-LP Observations, J. Geophys. Res.-Atmos., 125, e2020JD032579, https://doi.org/10.1029/2020JD032579, 2020.
Ulke, A. G., Torres Brizuela, M. M., Raga, G. B., and Baumgardner, D.: Aerosol properties and meteorological conditions in the city of Buenos Aires, Argentina, during the resuspension of volcanic ash from the Puyehue-Cordón Caulle eruption, Nat. Hazards Earth Syst. Sci., 16, 2159–2175, https://doi.org/10.5194/nhess-16-2159-2016, 2016.
Vaughan, M. A., Winker, D. M., and Powell, K. A.: CALIOP Algorithm Theoretical Basis Document Part 2: Feature Detection and Layer Properties Algorithms, available at: https://www-calipso.larc.nasa.gov/resources/pdfs/PC-SCI-202_Part2_rev1x01.pdf (last access: 2 February 2023), 2005.
Vaughan, M. A., Powell, K. A., Winker, D. M., Hostetler, C. A., Kuehn, R. E., Hunt, W. H., Getzewich, B. J., Young, S. A., Liu, Z., and McGill, M. J.: Fully automated detection of cloud and aerosol layers in the CALIPSO lidar measurements, J. Atmos. Ocean. Technol., 26, 2034–2050, https://doi.org/10.1175/2009JTECHA1228.1, 2009.
Vernier, J. P., Pommereau, J. P., Garnier, A., Pelon, J., Larsen, N., Nielsen, J., Christensen, T., Cairo, F., Thomason, L. W., Leblanc, T., and McDermid, I. S.: Tropical stratospheric aerosol layer from CALIPSO lidar observations, J. Geophys. Res.-Atmos., 114, D00H10, https://doi.org/10.1029/2009jd011946, 2009.
Vernier, J.-P., Fairlie, T. D., Murray, J. J., Tupper, A., Trepte, C., Winker, D., Pelon, J., Garnier, A., Jumelet, J., Pavolonis, M., Omar, A. H., and Powell, K. A.: An advanced system to monitor the 3D structure of diffuse volcanic ash clouds, J. Appl. Meteorol. Clim., 52, 2125–2138, https://doi.org/10.1175/JAMC-D-12-0279.1, 2013.
Vernier, J.-P., Fairlie, T. D., Deshler, T., Natarajan, M., Knepp, T., Foster, K., Wienhold, F. G., Bedka, K. M., Thomason, L., and Trepte, C.: In situ and space-based observations of the Kelud volcanic plume: The persistence of ash in the lower stratosphere, J. Geophys. Res.-Atmos., 121, 11104–11118, https://doi.org/10.1002/2016JD025344, 2016.
Vernier, J., Fairlie, T.D., Deshler, T., Venkat Ratnam, M., Gadhavi, H., Kumar, B. S., Natarajan, M., Pandit, A. K., Akhil Raj, S. T., Hemanth Kumar, A., Jayaraman, A., Singh, A. K., Rastogi, N., Sinha, P. R., Kumar, S., Tiwari, S., Wegner, T., Baker, N., Vignelles, D., Stenchikov, G., Shevchenko, I., Smith, J., Bedka, K., Kesarkar, A., Singh, V., Bhate, J., Ravikiran, V., Durga Rao, M., Ravindrababu, S., Patel, A., Vernier, H., Wienhold, F. G., Liu, H., Knepp, T. N., Thomason, L., Crawford, J., Ziemba, L., Moore, J., Crumeyrolle, S., Williamson, M., Berthet, G., Jegou, F., and Renard, J.: BATAL: The Balloon Measurement Campaigns of the Asian Tropopause Aerosol Layer, B. Am. Meteorol. Soc., 99, 955–973, https://doi.org/10.1175/BAMS-D-17-0014.1, 2018.
Waythomas, C. F., Scott, W. E., Prejean, S. G., Schneider, D. J., Izbekov, P., and Nye, C. J.: The 7–8 August 2008 eruption of Kasatochi Volcano, central Aleutian Islands, Alaska, J. Geophys. Res., 115, B00B06, https://doi.org/10.1029/2010JB007437, 2010.
Wunderman, R. (Ed.): Report on Puyehue-Cordon Caulle (Chile), Global Volcanism Program, Bulletin of the Global Volcanism Network, 37:3, Smithsonian Institution, https://doi.org/10.5479/si.GVP.BGVN201203-357150, 2012.
Winker, D. M., Vaughan, M. A., Omar, A., Hu, Y., Powell, K. A., Liu, Z., Hunt, W. H., and Young, S. A.: Overview of the CALIPSO mission and CALIOP data processing algorithms, J. Atmos. Ocean. Technol., 26, 2310–2323, https://doi.org/10.1175/2009JTECHA1281.1, 2009.
Winker, D. M., Liu, Z., Omar, A., Tackett, J., and Fairlie, D.: CALIOP observations of the transport of ash from the Eyjafjallajökull volcano in April 2010, J. Geophys. Res., 117, D00U15, https://doi.org/10.1029/2011JD016499, 2012.
Young, S. A., Vaughan, M. A., Kuehn, R. E., and Winker, D. M.: The retrieval of profiles of particulate extinction from Cloud–Aerosol Lidar and Infrared Pathfinder Satellite Observations (CALIPSO) data: Uncertainty and error sensitivity analyses, J. Atmos. Ocean. Technol., 30, 395–428, https://doi.org/10.1175/JTECH-D-12-00046.1, 2013.
Yu, P., Toon, O. B., Bardeen, C. G., Zhu, Y., Rosenlof, K. H., Portmann, R. W., Thornberry, T. D., Gao, R. S., Davis, S. M., Wolf, E. T., de Gouw, J., Peterson, D. A., Fromm, M. D., and Robock, A.: Black carbon lofts wildfire smoke high into the stratosphere to form a persistent plume, Science, 365, 587–590, https://doi.org/10.1126/science.aax1748, 2019.
Zhu, Y., Toon, O. B., Kinnison, D., Harvey, V. L., Mills, M. J., Bardeen, C. G., Pitts, M., Begue, N., Renard, J.-B., Berthet, G., and Jegou, F.: Stratospheric Aerosols, Polar Stratospheric Clouds, and Polar Ozone Depletion After the Mount Calbuco Eruption in 2015, J. Geophys. Res.-Atmos., 123, 12308–12331, https://doi.org/10.1029/2018JD028974, 2018.
Zhuang, J. and Yi, F.: Nabro aerosol evolution observed jointly by lidars at a mid-latitude site and CALIPSO, Atmos. Environ., 140, 106–116, https://doi.org/10.1016/j.atmosenv.2016.05.048, 2016.
- Abstract
- Introduction
- Data used
- Summary of the V4.2 stratospheric aerosol subtyping algorithm
- The version 4.5 stratospheric aerosol subtyping algorithm
- Performance assessment
- Conclusions
- Data availability
- Author contributions
- Competing interests
- Disclaimer
- Acknowledgements
- Review statement
- References
- Supplement