the Creative Commons Attribution 4.0 License.
the Creative Commons Attribution 4.0 License.
 | 23 Feb 2023
GNSS radio occultation soundings from commercial off-the-shelf receivers on board balloon platforms
Kevin J. Nelson
Feiqin Xie
Bryan C. Chan
Ashish Goel
Jonathan Kosh
Tyler G. R. Reid
Corey R. Snyder
Paul M. Tarantino
The Global Navigation Satellite System (GNSS) radio occultation (RO) technique has proven to be an effective tool for Earth atmosphere profiling. Traditional spaceborne RO satellite constellations are expensive with relatively low sampling density for specific regions of interest. In contrast, in-atmosphere RO platforms can provide much higher spatial and temporal sampling of ROs around regional weather events. This study explores the capability of a low-cost and scalable commercial off-the-shelf (COTS) GNSS receiver on board high-altitude balloons. The refractivity retrievals from balloon-borne RO payloads obtained from two flight campaigns (World View and ZPM-1) are presented. The balloon-borne RO soundings from the World View campaign show refractivity profiles between 6 and 19 km, with overall near-zero median difference from colocated ECMWF ERA5 reanalysis data and variability comparable to spaceborne RO missions (∼ 2.3 % median absolute deviation or MAD). Soundings from the ZPM-1 campaign show a relatively large positive refractivity bias (∼ 2.5 %). In summary, low-cost COTS RO payloads on board balloon platforms are worth further engineering and study in order to provide capabilities for dense, targeted atmospheric soundings that can improve regional weather forecasts via data assimilation.
- Article
(3413 KB) - Full-text XML
- BibTeX
- EndNote


The radio occultation (RO) atmospheric profiling method was first developed to measure planetary atmospheres in our solar system. The first major use of the RO method was part of the mission to examine atmospheric profiles of Venus as part of the Mariner V mission launched in 1967 (Fjeldbo and Eshleman, 1969; Fjeldbo et al., 1971). Due to vertical atmospheric density gradients, radio signals transmitted from the spacecraft will bend and be slightly delayed when passing through the limb of the planetary atmosphere before arriving at a receiving antenna on Earth. This bending accumulation along the ray path can be precisely measured using excess phase and can be used to derive atmospheric pressure, temperature, and concentration of atmospheric constituents (e.g., sulfuric acid concentrations on Venus). The same method was later applied to Mars (Mariner IX; Kliore et al., 1972; Lindal et al., 1979) and Neptune (Voyager II; Lindal, 1992). Even as recently as 2017, additional RO missions to Venus were underway (AKATSUKI; Imamura et al., 2017).
It was not until the mid-1990s that scientists began to apply RO techniques to the Earth’s atmosphere using Global Navigation Satellite System (GNSS) signals as transmitting sources (Kursinski et al., 1996, 1997; Ware et al., 1996). To date, most Earth GNSS RO observations are taken from low-Earth orbiting (LEO) satellite constellations such as the Constellation Observing System for Meteorology, Ionosphere, and Climate (COSMIC-1; Anthes et al., 2008), the GNSS Receiver for Atmospheric Sounding (GRAS; Luntama et al., 2008) on board the MetOp satellite series, and COSMIC-2 (Schreiner et al., 2020). More recently, several private companies (e.g., Spire, GeoOptics, PlanetIQ) launched CubeSat constellations that can offer RO soundings with comparable quality to the more sophisticated satellite RO missions (Bowler, 2020). The impact of spaceborne RO profile assimilation on global weather forecasts has been ranked second among satellite measurements (Cardinali and Healy, 2014), with its impact varying depending on assimilation methods (Boullot et al., 2014; Harnisch et al., 2013; Ruston and Healy, 2020).
RO observations are also possible from receivers inside the atmosphere as opposed to from the LEO receivers in space. One of the more common in-atmosphere RO platforms is an airplane or drone. Airborne radio occultation (ARO) typically uses custom-built receiver payloads on board a modified aircraft with additional antennae and is capable of significantly higher spatial sampling density than spaceborne RO (Wang et al., 2016) due to their slower velocities compared to the LEO receiver satellites (e.g., COSMIC-1, COSMIC-2). This allows ARO receivers to potentially track more GNSS signals, creating the potential for more frequent, localized occultations (Chan et al., 2021, 2022; Xie et al., 2008). ARO platforms also have the benefit of providing on-demand RO profiles around transient weather events such as mid-latitude or tropical cyclones. ARO is limited primarily by flight restrictions regulated by aviation safety agencies (e.g., US Federal Aviation Administration, European Union Aviation Safety Agency) and by the fuel range of the aircraft. In addition, the slower-moving airborne receivers lead to longer occultation duration with increased tangent point drifting distance, potentially leading to larger variations in the sampled atmosphere in comparison with spaceborne RO.
Early ARO studies developed and tested research instruments as a baseline for in-atmosphere RO and modified the traditional spaceborne RO retrieval algorithms (Garrison et al., 2007; Healy et al., 2002; Xie et al., 2008; Zuffada et al., 1999). Open-loop signal tracking algorithms were successfully implemented to reduce unwrapping and tracking errors from airborne platforms (Murphy et al., 2015; Wang et al., 2016). Radio-holographic retrieval methods modified for in-atmosphere radio occultations (Adhikari et al., 2016; Wang et al., 2016) have also been implemented to improve upon geometric optics retrievals (Kursinski et al., 1997, 2000) in the moist lower troposphere to reduce multi-path errors.
Another option for an RO observation platform is a high-altitude balloon, but few attempts have been successfully implemented thus far. The Concordiasi project (Rabier et al., 2010, 2013) is the only field campaign to date during which balloon-borne RO (BRO) observations were targeted as part of the overall research goal. Haase et al. (2012) detailed the proof-of-concept BRO payload and platform design, along with some preliminary results indicating the feasibility of BRO measurements from the Concordiasi field campaign. More recently, Cao et al. (2022) showed that BRO using a custom-built receiver payload aboard a high-altitude Strateole-2 balloon (Haase et al., 2018) is also capable of resolving equatorial Kelvin waves. Other remote sensing projects have used balloon platforms for other purposes (e.g., GNSS Reflectometry, GNSS-R; Carreno-Luengo et al., 2016), but GNSS RO payloads on balloon platforms are still otherwise underrepresented.
Balloon-borne RO has many advantages over spaceborne RO and ARO. Like ARO observations, BRO platforms move slowly compared to spaceborne platforms and are therefore capable of offering high spatial and temporal sounding densities over targeted regions. Additionally, BRO platforms can remain aloft and collect observations for weeks to months, depending on the design and capabilities of the platforms (Chan et al., 2021, 2022). BRO platforms can also be tactically launched en masse above and around transient weather events such as tropical cyclones and supercell thunderstorms to provide spatially dense sampling of atmospheric thermodynamic profiles inside and surrounding dangerous weather events.
Multiple US federal agencies have also invested in supplementary RO data to support operational weather forecasting. The US National Oceanic and Atmospheric Administration (NOAA) is undergoing a multi-year program intended to incentivize commercial participation in Data as a Service, which can be used for improving weather forecasting through data assimilation (National Oceanic and Atmospheric Administration and National Environmental Satellite, Data, and Information Service, 2020). The US National Aeronautics and Space Administration (NASA) also funds a Commercial Smallsat Data Acquisition (CSDA) Program (National Aeronautics and Space Administration, 2022), of which RO profiles are an area of heavy research. Furthermore, low-cost, on-demand RO data would be highly useful for conducting research in the planetary boundary layer (PBL), a targeted observable in the NASA 2017 decadal survey (National Academies of Sciences, 2018). BRO data could be a low-cost alternative or supplement to spaceborne and airborne radio occultation data for PBL sensing.
The remainder of this paper is structured as follows. Section 2 briefly introduces a newly developed, low-cost, scalable commercial off-the-shelf (COTS) GNSS receiver on board high-altitude balloons and the associated flight campaigns, along with the detailed description on BRO data and methodology. Section 3 shows the refractivity retrieval process and quality control procedures based on one representative BRO case. Section 4 examines the overall statistics of the BRO observations and provides a preliminary error analysis. Finally, conclusions and future studies are summarized in Sect. 5.
2.1 Balloon-borne GNSS RO payload and high-altitude balloon platforms
A detailed description of the balloon-borne GNSS RO payload developed by Night Crew Labs (NCL) can be found in Chan et al. (2021, 2022) – a summary is presented here. The instrumentation is comprised of two major components: a mission system support component and a science payload for GNSS RO profiling. The mission system support component is the Balloon Re-Programmable Integrated Computer (BRIC), which is a third-generation flight management computer that supports data logging, as well as power management, flight control, and thermal control. The science payload is the GNSS Radio Occultation and Observable Truth (GROOT), which is a first-generation balloon-borne GNSS RO science instrument based on COTS GNSS equipment. The GROOT payload includes a Swift Navigation Piksi Multi GNSS receiver for raw RO measurements (e.g., carrier phase, signal-to-noise ratio (SNR), and Doppler velocities) and a Trimble BX992 dual-antenna GNSS receiver coupled with an inertial navigation system and an L-band GNSS corrections service, in addition to the BRIC flight computer and other ancillary needs. All balloon-borne RO data described in this study were collected from the GROOT payload. The Piksi GNSS RO receiver is particularly noteworthy, as it is about the size of a credit card, which is quite small compared to most other custom-built GNSS RO receivers for in-atmosphere and spaceborne observations.

Figure 1(a) GROOT payload used in balloon RO flight missions. Numbers indicate the following components: (1) patch heaters, (2) Raspberry Pi data logger, (3) Trimble BX992 receiver, (4) BRIC flight computer, (5) Power board and Swift Piksi Multi stack for phase and amplitude measurements (adapted from Chan et al., 2022). (b) World View Stratolite balloon being filled prior to launch. (c) Balloon RO payload being prepared for launch during World View BRO flight campaigns. GNSS antennae are indicated by red circles. (d) NCL ZPM-1 balloon being filled prior to launch. (e) ZPM-1 RO payload and GNSS antennae configuration.
In this study, the RO profiles collected from two high-altitude balloon flight campaigns equipped with the GROOT payload were analyzed. Figure 1a shows the GROOT payload as described above, with each component labeled. The first of a series of high-altitude balloon campaigns occurred in August 2020 on a zero-pressure balloon as a secondary payload hosted on the World View Stratolite balloon bus platform (Fig. 1b, c). The World View flight launched out of Page, Arizona, and maintained 18+ km (60 000+ ft) altitude, enabling 5 d (120 h) of continuous data collection. During the flight, GROOT continuously collected balloon state data and RO data from the GPS (United States), GLONASS (Russia), Galileo (European Union), BeiDou (China), and QZSS (Japan) constellations. The World View balloon platform was equipped with yaw control equipment to minimize spinning during flight and to allow for yaw rotation corrections as necessary. After mission termination, the payload was recovered, and the data were processed.
The second flight campaign was the NCL Zero-Pressure Balloon Mission 1 (ZPM-1), which launched near Empire, Nevada, on 28 November 2020 (Fig. 1d, e). The ZPM-1 balloon reached a maximum altitude of 31.7 km (104 567 ft), traveling southeast toward Utah. Overnight, ZPM-1 dropped to a lower-than-expected altitude of 17.9 km (59 000 ft) due to colder ambient temperature, which caused the balloon to drift eastwards towards the Rocky Mountains and led to early termination of the mission after 12 h. During the flight, GROOT collected balloon state data and RO data from GPS, GLONASS, Galileo, BeiDou, and QZSS constellations. The payload was later recovered in southern Utah.
2.2 Balloon-borne RO measurements
Figure 2 shows the ground tracks for the two balloon flight campaigns along with the predicted occultation tangent point locations at the lowest elevation angle, labeled by their respective GNSS RO satellites. The selected occultation events extracted for analysis are highlighted for both flight campaigns. The GROOT receiver can potentially track all currently operational GNSS satellite constellations such as GPS, GLONASS, Galileo, BeiDou, and QZSS. Out of a total number of 680 predicted occultation soundings for the World View flight (based on balloon and GNSS real trajectories), approximately 71 % of observations came from non-GPS occultations and were not analyzed (see Fig. A1). This decision was made because GROOT processing on non-GPS satellite data from several previous flights consistently resulted in poor-quality ROs as a result of receiver bandwidth limitations. In addition, the closed-loop tracking receiver in the GROOT payload can only track setting (vs. rising) occultations, filtering out another 50 % of the available occultations. Of the remaining occultations, only the RO events that had measurements with (1) a minimum elevation angle less than 0∘ and (2) an excess phase greater than 50 meters were processed. This subset of occultations was divided into those that are good quality and those that required additional quality control such as cycle slip corrections (Fig. A1). Of the original 680 occultations from the World View flight, only 15 cases were extracted for analysis (see Appendix A). Cycle slip corrections were required for 7 of the 15 cases, and 1 World View case was removed after failing quality control procedures. The same pre- and post-processing algorithms were applied to ZPM-1 measurements. Unfortunately, the ZPM-1 flight encountered power failures during the segments of the flight, resulting in the loss of altitude and a much shorter flight time with fewer occultations being collected; only 8 occultations out of 84 were selected for processing.
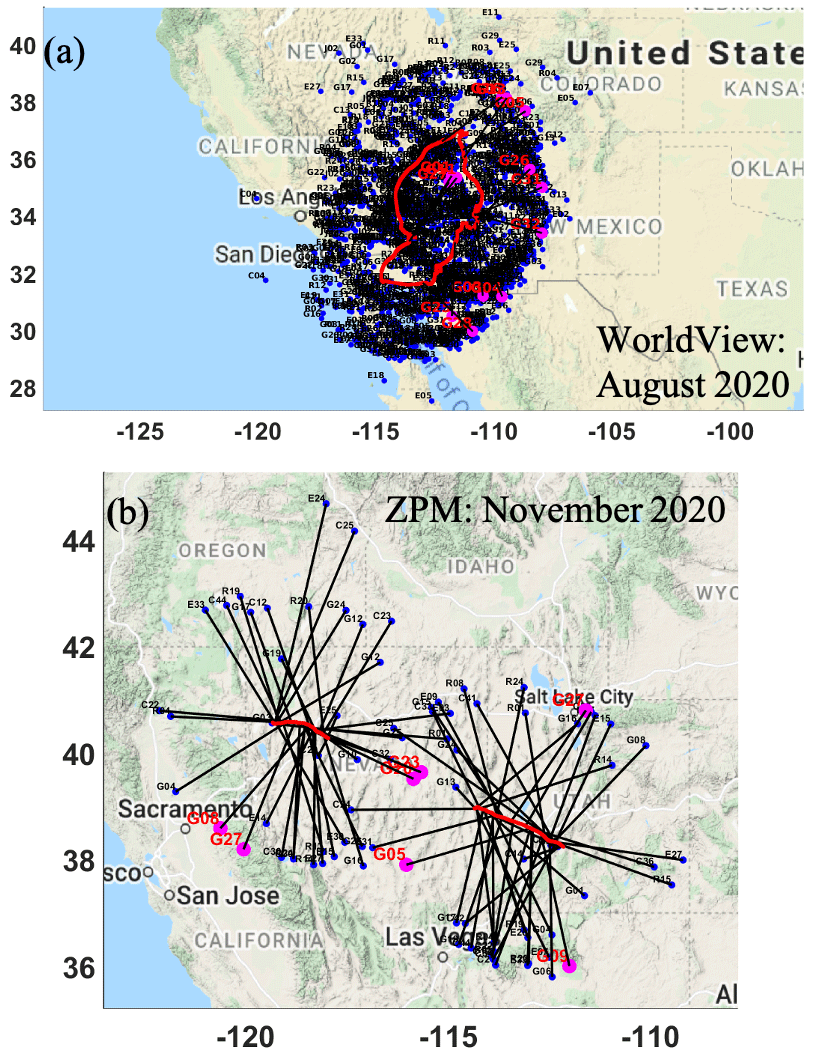
Figure 2High-altitude balloon flight trajectory (red) and predicted occultation tangent point drifting paths and their respective GPS satellites (black) for (a) World View and (b) ZPM-1. Pink circles with red text indicate the selected RO cases and the occulting GPS satellite number presented in this study.
2.3 Balloon-borne RO data processing and retrieval methods
After the flight data are logged, several pre-processing steps are required prior to retrieving bending angle and refractivity. The full retrieval process is detailed in Chan et al. (2022) but is summarized here. The first step in the BRO retrieval is to pre-process the L1 frequency data for ingestion into the retrieval algorithms. Raw line-of-sight (LOS) GNSS observables, along with satellite ephemeris data and balloon state (position and velocity) data, all of which are measured at 10 Hz, are extracted from payload storage. Once the LOS data are parsed and aligned, the next step is to compute the excess phase by subtracting the receiver’s measured phase from the LOS geometric distance between the occulting GNSS satellite and the receiver. Step 3 is receiver clock calibration, where the excess phase is calibrated by differencing the excess phase of the occulting and high-elevation GNSS satellites. Step 4 is cycle slip correction, where an exponential curve is fitted to the data to both smooth and remove medium to large discontinuities. Step 5 uses a Gaussian process regression (GPR; Shi and Choi, 2011) to further remove any smaller discontinuities as needed in processing the individual cases. Steps 3 through 5 clean and smooth the excess phase data so that it can be used in the retrieval downstream in the retrieval processing. Finally, the pre-processed results, RO excess phase, excess Doppler shift, SNR, and balloon state are exported as a NetCDF file, a format convenient for downstream GNSS RO retrieval processing. In our study, the L2 frequency data were often less reliable for retrievals, as it would often drop out sooner than the L1 data. However, the L2 data were still used for pre-processing data corrections (e.g., data verification, cycle slip corrections).
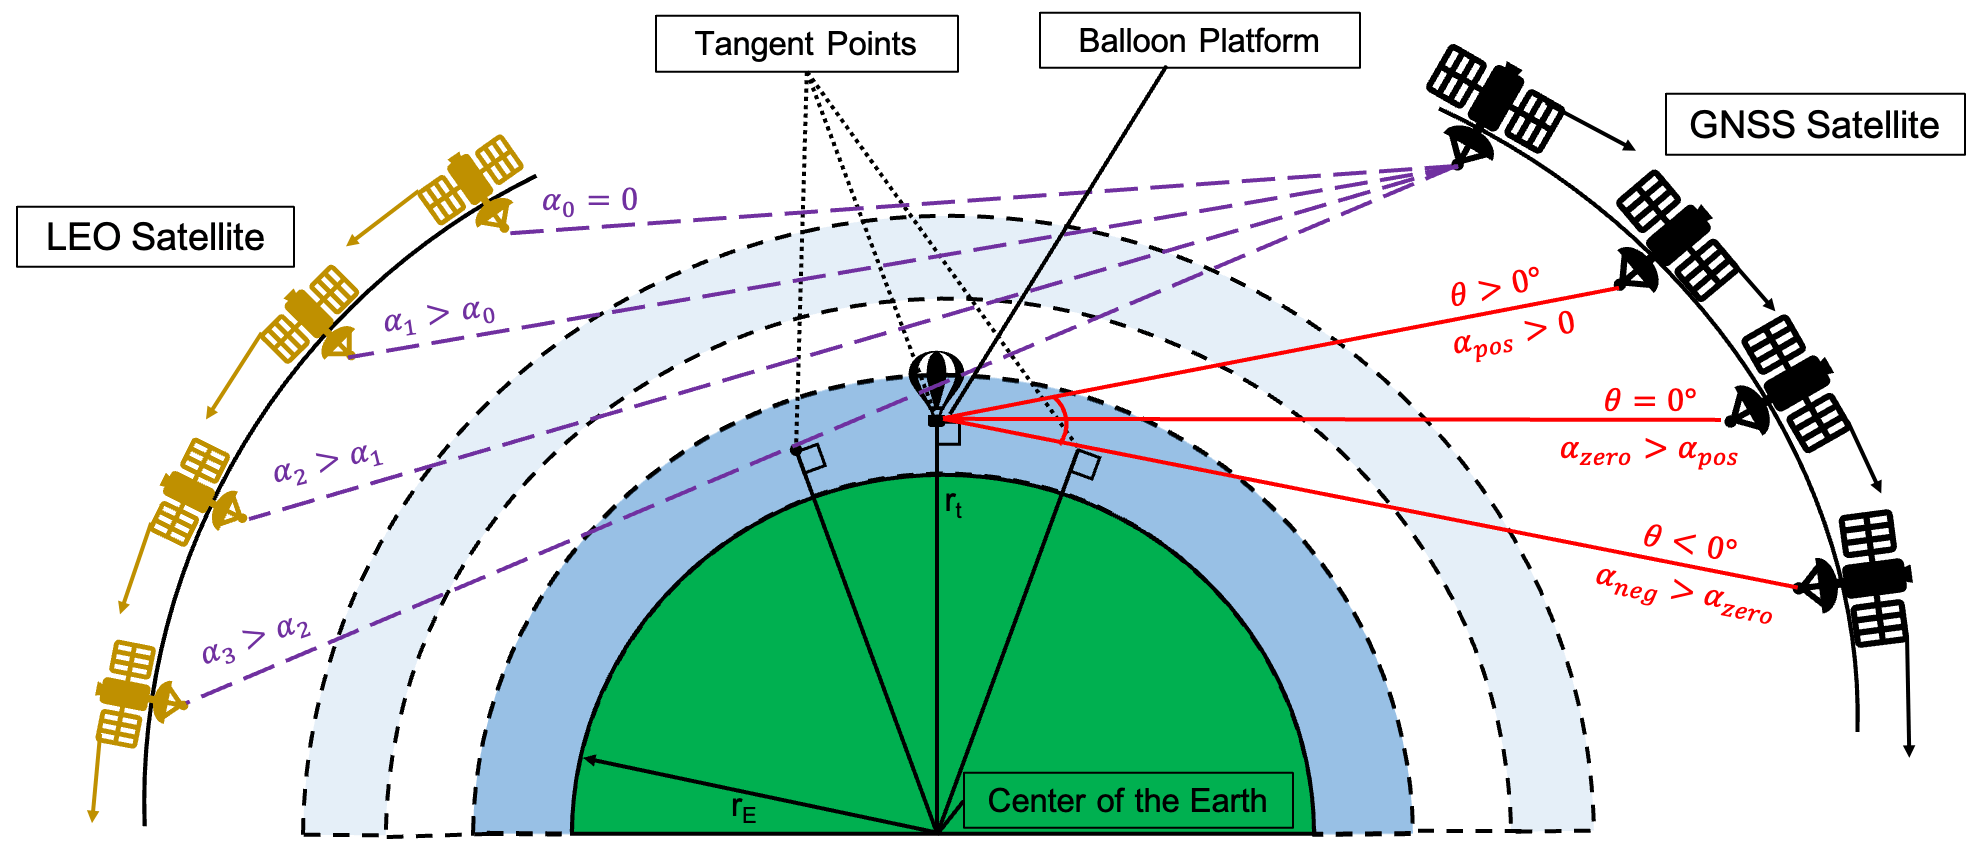
Figure 3Balloon radio occultation transmitter–receiver geometry diagram that does not show the bending of the GNSS ray paths. rE and rt represent Earth's radius and the radius at the tangent point, respectively. Adapted from Xie et al. (2008).
Unlike the well-known traditional spaceborne RO, balloon-borne (and airborne) RO have a more unique, less common transmitter–receiver geometry (Fig. 3). The receiver on board the balloon platform is shown in the center at a radius rt. High-elevation GNSS satellites, where the elevation angle is required to be θ>55∘, are used to calibrate the excess phase at the in-atmosphere receiver. GNSS satellites with elevation angle ∘ are used in the retrieval process to calculate the bending angle retrievals and subsequent products (Chan et al., 2022; Xie et al., 2018).
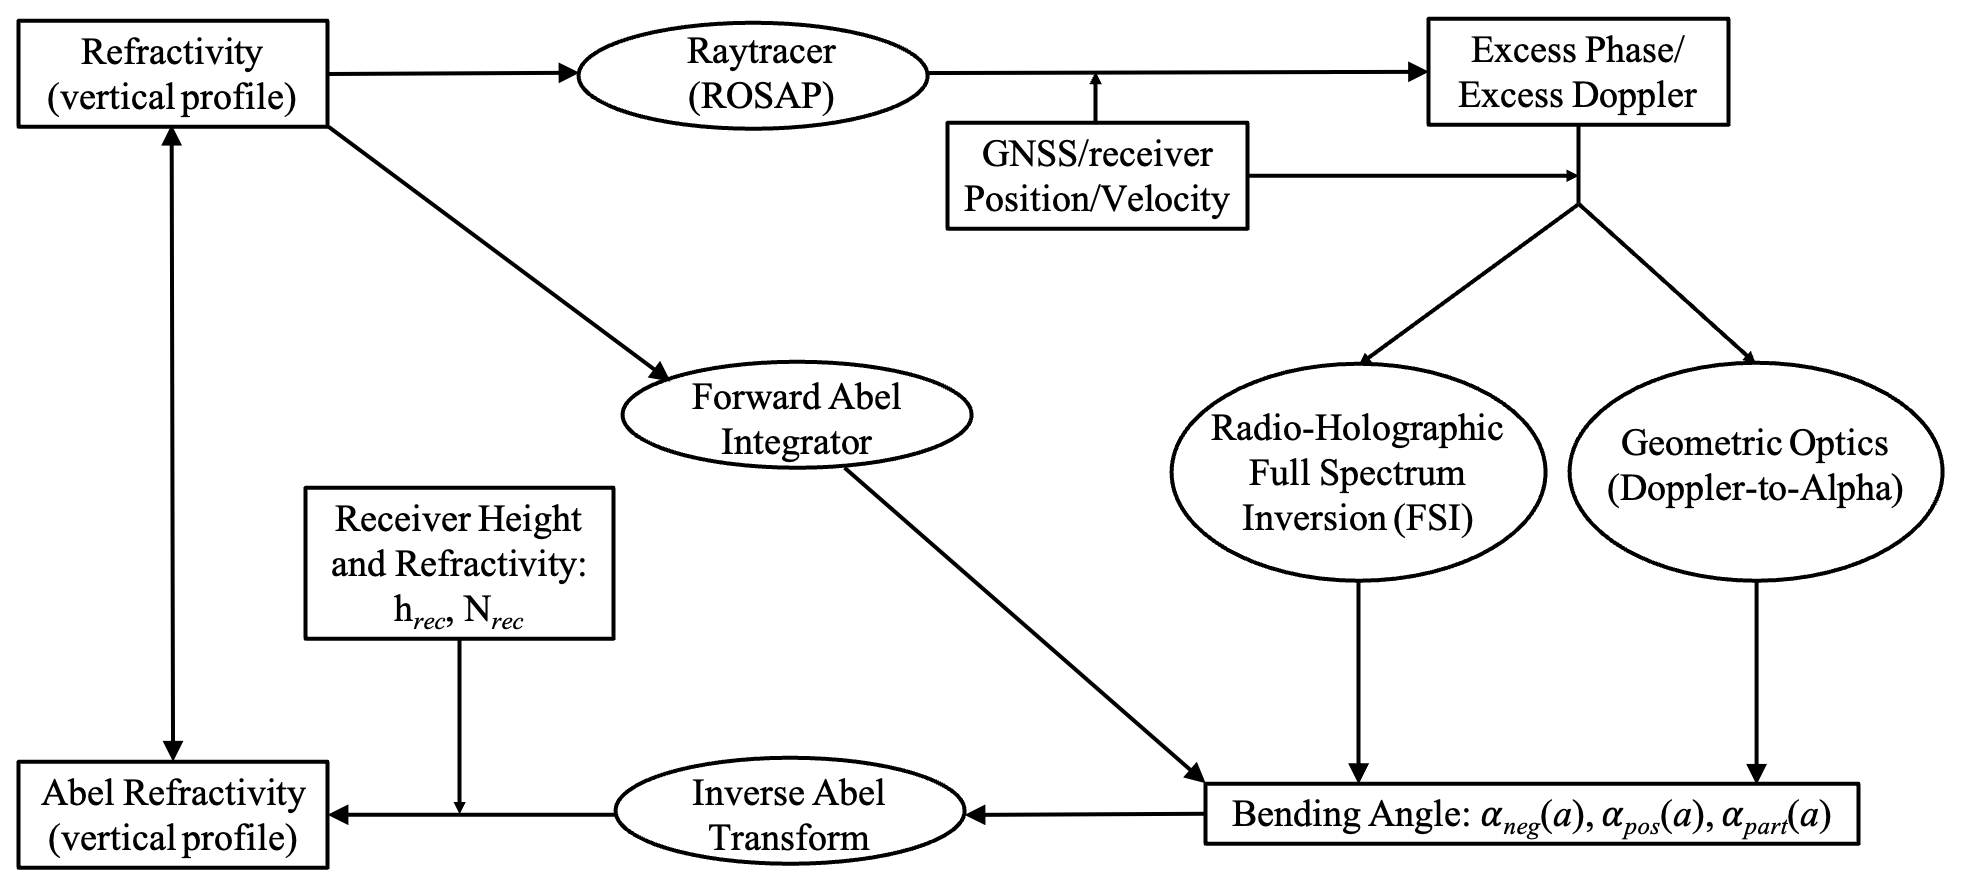
Figure 4Flow chart of the end-to-end simulation and retrieval processing system for airborne and balloon-borne GNSS radio occultation.
To evaluate the performance of the balloon-borne GNSS RO retrieval algorithm, an end-to-end simulation and retrieval processing system (Fig. 4) originally developed for aircraft-based GNSS RO (Xie et al., 2008) was adapted for balloon-borne RO measurements. The processing system includes four main components: (a) a geometric optics ray tracer, i.e., Radio Occultation Simulations for Atmospheric Profiling (ROSAP; Høeg et al., 1996), which simulates the GNSS RO signal and calculates the associated excess phase, excess Doppler shift, and the along-path accumulated bending angle at each impact parameter as it travels through a prescribed Earth’s atmosphere (with either spherical or oblate Earth) given by a one-dimensional atmospheric refractivity profile (the oblate-Earth option is used in our study); (b) a module that derives the bending angle from the LOS excess phase and Doppler measurements through a modified geometric optics (GO) retrieval, i.e., Doppler-to-alpha, (Lesne et al., 2002; Vorob'ev and Krasil'nikova, 1994; Xie et al., 2008) and radio-holographic retrieval (i.e., FSI; Jensen et al., 2003) modified for in-atmosphere retrievals (Adhikari et al., 2016); (c) a forward Abel integrator (FAI), modified for in-atmosphere RO retrievals, that generates the bending angle profile through the forward integration of an input refractivity profile (Fjeldbo and Eshleman, 1969; Fjeldbo et al., 1971; Xie et al., 2008); and (d) an inverse integrator that retrieves a refractivity profile via an inverse Abel transform (IAT; Fjeldbo and Eshleman, 1969) modified for in-atmosphere RO (Healy et al., 2002; Xie et al., 2008). Note that the GO retrieval method has limited vertical resolution and encounters multipath problems in the moist lower troposphere. Therefore, the FSI method adapted for airborne and balloon-borne RO retrieval will also be used (Adhikari et al., 2016).
During the retrieval process, the pre-processed 10 Hz LOS observations are log-linearly smoothed using a 30 s moving window to further ensure that high-frequency noise has been removed. The ROSAP simulation also runs its ray tracing at the same sampling interval as the provided satellite–receiver geometry. The excess phase output of the ROSAP simulation is also run through the same log-linear smoothing algorithm as the LOS excess phase.
After the bending angle (α) profiles are retrieved using either GO or FSI methods, the partial bending angle (αpart), i.e., the difference between negative- and positive-elevation bending angles (αneg and αpos, respectively) at the same impact parameter, can be derived. The partial bending angle profile is then converted to the refractivity profile using the modified IAT, which requires a priori knowledge of the refractivity at the receiver during the occultation event. In addition, the local radius of curvature of the Earth (rE) is also required for the conversion of bending angle impact parameter to geometric height as part of the IAT. Due to the very low excess phase, the raw observation of αpos, as well as the αneg near the receiver height, is generally very small and can also be rather noisy, which would lead to large errors in partial bending angle and the following refractivity retrieval. Therefore, in this study, the αpos and the αneg within 1.5 km of the receiver altitude were substituted by the simulated bending angle (e.g., FAI or ROSAP bending angle simulation) based on a colocated refractivity profile (Adhikari et al., 2016; Xie et al., 2018). By doing this, the top 1.5 km of the αpos and the αneg profiles are significantly less noisy, preventing failure of the IAT.
2.4 ERA5 model reanalysis data
To evaluate the quality of balloon-borne RO measurements, we use 3-hourly ERA5 model reanalysis (Hersbach et al., 2020) from the European Centre for Medium-range Weather Forecasting (ECMWF) to provide estimates of atmospheric conditions near the BRO sounding locations. The native ERA5 model grid has 0.25∘ × 0.25∘ horizontal resolution and 137 vertical levels. The ERA5 profiles are referenced to geopotential heights, which are converted to geometric heights for direct comparisons to BRO profiles. The atmospheric refractivity profiles can be derived from the gridded temperature, water vapor pressure (humidity), and pressure profiles according to Eq. (1).
Equation (1) is an approximation of atmospheric refractivity for the neutral atmosphere, where N is refractivity in N-units; P is atmospheric pressure in hPa; T is atmospheric temperature in K; Pw is the water vapor pressure in hPa; and a1 and a2 are unitless coefficients with values of 77.6 and 3.73×10⁵, respectively (Kursinski et al., 1997, 2000).
In addition, during an occultation event, the tangent point (TP) is located at the receiver position when the occulting satellite is at zero elevation. In-atmosphere RO bending angle retrieval requires a priori atmospheric refractivity at the receiver, which can be provided by a colocated ERA5 profile, when high-quality in situ measurements are not available (Xie et al., 2008, 2018; Adhikari et al., 2016). Thus, for simplicity, each occultation event uses one referencing refractivity profile from the colocated ERA5 grid at the zero-elevation angle (θ=0) tangent point location. This refractivity profile is used to compute the time series of refractivity at the receiver throughout the occultation observations by interpolating the refractivity profile to the receiver height at each timestamp. Furthermore, considering the high horizontal resolution of ERA5 reanalysis and the potential fine-scale variations of refractivity that are smaller to the RO horizontal footprint, we use a median refractivity profile of a 1∘ × 1∘ horizontal grid surrounding the zero-elevation TP location for input into the initial ROSAP and FAI simulations. The tangent point locations during the occultation event can therefore be derived from ROSAP ray-tracing simulation with the real occultation geometry. It is important to consider the relatively large horizontal drift of BRO TPs when determining the accuracy of the retrieved refractivity profiles. To best evaluate the quality of the individual retrieved BRO refractivity profiles, the final refractivity comparison uses the ERA5 profile at the 5 km TP location determined by the initial ROSAP simulations. Therefore, three separate refractivity profiles from ERA5 are used during the retrieval process: the zero-elevation angle refractivity profile for the time series of refractivity at the receiver, the 1∘ × 1∘ median refractivity profile surrounding the zero-elevation angle location used for input into simulations, and the 5 km TP location refractivity profile used for final retrieval comparisons.
Here we focus on one typical BRO sounding, an approximately 27 min long BRO measurement from the World View campaign (hereafter referred to as WVG26) at 06:26 UTC on 22 August 2020. The WVG26 case occurred over the Tonto National Forest, northeast of Phoenix, Arizona. The colocated (zero-elevation angle location) ERA5 thermodynamic profiles (temperature, specific humidity, and refractivity) at the location of this BRO sounding with tangent point at 5 km above mean sea level (a.m.s.l.) are shown in Fig. 5. During the occultation event, the local atmosphere was hot and very dry, particularly above 5 km. Additionally, the planetary boundary layer height (PBLH) detected using the gradient method (Ao et al., 2008, 2012; Nelson et al., 2021; Winning et al., 2017) for this case was found to be at approximately 0.9 km, clearly marked by a distinct temperature inversion (dash-dotted gold line) and weak vertical gradients in specific humidity (dotted gray line) and refractivity (dashed blue lines) shown in Fig. 5). The cold-point tropopause was located around 15 km altitude.

Figure 5ERA5 vertical profiles of temperature (T, gold), specific humidity (q, gray), and refractivity (N, blue) at 06:00 UTC, colocated with the World View G26 BRO case on 22 August 2020. Note that for display purposes, 1/10 of the refractivity () was plotted. In addition, the colocation longitude and latitude of the BRO profile are indicated. Dashed lines indicate the planetary boundary layer height (PBLH) as determined by the gradient method from each variable (see text for details).
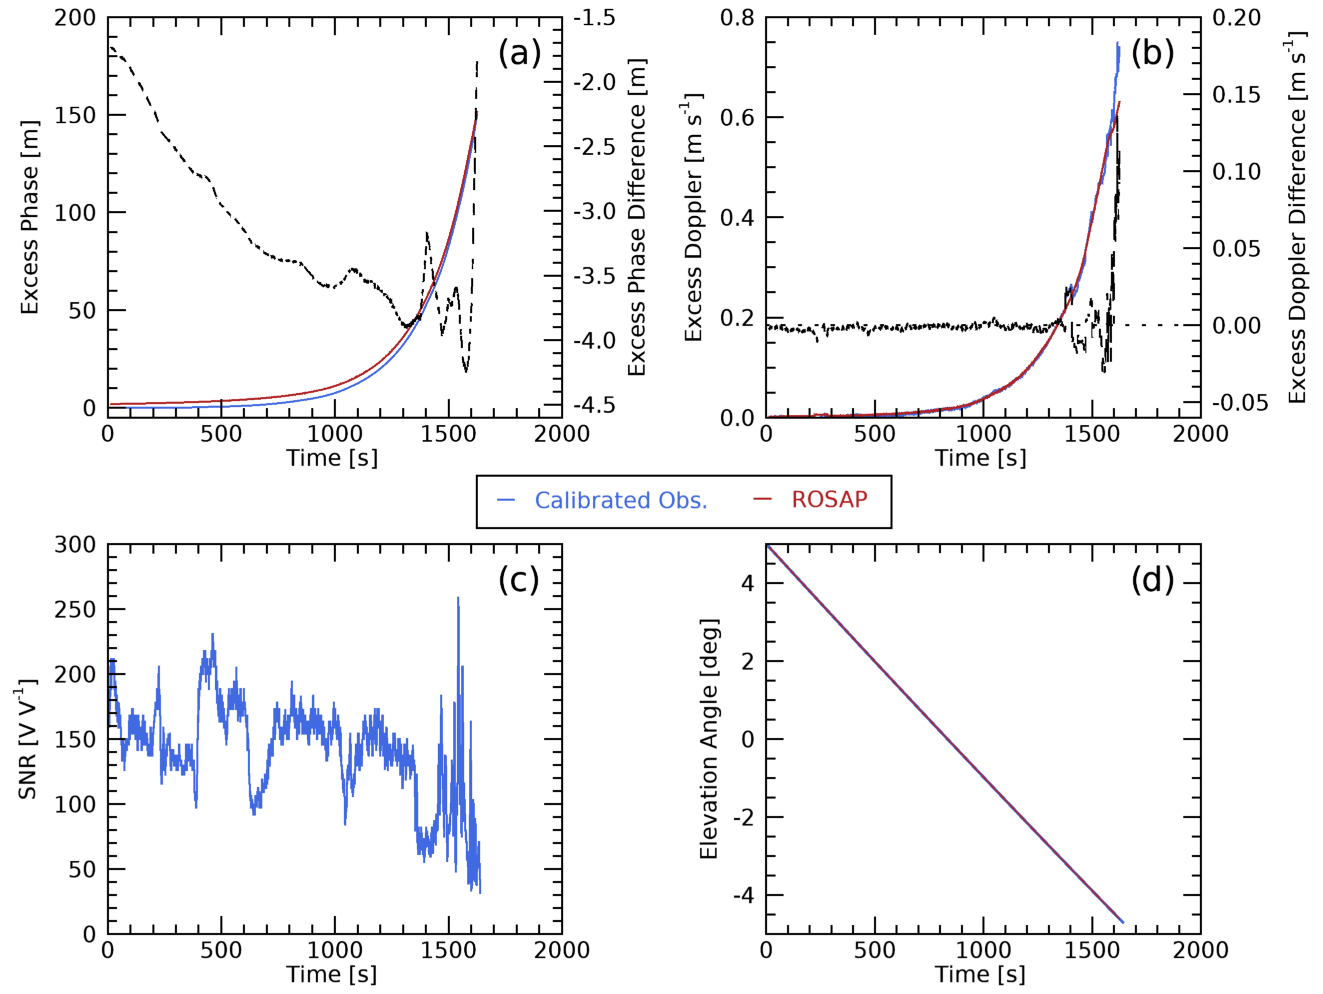
Figure 6WVG26 time series of (a) excess phase, (b) excess Doppler, (c) signal-to-noise ratio, and (d) elevation angle from calibrated observations (blue) and ROSAP ray-tracing simulation (red). Dashed lines in panels (a) and (b) represent differences between the LOS observations and the ROSAP simulation.
Figure 6a shows the WVG26 calibrated excess phase observations (blue) alongside the excess phase from the ROSAP simulation (red) and the difference between the LOS observations and the ROSAP simulation (dashed black line). The calibrated excess phase delay compares favorably with the corresponding ROSAP excess phase, with differences between the two being within 3 m of each other throughout the whole time series. The high consistency throughout the time series is also seen in the excess Doppler comparison (Fig. 6b), with differences only exceeding 0.01 m s−1 at the end of the time series. The observed L1 SNR for the WVG26 case is shown in Fig. 6c. As the signal penetrates deeper into the atmosphere (i.e., the elevation angle dips below the local horizon to approximately −4.5∘; Fig. 6d), the SNR typically decreases and becomes much more variable due to high signal dynamics resulting from the fine moisture variations in the lower troposphere. The overall mean L1 SNR from the GROOT receiver (141.79 V V−1) is smaller than the mean SNR from the COSMIC-1 and SAC-C GNSS RO satellite missions (approximately 700 V V−1; Ao et al., 2009; Ho et al., 2020). Although the L1 SNR values from the Piksi receiver are approximately 5 times less than the values from spaceborne RO missions, considering the compact size of the Piksi receiver, such high L1 SNR values are quite impressive and can be partially attributed to the smaller defocusing effect compared to that of spaceborne ROs, as the Piksi receiver is inside the atmosphere.
Figure 7a shows the BRO bending angle profiles from GO and FSI retrievals as a function of impact height (impact parameter minus the local curvature radius of the Earth) for the WVG26 case. Note that, as discussed in Sect. 2.3, the noisy αpos and αneg within 1.5 km below the receiver height were replaced by the simulated FAI bending angle based on the colocated ERA5 refractivity profile (Fig. 5). Figure 7a also shows a conceptual calculation of the partial bending angle as discussed in Sect. 2.3. At each impact height, αpos is subtracted from αneg to calculate the partial bending angle (αpart), which is later used to retrieve the final refractivity profile. Figure 7b shows the partial bending angle calculated using the method shown in Fig. 7a with 100 m log-linear vertical smoothing applied. It is worth noting that BRO bending angle observations from both the GO and FSI retrievals match the colocated ERA5 FAI and ROSAP simulations quite well from the balloon altitude (just over 18 km) all the way down to impact heights of around 6 km (corresponding to approximately 4 km a.m.s.l.). Differences between the retrievals and the ROSAP simulation between 10 and 11 km, as well as between 6 and 8 km, are most likely caused by platform yaw instability, as discussed in Sect. 2.1.
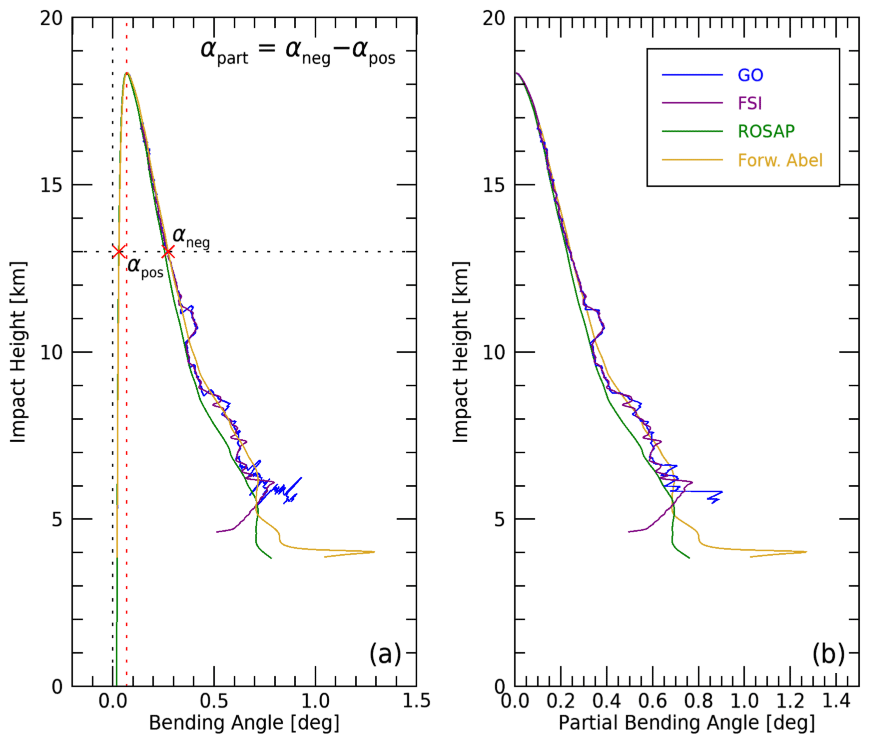
Figure 7(a) Bending angle for WVG26 case from the GO retrieval (blue) and FSI retrieval (purple), in comparison with the colocated ERA5 bending angle from ROSAP ray-tracing simulation (green), and forward-Abel-integrator (gold). Conceptual calculation of partial bending angle at 13 km impact height is also shown. (b) Final partial bending angle for WVG26 case from the GO retrieval (blue), FSI retrieval (purple), ROSAP ray-tracing simulation (green), and Forward Abel transform (gold).
Figure 8a shows the refractivity retrieval for the WVG26 BRO case. The 5 km tangent height ERA5 refractivity profile colocated with the WVG26 case is approximately 425 km from the receiver (zero-elevation) location, and the terrain changes significantly compared to the origin point in the Tonto National Forest in Arizona, USA. From the top of the refractivity profiles, both the GO and FSI retrievals match the ERA5 refractivity profile from the location of the 5 km tangent height very well. Similar to the αpart results, the refractivity retrieval from FSI bending angle reaches about 1 km deeper into the atmosphere than the GO retrieval, highlighting the usefulness of the FSI over GO methods. This is primarily due to the improvement from FSI in terms of resolving the multi-path problem of the GO method in the moist lower troposphere.
In order to quantify the differences between the retrievals and the colocated ERA5 profile, the fractional refractivity difference profile is calculated. Figure 8b shows the fractional refractivity difference between the refractivity retrievals and the colocated ERA5 profile, respectively. The GO retrieval is highly consistent with FSI retrieval above ∼ 7.5 km and starts showing small differences below. Both retrievals perform very well in the middle troposphere, between 5 and 10 km. Once more water vapor is encountered below 5 km altitude, the magnitude of the median difference for the GO retrieval increases. Additionally, intermittent signal degradation and loss due to platform yaw rotation likely induces retrieval errors in the FSI retrieval and stops the GO retrieval closer to the surface, resulting in sharp changes in N bias for both retrievals.

Figure 8(a) BRO refractivity retrieval for WVG26 case from GO (blue) and FSI (purple) compared to the colocated refractivity profile from ERA5. (b) Fractional refractivity difference between BRO retrieval and ERA5 (GO, black; FSI, red). Local terrain at the location of BRO tangent point at 5 km a.m.s.l. is marked by tan polygons.
Figure 9 shows the fractional refractivity difference between GO and FSI retrievals and the colocated ERA5 profile for each BRO sounding from the World View flight campaign. Individual fractional refractivity difference profiles are calculated by interpolating the retrieval and ERA5 profiles to the same 10 m vertical grid before taking the difference between the refractivity profiles. Summary statistics for all World View flight campaign BRO profiles calculated over different height ranges are shown in Table 1. The median refractivity difference between the GO retrieval and the colocated ERA5 oscillates within 0.25 %, with median absolute deviation (MAD) between 0.71 % above 15 km and approximately 2.28 % across all levels (see Table 1). The GO refractivity retrieval starts showing negative N biases below approximately 6 km, with a median refractivity difference of −5.86 % (MAD: 1.99 %) over the 0–5 km height range. The FSI retrieval also starts showing negative N biases below approximately 6 km but with a smaller median difference of −3.60 % (MAD: 3.26 %). The higher-magnitude N biases in the lowest portions of the troposphere have a variety of potential causes. The lowest-level negative N bias is likely caused by the tracking errors introduced by the closed-loop tracking receiver, which is a well-known problem that could easily degrade the BRO observation quality (Ao et al., 2009; Wang et al., 2013). Additionally, high spatial variations in moisture content can also cause low SNR or high signal dynamics, ultimately resulting in a negative bending angle biases (Wang et al., 2016). It is also important to consider that there is likely to be increased low-sampling bias closer to the surface, weakening the robustness of the statistics.
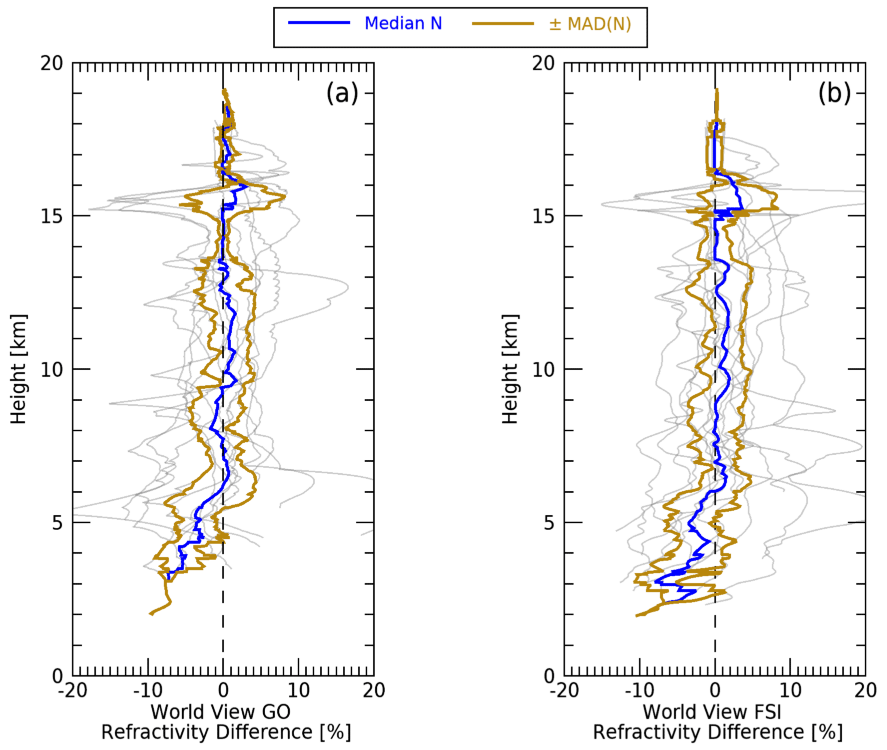
Figure 9Fractional refractivity difference between BRO retrievals and the colocated ERA5 for (a) GO retrievals and (b) FSI retrievals of all World View cases (gray). The median fractional refractivity difference profiles are shown in blue, and the median ± the median absolute deviation (MAD) is shown in gold.
Table 1Summary statistics for median refractivity differences between GO and FSI retrievals and the colocated ERA5, with corresponding median absolute deviation over varying height ranges from all World View flight campaign BRO profiles.
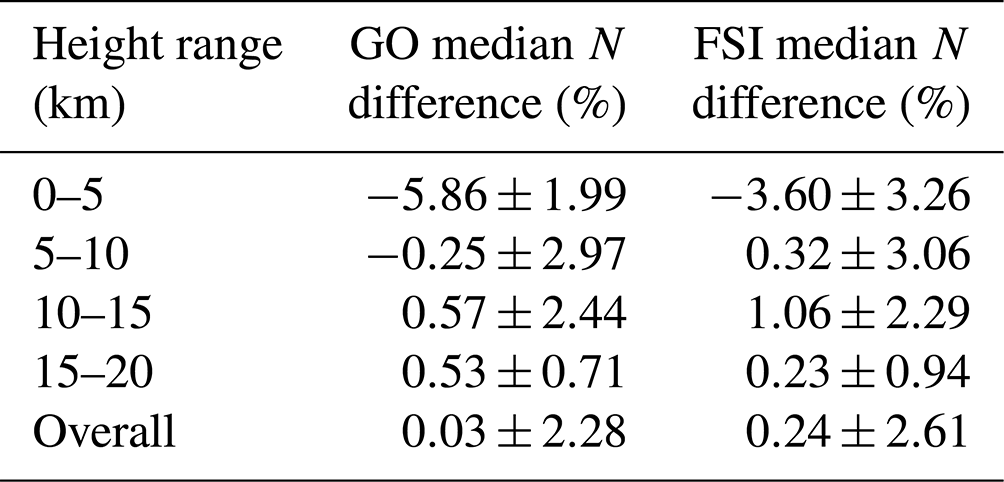
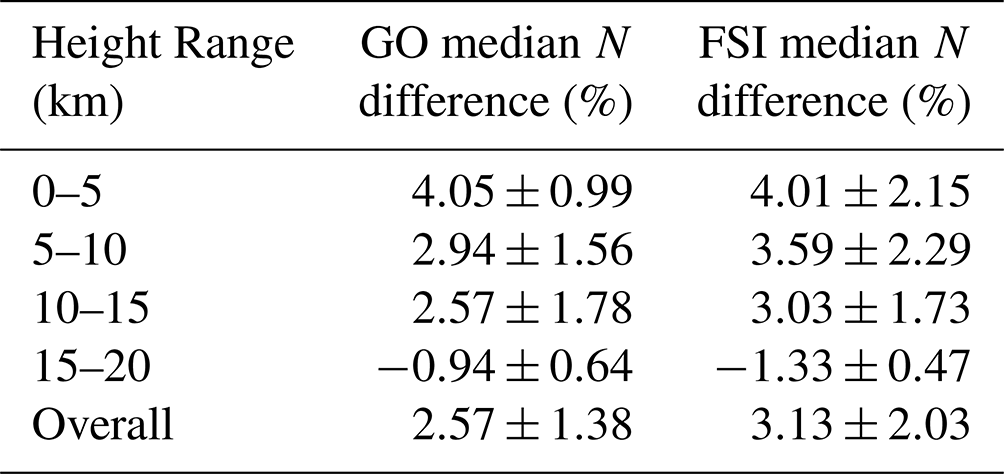
Figure 10 shows the fractional refractivity difference profiles for the ZPM-1 flight campaign from the GO and FSI retrievals. The ZPM-1 refractivity differences are slightly positively biased overall compared to the World View campaign data. The ZPM-1 refractivity differences from both retrieval methods show less variability across all heights in both the median profile and the individual refractivity profiles. The ZPM-1 refractivity differences are also slightly positively biased overall compared to the World View campaign data. The GO retrieval has an overall median refractivity difference of 2.57 % (MAD: 1.38 %; see Table 2). The maximum N bias from the GO retrieval is 4.05 % in the lower troposphere. The FSI retrieval has an overall median refractivity difference of 3.13 % (MAD: 2.03 %). The World View platform had rotational yaw control capability, whereas the ZPM-1 platform did not – as such, the platform and GNSS antennae were free to spin during high-altitude wind gusts. During RO events, rotational movement likely induced position errors in the dual-antenna navigation system as a result of SNR degradation, which could potentially result in larger N biases. Such a phenomenon warrants future investigation of BRO platform control on BRO retrievals.

Errors and biases in BRO refractivity retrievals can come from a variety of potential sources. One potential cause is the difference in precise orbit determination (POD) solutions for BRO missions. Generally speaking, POD solutions for LEO missions aim to have LEO velocity accuracies of 0.5 mm s−1 or better and LEO position accuracies of 10 cm or better. In contrast, BRO missions are generally capable of velocity accuracies of 30 mm s−1 or better and position accuracies of 5 cm or better. The larger POD velocity errors are due to difficult-to-model disturbances such as wind gusts and other aerodynamic factors. Xie et al. (2008) showed that the addition of simulated 5 mm s−1 random excess Doppler errors will not result in additional N biases but could possibly introduce less than 1 % refractivity error near the receiver (10 km) and less than 0.2 % below ∼ 6 km. In the case of our study, the larger BRO receiver positioning errors (if random) will likely not introduce significant N biases (Fig. 9) for World View or ZPM-1 cases.
As discussed previously, the limitations of closed-loop tracking receivers may also affect the BRO refractivity retrieval quality. Additionally, low SNR in in-atmosphere GNSS RO observations can potentially result in approximately ±5 % refractivity error (Wang et al., 2016). This estimate is consistent with the overall results shown here, meaning that an improvement to SNR in the lower atmosphere would be extremely beneficial. However, it is important to note that, despite the overall positive bias in the ZPM-1 cases, the median absolute deviation of the cases minimizes in the upper and middle troposphere, much like the World View campaign data. One important caveat for the ZPM-1 campaign data is the small number of available occultations. Furthermore, power loss issues on the platform during the flights caused a decrease in the number of occultations. The low sampling numbers could also lead to larger median refractivity differences.
In this study, the GNSS RO atmospheric profiling technique has been adapted for use on high-altitude balloon platforms. Most of the past airborne and balloon-borne RO payloads require custom-made parts and costly operational expenses that require significant investments. We show the successful implementation of the Night Crew Labs GROOT payload developed from commercial off-the-shelf (COTS) components on high-altitude balloon platforms. This approach is simpler and significantly more affordable than current airborne and space-based methods. The results from the low-cost, highly compact GROOT payload are promising, but more study is needed.
Utilizing a balloon platform for GNSS RO observations has been done only a few times in the past. Haase et al. (2012) showed the proof of concept for balloon-borne GNSS RO using a custom-built receiver during the Concordiasi field campaign (Rabier et al., 2010, 2013) and found excess Doppler agreement that would correspond to approximately 1 % refractivity difference, indicating that BRO is able to produce high-quality RO profiles. Cao et al. (2022) showed that BRO retrievals can be used to identify equatorial Kelvin waves during long-duration balloon flights with minimal error in the observations. The BRO retrievals from the GROOT payload have refractivity differences in the middle and upper troposphere that are comparable to previous airborne and balloon-borne RO studies (Adhikari et al., 2016; Haase et al., 2012; Xie et al., 2008; Healy et al., 2002). The added benefit of using BRO platforms is the dense spatial and temporal sampling over targeted regions due to the low platform velocities relative to the LEO-based RO satellites. Additionally, BRO platforms are scalable and can potentially be launched in advance of significant weather events and remain aloft for long periods of time to collect abundant RO observations.
Currently, the major limitation of BRO platforms with COTS payloads is the use of closed-loop tracking GNSS receivers, which limit penetration of RO observations into the lower troposphere due to the large variations in moisture content. Additionally, closed-loop tracking also prohibits the tracking of rising occultations, cutting the potential number of RO soundings in half. For these reasons, design and implementation of COTS payloads capable of open-loop tracking is the next natural step to improving balloon-borne RO. Furthermore, BRO platform orientation can be uncontrolled, so a sudden change in winds aloft can alter the antenna position and cause signal loss. Additionally, the comparatively slow-moving receivers result in longer occultations (approximately 20–30 min for one balloon-borne RO event in comparison to ∼ 1 min for one spaceborne RO event), which can result in larger unwrapping errors (Wang et al., 2016) and lead to further underestimates of bending angle in the moist lower troposphere.
An analysis of the quality of the retrieved refractivity profiles reveals that the overall median refractivity difference for the World View campaign is generally less than 1 %. The same analysis of the ZPM-1 campaign data shows that the median is slightly positively biased overall (approximately 3 %) but with similar median absolute deviation values. While both GO and FSI retrieval methods offer promising results, it appears that the FSI retrievals tend to outperform the GO retrievals in terms of atmospheric penetration. The limitation of the closed-loop tracking could be the primary cause of the negative N biases below 6 km as seen in World View BRO soundings. In addition, the relatively low SNR in the lower troposphere could also lead to negative bending angle bias, which could also be another likely cause of the negative refractivity biases in the lower troposphere.
This study shows that high-altitude balloons with RO payloads can be launched over areas of complex terrain, can potentially remain aloft for far longer than airborne RO platforms, and would hypothetically be deployable in all weather conditions, similar to radiosondes. Furthermore, the balloon-borne RO platform can offer unprecedented high spatial and temporal BRO sampling over targeted regions far higher than traditional spaceborne RO (see Fig. 2). Additionally, balloon-borne RO data could be much more cost effective to retrieve due to the low-cost COTS GNSS RO receiver and overall affordability of the high-altitude balloon flight platform, as the instrument can be retrieved and reused after each deployment. We believe the advances in the COTS GNSS RO receiver development and high-altitude balloon platform control in the future will lead to large increases in high-quality localized BRO soundings over targeted weather events (e.g., severe thunderstorms, tropical cyclones) and improve regional weather forecasts through data assimilation.
Balloon-borne RO can collect high-density observations around the platform, particularly compared to spaceborne ROs. Figure A1 shows a Sankey plot filtering visualization of the World View predicted occultations. On board the GROOT payload, duplicate Piksi receivers were used to ensure all GNSS constellations were tracked. Piksi 1 was programmed to log data from GPS, Galileo, Glonass, and Beidou, whereas Piksi 2 was only programmed to log data from GPS and Galileo. As such, Piksi 2 was able to log more ROs from GPS. We believe the Piksi receivers and antennae were manufactured in such a way that they were tuned to maximize GPS performance; as such, satellites from the GPS constellation consistently showed better performance than the other constellations.
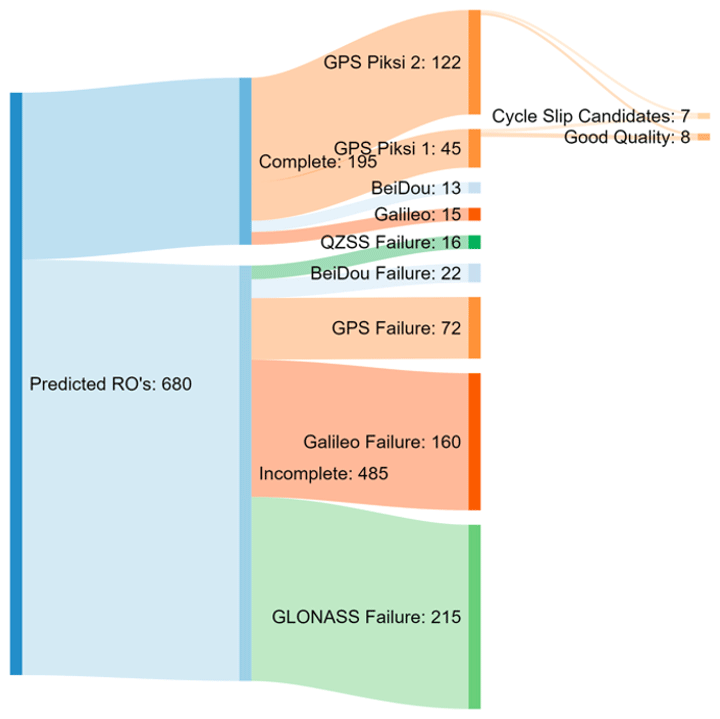
Figure A1Sankey filtering plot visualizing the balloon-borne RO case filtering from the World View campaign.
Of the original 680 predicted ROs from all GNSS constellations (originally discussed in Sect. 2.1), a total of 485 were incomplete and therefore not suitable for retrieval processing. The remaining 195 occultations were then filtered further by removing those from QZSS, Galileo, BeiDou, and GLONASS with low quality due to the frequency tuning inherent to the Piksi receiver. Of the 167 from the GPS system, only 8 good-quality cases were ready to use immediately. Another 7 cases required additional pre-processing in the form of cycle slip corrections. The same process was also applied for cases observed during the ZPM-1 flight campaign.
TAMUCC-derived balloon-borne RO data and retrievals used in this study are publicly available from the NOAA National Center for Environmental Information under CC-BY-NC-SA 4.0 licensing (https://doi.org/10.25921/ex5z-7r81; Nelson et al., 2022). TAMUCC-derived balloon-borne RO data and retrievals are also available upon request by contacting Kevin J. Nelson at kevin.j.nelson@jpl.nasa.gov. NCL-derived balloon-borne RO data and retrievals used in this study are available upon request by contacting Bryan C. Chan at bryan@nightcrewlabs.com.
All ERA5 data (Hersbach et al., 2020) are available to download from ECMWF and CDS with proper registration and credentials. Instructions for download can be found in https://confluence.ecmwf.int/display/CKB/How+to+download+ERA5 (last access: 26 January 2023).
BCC and FX developed the concept for the study. BCC, AG, TGRR, PMT, JK, and CRS completed payload engineering. BCC, FX, and AG developed the methodology for the study. KJN, FX, JK, and AG developed the software used for this study. KJN, BCC, JK, and AG completed data validation at different steps. Formal analysis was completed by KJN, JK, AG, and FX. Data curation was done by KJN. Data visualization was done by KJN, JK, and AG. Initial drafts of this paper were written by KJN. Editing and review of the paper were completed by KJN, FX, BCC, and TGRR. Project administration, funding acquisition, and supervision were done by BCC and FX.
The contact author has declared that none of the authors has any competing interests.
This work was done as a private venture and not in the authors' capacity as an employee of the Jet Propulsion Laboratory, California Institute of Technology.
Publisher’s note: Copernicus Publications remains neutral with regard to jurisdictional claims in published maps and institutional affiliations.
This paper is supported by NOAA grant no. 1305M2-19-C-NRMW-0015. Kevin J. Nelson acknowledges the research assistantship support from the Coastal Marine System Science Program at Texas A&M University – Corpus Christi. Authors from Night Crew Labs acknowledge additional support from NASA grant no. 80NSSC20K0106. The authors would also like to thank Loknath Adhikari from the University of Maryland for the productive discussion. The anonymous reviewers are also acknowledged for their insight and comments to improve this paper.
This research has been supported by the National Oceanic and Atmospheric Administration, NOAA Research (grant no. 1305M2-19-C-NRMW-0015) and the National Aeronautics and Space Administration, Science Mission Directorate (grant no. 80NSSC20K0106).
This paper was edited by Roeland Van Malderen and reviewed by two anonymous referees.
Adhikari, L., Xie, F., and Haase, J. S.: Application of the full spectrum inversion algorithm to simulated airborne GPS radio occultation signals, Atmos. Meas. Tech., 9, 5077–5087, https://doi.org/10.5194/amt-9-5077-2016, 2016. a, b, c, d, e, f
Anthes, R. A., Bernhardt, P. A., Chen, Y., Cucurull, L., Dymond, K. F., Ector, D., Healy, S. B., Ho, S. P., Hunt, D. C., Kuo, Y. H., Liu, H., Manning, K., McCormick, C., Meehan, T. K., Randel, W. J., Rocken, C., Schreiner, W. S., Sokolovskiy, S. V., Syndergaard, S., Thompson, D. C., Trenberth, K. E., Wee, T. K., Yen, N. L., and Zeng, Z.: The COSMIC/FORMOSAT-3 Mission: Early Results, B. Am. Meteorol. Soc., 89, 313–334, https://doi.org/10.1175/bams-89-3-313, 2008. a
Ao, C. O., Chan, T. K., Iijima, A., Li, J.-L., Mannucci, A. J., Teixeira, J., Tian, B., and Waliser, D. E.: Planetary Boundary Layer Information from GPS Radio Occultation Measurements, GRAS SAF Workshop on Applications of GPSRO Measurements, 123–131, 2008. a
Ao, C. O., Hajj, G. A., Meehan, T. K., Dong, D., Iijima, B. A., Mannucci, A. J., and Kursinski, E. R.: Rising and setting GPS occultations by use of open-loop tracking, J. Geophys. Res., 114, D04101, https://doi.org/10.1029/2008jd010483, 2009. a, b
Ao, C. O., Waliser, D. E., Chan, S. K., Li, J.-L., Tian, B., Xie, F., and Mannucci, A. J.: Planetary boundary layer heights from GPS radio occultation refractivity and humidity profiles, J. Geophys. Res.-Atmos., 117, D16117, https://doi.org/10.1029/2012jd017598, 2012. a
Boullot, N., Rabier, F., Langland, R., Gelaro, R., Cardinali, C., Guidard, V., Bauer, P., and Doerenbecher, A.: Observation impact over the southern polar area during the Concordiasi field campaign, Q. J. Roy. Meteor. Soc., 142, 597–610, https://doi.org/10.1002/qj.2470, 2014. a
Bowler, N. E.: An assessment of GNSS radio occultation data produced by Spire, Q. J. Roy. Meteor. Soc., 146, 3772–3788, https://doi.org/10.1002/qj.3872, 2020. a
Cao, B., Haase, J. S., Murphy, M. J., Alexander, M. J., Bramberger, M., and Hertzog, A.: Equatorial waves resolved by balloon-borne Global Navigation Satellite System radio occultation in the Strateole-2 campaign, Atmos. Chem. Phys., 22, 15379–15402, https://doi.org/10.5194/acp-22-15379-2022, 2022. a, b
Cardinali, C. and Healy, S.: Impact of GPS radio occultation measurements in the ECMWF system using adjoint-based diagnostics: Impact of GPS radio occultation measurements, Q. J. Roy. Meteor. Soc., 140, 2315–2320, https://doi.org/10.1002/qj.2300, 2014. a
Carreno-Luengo, H., Camps, A., Querol, J., and Forte, G.: First Results of a GNSS-R Experiment From a Stratospheric Balloon Over Boreal Forests, IEEE T. Geosci. Remote, 54, 2652–2663, https://doi.org/10.1109/tgrs.2015.2504242, 2016. a
Chan, B. C., Goel, A., Kosh, J., Reid, T. G. R., Snyder, C. R., Tarantino, P. M., Soedarmadji, S., Soedarmadji, W., Nelson, K. J., Xie, F., and Vergalla, M.: GNSS Radio Occultation on Aerial Platforms with Commercial Off-the-Shelf Receivers, ION GNSS Proceedings, https://doi.org/10.48550/arXiv.2109.13328, 2021. a, b, c
Chan, B. C., Goel, A., Kosh, J., Reid, T. G. R., Snyder, C. R., Tarantino, P. M., Soedarmadji, S., Soedarmadji, W., Nelson, K., Xie, F., and Vergalla, M.: Commercial GNSS Radio Occultation on Aerial Platforms With Off-The-Shelf Receivers, Navigation-US, 69, navi.544, https://doi.org/10.33012/navi.544, 2022. a, b, c, d, e, f
Fjeldbo, G. and Eshleman, V. R.: Atmosphere of Venus as Studied with the Mariner 5 Dual Radio-Frequency Occultation Experiment, Radio Sci., 4, 879–897, https://doi.org/10.1029/RS004i010p00879, 1969. a, b, c
Fjeldbo, G., Kliore, A. J., and Eshleman, V. R.: The neutral atmosphere of Venus as studied with the Mariner V radio occultation experiments, Astron. J., 76, 123–140, https://doi.org/10.1086/111096, 1971. a, b
Garrison, J. L., Walker, M., Haase, J. S., Lulich, T., Xie, F., Ventre, B., Boehme, M. H., Wilmhoff, B., and Katzberg, S. J.: Development and Testing of the GISMOS Instrument, in: IGARSS Barcelona 2007: Sensing and Understanding Our Planet, IEEE International, 5105–5108, https://doi.org/10.1109/IGARSS.2007.4424010, 2007. a
Haase, J. S., Maldonado-Vargas, J., Rabier, F., Cocquerez, P., Minois, M., Guidard, V., Wyss, P., and Johnson, A. V.: A proof-of-concept balloon-borne Global Positioning System radio occultation profiling instrument for polar studies, Geophys. Res. Lett., 39, 1–5, https://doi.org/10.1029/2011gl049982, 2012. a, b, c
Haase, J. S., Alexander, M. J., Hertzog, A., Kalnajs, L., Deshler, T., Davis, S. M., Plougonven, R., Cocquerez, P., and Venel, S.: Around the World in 84 Days, EOS, 99, 32–38, https://doi.org/10.1029/2018EO091907, 2018. a
Harnisch, F., Healy, S. B., Bauer, P., and English, S. J.: Scaling of GNSS Radio Occultation Impact with Observation Number Using an Ensemble of Data Assimilations, Mon. Weather Rev., 141, 4395–4413, https://doi.org/10.1175/mwr-d-13-00098.1, 2013. a
Healy, S. B., Haase, J., and Lesne, O.: Letter to the Editor, Abel transform inversion of radio occultation measurements made with a receiver inside the Earth’s atmosphere, Ann. Geophys., 20, 1253–1256, https://doi.org/10.5194/angeo-20-1253-2002, 2002. a, b, c
Hersbach, H., Bell, B., Berrisford, P., Hirahara, S., Horányi, A., Muñoz-Sabater, J., Nicolas, J., Peubey, C., Radu, R., Schepers, D., Simmons, A., Soci, C., Abdalla, S., Abellan, X., Balsamo, G., Bechtold, P., Biavati, G., Bidlot, J., Bonavita, M., De Chiara, G., Dahlgren, P., Dee, D., Diamantakis, M., Dragani, R., Flemming, J., Forbes, R., Fuentes, M., Geer, A., Haimberger, L., Healy, S., Hogan, R. J., Hólm, E., Janisková, M., Keeley, S., Laloyaux, P., Lopez, P., Lupu, C., Radnoti, G., de Rosnay, P., Rozum, I., Vamborg, F., Villaume, S., and Thépaut, J.-N.: The ERA5 Global Reanalysis, Q. J. Roy. Meteor. Soc., 146, 1999–2049, https://doi.org/10.1002/qj.3803, 2020. a, b
Ho, S.-p., Anthes, R. A., Ao, C. O., Healy, S., Horanyi, A., Hunt, D., Mannucci, A. J., Pedatella, N., Randel, W. J., Simmons, A., Steiner, A., Xie, F., Yue, X., and Zeng, Z.: The COSMIC/FORMOSAT-3 Radio Occultation Mission after 12 Years: Accomplishments, Remaining Challenges, and Potential Impacts of COSMIC-2, B. Am. Meteorol. Soc., 101, E1107–E1136, https://doi.org/10.1175/bams-d-18-0290.1, 2020. a
Høeg, P., Hauchecorne, A., Kirchengast, G., Syndergaard, S., Belloul, B., Leitinger, R., and Rothleitner, W.: Derivation of Atmospheric Properties using a Radio Occultation Technique, Tech. rep., Danish Meteorological Institute, Copenhagen, Denmark, ISBN 87-7478-331-9, 1996. a
Imamura, T., Ando, H., Tellmann, S., Pätzold, M., Häusler, B., Yamazaki, A., Sato, T. M., Noguchi, K., Futaana, Y., Oschlisniok, J., Limaye, S., Choudhary, R. K., Murata, Y., Takeuchi, H., Hirose, C., Ichikawa, T., Toda, T., Tomiki, A., Abe, T., Yamamoto, Z.-i., Noda, H., Iwata, T., Murakami, S.-Y., Satoh, T., Fukuhara, T., Ogohara, K., Sugiyama, K.-I., Kashimura, H., Ohtsuki, S., Takagi, S., Yamamoto, Y., Hirata, N., Hashimoto, G. L., Yamada, M., Suzuki, M., Ishii, N., Hayashiyama, T., Lee, Y. J., and Nakamura, M.: Initial performance of the radio occultation experiment in the Venus orbiter mission Akatsuki, Earth Planets Space, 69, 137, https://doi.org/10.1186/s40623-017-0722-3, 2017. a
Jensen, A. S., Lohmann, M. S., Benzon, H.-H., and Nielsen, A. S.: Full Spectrum Inversion of radio occultation signals, Radio Sci., 38, 1–15, https://doi.org/10.1029/2002rs002763, 2003. a
Kliore, A. J., Cain, D. L., Fjeldbo, G., Seidel, B. L., Sykes, M. J., and Rasool, S. I.: The Atmosphere of Mars from Mariner 9 Radio Occultation Measurements, Icarus, 17, 484–516, 1972. a
Kursinski, E. R., Hajj, G. A., Bertiger, W. I., Leroy, S. S., Meehan, T. K., Romans, L. J., Schofield, J. T., McCleese, D. J., Melbourne, W. G., Thornton, C. L., Yunck, T. P., Eyre, J. R., and Nagafini, R. N.: Initial Results of Radio Occultation Observations of Earth’s Atmosphere Using the Global Positioning System, Science, 271, 1107–1110, 1996. a
Kursinski, E. R., Hajj, G. A., Schofield, J. T., Linfield, R. P., and Hardy, K. R.: Observing Earth's atmosphere with radio occultation measurements using the Global Positioning System, J. Geophys. Res.-Atmos., 102, 23429–23465, https://doi.org/10.1029/97jd01569, 1997. a, b, c
Kursinski, E. R., Hajj, G. A., Leroy, S. S., and Herman, B.: The GPS Radio Occultation Technique, Terr. Atmos. Ocean. Sc., 11, 53–114, 2000. a, b
Lesne, O., Haase, J. S., Kirchengast, G., Ramsauer, J., and Poetzi, W.: Sensitivity analysis for airborne sounding of the troposphere by GNSS radio occultation, Phys. Chem. Earth, 27, 291–299, https://doi.org/10.1016/S1474-7065(02)00003-7, 2002. a
Lindal, G. F.: The atmosphere of Neptune-an analysis of radio occultation data acquired with Voyager 2, Astron. J., 103, 967–982, 1992. a
Lindal, G. F., Hotz, H. B., Sweetnam, D. N., Shippony, Z., Brenkle, J. P., Hartsell, G. V., Spear, R. T., and Michael, W. H.: Viking radio occultation measurements of the atmosphere and topography of Mars: Data acquired during 1 Martian year of tracking, J. Geophys. Res., 84, 8443–8456, https://doi.org/10.1029/JB084iB14p08443, 1979. a
Luntama, J.-P., Kirchengast, G., Borsche, M., Foelsche, U., Steiner, A., Healy, S., von Engeln, A., O’Clerigh, E., and Marquardt, C.: Prospects of the EPS GRAS Mission for Operational Atmospheric Applications, B. Am. Meteorol. Soc., 89, 1863–1875, https://doi.org/10.1175/2008BAMS2399.1, 2008. a
Murphy, B. J., Haase, J. S., Muradyan, P., Garrison, J. L., and Wang, K. N.: Airborne GPS radio occultation refractivity profiles observed in tropical storm environments, J. Geophys. Res.-Atmos., 120, 1690–1709, https://doi.org/10.1002/2014jd022931, 2015. a
National Academies of Sciences: Thriving on Our Changing Planet: A Decadal Strategy for Earth Observation from Space, The National Academies Press, Washington, DC, https://doi.org/10.17226/24938, 2018. a
National Aeronautics and Space Administration: NASA ESDS Commercial Smallsat Data Acquisition (CSDA) Program, NASA, https://www.earthdata.nasa.gov/esds/csda (last access: 25 January 2023), 2022. a
National Oceanic and Atmospheric Administration and National Environmental Satellite, Data, and Information Service: Commercial Weather Data Pilot (CWDP) Round 2 Summary, Tech. rep., National Oceanic and Atmospheric Administration, https://www.space.commerce.gov/wp-content/uploads/2020-06-cwdp-round-2-summary.pdf (last access: 12 October 2022), 2020. a
Nelson, K. J., Xie, F., Ao, C. O., and Oyola-Merced, M. I.: Diurnal Variation of the Planetary Boundary Layer Height Observed from GNSS Radio Occultation and Radiosonde Soundings over the Southern Great Plains, J. Atmos. Ocean. Tech., 38, 2081–2093, https://doi.org/10.1175/jtech-d-20-0196.1, 2021. a
Nelson, K. J., Xie, F., Chan, B. C., Goel, A., Kosh, J., Reid, T. G. R., Snyder, C. R., and Tarantino, P. M.: GNSS Radio Occultation Soundings from Commercial Off-the-Shelf Receivers Onboard Balloon Platforms (NCEI Accession 0254366), NOAA National Centers for Environmental Information [data set], https://doi.org/10.25921/ex5z-7r81, 2022. a
Rabier, F., Bouchard, A., Brun, E., Doerenbecher, A., Guedj, S., Guidard, V., Karbou, F., Peuch, V.-H., El Amraoui, L., Puech, D., Genthon, C., Picard, G., Town, M., Hertzog, A., Vial, F., Cocquerez, P., Cohn, S. A., Hock, T., Fox, J., Cole, H., Parsons, D., Powers, J., Romberg, K., VanAndel, J., Deshler, T., Mercer, J., Haase, J. S., Avallone, L., Kalnajs, L., Mechoso, C. R., Tangborn, A., Pellegrini, A., Frenot, Y., Thépaut, J.-N., McNally, A., Balsamo, G., and Steinle, P.: The Concordiasi Project in Antarctica, B. Am. Meteorol. Soc., 91, 69–86, https://doi.org/10.1175/2009bams2764.1, 2010. a, b
Rabier, F., Cohn, S., Cocquerez, P., Hertzog, A., Avallone, L., Deshler, T., Haase, J., Hock, T., Doerenbecher, A., Wang, J., Guidard, V., Thépaut, J.-N., Langland, R., Tangborn, A., Balsamo, G., Brun, E., Parsons, D., Bordereau, J., Cardinali, C., Danis, F., Escarnot, J.-P., Fourrié, N., Gelaro, R., Genthon, C., Ide, K., Kalnajs, L., Martin, C., Meunier, L.-F., Nicot, J.-M., Perttula, T., Potts, N., Ragazzo, P., Richardson, D., Sosa-Sesma, S., and Vargas, A.: The Concordiasi Field Experiment over Antarctica: First Results from Innovative Atmospheric Measurements, B. Am. Meteorol. Soc., 94, ES17–ES20, https://doi.org/10.1175/bams-d-12-00005.1, 2013. a, b
Ruston, B. and Healy, S.: Forecast Impact of FORMOSAT‐7/COSMIC‐2 GNSS Radio Occultation Measurements, Atmos. Sci. Lett., 22, e1019, https://doi.org/10.1002/asl.1019, 2020. a
Schreiner, W. S., Weiss, J. P., Anthes, R. A., Braun, J., Chu, V., Fong, J., Hunt, D., Kuo, Y.-H., Meehan, T., Serafino, W., Sjoberg, J., Sokolovskiy, S., Talaat, E., Wee, T. K., and Zeng, Z.: COSMIC‐2 Radio Occultation Constellation: First Results, Geophys. Res. Lett., 47, e2019GL086841, https://doi.org/10.1029/2019gl086841, 2020. a
Shi, J. Q. and Choi, T.: Gaussian Process Regression Analysis for Functional Data, CRC Press, Boca Raton, FL, USA, ISBN 978-1-4398-3773-3, 2011. a
Vorob'ev, V. V. and Krasil'nikova, T. G.: Estimation of the Accuracy of the Atmospheric Refractive Index Recovery from Doppler Shift Measurements at Frequencies Used in the NAVSTAR System, Phys. Atmos. Ocean, 29, 602–609, 1994. a
Wang, K.-N., Muradyan, P., Garrison, J. L., Haase, J. S., Murphy, B., Acikoz, U., and Lulich, T.: Open-loop tracking of rising and setting GNSS radio-occultation signals from an Airborne Platform: Signal model and statistical analysis, in: 2013 IEEE international Geoscience & Remote Sensing Symposium Proceedings, IGARSS Proceedings, 3367–3370, https://doi.org/10.1109/IGARSS.2013.6723550, 2013. a
Wang, K.-N., Garrison, J. L., Acikoz, U., Haase, J. S., Murphy, B. J., Muradyan, P., and Lulich, T.: Open-Loop Tracking of Rising and Setting GPS Radio-Occultation Signals From an Airborne Platform: Signal Model and Error Analysis, IEEE T. Geosci. Remote, 54, 3967–3984, https://doi.org/10.1109/tgrs.2016.2532346, 2016. a, b, c, d, e, f
Ware, R. H., Exner, M., Feng, D., Gorbunov, M., Hardy, K. R., Herman, B., Kuo, Y. H., Meehan, T. K., Melbourne, W., Rocken, C., Schreiner, W. S., Sokolovskiy, S., Solheim, F., Zou, X., Anthes, R., Businger, S., and Trenberth, K. E.: GPS Sounding of the Atmosphere from Low Earth Orbit: Preliminary Results, B. Am. Meteorol. Soc., 77, 19–40, 1996. a
Winning, T. E., Chen, Y.-L., and Xie, F.: Estimation of the marine boundary layer height over the central North Pacific using GPS radio occultation, Atmos. Res., 183, 362–370, https://doi.org/10.1016/j.atmosres.2016.08.005, 2017. a
Xie, F., Haase, J. S., and Syndergaard, S.: Profiling the Atmosphere Using the Airborne GPS Radio Occultation Technique: A Sensitivity Study, IEEE T. Geosci. Remote, 46, 3424–3435, https://doi.org/10.1109/tgrs.2008.2004713, 2008. a, b, c, d, e, f, g, h, i, j
Xie, F., Adhikari, L., Haase, J. S., Murphy, B., Wang, K.-N., and Garrison, J. L.: Sensitivity of airborne radio occultation to tropospheric properties over ocean and land, Atmos. Meas. Tech., 11, 763–780, https://doi.org/10.5194/amt-11-763-2018, 2018. a, b, c
Zuffada, C., Hajj, G. A., and Kursinski, E. R.: A novel approach to atmospheric profiling with a mountain-based or airborne GPS receiver, J. Geophys. Res.-Atmos., 104, 24435–24447, https://doi.org/10.1029/1999jd900766, 1999. a
- Abstract
- Introduction
- Data and methodology
- Case study: BRO from the World View campaign
- Evaluation of balloon-borne RO refractivity retrievals
- Conclusions
- Appendix A: Balloon-borne RO cases and sampling
- Data availability
- Author contributions
- Competing interests
- Disclaimer
- Acknowledgements
- Financial support
- Review statement
- References