the Creative Commons Attribution 4.0 License.
the Creative Commons Attribution 4.0 License.
 | 23 Feb 2023
Quantitative chemical assay of nanogram-level particulate matter using aerosol mass spectrometry: characterization of particles collected from uncrewed atmospheric measurement platforms
Christopher R. Niedek
Maria A. Zawadowicz
Zihua Zhu
Beat Schmid
Aerosol generation techniques have expanded the utility of aerosol mass spectrometry (AMS) for offline chemical analysis of airborne particles and droplets. However, standard aerosolization techniques require relatively large liquid volumes (e.g., several milliliters) and high sample masses that limit their utility. Here we report the development and characterization of a micronebulization AMS (MN-AMS) technique that requires as low as 10 µL of sample and can provide the quantification of the nanogram level of organic and inorganic substances via the usage of an isotopically labeled internal standard (34SO). Using standard solutions, the detection limits for this technique were determined at 0.19, 0.75, and 2.2 ng for sulfate, nitrate, and organics, respectively. The analytical recoveries for these species are 104 %, 87 %, and 94 %, respectively. This MN-AMS technique was applied successfully to analyze filter and impactor samples collected using miniature particulate matter (PM) samplers deployable on uncrewed atmospheric measurement platforms, such as uncrewed aerial systems (UASs) and tethered balloon systems (TBSs). Chemical composition of PM samples collected from a UAS field campaign conducted at the Department of Energy's (DOE) Southern Great Plains (SGP) observatory was characterized. The offline MN-AMS data compared well with the in situ PM composition measured by a co-located aerosol chemical speciation monitor (ACSM). In addition, the MN-AMS and ion chromatography (IC) agreed well for measurements of sulfate and nitrate concentrations in the PM extracts. This study demonstrates the utility of combining MN-AMS with uncrewed measurement platforms to provide quantitative measurements of ambient PM composition.
- Article
(4454 KB) - Full-text XML
-
Supplement
(949 KB) - BibTeX
- EndNote


Aerosols play key roles in human health, air quality, and the climate (Jaffe et al., 2020; Kim et al., 2015; Sommers et al., 2014), and the chemistry of the particles is an important determinant of their hygroscopic, radiative, and toxicological properties (Al-Kindi et al., 2020; Calvo et al., 2013; Contini et al., 2021; Von Schneidemesser et al., 2015). Detailed information on aerosol chemistry and how it varies in the atmosphere is necessary for assessing the effects that ambient particles have on the environment and public health. For example, while the detrimental health effects of PM2.5 (particulate matter with aerodynamic diameter less than or equal to 2.5 µm) as a broad class of pollution have long been recognized (Dockery et al., 1993), recent studies have demonstrated different levels of toxicity among different chemical classes and aerosols from different sources, suggesting potentially discrete effects of particulate matter (PM) with distinct chemical compositions (e.g., Contini et al., 2021; D'Evelyn et al., 2021; Groma et al., 2022; Heal et al., 2012; Plummer et al., 2015; Sun et al., 2017). A thorough understanding of aerosol composition and chemical processes is also necessary for the development and validation of atmospheric chemical transport models and climate models (Shrivastava et al., 2017). Climate models have historically used the physical properties of aerosols (e.g., mass concentration and size distributions) to estimate the radiative effects of particles in the atmosphere, but it is now known that understanding the chemical nature of aerosols is also key to improving model simulations of aerosols' direct and indirect radiative forcing (Gustafsson and Ramanathan, 2016; Y. Liu et al., 2021; Lou et al., 2020; Ramanathan et al., 2001; Reddington et al., 2017).
Improved techniques for aerosol chemical measurements are needed to more fully understand the effects of aerosols. Field studies on aerosol chemistry are currently performed through several different avenues, each with their own strengths and weaknesses. Ground-based monitoring approaches can use a suite of instrumentation to obtain highly detailed, continuous measurements of aerosol physical and chemical properties but are usually restricted to single locations. Piloted aircraft have been utilized in numerous field campaigns around the world and have the advantage of flying to a source of aerosols such as wildfire events (e.g., Permar et al., 2021; Zhang et al., 2018) and tracking the evolution of aerosol properties as the plumes disperse (e.g., Akagi et al., 2012; Kleinman et al., 2020). However, piloted aircraft are costly to deploy, usually have limited ability to characterize the vertical distribution of aerosols near the surface, and have high speeds that restrict the spatial resolution of the measurements.
Over the past decade, uncrewed atmospheric measurement platforms (UxSs), such as uncrewed aerial systems (UASs) and tethered balloon systems (TBSs), have been increasingly used for air quality monitoring (Lambey and Prasad, 2021; Villa et al., 2016) to help fill the gaps left between ground-based and traditional piloted aircraft measurements of atmospheric species (Mei et al., 2022). UASs can be deployed where it would otherwise be too dangerous to fly a piloted aircraft, such as under a forest canopy (Kobziar et al., 2019) or in particularly remote and challenging locations like Arctic areas near newly forming sea ice (de Boer et al., 2018). Additionally, UxSs offer an effective way to investigate the vertical stratification of atmospheric components like PM, which is vital for reducing uncertainties regarding aerosol–cloud interactions (de Boer et al., 2018; Creamean et al., 2018; Maahn et al., 2017). In comparison, ground-based measurements of aerosols may not be a reliable method to investigate cloud formation at the time of measurement (Shupe et al., 2013), while limited airborne datasets do not offer the spatial or temporal resolution necessary for a fuller understanding of the relationship between cloud properties and aerosols.
In situ, high time resolution, and low detection limit measurements of PM chemistry are difficult to achieve with UxSs due to the high energy consumption and weight of the required instrumentation (Brady et al., 2016; Glaser et al., 2003; Hemingway et al., 2017). The studies that demonstrate such measurements are generally limited to particle number and size distributions (e.g., Aurell et al., 2021; Bates et al., 2013; Brady et al., 2016; Corrigan et al., 2008; Girdwood et al., 2020; Kezoudi et al., 2021; Villa et al., 2016). For detailed chemical information, offline analysis of UxS-collected PM is more plausible, as this removes the need to have the heavy instrumentation aboard a UxS. However, due to payload restrictions, the samplers on board uncrewed platforms usually have a low volumetric flow rates that severely limit the total collectible PM mass from UxSs (Villa et al., 2016). For example, the U.S. Department of Energy's (DOE) TigerShark, which can afford several hours of continuous flight time with a payload of ∼ 100 lbs (45.4 kg) (Mei et al., 2022), uses a filter sampling system that operates at a flow rate of 2.5 L min−1, which is ∼ 400 times lower compared to the high volume air samplers often used for ground-based sampling.
Aerosol mass spectrometry (AMS) is a widely used technique for the quantitative measurement of non-refractory (NR) aerosol species such as sulfate, nitrate, ammonium, chloride, and organics (Canagaratna et al., 2007; DeCarlo et al., 2006). While the application of AMS has primarily been real-time measurements (e.g., Fountoukis et al., 2014; Li et al., 2017; Zhou et al., 2020), in recent years, an increasing number of studies have reported the usage of AMS for offline analysis of PM samples to describe long-term chemical characteristics of PM or to examine the sources and chemical properties of water-soluble and insoluble components (e.g., Bozzetti et al., 2017; Daellenbach et al., 2016; Ge et al., 2017; Li et al., 2021, 2020; Moschos et al., 2018; Sun et al., 2011; Vlachou et al., 2018).
The AMS is a highly sensitive instrument with 1 min detection limits of ∼ 20 ng m−3 for organics, and as low as 2.9 ng m−3 for nitrate, at an air sampling flow rate of ∼ 0.1 L min−1 (DeCarlo et al., 2006). However, the amount of PM mass that needs to be collected for offline AMS analysis is dependent on the liquid volume and concentration required for stable particle generation in the size range needed for AMS sampling. The nebulization efficiency (i.e., the ratio between the mass detected by the AMS compared to the mass of solute nebulized) of aerosol generation systems is low, e.g., ∼ 0.02 %, for an ultrasonic atomizer utilized by O'Brien et al. (2019). Additionally, liquid volumes of several milliliters and tens of micrograms of sample mass are usually required for continuous aerosol generation and AMS analysis (O'Brien et al., 2019; Sun et al., 2011). Given a typical ambient PM concentration of 10 µg m−3, several cubic meters of air need to be sampled to meet this mass requirement, which is very difficult to achieve with many UxSs. Taking the characteristics of the TigerShark as an example, the on-board PM filter sampler has a flow rate of 2.5 L min−1 (Mei et al., 2022), thus requiring 400 min of flight time to sample 1 m3 of air. This flight time is not practical for many UASs currently used, and as such, it is necessary to substantially increasing aerosol generation efficiency for the AMS analysis of UAS-collected samples.
In this study, we develop a novel analytical technique that combines isotopically labeled internal standardization, micronebulization, and high-resolution aerosol mass spectrometry to achieve quantitative analysis of the nanogram level of PM in liquid samples. This micronebulization AMS (MN-AMS) technique expands the utility of offline AMS analyses by dramatically reducing the required liquid volumes needed for stable aerosol generation. In addition, this method uses sulfur-34-labeled ammonium sulfate (A34S) as the internal standard to achieve quantification of liquid concentration based on AMS measurements. While ammonium sulfate has frequently been used as an internal standard in lab studies (e.g., Jiang et al., 2021; Ma et al., 2021; Yu et al., 2014), it cannot be used for ambient samples without an independent measurement of sulfate concentration. We also present the application of this analytical method to ambient PM samples collected using UAS instrumentation, including from a recent UAS field campaign.
2.1 Chemicals
Chemicals were used as received. Sucrose (American Chemical Society (ACS) grade), sulfuric acid (ACS plus grade), and methanol (liquid chromatography mass spectrometry (LC-MS) grade) were from Fisher Scientific. Ammonium sulfate (AS; ACS reagent grade) and A34S (> 98 % 34S) were from MilliporeSigma. Anhydrous sodium carbonate was from Alfa Aesar. All chemical solutions were prepared using ultrapure water (Milli-Q water; ≥ 18.2 MΩ cm).
2.2 UAS sample collection and site description
Ambient aerosol samples examined in this study were collected at two locations, i.e., the Pacific Northwest National Laboratory (PNNL) in Richland, Washington, and the central facility of the Southern Great Plains (SGP) observatory, which is operated by the DOE's Atmospheric Radiation Measurement (ARM) program and located near Lamont in north–central Oklahoma. PM2.5 samples were collected on two types of substrates, namely polytetrafluoroethylene (PTFE) filters and aluminum impactor stubs. The PTFE filters were installed with a time-resolved filter sampler (model 9401; Brechtel) designed for deployment on UxSs (Mei and Goldberger, 2020). The aluminum impactor stubs were installed inside a custom-built growth tube to collect droplets generated from a moderated aerosol growth inside a water-based condensation particle counter (CPC; Hering et al., 2014). The sampling rates are 2.5 and 0.3 L min−1 for filter and impactor collection, respectively. Both substrates were precleaned using a methanol (high-performance liquid chromatography (HPLC) grade; Fisher Scientific) wash followed by ultrasonication in purified water for 10 min. All samples were acquired on the ground, except for the filter sample from the SGP site, which was sampled across multiple UAS flights for 15 h during November 2021. Details of the SGP UAS campaign are described in Mei et al. (2022). A table of sampling information can be found in the Supplement (Table S1). Blank filters and impactor stubs were also processed and analyzed in the same manner as the sampled filters and impactors. In addition, lab-generated aerosols composed of sucrose and ammonium sulfate were collected using the same samplers for initial method development.
On 16 and 17 November 2021, additional aerosol samples were collected on multiple silicon substrates, using a four-stage impactor (Sioutas Personal Cascade Impactor, SKC Ltd.) operating at a flow rate of 9 L min−1. The impactors were deployed on the roof of the Aerosol Observing Systems trailer (AOS; 10 m above the ground) at SGP for 2 h d−1. The aerosol particles collected by the impactor were analyzed offline by a time-of-flight secondary ion mass spectrometer (ToF-SIMS; detailed in Sect. 2.3.4).
2.3 Chemical analyses of PM samples
2.3.1 Extraction of PM
A schematic overview of the PM sample extraction and analysis steps can be found in Fig. 1a. For the extraction of a PTFE filter sample (13 mm in diameter), a portion of the filter (punched out with a 3.97 mm diameter puncher) is placed in a microcentrifuge tube (1.5 mL conical) along with 100 µL methanol (LC-MS grade) and subjected to ultrasonication in an ice bath for 15 min. Methanol was chosen as the extraction solvent to increase the proportion of organic material that could be removed from the filters. After this first sonication, 300 µL of 1 mg L−1 34SO internal standard solution was added, the combined solution was sonicated for 30 min, and then diluted to 1 mL with 1 mg L−1 34SO. To extract the impactor stub samples, where particles were collected on the surface in a ∼ 2 mm diameter spot, 15 µL of methanol was added to the impactor surface, the surface was gently scraped, and the resulting solution was transferred into a microcentrifuge tube. This procedure was repeated three times to ensure quantitative transfer of PM into the microcentrifuge tube, and the combined solution was sonicated for 15 min. Then, 1 mg L−1 34SO was added to bring the final volume to 500 µL and sonicated again for 15 min. All ultrasonication procedures were performed at 0 ∘C to prevent heat-induced degradation. Finally, the filter and impactor extracts were filtered using syringe filters (0.45 µm PTFE) to remove insoluble materials and stored frozen at −20 ∘C prior to chemical analysis.
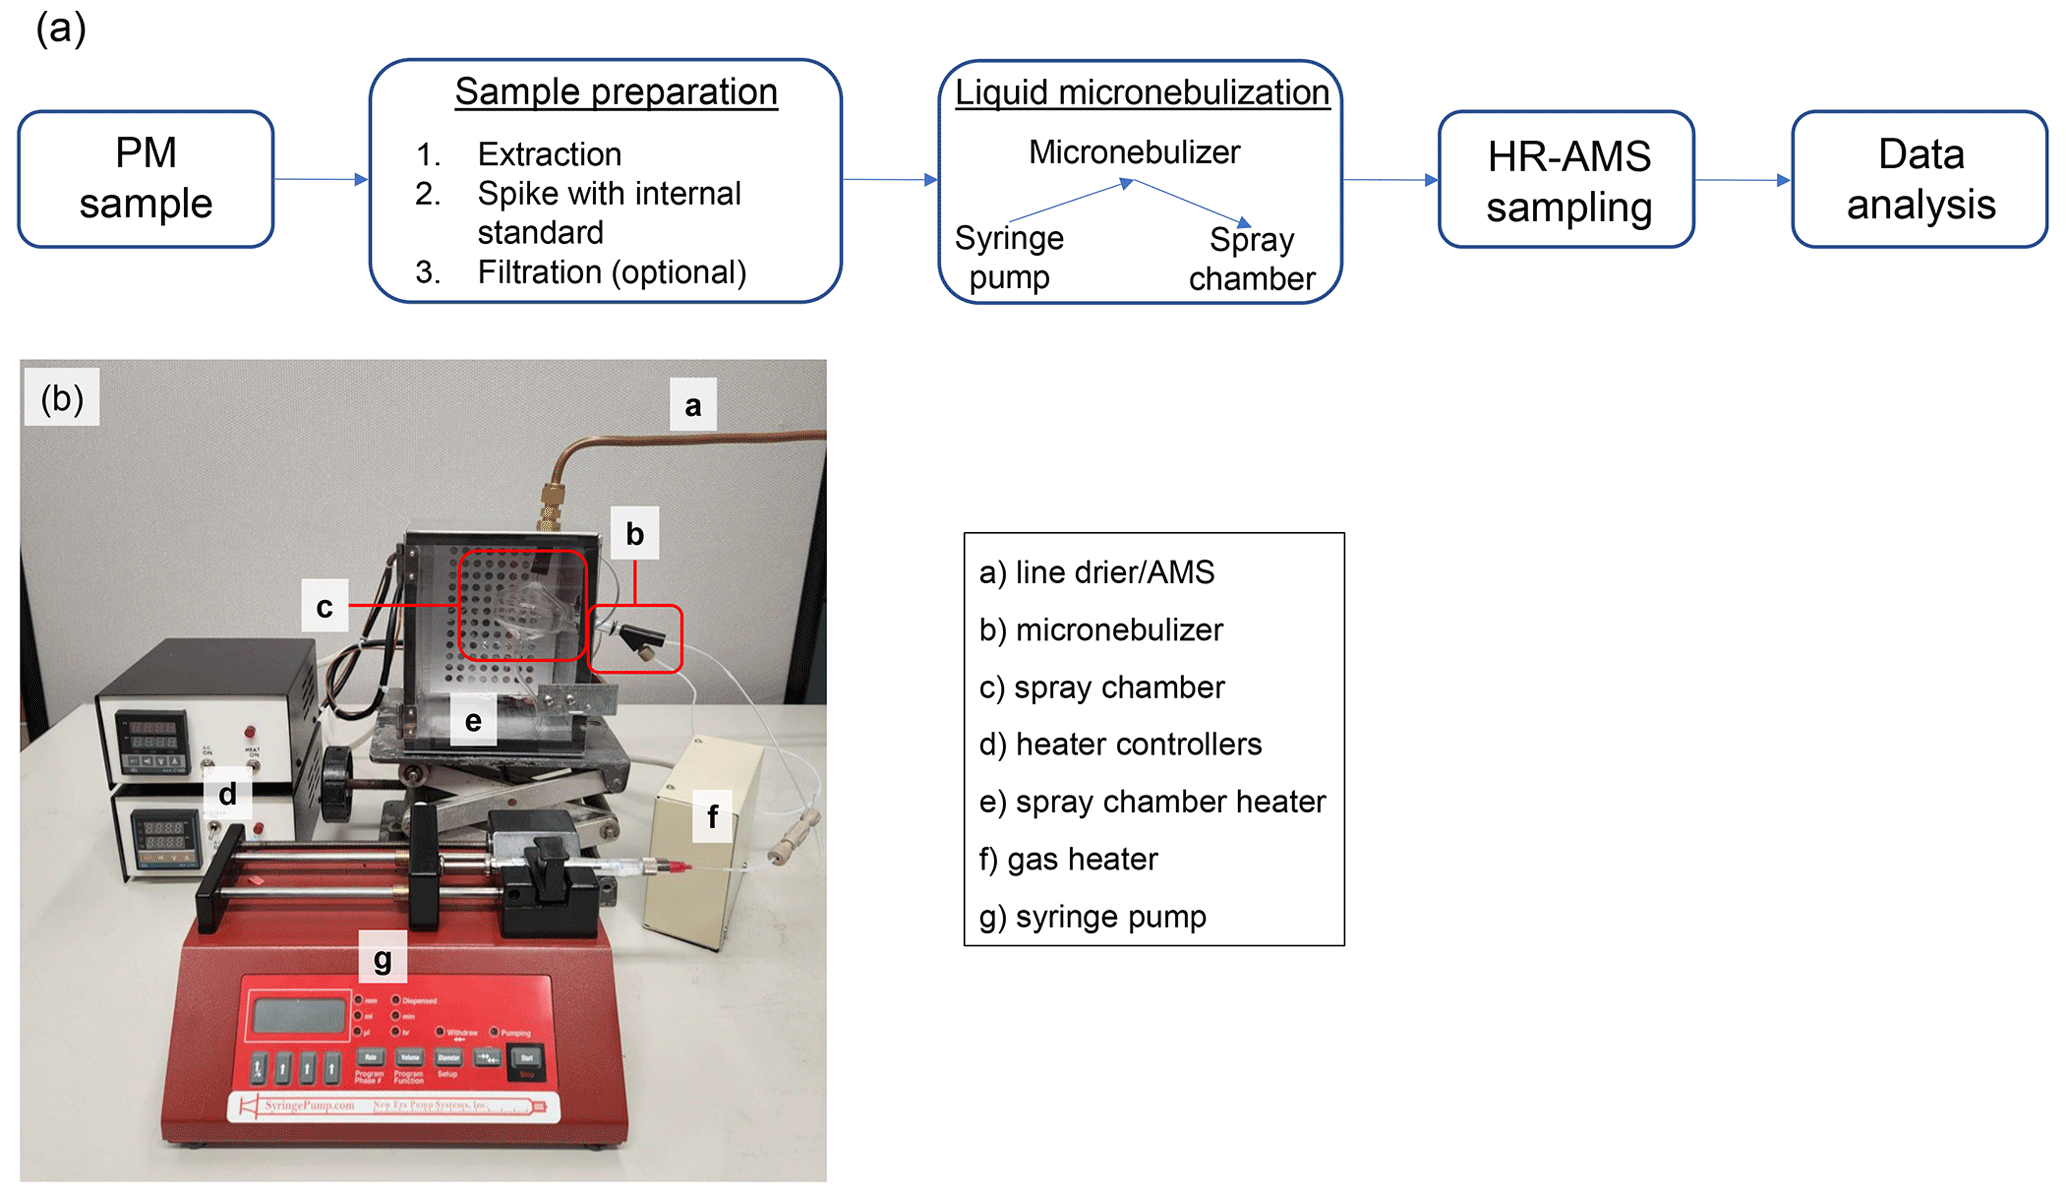
Figure 1(a) A schematic overview of our microextraction and analysis methodology. (b) A picture of the micro-flow nebulization setup.
2.3.2 Aerosol mass spectrometry (AMS) analysis
A high-resolution time-of-flight AMS (HR-AMS; Aerodyne Research Inc.) was used to characterize the bulk chemical composition of the filter and impactor extracts. The HR-AMS was typically operated in “V” mode (with a mass resolution of () of ∼ 3000) with 1 min averaging. When the fast-sampling mode was used, the averaging time was decreased to 1 s. Prior to sampling with the AMS, liquid extracts were aerosolized using a micronebulization assembly and N2 as the carrier gas, which is pictured in Fig. 1b and discussed in detail in Sect. 3.1.
2.3.3 Ion chromatography (IC) analysis
An ion chromatograph (Metrohm 881 Compact IC pro) with a conductivity detector was used for measurement of anions. The anion IC was equipped with a Metrohm A Supp 7 250/4.0 column, 3.6 mM Na2CO3 was used as the eluent, and 0.1 M H2SO4 was used as the suppressor solution. Calibration curves of SO and 34SO were created with a concentration range of 0–500 µg L−1 in terms of SO or 34SO. SO and 34SO co-elute (Fig. 2a), so separate calibration curves are necessary to quantify SO and 34SO in samples containing both species.
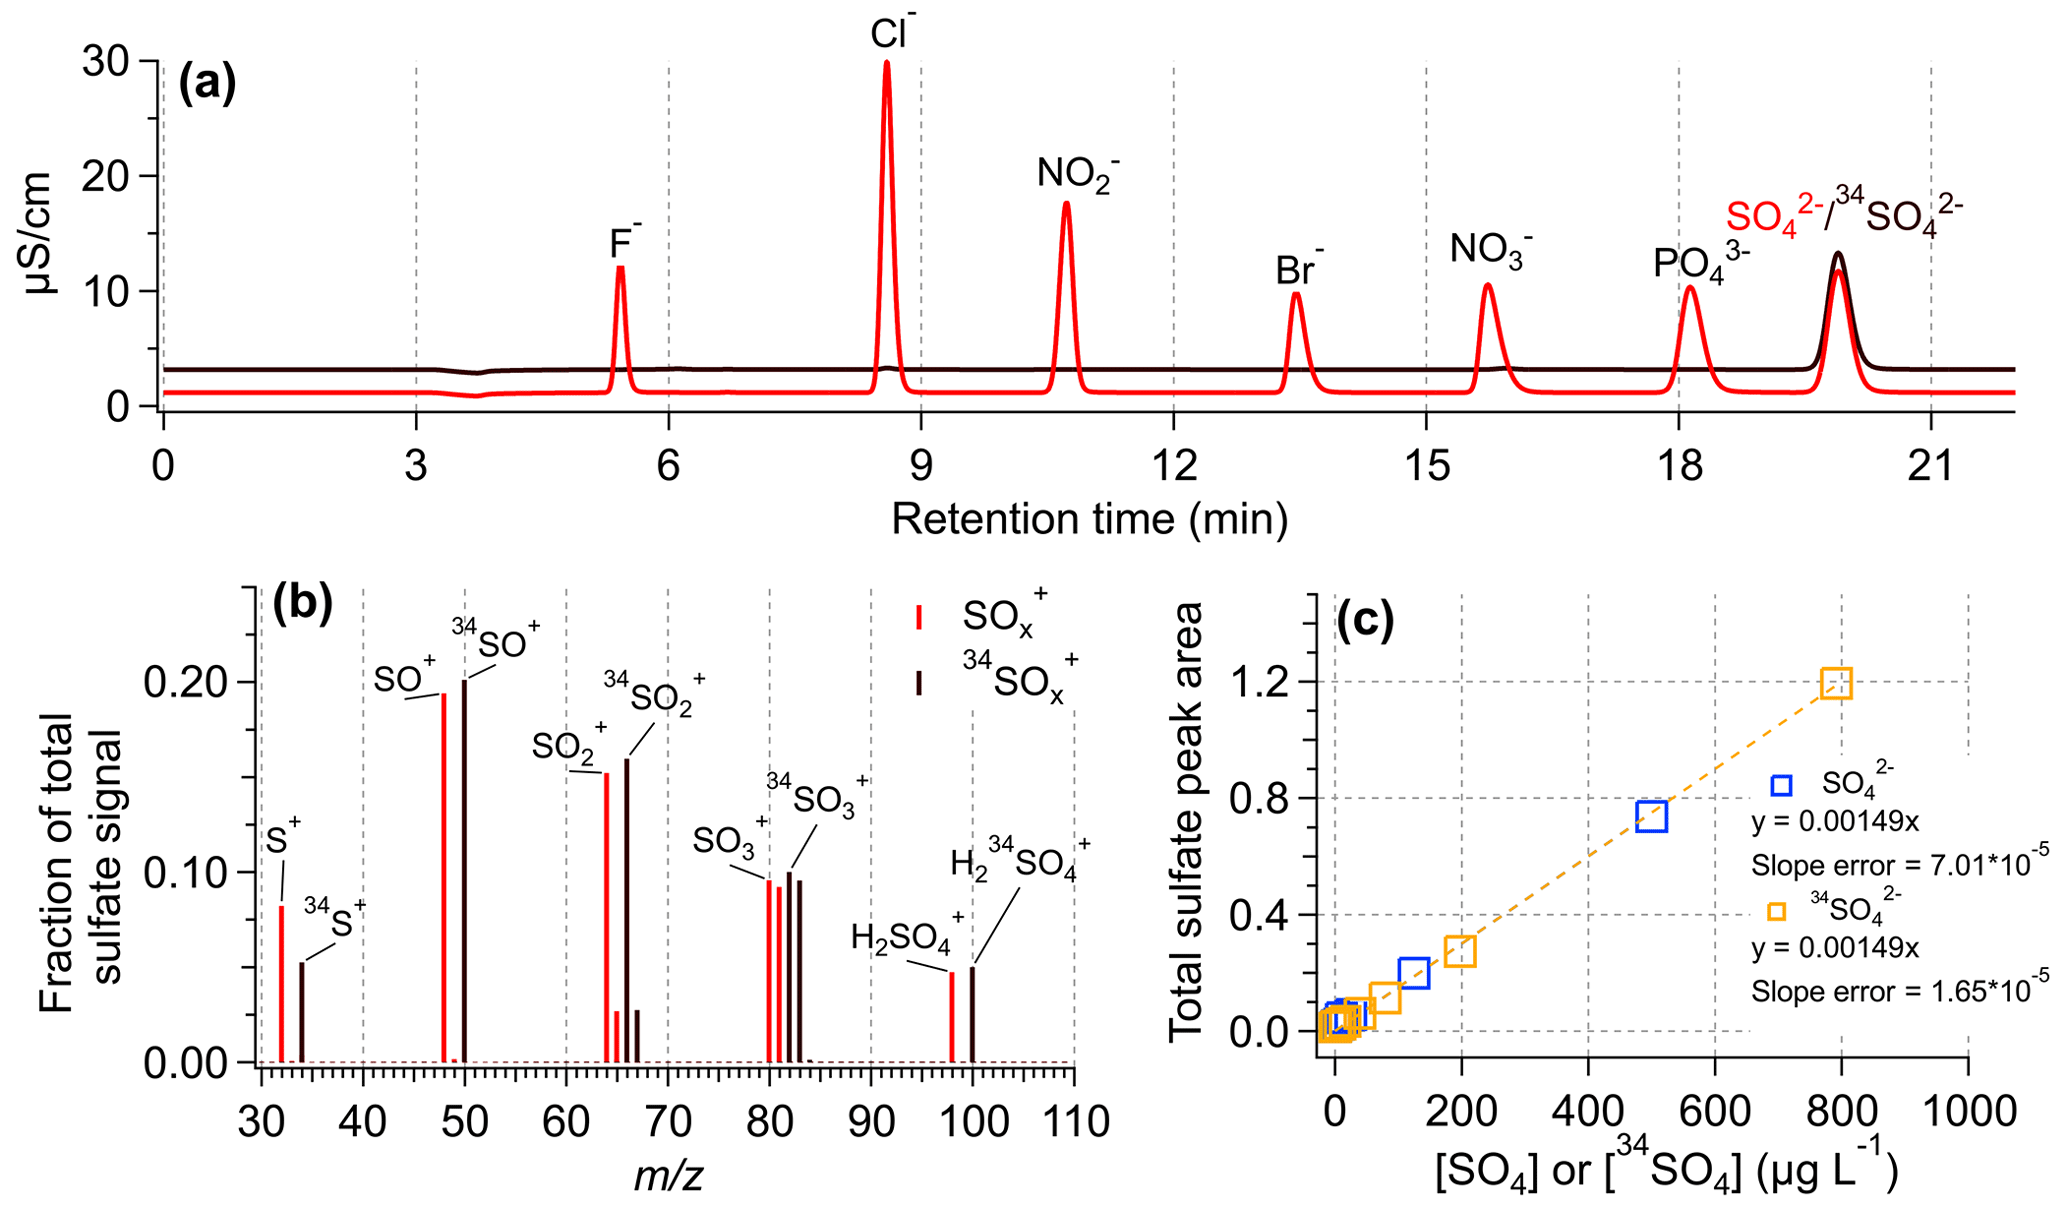
Figure 2Assessment of the instrumental response to SO4 and 34SO4. (a) IC chromatograms of an anion standard mix (in light red) and a 34SO standard. The SO and 34SO concentrations were 3 mg L−1 in each solution. (b) HR-AMS mass spectra for a solution containing equal concentrations of SO4 and 34SO4. The HR-AMS signal for the 34SO4 ions follow the expected trends based on the standard SO4 ions. (c) IC standard calibration curves of sulfate (SO) and isotopically labeled sulfate (34SO).
2.3.4 Secondary ion mass spectrometry (SIMS) analysis
SIMS measurement of PM composition was performed at the Environmental Molecular Sciences Laboratory (EMSL), which is located at PNNL. A TOF.SIMS5 instrument (IONTOF GmbH, Münster, Germany) was used. A 25 keV pulsed Bi beam was used as the analysis beam to collect SIMS spectra. The Bi beam was focused to be ∼ 0.4 µm diameter and scanned over a 100 × 100 µm2 area on the aerosol particles collected on silicon wafers using the delay extraction mode. The mass resolution () of the SIMS was in a range of 3000–5000. Data reconstruction was conducted using the SurfaceLab 6 software (version 6.3, IONTOF GmbH, Münster, Germany). Region-of-interest (ROI) reconstruction was performed, in which only signals from aerosol particles were reconstructed as new spectra, while the signals from the silicon substrate were excluded. Mass calibration was carried out using characteristic peaks, e.g., CH ( 15), C2H ( 27), C3H ( 39), and Bi+ ( 209) in positive ion spectra and CN− ( 26), C ( 36), NO ( 62), and SO4H− ( 97) in negative ion spectra.
2.4 Data processing
The HR-AMS data were processed using the standard AMS data analysis toolkits (SQUIRREL v1.63H and PIKA v1.23H). Although a high-capacity silica gel drier was used, a large-particle water signal was measured. To avoid potentially overestimating the organic water signal, the HxO+ signals were parameterized using the standard method for HR-AMS ambient data processing, i.e., H2O+ = 0.225 × CO, HO+ = 0.25 × H2O+, and O+ = 0.04 × H2O+ (Aiken et al., 2008). In addition, since purified nitrogen was used as the carrier gas in this study, the CO+ signal was also parameterized using the Aiken method for ambient aerosol, i.e., CO+ = CO (Aiken et al., 2008).
In order to separately quantify SO4 and 34SO4 with the HR-AMS, several modifications were made to the PIKA analysis procedures. First, all sulfate-related ions, e.g., HSO (Allan et al., 2004) with the 34S isotope were unconstrained so the signals would not be parameterized based on the parent isotope and natural isotopic abundances. A high-resolution fragmentation wave was also created to represent 34SO4. This pattern was similar to the standard fragmentation pattern for sulfate, except that the sulfate-associated H2O+ signal was parameterized to the 34SO and 34SO+ ions, and the parameterizations for the S and 33S signals were removed from the 34SO4 fragmentation wave. A table containing the fragmentation pattern can be found in the Supplement (Table S2). Last, a new ion family containing all sulfate-relevant 34S ions was created, separate from the standard ion family containing all of the sulfate-relevant ions.
In order to determine the spiked 34SO4 by the AMS, the natural abundance of 34S present in the native sulfate must be subtracted out of the measured 34SO4. This adjusted 34SO4 concentration ([34SO4]AMS, adj) is calculated using the natural isotopic abundance of 34S (= 0.0447 × 32S):
where [34SO4]AMS and [SO4]AMS are the HR-AMS measured aerosolized concentrations (µg m−3) of 34SO4 and SO4, respectively. The liquid concentration of component X ([X]liquid; µg L−1), e.g., organics, nitrate, chloride, and the native SO4, is calculated as follows:
where [34SO4] is the known concentration (µg L−1) of the internal standard (34SO) in the liquid sample.
Then, the ambient concentration (µg m−3) of the sampled PM components ([X]ambient) can be calculated as follows:
where Vextract is the total extract volume (mL), Vair is the total volume of air sampled (m3), and 1000 is a unit conversion factor.
IC analysis was performed in this study as an independent check for the accuracy of AMS quantification. For IC analysis, calibration curves of SO and 34SO were generated for a sulfate concentration range of 0–500 µg L−1. Calibration curves fitting parameters were used for later separation of the SO and 34SO signal in samples containing both ions. For the calculation of SO in ambient samples that have been spiked with 34SO, the IC peak area is first used to estimate the SO liquid concentration ([SO4]est), assuming the signal is solely from SO:
where SO4,PA is the IC-measured peak area, and m and b are the linear regression slope and intercept, respectively, from the calibration curve of SO. The contribution from the 34SO internal standard is then subtracted out to determine the true liquid concentration of SO.
3.1 Assessment of the micronebulization AMS technique
3.1.1 Micro-flow nebulization system and interfacing with AMS
Due to the low PM mass that can be collected by many weight-limited aerial platforms, micronebulization techniques that can achieve ultra-low flow rates, thus requiring significantly lower sample masses compared to common, Collison-type atomizers, are needed for offline AMS analysis of such samples. O'Brien et al. (2019) reported the utilization of a micronebulization system based on ultrasonic atomization to enable offline AMS analysis of microgram-level samples for atmospheric research (O'Brien et al., 2019). However, this method suffers severe sample loss upstream of the AMS, and the nebulization efficiency (NE), which is defined as the ratio of mass measured by the AMS to the known mass of nebulized analyte, was found to be only 0.02 %–0.06 % (O'Brien et al., 2019). The sensitivity of offline AMS methods can be substantially increased through improving the efficiency of the aerosol generation interface.
Figure 1b shows a picture of the micro-flow nebulization system developed in this study that can be interfaced directly with the AMS to allow sensitive detection and chemical characterization of nanogram-level samples. This system consists of a syringe pump that delivers liquid to a concentric nebulizer made of Teflon at a predefined flow rate (e.g., 100 µL min−1). The liquid is nebulized using pressurized gas such as high-purity nitrogen or argon (50 psi), and the resulting fine mist enters a glass cyclonic spray chamber, where large droplets are removed. Both the gas line and the spray chamber are mildly heated to facilitate droplet evaporation and minimize condensation on the spray chamber wall. The resulting aerosol then passes through a silicate diffusion drier before entering the HR-AMS.
The MN-AMS method was initially evaluated using standard solutions composed of sucrose, AS, and A34S with additional method validation using IC analysis. Figure S1 compares the AMS mass spectra of a solution containing 1 mg L−1 each of sucrose and sulfate atomized using a standard, Collison-type atomizer (TSI 3076) and the micronebulizer. The organic and inorganic mass spectra derived from each atomization system show a high degree of similarity (r2 = 0.99), indicating that the micronebulization system does not introduce any artifacts compared to a standard atomizer.
Since the transmission efficiency of the AMS aerodynamic lens is size dependent and is nearly 100 % for particles in the diameter range of ∼ 70–500 nm (Jayne et al., 2000; Liu et al., 2007), it is necessary to control the aerosol sizes generated from the micronebulization system to maximize the overall sensitivity of the MN-AMS system. Factors affecting the size distribution of the droplets from the nebulizer, thus the dry particle sizes, include the total solute concentration and liquid sample flow rate. Figure S2 shows that, at total solute concentrations of 1–7 mg L−1, the mode of the vacuum aerodynamic diameter (Dva; DeCarlo et al., 2004) of the generated particles is ∼ 100–200 nm, which is well within the 100 % transmittance range of the AMS (Liu et al., 2007). Decreasing the solute concentration to a low value of less than 1 mg L−1 may cause a significant reduction in MN-AMS sensitivity, as the measured particle size may have a considerable fraction of particle mass outside of the 100 % transmission range of the AMS (Dva ∼ 100–500 nm). Lowering the liquid flow rate can decrease the mode size distribution as well (see Fig. S2b, c), but when operated under the flow rate specified for the nebulizer (i.e., 50 µL min−1), the effect is small compared to lowering the total solute concentration.
3.1.2 Nebulization efficiency
The nebulization efficiency (NE) of the MN-AMS was determined by nebulizing 400 µL of the solution with varying concentrations of sucrose, SO4, and 34SO4 (where the total solute concentration was kept constant at 9 mg L−1) and integrating the AMS-measured mass of the individual components over the entire length of sample nebulization (O'Brien et al., 2019). Figure 3a shows the variation in NE for organics and SO4 as a function of the nebulized mass, which was, in turn, varied by dilution with 34SO4 solution (to keep the total solute concentration constant) and by decreasing the syringe pump flow rate. A NE of 0.93 %–1.2 % was determined for the NM-AMS system. One of the factors responsible for the low NE is that the concentric nebulizer requires around 50 psi of gas pressure to function properly. The high pressure meant that the aerosol flow rate out of the nebulizer is notably higher than the AMS inlet flow rate, meaning the AMS is subsampling the total aerosol mass. Another factor is the loss of nebulized mass due to condensation inside the spray chamber, and this was partially corrected by mildly heating the spray chamber and the gas line (see Fig. 1a). Loss of aerosols inside the diffusion dryer may also be a factor as well. Depending on the design of the experiment, these different factors may not be tunable, whereas syringe pump flow rate and solution composition can be controlled to maximize the NE of the MN-AMS system.
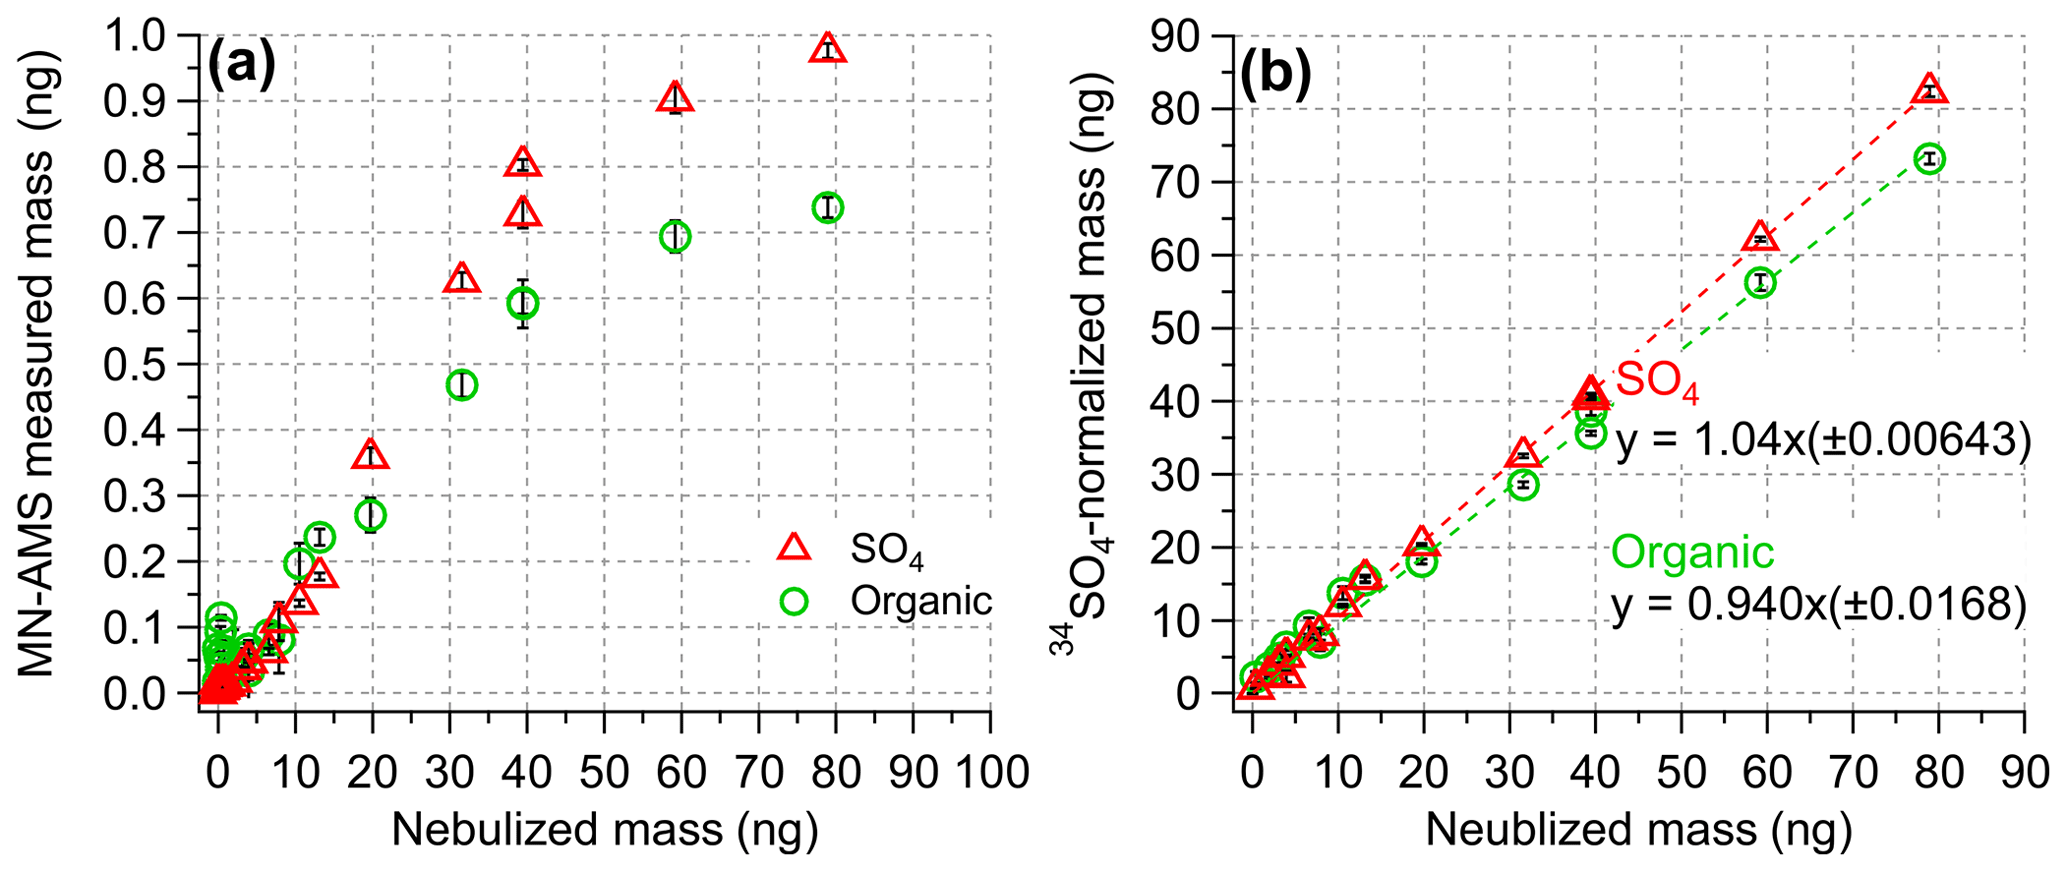
Figure 3(a) The MN-AMS-measured mass of organics and SO4 compared to the expected mass of sucrose and SO4. The ratio between the two values gives the nebulization efficiency of each component. The MN-AMS measured mass is not linearly proportional to the nebulized mass, but this can be corrected with internal standardization (as in panel b). (b) The 34SO4-normalized mass of organics and SO4 compared to the nebulized mass.
In addition to optimizing the efficiency of aerosol generation, the AMS sampling frequency is also a critical factor determining the minimum sample volume and, thus, the MN-AMS detection limits. With very low sample volumes, the fast-MS mode of the AMS is particularly useful, as it reduces the sampling time to 1 s or less (Kimmel et al., 2011), thus requiring much less aerosol mass compared to the standard sampling mode, which acquires mass spectral data over at least 6 s (i.e., 3 s each on the chopper-open and the chopper-closed positions; DeCarlo et al., 2006). As shown in Fig. S3, for MN-AMS setup reported here, the fast-MS mode provides highly reproducible measurements of different chemical components in the liquid sample, and the liquid concentration of organics and sulfate measured using the fast-MS mode is accurate when normalized to the known concentration of 34SO4.
3.1.3 Quantification via internal standardization
Due to variations in factors affecting the AMS signal intensities, such as the nebulization efficiency discussed above, the use of an internal standard (IS) is necessary for quantitative analysis of liquid samples using AMS (Jiang et al., 2021; O'Brien et al., 2019; Yu et al., 2016). An IS is a chemical substance that is added in a constant amount to every sample analyzed, including the samples, the blank, and calibration standards. It allows for the quantification of other measured species and for correcting variabilities in NE and AMS detection sensitivity. Isotopically labeled internal standards are commonly used for mass spectrometry as they are very similar to the chemical species of interest in the samples, and the effects of sample preparation should, relative to the amount of each species, be the same for the signal from the internal standard as for the signal from analyte. The use of isotopically labeled internal standards for AMS analysis, specifically 15NO3, has been explored previously (O'Brien et al., 2019). In the present study, we chose 34SO4 as the IS due to the well-characterized fragmentation behavior of sulfate in the AMS, fragment ions that are separated well from isobaric ions, and compatibility in both the HR-AMS and IC systems. Furthermore, the low volatility of ammonium sulfate prevents positive artifacts due to the evaporation loss of the internal standard.
A key use of isotopically labeled sulfate is the quantification of ambient PM components, particularly sulfate, in the HR-AMS. Figure 2b shows that 34SO behaves the same as the natural sulfate (SO) in the AMS, producing nearly identical fragmentation patterns. Additionally, while SO and 34SO co-elute in IC (Fig. 2a), the response factor for each form of sulfate is nearly identical (Fig. 2c). Similarly, Fig. S4 shows the liquid concentration of SO4 measured by IC and MN-AMS for a range of standard solutions containing varying ratios of SO4 and 34SO4. Both instrumental systems showed similar behavior for the measured SO4 concentration using 34SO4 as the internal standard, demonstrating the utility of using 34SO4 for determination of SO4. The effectiveness of an internal standard for AMS quantification of liquid samples is demonstrated in Fig. 3, where the 34SO4-normalized masses of organics and SO4 accurately reproduce the known, nebulized masses of organics and sulfate (Fig. 3b), while the unnormalized measurement data do so poorly (Fig. 3a). Additionally, the lowest concentration samples analyzed here ([sucrose] = [SO4] = 0.06 mg L−1), which are sampled using the lowest usable flow rate (13 µL min−1), were used to estimate the detection limits discussed later.
3.2 Evaluation of the MN-AMS method using PM samples collected by UxS samplers on the ground
In order to evaluate the MN-AMS method for UxS sample analysis, a total of eight filters and three impactor samples of ambient PM were collected from PNNL and analyzed. The filters were sampled for 3 h periods, corresponding to 0.45 m3 air, and the impactors were sampled for variable lengths of time corresponding to 0.036–0.34 m3 air (Table S1). Since low volatility organic matter in organic solvents may produce background signals in the AMS, we used ultrapure, LC-MS grade methanol for PM extraction. Testing with varying concentrations of methanol in 1 ppm (parts per million) 34SO solution revealed that LC-MS grade methanol still generates organic background signals in the AMS analysis, but final methanol concentrations at or below 10 % gave a consistent and acceptably low background. The 34SO4-normalized liquid concentration of organics in the blanks were subtracted from the filter and impactor data. The organic contribution from the blank filter and impactor were at most 15 % and 30 % of the organic signal from this set of ambient filters and impactors, respectively.
As the last filter (PNNL_F8) and impactor (PNNL_I3) were sampled during the same time period (Table S1), the chemical composition of each can be compared as a means of assessing biases in the sampling system or in our extraction procedure (Fig. S5). Overall, the organic mass spectra of the filter extract and the impactor extract are similar (Fig. S5a, b), although the HR-AMS spectrum of the impactor extract shows relatively enhanced CxH ions and several higher CxHyO ions compared to the MS of the filter extract. Given that these ions are also significant in the methanol solvent blank mass spectrum, a potential contamination from methanol was possibly the reason. However, it is also important to note the differences in extraction technique used for the filter and impactor samples, as described in Sect. 2.2. For example, a significant difference in the volume of air sampled for the filter vs. the impactor over a given time period led to much less collected PM on the impactor stub. In addition, while both sample types were initially extracted with pure methanol, the final methanol concentration is higher in the filter extracts compared to the impactor extracts (6.7 % vs. 2.2 %), leading to potentially different contributions from methanol residuals. Despite these potential confounding issues, our results indicate that the filter and impactor samples are chemically quite similar.
3.3 Chemical characterization of aerosol samples collected from a UAS campaign and intercomparison with co-located measurements
A field campaign was conducted at the SGP site to examine techniques of UxS measurements and data analysis (Mei et al., 2022). Figure 4 is a UAS flight track (colored with the aerosol total number concentration from a CPC) overlapped with the United States Geological Survey (USGS) national map of the SGP site and surrounding area. The Central Facility is located in a rural environment with several large urban areas located within 200 km. A refinery and a coal-fired power plant are located within 50 km of the Central Facility (J. Liu et al., 2021; Sisterson et al., 2016). The diversity of land use at the SGP site causes a diversity of air masses originating from anthropogenic, biogenic, and biomass burning sources (J. Liu et al., 2021; Parworth et al., 2015).
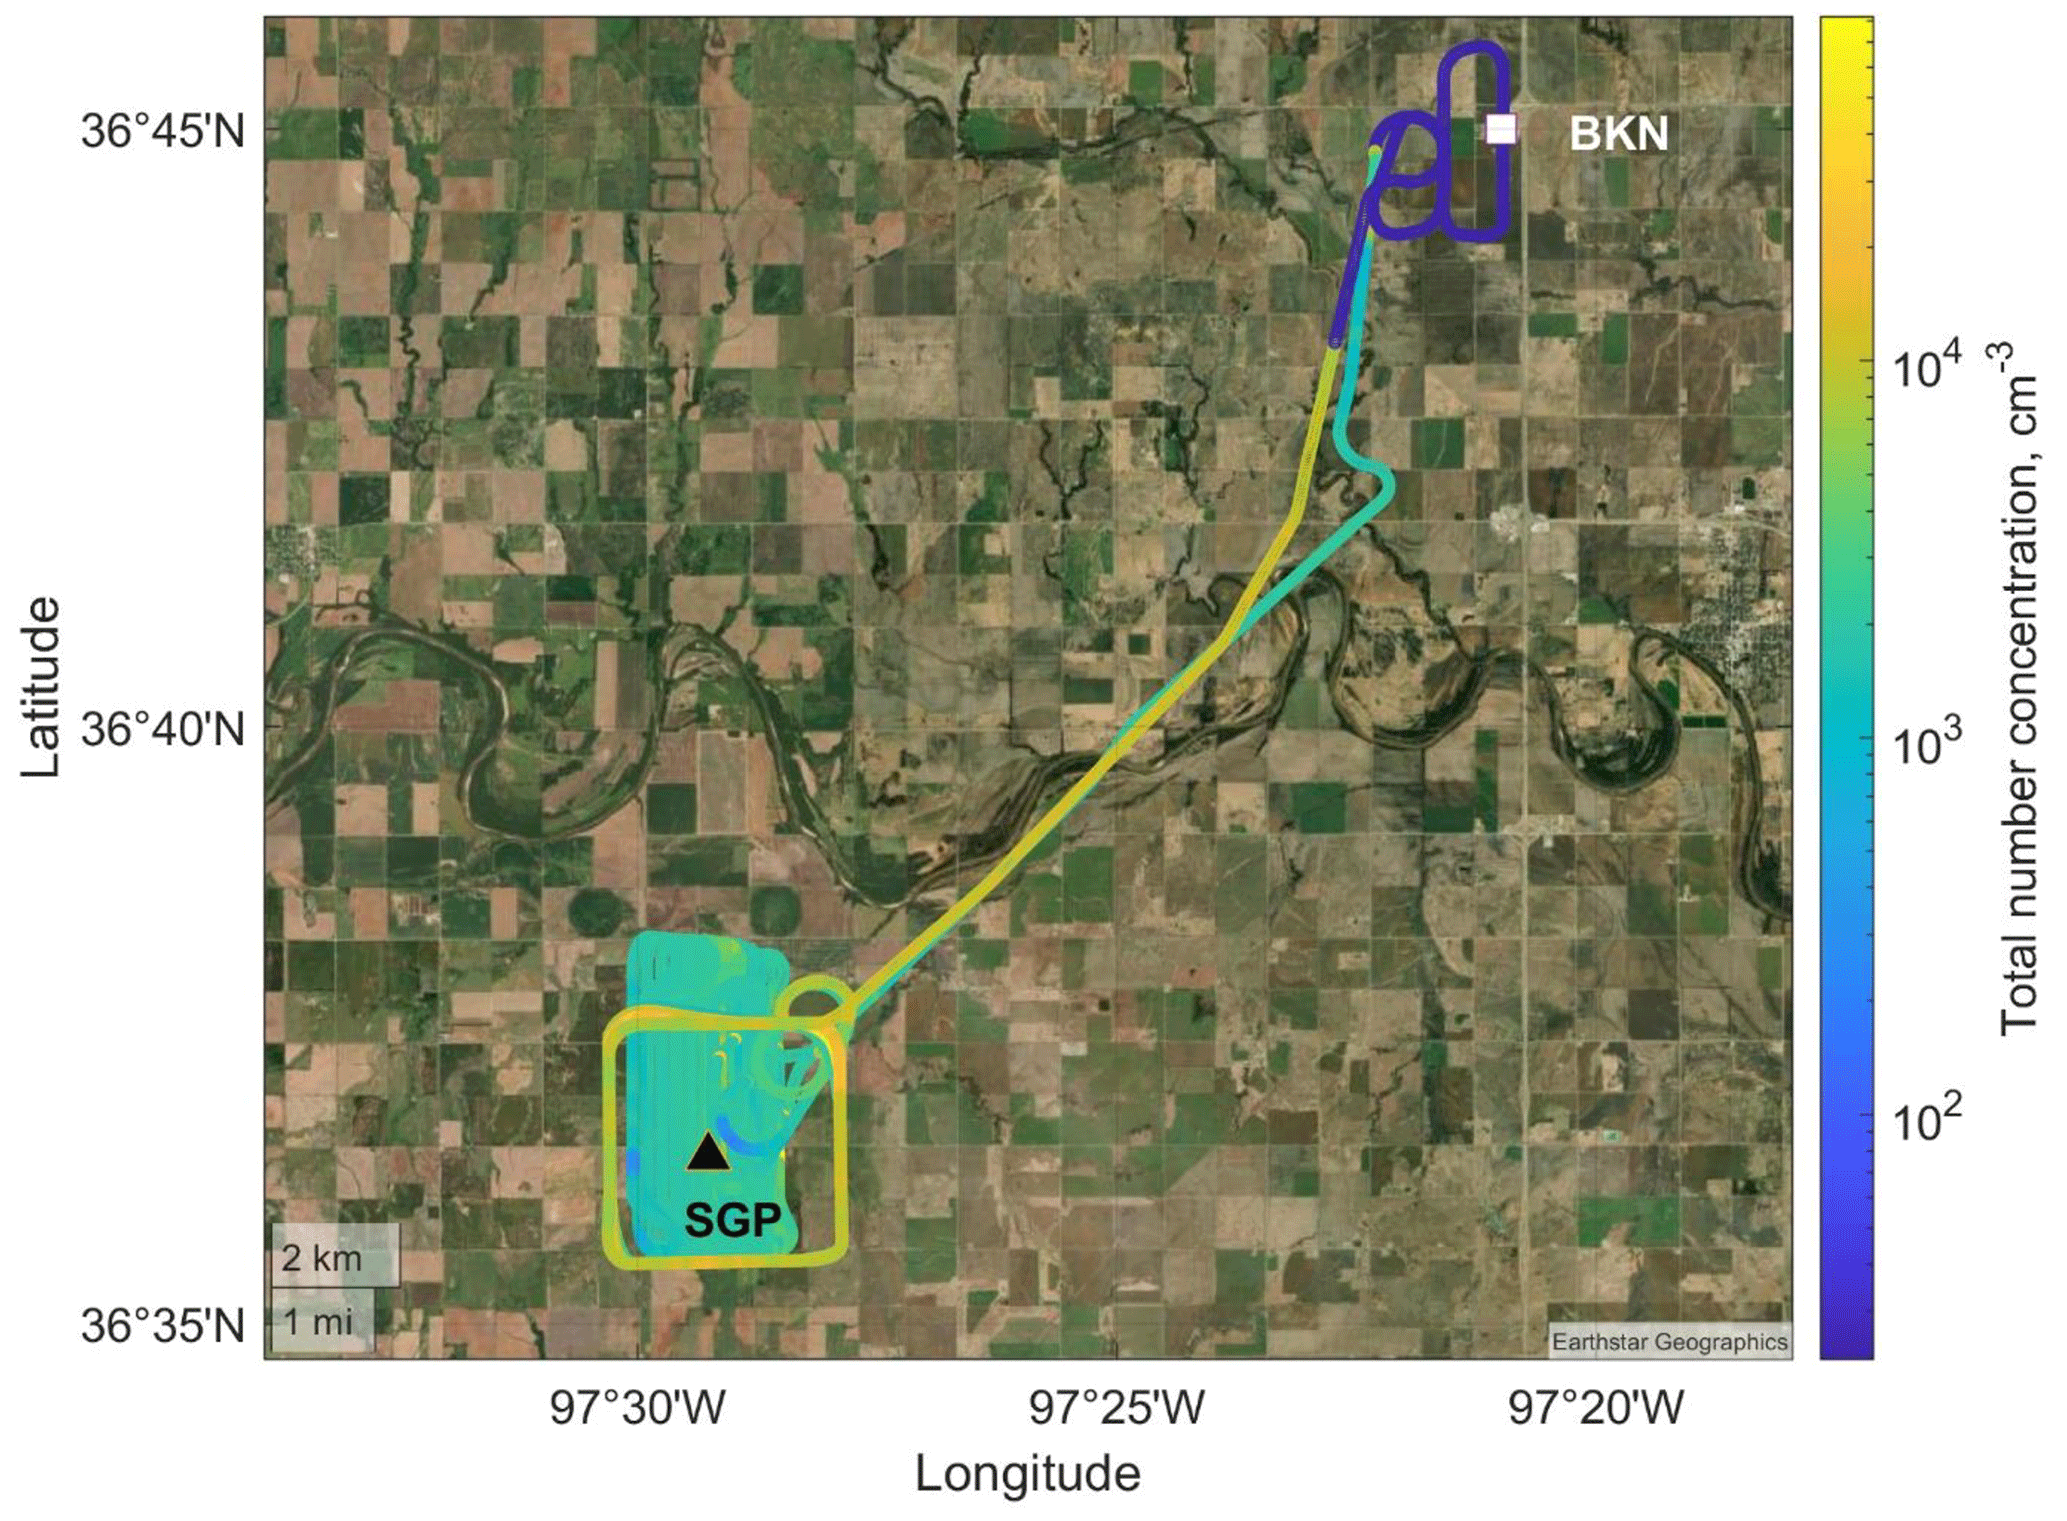
Figure 4A typical flight track of one UAS flight (recorded on 13 November 2021) overlapped with the USGS national map. The UAS took off from Blackwell–Tonkawa Municipal Airport (BKN; white square) and sampled near the Central Facility (black triangle) of the SGP observatory. The flight track is colored with the total particle number concentration from an on-board CPC. Other sampling days used a partial version of this flight pattern due to weather limitations. Ground sampling occurred at the Central Facility.
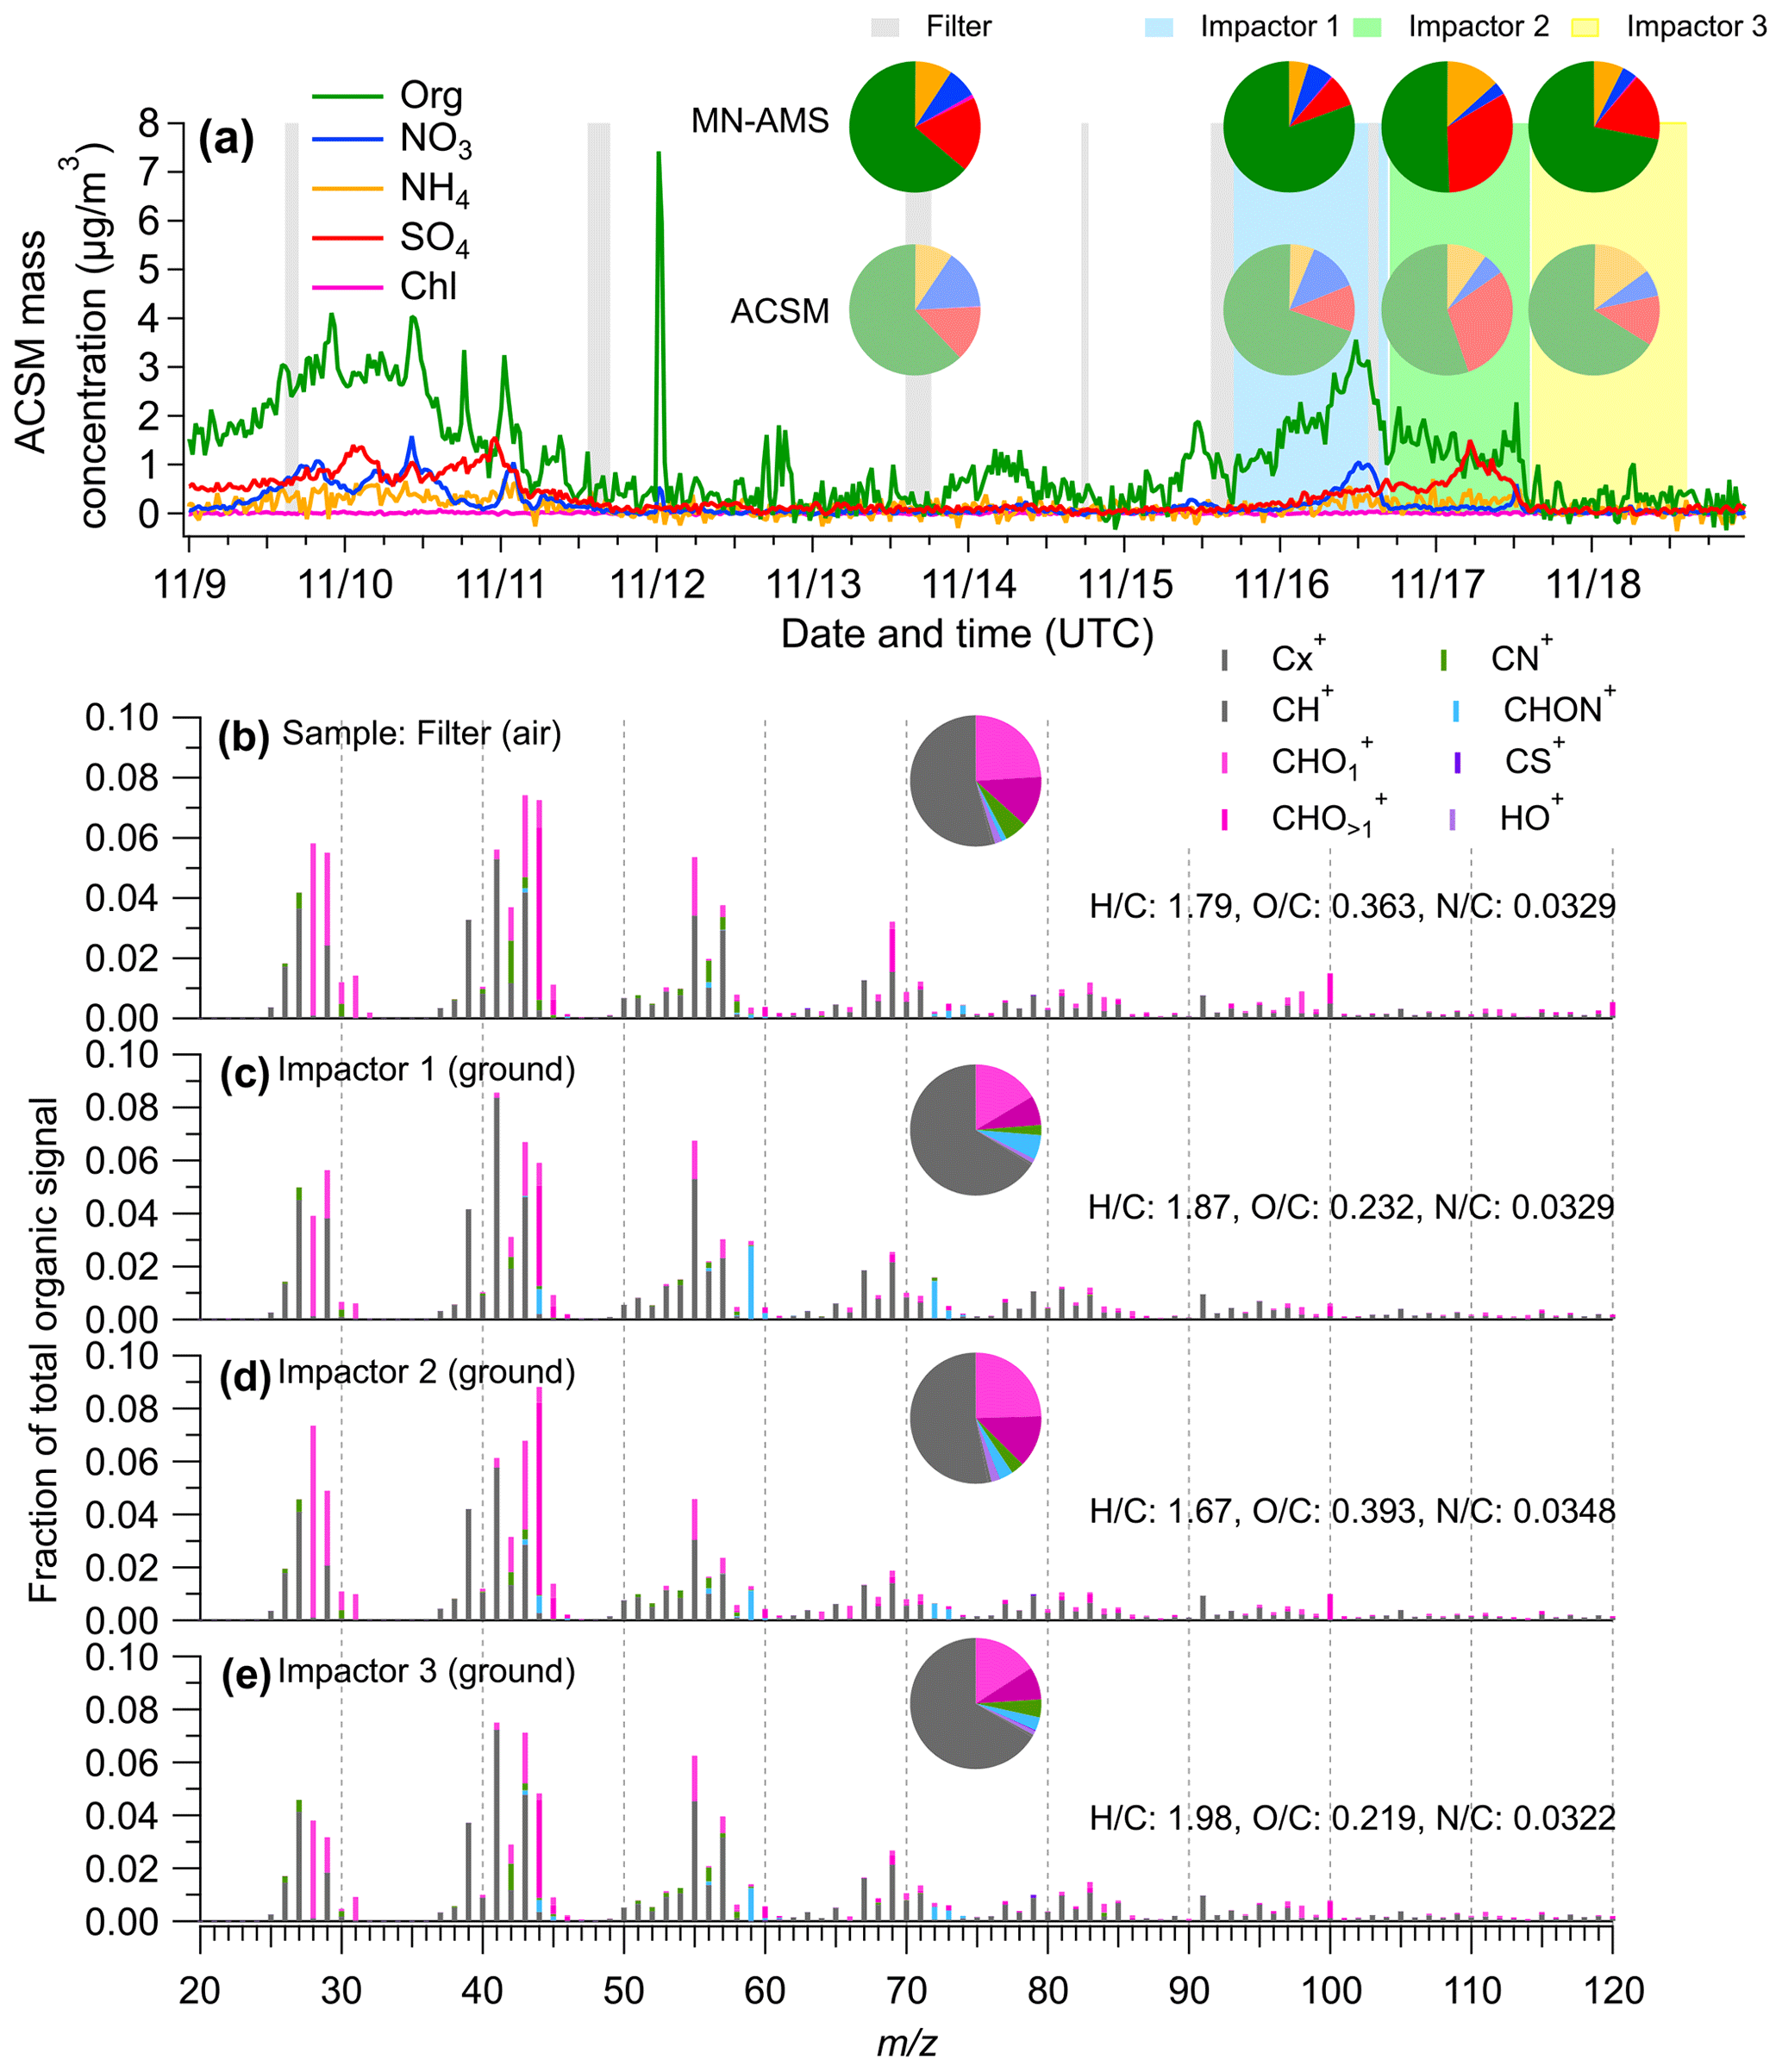
Figure 5Comparison of offline PM2.5 composition measured offline using the MN-AMS vs. the real-time PM1 measured using a quadrupole aerosol chemical speciation monitor (ACSM). (a) Time series of the ACSM-measured NR-PM1 species at the SGP site. The inset pie charts compare the composition measurements by the MN-AMS (darker colors) and the ACSM (lighter colors) for the same time periods. (b–e) High mass resolution organic spectra colored by eight ion categories for the SGP filter and impactors measured by MN-AMS. The average atomic ratios in the organics of each samples are shown in the legends.
Ground and air samples were collected at SGP and analyzed using the MN-AMS technique. Additionally, an Aerodyne quadrupole aerosol chemical speciation monitor (ACSM) provided unit mass resolution, with continuous measurements of non-refractory submicrometer aerosols (NR-PM1) at the SGP site during the UAS deployment period. Figure 5a shows the time series of ACSM-measured NR-PM1 species, along with the corresponding sampling periods for the impactors and UAS filter samples during which the ACSM data were averaged. The MN-AMS data and the ACSM data show similar NR-PM composition during the time periods that the UAS filter and impactor samples were being collected (see inset pie charts in Fig. 5a). The comparison between the MN-AMS and ACSM organic unit mass spectra is shown in Fig. S6. The agreement between the MN-AMS and ACSM measurements is moderate (0.5 < r2 < 0.8). However, it is important to remember the differences in PM sampling between the MN-AMS and ACSM (filter and impactor extraction of PM2.5 vs. real-time PM1) and that the two instruments may have different sensitivities to certain organic species resulting in discrepancies for co-located AMS and ACSM measurements (e.g., Zhou et al., 2016). Many of the most divergent ions measured in both instruments are CxHy ions that appear to have a significantly higher signal in the MN-AMS. Another notable difference is the presence of an elevated C2H5NO ion at = 59 in the MN-AMS spectra compared to the ACSM spectra. This may suggest chemical differences in the PM2.5 and PM1 size regimes.

Figure 6Comparison of the ACSM-measured ambient NR-PM1 mass concentration and the MN-AMS back-calculated ambient NR-PM2.5 mass concentration at the SGP site. Sampling time periods for the filter and impactors are shown as shaded areas in Fig. 5a.
The MN-AMS data can be used to back-calculate the ambient PM mass concentration (see Sect. 2.4 for details). The ACSM data suggested a reasonably neutralized particle mass during the sampling period, and this information was used to correct the ammonium concentration in the offline samples (due to the addition of isotopically labeled ammonium sulfate) by assuming that the measured SO and NO was in full charge balance with the NH. The comparison between the MN-AMS estimated ambient PM loading and the ACSM measured loading can be found in Fig. 6. The PM loadings are within 20 %, except for impactor 1, where the MN-AMS measurement reports a notably higher organic mass loading than that measured by the ACSM. Besides the chemical differences between PM2.5 and PM1, the discrepancy could also be due to contamination which could occur during sample collection and processing. Last, it is possible that the extraction process, using both methanol and water, is a source of discrepancy between the MN-AMS and ACSM datasets as both organic and inorganic PM exhibit a range of solubilities in different solvents (Mihara and Mochida, 2011). While the MN-AMS data resembled the online ACSM measurements to a high degree, differences in recovery of specific PM components when comparing offline to online results should be considered (Daellenbach et al., 2016). Nevertheless, the general trend in the total PM loading is quite similar between the two instruments, suggesting that the MN-AMS technique is recapturing the real-time measurements to a large degree.
In addition, the high mass resolution of the MN-AMS allows richer chemical information of PM to be obtained compared to the ACSM. For example, the detection of nitrogen-containing organic species in the filter and impactor samples is noteworthy, as organonitrates have been previously suspected to be present at SGP (Parworth et al., 2015). As a fraction of total measured organic ions, the SGP PM2.5 samples contained 3.8 % to 8.5 % of the CxHyN and CxHyNO+ type of ions (Figs. 5b–e and S7a–d). The filter sample (collected aboard a UAS) contained primarily CxHyN+ ions, with C2H4N+ being the highest signal in the family. The impactor samples had more CxHyNO+ ions, with C2H5NO+ being the most dominate in the family. These results highlight the importance of nitrogen-containing organic aerosols in the SGP region. This finding is confirmed by SIMS analysis of the same PM samples. An example of one of the SIMS unit mass spectra collected is shown in Fig. S8a with a selection of high-resolution ion fittings shown in Fig. S8b. The large differences in sampling and ionization mechanisms between the two instruments precludes specific chemical comparisons, but the general characteristics of the data can be compared. The SIMS detected a large number of nitrogen-containing organics in addition to many CH+ ions and a few CHO+ ions. Most of the detected nitrogen species produce the CxHyN+ type of ions with a small number of CxHyNO+. The detection of nitrogen-containing organics using both the MN-AMS technique and SIMS helps to validate the use of the MN-AMS technique and, alongside a previous publication from Parworth et al. (2015), suggests that further study of the nitrogen-containing organics at the SGP site is warranted.
This study evaluated a novel MN-AMS technique and demonstrated its utility for the quantitative, chemical analysis of low mass, low volume PM samples such as those collected from UxS platforms. The micronebulization technique can continuously generate aerosols from tens of microliter sample volumes, a large improvement on commonly used atomization systems that require volumes in the range of 5–15 mL. Nebulization efficiencies, detection limits, and recoveries (calculated using HR-AMS data) for sulfate, nitrate, and organics are summarized in Table S3. Nebulization efficiencies are in the range of 0.93 %–1.2 % (depending on solute concentration and syringe pump flow rate), which is an order of magnitude higher than the nebulization efficiencies reported by O'Brien et al. (2019), who used an ultrasonic atomization system (O'Brien et al., 2019). A main cause for the low NE in MN-AMS is analyte losses due to the condensation of droplets inside the spray chamber. In addition, particle loss inside the drier, subsampling of the total atomization output by the AMS, and partial AMS lens transmission of particles outside of the optimal transmission size range (Dva of ∼ 100–500 nm; Liu et al., 2007) may contribute to the low NE as well. The detection limits of this MN-AMS method for organics, nitrate, and sulfate are of the order of 1 ng, with analytical recoveries ranging between 87 %–104 %.
A key advantage of the MN-AMS technique is the requirement of lower liquid volume (as low as 10 µL) for stable aerosol generation, which translates to substantially lowering the required initial PM mass that must be collected for offline AMS analysis. As a result, this technique meets the needs following from the growing desire for atmospheric UxS sampling and the widespread use of the AMS for offline chemical analysis of PM samples. As a proof of concept, a small number of PM samples were collected using UAS sampling instrumentation, one sample was collected aboard a UAS, and both were analyzed using the MN-AMS technique. Further analysis of UAS samples is advisable to explore the utility of the MN-AMS technique for investigating the ambient aerosol chemical distribution with improved sampling time resolution. Table S3 estimates the required sampling time needed to sample enough PM mass to reach the quantification limit for organics, sulfate, and nitrate. Assuming an ambient PM concentration of 10 µg m−3 and a sampler flow rate of 2.5 L min−1, less than 0.5 h of sampling time are required. This sampling resolution will significantly benefit the UAS sampling of PM.
All datasets, including HR-AMS, ACSM, and SIMS mass spectral data, are available upon request from Qi Zhang (dkwzhang@ucdavis.edu).
The document contains additional mass spectral datasets (for the ACSM and SIMS) and information on AMS data analysis with 34SO4 in addition to particle size distributions. The supplement related to this article is available online at: https://doi.org/10.5194/amt-16-955-2023-supplement.
CRN and QZ designed experiments and carried them out. FM and BS performed ambient sampling at PNNL and SGP. MAZ provided ACSM data. ZZ performed SIMS data analysis. CRN and QZ prepared the paper with contributions from all authors.
The contact author has declared that none of the authors has any competing interests.
Publisher’s note: Copernicus Publications remains neutral with regard to jurisdictional claims in published maps and institutional affiliations.
This research has been supported by, and data have been obtained from, the Atmospheric Radiation Measurement (ARM) User Facility, a U.S. Department of Energy (DOE) Office of Science User Facility managed by the Biological and Environmental Research Program and the DOE's Atmospheric System Research Program (grant no. DE-SC0022140). The SIMS analysis has been performed on a project award (https://doi.org/10.46936/expl.proj.2021.60186/60008210) from the Environmental Molecular Sciences Laboratory, a DOE Office of Science User Facility sponsored by the Biological and Environmental Research program (contract no. DE-AC05-76RL01830). Maria A. Zawadowicz has been supported by the Scientific Focus Area (SFA) Science Plan program that is supported by the Office of Biological and Environmental Research in the Department of Energy, Office of Science, through the United States Department of Energy (contract no. DE-SC0012704) to Brookhaven National Laboratory. Christopher R. Niedek also acknowledges funding from the Jastro-Shields Research Award and the Fumio Matsumura Memorial Fellowship from the University of California at Davis.
This research has been supported by the U.S. Department of Energy (grant nos. DE-SC0022140, DE-AC05-76RL01830, and DE-SC0012704) and the University of California at Davis (Jastro-Shields Research Award and Matsumura Memorial Fellowship).
This paper was edited by Jessie Creamean and reviewed by three anonymous referees.
Aiken, A. C., DeCarlo, P. F., Kroll, J. H., Worsnop, D. R., Huffman, J. A., Docherty, K. S., Ulbrich, I. M., Mohr, C., Kimmel, J. R., Sueper, D., Sun, Y., Zhang, Q., Trimborn, A., Northway, M., Ziemann, P. J., Canagaratna, M. R., Onasch, T. B., Alfarra, M. R., Prevot, A. S. H., Dommen, J., Duplissy, J., Metzger, A., Baltensperger, U., and Jimenez, J. L.: O C and OM OC Ratios of Primary, Secondary, and Ambient Organic Aerosols with High-Resolution Time-of-Flight Aerosol Mass Spectrometry, Environ. Sci. Technol., 42, 4478–4485, https://doi.org/10.1021/es703009q, 2008.
Akagi, S. K., Craven, J. S., Taylor, J. W., McMeeking, G. R., Yokelson, R. J., Burling, I. R., Urbanski, S. P., Wold, C. E., Seinfeld, J. H., Coe, H., Alvarado, M. J., and Weise, D. R.: Evolution of trace gases and particles emitted by a chaparral fire in California, Atmos. Chem. Phys., 12, 1397–1421, https://doi.org/10.5194/acp-12-1397-2012, 2012.
Al-Kindi, S. G., Brook, R. D., Biswal, S., and Rajagopalan, S.: Environmental determinants of cardiovascular disease: lessons learned from air pollution, Nat. Rev. Cardiol., 17, 656–672, https://doi.org/10.1038/s41569-020-0371-2, 2020.
Allan, J. D., Delia, A. E., Coe, H., Bower, K. N., Alfarra, M. R., Jimenez, J. L., Middlebrook, A. M., Drewnick, F., Onasch, T. B., Canagaratna, M. R., Jayne, J. T., and Worsnop, D. R.: A generalised method for the extraction of chemically resolved mass spectra from Aerodyne aerosol mass spectrometer data, J. Aerosol Sci., 35, 909–922, https://doi.org/10.1016/j.jaerosci.2004.02.007, 2004.
Aurell, J., Gullett, B., Holder, A., Kiros, F., Mitchell, W., Watts, A., and Ottmar, R.: Wildland fire emission sampling at Fishlake National Forest, Utah using an unmanned aircraft system, Atmos. Environ., 247, 118193, https://doi.org/10.1016/j.atmosenv.2021.118193, 2021.
Bates, T. S., Quinn, P. K., Johnson, J. E., Corless, A., Brechtel, F. J., Stalin, S. E., Meinig, C., and Burkhart, J. F.: Measurements of atmospheric aerosol vertical distributions above Svalbard, Norway, using unmanned aerial systems (UAS), Atmos. Meas. Tech., 6, 2115–2120, https://doi.org/10.5194/amt-6-2115-2013, 2013.
Bozzetti, C., Sosedova, Y., Xiao, M., Daellenbach, K. R., Ulevicius, V., Dudoitis, V., Mordas, G., Byčenkienė, S., Plauškaitė, K., Vlachou, A., Golly, B., Chazeau, B., Besombes, J.-L., Baltensperger, U., Jaffrezo, J.-L., Slowik, J. G., El Haddad, I., and Prévôt, A. S. H.: Argon offline-AMS source apportionment of organic aerosol over yearly cycles for an urban, rural, and marine site in northern Europe, Atmos. Chem. Phys., 17, 117–141, https://doi.org/10.5194/acp-17-117-2017, 2017.
Brady, J. M., Stokes, M. D., Bonnardel, J., and Bertram, T. H.: Characterization of a Quadrotor Unmanned Aircraft System for Aerosol-Particle-Concentration Measurements, Environ. Sci. Technol., 50, 1376–1383, https://doi.org/10.1021/acs.est.5b05320, 2016.
Calvo, A. I., Alves, C., Castro, A., Pont, V., Vicente, A. M., and Fraile, R.: Research on aerosol sources and chemical composition: Past, current and emerging issues, Atmos. Res., 120–121, 1–28, https://doi.org/10.1016/j.atmosres.2012.09.021, 2013.
Canagaratna, M. R., Jayne, J. T., Jimenez, J. L., Allan, J. D., Alfarra, M. R., Zhang, Q., Onasch, T. B., Drewnick, F., Coe, H., Middlebrook, A., Delia, A., Williams, L. R., Trimborn, A. M., Northway, M. J., DeCarlo, P. F., Kolb, C. E., Davidovits, P., and Worsnop, D. R.: Chemical and microphysical characterization of ambient aerosols with the aerodyne aerosol mass spectrometer, Mass Spectrom. Rev., 26, 185–222, https://doi.org/10.1002/mas.20115, 2007.
Contini, D., Lin, Y.-H., Hänninen, O., and Viana, M.: Contribution of Aerosol Sources to Health Impacts, Atmosphere, 12, 730, https://doi.org/10.3390/atmos12060730, 2021.
Corrigan, C. E., Roberts, G. C., Ramana, M. V., Kim, D., and Ramanathan, V.: Capturing vertical profiles of aerosols and black carbon over the Indian Ocean using autonomous unmanned aerial vehicles, Atmos. Chem. Phys., 8, 737–747, https://doi.org/10.5194/acp-8-737-2008, 2008.
Creamean, J. M., Maahn, M., de Boer, G., McComiskey, A., Sedlacek, A. J., and Feng, Y.: The influence of local oil exploration and regional wildfires on summer 2015 aerosol over the North Slope of Alaska, Atmos. Chem. Phys., 18, 555–570, https://doi.org/10.5194/acp-18-555-2018, 2018.
Daellenbach, K. R., Bozzetti, C., Křepelová, A., Canonaco, F., Wolf, R., Zotter, P., Fermo, P., Crippa, M., Slowik, J. G., Sosedova, Y., Zhang, Y., Huang, R.-J., Poulain, L., Szidat, S., Baltensperger, U., El Haddad, I., and Prévôt, A. S. H.: Characterization and source apportionment of organic aerosol using offline aerosol mass spectrometry, Atmos. Meas. Tech., 9, 23–39, https://doi.org/10.5194/amt-9-23-2016, 2016.
de Boer, G., Ivey, M., Schmid, B., Lawrence, D., Dexheimer, D., Mei, F., Hubbe, J., Bendure, A., Hardesty, J., Shupe, M. D., McComiskey, A., Telg, H., Schmitt, C., Matrosov, S. Y., Brooks, I., Creamean, J., Solomon, A., Turner, D. D., Williams, C., Maahn, M., Argrow, B., Palo, S., Long, C. N., Gao, R.-S., and Mather, J.: A Bird's-Eye View: Development of an Operational ARM Unmanned Aerial Capability for Atmospheric Research in Arctic Alaska, B. Am. Meteorol. Soc., 99, 1197–1212, https://doi.org/10.1175/BAMS-D-17-0156.1, 2018.
DeCarlo, P. F., Slowik, J. G., Worsnop, D. R., Davidovits, P., and Jimenez, J. L.: Particle Morphology and Density Characterization by Combined Mobility and Aerodynamic Diameter Measurements. Part 1: Theory, Aerosol Sci. Tech., 38, 1185–1205, https://doi.org/10.1080/027868290903907, 2004.
DeCarlo, P. F., Kimmel, J. R., Trimborn, A., Northway, M. J., Jayne, J. T., Aiken, A. C., Gonin, M., Fuhrer, K., Horvath, T., Docherty, K. S., Worsnop, D. R., and Jimenez, J. L.: Field-deployable, high-resolution, time-of-flight aerosol mass spectrometer, Anal. Chem., 78, 8281–8289, https://doi.org/10.1021/ac061249n, 2006.
D'Evelyn, S. M., Vogel, C., Bein, K. J., Lara, B., Laing, E. A., Abarca, R. A., Zhang, Q., Li, L., Li, J., Nguyen, T. B., and Pinkerton, K. E.: Differential inflammatory potential of particulate matter (PM) size fractions from Imperial Valley, CA, Atmos. Environ., 244, 117992, https://doi.org/10.1016/j.atmosenv.2020.117992, 2021.
Dockery, D. W., Pope, C. A., Xu, X., Spengler, J. D., Ware, J. H., Fay, M. E., Ferris, B. G., and Speizer, F. E.: An Association between Air Pollution and Mortality in Six U.S. Cities, N. Engl. J. Med., 329, 1753–1759, https://doi.org/10.1056/NEJM199312093292401, 1993.
Fountoukis, C., Megaritis, A. G., Skyllakou, K., Charalampidis, P. E., Pilinis, C., Denier van der Gon, H. A. C., Crippa, M., Canonaco, F., Mohr, C., Prévôt, A. S. H., Allan, J. D., Poulain, L., Petäjä, T., Tiitta, P., Carbone, S., Kiendler-Scharr, A., Nemitz, E., O'Dowd, C., Swietlicki, E., and Pandis, S. N.: Organic aerosol concentration and composition over Europe: insights from comparison of regional model predictions with aerosol mass spectrometer factor analysis, Atmos. Chem. Phys., 14, 9061–9076, https://doi.org/10.5194/acp-14-9061-2014, 2014.
Ge, X., Li, L., Chen, Y., Chen, H., Wu, D., Wang, J., Xie, X., Ge, S., Ye, Z., Xu, J., and Chen, M.: Aerosol characteristics and sources in Yangzhou, China resolved by offline aerosol mass spectrometry and other techniques, Environ. Pollut., 225, 74–85, https://doi.org/10.1016/j.envpol.2017.03.044, 2017.
Girdwood, J., Smith, H., Stanley, W., Ulanowski, Z., Stopford, C., Chemel, C., Doulgeris, K.-M., Brus, D., Campbell, D., and Mackenzie, R.: Design and field campaign validation of a multi-rotor unmanned aerial vehicle and optical particle counter, Atmos. Meas. Tech., 13, 6613–6630, https://doi.org/10.5194/amt-13-6613-2020, 2020.
Glaser, K., Vogt, U., Baumbach, G., Volz-Thomas, A., and Geiss, H.: Vertical profiles of O3, NO2, NOx, VOC, and meteorological parameters during the Berlin Ozone Experiment (BERLIOZ) campaign, J. Geophys. Res.-Atmos., 108, 8253, https://doi.org/10.1029/2002jd002475, 2003.
Groma, V., Alföldy, B., Börcsök, E., Czömpöly, O., Füri, P., Horváthné Kéri, A., Kovács, G., Török, S., and Osán, J.: Sources and health effects of fine and ultrafine aerosol particles in an urban environment, Atmos. Pollut. Res., 13, 101302, https://doi.org/10.1016/j.apr.2021.101302, 2022.
Gustafsson, Ö. and Ramanathan, V.: Convergence on climate warming by black carbon aerosols, P. Natl. Acad. Sci. USA, 113, 4243–4245, https://doi.org/10.1073/pnas.1603570113, 2016.
Heal, M. R., Kumar, P., and Harrison, R. M.: Particles, air quality, policy and health, Chem. Soc. Rev., 41, 6606–6630, https://doi.org/10.1039/C2CS35076A, 2012.
Hemingway, B. L., Frazier, A. E., Elbing, B. R., and Jacob, J. D.: Vertical sampling scales for atmospheric boundary layer measurements from small unmanned aircraft systems (sUAS), Atmosphere, 8, 176, https://doi.org/10.3390/atmos8090176, 2017.
Hering, S. V, Spielman, S. R., and Lewis, G. S.: Moderated, Water-Based, Condensational Particle Growth in a Laminar Flow, Aerosol Sci. Tech., 48, 401–408, https://doi.org/10.1080/02786826.2014.881460, 2014.
Jaffe, D. A., O'Neill, S. M., Larkin, N. K., Holder, A. L., Peterson, D. L., Halofsky, J. E., and Rappold, A. G.: Wildfire and prescribed burning impacts on air quality in the United States, J. Air Waste Manag. Assoc., 70, 583–615, https://doi.org/10.1080/10962247.2020.1749731, 2020.
Jayne, J. T., Leard, D. C., Zhang, X., Davidovits, P., Smith, K. A., Kolb, C. E., and Worsnop, D. R.: Development of an aerosol mass spectrometer for size and composition analysis of submicron particles, Aerosol Sci. Tech., 33, 49–70, https://doi.org/10.1080/027868200410840, 2000.
Jiang, W., Misovich, M. V., Hettiyadura, A. P. S., Laskin, A., McFall, A. S., Anastasio, C., and Zhang, Q.: Photosensitized Reactions of a Phenolic Carbonyl from Wood Combustion in the Aqueous Phase - Chemical Evolution and Light Absorption Properties of AqSOA, Environ. Sci. Technol., 55, 5199–5211, https://doi.org/10.1021/acs.est.0c07581, 2021.
Kezoudi, M., Keleshis, C., Antoniou, P., Biskos, G., Bronz, M., Constantinides, C., Desservettaz, M., Gao, R.-S., Girdwood, J., Harnetiaux, J., Kandler, K., Leonidou, A., Liu, Y., Lelieveld, J., Marenco, F., Mihalopoulos, N., Močnik, G., Neitola, K., Paris, J.-D., Pikridas, M., Sarda-Esteve, R., Stopford, C., Unga, F., Vrekoussis, M., and Sciare, J.: The Unmanned Systems Research Laboratory (USRL): A New Facility for UAV-Based Atmospheric Observations, Atmosphere, 12, 1042, https://doi.org/10.3390/atmos12081042, 2021.
Kim, K.-H., Kabir, E., and Kabir, S.: A review on the human health impact of airborne particulate matter, Environ. Int., 74, 136–143, https://doi.org/10.1016/j.envint.2014.10.005, 2015.
Kimmel, J. R., Farmer, D. K., Cubison, M. J., Sueper, D., Tanner, C., Nemitz, E., Worsnop, D. R., Gonin, M., and Jimenez, J. L.: Real-time aerosol mass spectrometry with millisecond resolution, Int. J. Mass Spectrom., 303, 15–26, https://doi.org/10.1016/j.ijms.2010.12.004, 2011.
Kleinman, L. I., Sedlacek III, A. J., Adachi, K., Buseck, P. R., Collier, S., Dubey, M. K., Hodshire, A. L., Lewis, E., Onasch, T. B., Pierce, J. R., Shilling, J., Springston, S. R., Wang, J., Zhang, Q., Zhou, S., and Yokelson, R. J.: Rapid evolution of aerosol particles and their optical properties downwind of wildfires in the western US, Atmos. Chem. Phys., 20, 13319–13341, https://doi.org/10.5194/acp-20-13319-2020, 2020.
Kobziar, L. N., Pingree, M. R. A., Watts, A. C., Nelson, K. N., Dreaden, T. J., and Ridout, M.: Accessing the Life in Smoke: A New Application of Unmanned Aircraft Systems (UAS) to Sample Wildland Fire Bioaerosol Emissions and Their Environment, Fire, 2, 56, https://doi.org/10.3390/FIRE2040056, 2019.
Lambey, V. and Prasad, A. D.: A Review on Air Quality Measurement Using an Unmanned Aerial Vehicle, Water Air Soil Pollut., 232, 109, https://doi.org/10.1007/s11270-020-04973-5, 2021.
Li, H., Zhang, Q., Jiang, W., Collier, S., Sun, Y., Zhang, Q., and He, K.: Characteristics and sources of water-soluble organic aerosol in a heavily polluted environment in Northern China, Sci. Total Environ., 758, 143970, https://doi.org/10.1016/j.scitotenv.2020.143970, 2021.
Li, J., Zhang, Q., Wang, G., Li, J., Wu, C., Liu, L., Wang, J., Jiang, W., Li, L., Ho, K. F., and Cao, J.: Optical properties and molecular compositions of water-soluble and water-insoluble brown carbon (BrC) aerosols in northwest China, Atmos. Chem. Phys., 20, 4889–4904, https://doi.org/10.5194/acp-20-4889-2020, 2020.
Li, Y. J., Sun, Y., Zhang, Q., Li, X., Li, M., Zhou, Z., and Chan, C. K.: Real-time chemical characterization of atmospheric particulate matter in China: A review, Atmos. Environ., 158, 270–304, https://doi.org/10.1016/j.atmosenv.2017.02.027, 2017.
Liu, J., Alexander, L., Fast, J. D., Lindenmaier, R., and Shilling, J. E.: Aerosol characteristics at the Southern Great Plains site during the HI-SCALE campaign, Atmos. Chem. Phys., 21, 5101–5116, https://doi.org/10.5194/acp-21-5101-2021, 2021.
Liu, P. S. K., Deng, R., Smith, K. A., Williams, L. R., Jayne, J. T., Canagaratna, M. R., Moore, K., Onasch, T. B., Worsnop, D. R., and Deshler, T.: Transmission Efficiency of an Aerodynamic Focusing Lens System: Comparison of Model Calculations and Laboratory Measurements for the Aerodyne Aerosol Mass Spectrometer, Aerosol Sci. Tech., 41, 721–733, https://doi.org/10.1080/02786820701422278, 2007.
Liu, Y., Dong, X., Wang, M., Emmons, L. K., Liu, Y., Liang, Y., Li, X., and Shrivastava, M.: Analysis of secondary organic aerosol simulation bias in the Community Earth System Model (CESM2.1), Atmos. Chem. Phys., 21, 8003–8021, https://doi.org/10.5194/acp-21-8003-2021, 2021.
Lou, S., Shrivastava, M., Easter, R. C., Yang, Y., Ma, P.-L., Wang, H., Cubison, M. J., Campuzano-Jost, P., Jimenez, J. L., Zhang, Q., Rasch, P. J., Shilling, J. E., Zelenyuk, A., Dubey, M., Cameron-Smith, P., Martin, S. T., Schneider, J., and Schulz, C.: New SOA Treatments Within the Energy Exascale Earth System Model (E3SM): Strong Production and Sinks Govern Atmospheric SOA Distributions and Radiative Forcing, J. Adv. Model. Earth Syst., 12, e2020MS002266, https://doi.org/10.1029/2020MS002266, 2020.
Ma, L., Guzman, C., Niedek, C., Tran, T., Zhang, Q., and Anastasio, C.: Kinetics and Mass Yields of Aqueous Secondary Organic Aerosol from Highly Substituted Phenols Reacting with a Triplet Excited State, Environ. Sci. Technol., 55, 5772–5781, https://doi.org/10.1021/acs.est.1c00575, 2021.
Maahn, M., de Boer, G., Creamean, J. M., Feingold, G., McFarquhar, G. M., Wu, W., and Mei, F.: The observed influence of local anthropogenic pollution on northern Alaskan cloud properties, Atmos. Chem. Phys., 17, 14709–14726, https://doi.org/10.5194/acp-17-14709-2017, 2017.
Mei, F. and Goldberger, L. A.: Time-Resolved Aerosol Filter Sampler Instrument Handbook, United States, DOE/SC-ARM-TR-256, 2020.
Mei, F., Pekour, M. S., Dexheimer, D., de Boer, G., Cook, R., Tomlinson, J., Schmid, B., Goldberger, L. A., Newsom, R., and Fast, J. D.: Observational data from uncrewed systems over Southern Great Plains, Earth Syst. Sci. Data, 14, 3423–3438, https://doi.org/10.5194/essd-14-3423-2022, 2022.
Mihara, T. and Mochida, M.: Characterization of solvent-extractable organics in urban aerosols based on mass spectrum analysis and hygroscopic growth measurement, Environ. Sci. Technol., 45, 9168–9174, https://doi.org/10.1021/es201271w, 2011.
Moschos, V., Kumar, N. K., Daellenbach, K. R., Baltensperger, U., Prévôt, A. S. H., and El Haddad, I.: Source Apportionment of Brown Carbon Absorption by Coupling Ultraviolet–Visible Spectroscopy with Aerosol Mass Spectrometry, Environ. Sci. Technol. Lett., 5, 302–308, https://doi.org/10.1021/acs.estlett.8b00118, 2018.
O'Brien, R. E., Ridley, K. J., Canagaratna, M. R., Jayne, J. T., Croteau, P. L., Worsnop, D. R., Budisulistiorini, S. H., Surratt, J. D., Follett, C. L., Repeta, D. J., and Kroll, J. H.: Ultrasonic nebulization for the elemental analysis of microgram-level samples with offline aerosol mass spectrometry, Atmos. Meas. Tech., 12, 1659–1671, https://doi.org/10.5194/amt-12-1659-2019, 2019.
Parworth, C., Fast, J., Mei, F., Shippert, T., Sivaraman, C., Tilp, A., Watson, T., and Zhang, Q.: Long-term measurements of submicrometer aerosol chemistry at the Southern Great Plains (SGP) using an Aerosol Chemical Speciation Monitor (ACSM), Atmos. Environ., 106, 43–55, https://doi.org/10.1016/j.atmosenv.2015.01.060, 2015.
Permar, W., Wang, Q., Selimovic, V., Wielgasz, C., Yokelson, R. J., Hornbrook, R. S., Hills, A. J., Apel, E. C., Ku, I.-T., Zhou, Y., Sive, B. C., Sullivan, A. P., Collett Jr, J. L., Campos, T. L., Palm, B. B., Peng, Q., Thornton, J. A., Garofalo, L. A., Farmer, D. K., Kreidenweis, S. M., Levin, E. J. T., DeMott, P. J., Flocke, F., Fischer, E. V., and Hu, L.: Emissions of Trace Organic Gases From Western U.S. Wildfires Based on WE-CAN Aircraft Measurements, J. Geophys. Res.-Atmos., 126, e2020JD033838, https://doi.org/10.1029/2020JD033838, 2021.
Plummer, L. E., Carosino, C. M., Bein, K. J., Zhao, Y., Willits, N., Smiley-Jewell, S., Wexler, A. S., and Pinkerton, K. E.: Pulmonary inflammatory effects of source-oriented particulate matter from California's San Joaquin Valley, Atmos. Environ., 119, 174–181, https://doi.org/10.1016/j.atmosenv.2015.08.043, 2015.
Ramanathan, V., Crutzen, P. J., Lelieveld, J., Mitra, A. P., Althausen, D., Anderson, J., Andreae, M. O., Cantrell, W., Cass, G. R., Chung, C. E., Clarke, A. D., Coakley, J. A., Collins, W. D., Conant, W. C., Dulac, F., Heintzenberg, J., Heymsfield, A. J., Holben, B., Howell, S., Hudson, J., Jayaraman, A., Kiehl, J. T., Krishnamurti, T. N., Lubin, D., McFarquhar, G., Novakov, T., Ogren, J. A., Podgorny, I. A., Prather, K., Priestley, K., Prospero, J. M., Quinn, P. K., Rajeev, K., Rasch, P., Rupert, S., Sadourny, R., Satheesh, S. K., Shaw, G. E., Sheridan, P., and Valero, F. P. J.: Indian Ocean Experiment: An integrated analysis of the climate forcing and effects of the great Indo-Asian haze, J. Geophys. Res.-Atmos., 106, 28371–28398, https://doi.org/10.1029/2001JD900133, 2001.
Reddington, C. L., Carslaw, K. S., Stier, P., Schutgens, N., Coe, H., Liu, D., Allan, J., Browse, J., Pringle, K. J., Lee, L. A., Yoshioka, M., Johnson, J. S., Regayre, L. A., Spracklen, D. V, Mann, G. W., Clarke, A., Hermann, M., Henning, S., Wex, H., Kristensen, T. B., Leaitch, W. R., Pöschl, U., Rose, D., Andreae, M. O., Schmale, J., Kondo, Y., Oshima, N., Schwarz, J. P., Nenes, A., Anderson, B., Roberts, G. C., Snider, J. R., Leck, C., Quinn, P. K., Chi, X., Ding, A., Jimenez, J. L., and Zhang, Q.: The Global Aerosol Synthesis and Science Project (GASSP): Measurements and Modeling to Reduce Uncertainty, B. Am. Meteorol. Soc., 98, 1857–1877, https://doi.org/10.1175/BAMS-D-15-00317.1, 2017.
Shrivastava, M., Cappa, C. D., Fan, J., Goldstein, A. H., Guenther, A. B., Jimenez, J. L., Kuang, C., Laskin, A., Martin, S. T., Ng, N. L., Petaja, T., Pierce, J. R., Rasch, P. J., Roldin, P., Seinfeld, J. H., Shilling, J., Smith, J. N., Thornton, J. A., Volkamer, R., Wang, J., Worsnop, D. R., Zaveri, R. A., Zelenyuk, A., and Zhang, Q.: Recent advances in understanding secondary organic aerosol: Implications for global climate forcing, Rev. Geophys., 55, 509–559, https://doi.org/10.1002/2016RG000540, 2017.
Shupe, M. D., Persson, P. O. G., Brooks, I. M., Tjernström, M., Sedlar, J., Mauritsen, T., Sjogren, S., and Leck, C.: Cloud and boundary layer interactions over the Arctic sea ice in late summer, Atmos. Chem. Phys., 13, 9379–9399, https://doi.org/10.5194/acp-13-9379-2013, 2013.
Sisterson, D. L., Peppler, R. A., Cress, T. S., Lamb, P. J., and Turner, D. D.: The ARM Southern Great Plains (SGP) Site, Meteorol. Monogr., 57, 6.1–6.14, https://doi.org/10.1175/AMSMONOGRAPHS-D-16-0004.1, 2016.
Sommers, W. T., Loehman, R. A., and Hardy, C. C.: Wildland fire emissions, carbon, and climate: Science overview and knowledge needs, Forest Ecol. Manage., 317, 1–8, https://doi.org/10.1016/j.foreco.2013.12.014, 2014.
Sun, X., Wei, H., Young, D. E., Bein, K. J., Smiley-Jewell, S. M., Zhang, Q., Fulgar, C. C. B., Castañeda, A. R., Pham, A. K., Li, W., and Pinkerton, K. E.: Differential pulmonary effects of wintertime California and China particulate matter in healthy young mice, Toxicol. Lett., 278, 1–8, https://doi.org/10.1016/j.toxlet.2017.07.853, 2017.
Sun, Y., Zhang, Q., Zheng, M., Ding, X., Edgerton, E. S., and Wang, X.: Characterization and source apportionment of water-soluble organic matter in atmospheric fine particles (PM2.5) with high-resolution aerosol mass spectrometry and GC-MS, Environ. Sci. Technol., 45, 4854–4861, https://doi.org/10.1021/es200162h, 2011.
Villa, T. F., Gonzalez, F., Miljievic, B., Ristovski, Z. D., and Morawska, L.: An Overview of Small Unmanned Aerial Vehicles for Air Quality Measurements: Present Applications and Future Prospectives, Sensors, 16, 1072, https://doi.org/10.3390/s16071072, 2016.
Vlachou, A., Daellenbach, K. R., Bozzetti, C., Chazeau, B., Salazar, G. A., Szidat, S., Jaffrezo, J.-L., Hueglin, C., Baltensperger, U., Haddad, I. E., and Prévôt, A. S. H.: Advanced source apportionment of carbonaceous aerosols by coupling offline AMS and radiocarbon size-segregated measurements over a nearly 2-year period, Atmos. Chem. Phys., 18, 6187–6206, https://doi.org/10.5194/acp-18-6187-2018, 2018.
Von Schneidemesser, E., Monks, P. S., Allan, J. D., Bruhwiler, L., Forster, P., Fowler, D., Lauer, A., Morgan, W. T., Paasonen, P., Righi, M., Sindelarova, K., and Sutton, M. A.: Chemistry and the Linkages between Air Quality and Climate Change, Chem. Rev., 115, 3856–3897, https://doi.org/10.1021/acs.chemrev.5b00089, 2015.
Yu, L., Smith, J., Laskin, A., Anastasio, C., Laskin, J., and Zhang, Q.: Chemical characterization of SOA formed from aqueous-phase reactions of phenols with the triplet excited state of carbonyl and hydroxyl radical, Atmos. Chem. Phys., 14, 13801–13816, https://doi.org/10.5194/acp-14-13801-2014, 2014.
Yu, L., Smith, J., Laskin, A., George, K. M., Anastasio, C., Laskin, J., Dillner, A. M., and Zhang, Q.: Molecular transformations of phenolic SOA during photochemical aging in the aqueous phase: competition among oligomerization, functionalization, and fragmentation, Atmos. Chem. Phys., 16, 4511–4527, https://doi.org/10.5194/acp-16-4511-2016, 2016.
Zhang, Q., Zhou, S., Collier, S., Jaffe, D., Onasch, T., Shilling, J., Kleinman, L., and Sedlacek, A.: Understanding Composition, Formation, and Aging of Organic Aerosols in Wildfire Emissions via Combined Mountain Top and Airborne Measurements, in: Multiphase Environmental Chemistry in the Atmosphere, chap. 18, 1299, 363–385, American Chemical Society, https://doi.org/10.1021/bk-2018-1299.ch018, 2018.
Zhou, S., Collier, S., Xu, J., Mei, F., Wang, J., Lee, Y.-N., Sedlacek III, A. J., Springston, S. R., Sun, Y., and Zhang, Q.: Influences of upwind emission sources and atmospheric processing on aerosol chemistry and properties at a rural location in the Northeastern U.S., J. Geophys. Res.-Atmos., 121, 6049–6065, https://doi.org/10.1002/2015JD024568, 2016.
Zhou, W., Xu, W., Kim, H., Zhang, Q., Fu, P., Worsnop, D. R., and Sun, Y.: A review of aerosol chemistry in Asia: insights from aerosol mass spectrometer measurements, Environ. Sci.-Proc. Imp., 22, 1616–1653, https://doi.org/10.1039/D0EM00212G, 2020.