the Creative Commons Attribution 4.0 License.
the Creative Commons Attribution 4.0 License.
 | 23 Feb 2024
Validation and field application of a low-cost device to measure CO2 and evapotranspiration (ET) fluxes
Michael Asante
Geoffroy Sossa
Danica Antonijević
Maren Dubbert
Mathias Hoffmann
Mitigating the global climate crisis and its consequences, such as more frequent and severe droughts, is one of the major challenges for future agriculture. Therefore, identifying land use systems and management practices that reduce greenhouse gas (GHG) emissions and promote water use efficiency (WUE) is crucial. This, however, requires accurate and precise measurements of carbon dioxide (CO2) fluxes and evapotranspiration (ET). Despite that, commercial systems to measure CO2 and ET fluxes are expensive and thus often exclude research in ecosystems within the Global South. This is especially true for research and data of agroecosystems in these areas, which are to date still widely underrepresented. Here, we present a newly developed low-cost, non-dispersive infrared (NDIR)-based CO2 and ET flux measurement device (∼ EUR 200) that provides reliable, accurate and precise CO2 and ET flux measurements in conjunction with manually operated closed chambers. To validate the system, laboratory and field validation experiments were performed, testing multiple different low-cost sensors. We demonstrate that the system delivers accurate and precise CO2 and ET flux measurements using the K30 FR NDIR (CO2) and SHT31 (RH, relative humidity) sensor. An additional field trial application demonstrated its longer-term stability (> 3 months) and ability to obtain valid net ecosystem C balances (NECBs) and WUE. This was the case, even though environmental conditions at the field trial application site in sub-Saharan Africa were rather challenging (e.g., extremely high temperatures, humidity and rainfall). Consequently, the developed low-cost CO2 and ET flux measurement device not only provides reasonable results but also might help with democratizing science and closing current data gaps.
- Article
(5655 KB) - Full-text XML
- BibTeX
- EndNote


The global climate crisis is one of the most critical problems of our time, and identifying and implementing measures to mitigate or adapt to its consequences, such as more frequent and severe drought, is a key challenge. Solving this challenge requires first and foremost a substantial reduction of anthropogenic greenhouse gas (GHG) emissions in all sectors (IPCC, 2019). While agriculture is a significant contributor to these anthropogenic GHG emissions (FAO, 2020), it might also offer the potential to mitigate the climate crisis by increasing soil carbon (C) sequestration (Lal, 2004). Specifically, land use systems and management practices which not only promote a net C uptake but also promote an efficient water use are needed. They might help to increase soil C stocks and crop productivity, reducing GHG emissions while simultaneously sustaining yield, despite intensifying climate stressors, such as more frequent and severe droughts. Hence, it is crucial to evaluate land use systems regarding their potential to sequester additional C and effectively utilize water. Common parameters used to assess both are the net ecosystem C balance (NECB; Smith et al., 2010) and the agronomic and ecosystem water use efficiency (WUE; Beer et al., 2009). Their determination, however, requires accurate and precise measurement of carbon dioxide (CO2) and evapotranspiration (ET) fluxes (Chapin et al., 2006; Livingston and Hutchinson, 1995; Rosenstock et al., 2016; Xu et al., 2019).
Measurement of CO2 and ET fluxes are commonly performed using eddy covariance or chamber-based systems (Baldocchi et al., 1996; Smith et al., 2010; Wang et al., 2017; Yang et al., 2014), while the latter are especially well suited for direct treatment comparisons (Dubbert et al., 2014; Hoffmann et al., 2018; Kübert et al., 2020). In the case of a remote study site or limitations in power supply, manually operated closed-chamber measurements are particularly used to measure the CO2 exchange and ET fluxes (Rochette and Hutchinson, 2015). However, the relatively high costs of needed measurement equipment (particularly gas analyzers) strongly limits their accessibility and often excludes research in ecosystems within the Global South. This resulted in a pronounced underrepresentation of regions, land use systems, and management practices from subtropical and tropical South America, south Asia, and Africa, even though the quantification of, for example, CO2 fluxes in these regions might reduce disparities in the global CO2 budget (Canadell et al., 2011; Gurney et al., 2002; Kondo et al., 2015).
Recent efforts to solve this financial constraint focus on developing low-cost, yet reliable, measurement devices. This was catalyzed by the growing availability of relatively inexpensive microcontrollers, which are increasingly utilized for scientific environmental research (Blackstock et al., 2019; Capri et al., 2021). An additional contribution came from the improvement in accuracy and precision of low-cost relative humidity (RH) and especially non-dispersive infrared (NDIR) CO2 sensors. Evaluation of commercially available NDIR CO2 sensors (Keimel, 2019; Martin et al., 2017; Pandey et al., 2007; Yasuda et al., 2012) showed that they have acceptable precision and accuracy in measuring CO2 concentrations, especially when proper calibration methods are applied. Although low-cost NDIR CO2 sensors are commonly used in air quality monitoring studies (Araújo et al., 2020; Wastine et al., 2022), these sensors have also been applied in environmental research (Bastviken et al., 2015; Brown et al., 2020). For example, multiple studies have demonstrated the applicability of using low-cost NDIR CO2 sensors for reliable measurements of soil CO2 efflux (Brändle and Kunert, 2019; Curcoll et al., 2022; Harmon et al., 2015) and water crop use determination (Capri et al., 2021). However, in the case of RH sensors, the inversely increased measurement uncertainty of total water vapor concentration with decreasing RH (e.g., a typical low-cost RH sensor has a measurement accuracy of 1 %–3 % in relative but not absolute humidity) might constitute a problem. Despite first studies showing the potential of using low-cost sensors as an alternative to more-expensive commercial counterparts, there is still little evidence that in situ closed-chamber CO2 and ET flux measurements using both are comparable in precision and accuracy.
Here, we present the hardware and software implementation, as well as laboratory and in situ validation, of a new low-cost CO2 and ET flux measurement device with open-source technology. We hypothesize that by using the device in conjunction with a closed chamber (1) CO2 and ET fluxes can be reliably and accurately measured, and that (2) measured CO2 and ET fluxes can be used to obtain valid estimates of net ecosystem C balance (NECB) and WUE, even under challenging environmental conditions such as extremely high air temperatures, humidity and precipitation. To test these hypotheses, we first validated the accuracy and precision of four different low-cost NDIR CO2 sensors (K30 FR, SCD30, MH-Z14 and MH-Z19) under controlled laboratory conditions. Afterwards, the NDIR sensors passing laboratory validation as well as two different RH sensors were validated in the field. During field validation, ET and CO2 fluxes (ecosystem respiration (Reco) and net ecosystem exchange (NEE)), as well as temperature-dependent Reco and photosynthetically active radiation (PAR)-dependent gross primary production (GPP) parameters, were compared to the results obtained simultaneously with a reference infrared gas analyzer (IRGA; LI-850, LI-COR, USA). Finally, the ability of the developed low-cost CO2 and ET flux measurement device to obtain reliable NECB and WUE as well as its practicability and stability was tested. Therefore, multiple devices were used during a field trial application in northern Ghana to obtain seasonal CO2 exchange and ET, as well as NECB and WUE for four different fertilizer treatments in a maize cultivation.
2.1 Hardware and software implementation
The developed highly portable CO2 and ET flux measurement device consists of a logger and sensor unit, both assembled from combination of various low-cost, off-the-shelf components. A complete list of used components, distributors and prices is given in Table 1. Figure 1 shows the assembled logger and attachable sensor unit, together with a schematic representation of the wiring. The logger unit consists of an Arduino Uno-like microcontroller (Atmega328, AZ-Delivery Vertriebs GmbH, Germany) with attached logger shield module (AZ-Delivery Vertriebs GmbH, Germany), including an SD card reader and SD card (2 GB) to store sensor readings and a real time clock (RTC), which helps to keep the time and date even when the system is switched off. A BME280 air temperature (±1 °C), air humidity (±3 %) and air pressure sensor (±1 hPa; Reichelt electronics GmbH, Germany) as well as an LCD (AZ-Delivery Vertriebs GmbH, Germany) and HC-05 Bluetooth module are part of the logger unit and are connected to the microcontroller. The logger unit is fitted into a weather- and shock-resistant outdoor housing (B&W outdoor case type 500, Overhaul Media GmbH, Germany). It easily connects to end-user devices using the Bluetooth module, so data can be visualized inter alia with a smartphone in real time without the need to open the weather- and shock-resistant outdoor housing. The external sensor unit consists of an NDIR-based CO2 (0–10 000 ppm, ±30 ppm ± 3 % accuracy; K30 FR, Senseair AB, Sweden) and an air humidity (RH) and air temperature sensor (SHT31, ±2 % accuracy, Sensirion AG, Switzerland or DHT22, ±2 % to 5 % accuracy, Aosong Electronics Co., Ltd., China). Both sensors were connected through a seven-core cable to the logger unit using UART (K30 FR) and I2C (SHT31) data communication, respectively. The power supply of the microcontroller is energized by six rechargeable AA nickel–metal hydride (Ni–MH) batteries (1.2 V; 2600 mAh) in a 6 × AA battery holder, which supplies 7.2 V. Due to the power requirements of the external sensor unit (K30 FR and SHT31), an additional 6 × AA battery holder is attached to the housing directly. The software implementation was done using Arduino IDE 2.0.3.
Table 1Sensor components and cost (in Euro) at the time of writing, including weather and shock-proof housing and energy supply (rechargeable batteries). Components needed for optional semi-automatic mode are listed in addition. The last access date for section “Cost of other NDIR sensors tested” is 8 December 2023; the last access date for other URLs cited in the table is 21 March 2023.
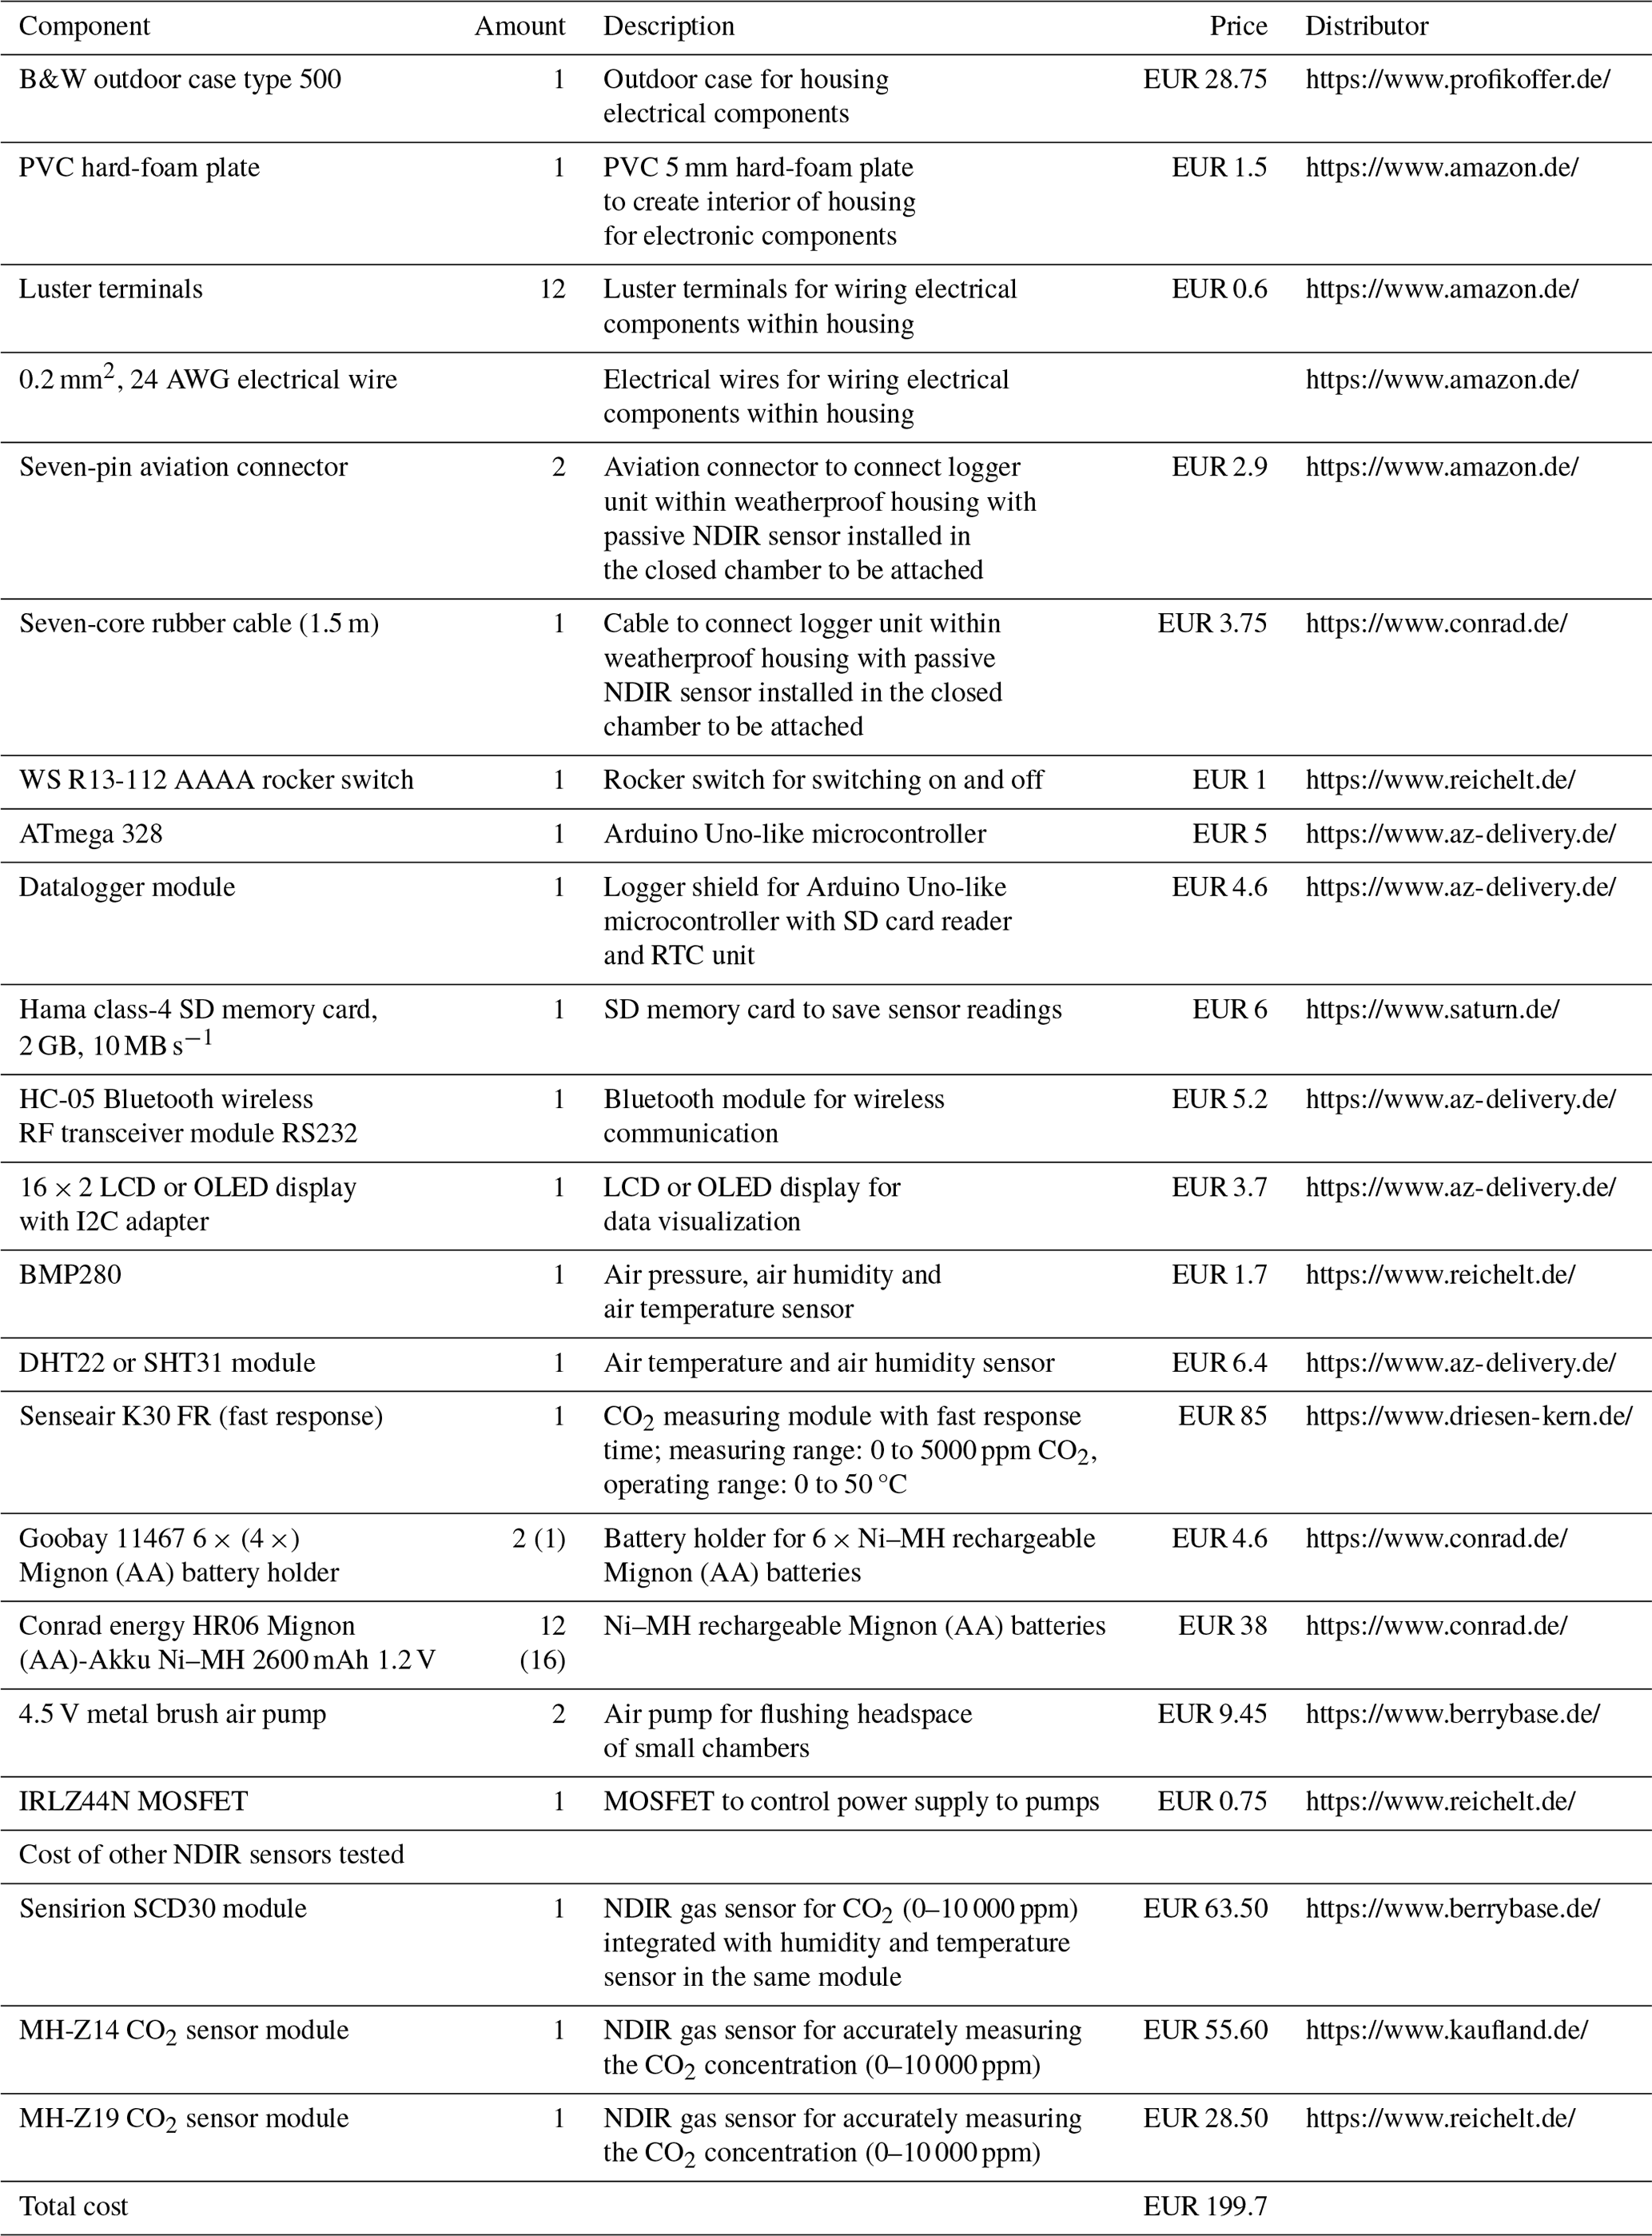
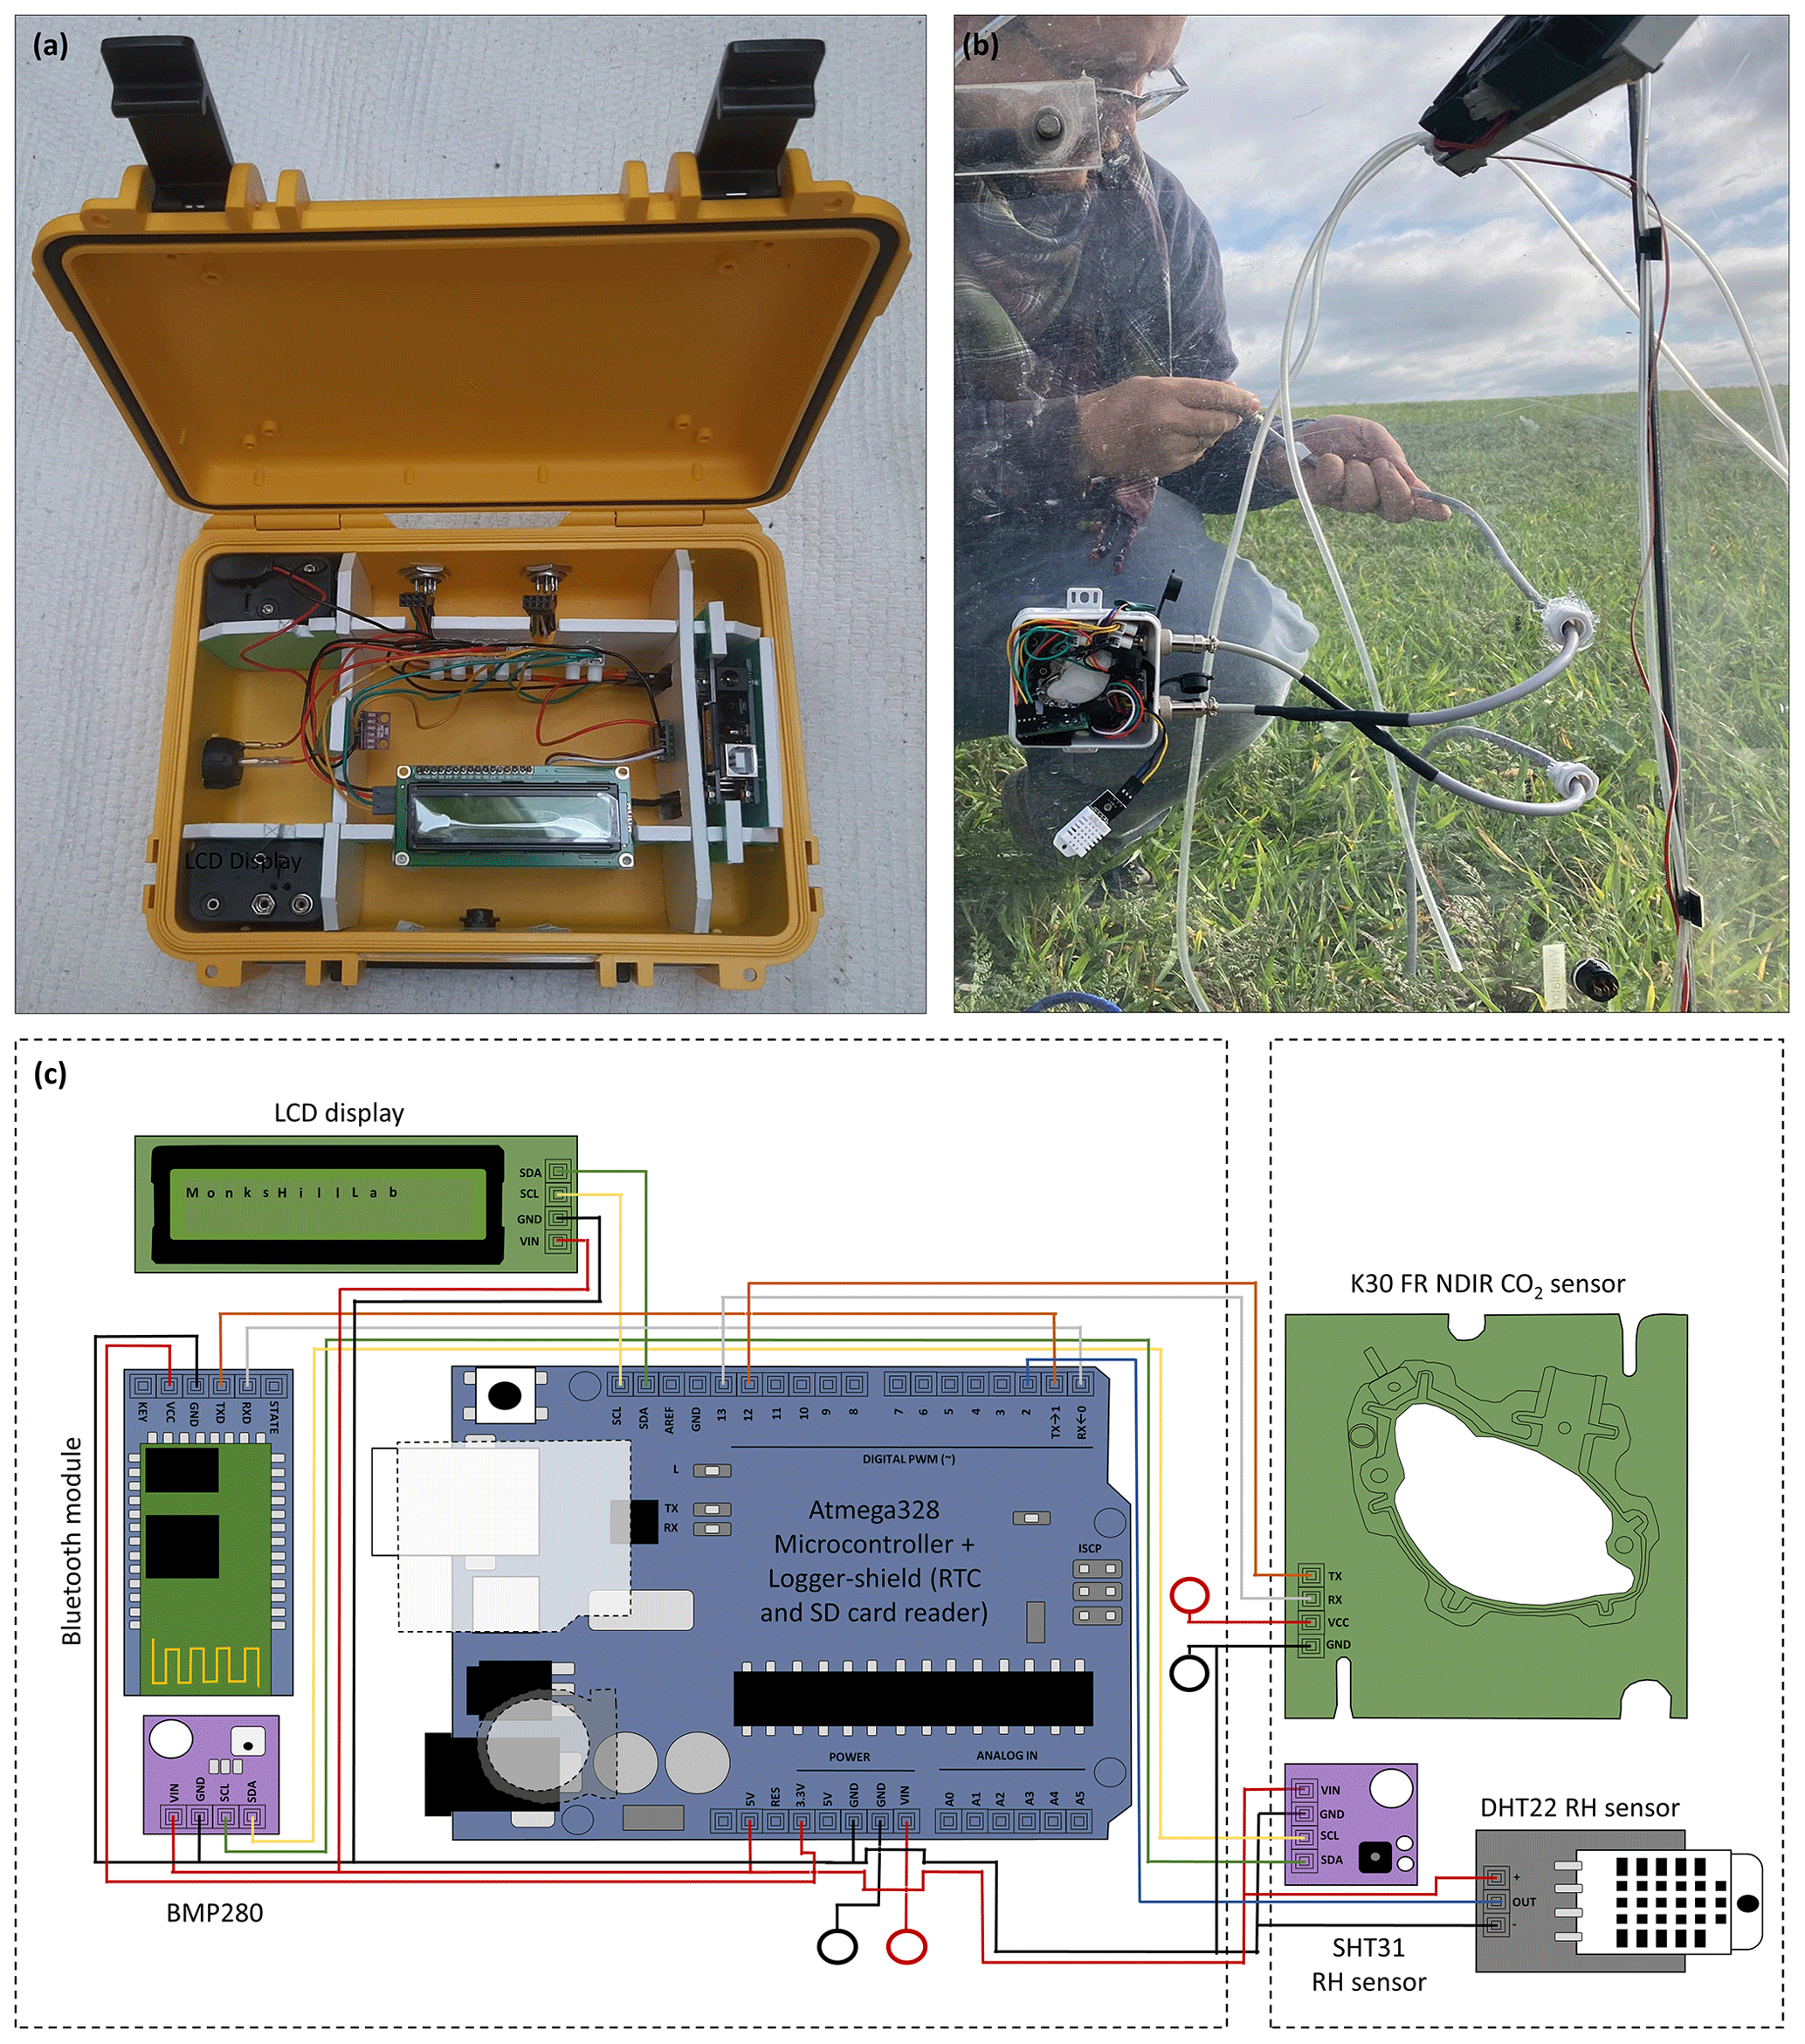
Figure 1(a) Logger unit in weather- and shock-resistant housing, (b) external sensor unit attached to a transparent non-flow-through non-steady-state (NFT-NSS) closed chamber and (c) schematic representation of wiring.
2.2 Laboratory validation
To identify the NDIR sensor most suitable for in situ, dynamic closed-chamber measurements, four different NDIR-based sensors were tested and validated regarding their precision and accuracy during a laboratory validation experiment. The sensors tested were (1) MH-Z19 (Winsen Electronics Technology Co., Ltd., China), (2) MH-Z14 (Winsen Electronics Technology Co., Ltd., China), (3) SCD30 (Sensirion AG, Switzerland) and (4) K30 FR (Senseair AB, Sweden). Sensors were placed separately into a sealed, ventilated, cylindrical vessel (Fig. 2; volume: 1425.5 cm3) and connected to the developed low-cost logger system.
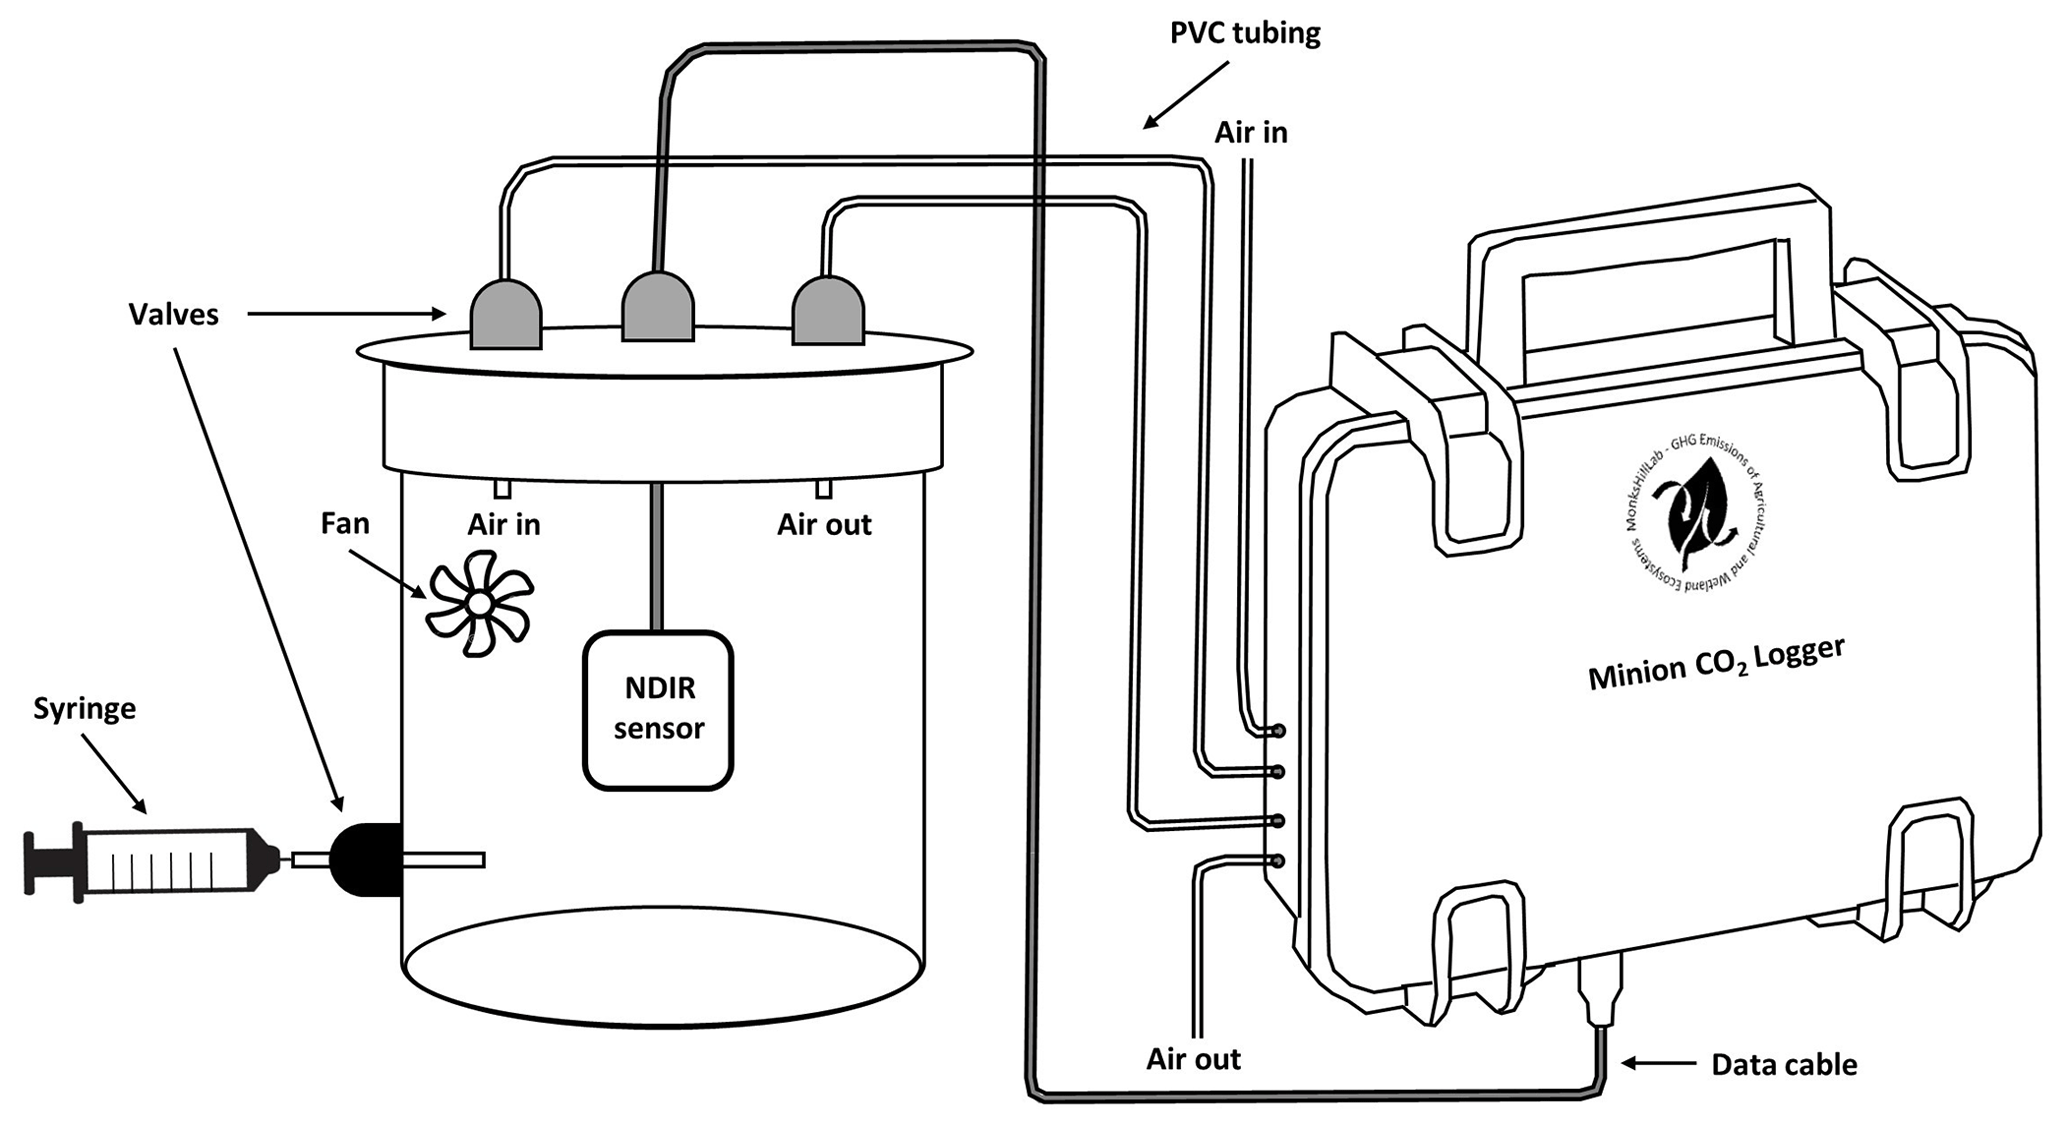
Figure 2Experimental setup of the performed laboratory validation experiment for four different NDIR CO2 sensors connected to the developed low-cost CO2 and ET flux measurement device (MH-Z14, MH-Z19, SCD30 and K30 FR). Validation was performed by injecting distinct amounts of technical gas (Linde, Germany; 10 000 ppm CO2) into the air-tight, sealed, cylindrical vessel.
All sensors were calibrated in ambient air prior to use according to manufacturer instructions. Afterwards, different distinct amounts (5 to 30 mL, in 5 mL steps; each step was repeated five times) of a technical gas containing 10 000 ppm CO2 (Linde, Germany) were injected into the sealed vessel using a syringe. In between injections, the vessel was flushed with ambient air by two pumps (1.5 L min−1) connected to the vessel (semi-automatic measurement mode of the developed device). Finally, CO2 concentration increases inside the vessel, measured with a 5 s interval by the NDIR-based sensors, from before to after injection (ΔCO2 in ppm) were compared against mixing-induced CO2 concentration increases. Sensors that performed best in terms of accuracy and precision were subsequently validated during the field validation experiment.
2.3 Field validation
Field validation of the low-cost CO2 and ET flux measurement device was performed through parallel manually operated taken closed-chamber measurements using an infrared gas analyzer (IRGA; LI-850, LI-COR, USA) and NDIR sensors (CO2) passing previous laboratory validation, as well as two different RH sensors (ET). Measurements were conducted at the “PatchCrop” experimental field, managed by the Leibniz Centre for Agricultural Landscape Research (Fig. 3; ZALF). PatchCrop features multiple smaller patches (72 × 72 m), with diverse and site-specific crop rotations, aiming to create synergies and interactions between fields.
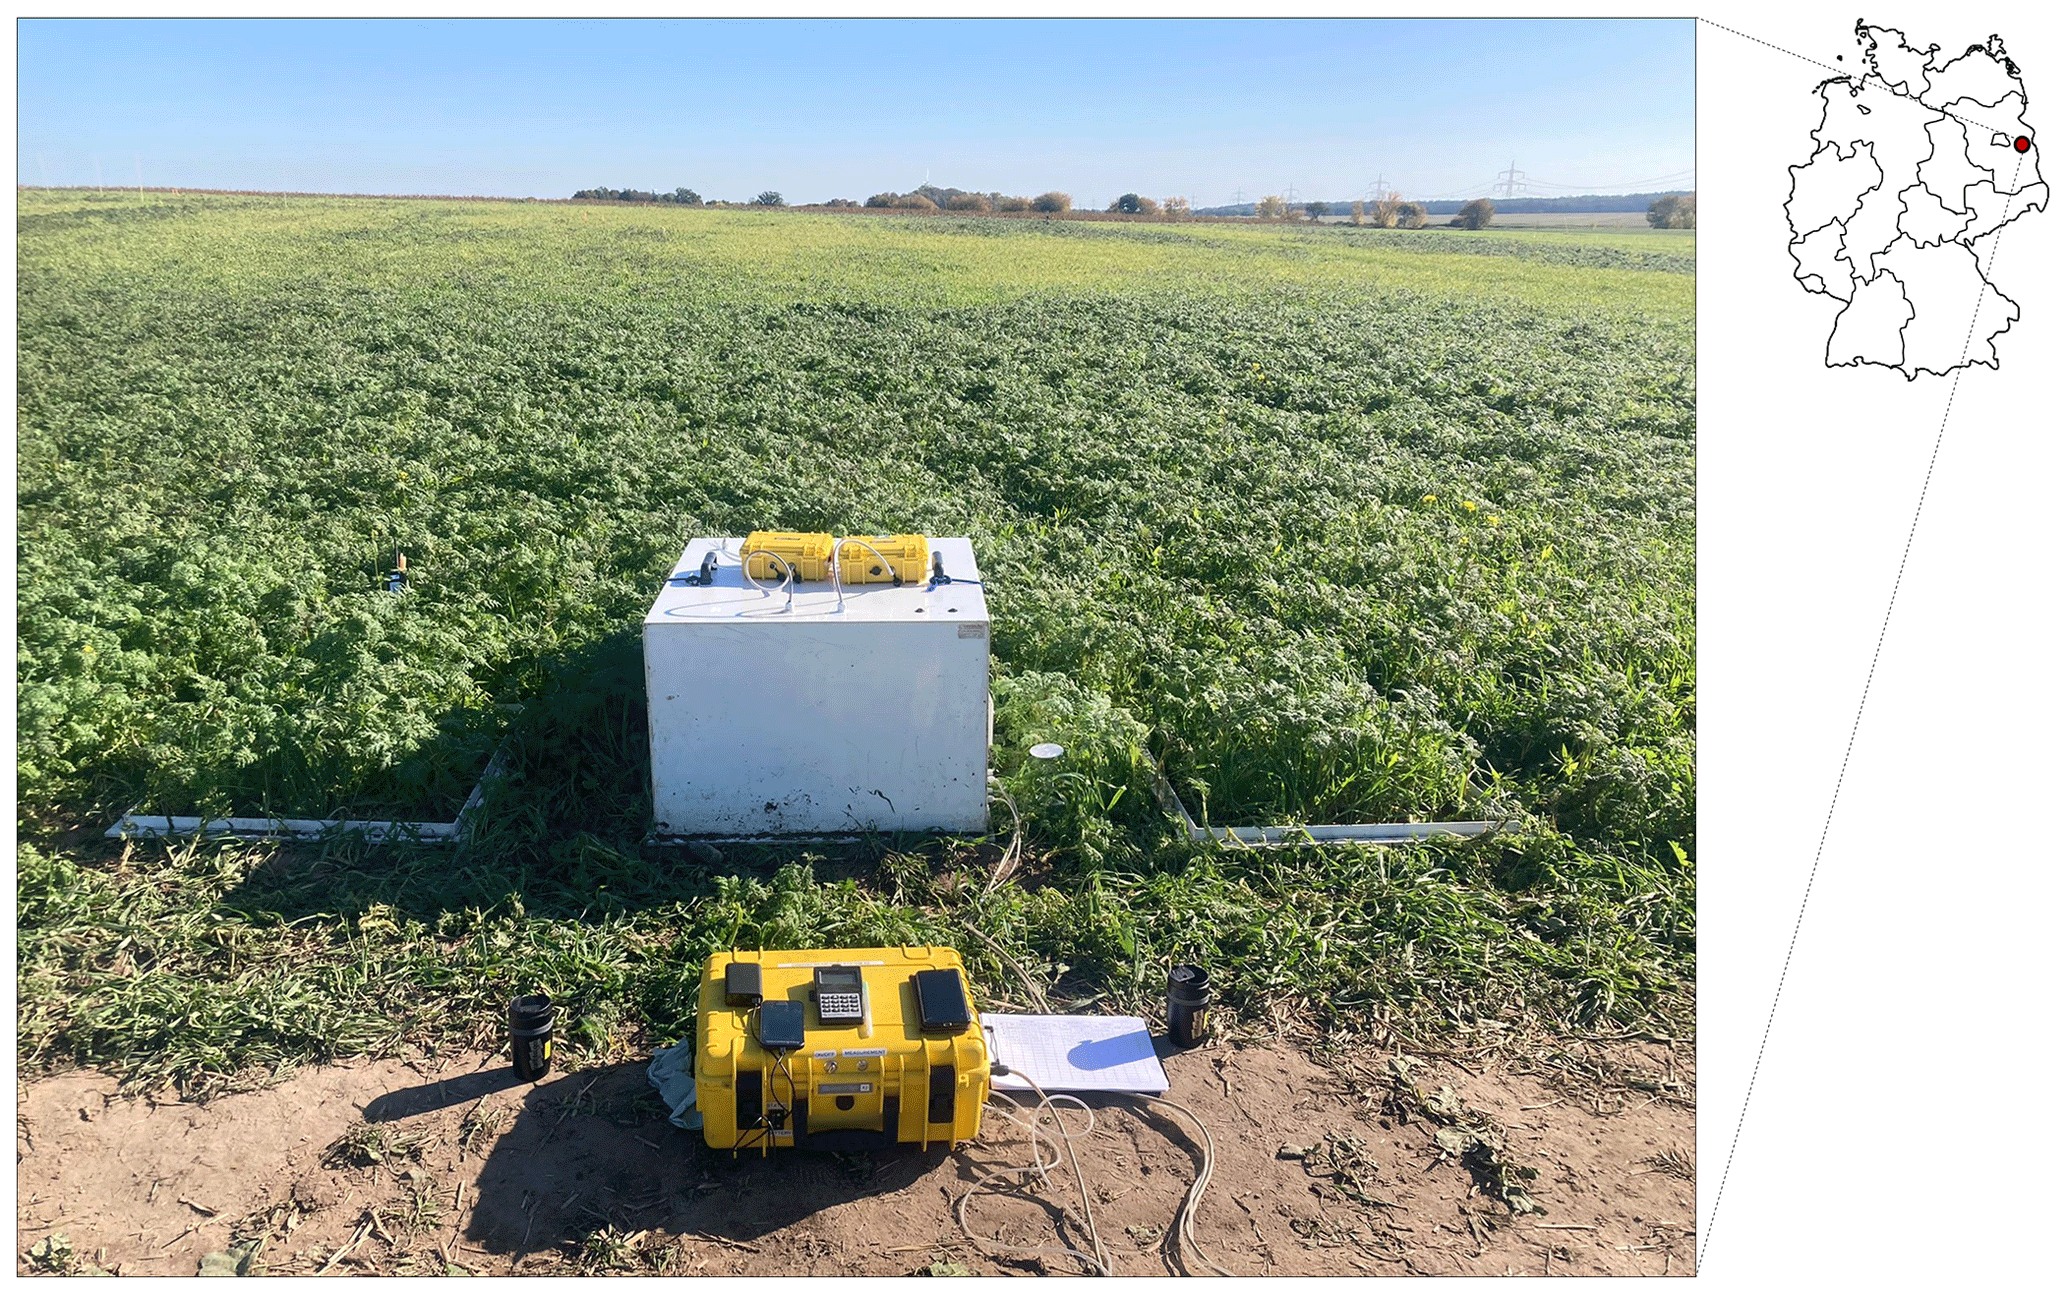
Figure 3Parallel opaque (Reco) manually operated closed-chamber measurements with a LI-COR 850 IRGA (LI-850, LI-COR, USA) and the developed low-cost CO2 and ET flux measurement device at ZALF experimental field near the village of Tempelberg, northeast Germany (52°26′49.2′′ N, 14°09′00.0′′ E). The developed system was equipped with a K30 FR and SCD30 NDIR, as well as SHT31 and DHT22 sensors.
The experimental field PatchCrop is located near the village of Tempelberg, northeast Germany (52°26′49.2′′ N, 14°09′00.0′′ E). The temperate climate is characterized by a mean annual air temperature of 9.7 °C and mean annual precipitation of 544 mm (ZALF weather station, 2010–2019). The medium loamy, sand-textured soil can be classified as Luvisol (IUSS Working Group WRB, 2015). CO2 exchange (NEE and Reco) and ET measurements were conducted for a mixture of Phacelia and Guizotia abyssinica at three repetitive plots, established at one of the patches by installing PVC collars (area: 0.5625 m2, 5 cm deep) in the beginning of October 2022. Measurements started shortly after sunrise and lasted to late afternoon during 2 consecutive days, using a dynamic, (non-)flow-through non-steady-state ((N)FT-NSS) closed-chamber system. The used transparent (86 % light transmission; NEE flux measurements) and opaque (Reco flux measurements) cube-shaped PVC chambers had a total volume of 0.296 m3 and were equipped with a fan for efficient headspace mixing. CO2 and H2O concentrations, as well as RH, during chamber deployment were recorded in parallel using a LI-850 IRGA and the developed low-cost measurement device, equipped with a K30 FR, SCD30, SHT31 and DHT22 sensors, respectively. NEE, Reco and ET fluxes were measured by alternately deploying the opaque and transparent chambers on the three pre-installed PVC frames. During individual 4 min measurements, CO2 and H2O concentration changes in the chamber headspace, as well as RH, air temperature inside and outside the chamber, soil temperature and humidity (TMS-4, TOMST, Czech Republic) as well as PAR (outside the chamber; Skye, UK) were recorded at a 3 s (LI-850) and 5 s interval (NDIR and RH sensors). To validate the low-cost CO2 and ET flux measurement device, measured Reco, NEE and ET fluxes, as well as the derived temperature and PAR dependency functions for Reco and GPP, respectively, were directly compared with results obtained in parallel with the LI-850.
2.4 Field trial application
The developed low-cost measurement device has been tested for applicability and reliability under challenging environmental conditions in an experimental field managed by the Council for Scientific and Industrial Research at the Savanna Agricultural Research Institute (Fig. 4; CSIR-SARI). The experimental field (21 × 54 m), located near the city of Nyankpala, northern Ghana (9°24′15.9′′ N, 01°00′12.1′′ W), featured a split-plot design (3 × 6 m; n=3), with the main plot assigned to tillage practice (conventional vs. reduced tillage) and the subplot assigned to a factorial combination of organic and mineral fertilizers. The tropical region around Nyankpala is characterized by a mean annual air temperature of 26 °C and a unimodal rainfall pattern with a distinct rainy season from June to October followed by a dry season from November to May (Alua et al., 2018), resulting in a mean annual precipitation of 1100 mm (CSIR-SARI weather station, 1995–2013). The soil is sandy loam textured and classified as Acrisol (IUSS Working Group WRB, 2015). CO2 exchange (NEE and Reco) and ET measurements were conducted for maize (Zea mays) from July to October 2022 at four out of the nine treatments with reduced tillage (bullock plow), namely, (1) Fertisoil (5 t ha−1; commercial organic fertilizer in northern Ghana; denoted FT), (2) farmyard manure (5 t ha−1; denoted FM), (3) Fertisoil + NPK (5 t ha−1 + 90–60–60 kg ha−1; denoted FT + MIN) and (4) farmyard manure + NPK (5 t ha−1 + 90–60–60 kg ha−1; denoted FM + MIN). Measurement campaigns took place every 2 weeks from sunrise to late evening using a dynamic, NFT-NSS closed-chamber system. The used transparent (86 % light transmission; NEE flux measurements) and opaque (Reco flux measurements) cube-shaped PVC chambers had a total volume of 1.56 m3 and were equipped with a fan for efficient headspace mixing. CO2 concentration and RH changes during chamber deployment were recorded using the developed low-cost measurement device, equipped with a K30 FR and DHT22 sensor. During each measurement campaign, NEE, Reco and ET fluxes were measured by alternately deploying the opaque and transparent chambers on pre-installed frames (area: 0.96 m2) at each of the measured plots.
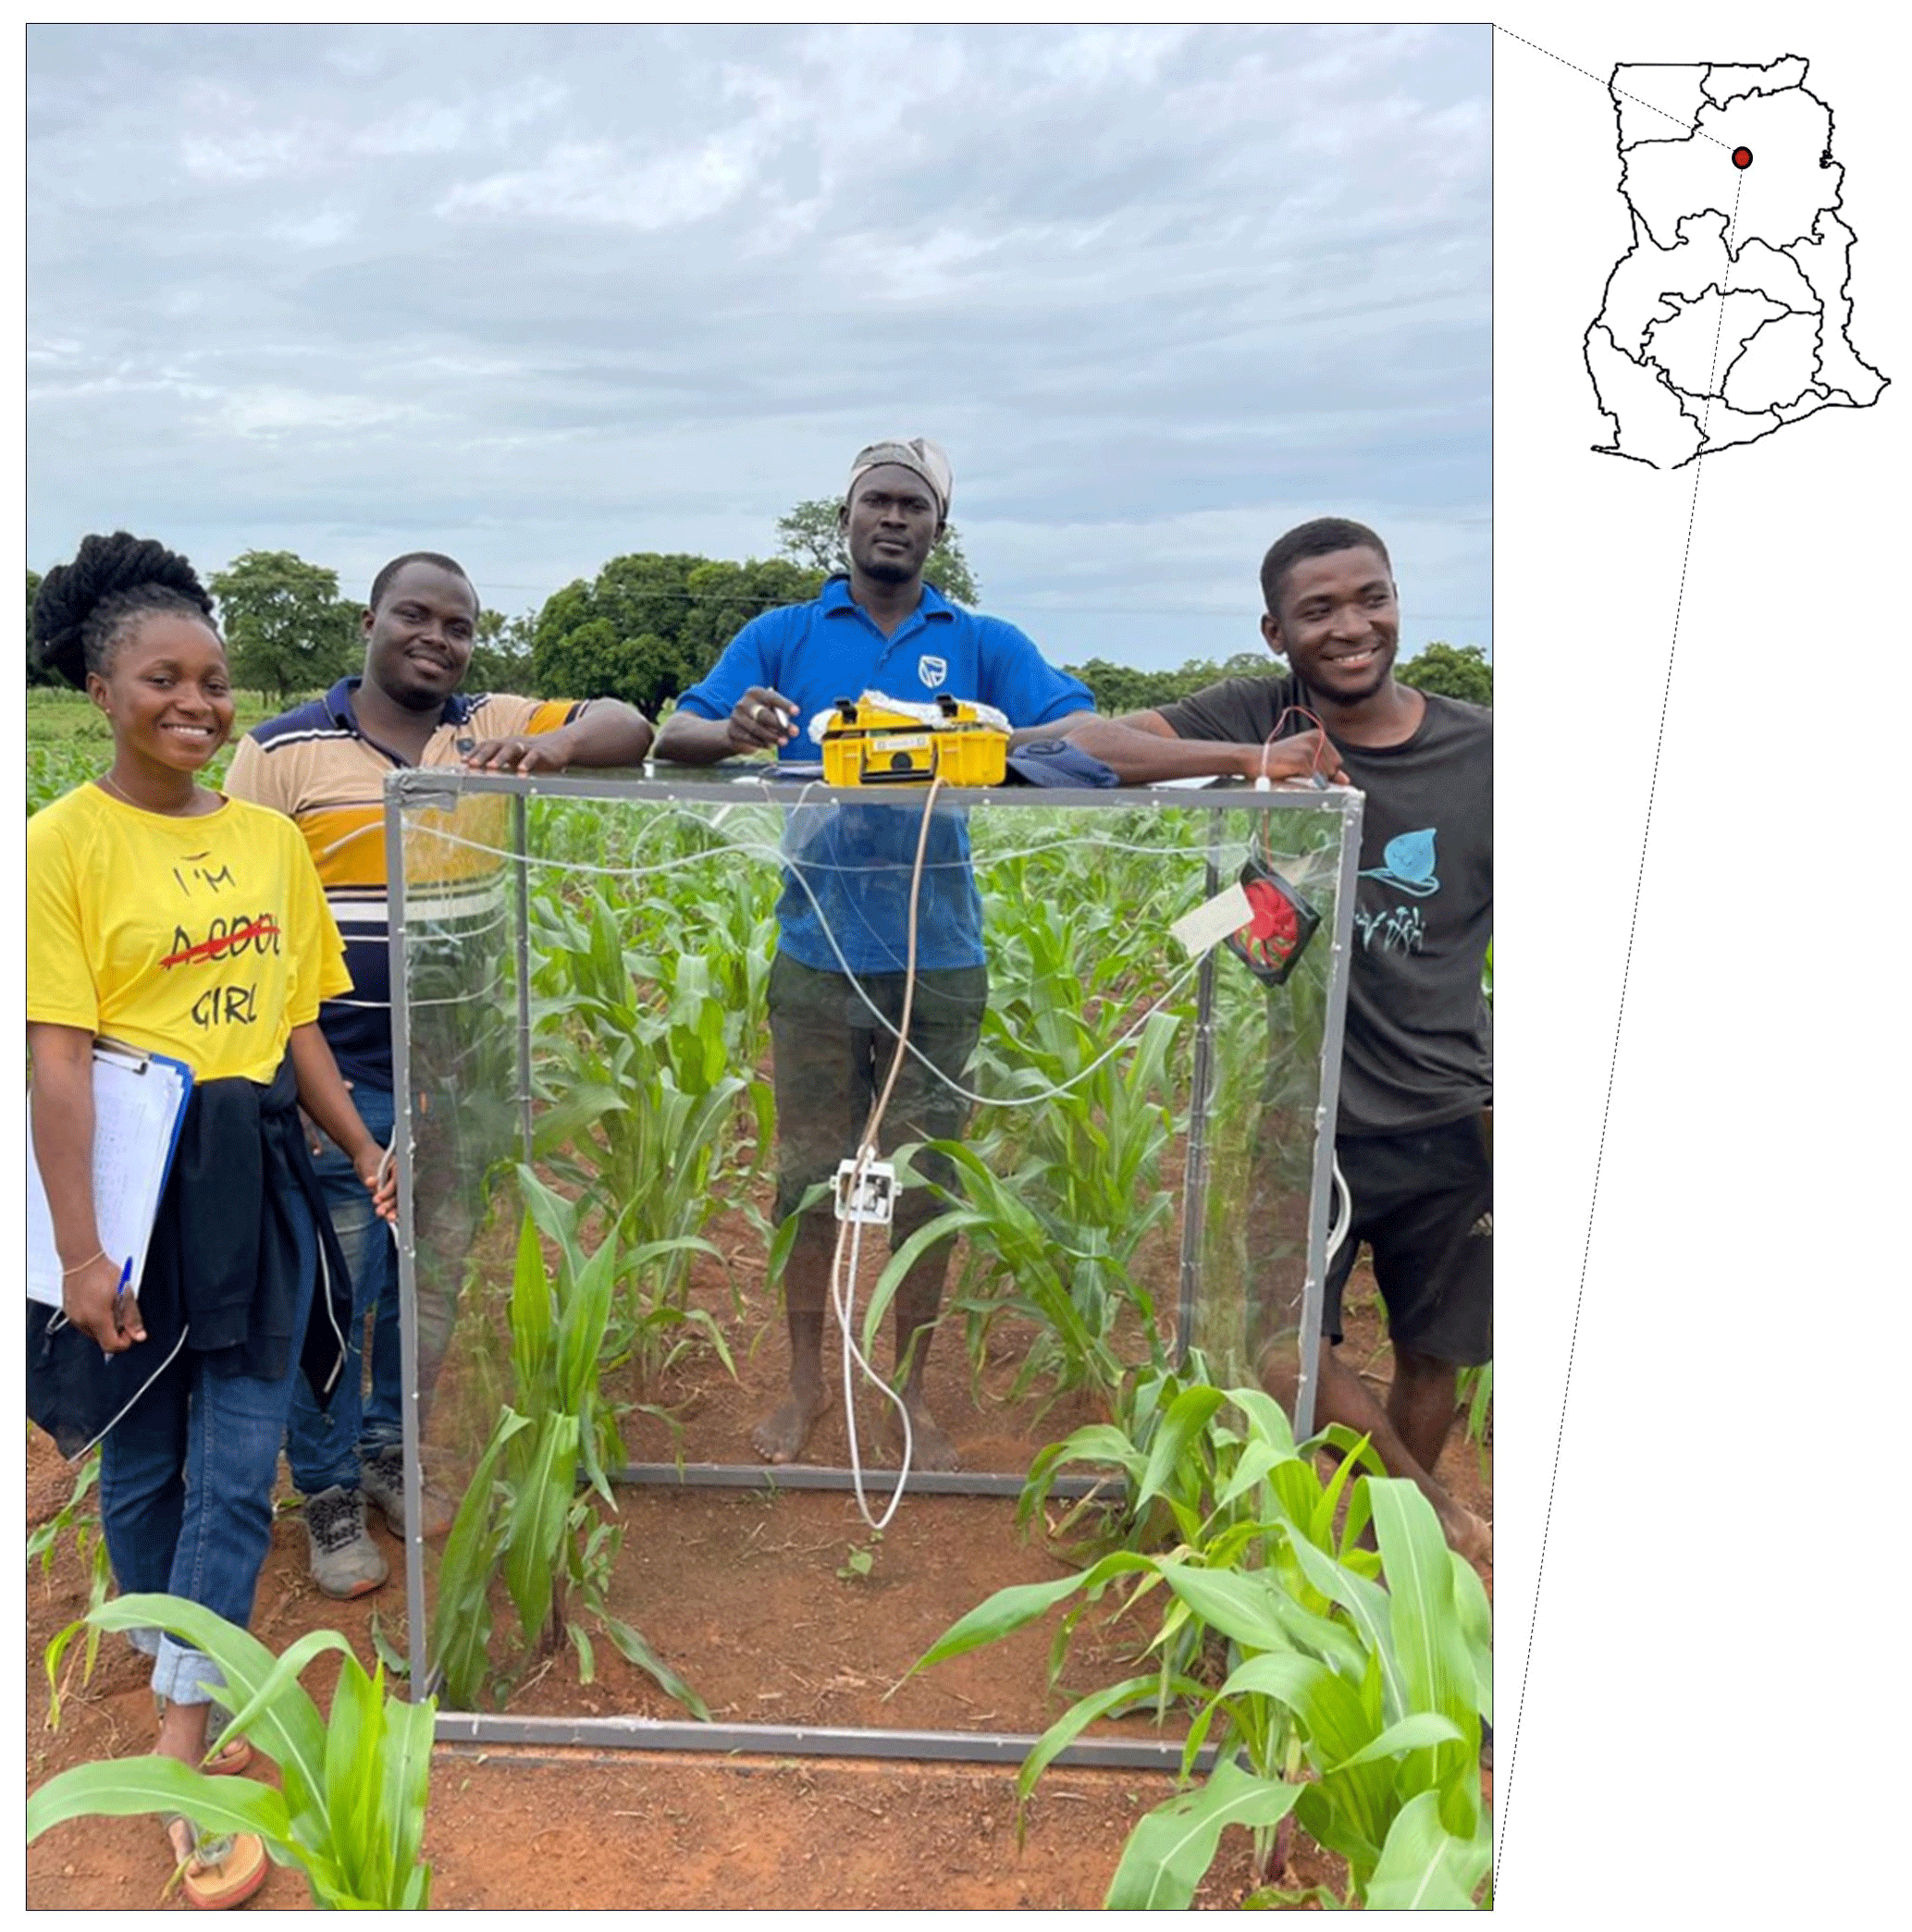
Figure 4Transparent (NEE) manually operated closed-chamber measurement at the CSIR-SARI experimental field, used for field trial application of the developed low-cost CO2 and ET flux measurement device, near the city of Nyankpala, northern Ghana (9°24′15.9′′ N, 01°00′12.1′′ W).
2.5 Data processing
2.5.1 CO2 and ET flux calculation, separation and gap-filling
For laboratory validation, the changes in CO2 concentrations in the vessel, expressed as ΔCO2 in ppm, were calculated as the mixing ratio of measured ambient air and injected technical gas CO2 concentration (10 000 ppm). These were compared with the ΔCO2 obtained for the four different NDIR sensors as the difference in mean CO2 concentrations measured for 1 min right before and 2 min after injection. For the field validation, measured CO2 and ET fluxes were calculated using a modular R script, described in detail by Hoffmann et al. (2015; CO2) and Dahlmann et al. (2023; ET), respectively. Prior to CO2 and ET flux calculation, underlying data were trimmed by removing the first and last 10 % of each chamber measurement dataset. This was conducted to eliminate data noise caused by turbulence and pressure fluctuations due to chamber deployment (Hoffmann et al., 2015) and to mitigate biases arising from the time needed to homogenize chamber headspace air (Vaidya et al., 2021). CO2 concentrations measured using the LI-850 were additionally corrected for changes in water vapor during chamber measurements (Webb et al., 1980; McDermitt et al., 1993). Unlike the LI-850 which provided H2O as mole fraction, used low-cost RH sensors (DHT22 and SHT31) required additional postprocessing. RH measurements were converted into a mass concentration following Hamel et al. (2015; Eq. 1):
where RH is the relative humidity, P is the gas pressure (Pa) and es is the saturated vapor pressure (Pa) that was calculated according to Allen et al. (1998). Thereafter, CO2 and ET fluxes were calculated based on the ideal gas law using a linear regression approach (Eq. 2):
where M denotes the molar mass of the gas (g mol−1), p denotes the ambient air pressure (Pa) and V denotes the chamber volume (m3). Since plants accounted for <0.1 % of the total chamber volume, a static chamber volume was assumed. R denotes the gas constant (8.314 m3 Pa K−1 mol−1), T denotes temperature inside the chamber (K), A denotes the basal area (m−2), and denotes the linear CO2 (e.g., Leiber-Sauheitl et al., 2014) and H2O concentration changes over time (e.g., Dahlmann et al., 2023). The variables T and, more importantly, , were obtained by applying a variable (window size 0.5 to 4 min) moving-window filter to each chamber measurement. Thus, resulting multiple ET and CO2 fluxes per measurement (based on generated variable moving window data subsets) were further evaluated according to the following criteria: (1) fulfilled prerequisites for applying a linear regression (normality (Lilliefors adaption of the Kolmogorov–Smirnov test), homoscedasticity (Breusch–Pagan test) and linearity), (2) regression slope (p≤0.1, t test), (3) range of within-chamber air temperature not larger than ±1.5 K and a PAR deviation (only transparent chamber measurements) not larger than ±20 % of the average to ensure stable environmental conditions within the chamber throughout the respective measurement window, and (4) no outliers present ( IQR, interquartile range). Calculated CO2 and ET fluxes that did not meet all criteria were discarded. In cases where more than one flux per measurement met all criteria, the CO2 and ET fluxes with the steepest slope and closest in time to chamber closure were chosen. For field validation and field trial application, CO2 fluxes were additionally separated into its flux components Reco, GPP and NEE and gap-filled through deriving empirical models. In the case of Reco, a temperature-dependent Arrhenius-type function was used and fitted for air as well as soil temperatures measured at different depths (Lloyd and Taylor, 1994; Eq. 3).
where Rref is the respiration rate at the reference temperature (Tref: 283.15 K), E0 is an activation energy-like parameter, T0 is the starting temperature constant (227.13 K), and T is the mean air or soil temperature during the flux measurement. Out of the four obtained Reco models (one model for air temperature inside the chamber, one for air temperature outside the chamber, and soil temperatures at 2 and 5 cm depths), the model with the lowest Akaike information criterion (AIC) was finally used. In the case of GPP, a PAR-dependent, rectangular hyperbolic light-response function, based on the Michaelis–Menten kinetic, was used (Elsgaard et al., 2012; Hoffmann et al., 2015; Wang et al., 2013; Eq. 4). Since GPP cannot be measured directly, GPP fluxes were calculated as the difference between measured NEE and modeled Reco fluxes, using campaign-specific previously derived parameters Rref and T0.
where GPmax is the maximum rate of C fixation at infinite PAR (µmol CO2 m−2 s−1), α is the light use efficiency (µmol CO2 µmol−1 photons) and PAR is the photon flux density (corrected for chamber light transmission) of the photosynthetically active radiation (µmol−1 photons m−2 s−1). In cases where the rectangular hyperbolic light-response function did not result in significant parameter estimates, a non-rectangular hyperbolic light-response function was used (Gilmanov et al., 2007, 2013). Reco and GPP parameter sets were evaluated and discarded in the case of non-significant parameter estimates. If no fit or a non-significant fit was achieved, averaged flux rates were used for Reco and GPP instead. Reco, GPP and NEE were modeled in half-hourly steps for the entire period based on continuously monitored temperature and PAR. For ET, campaign-wise average daily ET fluxes (for nighttime ET fluxes measured before, for daytime ET fluxes measured after 08:00) were determined and linearly interpolated between campaigns for the entire crop growth period.
2.5.2 NECB and WUE
NECB for the field trial application experiment was calculated as the sum of cumulated NEE, C output such as harvested biomass C and C input due to organic fertilizer application (Eq. 5; Smith et al., 2010).
Several minor NECB components have not been considered, such as, C input from seeding and methane emissions. However, due to their relatively low magnitude (e.g., no methane emissions in mineral soil under aerobic conditions), their influence on the NECB of our study is neglectable. Values for Reco, GPP, NEE, harvested biomass C and NECB are given using the atmospheric sign convention (Ceschia et al., 2010), where positive values indicate C losses from the plant–soil system and negative values indicate C uptake. Thus, NECB refers to the total change in belowground C. WUE was calculated as the agricultural WUE (WUEagro; Eq. 6; Hatfield and Dold, 2019).
where DM denotes harvested dry biomass (in g m−2), and ET is cumulative evapotranspiration (in mm).
2.5.3 Error calculation and statistical analysis
To test for normal distribution of the data obtained from laboratory and field validation measurements, a Kolmogorov–Smirnov test (p<0.05) was performed. In the case of a normal distribution, significant differences between ΔCO2 (in ppm) or Reco, NEE, or ET fluxes measured from low-cost sensors and mixing ratio ΔCO2 or IRGA-based Reco, NEE, and ET fluxes were determined using a one-sample t test (p<0.05). The error calculation for CO2 fluxes, as well as crop season CO2 exchange, was quantified using a comprehensive error prediction algorithm described in detail by Hoffmann et al. (2015). The approach utilizes bootstrapping alongside k-fold subsampling to estimate uncertainties for each flux measurement as well as subsequent Reco and GPP parameterization and final gap-filling. An adaptation of this approach was used to calculate errors in ET fluxes (Dahlmann et al., 2023). Seasonal ET flux errors were then estimated based on 1.96 × SD of daily average ET fluxes.
3.1 CO2 sensor laboratory validation
Differences in accuracy and precision among the four different low-cost tested NDIR sensors are shown in Fig. 5a–d as 1:1 agreement plots between mixing ratio (calculated) and measured ΔCO2. While accuracy can be assessed as deviation from the 1:1 agreement line, precision is determined by the residual standard deviation (SD) and the coefficient of determination (r2) of the linear regression fitted on calculated versus measured ΔCO2. The K30 FR (Fig. 5d) showed the highest accuracy among all tested NDIR sensors, reflecting well the increase in CO2 concentration (ΔCO2) derived through mixing ratio. Correspondingly, no significant difference (one sample t test, p=0.80) was found between calculated and measured ΔCO2. The SCD30 (Fig. 5c), even though fairly accurate at lower values, failed to reflect higher calculated ΔCO2 values and generally tends to overestimate triggered ΔCO2. Neither the MH-Z14 (Fig. 5b) nor the MH-Z19 (Fig. 5a) was sufficiently accurate or able to reflect triggered ΔCO2. While the MH-Z14 showed a rather constant offset from the 1:1 agreement by 28 ppm, the MH-Z19 tended to increasingly overestimate higher ΔCO2 values derived through mixing ratio. Hence, unlike the K30 FR, all other NDIR sensors measured significantly higher ΔCO2 when compared to mixing ratio ΔCO2 (one sample t test, p<0.01). Unlike the accuracy, overall precision and measurement repeatability among all four NDIR sensors was generally high and fairly comparable, showing a residual SD of 2.78, 4.23, 2.52 and 3.58 ppm, respectively. Regarding the response time (defined as mean time from injection to measured initial CO2 concentration increase), all four NDIR sensors differed substantially, with only 44 s for the K30 FR and more than 280 s for the MH-Z14. The same was true for the response strength (defined as the mean time from beginning to end of the injection triggered CO2 concentration increase, which represents its steepness), with 61, 160 and 265 s for the K30 FR, SCD30 and MH-Z19, respectively. In the case of the MH-Z14, response strength could not be evaluated, since no clear saturation after injection-induced CO2 concentration increase could be observed.
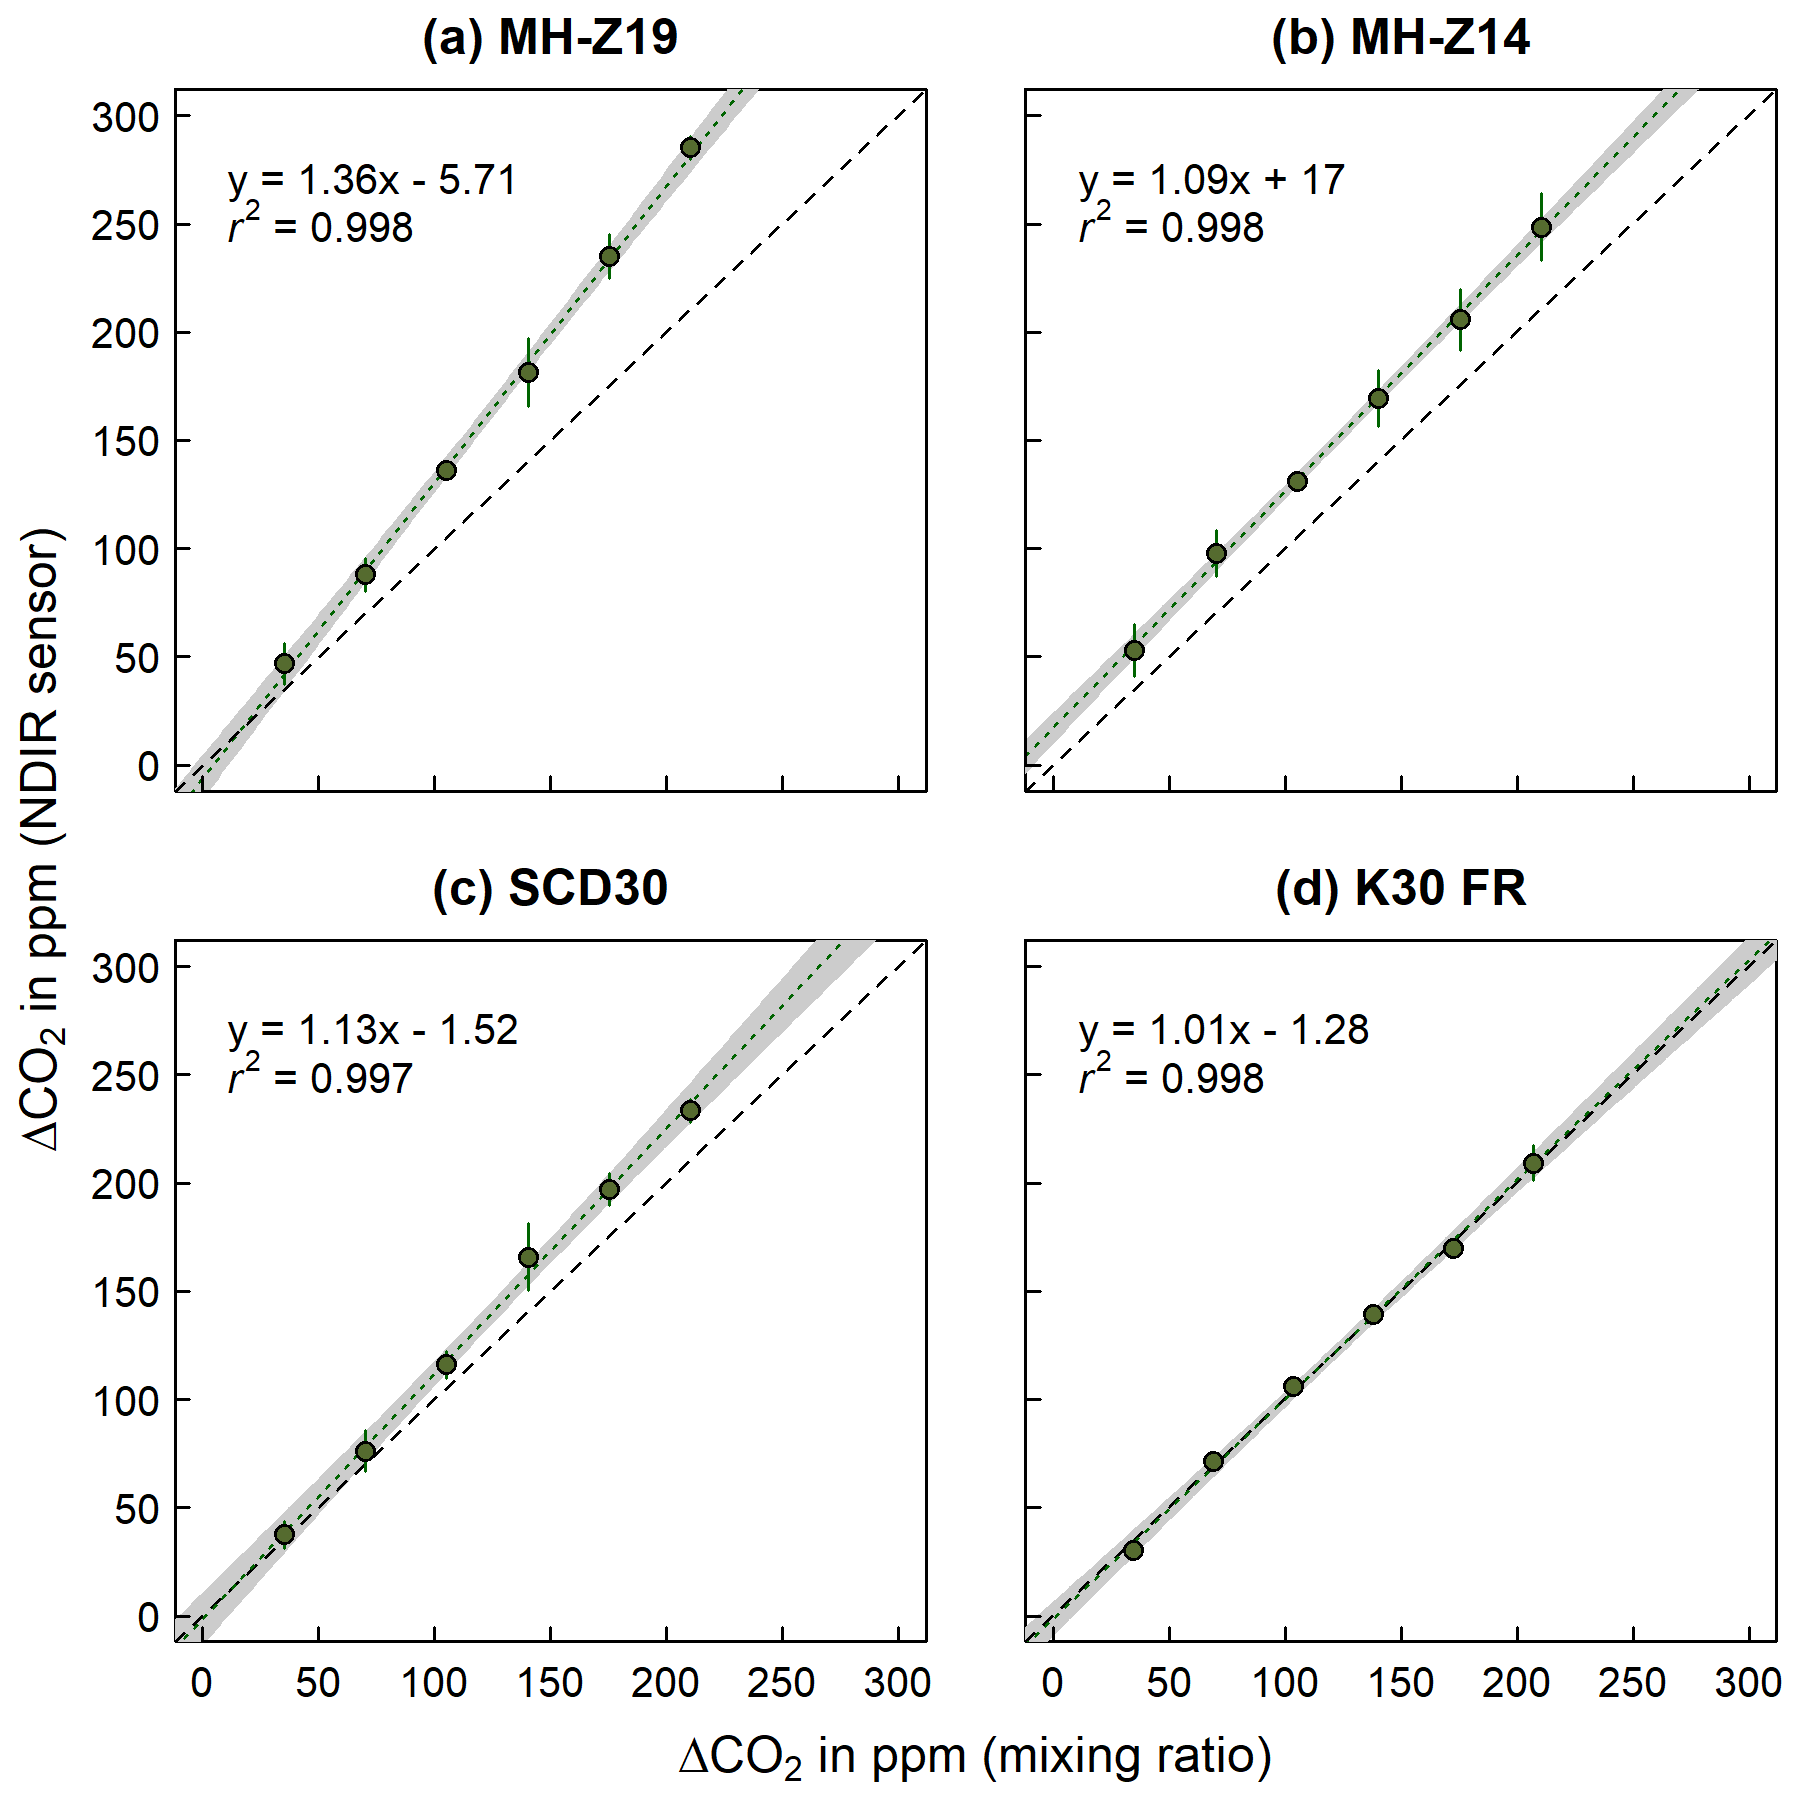
Figure 5The 1:1 agreement between mixing ratio and measured ΔCO2 (in ppm) from the four low-cost sensors (K30 FR, SCD30, MH-Z14 and MH-Z19). The dashed black line indicates the 1:1 agreement. The dotted green line shows the linear regression through the average ΔCO2 for each injection step (n=5), calculated from the repetitive measurements per step. Error bars indicate ±1.96 SD. The grey shaded area represents the respective confidence band of the regression line.
While accuracy and precision are of course highly relevant, response time and response strength in particular play a key role in determining the extent to which the tested NDIR sensors can be used for in situ NFT-NSS closed-chamber measurements. With a response time of almost 2 and 5 min, respectively, as well as low response strength, MH-Z19 and MH-Z14 would likely fail to correctly reflect ΔCO2 during short-time (<4 min) closed-chamber measurements, regardless of their low accuracy, which makes them additionally unsuitable. Therefore, only the K30 FR (and to a much lower extent the SCD30) with its fast response time and high response strength passed laboratory validation and met all necessary requirements for accurate and precise in situ measurements of CO2 exchange. Our findings, comparing accuracy and precision of four different NDIR sensors during the laboratory setup, are in good agreement with previous studies performing laboratory validation of single sensors. Brändle and Kunert (2019), who compared the MH-Z14A NDIR sensor against a GFS-3000 (Heinz Walz GmbH, Germany) during a laboratory validation, observed a similar response time and a general measurement offset of approx. +40 ppm. Based on this and an additionally conducted field validation, Brändle and Kunert (2019) also suggested that the MH-Z14A is not suitable for short-term measurements (<5 min). Also, findings by González Rivero et al. (2023), who tested the ability of the SCD30 to reflect calibration gas concentrations and concluded an acceptable accuracy and response time, are in good agreement with results of the present study. The most widely tested NDIR sensors so far, however, are those of the K series (e.g., Ali et al., 2016; Blackstock et al., 2019; Brown et al., 2020; Mendes et al., 2015). Laboratory validation performed by Blackstock et al. (2019) using a K30 1 % sensor to measure a span of different CO2 concentrations verified that it well reflects CO2 concentrations within the accuracy stated by the manufacturer. Similarly, laboratory tests performed by Mendes et al. (2015) found that the K30 sensor has nearly perfect linear response against calibration gas CO2 concentrations. Lastly, the laboratory experiment by Ali et al. (2016) also highlighted the accuracy of the K30 1 % sensor when compared against measurements of an SBA-5 CO2 gas analyzer (PP Systems, USA). During their experiment, both sensors showed a strong correlation and no offset when K30 1 % sensor self-calibration was used, highlighting the self-calibration capabilities of the K-series sensors that contribute to their stable performance and high measurement repeatability with minimal maintenance compared to other NDIR sensors.
3.2 Field validation
3.2.1 In situ ET flux validation
Two low-cost RH sensors (ET; SHT31 and DHT22) were tested in parallel with NDIR sensors passing the laboratory validation (CO2; K30 FR and SCD30) against LI-850 as reference. To avoid the systematic impact of opaque chambers on plant transpiration via stomatal closure upon darkening, in the case of ET fluxes, only transparent chamber measurements were taken into account (Larcher, 2003). Out of the 20 NEE measurements, 13 valid ET fluxes could be calculated in the case of the LI-850. Compared to that, 18 and 17 valid ET fluxes were obtained for the SHT31 and DHT22, respectively. Differences in accuracy and precision for ET fluxes calculated based on RH measurements (Fig. 6c–d) compared to ET fluxes calculated based on LI-850 are shown as 1:1 agreement plots in Fig. 6. No significant difference (mean diff. −0.01 mm d−1; one sample t test, p=0.89) was found between ET fluxes calculated from H2O concentration and RH measurements, using the LI-850 and SHT31, respectively (Fig. 6c). Together with an r2 of 0.72, this indicates a reasonable accuracy of SHT31-derived ET flux estimates. Compared to that, ET fluxes, determined through RH measurements using the DHT22 (Fig. 6d), were significantly smaller (mean diff. 0.28 mm d−1; one sample t test, p<0.05) than LI-850-based ET fluxes and with an r2 of 0.64, i.e., less accurate. This is consistent with sensor accuracy for measuring relative humidity specified by their corresponding manufacturers, which are ±2 % accuracy for SHT31 and ± 2 %–5 % accuracy for DHT22. Since these low-cost sensors were only capable of measuring at this level of accuracy, a higher uncertainty at lower RH concentrations and consequently derived ET fluxes might occur, even though not directly detected within this study. The overall precision of SHT31- and DHT22-derived ET fluxes were fairly similar but with a residual SD of 0.36 and 0.39 mm d−1, i.e., rather high.
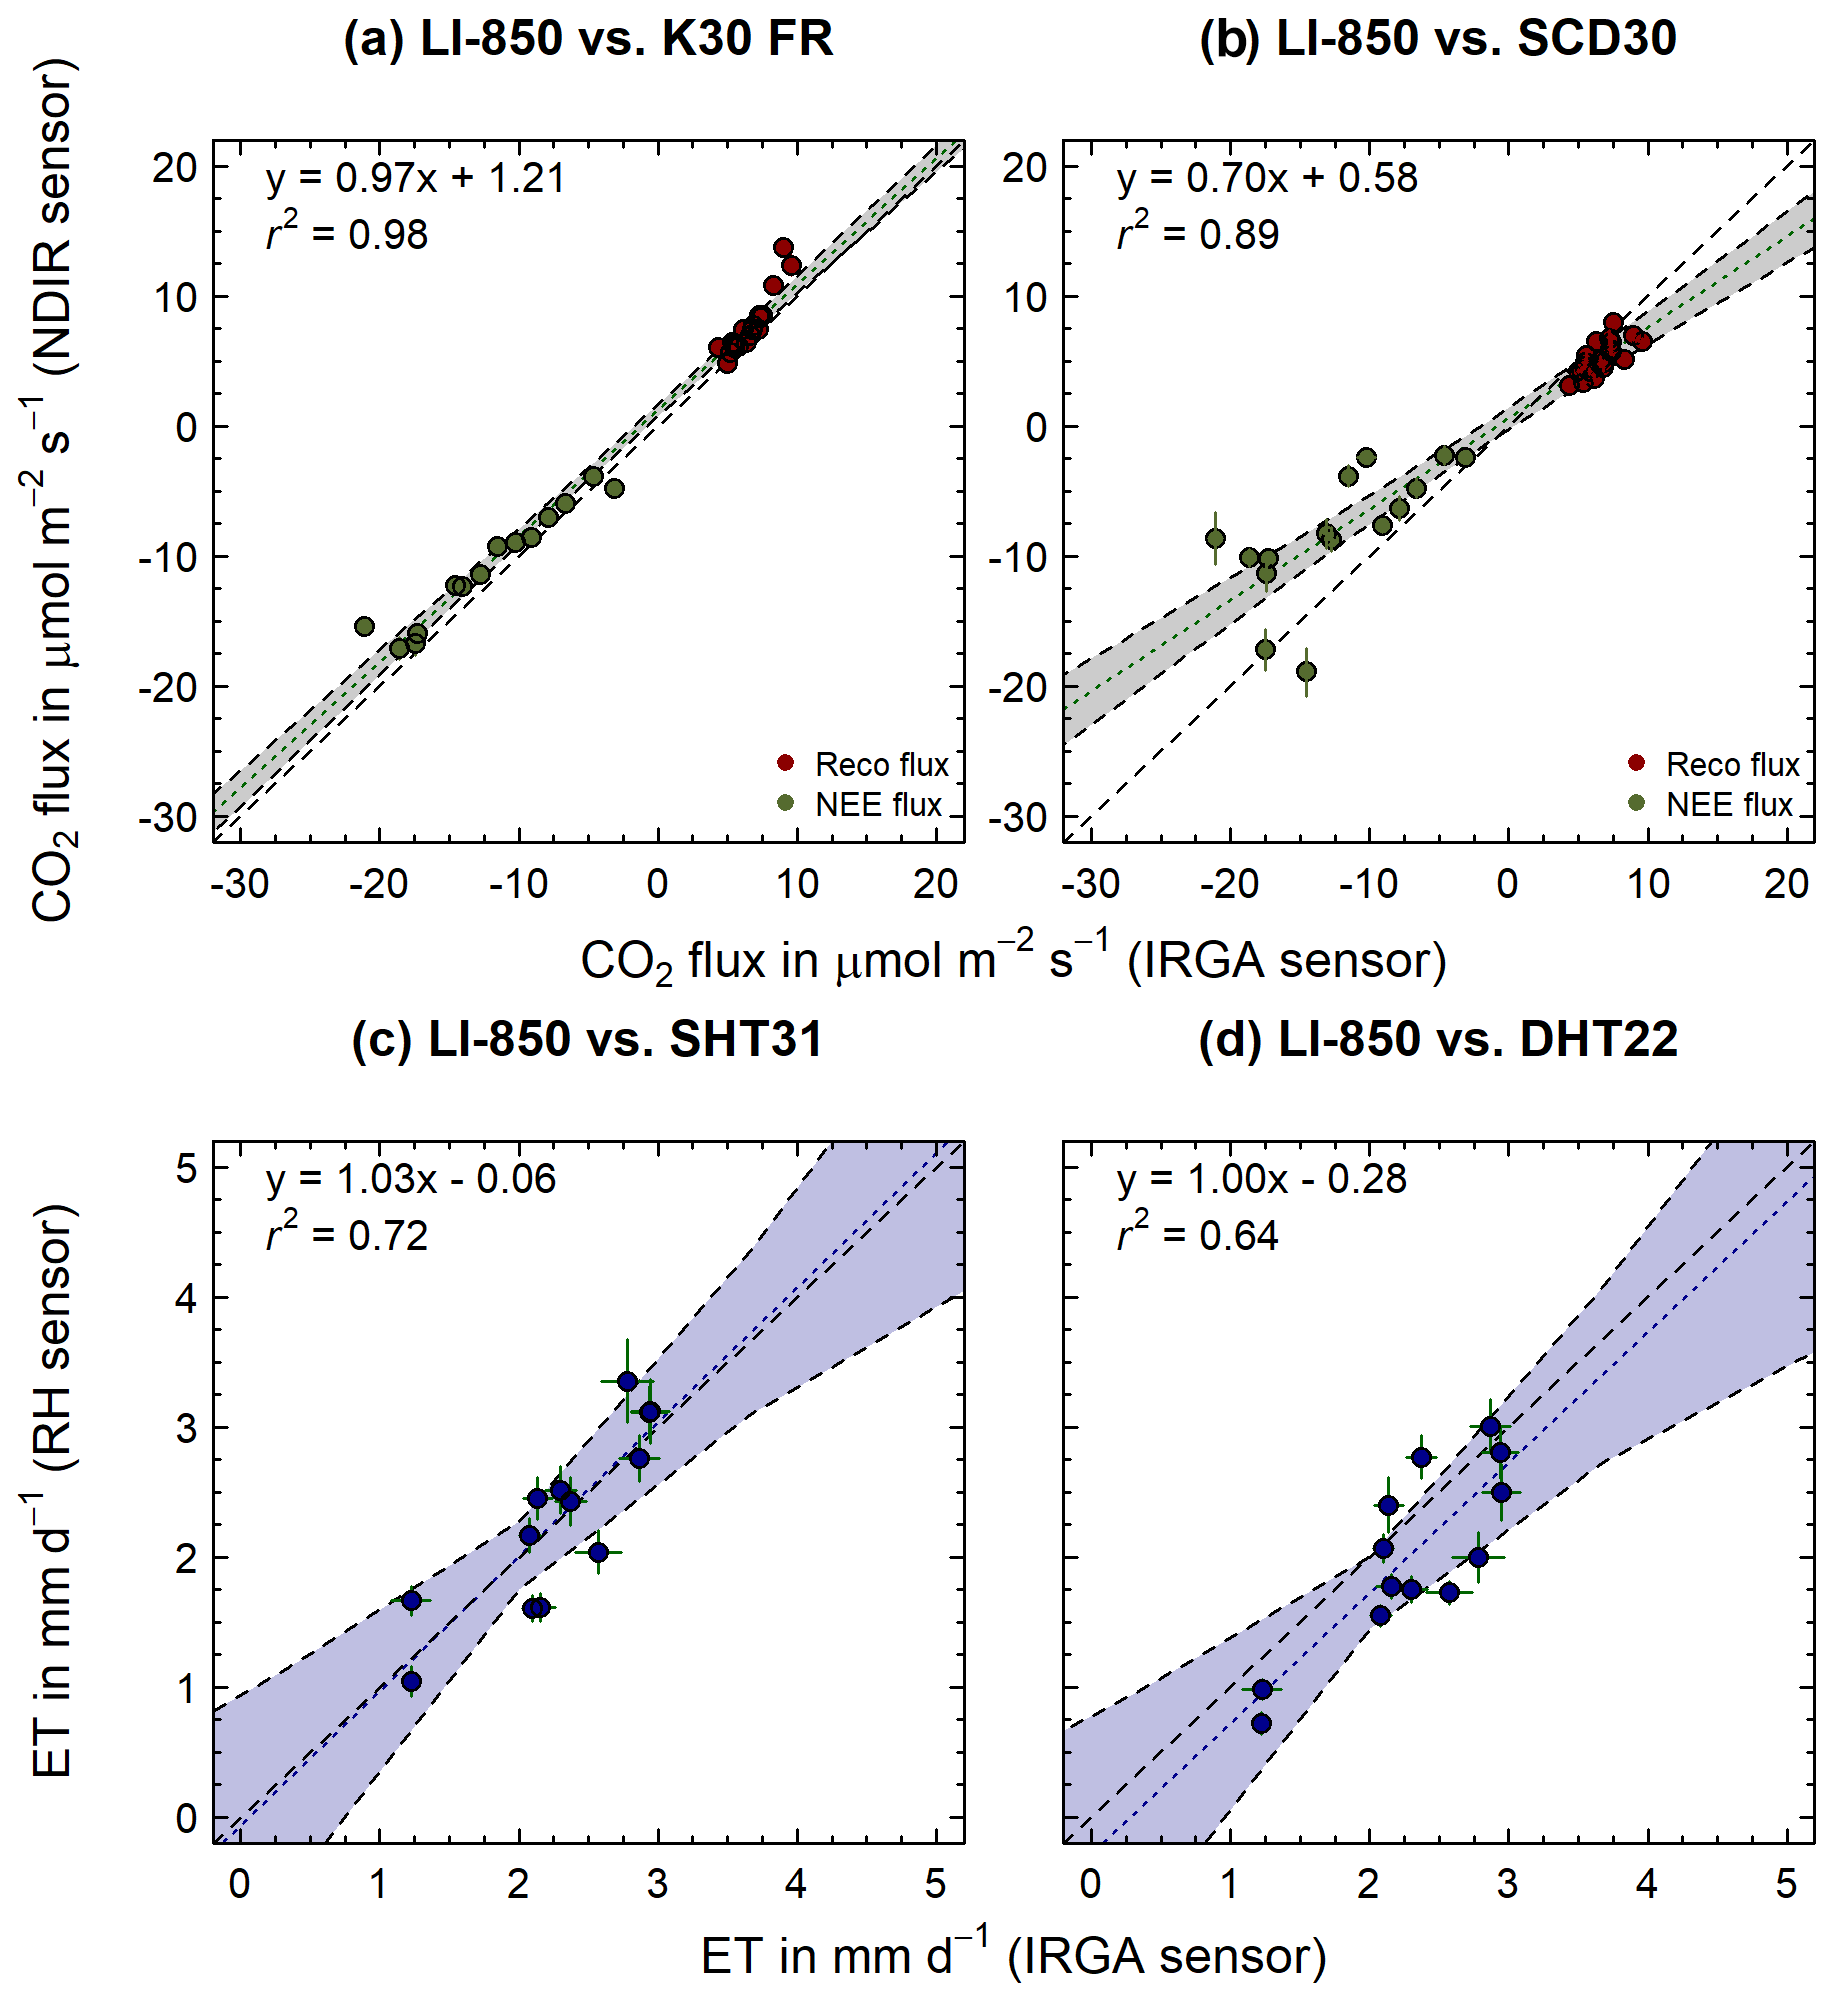
Figure 6The 1:1 agreement between (a–b) CO2 (Reco: dark red points; NEE: dark green points) and (c–d) ET fluxes measured with infrared gas analyzer (IRGA; LI-850, LI-COR, USA) and low-cost NDIR sensors (K30 FR and SCD30), as well as low-cost RH sensors (SHT 31 and DHT22), respectively. The dashed black line indicates the 1:1 agreement. The dotted green/blue line shows the linear regression through the measured CO2/ET fluxes. The grey/blue shaded area represents the respective confidence band of the regression line. Error bars indicate calculated flux error (CI: 95 %; p<0.05).
3.2.2 In situ CO2 flux validation
A total of 41 closed-chamber measurements (Reco: 21; NEE: 20) have been conducted during the 2 consecutive days of field validation, using the LI-850 as reference for both NDIR sensors passing the laboratory validation (CO2; K30 FR and SCD30). While 41 valid CO2 fluxes (Reco: 21; NEE: 20) could be calculated for the LI-850 sensor, 35 (Reco: 21; NEE: 14) and 36 (Reco: 21; NEE: 15) valid fluxes were obtained for the K30 FR and SCD30 sensors, respectively. Differences in accuracy and precision for CO2 fluxes calculated based on NDIR (Fig. 6a–b) compared to CO2 and ET fluxes calculated based on LI-850 are shown as 1:1 agreement plots in Fig. 6. While the comparison between Reco and NEE fluxes calculated from LI-850 and K30 FR measurements (Fig. 6a) was in accordance with the laboratory validation and showed again the overall accuracy and precision of this NDIR sensor, a small positive offset was found. Hence, CO2 fluxes for the K30 FR were significantly higher (Reco mean diff. 1.12 ; one sample t test, p<0.05) and less negative (NEE mean diff. 1.41 ; one sample t test, p<0.05) when compared to LI-850. No such systematic offset was found in the case of the SCD30 (Fig. 6b), which showed significantly lower Reco (mean diff. −1.33 ; one sample t test, p<0.05) and much less negative NEE fluxes (mean diff. −4.18 ; one sample t test, p<0.05) compared to LI-850. Since both NDIR sensors did not show a similar offset and an overestimation was not found for the K30 FR during the laboratory validation already, it can be assumed that the detected offset in the case of the K30 FR is neither a direct result of microclimatic effects (e.g., increasing humidity) nor incorrect sensor readings. Instead, inter alia differences within the chamber headspace and the position of the NDIR sensor right below the chamber top, approx. 10 cm above the LI-850 inlet and outlet, might help to explain it. Nonetheless, the K30 FR NDIR sensor still exhibited higher accuracy than the SCD30 sensor when validated against LI-850 flux measurements. The root mean squared error (RMSE), mean squared error (MSE) and mean absolute error (MAE) obtained from the K30 FR (RMSE: 1.77 , MSE: 3.16 , MAE: 1.34 ) were lower in comparison to the SCD30 (RMSE: 3.97 , MSE: 15.77 , MAE: 2.80 ). Compared to the K30 FR, the NEE fluxes obtained by the SCD30 were also especially characterized by a very low precision. The reason for this is certainly the lower CO2 concentrations (<400 ppm) in the NEE measurements, which are clearly outside the measurement range specified by the manufacturer (400 to 10 000 ppm). This also explains the decreasing precision with increased negative NEE fluxes obtained by SCD30, since these are likely related to CO2 concentration measurements well below 400 ppm. The general underestimation of Reco and NEE fluxes derived from SCD30, however, is probably a result of its rather long response time and lower response strength when compared to the K30 FR (see Sect. 3.1).
3.2.3 Temperature and PAR dependency of measured CO2 fluxes
Figure 7 shows temperature-dependent Reco (Fig. 7a–b) and PAR-dependent GPP (Fig. 7c–d) parameter estimates for flux measurements performed with the LI-850 compared to K30 FR (Fig. 7a, c) and SCD30 (Fig. 7b, d), respectively. Since the Reco and GPP parameters are based on the fluxes presented in Fig. 6, similar differences between LI-850, K30 FR and SCD30 could be obtained. With an Rref and E0 of 4.60 and 212.71, respectively, the K30 FR had similar but slightly higher Reco parameters (Fig. 7a) when compared to the LI-850 (Rref: 4.14; E0: 195.01). This indicates not only in general higher Reco fluxes but, more importantly, also a stronger increase of Reco fluxes with rising temperature. In the case of the SCD30 (Rref: 2.54; E0: 270.07), differences in Reco parameters were, however, much more pronounced. The same tends to be true for obtained GPP parameters, which were highly comparable for LI-850 (α: −0.048; GPmax: −39.83) and K30 FR (α: −0.042; GPmax: −38.42) but distinctly different for SCD30 (α: −0.029; GPmax: −31.83). As a result, the fitted K30 FR PAR dependency function was fully within the confidence band of the LI-850 PAR dependency function. In summary, the K30 FR well represented Reco and GPP fluxes measured with the LI-850 and thereon based parameter estimates for Reco and GPP. Unlike the K30 FR, the SCD30 was only able to reflect LI-850 Reco and GPP fluxes measured within the manufacturer-specified concentration range. Correspondingly, accurate parameter estimates, especially with GPP, were not obtained. Our findings are further supported by studies that compared the accuracy of K-series sensors against commercial sensor counterparts and its accuracy for field CO2 flux measurements (Curcoll et al., 2022). They integrated a K30 STA sensor into NFT-NSS chamber measurements and were able to accurately measure CO2 fluxes for a grassland ecosystem. Adding to that, the average CO2 flux obtained during our study using a K30 FR (0.4 ) falls within the range of reported daily average NEE values (4 to −6 ) in the study by Emmel et al. (2018) for a field site in Switzerland which was also covered with Phacelia cover crop. Based on the performed field validation, the developed low-cost measurement device equipped with the K30 FR and SHT31 is likely to accurately measure CO2 and ET fluxes in situ, using NFT-NSS closed chambers.
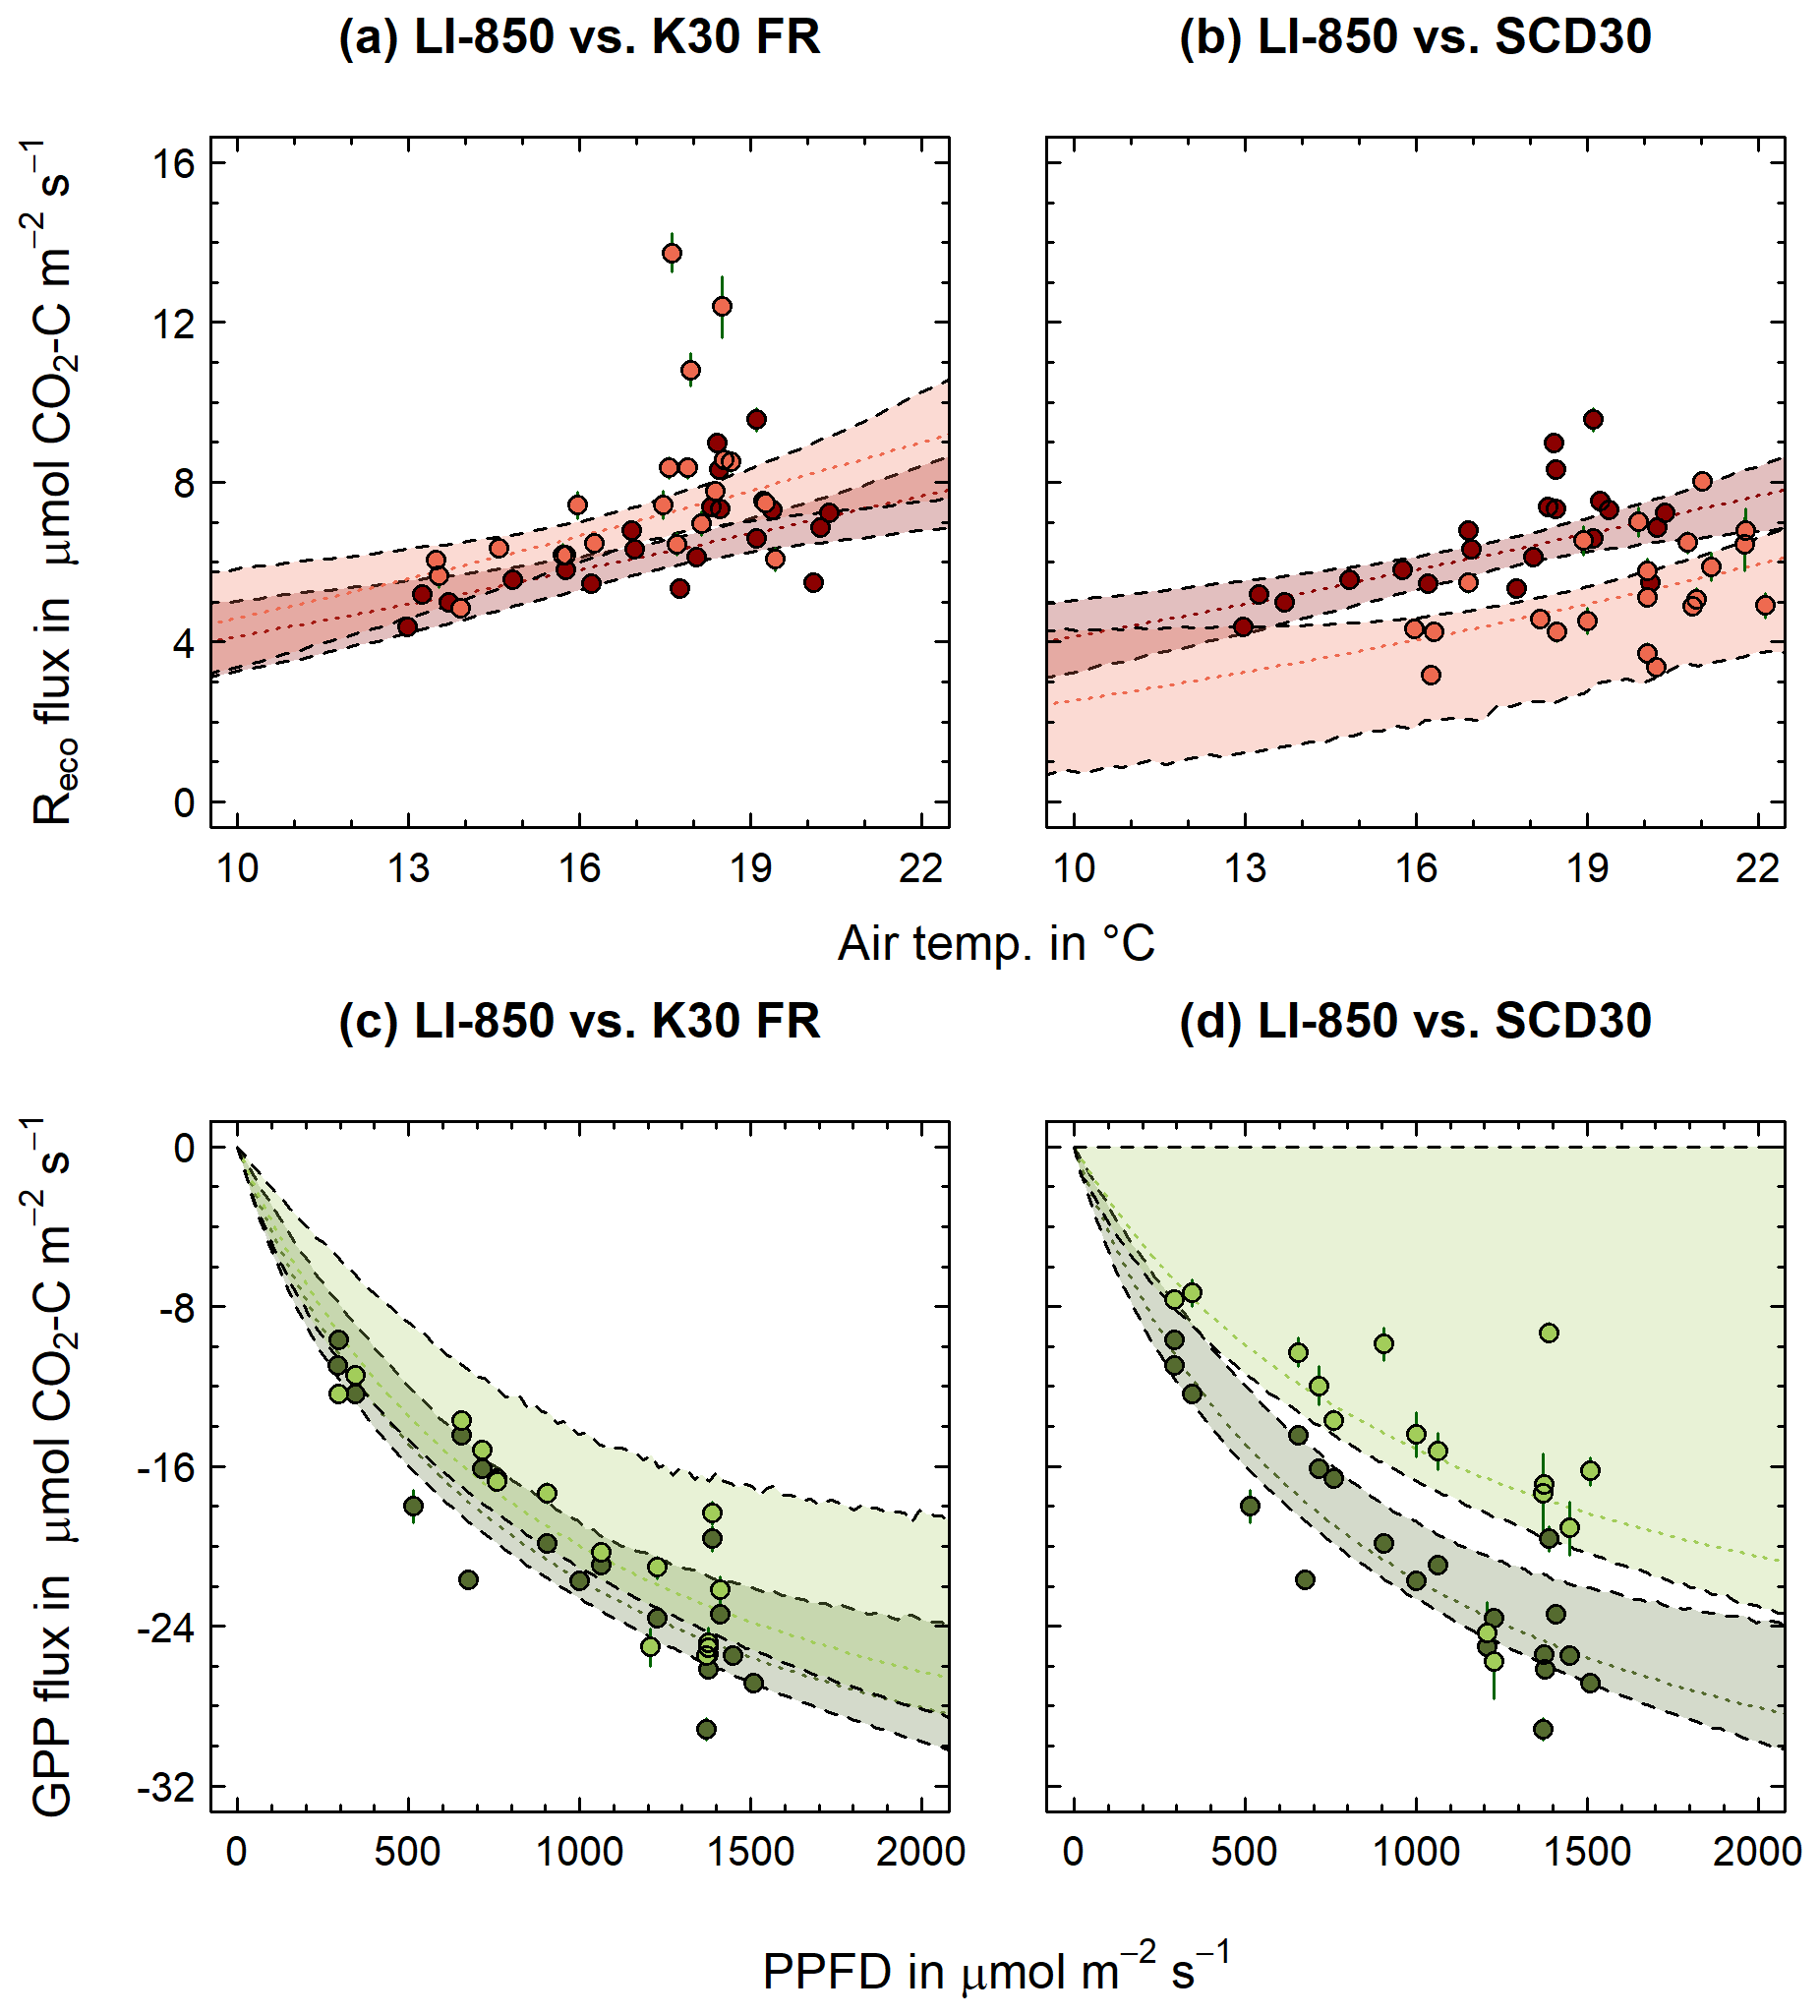
Figure 7Comparison of Reco temperature dependency (dotted red lines) and GPP PAR dependency functions (dotted green lines) between LI-850 (dark red/green) and K30 FR and SCD30 (light red/green), respectively. Shaded red/green areas indicate confidence band around functions. Dots represent measured Reco and derived GPP fluxes. Error bars indicate calculated flux error (95% CI; p<0.05).
3.3 Field trial application
During the measurement period, half-hourly air temperatures at the field site near Nyankpala, northern Ghana, reached as high as 46 °C, with daily average air temperatures ranging from 24 to 32 °C. Daily rainfall varied strongly between the rainy and dry season, with single heavy rain events of up to 115 mm d−1. Consequently, average monthly air humidity was highest (65 % to 85 %) during the rainy season and as low as 23 % during the dry season. Irrespective of these harsh environmental conditions, the reliability of the developed low-cost measurement device could be proven during the field trial application. Periodically performed diurnal CO2 measurement campaigns resulted in consistent Reco and NEE fluxes, showing throughout the entire crop growth a clear light (PAR) dependency for derived GPP fluxes (data not shown). The maximum daily Reco (3.9 g C m−2 d−1) and GPP (−6.9 g C m−2 d−1) fluxes derived for the non-mineral-fertilized treatments were well within the range (4.0 and −7.0 g C m−2 d−1) of eddy covariance (EC) derived maximum daily Reco and GPP fluxes reported by Quansah et al. (2015), who measured a mixed fallow and cropping system in northern Ghana, dominated by tall grasses. When adjusted for observation length, cumulative NEE, GPP and Reco values obtained during the same study (27, −195 and 222 g C m−2) were found to be consistent with the average cumulative NEE, GPP and Reco values obtained from the non-mineral-fertilized treatments during our field trial application experiment (−58 ± 8, −355 ± 1 and 297 ± 7 g C m−2). Also, EC measurements of an unfertilized cropland system (including maize) in Cameroon resulted with 218.5 g C m−2 in a comparable cumulative Reco (Verchot et al., 2020). Regarding ET, the highest cumulative ET of our study (FM + MIN; 229 ± 23 mm) was similar to the measured ET flux (238 mm) of a field site in northern Benin, which was dominated by C4 plants (Mamadou et al., 2016). In general, obtained cumulative ET values (Fig. 8d) for all four treatments were furthermore in good agreement with ET obtained for northern Ghana from average monthly actual evapotranspiration (FAO, 2019), corrected using phenology-specific crop factors for grain maize (263 mm; Brouwer and Heibloem, 1986). Cumulative Reco and GPP fluxes recorded for the four different treatments reflected well the difference in harvested biomass (529 ± 59 g C m−2 for FT + MIN and 534 ± 143 g C m−2 for FM + MIN), with higher cumulative Reco and GPP for higher crop biomass (Fig. 8a–b). Consequently, also NEE and thereon based NECB was higher for additionally mineral-fertilized treatments compared to non-mineral-fertilized treatments, with differences between additionally mineral and non-mineral-fertilized treatments being more pronounced for FM when compared to FT (Fig. 8c and e). Similar tendencies were found for ET and thereon based WUE, with additionally mineral-fertilized treatments showing a higher ET and WUE compared to non-mineral-fertilized treatments (Fig. 8d and f). This is in alignment with results reported by Mo et al. (2017) for maize in Kenya, where WUE increased with higher grain yield due to increasing mineral N fertilization. Besides the reliability of the developed low-cost measurement system, also its practicability was proved during the field trial application. Despite of the rather demanding environmental conditions, the system showed that it is uncomplicated and easy to operate even for untrained staff. After a short training session, even non-technical trained staff can conduct minor repairs of the system directly in the field. However, the missing user interface currently still prevents direct input of information, such as names of measurement location and soil temperatures, which made data postprocessing more tedious.
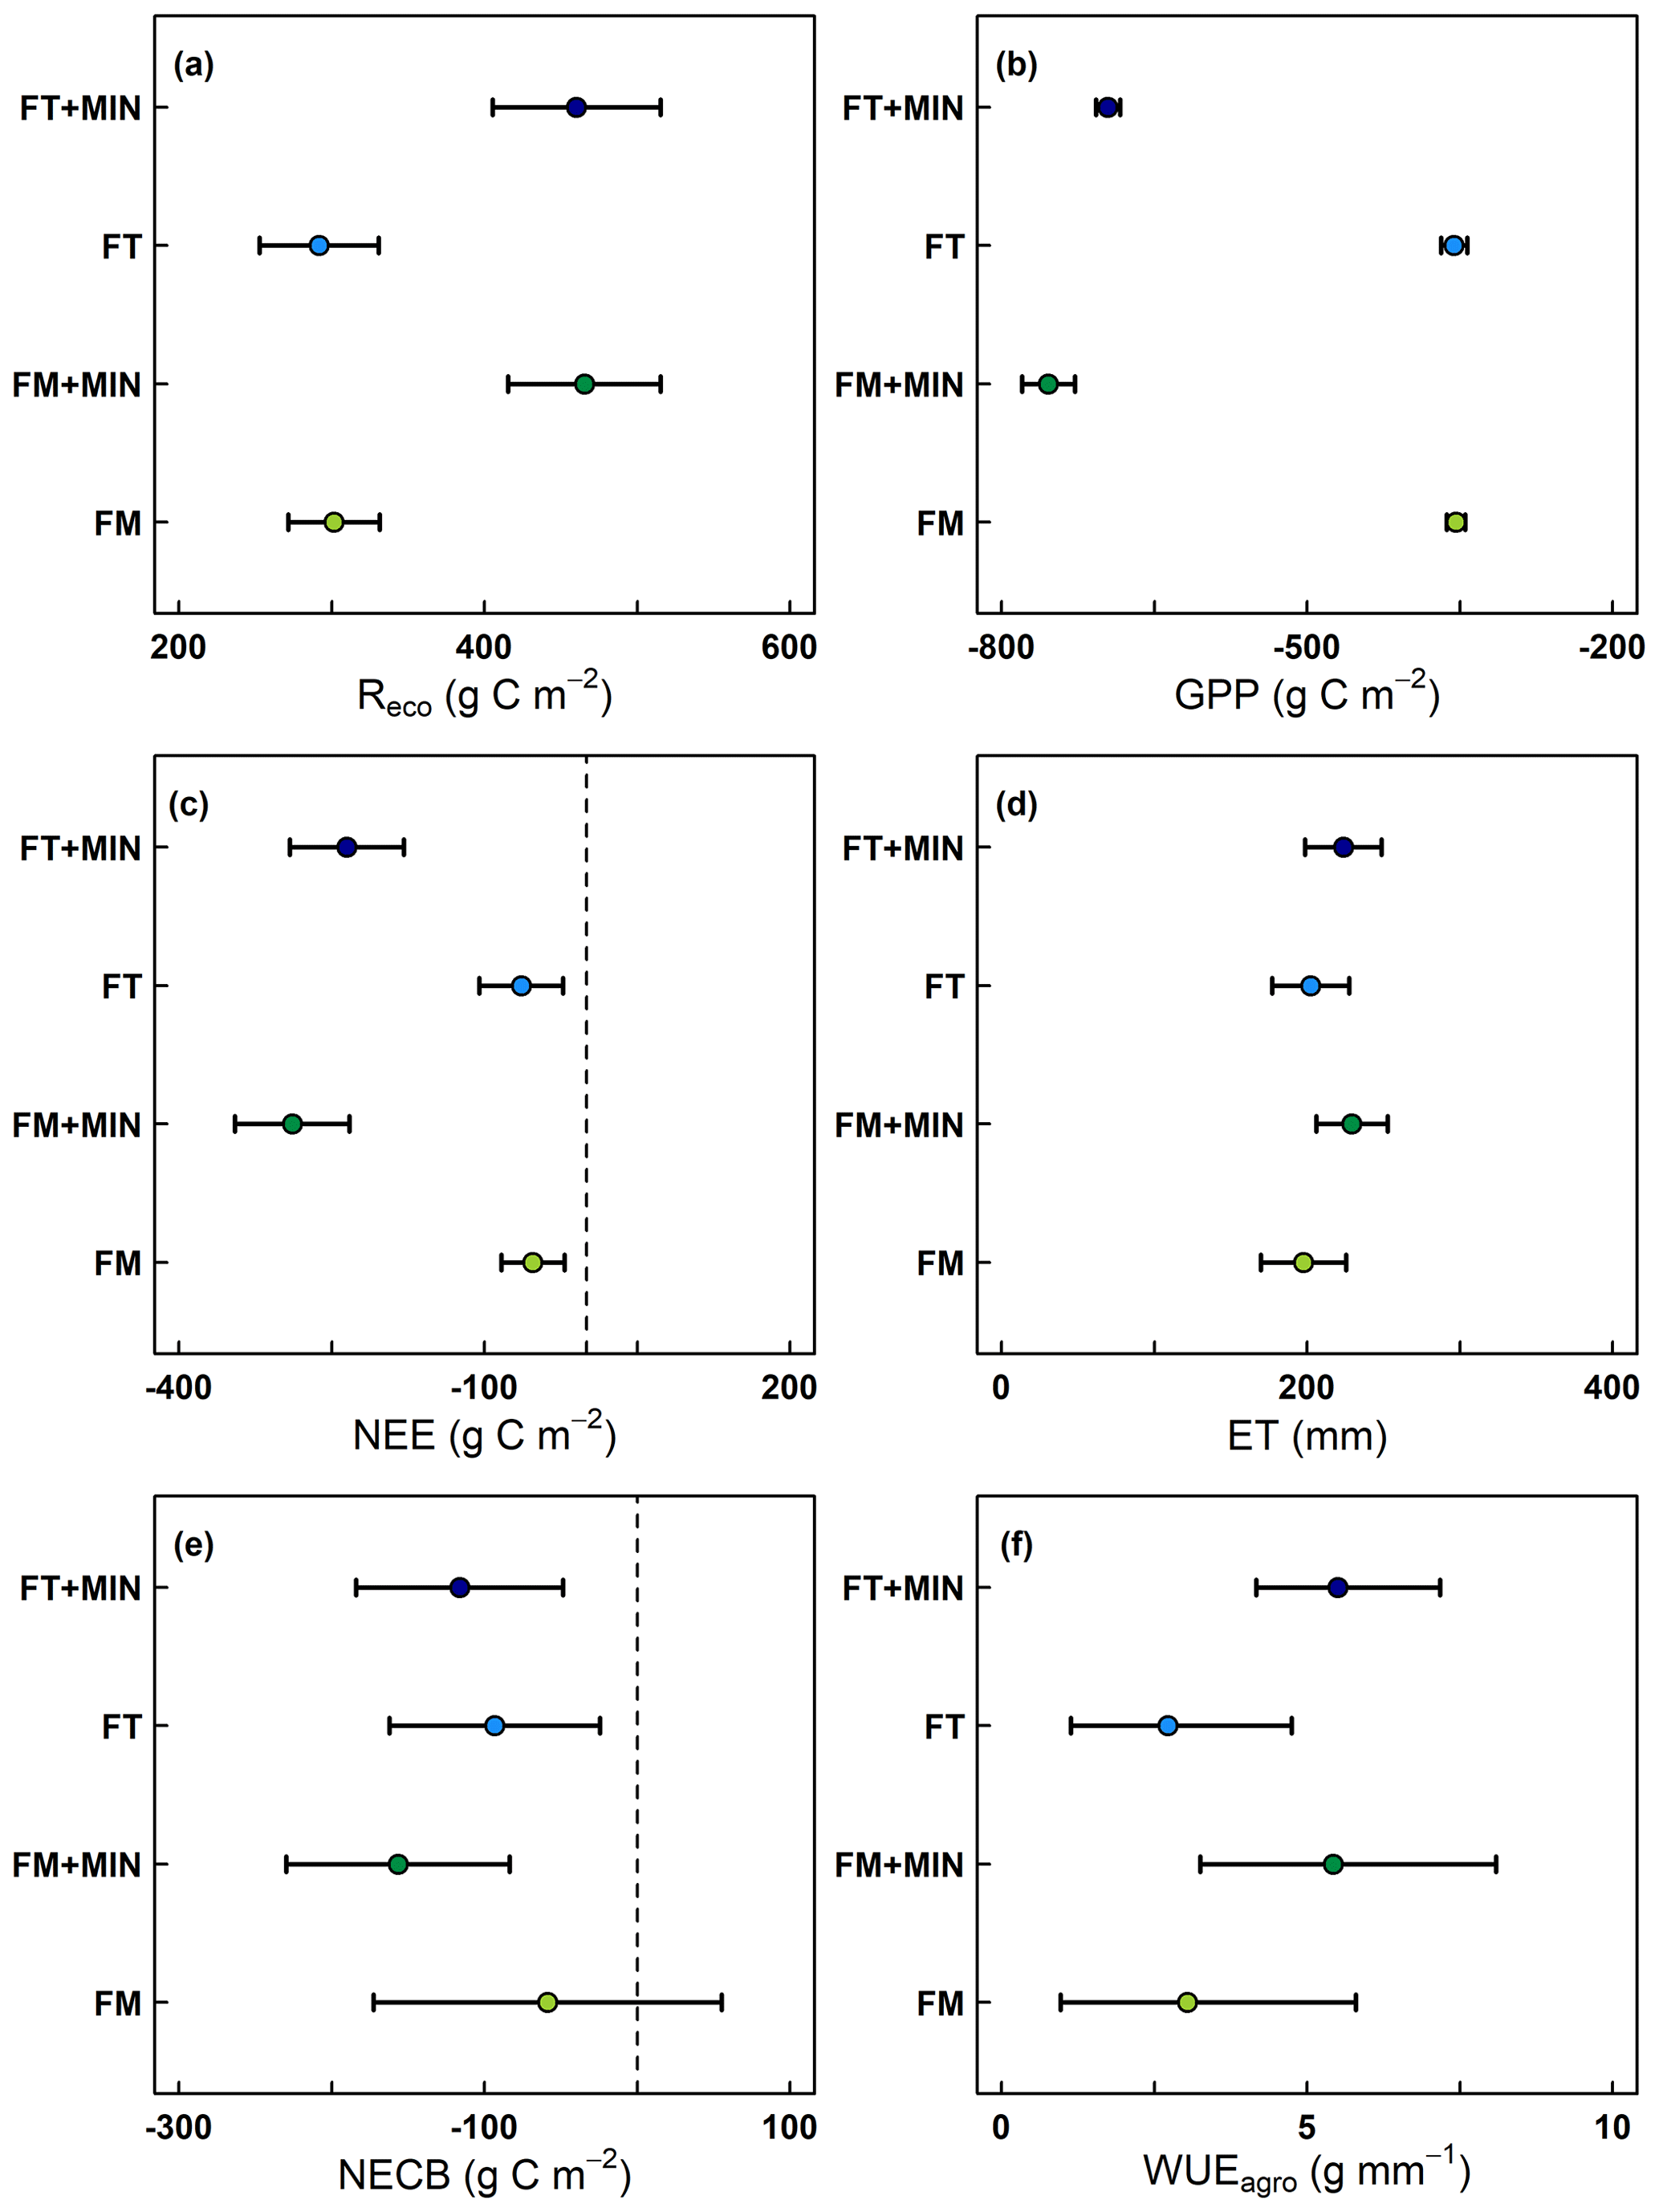
Figure 8Cumulative (a–d) Reco, GPP, NEE (g C m−2) and ET fluxes (mm) as well as thereon based estimates of (e–f) NECB (g C m−2) and WUE (g mm−1) for the four different fertilizer treatments, namely, (1) Fertisoil (5 t ha−1; commercial organic fertilizer in northern Ghana; denoted FT), (2) farmyard manure (5 t ha−1; denoted FM), (3) Fertisoil + NPK (5 t ha−1 + 90–60–60 kg ha−1; denoted FT + MIN) and (4) farmyard manure + NPK (5 t ha−1 + 90–60–60 kg ha−1; denoted FM + MIN). Error bars indicate calculated flux error (90% CI; p<0.1).
Performed experiments showed that CO2 and ET fluxes can be measured reliably and in a stable manner over time using inexpensive NDIR and RH sensors in conjunction with a closed-chamber system. Out of the various low-cost CO2 and RH sensors that were validated, the K30 FR and SHT31 proved to be the most accurate in measuring CO2 and ET fluxes, respectively. Additionally, the developed low-cost measurement device was shown to be both practical and applicable to use even in environmentally challenging agroecosystems, as demonstrated by the field trial application in northern Ghana, sub-Saharan Africa. There within, seasonal CO2 and ET fluxes turned out to be reliable and could be used to obtain valid NECB and WUE estimates. Since the developed system is battery-powered (solar rechargeable), based on open-source technology and all its components are low-cost, it can become easily accessible to a broad range of researchers. Its low weight and low power consumption, with the 12 rechargeable Ni–MH batteries lasting for as long as 8 h, make the system especially suitable for in situ closed-chamber measurements in remote tropical areas. Compared to Li-ion batteries, the rechargeable Ni–MH batteries are furthermore relatively safe to use at high temperatures. This opens many potential applications, especially in the Global South, regarding the evaluation and identification of various land use systems and management practices, in terms of their C sequestration potential, water consumption and WUE. Therefore, the developed measurement device can be a valuable tool in evaluating and assessing global carbon and water flux models, ultimately expanding the network for C budget and evapotranspiration research that are both critical for climate crisis adaptation and mitigation.
The data and code referred to in this study are publicly accessible at https://doi.org/10.4228/zalf-hdqh-br42 (Macagga et al., 2024).
MH and RM conceptualized and developed the system and code. RM, DA and GS carried out the laboratory and field validation experiments. MA conducted the field trial application. RM, MH and MD wrote and prepared the manuscript with contributions by all co-authors. All authors have reviewed and agreed to the final version of the paper.
The contact author has declared that none of the authors has any competing interests.
Publisher’s note: Copernicus Publications remains neutral with regard to jurisdictional claims made in the text, published maps, institutional affiliations, or any other geographical representation in this paper. While Copernicus Publications makes every effort to include appropriate place names, the final responsibility lies with the authors.
Michael Asante and Geoffroy Sossa were supported by the West African Science Service Center on Climate Change and Adapted Land Use (WASCAL) and the Prince Albert II of Monaco Foundation. The maintenance of the PatchCrop infrastructure is supported by the Leibniz Centre for Agricultural Landscape Research (ZALF). We would also like to extend our deepest gratitude to Matthias Lueck and Shukrona Giyasidinova for assisting during the laboratory validation experiment, as well as Shrijana Vaidya and Isabel Zentgraf for helping during the field validation experiment. Special thanks goes to Ayertey Aquinas Kofi, Mavis Nartey, Narkey Kofi Mark and Abdul-Fataw Alhassan, who helped during the field trial application.
This research has been supported by the German Federal Ministry of Food and Agriculture (BMEL) (grant no. 2819DOKA06).
The publication of this article was funded by the Open Access Fund of the Leibniz Association.
This paper was edited by Reem Hannun and reviewed by two anonymous referees.
Ali, A. S., Zanzinger, Z., Debose, D., and Stephens, B.: Open Source Building Science Sensors (OSBSS): A low-cost Arduino-based platform for long-term indoor environmental data collection, Build. Environ., 100, 114–126, https://doi.org/10.1016/j.buildenv.2016.02.010, 2016.
Allen, R. G., Pereira, L. S., Raes, D., and Smith, M.: Crop evapotranspiration – guidelines for computing crop water requirements, FAO Irrigation and drainage paper 56, Food and Agriculture Organization, Rome, ISBN 92-5-104219-5, 1998.
Alua, M. A., Peprah, K., and Achana, G. T. W.: Climate change implications for crop farming in Ghana's semi-arid guinea savanna, International Journal of Development and Sustainability, 7, 2334–2349, 2018.
Araújo, T., Silva, L. T., and Moreira, A. J. C.: Evaluation of Low-Cost Sensors for Weather and Carbon Dioxide Monitoring in Internet of Things Context, IoT, 1, 286–308, https://doi.org/10.3390/iot1020017, 2020.
Baldocchi, D., Valentini, R., Running, S., Oechel, W., and Dahlman, R.: Strategies for measuring and modelling carbon dioxide and water vapour fluxes over terrestrial ecosystems, Glob. Change Biol., 2, 159–168, https://doi.org/10.1111/j.1365-2486.1996.tb00069.x, 1996.
Bastviken, D., Sundgren, I., Natchimuthu, S., Reyier, H., and Gålfalk, M.: Technical Note: Cost-efficient approaches to measure carbon dioxide (CO2) fluxes and concentrations in terrestrial and aquatic environments using mini loggers, Biogeosciences, 12, 3849–3859, https://doi.org/10.5194/bg-12-3849-2015, 2015.
Beer, C., Ciais, P., Reichstein, M., Baldocchi, D., Law, B., Papale, D., Soussana, J.-F., Ammann, C., Buchmann, N., Frank, D., Gianelle, D., Janssens, I., Knohl, A., Köstner, B., Moors, E., Roupsard, O., Verbeeck, H., Vesala, T., Williams, C., and Wohlfahrt, G.: Temporal and among-site variability of inherent water use efficiency at the ecosystem level, Global Biogeochem. Cy., 23, GB2018, https://doi.org/10.1029/2008GB003233, 2009.
Blackstock, J. M., Covington, M. D., Perne, M., and Myre, J. M.: Monitoring Atmospheric, Soil, and Dissolved CO2 Using a Low-Cost, Arduino Monitoring Platform (CO2-LAMP): Theory, Fabrication, and Operation, Front. Earth Sci., 7, 313, https://doi.org/10.3389/feart.2019.00313, 2019.
Brändle, J. and Kunert, N.: A new automated stem CO2 efflux chamber based on industrial ultra-low-cost sensors, Tree Physiol., 39, 1975–1983, https://doi.org/10.1093/treephys/tpz104, 2019.
Brouwer, C. and Heibloem, M.: Irrigation Water Management: Irrigation Water Needs. Training manual no. 3, Food and Agriculture Organization of the United Nations, Rome, 1986.
Brown, S. L., Goulsbra, C. S., Evans, M. G., Heath, T., and Shuttleworth, E.: Low cost CO2 sensing: A simple microcontroller approach with calibration and field use, HardwareX, 8, e00136, https://doi.org/10.1016/j.ohx.2020.e00136, 2020.
Canadell, J. G., Ciais, P., Gurney, K., Le Quéré, C., Piao, S., Raupach, M. R., and Sabine, C. L.: An international effort to quantify regional carbon fluxes, EOS T. Am. Geophys. Un., 92, 81–82, 2011.
Capri, C., Gatti, M., Guadagna, P., Zozzo, F. D., Magnanini, E., and Poni, S.: A low-cost portable chamber based on Arduino micro-controller for measuring cover crops water use, Comput. Electron. Agr., 190, 106361, https://doi.org/10.1016/j.compag.2021.106361, 2021.
Chapin III, F. S., Woodwell, G. M., Randerson, J. T., Rastetter, E. B., Lovett, G. M., Baldocchi, D. A., Clark, M. E., Harmon, D. S., Schimel, R., Valentini, C., Wirth, J. D. , Aber, J. J., Cole, M. L., Goulden, J. W., Harden, M., Heimann, R. W., Howarth, P. A., Matson, A. D., McGuire, J. M., Melillo, H. A., Mooney, J. C., Neff, R. A., Houghton, M. L., Pace, M. G., Ryan, S. W., Running, O. E., Sala, W. H., and Schulze, E. D.: Reconciling Carbon-cycle Concepts, Terminology, and Methods, Ecosystems, 9, 1041–1050, https://doi.org/10.1007/s10021-005-0105-7, 2006.
Curcoll, R., Morguí, J.-A., Kamnang, A., Cañas, L., Vargas, A., and Grossi, C.: Metrology for low-cost CO2 sensors applications: the case of a steady-state through-flow (SS-TF) chamber for CO2 fluxes observations, Atmos. Meas. Tech., 15, 2807–2818, https://doi.org/10.5194/amt-15-2807-2022, 2022.
Ceschia, E., Béziat, P., Dejoux, J.-F., Aubinet, M., Bernhofer, C., Bodson, B., Buchmann, N., Carrara, A., Cellier, P., Tommasi, P., Elbers, J., Eugster, W., Grünwald, T., Jacobs, C., Jans, W., Jones, M., Kutsch, W. L., Lanigan, G., Magliulo, V., and Wattenbach, M.: Management effects on net ecosystem carbon and GHG budgets at European crop sites, Agr. Ecosyst. Environ., 139, 363–383, 2010.
Dahlmann, A., Hoffmann, M., Verch, G., Schmidt, M., Sommer, M., Augustin, J., and Dubbert, M.: Benefits of a robotic chamber system for determining evapotranspiration in an erosion-affected, heterogeneous cropland, Hydrol. Earth Syst. Sci., 27, 3851–3873, https://doi.org/10.5194/hess-27-3851-2023, 2023.
Dubbert, M., Cuntz, M., Piayda, A., and Werner, C.: Oxygen isotope signatures of transpired water vapor: the role of isotopic non-steady-state transpiration under natural conditions, New Phytol., 203, 1242–1252, https://doi.org/10.1111/nph.12878, 2014.
Elsgaard, L., Görres, C., Hoffmann, C. C., Blicher-Mathiesen, G., Schelde, K., and Petersen, S. O.: Net ecosystem exchange of CO2 and carbon balance for eight temperate organic soils under agricultural management, Agr. Ecosyst. Environ., 162, 52–67, https://doi.org/10.1016/j.agee.2012.09.001, 2012.
Emmel, C., Winkler, A., Hörtnagl, L., Revill, A., Ammann, C., D'Odorico, P., Buchmann, N., and Eugster, W.: Integrated management of a Swiss cropland is not sufficient to preserve its soil carbon pool in the long term, Biogeosciences, 15, 5377–5393, https://doi.org/10.5194/bg-15-5377-2018, 2018.
FAO (Food and Agriculture Organization): WaPOR v2.1, Version 2.1, Water Productivity Open Access Portal [data set], http://wapor.apps.fao.org/ (last access: 15 March 2023), 2019.
FAO (Food and Agricultural Organization): Emissions due to agriculture. Global, regional and country trends 2000–2018, FAOSTAT Analytical Brief Series No. 18, Food and Agriculture Organization of the United Nations, Rome, ISSN 2709-0078, 2020.
Gilmanov, T. G., Soussana, J. F., Aires, L., Allard, V., Ammann, C., Balzarolo, M., Barcza, Z., Bernhofer, C., Campbell, C. L., Cernusca, A., Cescatti, A., Clifton-Brown, J., Dirks, B. O. M., Dore, S., Eugster, W., Fuhrer, J., Gimeno, C., Gruenwald, T., Haszpra, L., Hensen, A., Ibrom, A., Jacobs, A. F. G., Jones, M. B., Lanigan, G., Laurila, T., Lohila, A., Manca, G., Marcolla, B., Nagy, Z., Pilegaard, K., Pinter, K., Pio, C., Raschi, A., Rogiers, N., Sanz, M. J., Stefani, P., Sutton, M., Tuba, Z., Valentini, R., Williams, M. L., and Wohlfahrt, G.: Partitioning European grassland net ecosystem CO2 exchange into gross primary productivity and ecosystem respiration using light response function analysis, Agr. Ecosyst. Environ., 121, 93–120, https://doi.org/10.1016/j.agee.2006.12.008, 2007.
Gilmanov, T. G., Wylie, B. K., Tieszen, L. L., Meyers, T. P., Baron, V. S., Bernacchi, C. J., Billesbach, D. P., Burba, G. G., Fischer, M. L., Glenn, A. J., Hanan, N. P., Hatfield, J. L., Heuer, M. W., Hollinger, S. E., Howard, D. M., Matamala, R., Prueger, J. H., Tenuta, M., and Young, D. G.: CO2 uptake and ecophysiological parameters of the grain crops of midcontinent North America: estimates from flux tower measurements, Agr. Ecosyst. Environ., 164, 162–175, https://doi.org/10.1016/j.agee.2012.09.017, 2013.
González Rivero, R. A., Morera Hernández, L. E., Schalm, O., Hernández Rodríguez, E., Alejo Sánchez, D., Morales Pérez, M. C., Nuñez Caraballo, V., Jacobs, W., and Martinez Laguardia, A.: A Low-Cost Calibration Method for Temperature, Relative Humidity, and Carbon Dioxide Sensors Used in Air Quality Monitoring Systems, Atmosphere, 14, 191, https://doi.org/10.3390/atmos14020191, 2023.
Gurney, K. R., Law, R. M., Denning, A. S., Rayner, P. J., Baker, D., Bousquet, P., Bruhwiler, L., Chen, Y.-H., Ciais, P., Fan, S., Fung, I. Y., Gloor, M., Heimann, M., Higuchi, K., John, J., Maki, T., Maksyutov, S., Masarie, K., Peylin, P., Prather, M., Pak, B. C., Randerson, J., Sarmiento, J., Taguchi, S., Takahashi, T., and Yuen, C.-W.: Towards robust regional estimates of CO2 sources and sinks using atmospheric transport models, Nature, 415, 626–630, 2002.
Hamel, P., Mchugh, I., Coutts, A., Daly, E., Beringer, J., and Fletcher, T. D.: Automated Chamber System to Measure Field Evapotranspiration Rates, J. Hydrol. Eng., 20, 04014037, https://doi.org/10.1061/(ASCE)HE.1943-5584.0001006, 2015.
Harmon, T. C., Dierick, D., Trahan, N., Allen, M. F., Rundel, P. W., Oberbauer, S. F., Schwendenmann, L., and Zelikova, T. J.: Low-cost soil CO2 efflux and point concentration sensing systems for terrestrial ecology applications, Methods Ecol. Evol., 6, 1358–1362, https://doi.org/10.1111/2041-210X.12426, 2015.
Hatfield, J. L. and Dold, C.: Water-Use Efficiency: Advances and Challenges in a Changing Climate, Front. Plant Sci., 10, 103, https://doi.org/10.3389/fpls.2019.00103, 2019.
Hoffmann, M., Jurisch, N., Albiac Borraz, E., Hagemann, U., Drösler, M., Sommer, M., and Augustin, J.: Automated modeling of ecosystem CO2 fluxes based on periodic closed chamber measurements: a standardized conceptual and practical approach, Agr. Forest Meteorol., 200, 30–45, https://doi.org/10.1016/j.agrformet.2014.09.005, 2015.
Hoffmann, M., Pohl, M., Jurisch, N., Prescher, A.-K., Mendez Campa, E., Hagemann, U., Remus, R., Verch, G., Sommer, M., and Augustin, J.: Maize carbon dynamics are driven by soil erosion state and plant phenology rather than nitrogen fertilization form, Soil Till. Res., 175, 255–266, https://doi.org/10.1016/j.still.2017.09.004, 2018.
IPCC: Climate Change and Land: an IPCC special report on climate change, desertification, land degradation, sustainable land management, food security, and greenhouse gas fluxes in terrestrial ecosystems, edited by: Shukla, P. R., Skea, J., Calvo Buendia, E., Masson-Delmotte, V., Pörtner, H.-O., Roberts, D. C., Zhai, P., Slade, R., Connors, S., van Diemen, R., Ferrat, M., Haughey, E., Luz, S., Neogi, S., Pathak, M., Petzold, J., Portugal Pereira, J., Vyas, P., Huntley, E., Kissick, K., Belkacemi, M., and Malley, J., https://doi.org/10.1017/9781009157988, 2019.
IUSS Working Group WRB: World reference base for soil resources 2014, International soil classification system for naming soils and creating legends for soil maps, World Soil Resources Reports No. 106, FAO, Rome, E-ISBN 978-92-5-108370-3 (PDF), 2015.
Keimel, A.: Comparison of Low-Cost CO2 Non-Dispersive Infrared (NDIR) Sensors for Ambient Greenhouse Gas Monitoring, thesis no. 282, UVM Honors College Senior Theses, https://scholarworks.uvm.edu/hcoltheses/282 (last access: 20 March 2023), 2019.
Kondo, M., Ichii, K., Takagi, H., and Sasakawa, M.: Comparison of the data-driven top-down and bottom-up global terrestrial CO2 exchanges: GOSAT CO2 inversion and empirical eddy flux upscaling, J. Geophys. Res.-Biogeosci., 120, 1226–1245, https://doi.org/10.1002/2014JG002866, 2015.
Kübert, A., Paulus, S., Dahlmann, A., Werner, C., Rothfuss, Y., Orlowski, N., and Dubbert, M.: Water Stable Isotopes in Ecohydrological Field Research: Comparison Between In Situ and Destructive Monitoring Methods to Determine Soil Water Isotopic Signatures, Front. Plant Sci., 11, 387, https://doi.org/10.3389/fpls.2020.00387, 2020.
Lal, R.: Soil carbon sequestration to mitigate climate change, Geoderma, 123, 1–22, https://doi.org/10.1016/j.geoderma.2004.01.032, 2004.
Larcher, W.: Physiological Plant Ecology: Ecophysiology and Stress Physiology of Functional Groups, 4th edn., Springer Berlin, Heidelberg, 514 pp., ISBN 3-540-43516-6, 2003.
Leiber-Sauheitl, K., Fuß, R., Voigt, C., and Freibauer, A.: High CO2 fluxes from grassland on histic Gleysol along soil carbon and drainage gradients, Biogeosciences, 11, 749–761, https://doi.org/10.5194/bg-11-749-2014, 2014.
Livingston, G. P. and Hutchinson, G. L.: Enclosure-based measurement of trace gas exchange: applications and sources of error, in: Methods in Ecology. Biogenic Trace Gases: Measuring Emissions from Soil and Water, edited by: Matson, P. A. and Harris, R. C., Blackwell Sci, New York, 14–51, ISBN: 0-632-03641-9, 1995.
Lloyd, J. and Taylor, J. A.: On the temperature dependence of soil respiration, Functional Ecol., 8, 315–323, https://doi.org/10.2307/2389824,1994.
Macagga, R., Asante, M., Sossa, G., Antonijevic, D., Dubbert, M., and Hoffmann, M.: Validation and field application of a low-cost device to measure CO2 and ET fluxes, BonaRes [data set/code], https://doi.org/10.4228/zalf-hdqh-br42, 2024.
Mamadou, O., Galle, S., Cohard, J., Peugeot, C., Kounouhewa, B., Biron, R., Hector, B., and Zannou, A. B.: Dynamics of water vapor and energy exchanges above two contrasting Sudanian climate ecosystems in Northern Benin (West Africa), J. Geophys. Res.-Atmos., 121, 11269–11286, https://doi.org/10.1002/2016JD024749, 2016.
Martin, C. R., Zeng, N., Karion, A., Dickerson, R. R., Ren, X., Turpie, B. N., and Weber, K. J.: Evaluation and environmental correction of ambient CO2 measurements from a low-cost NDIR sensor, Atmos. Meas. Tech., 10, 2383–2395, https://doi.org/10.5194/amt-10-2383-2017, 2017.
McDermitt, D. K., Welles J. M., and Eckles, R. D.: Effects of temperature, pressure and water vapor on gas phase infrared absorption by CO2, LI-COR Biosciences Inc. 1993.
Mendes, L., Ogink, N., Edouard, N., van Dooren, H., Tinôco, I., and Mosquera, J.: NDIR Gas Sensor for Spatial Monitoring of Carbon Dioxide Concentrations in Naturally Ventilated Livestock Buildings, Sensors, 15, 11239–11257, https://doi.org/10.3390/s150511239, 2015.
Mo, F., Wang, J.-Y., Zhou, H., Luo, C.-L., Zhang, X.-F., Li, X.-Y., Li, F.-M., Xiong, L.-B., Kavagi, L., Nguluu, S. N., and Xiong, Y.-C.: Ridge-furrow plastic-mulching with balanced fertilization in rainfed maize (Zea mays L.): An adaptive management in east African Plateau, Agr. Forest Meteorol., 236, 100–112, https://doi.org/10.1016/j.agrformet.2017.01.014, 2017.
Pandey, S., Kim, K. H., and Lee, S. H.: Use of a Dynamic Enclosure Approach to Test the Accuracy of the NDIR Sensor: Evaluation Based on the CO2 Equilibration Pattern, Sensors, 7, 3459–3471, https://doi.org/10.3390/s7123459, 2007.
Quansah, E., Mauder, M., Balogun, A. A., Amekudzi, L. K., Hingerl, L., Bliefernicht, J., and Kunstmann, H.: Carbon dioxide fluxes from contrasting ecosystems in the Sudanian Savanna in West Africa, Carbon Balance Manage, 10, 1, https://doi.org/10.1186/s13021-014-0011-4, 2015.
Rochette, P. and Hutchinson, G. L.: Measurement of Soil Respiration in situ: Chamber Techniques, in: Agronomy Monographs, edited by: Hatfield, J. L. and Baker, J. M., American Society of Agronomy, Crop Science Society of America, and Soil Science Society of America, Madison, WI, USA, 247–286, https://doi.org/10.2134/agronmonogr47.c12, 2015.
Rosenstock, T. S., Mpanda, M., Pelster, D. E., Butterbach-Bahl, K., Rufino, M. C., Thiong'o, M., Mutuo, P., Abwanda, S., Rioux, J., Kimaro, A. A., and Neufeldt, H.: Greenhouse gas fluxes from agricultural soils of Kenya and Tanzania, J. Geophys. Res.-Biogeo., 121, 1568–1580, https://doi.org/10.1002/2016JG003341, 2016.
Smith, P., Lanigan, G., Kutsch, W. L., Buchmann, N., Eugster, W., Aubinet, M., Ceschia, E., Béziat, P., Yeluripati, J. B., Osborne, B., Moors, E. J., Brut, A., Wattenbach, M., Saunders, M., and Jones, M.: Measurements necessary for assessing the net ecosystem carbon budget of croplands, Agr. Ecosyst. Environ., 139, 302–315, https://doi.org/10.1016/j.agee.2010.04.004, 2010.
Vaidya, S., Schmidt, M., Rakowski, P., Bonk, N., Verch, G., Augustin, J., Sommer, M., and Hoffmann, M.: A novel robotic chamber system allowing to accurately and precisely determining spatio-temporal CO2 flux dynamics of heterogeneous croplands, Agr. Forest Meteorol., 296, 108206, https://doi.org/10.1016/j.agrformet.2020.108206, 2021.
Verchot, L. V., Dannenmann, M., Kengdo, S. K., Njine-Bememba, C. B., Rufino, M. C., Sonwa, D. J., and Tejedor, J.: Land-use change and Biogeochemical controls of soil CO2, N2O and CH4 fluxes in Cameroonian forest landscapes, J. Integr. Environ. Sci., 17, 45–67, https://doi.org/10.1080/1943815X.2020.1779092, 2020.
Wang, K., Liu, C., Zheng, X., Pihlatie, M., Li, B., Haapanala, S., Vesala, T., Liu, H., Wang, Y., Liu, G., and Hu, F.: Comparison between eddy covariance and automatic chamber techniques for measuring net ecosystem exchange of carbon dioxide in cotton and wheat fields, Biogeosciences, 10, 6865–6877, https://doi.org/10.5194/bg-10-6865-2013, 2013.
Wang, X., Wang, C., and Bond-Lamberty, B.: Quantifying and reducing the differences in forest CO2-fluxes estimated by eddy covariance, biometric and chamber methods: A global synthesis, Agr. Forest Meteorol., 247, 93–103, https://doi.org/10.1016/j.agrformet.2017.07.023, 2017.
Wastine, B., Hummelgård, C., Bryzgalov, M., Rödjegård, H., Martin, H., and Schröder, S.: Compact Non-Dispersive Infrared Multi-Gas Sensing Platform for Large Scale Deployment with Sub-ppm Resolution, Atmosphere, 13, 1789, https://doi.org/10.3390/atmos13111789, 2022.
Webb, E. K., Pearman, G. I., and Leuning, R.: Correction of flux measurements for density effects due to heat and water vapour transfer, Q. J. Roy. Meteor. Soc., 106, 85–100, https://doi.org/10.1002/qj.49710644707, 1980.
Xu, C., McDowell, N. G., Fisher, R. A., Wei, L., Sevanto, S., Christoffersen, B. O., Weng, E., and Middleton, R. S.: Increasing impacts of extreme droughts on vegetation productivity under climate change, Nat. Clim. Change, 9, 948–953, https://doi.org/10.1038/s41558-019-0630-6, 2019.
Yang, F., Zhang, Q., Wang, R., and Zhou, J.: Evapotranspiration Measurement and Crop Coefficient Estimation over a Spring Wheat Farmland Ecosystem in the Loess Plateau, PLoS ONE, 9, e100031, https://doi.org/10.1371/journal.pone.0100031, 2014.
Yasuda, T., Yonemura, S., and Tani, A.: Comparison of the Characteristics of Small Commercial NDIR CO2 Sensor Models and Development of a Portable CO2 Measurement Device, Sensors, 12, 3641–3655, https://doi.org/10.3390/s120303641, 2012.