the Creative Commons Attribution 4.0 License.
the Creative Commons Attribution 4.0 License.
 | 15 Mar 2024
Enhancing consistency of microphysical properties of precipitation across the melting layer in dual-frequency precipitation radar data
Alessandro Battaglia
Ann M. Fridlind
Stratiform rain and the overlying ice play crucial roles in Earth's climate system. From a microphysics standpoint, water mass flux primarily depends on two variables: particles' concentration and their mass. The Dual-frequency Precipitation Radar (DPR) on the Global Precipitation Measurement mission core satellite is a spaceborne instrument capable of estimating these two quantities through dual-wavelength measurements. In this study, we evaluate bulk statistics on the ice particle properties derived from dual-wavelength radar data in relation to the properties of rain underneath. Specifically, we focus on DPR observations over stratiform precipitation, characterized by columns exhibiting a prominent bright band, where the melting layer can be easily detected.
Our analysis reveals a large increase in the retrieved mass flux as we transition from the ice to the rain phase in the official DPR product. This observation is in disagreement with our expectation that mass flux should remain relatively stable across the bright band in cold-rain conditions. To address these discrepancies, we propose an alternative retrieval algorithm that ensures a gradual transition of Dm (mean mass-weighted particle melted-equivalent diameter) and the precipitation rate across the melting zone. This approach also helps in estimating bulk ice density above the melting level. These findings demonstrate that DPR observations can not only quantify ice particle content and their size above stratiform rain regions but also estimate bulk density, provided uniform conditions that minimize uncertainties related to partial beam filling.
- Article
(8211 KB) - Full-text XML
- BibTeX
- EndNote


As part of the Global Precipitation Measurement (GPM; Hou et al., 2014) mission, in February 2014, US and Japanese national agencies jointly launched the spaceborne Dual-frequency Precipitation Radar (DPR). The DPR measures at the Ku- (13.6 GHz) and Ka-bands (35.5 GHz), improving on the single-frequency Ku-band (13.8 GHz) radar that was launched in 1997 with the Tropical Rainfall Measuring Mission (TRMM; Kummerow et al., 1998). Not only does GPM have an extended latitude range of 65° S–65° N, compared to TRMM's 36° S–36° N, but it has also improved the system sensitivity. In fact, the Ku-band precipitation radar is now able to detect a minimum radar reflectivity of 15.5 dBZ (Liao and Meneghini, 2022), whereas during the TRMM era, it was 18 dBZ (Heymsfield et al., 2000). Thanks to extended latitudinal coverage, the DPR has shown that the world's largest storms occur primarily over mid- and high-latitude oceans in both hemispheres (Liu and Zipser, 2015) and that the areal coverage of storms overshooting the tropopause over central North America and Argentina rivals that over the tropics (Liu and Liu, 2016).
Here we investigate use of DPR data for the retrieval of the size and the precipitation rate of ice crystals overlying cold rain. Widespread precipitation associated with convection is a primary source of stratiform rain, especially in the tropics. Observational and modeling studies have focused on this topic for decades (e.g., Webster and Stephens, 1980; Chen and Cotton, 1988). However, the climatological significance of fundamentally differing diabatic heating profiles corresponding to regions of convective and stratiform rain was fully realized only about 20 years ago (Houze, 1997). Since then, TRMM measurements have enabled us to assess the frequency and extent of stratiform rain in tropical and subtropical regions. This classification has unveiled the existence of more extensive stratiform rain regions over the ocean, even though the embedded convection is notably more intense over land (Houze et al., 2015; Schumacher and Funk, 2023). Today, identification of the precipitation type as convective, stratiform, or neither is a leading element of DPR retrievals (Awaka et al., 2021).
The microphysical properties of ice particles overlying stratiform rain have a strong impact on the local rain rate and the size and duration of stratiform regions (e.g., Jensen et al., 2018). However, the physical processes governing the size and evolution of ice particles are still poorly understood (Ackerman et al., 2015; Barnes and Houze, 2016; de Laat et al., 2017; Fridlind et al., 2017; Ladino et al., 2017; Lawson et al., 2017), highlighting the need for improved observational data sources to constrain model physics. While ice physics within convective columns is challenging to observe, stratiform rain decks are widespread and long-lived features that can be robustly observed and evaluated in simulations (e.g., via aircraft in situ measurements, Fridlind et al., 2017). The question is to what extent can satellite remote-sensing platforms be used to retrieve physically robust ice properties within these features. Single-wavelength radar reflectivity cannot reliably constrain ice size and concentration due to non-unique signatures from each variable (Drigeard et al., 2015). The CloudSat radar and Cloud-Aerosol Lidar and Infrared Pathfinder Satellite Observations (CALIPSO) introduced two-frequency (two-instrument) retrievals above the lidar extinction level (Delanoë and Hogan, 2010; Deng et al., 2010), providing an effective technique for characterizing cirrus clouds and the tops of thicker clouds. Thanks to its weaker attenuation the GPM radar offers an opportunity to characterize the microphysical properties of precipitable-size ice particles based on well-colocated dual-frequency measurements. The possibility of characterizing ice properties globally over stratiform rain regions from a spaceborne sensor provides a unique opportunity for advancing understanding of fundamental weather processes and offers a valuable constraint for improving climate model physics.
In the following sections, we first provide an example of DPR data obtained from a deep-stratiform rain volume and compile 5 years of global statistics on the DPR observables and the retrieved microphysical parameters in proximity to the melting layer (Sect. 3.2). Based on these statistics, some physically inconsistent properties of the precipitation columns are highlighted. Then, we demonstrate an alternative retrieval scheme for ice crystal properties that differs from the official DPR algorithm in the ice crystal density assumptions (Sect. 4). It should be noted that this algorithm is only applicable to homogenous precipitation columns and where both frequency measurements exceed the radar sensitivity threshold. The new retrieval is validated with the polarimetric radar product in Sect. 6. Results and conclusions are summarized in Sect. 7.
To showcase the measurement capabilities of the DPR system, we present an example of its observations and follow it with statistics on precipitation properties in the vicinity of the melting layer.
2.1 Example scene
Figure 1 provides an example of DPR Level-2 Ku- and Ka-band measurements from a deep-stratiform outflow region over Missouri in April 2017. The stratiform rain is associated with widespread Ku-band reflectivity values peaking around ∼ 40 dBZ below the melting level. For the Ka-band channel, much weaker echoes are observed as a result of the cumulative attenuation effects, mainly caused by raindrops and melting snowflakes, and non-Rayleigh scattering signatures. In this example, the stratiform rain is likely associated with the outflow from the squall line system that can be seen at the southern east end of the scene.
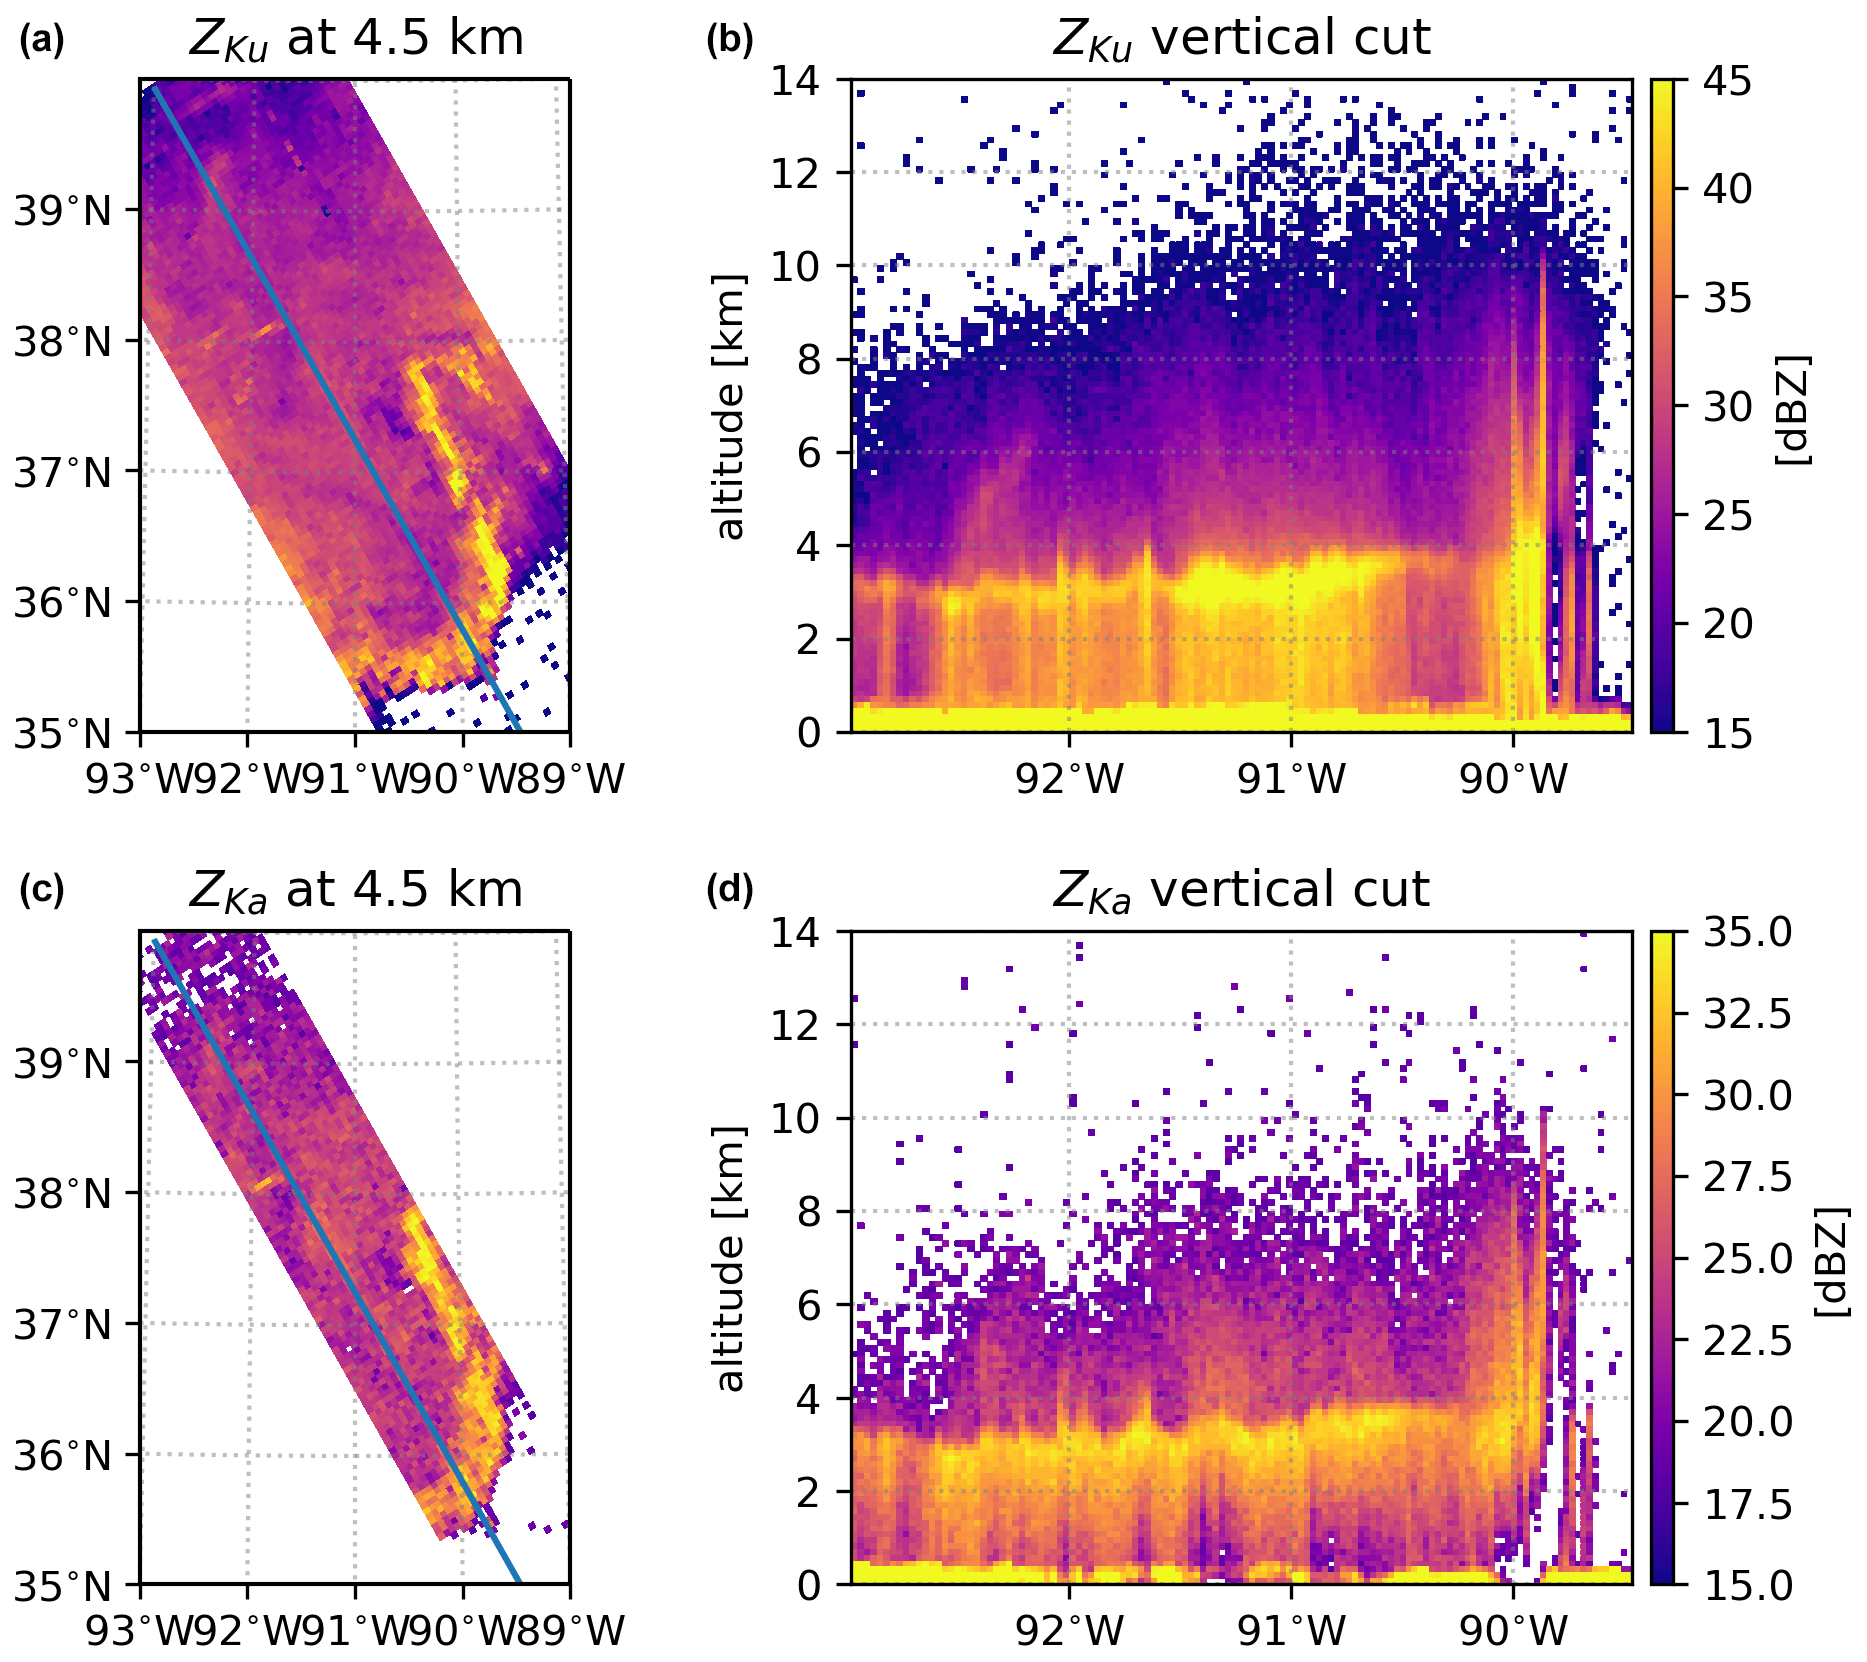
Figure 1DPR Ku- and Ka-band radar reflectivity measurements of a storm over Missouri on 30 April 2017 (orbit 18010). Panels (a) and (c) depict the horizontal cross-section at the constant altitude of 4.5 km a.s.l., whereas panels (b) and (d) show the vertical crosscut along the satellite track (29th ray).
The vertical cross-section at the Ku-band along the satellite track shows a pronounced bright band (BB) at 3–4 km above sea level (a.s.l.), which is characteristic of stratiform rain observed by low-frequency radars. Corresponding Ka-band vertical cross-sections do not show a bright band but exhibit a sharp increase in radar reflectivity due to the water phase transition and the resulting change in dielectric constant. It is evident that the Ku-band system is more sensitive than the Ka-band radar, with a sensitivity of 15.5 dBZ compared to 19.2 dBZ (Liao and Meneghini, 2022). Therefore, it is capable of detecting ice particles above 12 km in elevation for the presented weather system. In addition to distinct sensitivity levels, the measured reflectivity at the two bands above the melting zone exhibits a large difference. The measured reflectivity is a combination of the effective reflectivity Ze of the distributed hydrometeors at range r and the two-way path-integrated attenuation (PIA):
where k is the one-way specific attenuation along the path. Therefore, the difference in measured reflectivity, the so-called dual-frequency wavelength ratio (DFR),
is a result of differences in Ze (non-Rayleigh effects) and/or differences in specific attenuation at different channels (differential attenuation). The non-Rayleigh effects are most evident just above the melting layer where particles tend to aggregate and form large ice particles, while attenuation effects are not as strong (see, e.g., Kuo et al., 2016). For the scene shown in Fig. 1, the DFR reaches 7 dB in the ice phase. Below the melting zone, the DFR typically increases towards the surface due to the dominant effects of differential attenuation caused by rain.
2.2 Measurement and retrieval statistics
The statistics presented in this section are based on an analysis of DPR data collected between 2015 and 2020. We selected only stratiform rain columns for analysis, based on the following criteria. First, precipitation was detected by both GPM radars (flagPrecip=11 in the DPR Level-2 data files; for more details see the documentation file prepared by JAXA/EORC Team, 2017). Second, a bright band was detected at the Ku-band (flagBB=1) with a high-quality detection (qualityBB=1). Third, the stratiform rain type was identified (the first bit of typePrecip equal to 1) with high certainty (qualityTypePrecip=1). And fourth, to avoid any contamination with melting particles introduced by the slanted geometry of the scan, only five central scans along the satellite track that correspond to almost nadir measurements are selected. Note that the DPR beam has an approximate width of 5 km. As a result, the discrepancy in the altitude of the bottom boundary of the radar bin can reach approximately 1500 m (for Ku-band) or 700 m (for Ka-band) at the edge of the swath where the local zenith angle is equal to 17 or 8°, respectively. Moreover, before the swatch structure change in May 2018 (Liao and Meneghini, 2022), Ku- and Ka-band radar data were not matched in the outer swath and, consequently, dual-frequency retrieval was not available in that region.
The aim of this study is to establish a statistical relationship between DPR observables below and above the melting zone within stratiform rain, and we focus here exclusively on observables in these two regimes. The altitude and extent of the melting zone are determined using the DPR version 06 (V06) bright-band detection product (Le and Chandrasekar, 2013). In order to reduce the impact of signal fluctuations caused by instrument noise, we fit the measurements from the DPR system with a first-order polynomial over a 0.5 km layer above and below the bright band and then evaluate these polynomials at the melting-layer boundaries.
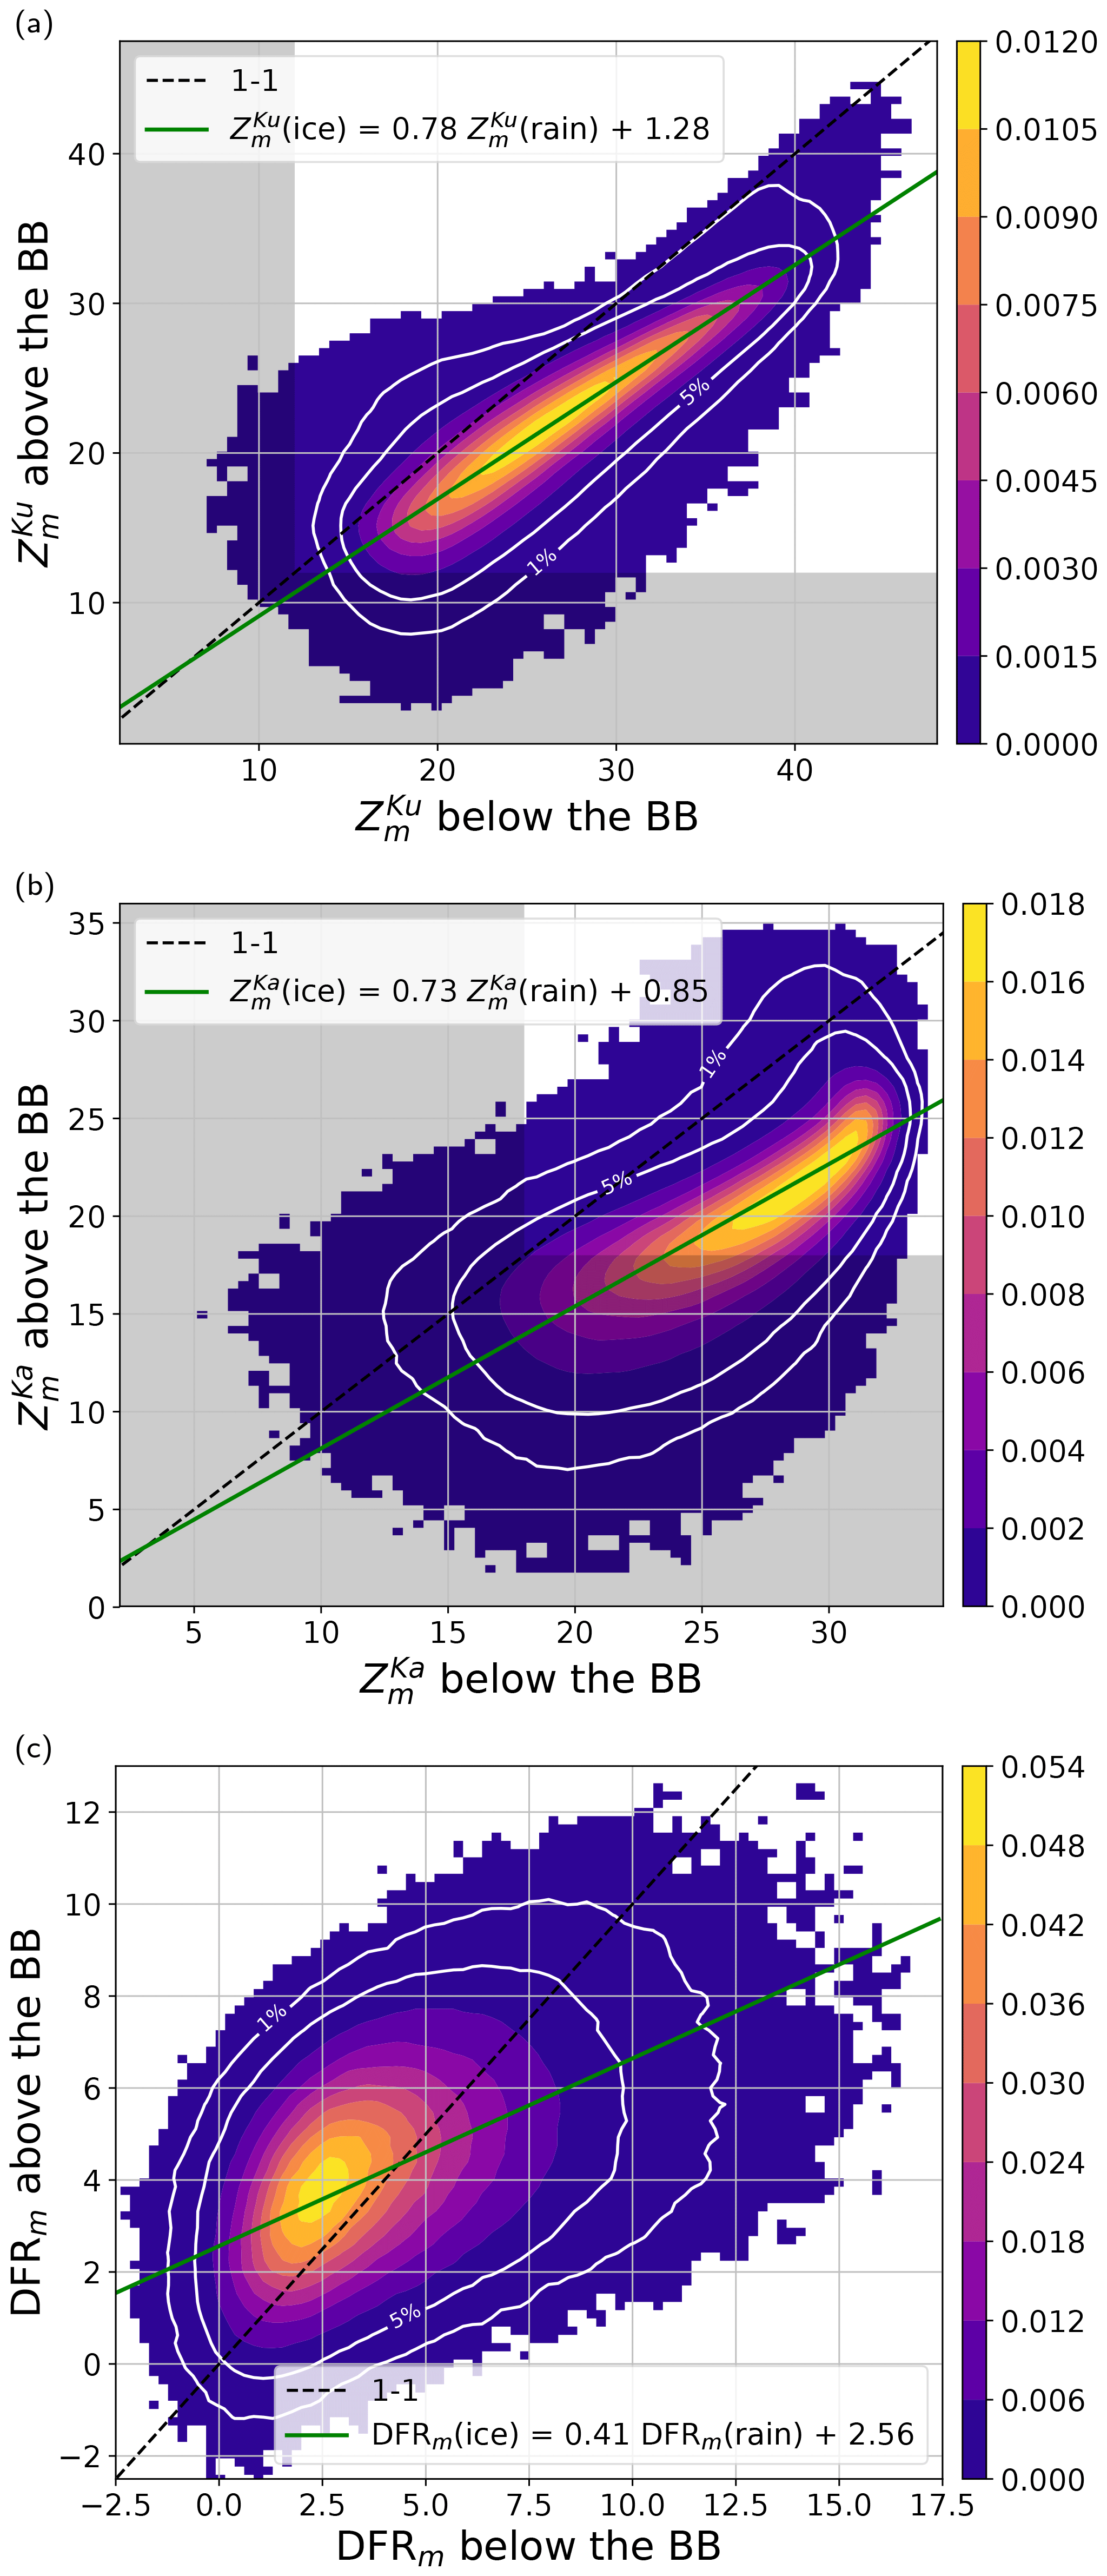
Figure 2The joint probability distribution functions (PDFs) of the DPR observables measured above and below the melting zone. The green line represents a linear fit passing through the most commonly observed values for a given argument x. The grey-shaded area represents measurements below the signal-to-noise ratio of 1. The white contour lines indicate a boundary of the regions that contain 1 % and 5 % of the least commonly observed values.
Figure 2 illustrates a joint histogram of DPR observables below and above the melting zone, corresponding to the entire dataset of ∼ 9 million columns. In general, liquid-phase hydrometeors are more reflective than ice particles at both DPR channels. The difference in Ku-band reflectivity between the ice and rain phases is typically less than 15 dB. A wide range of reflectivity values for solid particles producing the same radar signal in rain highlights the diverse range of ice properties. While interpreting this signal is not straightforward, some factors that contribute to the magnitude of the reflectivity change through the melting zone can be quantified. Drummond et al. (1996) have shown (their Eq. 5) that under an assumption of constant mass flux and a Rayleigh scattering regime the reflectivity in ice is directly related to the reflectivity in rain via the following formula:
where superscripts r and i denote “rain” and “ice”, respectively, while VD is the backscattering-weighted mean sedimentation velocity of particles in the radar volume. The factor of −6.4 dB corresponds to changes in the dielectric factor when water transitions from the solid to liquid phase (Fabry and Zawadzki, 1995). The second factor accounts for the change in particle concentration required to sustain the mass flux. Depending on the ice aerodynamics, this can compensate the scattering efficiency factor by up to 6 dB, with dense and thus fast-falling particles characterized by a small reduction. The contribution from other phenomena like the orientation, shape, and density of ice particles is very difficult to quantify, and it requires certain assumptions on particles' morphology. Additional complexity originates from microphysical processes that occur within the melting zone. The melting process cools down the air around particles, which induces condensation of the saturated air and an increase in the mass of particles. Furthermore, the presence of a wet coating on falling snowflakes makes them prone to aggregation within the bright band (Mitra et al., 1990). On the other hand, for strongly asymmetric particles, fragmentation can also occur. The regression line that passes through the most frequently observed pairs of Ku-band measurements suggests that the reflectivity difference between different water phases increases with rainfall intensity. This phenomenon can be attributed to greater ice density at higher precipitation rates, which reduces the second term in formula (3). Alternatively, non-Rayleigh scattering effects in the ice portion can lead to Zi values that are lower than predicted by Drummond et al. (1996). Additionally, continuous particle growth within the melting zone can favor reflectivities higher than anticipated below the melting zone.
Due to non-Rayleigh scattering, the Ka-band histogram is more compact than for the lower-frequency channel. The range of observed Ka-band reflectivity in the ice and liquid phase are smaller by 10 dB. Moreover, the number of pairs above the 1–1 line is also higher than at 13 GHz. The characteristic hook present for strong echoes may result from non-Rayleigh scattering in rain or strong attenuation induced by ice and melting particles, which greatly reduces measured echoes below the BB. Because of that, a wide range of radar reflectivity values in ice are observed for the same reflectivity in rain; e.g., for dBZ in rain the reflectivity in ice spans from 15 to 33 dBZ. Note that the lower end of the measured reflectivity ( dBZ) must be interpreted with caution because the signal-to-noise ratio is small there.
DFRs below the BB exhibit a range between −2 and 15 dB, with most of the variability (from −1 to 10 dB) attributed to Mie scattering at the Ka-band (Seto et al., 2013), which is associated with drops larger than approximately 0.8 mm. The extreme observed DFR values arise primarily from the effects of differential attenuation, with a minor contribution stemming from random instrument noise at the Ku- and Ka-bands. It is worth noting that, on average, the DFR of ice tends to increase with the DFR of rain. This aligns with the intuition that larger snowflakes aloft generate bigger drops. Having said that, the same degree of variability in the DFR is observed within ice across all DFR values in rain. This suggests that droplet size is not solely dependent on the size of ice particles. Other factors, such as ice density, should be considered for accurate modeling of the measured reflectivity above the 0° isotherm.
For liquid-phase particles, the DPR retrieval adopts the gamma distribution model, i.e.,
and μ is assumed to be constant and equal to 3. Mixed- and solid-phase particles are described in terms of melted hydrometeors with the same gamma function (Iguchi et al., 2018) model. By imposing the analytic form, the description of the complex shape of the particle size distribution is reduced to two parameters only: the mean mass-weighted melted-equivalent diameter Dm (mm) and the generalized intercept parameter Nw (mm−1 m−3). The parameter Nw functions as the scaling factor for particle concentration, while Dm serves as the descriptor for the overall size of particles present within the radar volume.
The definition of ice particle size remains a subject of ongoing debate within the remote sensing community (von Lerber et al., 2017). Depending on specific application requirements, various definitions are employed to characterize the size of individual ice particles. Even within the realm of in situ measurements, there is no universal consensus on a single definition. To illustrate this diversity, consider the example of a black-and-white image of a snowflake. In such cases, the size can be described using multiple criteria, including but not limited to the following.
-
Distance between the furthest pixels. This measures the greatest separation between any two points on the particle's perimeter.
-
Diameter of a circumscribed circle. This refers to the diameter of the smallest circle that fully encloses the snowflake.
-
Maximum extent along x or y axis. It represents the greatest length along either the horizontal (x) or vertical (y) axis of the particle.
-
Area-equivalent circle diameter. This method involves determining the diameter of a circle with the same area as the particle.
-
Diameters of a circumscribed ellipse. The diameter of the smallest ellipse that fully encloses the snowflake.
The choice of which definition to use often depends on the specific goals and constraints of a given research or measurement task, highlighting the multifaceted nature of ice particle size characterization in remote sensing and in situ observations.
In our current study, we choose to define the size of snow particles based on the diameter of a spherical raindrop with equivalent mass. Consequently, Dm is expressed in terms of the melted-equivalent size. Throughout the paper, we will refer to Dm as the “characteristic size” or simply “size” for brevity. This choice aligns with the one-to-one correspondence implied by the melting process, which is a central hypothesis in our investigation. Given that the dataset of snowflake scattering properties used in this study (available at https://doi.org/10.5281/zenodo.7510186, Mroz and Leinonen, 2023) also includes information on particle extent (i.e., the distance between the furthest points), it allows for a straightforward conversion from melted-equivalent size to physical size. The DPR algorithm utilizes a different snow morphology assumption. Snow is modeled as spherical particles consisting of an ice and air mixture with a density of 0.1 g cm−3, irrespective of the snowflake size.
The DPR retrieval algorithm utilizes measured radar reflectivity, total path-integrated attenuation estimates corrected for non-precipitating particles, the relationship between the precipitation rate and mean mass-weighted melted-equivalent diameter (PR–Dm), and phase information based on the melting-layer detection. It generates profiles of precipitation rate and drop size distribution parameters (Dm, Nw). Additionally, profiles of effective reflectivity and specific attenuation coefficients are provided. The algorithm employs the PR–Dm relationship with an adjustment parameter ϵ, aiming to reconcile discrepancies between the surface reference technique (SRT) and the one simulated from hydrometeor profiles. Version 06 had a single ϵ value along the profile, while version 07 introduces varying ϵ values in the column.
The PR–Dm relation replaces the traditionally used relation involving specific attenuation (k) and effective radar reflectivity factor (Ze). While using the k–Ze relation with the Hitschfeld–Bordan attenuation correction method (Hitschfeld and Bordan, 1954) enables the derivation of a Ze profile from the Zm profile without the need for scattering tables, this relation is not applicable at the Ka-band due to the weaker correlation between involved parameters. This limitation arises from rain extinction being strongly affected by absorption rather than being dominated by scattering. Consequently, the Hitschfeld–Bordan method leads to inconsistencies in attenuation correction at two frequencies.
The algorithm follows a logical sequence: assuming a gamma drop size distribution (DSD) with a fixed shape parameter, a relationship between PR and Dm imposes a unique solution for a given effective reflectivity. Consequently, the corresponding values for Nw are found, and by using the scattering tables the specific attenuation coefficient k is obtained. The process begins at the top, where the measured reflectivity is assumed to be unaffected by attenuation and is iteratively corrected using the estimated k. This procedure is applied throughout the column, resulting in the attenuation profile. The process is iterated with different values of ϵ to minimize the difference between the simulated PIA at the surface reference technique estimate.
For more details about the changes introduced in version 06 of the GPM DPR algorithm, refer to the GPM/DPR Level-2 Algorithm Theoretical Basis Document (Iguchi et al., 2018) or to the algorithm description provided by Seto et al. (2021). Additionally, the study conducted by Chase et al. (2020) provides a thorough evaluation of the PR–Dm relation in both rain and snow using disdrometer measurements. They conclude that the PR–Dm retrieval may not be optimal in snow due to the variability in snowflake mass, suggesting the exploration of alternative techniques.
3.1 Example scene
Figure 3 illustrates the DPR retrieval of the particle size distribution (PSD) parameters for the storm depicted in Fig. 1. In this study we use the DPR Level-2 version 06 (V06A) algorithm (2A.GPM.DPR files). In the solid-phase region, the retrieved parameters generally show a decrease in Dm and Nw as the height above the bright band increases. Notably, sharp horizontal discontinuities in the values of the retrieved intercept parameter indicate that the retrieval algorithm is run for each ray separately. Additionally, the retrieval results reveal that there is a higher concentration of particles when their characteristic size is small, and vice versa. This was already observed by Chase et al. (2021) in their Fig. 15. The relationship between Dm and Nw varies from column to column, resulting in horizontal inconsistencies in the microphysical properties. This inconsistency is particularly evident at the detectable cloud top, where a range of sizes and particle concentrations is observed for the same radar reflectivity value.
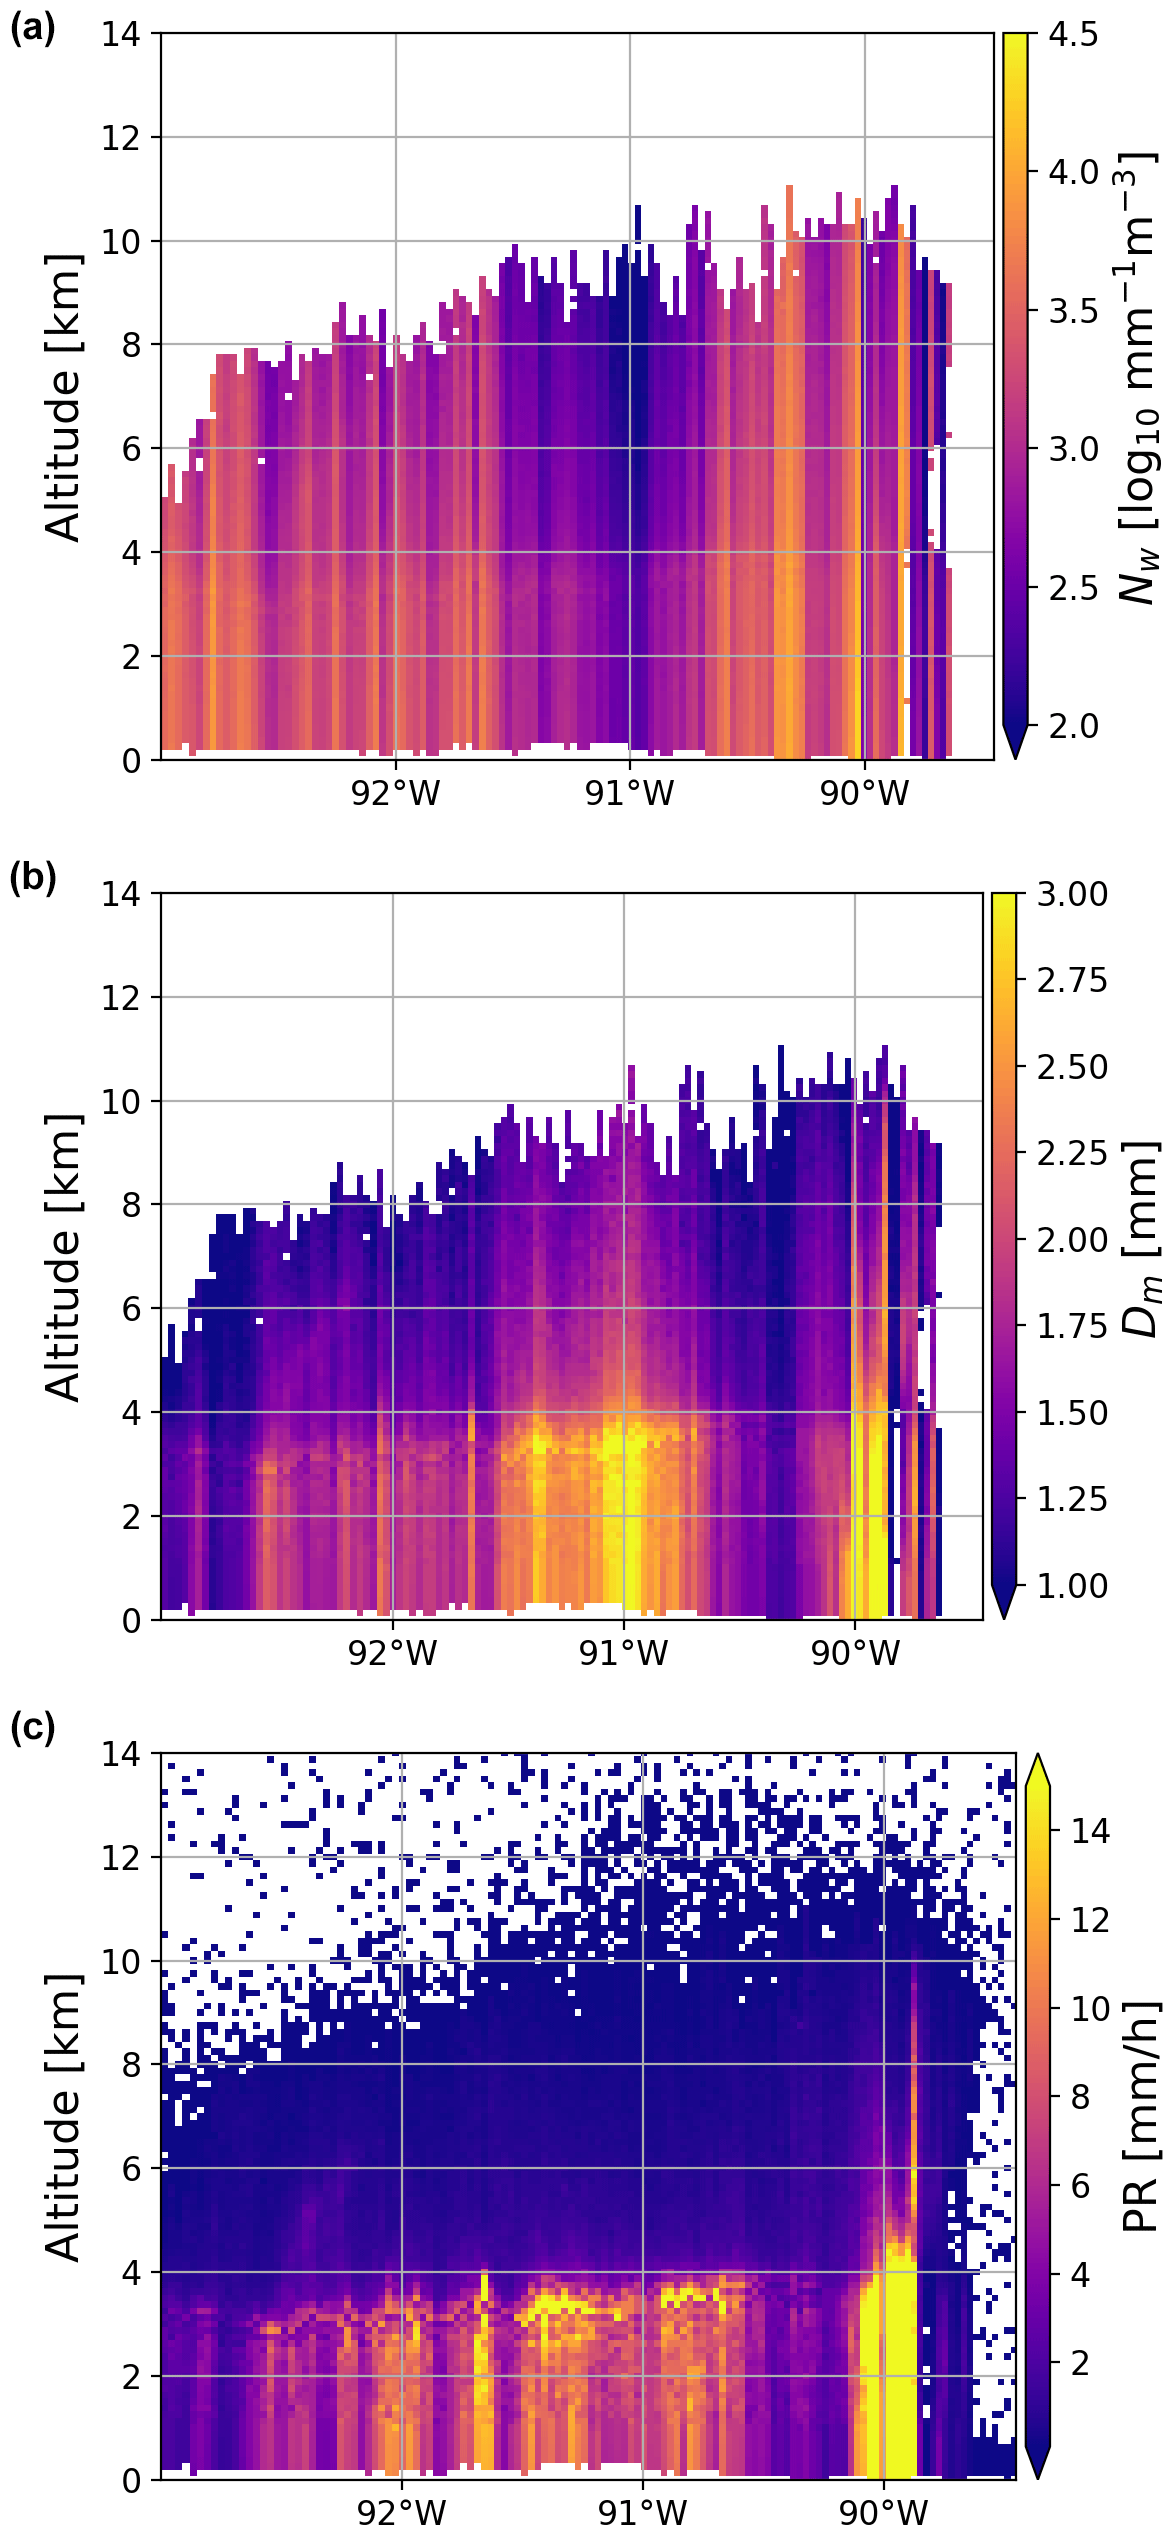
Figure 3The generalized intercept parameter (Nw), mean mass-weighted melted-equivalent diameter (Dm), and precipitation rate as retrieved in the DPR V06 product for the storm depicted in Fig. 1.
By assuming the falling velocity of particles is a function of diameter and density, as do Seto et al. (2013), the retrieved PSD parameters can be converted into the snowfall and rainfall rate. The rainfall product (Fig. 3, bottom left) clearly indicates different characteristic features of the squall line system (Biggerstaff and Houze, 1991): the leading convective part at the southern edge of the system characterized by heavy rain, the trailing stratiform region with moderate rain intensities (< 10 mm h−1) in the northern part of the system, and the transition zone between them characterized by small diameters (center left) and low rainfall rates. Unfortunately, the rainfall structure is not preserved above the freezing level. A sharp discontinuity of precipitation rates through the melting zone is particularly evident for high intensities, where approximately a 4-fold increase is observed. Such results are at odds with melting models, where constant mass flux is usually assumed (e.g., Szyrmer and Zawadzki, 1999; Zawadzki et al., 2005; Matrosov, 2008) or the precipitation rate from snow to rain changes gradually (e.g., Heymsfield et al., 2018a; Mróz et al., 2021c).
3.2 Statistical relationship between ice and rain parameters
In order to have a better insight into the relation between PSD parameter within ice and rain, a histogram of the retrieved values of Dm and Nw below and above the BB is shown in Fig. 4. To mitigate biases arising from errors in detecting the melting-layer extent, we define the data at 500 m above the detected bright-band top as the region “above the melting layer”. This approach assists in screening cases where the bright-band top altitude is uncertain and the top of the melting layer coincides with a region of sharp reflectivity increase.
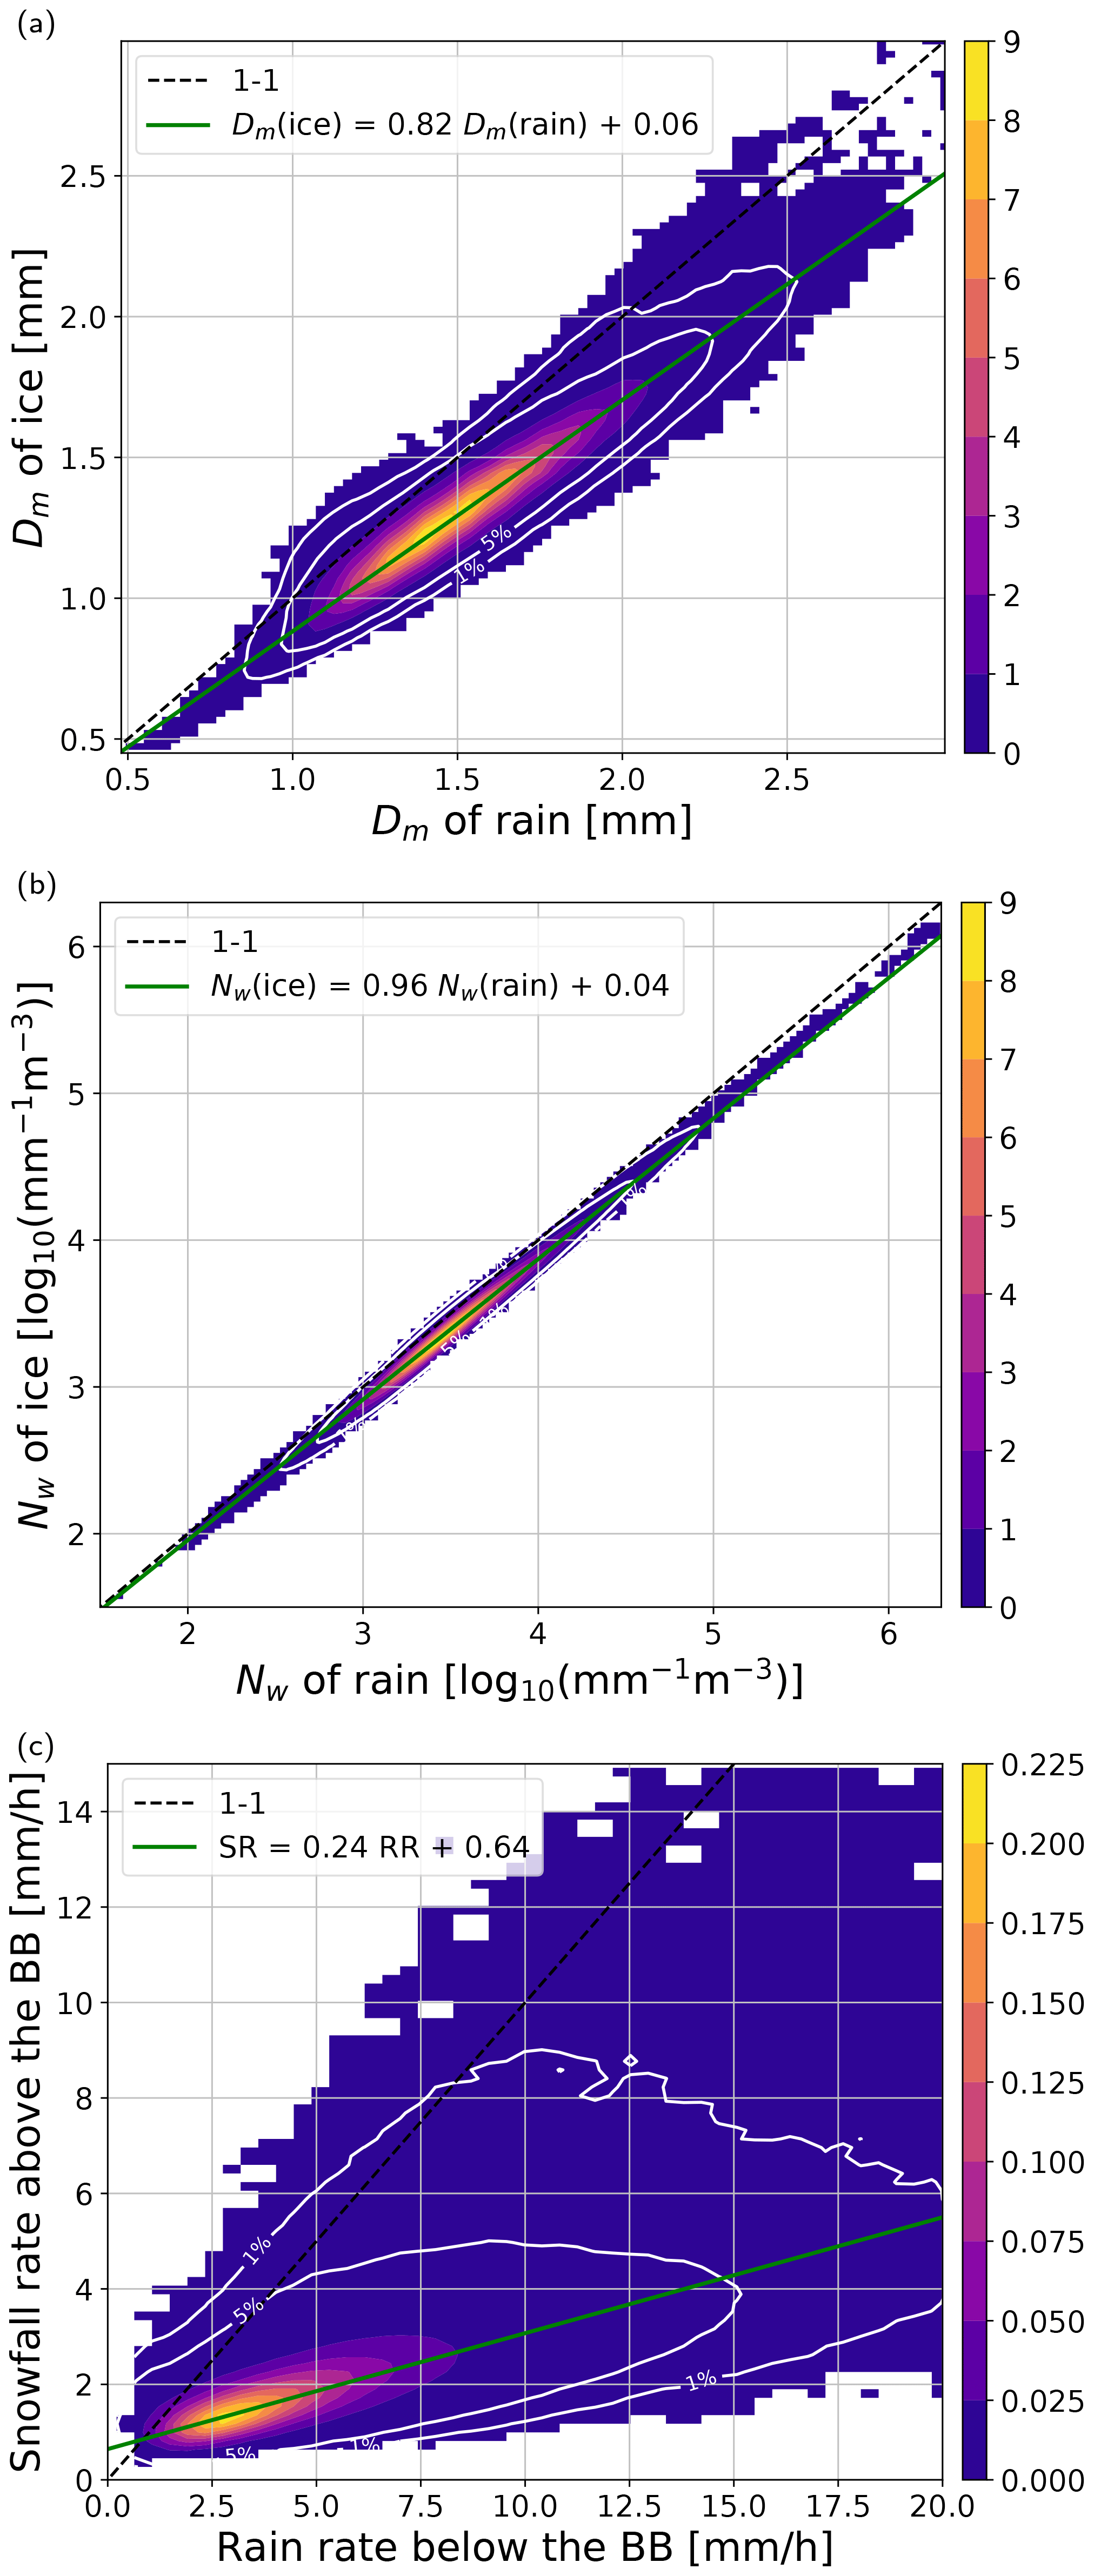
The sensitivity of the DPR system combined with the assumptions of the algorithm limits the lowest detectable size at 0.5 mm (Fig. 4a). Because of the ambiguity in the inversion process for small DFRs (Seto et al., 2013), the PSDs with a Dm smaller than 1 mm are extremely rare. On the other hand, there is a hard limit of 3 mm for a maximal characteristic size as was already observed by Gatlin et al. (2020). The retrieval suggests an increase of approximately 18 % in the Dm while particles are falling through the melting zone. The growth can be partially caused by the vapor deposition, which contributes to the increment of ∼ 6 % in mass (Fabry and Zawadzki, 1995), i.e., only 2 % in terms of the size. The remaining 16 % of the “observed” growth should be attributed to aggregation, or it may result from the algorithm underestimation of the assumed ice density/size or overestimation of rain diameters as has been reported by Petersen et al. (2018) and D'Adderio et al. (2018). Surprisingly, the statistical relation between retrieved characteristic sizes above and below the BB contradicts the findings of Mitra et al. (1990), who observed that snowflake breakup during melting is not uncommon, especially for strongly asymmetric particles. The recent melting simulations by Leinonen and Lerber (2018) confirm that unrimed particles are prone to breakup, indicating larger particles (in terms of melted-equivalent diameter) should be expected above the BB, not below. However, these aforementioned studies did not consider the possibility of particle collision and coalescence within the melting zone.
The retrieved intercept parameter values are closely clustered around 103.5 mm−1 m−3, with negligible variations among different water phases (refer to Fig. 4b). This observation elucidates the rapid changes in mass flux during melting in the DPR product. In order to maintain the precipitation rate, the concentration of slowly falling snowflakes must be considerably higher than that of rapidly falling raindrops, as posited by the mass flux conservation principle underlying formula (3). The potential underestimation of ice concentration aligns with recent findings by Chase et al. (2021), who assessed DPR retrieval using airborne radar data and collocated in situ probes, as well as the study by Mroz et al. (2021b), who demonstrated a large underestimation of snowfall rates over the continental US in comparison with ground-based radar products. A similar problem with the snowfall deficiency in the 2A.GPM.DPR product was also reported by Skofronick-Jackson et al. (2019) and Casella et al. (2017). The underestimation of ice particle concentration implies a severe discontinuity of the water mass flux through the melting zone. Figure 4c shows that the snowfall rate above the BB is roughly one-third of the rain rate below the BB.
In-depth analysis of the modeled Ka-band reflectivity above the bright band (BB) revealed that the radar signal corrected for attenuation is, on average, smaller than the actually measured reflectivity, as shown in Fig. 5. While some differences between the two are expected due to random noise in the measured reflectivity, systematic underestimation indicates non-physical negative attenuation or issues in the radar simulator's ability to fit the measurements. These discrepancies can have several consequences for the retrieval process with the overestimation of the characteristic size of ice particles being the most obvious.
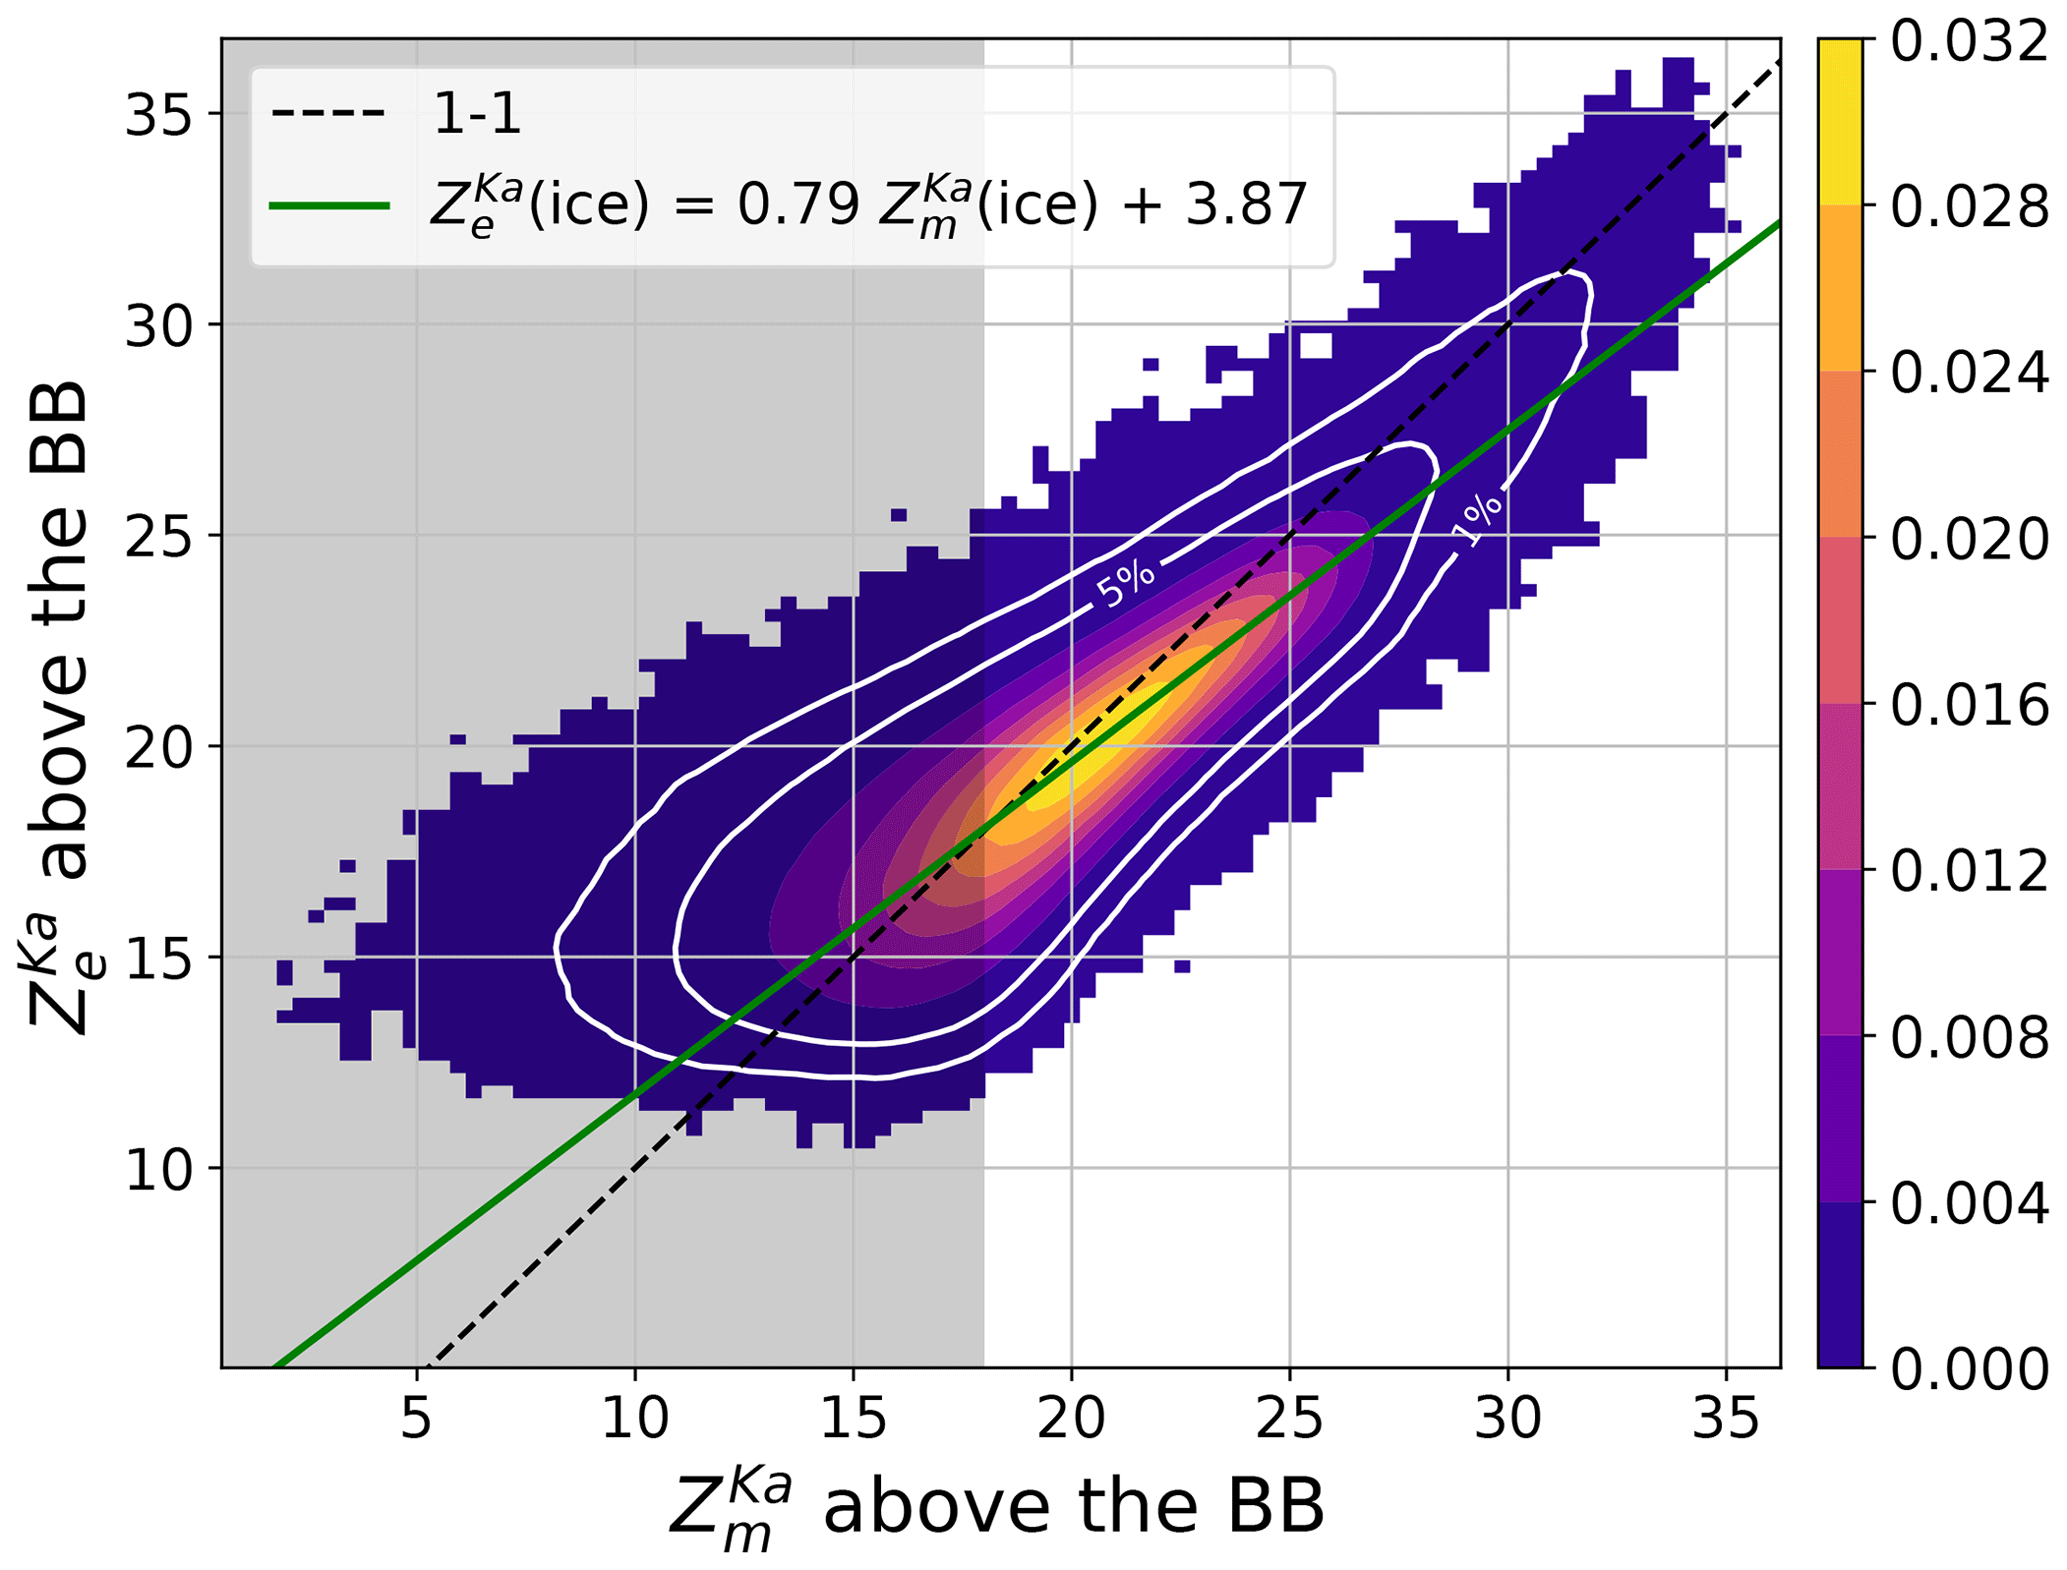
Figure 5A PDF of the measured and the corrected for attenuation Ka-band reflectivity above the melting region in the DPR V06 precipitation product.
We conducted a similar analysis with another official GPM product, specifically the 2B.GPM.DPRGMI.CORRA. This algorithm integrates DPR data with passive measurements from the GPM Microwave Imager (GMI). We evaluated the same version of this product over a consistent time span of 5 years. The findings indicated that this product is also subject to the same issue – specifically, the precipitation rate above the melting layer is only one-third of the rainfall rate below the melting zone. The regression line of best describes the mass flux change between the phases. Similar to the radar-only product, the melted-equivalent size of precipitation is well preserved through the melting zone ().
The striking similarities between the two official DPR products were already observed by Mroz et al. (2021b), who noted that both products are affected by a similar underestimation of snowfall rates over the continental US. For brevity and given the similarities to the corresponding figures for the DPR product, the histograms illustrating these results are not included in this paper.
The retrieval method proposed here aims to loosely enforce the continuity of the melted-equivalent diameter and the precipitation rate as particles transition through the melting zone. It follows the DPR approach with the use of a gamma PSD (Eq. 4); however no assumption on the shape parameter μ is made. Following Delanoë et al. (2005) we parameterize the PSD using a concept of moment normalization, i.e.,
where p is the moment, D is the liquid-sphere-equivalent diameter and Dmax is the diameter of the largest particle. With this approach, three parameters of the gamma model (Nw, Dm, μ) have an equivalent representation in terms of the physical quantities (PR, Dm, σm) defined as
where m and v denote the mass and velocity of particles, respectively. Dm represents the mean mass-weighted melted-equivalent diameter of the PSD, while σm indicates the mass-weighted standard deviation of the melted-equivalent diameter, often referred to as the width of the PSD. PR denotes the precipitation rate, which serves as the scaling parameter for particle concentration:
The function describes the shape of the PSD at a unit precipitation rate for a given characteristic size and width of the PSD. The aim of the DPR OE retrieval algorithm is to retrieve all three mentioned descriptors of the PSD; therefore, the vector of the retrieved parameters has the following form:
where N is the total number of DPR range gates above the Ku-band radar sensitivity threshold, while the superscript “ph” emphasizes that these are physical quantities.
4.1 A priori assumptions
Our a priori assumptions are specifically designed to align with the specifications of the DPR system, encompassing factors such as radar volume size and system sensitivity. To achieve this, we employ a “scale-up” approach, where we derive statistics on precipitation properties from ground-based polarimetric radars and average them to match the resolution of the DPR through collocated matchup volumes (Gatlin et al., 2020). This involves utilizing a network of S- and C-band radars that are part of the GPM ground validation (GV) program. It is important to note that ground-based radars offer finer horizontal resolution compared to the spaceborne system, thanks to their shorter distance to the meteorological targets. This enhanced resolution contributes to more detailed observations and reduces the problem of precipitation heterogeneity within the radar volume.
The collocated matchups of radar volumes facilitate effective cross-calibration between spaceborne and ground-based systems. Additionally, state-of-the-art polarimetric microphysical retrieval techniques are employed to estimate the characteristic rain size (Tokay et al., 2020) and precipitation rate (Cifelli et al., 2011) at fine scales, which are subsequently averaged to match the footprint size of the DPR. The polarimetric retrieval methods rely on radar simulations of disdrometer measurements and are validated with the ground-based rain gauges. This allows the GV dataset to bridge the gap between very distinct observation scales of disdrometers and the DPR.
Figure 6 illustrates the difference between the measured DSD characteristics at different scales. The black contour line represents the joint PDF of Dm and PR, as observed by two-dimensional video disdrometers (2DVD) deployed for the GPM ground validation program (Dolan et al., 2018). The color shading represents the data at the DPR resolution from the GV program data. Notably, the large-scale measurements cover a broader domain compared to the in situ data, despite the expected smearing-out effect in larger volumes. Additionally, the bull's-eye of the distribution is shifted to the left by 5 dB (equivalent to a difference of a factor of 3), indicating that at the DPR resolution, smaller precipitation rates are recorded for the same Dm.
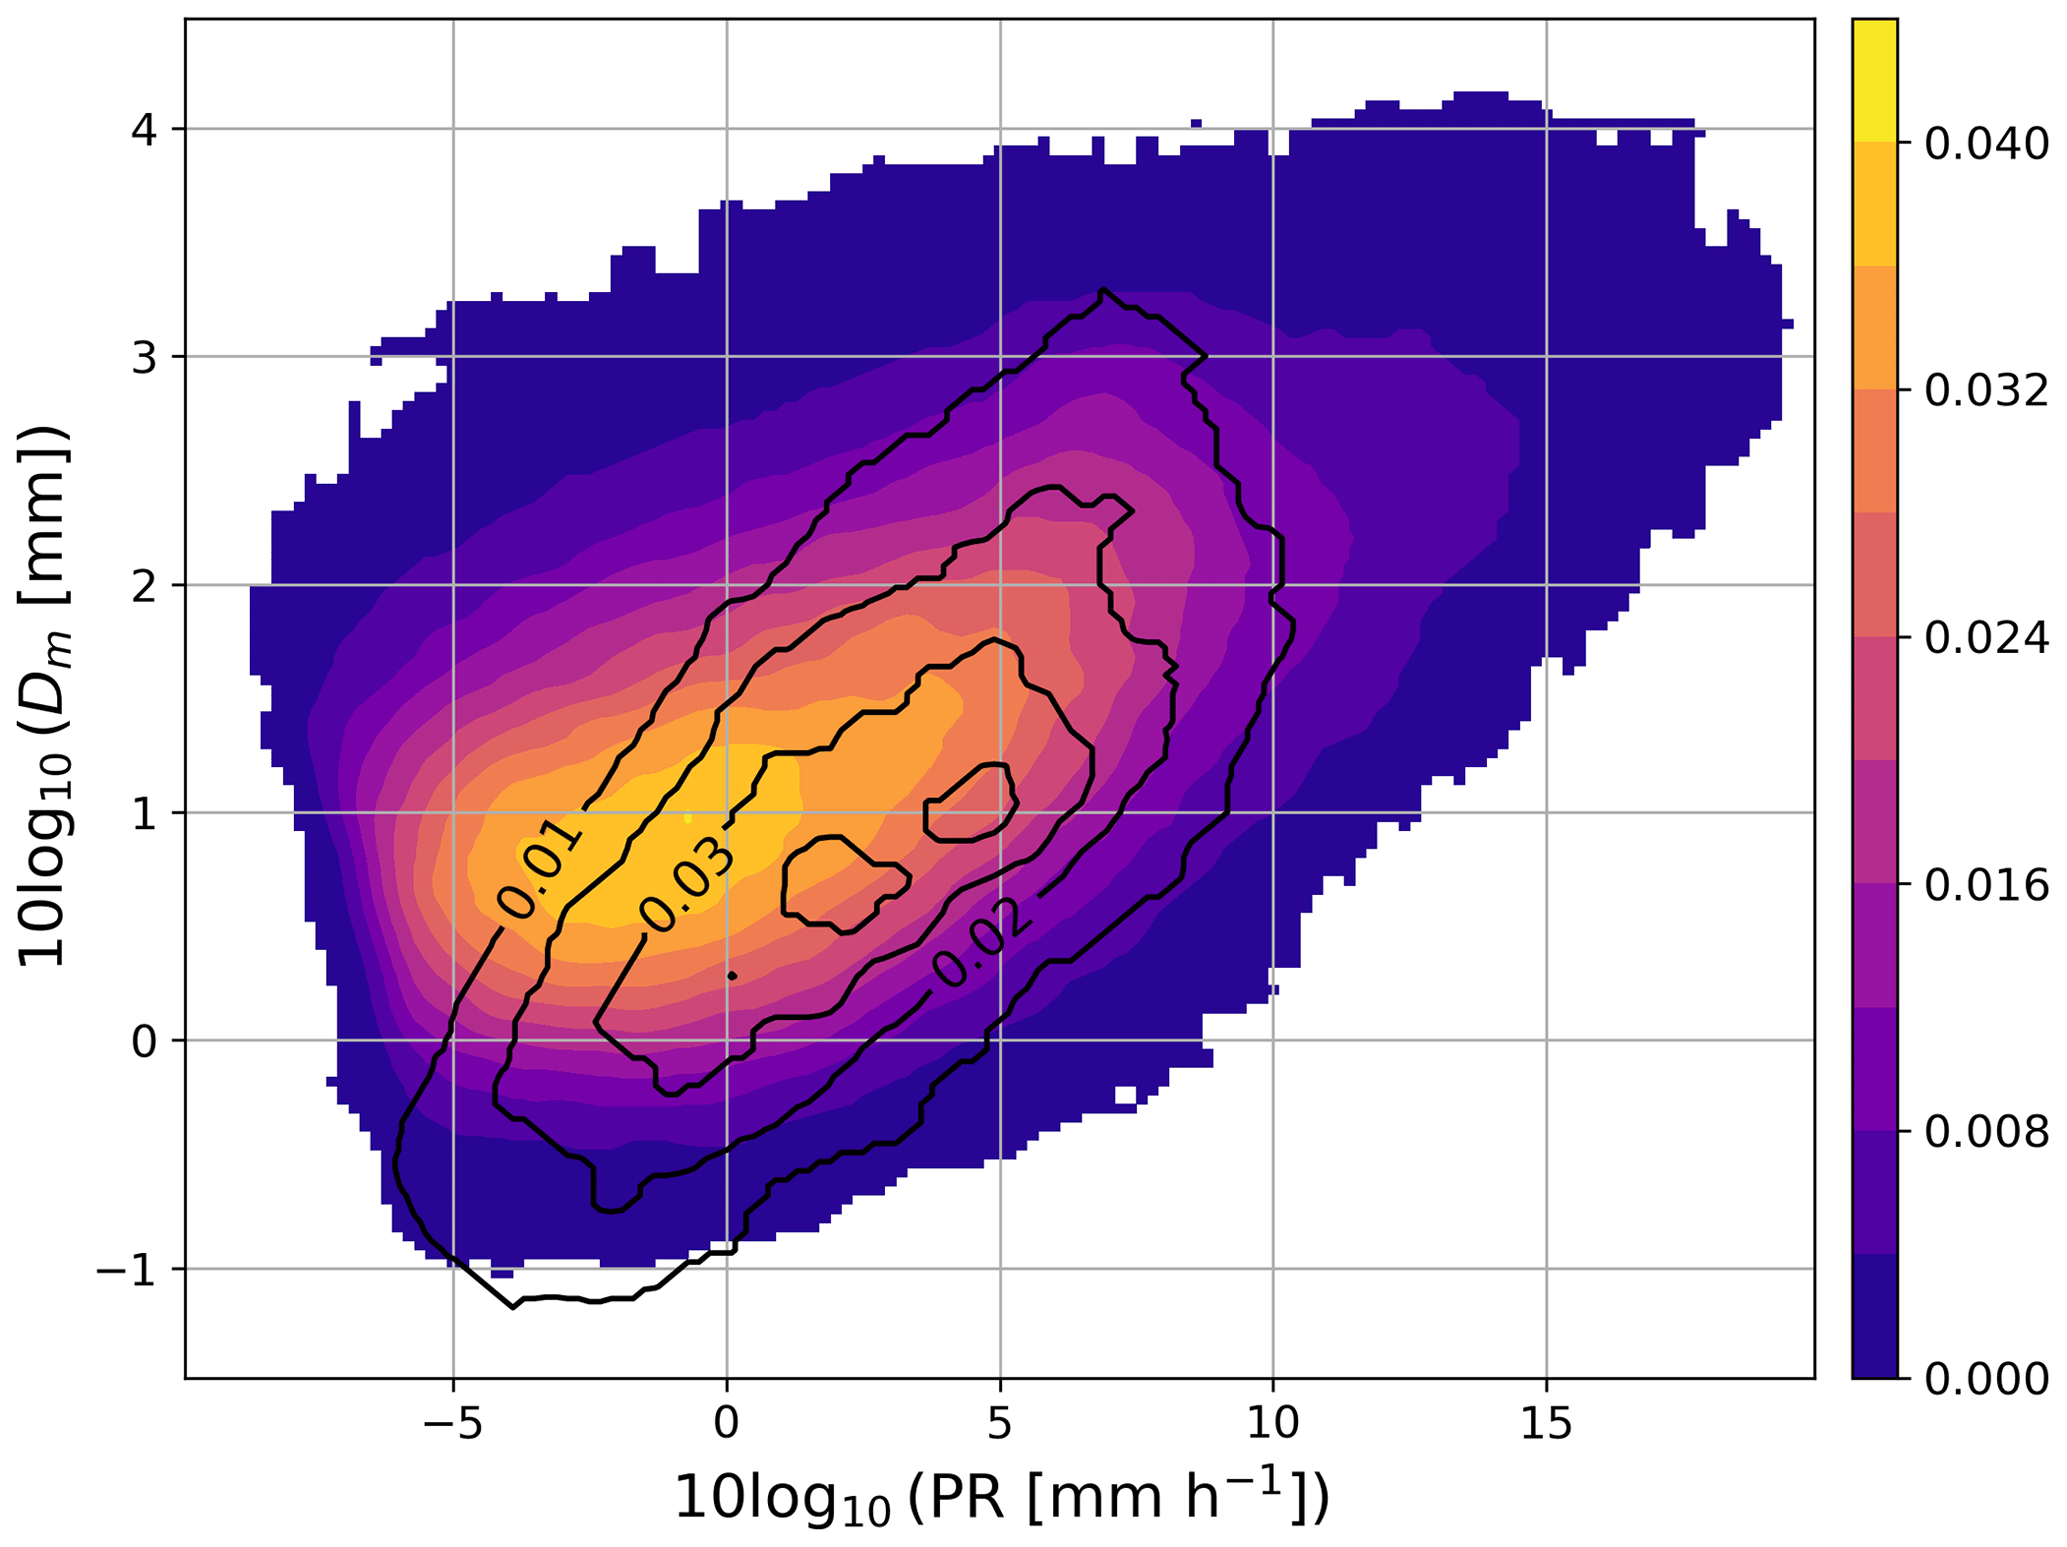
Figure 6Joint PDF of Dm and PR at GPM DPR resolution obtained through polarimetric radar retrieval. The retrieval is based on radar simulations of in situ DSD observations. In situ disdrometer data shown as a black contour line for comparison. Both PDFs include only samples where radar reflectivity at the S-band exceeds 15 dBZ.
In our analysis, we explore the statistical relations between the microphysical properties of rain derived from the polarimetric radar retrieval. These relationships are expressed in terms of the covariance matrix and the corresponding sample mean of the parameters under consideration:
It is important to note that and represent a priori assumptions made independently for each altitude level. To determine the contribution of the divergence of xph from the statistical mean to the cost function, as introduced in Eq. (19), we aggregate the components across all altitude levels.
To mitigate the influence of outliers in the dataset, a robust methodology known as the minimum covariance determinant (Butler et al., 1993) was employed for the analysis. It is important to note that 10log 10σm is not directly retrieved by the polarimetric product, and therefore disdrometer measurements were utilized to derive statistical information regarding this parameter. To improve the convergence rate of the OE algorithm, the dataset underwent principal component analysis (PCA) to diagonalize the matrix . Prior to PCA, data normalization was performed using the formula . The resulting principal components are as follows:
Each principal component explains 76 %, 20 %, and 4 % of the variability in the dataset, with corresponding explained variances of 2.29, 0.59, and 0.12, respectively. These principal components represent orthogonal directions within the microphysical properties space. The first principal component signifies the most probable direction of change when only one measurement is available, while the second principal component captures the correction introduced by an additional measurement.
4.2 The forward model and the measurements vector
To estimate microphysical properties of precipitation, it is crucial to understand their relationship with radar measurements. This requires a radar simulator that maps the physical characteristics of precipitation to radar observables. In our specific case, the forward model is responsible for mapping the microphysical parameters (PR, Dm, σm) to radar reflectivity at both the Ka- and Ku-band frequencies.
The equivalent reflectivity factor for a radar operating at wavelength λ (m) is given by
where σb is the backscattering cross-section of a particle (m2) and is the dielectric factor of liquid water at a reference temperature and frequency and is assumed to be equal to 0.9255 and 0.8989 for the Ku- and Ka-bands, respectively, as these values are used in the DPR Level-2 processing chain (Liao and Meneghini, 2022). The reflectivity is usually expressed in mm6 m−3 or, due to its high variability, in the logarithmic units of dBZ. Similarly, specific attenuation k (dB km−1) can be computed as
and the measured reflectivity at distance r is given by Eq. (1).
The path-integrated attenuation (PIA), represented by the integral provides valuable information about precipitation properties. However, estimating this quantity is challenging, particularly over land, due to surface variability. Nonetheless, a study by Meneghini et al. (2015) demonstrated that the difference in path-integrated attenuation between the Ka- and Ku-bands, denoted as δPIA, is less affected by surface variability and thus exhibits smaller estimation errors. Based on this finding, we have made the decision to include δPIA in the measurement vector, rather than individual PIA estimates.
The backscattering and extinction cross-sections of ice particles are modeled with the database of rimed snowflakes of Mroz and Leinonen (2023). The scattering characteristics of the simulated particles were calculated using the discrete dipole approximation (DDA), which is known to provide more realistic radar measurements compared to commonly used soft spheroids (e.g., Kneifel et al., 2015; Kulie et al., 2014; Leinonen et al., 2012). The database encompasses a wide range of ice densities and sizes, making it well-suited for our study. The bulk density of ice particles within the radar volume is characterized by the degree of riming, which is parameterized by a prefactor term (α) in the mass–size relationship of the form m(kg)=α(D(m))2. The database covers ice hydrometeors ranging from unrimed aggregates (α=0.01) to graupel-like particles (α=0.5). For a more detailed description of this conceptual model, please refer to Mroz et al. (2021a).
The scattering properties of liquid particles are computed with the T-matrix approximation, assuming the axial-ratio formula of Brandes et al. (2005). We do not explicitly model radar echoes within the melting region due to the complex scattering signatures and associated uncertainties involved. However, we account for the impact of the bright band on the measurements within the liquid phase below by simulating its extinction. Drawing from the findings of Matrosov (2008), we approximate the attenuation of the melting layer using a power-law formula based on the precipitation rate:
Here, γML and δML are wavelength-specific parameters. For the Ka-band, their values are 0.66 and 1.1, respectively. In the case of Ku-band simulations, we adopt the values obtained from X-band simulations, specifically 0.048 for γML and 1.05 for δML. Although we acknowledge that X-band attenuation is likely to be smaller than that of the Ku-band, we use it solely as a soft constraint or a priori value. The final attenuation estimate is subsequently refined during the OE iterations. In the study of Li and Moisseev (2019), it was suggested that synthetic simulations by Matrosov (2008) tend to overestimate attenuation for snowfall rates exceeding 2.5 mm h−1. However, their study was limited to radar measurements exhibiting clear signatures of supercooled clouds above the freezing level. This limitation implies that the study was restricted to rimed particles only. To accommodate potential variations in the melting-layer attenuation estimates, we operate under the assumption that they are subject to an uncertainty of a factor of 2 (see the next section). It is important to note that this approach focuses solely on simulating the extinction of the bright band and its influence on the measurements underneath.
4.3 Optimal-estimation concept
The inversion method presented here is based on the optimal-estimation framework (Rodgers, 2000), which aims at minimizing the cost function:
In our case, vector x consists of the PSD parameters, namely PR, Dm, and σm (as shown in Eq. 10), for both the ice and rain phases. Additionally, within the solid phase, parameter α, which quantifies ice density, is also retrieved. Notably, all microphysical parameters are estimated in the logarithmic space by employing the x↦10log 10x transformation of the physical quantities. This approach serves two purposes: preventing unphysical retrievals and promoting linearity in the forward model. It is assumed that 10log 10α changes linearly from the cloud top, where it is equal to −20, to the melting layer. Furthermore, the vector of unknowns includes an additional parameter, denoted as BBext, which characterizes the correction of the attenuation formula (18) within the BB region. This parameter accounts for uncertainties in the parameterization by multiplying the attenuation estimates at both the DPR frequencies. In summary,
The covariance matrix terms corresponding to the physical quantities are provided by Eq. (11). Similarly, the a priori value at a given altitude level is given by Eq. (12). The a priori estimate for 10log 10α is determined based on the radar measurements. We obtain the expected values of the precipitation rate, size, and shape parameters by aligning the Ku-band reflectivity measurements below the melting level with the reflectivity simulations along the direction given by the first principal component (Eq. 13). The other two principal components are set to 0. Once this one-dimensional search yields the best match, we calculate radar reflectivity in ice for different values of α, assuming that microphysical parameters remain constant within the melting zone. The value of α that provides the best fit to the measurements, weighted by their corresponding uncertainties, is selected as the a priori estimate. We assume that the standard deviation of this estimate is equal to 3 dB. The uncertainties in and are assumed to be 3 dB and 4 dB, respectively. A priori estimates of and are provided by Eq. (18).
The function F is the aforementioned forward model that transforms physical quantities into attenuated reflectivity at both bands and the differential PIA. The vector y consists of the measured values of Z and the differential PIA that are corrected for attenuation by non-precipitating particles and atmospheric gases (Kubota et al., 2020). The matrix is an inverse of the measurement error covariance matrix, and it is used as a weighting factor for individual observables. We assume that Sm is diagonal and the uncertainty in the DPR reflectivity at both channels is estimated by the formula given by Hogan et al. (2005), which gives 0.5 dB uncertainty for data with a high signal-to-noise ratio. The uncertainty in the estimated differential PIA is assumed to be 5 times the uncertainty in the PIA at the Ku-band in the DPR Level-2 product, following the assumption that PIAKa=6PIAKu.
To fully utilize the potential of principal component analysis (PCA), we transform the estimation problem of physical quantities into the space of principal components. This linear transformation ensures that both approaches are equivalent. The transformation can be expressed by the following equation:
where P is a matrix whose columns are the principal components, i.e., ; a is a vector in the principal component basis; ⊙ denotes element-wise multiplication; and × represents matrix multiplication.
An example of the OE retrieval is presented in Fig. 7. The rain component aligns with the overall structure observed in the DPR product, featuring distinct elements of a squall line system – a convective core, a transition zone, and stratiform precipitation – viewed from east to west. However, the range of retrieved parameters is smaller compared to the DPR algorithm, even within stratiform rain profiles. This discrepancy is mainly caused by differences in the differential attenuation fitting between the two algorithms. The DPR product tends to overestimate this parameter as it tries to compensate for the non-uniform beam-filling effect, while our product does not incorporate this correction. It must acknowledged that the reliability of the OE product is questionable in convective precipitation, given its design for stratiform precipitation. Consequently, the presence of artifacts at approximately 5 km altitude (a peak in Dm and PR) within the convective core should not come as a surprise.
Figure 7Mean mass-weighted melted-equivalent diameter (Dm) and precipitation rate (PR) as estimated by the optimal-estimation algorithm for the storm depicted in Fig. 1.
In the ice phase, the OE algorithm tends to yield a larger precipitation rate than the DPR product. Both PR and Dm reach their peaks above the melting zone and remain relatively constant in rain; that is, the majority of the growth occurs within the ice phase. Moreover, compared to the DPR product, the precipitation structure in the ice phase is not affected by strong discontinuities during the transition from one profile to the other, although no constraints on horizontal variability were imposed.
4.4 Similarities and differences with the DPR product
In spite of the distinct mechanics employed by our algorithm, specifically our reliance on the optimal-estimation framework, and the iterative nature of the DPR product, which primarily aims at fitting the measurements, there exist notable similarities between these two approaches. For instance, the utilization of principal components in our method shares an underlying idea with the PR–Dm relationship. The principal components determine orthogonal directions within the space of microphysical parameters while providing insights into which component is most likely to change. The first principal component, for instance, represents the direction that undergoes the most significant changes as it is characterized by the largest variance, by definition. Variations along this principal component can be likened to imposing the PR–Dm relationship, a step analogous to the approach adopted in the DPR product. A noteworthy similarity arises when altering the second principal component; this modification influences the PR–Dm relationship, akin to the ϵ adjustment implemented in the DPR product. Despite these similarities, our approach offers a distinct advantage – a priori knowledge regarding the natural variability in these relationships, quantified by their respective standard deviations. This insight allows for a more nuanced understanding of how these relationships may vary in real-world scenarios.
Another notable similarity between our algorithm and the DPR product lies in the approach to assimilating the measured reflectivity. Traditionally, the measured reflectivity is corrected for attenuation prior to microphysical retrievals (e.g., Vulpiani et al., 2006). Both our and the DPR algorithm adopt this step solely to obtain the initial guess. Subsequently, an iterative procedure is initiated, and the distribution of microphysical parameters within the column is modified to align with the measured reflectivity. Both algorithms employ a top-down approach, estimating attenuation caused by various hydrometeors from scattering tables. The attenuation accumulates along the propagation path until reaching the surface. The total PIA estimate serves as a crucial constraint for both algorithms, ensuring the stability of the iterative process. The difference lies in the modeling of the melting layer. In our approach, we solely estimate the attenuation caused by melting particles using the parameterization of Matrosov (2008). In contrast, the DPR product simulates the melting particles and their associated scattering properties within the melting zone. This simulation yields reflectivity and hydrometeor property profiles within the melting zone. In our case, hydrometeor properties are obtained solely through continuity, and no measurements are simulated within the melting zone.
It is essential to highlight a nuanced difference in our algorithm compared to the DPR product. Our algorithm is designed to simultaneously fit the measured reflectivity at the Ku- and Ka-bands, alongside the differential PIA estimate. Conversely, the DPR product appears to prioritize fitting the Ku-band reflectivity. This prioritization is justified due to challenges in simultaneously fitting both channels under non-uniform conditions (Mroz et al., 2018). Notably, our algorithm is tailored for stratiform rain scenarios, where such conditions are minimized, while the official DPR product is designed to be a versatile one-for-all approach.
The primary distinction between the two algorithms centers on how ice is modeled. Our approach employs the simulation of realistic ice hydrometeors, complemented by discrete dipole simulations of scattering properties. In contrast, the DPR product adopts “soft-sphere” simulations, representing ice particles as a uniform mixture of air and ice. In this case, scattering simulations can be approximated using Mie theory. However, it is essential to emphasize that the primary difference in our approaches is not the shape of the particles or the scattering simulation methodology. What sets our algorithm apart is the capacity of the OE algorithm to accommodate changes in the density of ice particles, while the DPR product maintains a fixed density of spherical air–ice mixtures at 0.1 g cm−3. This unique flexibility allows the OE algorithm to search for solutions that ensure continuity in the water mass flux through the melting zone. Importantly, this coherence in the fluxes is achieved without sacrificing the continuity of the melted-equivalent size, and it is obtained with the radar measurements matching. The ability to adjust ice particle density provides a crucial advantage, enabling our algorithm to navigate to a physically consistent solution more effectively.
The optimal-estimation algorithm underwent testing to see if it achieves its core retrieval objectives, which include ensuring continuity in precipitation properties and evaluating the accuracy of simulated reflectivity against actual measurements. A summary of this testing is presented in Fig. 8. Notably, our algorithm yields a narrower range of retrieved raindrop sizes compared to the DPR product, and when examining the regression line, it suggests a more substantial increase in precipitation size during the melting phase. It is worth noting, however, that the observed increase consistently remains below 30 %, whereas the DPR product showed an approximate 15 % increase.
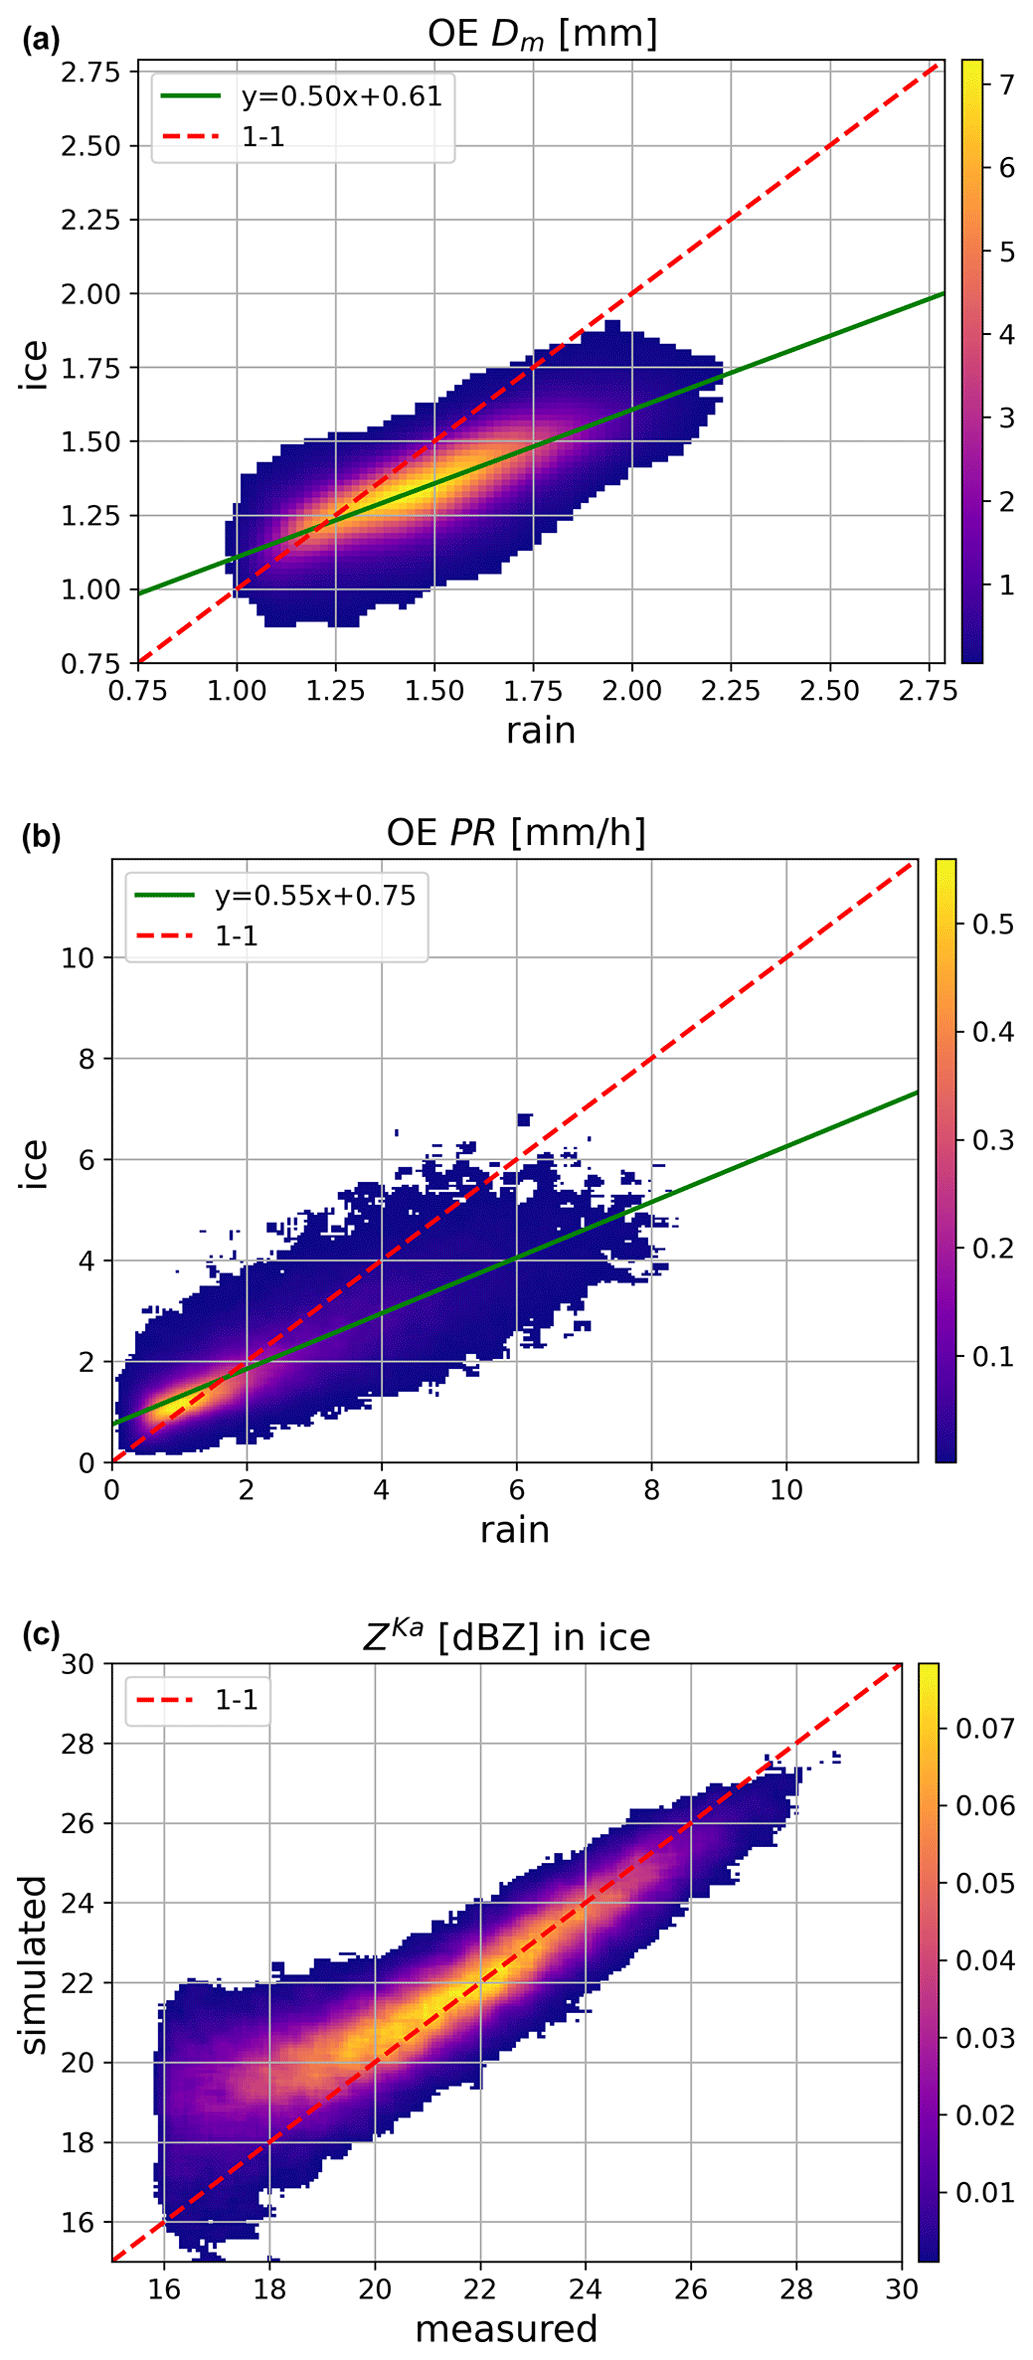
Figure 8Panels (a) and (b) display joint PDFs for OE retrieval results both above and below the melting zone. A green line signifies a linear fit through the most frequently observed values for the variable x. Panel (a) depicts Dm, panel (b) shows PR, and panel (c) illustrates PDFs for measured and simulated Ka-band reflectivity values, differentiating between regions above and below the melting zone.
Notably, our product improves the coherence between precipitation rates above and below the melting zone. Similar to the DPR product, there is an increase in the water mass flux during the transition from ice to rain, but in our case, this increase is more subdued. Upon examining the regression lines, the expected snowfall rate above the melting zone, with 10 mm h−1 of rainfall underneath, equals 6 mm h−1 for our product and 3 mm h−1 for the DPR product.
Overall, the mean fractional bias (MFB), defined as
is equal to 4 % and 106 % for the OE and the DPR algorithms, respectively. Using DPR precipitation rates in rain as the reference for our product, the snowfall rate is on average 30 % smaller than the rainfall rate underneath.
In the validation study conducted by Chase et al. (2022), it was demonstrated that the neural network snowfall algorithm (Chase et al., 2021), designed specifically for the DPR, exhibits improved agreement between snow- and ice-phase precipitation rates compared to the DPR product. Their algorithm almost perfectly aligns with the mass flux between the phases, showing only a 2 % difference. This underscores the remarkable success achievable with artificial intelligence algorithms when trained using the right database. However, it is crucial to note that its accuracy is contingent on the precision of the attenuation correction, particularly at the Ka-band, which is more susceptible, especially in heavy-precipitation conditions.
While our algorithm does not achieve a perfect precipitation rate match between different water phases, it brings about noticeable improvement compared to the DPR product. The algorithm's development is still in its early stages, and ongoing adjustments in the code are expected to reduce this discrepancy. Preliminary tests have been conducted, revealing that the continuity of the mass flux through the melting zone can be enhanced at the expense of the continuity of the melted-equivalent size. However, it remains debatable which of these two properties exhibits less variability within the melting zone, and this should be a topic for future studies. Furthermore, it is important to acknowledge that some changes in the precipitation rate may still occur within the melting zone, resulting in an anticipated growth in the precipitation rate. The extent of this change depends on environmental conditions such as relative humidity and temperature profiles (Heymsfield et al., 2018b).
Upon evaluating the Ka-band reflectivity simulations in the ice-phase region, we observe that our algorithm demonstrates improved accuracy when compared to the official product (as shown in Fig. 5). Our simulations exhibit an absence of bias. In fact, the majority of our simulated values closely align with the measured values, typically falling within a range of just 1 dB. Having said that, it is important to note that the reflectivity values below the 20 dBZ threshold exhibit higher uncertainties. In the current version of our algorithm, we consider these measurements as marginally reliable, and accordingly, we do not expect the algorithm to fit them well.
The validation of the OE algorithm was exclusively conducted within the rainy portion of the radar profiles. This might appear surprising, given the anticipated improvement in algorithm quality compared to the DPR product above the freezing level. However, this approach is expedient due to the limited availability of DPR underflights within snow during stratiform precipitation events. To the best of our knowledge, only one flight was conducted throughout the entire OLYMPEX campaign, and this singular event was utilized in the study by Chase et al. (2021). In their study, only a qualitative assessment of the product was conducted, refraining from direct comparisons due to disparities in sampling time during in situ flights and significant differences in sampling volume. The discrepancy in sampling time arises from the high ground track speed of the satellite (7 km s−1) compared to approximately 600 km h−1 of an in situ aircraft. Consequently, within a 10 min window, only 20 validation points are collected. This raises a critical question about the representativeness of the sample and the robustness of potential statistical comparisons. Moreover, in situ sampling may be inadequate to sufficiently represent the entire radar volume, given its proximity to a one-dimensional cut through a km3 volume. The impact of this difference in sampling volume could potentially be mitigated with the collection of large statistics, as discrepancies in the sampling volumes would result in random noise only. However, as pointed out earlier, collecting these statistics is impractical due to the limited number of validation points per flight, making such an effort very expensive. Chase et al. (2021) overcame this issue by utilizing airborne radar data at finer horizontal and vertical resolutions for more robust statistics. While we acknowledge their efforts, it is crucial to note that airborne data differ significantly from spaceborne measurements. Airborne data exhibit superior sensitivity, resolution, and reduced signal fluctuations. Additionally, they are less affected by non-uniform beam-filling effects compared to satellite measurements. The validation presented here served as a sanity check, aiming to assess whether a physically consistent retrieval could be achieved without compromising the integrity of the DPR rainfall product.
We employed the state-of-the-art polarimetric retrieval method, relying on ground-based radar measurements as our reference dataset. Our choice of this validation strategy is driven by the fact that a single radar network covers a much larger area compared to the collective measurement coverage of all rain gauges worldwide. Furthermore, due to the short correlation lengths of precipitation patterns, rain gauges cannot accurately represent instantaneous precipitation rates.
For our validation, we chose a dataset from Gatlin et al. (2020) specifically designed for GPM validation. This dataset offers quality-controlled dual-polarimetric radar moments and corresponding polarimetric estimates of DSD parameters, such as Dm and PR, obtained from approximately 100 radar systems worldwide. The dataset is based on the concept of matching spaceborne and ground-based radar volumes that was originally introduced by Schwaller and Morris (2011). High-horizontal-resolution DSD moment data (with a resolution of 250 m and 1° in range and azimuth, respectively) are averaged to generate GPM DPR footprint matches. Similarly, an averaging of the DPR data, known for its high vertical resolution, is applied to align with the ground-based radar volumes. The validation is performed with all the collocated radar volumes that are not contaminated by the ground clutter or melting-layer signatures.
A comparison between the horizontal resolution of the DPR system and that of a US ground-based radar is illustrated in Fig. 9. The correlation between the two radar fields is noteworthy. Nevertheless, owing to its higher horizontal resolution, the ground-based data reveal much finer structures, particularly noticeable in the convective cells situated in the southeastern part of the precipitation area. It is important to highlight that the ground-based radar exhibits greater sensitivity, enabling the validation of DPR precipitation retrieval across the full range of detectable signals. Additionally, at short ranges, where the radar beam volumes are close to the ground, the issue of precipitation overshooting is minimized.
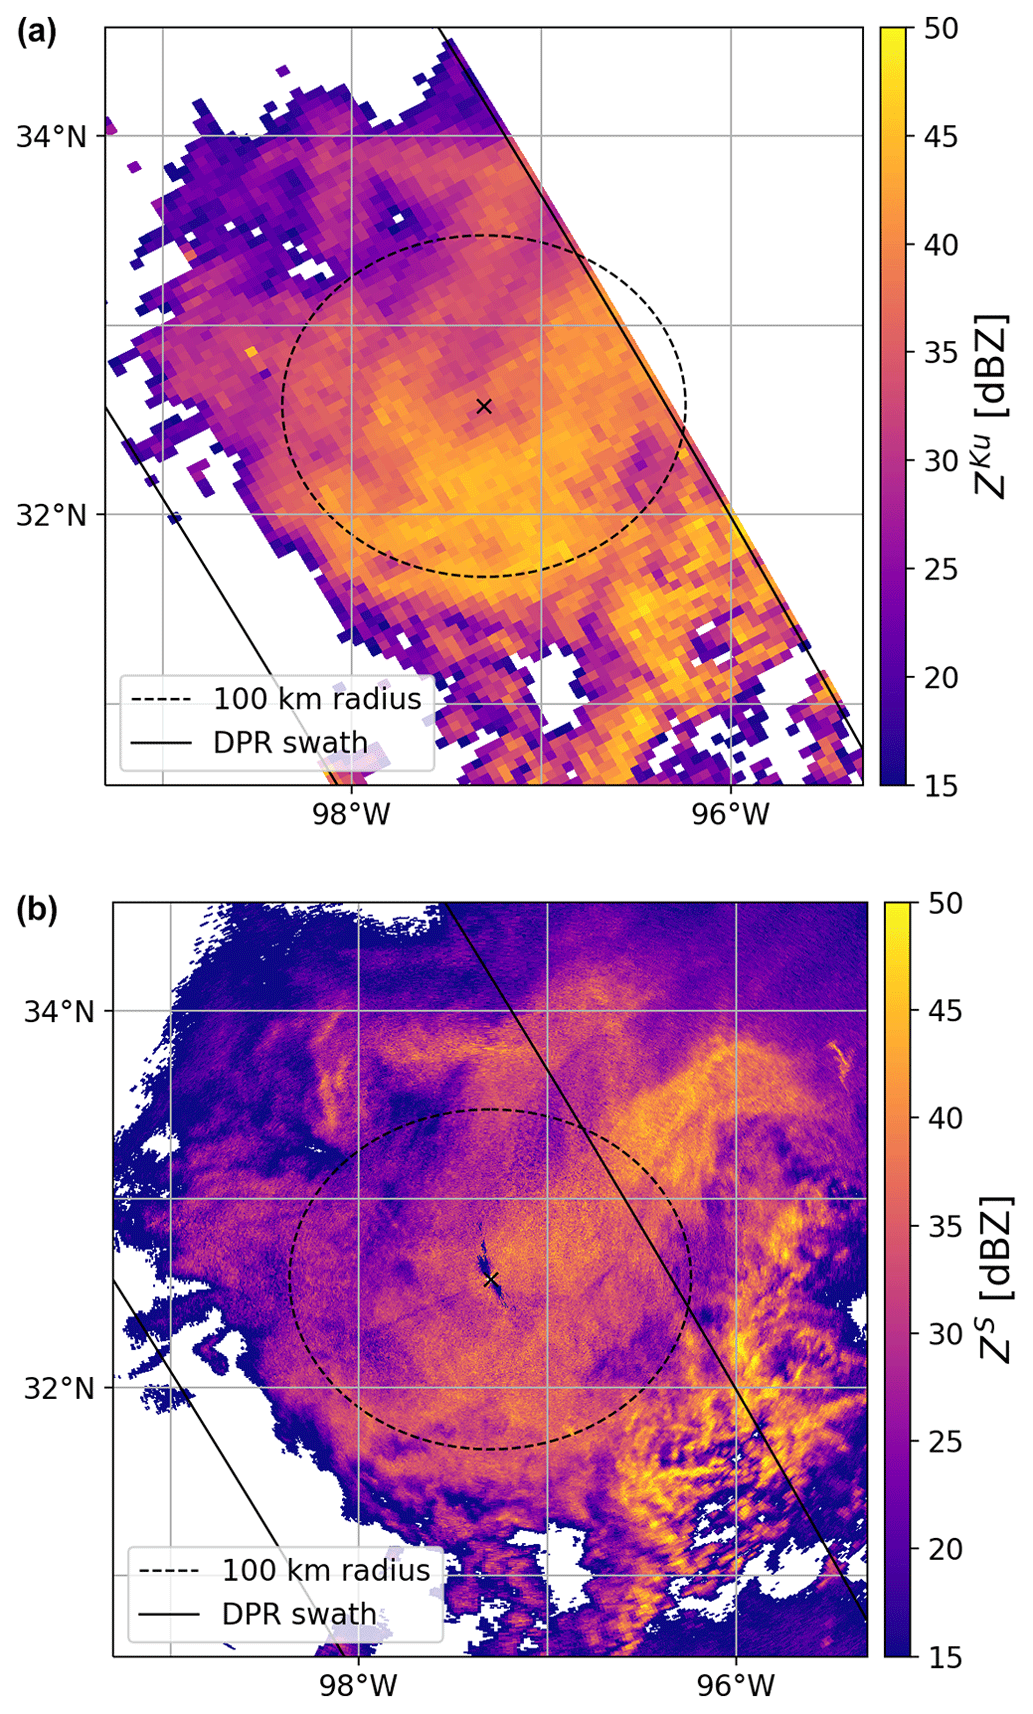
Figure 9(a) Ku-band radar reflectivity at an altitude of 3 km a.s.l., as observed by the DPR. (b) S-band reflectivity obtained from the lowest elevation scan (0.5°) conducted by the ground-based radar situated in Dallas, US (KFWS). These measurements are associated with DPR orbit number 11525, which passed over the storm being observed at around 10:10 UTC on 23 July 2018. The continuous black lines indicate the edges of the DPR swath, while the dashed line shows a 100 km radius from the ground-based station.
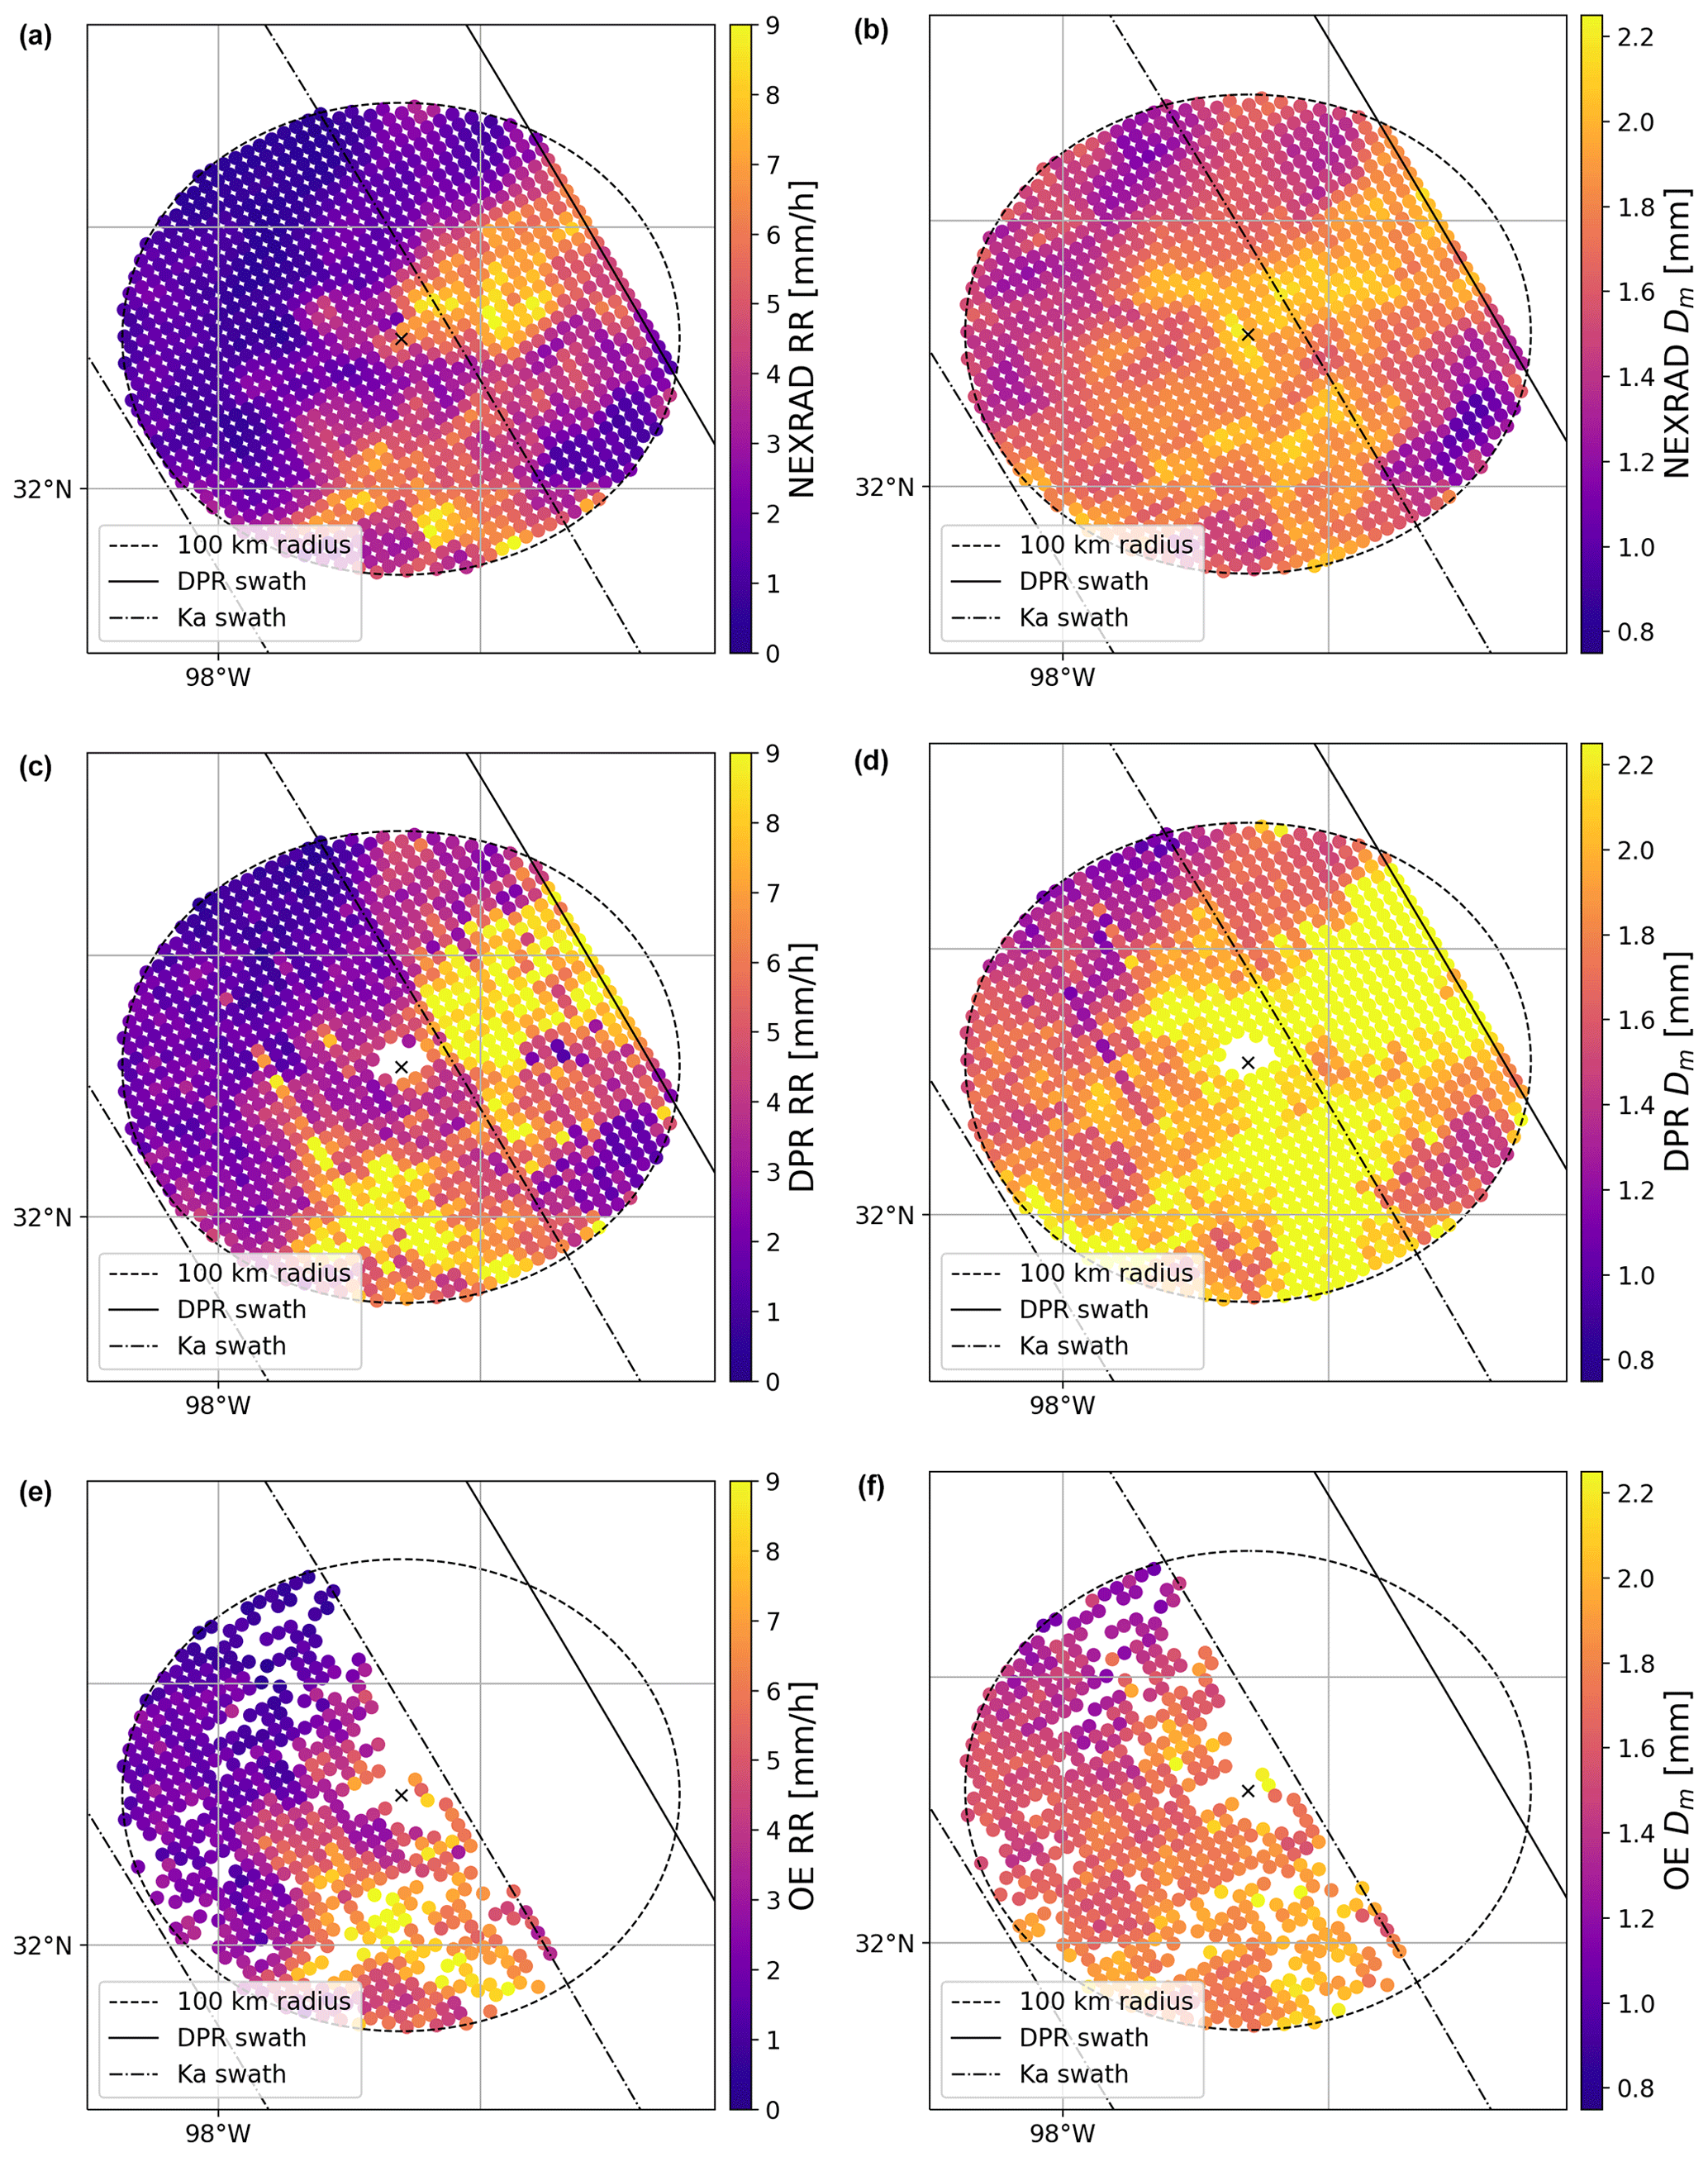
Figure 10Microphysical precipitation retrievals within the matched radar volumes at the lowest available altitude. The data are confined within a 100 km radius from the ground-based station to preserve high vertical resolution. The dash-dotted line indicates the edge of the inner swath where the Ku- and Ka-band radar perform collocated measurements. The continuous line shows the edge of Ku-band swath. Panels (a), (c), and (e) show the precipitation rate, while panels (b), (d), and (f) show the precipitation size Dm. (a, b) Dual-polarization retrieval from the ground-based station; (c, d) DPR rain rate product; (e, f) OE-derived precipitation rate. NEXRAD: Next Generation Weather Radar.
The left column in Fig. 10 illustrates rain rate retrievals within a 100 km radius from the ground-based station, focusing on the radar-matched volumes at the lowest available altitude. The dual-polarization rainfall product is derived using the methodology presented in Cifelli et al. (2011). A visual examination of the DPR precipitation product for this event indicates an overestimation of high rainfall rates. However, this overestimation is less pronounced within the matched-scan (MS) swatch, where Ku- and Ka-band radars closely collocate in both space and time. This observation highlights the superior performance of the dual-frequency algorithm compared to the Ku-band-only product. The OE algorithm was exclusively applied to columns within the MS swath, where the bright band was distinctly detected by the DPR algorithm. This results in gaps in the image compared to the DPR product. Nonetheless, despite these challenges, the storm structure closely resembles that of the polarimetric product. It is important to note that we cannot assess its performance within the strongest echoes, as they were classified as convective profiles and, consequently, were not processed by our algorithm.
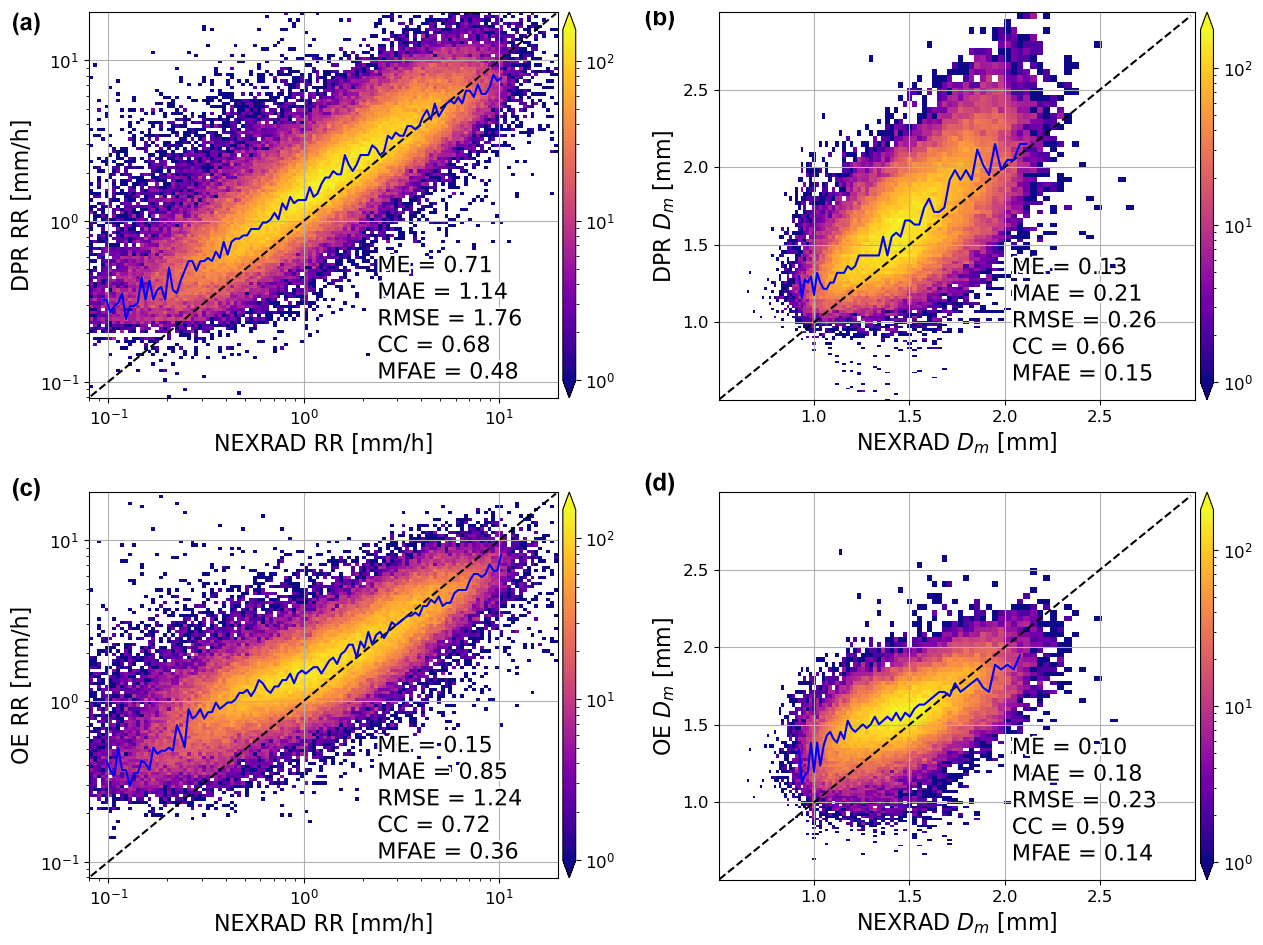
Figure 11Statistics for 1 year of the DPR and OE algorithms compared to the collocated polarimetric radar product. Panels (a) and (c) represent the precipitation rate product, while panels (b) and (d) display the characteristic size estimate. Panels (a) and (b) represent the DPR V06 product, while panels (c) and (d) correspond to the OE algorithm. Statistical quantities are computed for radar volumes where the precipitation rate falls within the range of 1 to 10 mm h−1. ME: mean error, MAE: mean absolute error, RMSE: root mean square error, CC: correlation coefficient, MFAE: mean fractional absolute error.
A similar case study analysis was conducted for the retrieval of the characteristic size. The polarimetric Dm algorithm is based on the methodology introduced by Tokay et al. (2020). Much like the situation encountered with rainfall rate (RR), the DPR retrieval of Dm often leads to an overestimation of larger drop sizes. This phenomenon can be attributed to the assumption made about the shape of the drop size distribution (DSD). The algorithm operates under the assumption of a constant value for the shape parameter μ, which is fixed at 3. However, recent studies by Williams et al. (2014) and Protat et al. (2019) have demonstrated that, statistically, the shape parameter decreases as the characteristic size increases. Consequently, relying on a constant value for μ may not be suitable and can result in inaccurate representations of the DSD, ultimately leading to biases in reflectivity simulations. It is important to note that, once again, the OE algorithm was not applied to columns with the largest sizes. However, it is evident that the range of retrieved sizes is smaller compared to the DPR product, and it aligns better with the ground-based algorithm.
To conduct a more comprehensive assessment of the retrievals, we analyzed data spanning an entire year, specifically from 2016. In this analysis, we exclusively focused on DPR columns within the MS swath. Furthermore, all the profiles selected for this study exhibited the presence of the bright band. These criteria were established to ensure that both algorithms were applied to the same set of profiles, enabling a fair and direct comparison between the OE and DPR methodologies. We utilized data from the GPM ground validation program in version 2.4 for this exercise. This dataset is independent of the one that was used to derive a priori statistics on Dm, PR, and σm, as they were derived using the data from 2015. This statistical assessment of the spaceborne algorithms with the ground-based product as a reference is presented in Fig. 11.
The performance of both the DPR and OE rainfall rate retrieval methods exhibits clear similarities. In direct comparison with the polarimetric rainfall products, both approaches tend to exhibit certain systematic biases. They both have a tendency to overestimate small rainfall rates, while simultaneously underestimating high rainfall rates. However, within the range of precipitation rates specified by mission requirements, i.e., between 1 and 10 mm h−1, some differences between the algorithms emerge.
Within this range of precipitation rates, our retrieval method demonstrates somewhat improved statistical performance. This superiority is characterized by a smaller mean error, which arises from the counterbalancing effect of underestimation for larger precipitation rates and overestimation for smaller ones. In essence, our product achieves a more balanced representation within this precipitation rate range, leading to an improvement in overall accuracy of the rainfall accumulation estimates.
In terms of statistical metrics, our product exhibits slightly improved performance with a smaller mean absolute error and lower root mean square error, measuring at 0.3 and 0.52 mm h−1, respectively. While these improvements are notable, it is important to emphasize that they do not represent an impactful deviation from previous methods. Moreover, our product overestimates low rain rates more than the official algorithm. One of the key indicators demonstrating our product's improved performance is the mean fractional absolute error, which has seen a decrease from 0.48 to 0.36. This reduction corresponds to a 12-percentage-point improvement in the fractional error. These results highlight the effectiveness of our approach in providing rainfall rate estimates that match or even exceed the performance of the official GPM product.
The retrieval of the characteristic size exhibits patterns akin to those observed in precipitation rate retrievals. In both the DPR and OE products, there is a tendency to overestimate smaller sizes, while underestimating larger ones. This phenomenon is likely a consequence of maintaining a constant shape parameter assumption within the drop size distribution parameterization. Given that the shape parameter typically decreases as size increases (Williams et al., 2014), the persistence of a constant value may introduce biases into the retrieval process. In the case of the OE algorithm, this behavior can be attributed to the inherent nature of Bayesian algorithms. Firstly, they narrow the range of retrieved parameters by penalizing large deviations from the statistical mean. Secondly, this penalty is more pronounced for smaller sizes, which correspond to lower reflectivity values characterized by higher uncertainties. Consequently, these smaller reflectivity values contribute less to the final estimate, reinforcing the observed overestimation of smaller characteristic sizes.
When we narrow our statistical analysis of the Dm retrieval to radar volumes falling within the predetermined mission requirements for precipitation rates, we notice a marginal enhancement in error metrics when compared to the DPR product. Specifically, the mean error, mean absolute error, and root mean square error all exhibit a reduction of 0.03 mm, suggesting a slight improvement in accuracy. Additionally, the mean fractional absolute error sees a modest decrease of 1 percentage point, although it is important to note that the correlation coefficient experiences a marginal decline of 0.07. These observations underscore the fact that the proposed methodology effectively matches the performance of the DPR retrieval, demonstrating its reliability within the specified mission requirements.
This paper introduces a novel algorithm designed for the retrieval of microphysics information within cold-rain precipitation regions. Several findings and insights are unveiled throughout the course of this study.
Firstly, the algorithm effectively transfers microphysics data from the rain phase to the snow phase situated above the melting layer. This approach ensures a physically consistent retrieval of precipitation properties, which is a critical advancement in comparison with the Dual-frequency Precipitation Radar (DPR) operational product. Furthermore, the incorporation of variable ice density within the algorithm emerges as a crucial factor in improving the agreement between radar simulations and observations from the DPR, especially in regions adjacent to the melting zone. This aspect of the algorithm increases the likelihood that the derived physical properties align more closely with real-world conditions, further ensuring its accuracy.
The study reveals a tendency of the OE method to overestimate rain size for small raindrops, shedding light on a limitation in the retrieval of rain characteristics that warrants further investigation and refinement. It is expected that this issue is related to the way the Bayesian statistics work. Small raindrops occur for low-reflectivity measurements that are characterized by higher uncertainty. This increases relative importance of the a priori assumptions, and the algorithm drifts toward the statistical mean of the precipitation characteristics rather than fitting the measurements. Moreover, due to sensitivity of the Ka-band system, in the low-reflectivity regions, our retrieval is often limited to single-frequency data, which may result in poorer quality of the product. The algorithm is still in the development stage, and this paper serves as a proof of concept only. The influence of a universal a priori assumption on the accuracy of rain rate estimations, particularly in low-reflectivity conditions, is still being investigated, and intensity-dependent approaches as in Tridon et al. (2019) and Battaglia et al. (2015) are under consideration.
While recognizing the significance of matching the performance of the DPR product in rain regions, the primary emphasis of this study is directed towards the retrieval of ice-phase characteristics above the melting zone, which remains a limiting uncertainty in simulations of weather and climate (Sullivan and Voigt, 2021). This novel algorithm not only achieves similar performance compared to existing approaches in retrieving rain properties but also offers a more physically consistent retrieval of the continually evolving characteristics of precipitation within the melting zone. This advancement opens new possibilities for quantifying ice density, particularly in the proximity of the freezing level, which holds important implications for our understanding and prediction of mixed-phase precipitation phenomena.
In this study, we deliberately omitted the consideration of multiple scattering in the radar observations at the Ka-band for two primary reasons. Firstly, this simplification was implemented to enhance the algorithm's computational speed, making it more efficient for practical use. Secondly, it is worth noting that multiple scattering events occur in highly unusual circumstances, particularly in convective precipitation, as documented in previous research (Battaglia et al., 2014). These events occur when the attenuation coefficient exceeds the reciprocal of the radar beam width and the scattering albedo is notably high (Battaglia et al., 2010). For the DPR system, such conditions typically arise within the ice phase when precipitation rates surpass 12 mm h−1 for graupel and 40 mm h−1 for aggregates of dendrites. As these conditions are rare in cold rain, we deemed them unlikely to impact the majority of precipitation scenarios. However, it is essential to acknowledge that should the need arise, these effects can be accounted for by incorporating the methodology developed by Hogan and Battaglia (2008).
In order to enhance radar performance analysis, the authors employ ground-based data to develop a non-uniform beam-filling (NUBF) radar simulator. Present efforts primarily concentrate on simulating radar reflectivity and attenuation at both the Ku- and Ka-bands, matching the resolution of the ground-based radar stations. These simulations, in conjunction with microphysical rain properties, are averaged over the DPR footprint size, resulting in a comprehensive radar simulator tailored to target heterogeneous scenes. It is important to acknowledge that this approach does not consider the potential shadowing effect in the attenuation field, as described in Short and Iguchi (2011), and is equivalent to a complete decorrelation of precipitation fields at various levels. Nevertheless, it represents an initial step in addressing the NUBF problem.
In the future development of our algorithm, we are contemplating the strategic utilization of the synergy between spaceborne and ground-based measurements to enhance both spatial and vertical resolution. Rather than pursuing an approach focused on upscaling the resolution of radar volumes, our vision centers on refining the retrieval process by harnessing the distinct advantages offered by these two complementary systems. While one system excels in delivering precise vertical resolution, the other boasts exceptional horizontal resolution. Our objective is to leverage this harmonious pairing to elevate our retrieval capabilities, ultimately enabling us to derive precipitation quantities at a finer scale. This forward-looking strategy holds the potential to improve the accuracy and precision of our precipitation retrievals, pushing the boundaries of what is achievable in the fields of remote sensing and meteorology.
The realization of this enhancement necessitates a precise collocation of measurements in both space and time. While spatial collocation poses minimal challenges, temporal alignment remains a considerable concern. Ground-based radar volume scans typically span approximately 5 min, introducing temporal discrepancies. Until rapid scans from phased-array radars become available, our precipitation model employed in the retrieval must accommodate factors like advection. This entails assimilating data from multiple radar volumes into the algorithm or implementing corrections for system movements, such as utilizing optical-flow techniques (Pulkkinen et al., 2019). By integrating these advancements into the optimal-estimation process, we can establish pseudo-triple-frequency retrievals, offering exceptional potential as validation datasets. Moreover, these retrievals can serve as valuable training data for upcoming radar missions, such as Tomorrow.io, that rely on data-driven machine learning approaches. This collaborative approach holds the promise of advancing the accuracy and effectiveness of our precipitation retrieval methods, marking a pivotal step in meteorological research and remote sensing technology.
The optimal-estimation algorithm along with the scattering tables used in this study is publicly available at https://doi.org/10.5281/zenodo.10805217 (Mroz, 2024).
The database of single-scattering properties of rimed aggregates can be found at https://doi.org/10.5281/zenodo.7510186 (Mroz and Leinonen, 2023). GPM data are freely available subject to registration from NASA servers (https://doi.org/10.5067/GPM/DPR/GPM/2A/06, Iguchi and Meneghini, 2017). The GPM ground validation data were obtained from https://doi.org/10.5067/GPMGV/WFF/MULTIPLE/DATA101 (Petersen, 2021).
KM developed the retrieval algorithm, led the writing of the manuscript, and prepared all figures. AB assisted in developing the methodology and provided editorial comments. AMF contributed to the scientific discussion and provided an initial draft of the paper.
The contact author has declared that none of the authors has any competing interests.
Publisher’s note: Copernicus Publications remains neutral with regard to jurisdictional claims made in the text, published maps, institutional affiliations, or any other geographical representation in this paper. While Copernicus Publications makes every effort to include appropriate place names, the final responsibility lies with the authors.
Work done by Kamil Mroz and Alessandro Battaglia was performed under a contract with the National Centre for Earth Observation. This research used the ALICE High Performance Computing facility at the University of Leicester.
This research has been supported by the National Centre for Earth Observation (grant no. RP18G0088).
This paper was edited by Gianfranco Vulpiani and reviewed by two anonymous referees.
Ackerman, A. S., Fridlind, A. M., Grandin, A., Dezitter, F., Weber, M., Strapp, J. W., and Korolev, A. V.: High ice water content at low radar reflectivity near deep convection – Part 2: Evaluation of microphysical pathways in updraft parcel simulations, Atmos. Chem. Phys., 15, 11729–11751, https://doi.org/10.5194/acp-15-11729-2015, 2015. a
Awaka, J., Le, M., Brodzik, S., Kubota, T., Masaki, T., Chandrasekar, V., and Iguchi, T.: Development of Precipitation Type Classification Algorithms for a Full Scan Mode of GPM Dual-frequency Precipitation Radar, J. Meteorol. Soc. Jpn. Ser. II, 99, 1253–1270, https://doi.org/10.2151/jmsj.2021-061, 2021. a
Barnes, H. C. and Houze Jr., R. A.: Comparison of observed and simulated spatial patterns of ice microphysical processes in tropical oceanic mesoscale convective systems, J. Geophys. Res., 121, 8269–8296, 2016. a
Battaglia, A., Tanelli, S., Kobayashi, S., Zrnic, D., Hogan, R. J., and Simmer, C.: Multiple-scattering in radar systems: A review, J. Quant. Spectrosc. Ra., 111, 917–947, https://doi.org/10.1016/j.jqsrt.2009.11.024, 2010. a
Battaglia, A., Tanelli, S., Heymsfield, G. M., and Tian, L.: The Dual Wavelength Ratio Knee: A Signature of Multiple Scattering in Airborne Ku–Ka Observations, J. Appl. Meteorol. Clim., 53, 1790–1808, https://doi.org/10.1175/JAMC-D-13-0341.1, 2014. a
Battaglia, A., Tanelli, S., Mroz, K., and Tridon, F.: Multiple scattering in observations of the GPM dual-frequency precipitation radar: Evidence and impact on retrievals, J. Geophys. Res.-Atmos., 120, 4090–4101, https://doi.org/10.1002/2014JD022866, 2015. a
Biggerstaff, M. I. and Houze, R. A.: Kinematic and Precipitation Structure of the 10–11 June 1985 Squall Line, Mon. Weather Rev., 119, 3034–3065, https://doi.org/10.1175/1520-0493(1991)119<3034:KAPSOT>2.0.CO;2, 1991. a
Brandes, E. A., Zhang, G., and Vivekanandan, J.: Corrigendum, J. Appl. Meteorol., 44, 186–186, https://doi.org/10.1175/1520-0450(2005)44<186:C>2.0.CO;2, 2005. a
Butler, R. W., Davies, P. L., and Jhun, M.: Asymptotics for the Minimum Covariance Determinant Estimator, Ann. Stat., 21, 1385–1400, 1993. a
Casella, D., Panegrossi, G., Sanò, P., Marra, A. C., Dietrich, S., Johnson, B. T., and Kulie, M. S.: Evaluation of the GPM-DPR snowfall detection capability: Comparison with CloudSat-CPR, Atmos. Res., 197, 64–75, https://doi.org/10.1016/j.atmosres.2017.06.018, 2017. a
Chase, R. J., Nesbitt, S. W., and McFarquhar, G. M.: Evaluation of the Microphysical Assumptions within GPM-DPR Using Ground-Based Observations of Rain and Snow, Atmosphere, 11, 619, https://doi.org/10.3390/atmos11060619, 2020. a
Chase, R. J., Nesbitt, S. W., and McFarquhar, G. M.: A Dual-Frequency Radar Retrieval of Two Parameters of the Snowfall Particle Size Distribution Using a Neural Network, J. Appl. Meteorol. Clim., 60, 341–359, https://doi.org/10.1175/JAMC-D-20-0177.1, 2021. a, b, c, d, e
Chase, R. J., Nesbitt, S. W., McFarquhar, G. M., Wood, N. B., and Heymsfield, G. M.: Direct Comparisons between GPM-DPR and CloudSat Snowfall Retrievals, J. Appl. Meteorol. Clim., 61, 1257–1271, https://doi.org/10.1175/JAMC-D-21-0081.1, 2022. a
Chen, S. and Cotton, W. R.: The sensitivity of a simulated extratropical mesoscale convective system to longwave radiation and ice-phase microphysics, J. Atmos. Sci., 45, 3897–3910, 1988. a
Cifelli, R., Chandrasekar, V., Lim, S., Kennedy, P. C., Wang, Y., and Rutledge, S. A.: A New Dual-Polarization Radar Rainfall Algorithm: Application in Colorado Precipitation Events, J. Atmos. Ocean. Tech., 28, 352–364, https://doi.org/10.1175/2010JTECHA1488.1, 2011. a, b
D'Adderio, L. P., Vulpiani, G., Porcú, F., Tokay, A., and Meneghini, R.: Comparison of GPM-CO and Ground-Based Radar Retrieval of Mass-Weighted Mean Rain Drop Diameter at Mid-Latitude, J. Hydrometeorol., 19, 1583–1598, https://doi.org/10.1175/JHM-D-18-0002.1, 2018. a
de Laat, A., Defer, E., Delanoë, J., Dezitter, F., Gounou, A., Grandin, A., Guignard, A., Meirink, J. F., Moisselin, J.-M., and Parol, F.: Analysis of geostationary satellite-derived cloud parameters associated with environments with high ice water content, Atmos. Meas. Tech., 10, 1359–1371, https://doi.org/10.5194/amt-10-1359-2017, 2017. a
Delanoë, J. and Hogan, R. J.: Combined CloudSat-CALIPSO-MODIS retrievals of the properties of ice clouds, J. Geophys. Res., 115, D00H29, https://doi.org/10.1029/2009JD012346, 2010. a
Delanoë, J., Protat, A., Testud, J., Bouniol, D., Heymsfield, A. J., Bansemer, A., Brown, P. R. A., and Forbes, R. M.: Statistical properties of the normalized ice particle size distribution, J. Geophys. Res., 110, D10201, https://doi.org/10.1029/2004JD005405, 2005. a
Deng, M., Mace, G. G., Wang, Z., and Okamoto, H.: Tropical Composition, Cloud and Climate Coupling Experiment validation for cirrus cloud profiling retrieval using CloudSat radar and CALIPSO lidar, J. Geophys. Res., 115, D00J17, https://doi.org/10.1029/2009JD013104, 2010. a
Dolan, B., Fuchs, B., Rutledge, S. A., Barnes, E. A., and Thompson, E. J.: Primary Modes of Global Drop Size Distributions, J. Atmos. Sci., 75, 1453–1476, https://doi.org/10.1175/JAS-D-17-0242.1, 2018. a
Drigeard, E., Fontaine, E., Wobrock, W., Schwarzenböck, A., Duroure, C., Williams, E. R., Russell, B., Protat, A., Delanoë, J., Cazenave, F., and Gosset, M.: A comparison of airborne in-situ cloud microphysical measurement with ground based C-band radar observations in deep stratiform regions of African squall lines, J. Appl. Meteorol. Clim., 54, 2461–2477, https://doi.org/10.1175/JAMC-D-14-0262.1, 2015. a
Drummond, F. J., Rogers, R. R., Cohn, S. A., Ecklund, W. L., Carter, D. A., and Wilson, J. S.: A New Look at the Melting Layer, J. Atmos. Sci., 53, 759–769, https://doi.org/10.1175/1520-0469(1996)053<0759:ANLATM>2.0.CO;2, 1996. a, b
Fabry, F. and Zawadzki, I.: Long-Term Radar Observations of the Melting Layer of Precipitation and Their Interpretation, J. Atmos. Sci., 52, 838–851, https://doi.org/10.1175/1520-0469(1995)052<0838:LTROOT>2.0.CO;2, 1995. a, b
Fridlind, A. M., Li, X., Wu, D., van Lier-Walqui, M., Ackerman, A. S., Tao, W.-K., McFarquhar, G. M., Wu, W., Dong, X., Wang, J., Ryzhkov, A., Zhang, P., Poellot, M. R., Neumann, A., and Tomlinson, J. M.: Derivation of aerosol profiles for MC3E convection studies and use in simulations of the 20 May squall line case, Atmos. Chem. Phys., 17, 5947–5972, https://doi.org/10.5194/acp-17-5947-2017, 2017. a, b
Gatlin, P. N., Petersen, W. A., Pippitt, J. L., Berendes, T. A., Wolff, D. B., and Tokay, A.: The GPM Validation Network and Evaluation of Satellite-Based Retrievals of the Rain Drop Size Distribution, Atmosphere, 11, 1010, https://doi.org/10.3390/atmos11091010, 2020. a, b, c
Heymsfield, A., Bansemer, A., Wood, N. B., Liu, G., Tanelli, S., Sy, O. O., Poellot, M., and Liu, C.: Toward Improving Ice Water Content and Snow-Rate Retrievals from Radars. Part II: Results from Three Wavelength Radar–Collocated In Situ Measurements and CloudSat–GPM–TRMM Radar Data, J. Appl. Meteorol. Clim., 57, 365–389, https://doi.org/10.1175/JAMC-D-17-0164.1, 2018a. a
Heymsfield, A., Bansemer, A., Wood, N. B., Liu, G., Tanelli, S., Sy, O. O., Poellot, M., and Liu, C.: Toward Improving Ice Water Content and Snow-Rate Retrievals from Radars. Part II: Results from Three Wavelength Radar–Collocated In Situ Measurements and CloudSat–GPM–TRMM Radar Data, J. Appl. Meteorol. Clim., 57, 365–389, https://doi.org/10.1175/JAMC-D-17-0164.1, 2018b. a
Heymsfield, G. M., Geerts, B., and Tian, L.: TRMM Precipitation Radar Reflectivity Profiles as Compared with High-Resolution Airborne and Ground-Based Radar Measurements, J. Appl. Meteorol., 39, 2080–2102, https://doi.org/10.1175/1520-0450(2001)040<2080:TPRRPA>2.0.CO;2, 2000. a
Hitschfeld, W. and Bordan, J.: Errors inherent in the radar measurement of rainfall at attenuating wavelengths, J. Meteor., 11, 58–67, 1954. a
Hogan, R. J. and Battaglia, A.: Fast Lidar and Radar Multiple-Scattering Models. Part II: Wide-Angle Scattering Using the Time-Dependent Two-Stream Approximation, J. Atmos. Sci., 65, 3636–3651, https://doi.org/10.1175/2008JAS2643.1, 2008. a
Hogan, R. J., Gaussiat, N., and Illingworth, A. J.: Stratocumulus Liquid Water Content from Dual-Wavelength Radar, J. Atmos. Ocean. Tech., 22, 1207–218, https://doi.org/10.1175/JTECH1768.1, 2005. a
Hou, A., Kakar, R. K., Neeck, S., Azarbarzin, A. A., Kummerow, C. D., Kojima, M., Oki, R., Nakamura, K., and Iguchi, T.: The Global Precipitation Measurement Mission, B. Am. Meteorol. Soc., 95, 701–722, https://doi.org/10.1175/BAMS-D-13-00164.1, 2014. a
Houze Jr., R. A.: Stratiform precipitation in regions of convection: A meteorological paradox?, B. Am. Meteorol. Soc., 78, 2179–2226, 1997. a
Houze Jr., R. A., Rasmussen, K. L., and Zuluaga, M. D.: The variable nature of convection in the tropics and subtropics: A legacy of 16 years of the Tropical Rainfall Measuring Mission satellite, Rev. Geophys., 53, 994–1021, https://doi.org/10.1002/2015RG000488, 2015. a
Iguchi, T. and Meneghini, R.: GPM DPR precipitation profile L2A 1.5 hours 5 km V06, GES DISC [data set], https://doi.org/10.5067/GPM/DPR/GPM/2A/06, 2017. a
Iguchi, T., Seto, S., Meneghini, R., Yoshida, N., Awaka, J., Le, M., Chandrasekar, V., Brodzik, S., and Kubota, T.: GPM/DPR Level-2 Algorithm Theoretical Basis Document, NASA, https://gpm.nasa.gov/sites/default/files/2019-05/ATBD_DPR_201811_with_Appendix3b.pdf (last access: 10 January 2023), 2018. a, b
JAXA/EORC Team: GPM/DPR L2/3 Product Format Documentation, JAXA, http://www.eorc.jaxa.jp/GPM/doc/product/format/en/03.%20GPM_DPR_L2_L3%20Product%20Format%20Documentation_V5_E.pdf (last access: 10 January 2023), 2017. a
Jensen, A. A., Harrington, J. Y., and Morrison, H.: Microphysical Characteristics of Squall-Line Stratiform Precipitation and Transition Zones Simulated Using an Ice Particle Property-Evolving Model, Mon. Weather Rev., 146, 723–743, 2018. a
Kneifel, S., Lerber, A., Tiira, J., Moisseev, D., Kollias, P., and Leinonen, J.: Observed relations between snowfall microphysics and triple-frequency radar measurements, J. Geophys. Res.-Atmos., 120, 6034–6055, https://doi.org/10.1002/2015JD023156, 2015. a
Kubota, T., Seto, S., Satoh, M., Nasuno, T., Iguchi, T., Masaki, T., Kwiatkowski, J. M., and Oki, R.: Cloud Assumption of Precipitation Retrieval Algorithms for the Dual-Frequency Precipitation Radar, J. Atmos. Ocean. Tech., 37, 2015–2031, https://doi.org/10.1175/JTECH-D-20-0041.1, 2020. a
Kulie, M. S., Hiley, M. J., Bennartz, R., Kneifel, S., and Tanelli, S.: Triple-Frequency Radar Reflectivity Signatures of Snow: Observations and Comparisons with Theoretical Ice Particle Scattering Models, J. Appl. Meteorol. Clim., 53, 1080–1098, https://doi.org/10.1175/JAMC-D-13-066.1, 2014. a
Kummerow, C., Barnes, W., Kozu, T., Shiue, J., and Simpson, J.: The Tropical Rainfall Measuring Mission (TRMM) sensor package, J. Atmos. Ocean. Tech., 15, 809–817, https://doi.org/10.1175/1520-0426(1998)015<0809:TTRMMT>2.0.CO;2, 1998. a
Kuo, K.-S., Olson, W. S., Johnson, B. T., Grecu, M., Tian, L., Clune, T. L., van Aartsen, B. H., Heymsfield, A. J., Liao, L., and Meneghini, R.: The Microwave Radiative Properties of Falling Snow Derived from Nonspherical Ice Particle Models. Part I: An Extensive Database of Simulated Pristine Crystals and Aggregate Particles, and Their Scattering Properties, J. Appl. Meteorol. Clim., 55, 691–708, https://doi.org/10.1175/JAMC-D-15-0130.1, 2016. a
Ladino, L. A., Korolev, A., Heckman, I., Wolde, M., Fridlind, A. M., and Ackerman, A. S.: On the role of ice-nucleating aerosol in the formation of ice particles in tropical mesoscale convective systems, Geophys. Res. Lett., 44, 1574–1582, 2017. a
Lawson, P., Gurganus, C., Woods, S., and Bruintjes, R.: Aircraft Observations of Cumulus Microphysics Ranging from the Tropics to Midlatitudes: Implications for a “New” Secondary Ice Process, J. Atmos. Sci., 74, 2899–2920, 2017. a
Le, M. and Chandrasekar, V.: Precipitation Type Classification Method for Dual-Frequency Precipitation Radar (DPR) Onboard the GPM, IEEE T. Geosci. Remote, 51, 1784–1790, https://doi.org/10.1109/TGRS.2012.2205698, 2013. a
Leinonen, J. and Lerber, A. V.: Snowflake Melting Simulation Using Smoothed Particle Hydrodynamics, J. Geophys. Res.-Atmos., 123, 1811–1825, https://doi.org/10.1002/2017JD027909, 2018. a
Leinonen, J., Kneifel, S., Moisseev, D., Tyynelä, J., Tanelli, S., and Nousiainen, T.: Evidence of nonspheroidal behavior in millimeter-wavelength radar observations of snowfall, J. Geophys. Res.-Atmos., 117, D18205, https://doi.org/10.1029/2012JD017680, 2012. a
Li, H. and Moisseev, D.: Melting Layer Attenuation at Ka- and W-Bands as Derived From Multifrequency Radar Doppler Spectra Observations, J. Geophys. Res.-Atmos., 124, 9520–9533, https://doi.org/10.1029/2019JD030316, 2019. a
Liao, L. and Meneghini, R.: GPM DPR Retrievals: Algorithm, Evaluation, and Validation, Remote Sens., 14, 843, https://doi.org/10.3390/rs14040843, 2022. a, b, c, d
Liu, C. and Zipser, E. J.: The global distribution of largest, deepest, and most intense precipitation systems, Geophys. Res. Lett., 42, 3591–3595, https://doi.org/10.1002/2015GL063776, 2015. a
Liu, N. and Liu, C.: Global distribution of deep convection reaching tropopause in 1 year GPM observations, J. Geophys. Res., 121, 3824–3842, https://doi.org/10.1002/(ISSN)2169-8996, 2016. a
Matrosov, S. Y.: Assessment of Radar Signal Attenuation Caused by the Melting Hydrometeor Layer, IEEE T. Geosci. Remote, 46, 1039–1047, https://doi.org/10.1109/TGRS.2008.915757, 2008. a, b, c, d
Meneghini, R., Kim, H., Liao, L., Jones, J. A., and Kwiatkowski, J. M.: An Initial Assessment of the Surface Reference Technique Applied to Data from the Dual-Frequency Precipitation Radar (DPR) on the GPM Satellite, J. Atmos. Ocean. Tech., 32, 2281–2296, https://doi.org/10.1175/JTECH-D-15-0044.1, 2015. a
Mitra, S. K., Vohl, O., Ahr, M., and Pruppacher, H. R.: A Wind Tunnel and Theoretical Study of the Melting Behavior of Atmospheric Ice Particles. IV: Experiment and Theory for Snow Flakes, J. Atmos. Sci., 47, 584–591, https://doi.org/10.1175/1520-0469(1990)047<0584:AWTATS>2.0.CO;2, 1990. a, b
Mroz, K.: mrozkamil/gpym: DPR paper release, Zenodo [code], https://doi.org/10.5281/zenodo.10805217, 2024. a
Mroz, K. and Leinonen, J.: Microwave Single Scattering Properties Database (Horizontally Aligned Aggregates of Dendrites) (1.0), Zenodo [data set], https://doi.org/10.5281/zenodo.7510186, 2023. a, b, c
Mroz, K., Battaglia, A., Lang, T. J., Tanelli, S., and Sacco, G. F.: Global Precipitation Measuring Dual-Frequency Precipitation Radar Observations of Hailstorm Vertical Structure: Current Capabilities and Drawbacks, J. Appl. Meteorol. Clim., 57, 2161–2178, https://doi.org/10.1175/JAMC-D-18-0020.1, 2018. a
Mroz, K., Battaglia, A., Nguyen, C., Heymsfield, A., Protat, A., and Wolde, M.: Triple-frequency radar retrieval of microphysical properties of snow, Atmos. Meas. Tech., 14, 7243–7254, https://doi.org/10.5194/amt-14-7243-2021, 2021a. a
Mroz, K., Montopoli, M., Battaglia, A., Panegrossi, G., Kirstetter, P., and Baldini, L.: Cross Validation of Active and Passive Microwave Snowfall Products over the Continental United States, J. Hydrometeorol., 22, 1297–1315, https://doi.org/10.1175/JHM-D-20-0222.1, 2021b. a, b
Mróz, K., Battaglia, A., Kneifel, S., von Terzi, L., Karrer, M., and Ori, D.: Linking rain into ice microphysics across the melting layer in stratiform rain: a closure study, Atmos. Meas. Tech., 14, 511–529, https://doi.org/10.5194/amt-14-511-2021, 2021c. a
Petersen, W. A.: GPM Ground Validation Validation Network (VN) [collocations in 2015 and 2016], NASA Global Hydrometeorology Resource Center DAAC [data set], Huntsville, Alabama, U.S.A., https://doi.org/10.5067/GPMGV/WFF/MULTIPLE/DATA101, 2021. a
Petersen, W. A., Tokay, A., Morris, K. R., D'Adderio, L. P., Wolff, D. B., and Gatlin, P. N.: Polarimetric Radar Verification of GPM Satellite-Based Retrievals of the Raindrop Size Distribution, 38th Conference on Radar Meteorology, 28 August 2017, Chicago, USA, American Meteorological Society, https://ams.confex.com/ams/38RADAR/webprogram/Paper320335.html (last access: 1 May 2023), 2018. a
Protat, A., Klepp, C., Louf, V., Petersen, W. A., Alexander, S. P., Barros, A., Leinonen, J., and Mace, G. G.: The Latitudinal Variability of Oceanic Rainfall Properties and Its Implication for Satellite Retrievals: 1. Drop Size Distribution Properties, J. Geophys. Res.-Atmos., 124, 13291–13311, https://doi.org/10.1029/2019JD031010, 2019. a
Pulkkinen, S., Nerini, D., Pérez Hortal, A. A., Velasco-Forero, C., Seed, A., Germann, U., and Foresti, L.: Pysteps: an open-source Python library for probabilistic precipitation nowcasting (v1.0), Geosci. Model Dev., 12, 4185–4219, https://doi.org/10.5194/gmd-12-4185-2019, 2019. a
Rodgers, C. D.: Inverse Methods for Atmospheric Sounding, World Scientific, https://doi.org/10.1142/3171, 2000. a
Schumacher, C. and Funk, A.: Assessing Convective-Stratiform Precipitation Regimes in the Tropics and Extratropics With the GPM Satellite Radar, Geophys. Res. Lett., 50, e2023GL102786, https://doi.org/10.1029/2023GL102786, 2023. a
Schwaller, M. R. and Morris, K. R.: A Ground Validation Network for the Global Precipitation Measurement Mission, J. Atmos. Ocean. Tech., 28, 301–319, https://doi.org/10.1175/2010JTECHA1403.1, 2011. a
Seto, S., Iguchi, T., and Oki, T.: The Basic Performance of a Precipitation Retrieval Algorithm for the Global Precipitation Measurement Mission's Single/Dual-Frequency Radar Measurements, IEEE T. Geosci. Remote, 51, 5239–5251, https://doi.org/10.1109/TGRS.2012.2231686, 2013. a, b, c
Seto, S., Iguchi, T., Meneghini, R., Awaka, J., Kubota, T., Masaki, T., and Takahashi, N.: The Precipitation Rate Retrieval Algorithms for the GPM Dual-frequency Precipitation Radar, J. Meteorol. Soc. Jpn. Ser. II, 99, 205–237, https://doi.org/10.2151/jmsj.2021-011, 2021. a
Short, D. A. and Iguchi, T.: Model simulations of non-uniform beam filling correction for spaceborne precipitation radar, in: 2011 IEEE International Geoscience and Remote Sensing Symposium, Vancouver, BC, Canada, 24–29 July 2011, Institute of Electrical and Electronics Engineers (IEEE), 2594–2597, https://doi.org/10.1109/IGARSS.2011.6049772, 2011. a
Skofronick-Jackson, G., Kulie, M., Milani, L., Munchak, S. J., Wood, N. B., and Levizzani, V.: Satellite Estimation of Falling Snow: A Global Precipitation Measurement (GPM) Core Observatory Perspective, J. Appl. Meteorol. Clim., 58, 1429–1448, https://doi.org/10.1175/JAMC-D-18-0124.1, 2019. a
Sullivan, S. C. and Voigt, A.: Ice microphysical processes exert a strong control on the simulated radiative energy budget in the tropics, Communications Earth and Environment, 2, 137, https://doi.org/10.1038/s43247-021-00206-7, 2021. a
Szyrmer, W. and Zawadzki, I.: Modeling of the Melting Layer. Part I: Dynamics and Microphysics, J. Atmos. Sci., 56, 3573–3592, https://doi.org/10.1175/1520-0469(1999)056<3573:MOTMLP>2.0.CO;2, 1999. a
Tokay, A., D'Adderio, L. P., Wolff, D. B., and Petersen, W. A.: Development and Evaluation of the Raindrop Size Distribution Parameters for the NASA Global Precipitation Measurement Mission Ground Validation Program, J. Atmos. Ocean. Tech., 37, 115–128, https://doi.org/10.1175/JTECH-D-18-0071.1, 2020. a, b
Tridon, F., Battaglia, A., Chase, R. J., Turk, F. J., Leinonen, J., Kneifel, S., Mroz, K., Finlon, J., Bansemer, A., Tanelli, S., Heymsfield, A. J., and Nesbitt, S. W.: The Microphysics of Stratiform Precipitation During OLYMPEX: Compatibility Between Triple-Frequency Radar and Airborne In Situ Observations, J. Geophys. Res.-Atmos., 124, 8764–8792, https://doi.org/10.1029/2018JD029858, 2019. a
von Lerber, A., Moisseev, D., Bliven, L. F., Petersen, W., Harri, A.-M., and Chandrasekar, V.: Microphysical Properties of Snow and Their Link to Ze–S Relations during BAECC 2014, J. Appl. Meteorol. Clim., 56, 1561–1582, https://doi.org/10.1175/JAMC-D-16-0379.1, 2017. a
Vulpiani, G., Marzano, F. S., Chandrasekar, V., Berne, A., and Uijlenhoet, R.: Rainfall rate retrieval in presence of path attenuation using C-band polarimetric weather radars, Nat. Hazards Earth Syst. Sci., 6, 439–450, https://doi.org/10.5194/nhess-6-439-2006, 2006. a
Webster, P. J. and Stephens, G. L.: Tropical upper-tropospheric extended clouds: Inferences from Winter MONEX, J. Atmos. Sci., 37, 1521–1541, https://doi.org/10.1175/1520-0469-37.7.1521, 1980. a
Williams, C. R., Bringi, V. N., Carey, L. D., Chandrasekar, V., Gatlin, P. N., Haddad, Z. S., Meneghini, R., Munchak, S. J., Nesbitt, S. W., Petersen, W. A., Tanelli, S., Tokay, A., Wilson, A., and Wolff, D. B.: Describing the Shape of Raindrop Size Distributions Using Uncorrelated Raindrop Mass Spectrum Parameters, J. Appl. Meteorol. Clim., 53, 1282–1296, https://doi.org/10.1175/JAMC-D-13-076.1, 2014. a, b
Zawadzki, I., Szyrmer, W., Bell, C., and Fabry, F.: Modeling of the Melting Layer. Part III: The Density Effect, J. Atmos. Sci., 62, 3705–3723, https://doi.org/10.1175/JAS3563.1, 2005. a
- Abstract
- Introduction
- DPR measurements
- DPR retrieval: current status
- Optimal-estimation (OE) retrieval development
- Demonstrating criteria compliance: algorithm evaluation
- Performance assessment in rain
- Conclusions
- Code availability
- Data availability
- Author contributions
- Competing interests
- Disclaimer
- Acknowledgements
- Financial support
- Review statement
- References