the Creative Commons Attribution 4.0 License.
the Creative Commons Attribution 4.0 License.
 | 19 Mar 2024
Assessment of current methane emission quantification techniques for natural gas midstream applications
Yunsong Liu
Jean-Daniel Paris
Gregoire Broquet
Violeta Bescós Roy
Tania Meixus Fernandez
Rasmus Andersen
Andrés Russu Berlanga
Emil Christensen
Yann Courtois
Sebastian Dominok
Corentin Dussenne
Travis Eckert
Andrew Finlayson
Aurora Fernández de la Fuente
Catlin Gunn
Ram Hashmonay
Juliano Grigoleto Hayashi
Jonathan Helmore
Soeren Honsel
Fabrizio Innocenti
Matti Irjala
Torgrim Log
Cristina Lopez
Francisco Cortés Martínez
Jonathan Martinez
Adrien Massardier
Helle Gottschalk Nygaard
Paula Agregan Reboredo
Elodie Rousset
Axel Scherello
Matthias Ulbricht
Damien Weidmann
Oliver Williams
Nigel Yarrow
Murès Zarea
Robert Ziegler
Jean Sciare
Mihalis Vrekoussis
Philippe Bousquet
Methane emissions from natural gas systems are increasingly scrutinized, and accurate reporting requires quantification of site- and source-level measurement. We evaluate the performance of 10 available state-of-the-art CH4 emission quantification approaches against a blind controlled-release experiment at an inerted natural gas compressor station in 2021. The experiment consisted of 17 blind 2 h releases at a single exhaust point or multiple simultaneous ones. The controlled releases covered a range of methane flow rates from 0.01 to 50 kg h−1. Measurement platforms included aircraft, drones, trucks, vans, ground-based stations, and handheld systems. Herewith, we compare their respective strengths, weaknesses, and potential complementarity depending on the emission rates and atmospheric conditions. Most systems were able to quantify the releases within an order of magnitude. The level of errors from the different systems was not significantly influenced by release rates larger than 0.1 kg h−1, with much poorer results for the 0.01 kg h−1 release. It was found that handheld optical gas imaging (OGI) cameras underestimated the emissions. In contrast, the “site-level” systems, relying on atmospheric dispersion, tended to overestimate the emission rates. We assess the dependence of emission quantification performance on key parameters such as wind speed, deployment constraints, and measurement duration. At the low wind speeds encountered (below 2 m s−1), the experiments did not reveal a significant dependence on wind speed. The ability to quantify individual sources degraded during multiple-source releases. Compliance with the Oil and Gas Methane Partnership's (OGMP 2.0) highest level of reporting may require a combination of the specific advantages of each measurement technique and will depend on reconciliation approaches. Self-reported uncertainties were either not available or were based on the standard deviation in a series of independent realizations or fixed values from expert judgment or theoretical considerations. For most systems, the overall relative errors estimated in this study are higher than self-reported uncertainties.
- Article
(2856 KB) - Full-text XML
-
Supplement
(1341 KB) - BibTeX
- EndNote


Methane, a key constituent of natural gas, is a powerful, short-lived (11.8 years) greenhouse gas that has about 29.8 times the global warming potential of CO2 on a 100-year horizon (IPCC, 2021). Natural gas consumption has increased by 2.2 % over the last decade to reach4307.5×109 standard cubic meters (m3), with existing reserves reaching 1.88×10¹⁴ m3 in 2021 (BP, 2022). Global demand for natural gas is projected to grow to approximately 4500×109 m3 in 2030 and 5100×109 m3 in 2050 (IEA, 2021). Although the combustion of natural gas releases less CO2 per unit of energy produced than other fossil fuels, methane emissions due to procedures leading to venting, unintentional leaks, and incomplete combustion associated with the supply chain may erode the climatic advantage of natural gas as a transitional energy compared to liquid fuels if not addressed (Balcombe et al., 2017; Cooper et al., 2021; Zimmerle et al., 2020). Improving CH4 emission detection and reporting across the natural gas value chain is thus critical to understanding and mitigating the emission sources to enable a large-scale transition to natural gas.
Intensive research has recently focused on quantifying CH4 emissions from different sectors of the natural gas supply chain (Bell et al., 2017; Crow et al., 2019; Duren et al., 2019; Roscioli et al., 2015; Defratyka et al., 2021a). To continuously improve reporting through better quantification of emissions in the natural gas value chain, different measurement systems have been developed and applied in the field during the past decade (Allen et al., 2013; Ars et al., 2017; Johnson et al., 2021; Morales et al., 2022; Sherwin et al., 2021; Bell et al., 2020). In many cases, in natural gas production areas, CH4 emissions derived from atmospheric measurements were larger than the values reported in inventories at the basin scale (Harriss et al., 2015; Alvarez et al., 2018; Rutherford et al., 2021; Foulds et al., 2022), although underestimation might not be systematic in poorly constrained production regions such as the western Russian Arctic or Arabian Gulf gas fields (Petäjä et al., 2020; Paris et al., 2021). Inventory under-reporting has been attributed to a variety of potential reasons: reporting based on assumptions of past years' activity while activity increases, a lack of accounting for all sources in emission inventories, a lack of accounting for specific and time-limited venting operations, aging equipment and aging plants, challenging spatial or temporal aggregation of activities, or missing specific super-emitters.
Facing this challenge of reconciling inventories with measurements and in order to monitor progress in emission reduction policies, the Oil and Gas Methane Partnership (OGMP 2.0; https://ogmpartnership.com/, last access: 7 March 2024), as a voluntary initiative, encourages the use of site-level measurement to reconcile source- and site-level emission estimates. This approach is relevant to bridge the gap between industry practice of source-level (bottom-up) approaches and site-scale measurements (Allen, 2014; Olczak et al., 2022). However, measuring site-scale emissions relies on a range of measurement systems, which have highly variable performance at this scale.
Controlled-release experiments and intercomparison studies have been used to improve and evaluate the performance of methane emission measurement systems (e.g., Albertson et al., 2016; Feitz et al., 2018; Ravikumar et al., 2019; Edie et al., 2020; Defratyka et al., 2021b; Kumar et al., 2021; Morales et al., 2022). Ravikumar et al. (2019) reported the evaluation of the results from 10 vehicle-, drone-, and plane-based mobile CH4 leak detection and quantification technologies through single blind controlled-release tests. They found that 6 of the 10 technologies correctly detected over 90 % of the test scenarios and correctly assigned a leak to specific equipment in at least 50 % of test scenarios. Bell et al. (2020) assessed 12 CH4 emission measurement technologies. They found that localization by handheld and mobile technologies is more accurate than continuous monitoring systems. However, Kumar et al. (2022) reported 20 %–30 % precision for their estimate of controlled CH4 release rates when relying on either mobile or fixed-station networks. Their localization of the releases was better when relying on fixed stations. With the rapid development of current technology, Sherwin et al. (2021) have shown that an airplane-based hyperspectral imaging CH4 emission detection system can detect and quantify over 50 % of total emissions from super-emitters. Super-emitters are fewer than 20 % of sources, while contributing more than 60 % of total emissions (Duren et al., 2019). Moreover, the airborne CH4 measurement technology reported by Johnson et al. (2021) can detect, locate, and quantify individual sources at or below the magnitude of recently regulated venting limits (for example, regulations in Alberta, Canada, limit the methane emissions from site venting to 12.3 kg CH4 h−1) with ±31 %–68 % quantification uncertainties.
These studies propose conclusions that strongly depend on the specific experimental setup, mobile or fixed platforms, sensors, sampling strategies, and applied models. With the regular improvement of instruments and techniques, new intercomparisons based on controlled releases and involving a wide range of techniques are needed periodically. Our study aims to provide an update on the current capabilities in a scenario that replicates real conditions and to fulfill this requirement, focusing on mature technologies available in Europe.
In the present study, we investigate the performance of various available techniques to quantify emissions in a blind controlled-release experiment. The experiment was held at the mothballed (N2 inerted) compressor station of a defunct underground gas storage facility, providing a realistic environment for such measurements. It was organized by the European Gas Research Group (GERG; https://www.gerg.eu/, last access: 7 March 2024) in 2021. The range of emissions and the configuration of exhaust points aimed to reproduce highly realistic conditions occurring in the midstream natural gas industry, including transmission pipelines, compressor stations, and storage facilities that connect upstream production to downstream distribution and end users (GIE and MARCOGAZ, 2019). The experiment included 17 blind controlled 2 h releases with single or multiple emission sources. The controlled releases covered a wide range of situations, such as different flow rates (from 0.01 to 50 kg h−1), release heights (ranging from 1 to 28 m), and gas outlet shapes. In addition, the actual compressor station piping maze and equipment surrounding the release points provided the challenging airflow environment encountered at a site in operation.
Twelve different promising measurement systems were selected to participate in this 1-week campaign by GERG. The aim was to compare and evaluate these measurement systems (including mobile, ground-based, and handheld measurement platforms) to quantify CH4 emissions at the industrial site level and analyze their respective strengths, weaknesses, and potential complementarity depending on the emission and atmospheric conditions. The study focuses on quantifying emissions from single or multiple emission points. The detection and identification of those leaks are a prerequisite to this quantification, but they are not evaluated in the present study as release points were known by the measurement systems' operators.
2.1 Site description
A mothballed compressor station located in Spain was selected as the test site. The compressor station has a variety of compression equipment for injecting and treating gas extracted from a nearby underground gas storage area (Fig. 1). It is not in operation and has been completely inerted with nitrogen. There were no significant natural or anthropogenic sources of methane identified in the area. The site is surrounded by flat roads from the outside and inside, making it suitable for vehicle-based mobile measurements.
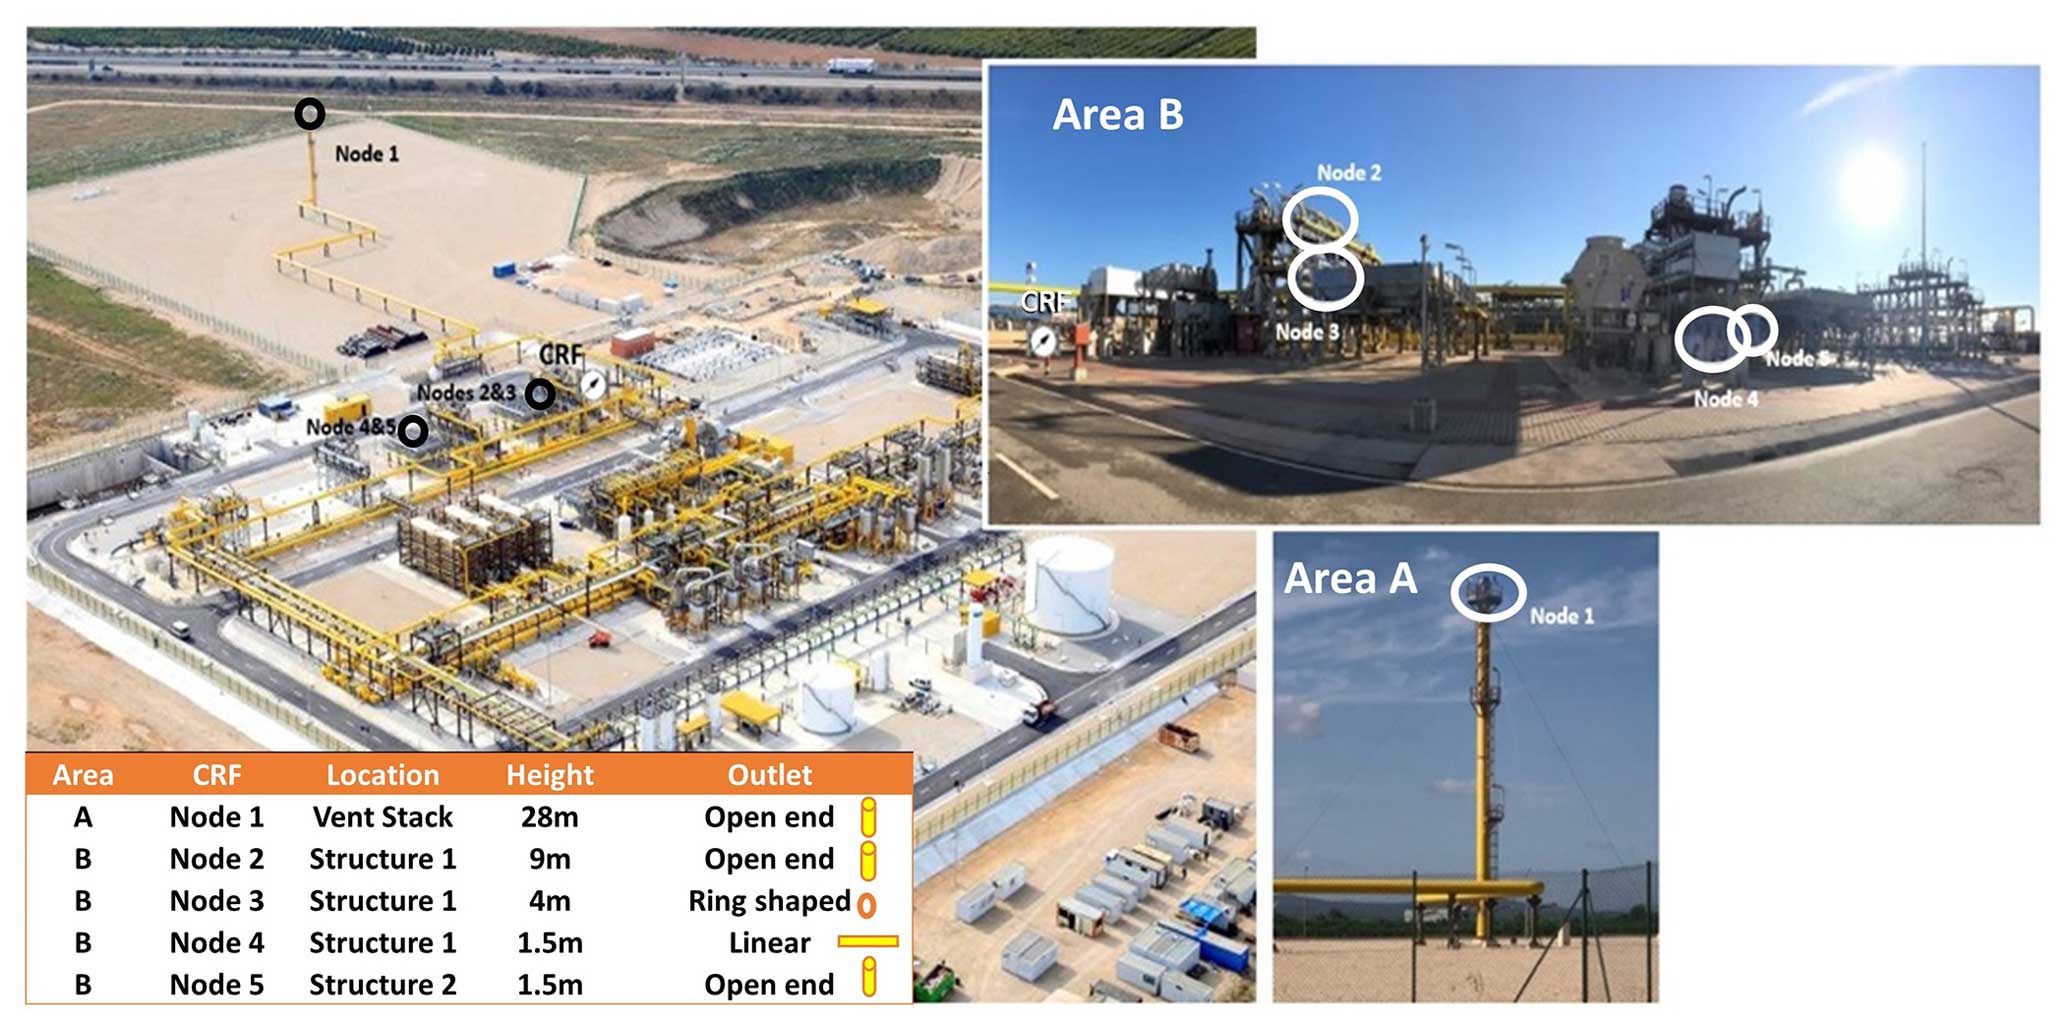
Figure 1Aerial view of the Enagas site in Spain and node locations (white circles). The controlled-release facility is indicated by a white disk marked “CRF”.
Five selected gas outlet points, hereafter called nodes, were embedded in the site infrastructure. The nodes were split into two areas: Area A included Node 1 and Area B included Nodes 2–5 (Fig. 1). Node 1 was located at the top of the site's vent stack at a height of 28 m. In this case, the chosen exit type was open-ended to simulate the emission conditions in vent stacks. Node 2 was 9 m above ground level with an open-ended exit. Node 3 was 4 m high with openings in a small ring-shaped pipe. Node 4 was a linear tube 3 m long with holes along it at 1.5 m in height. Node 5 was an open outlet at 1.5 m in height, dedicated exclusively to the tests with the lowest emission rates.
2.2 Controlled-release facility
The controlled-release facility (CRF) is a portable flow control system purposefully designed and configured by the National Physical Laboratory (NPL) to create “real-world” gaseous emission scenarios. A detailed description can be found in Gardiner et al. (2017). The gas used for this experiment was 99.95 % pure methane by volume, supplied by a commercial pressurized gas cylinder provider. This system (Fig. 2) enables the operator to replicate a variety of gaseous emissions at comparable scales in a range of industrial settings to validate emissions-monitoring methodologies under field conditions. The facility is computer-controlled and monitored, allowing for the execution of pre-written operational programs and the analysis of post-test flow data. Communication with the instrument is facilitated via a low-voltage umbilical cable, allowing the operator to control the system from a distance of up to 50 m from the gas blending equipment. The so-called “MidiCRF” system was used when the flow was below 1.2 kg h−1 (Node 5). Its principle derives from a simplified version of the CRF. The uncertainties in the CRF and MidiCRF are dominated by the calibration uncertainty. Calibration was performed on site prior to tests commencing, with the same source gas as was used in the tests. The CRF and MidiCRF were calibrated by NPL using volumetric piston-based calibrators (Mesa Labs) with measurement traceability to national standards.
NPL provided operational training to Enagas staff, who then operated the CRF for the execution of the tests.
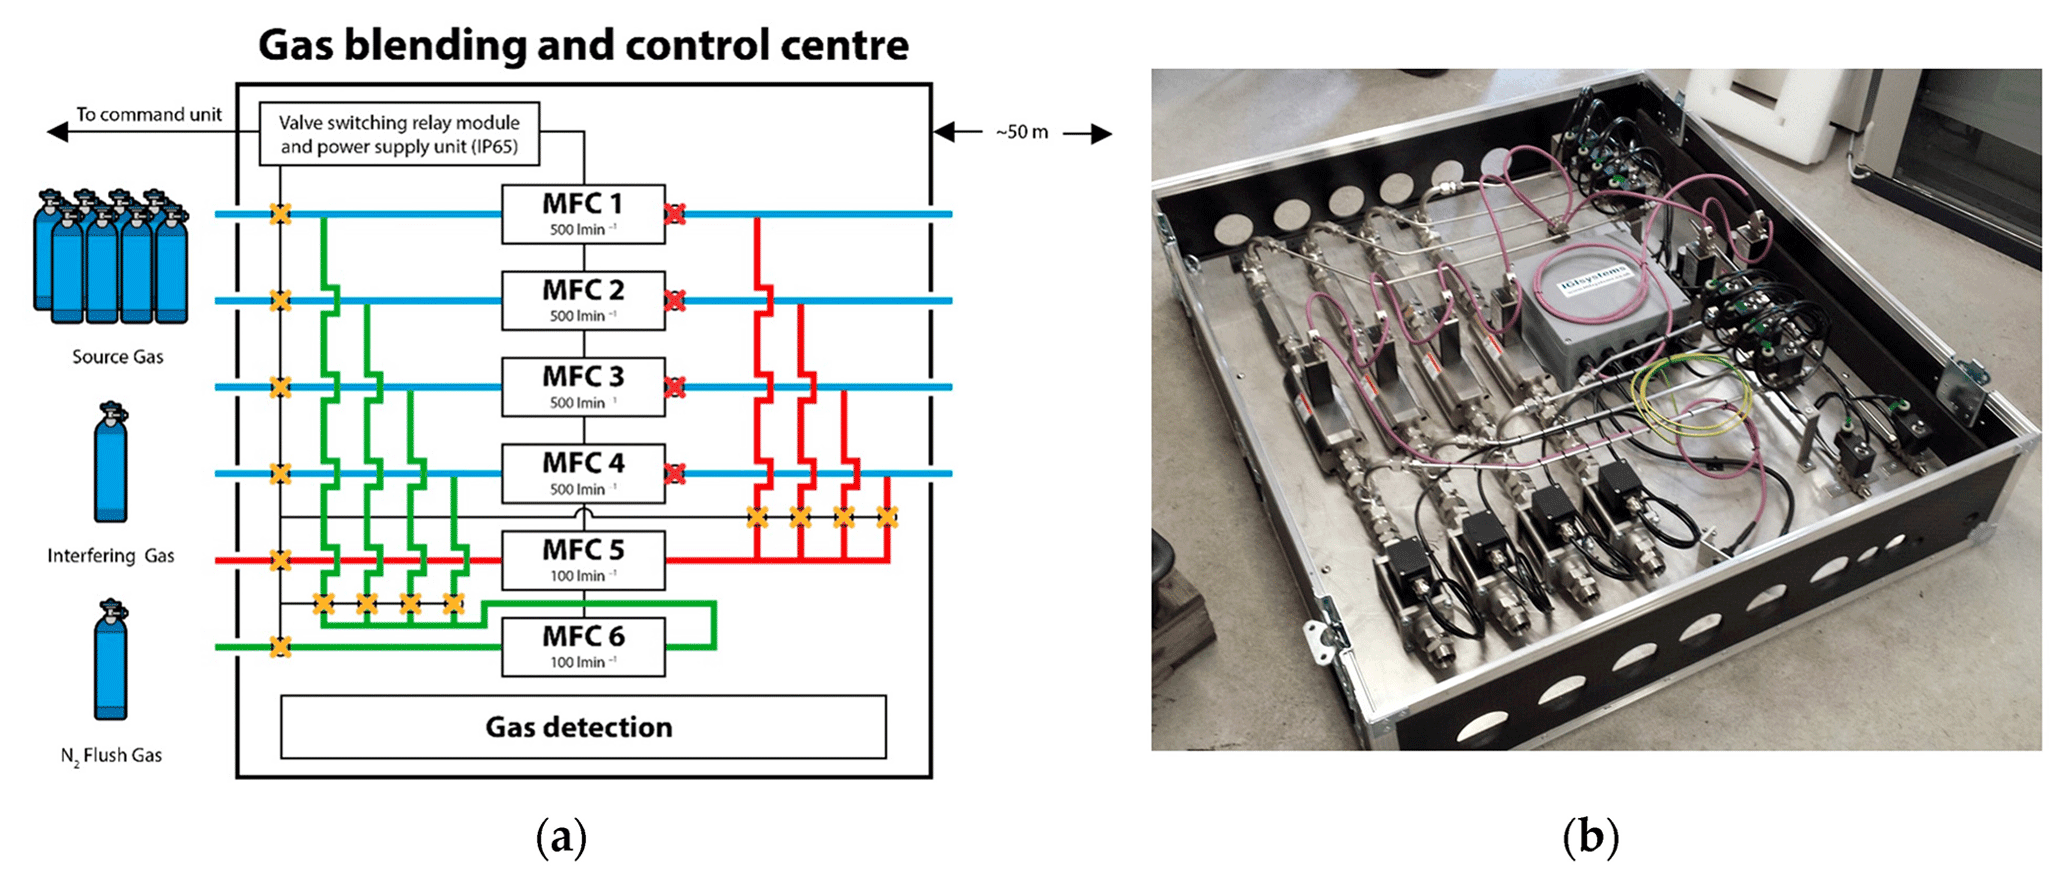
Figure 2(a) The controlled-release facility schematic and (b) photograph of the flow control system (Gardiner et al., 2017).
2.3 Test scenarios and organization of the experiment
The 17 releases were performed from 4 to 8 October 2021. They covered a range of situations combining different total flow rates (0.01–50 kg h−1, as shown in Table 1), across single or multiple nodes. This approach aimed to simulate a variety of fugitive and venting emissions in natural gas midstream sites.
Table 1Test scenarios with details of emission rates per node (units in kg h−1). The reported uncertainties are based on 2 standard deviations, providing a confidence interval of 95 %.
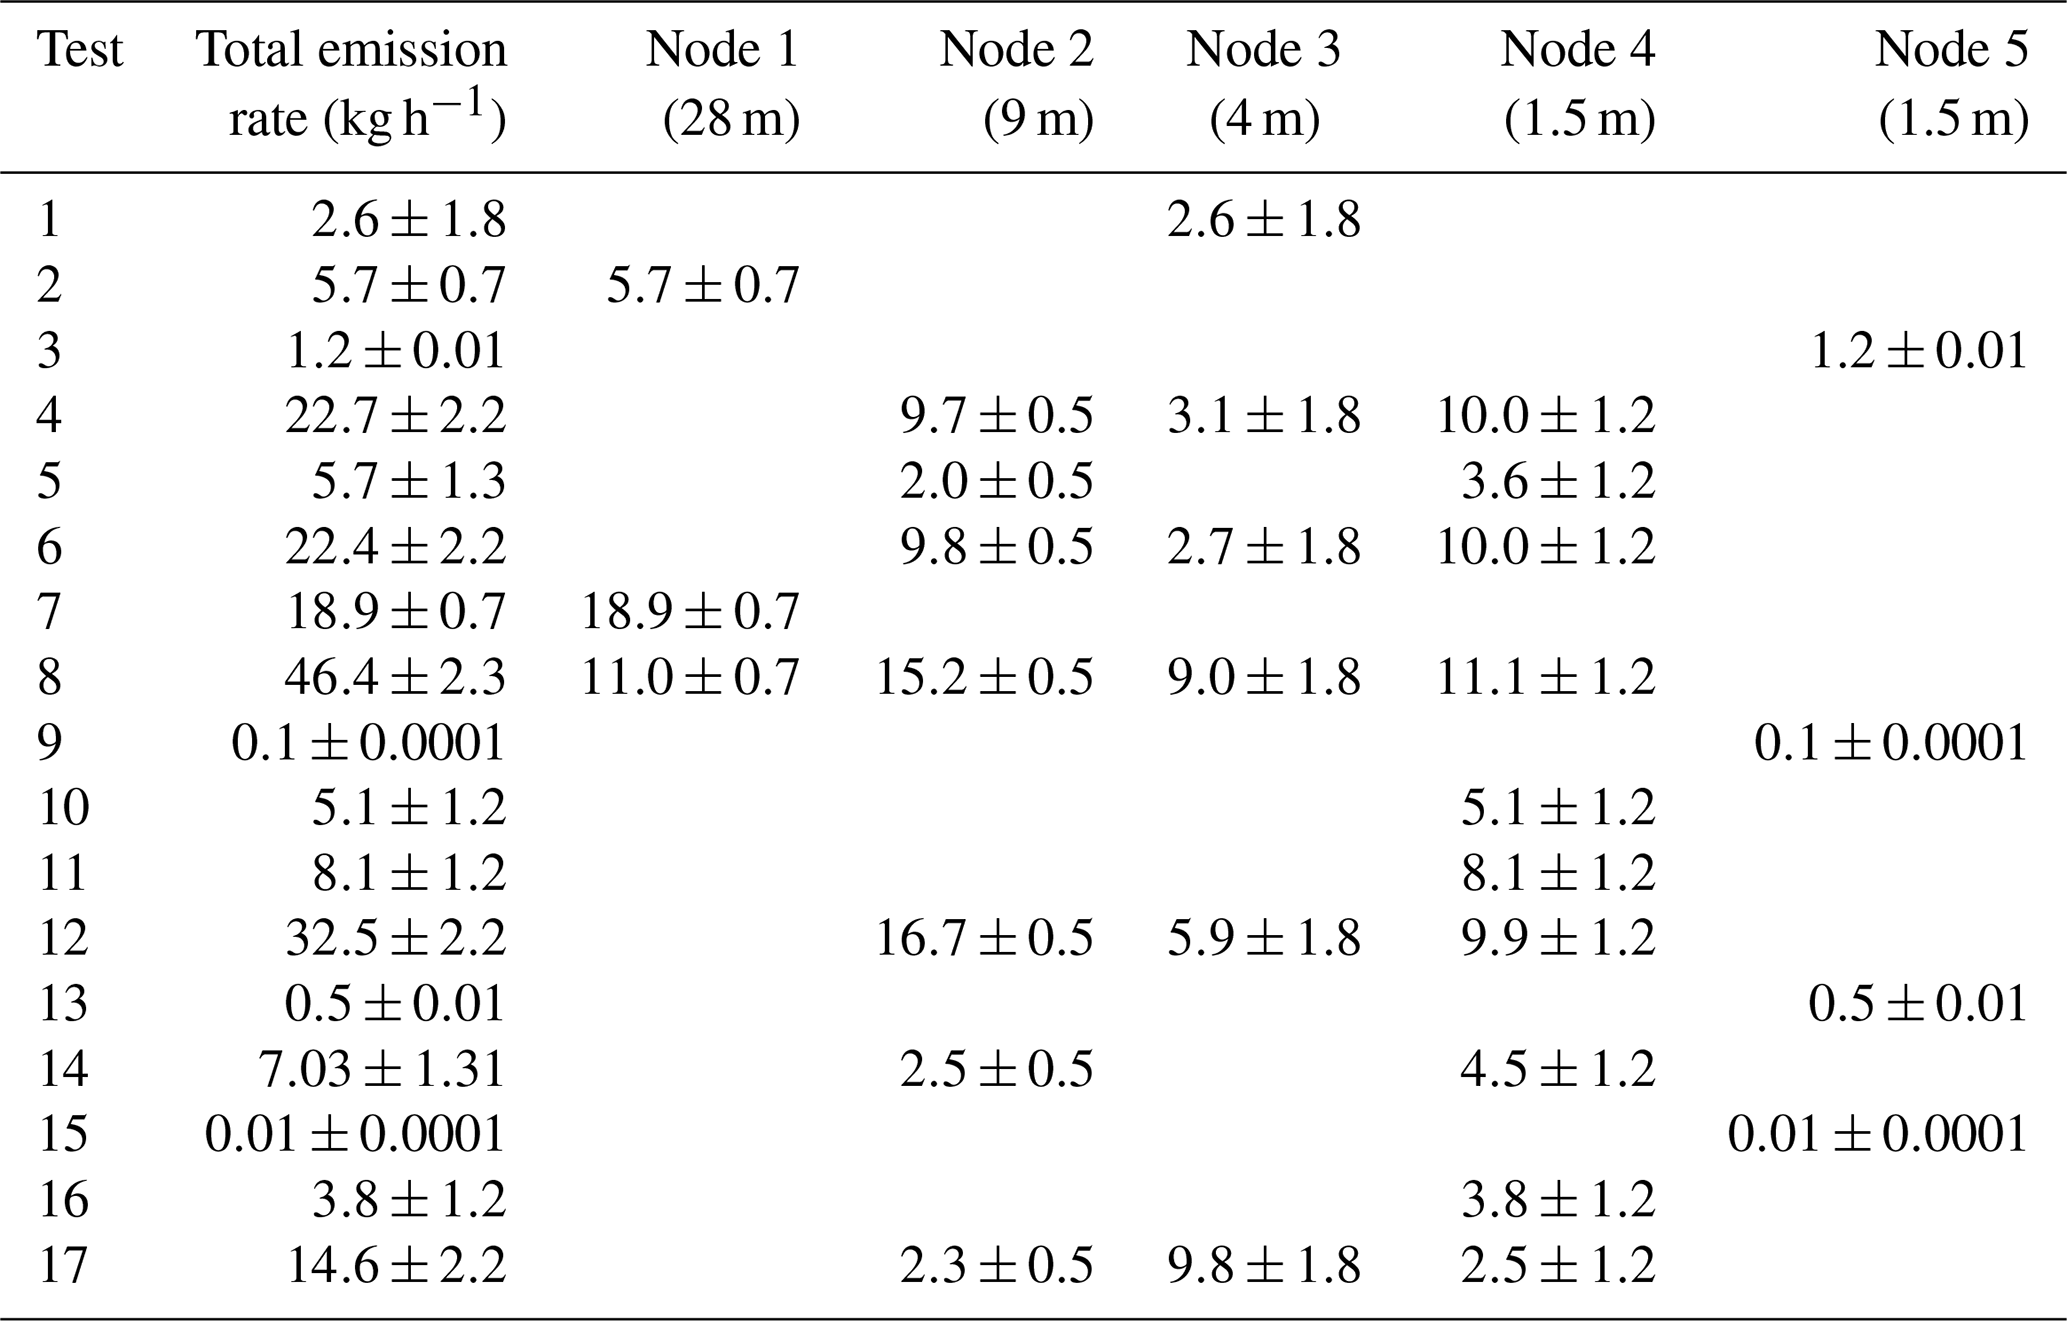
The releases involved single or multiple nodes with a constant emission rate over 2 h. The releases were “blind”; i.e., the release rates were not known by the participants. The series of release rates were established in advance and ordered randomly within the range of 0.01 to 50 kg h−1 (Table 2). Two releases took place in Area A only, 14 in Area B only, and 1 in both Areas A and B. The participants knew the areas of emission (A and/or B) but not the exact emitting node(s) in the case of Area B. Participants also knew the range of possible emission rates and the timing of the releases. Participants did not know each other's results until after all participants had blindly uploaded their results to an “upload only” server 3 weeks after the end of the campaign week.
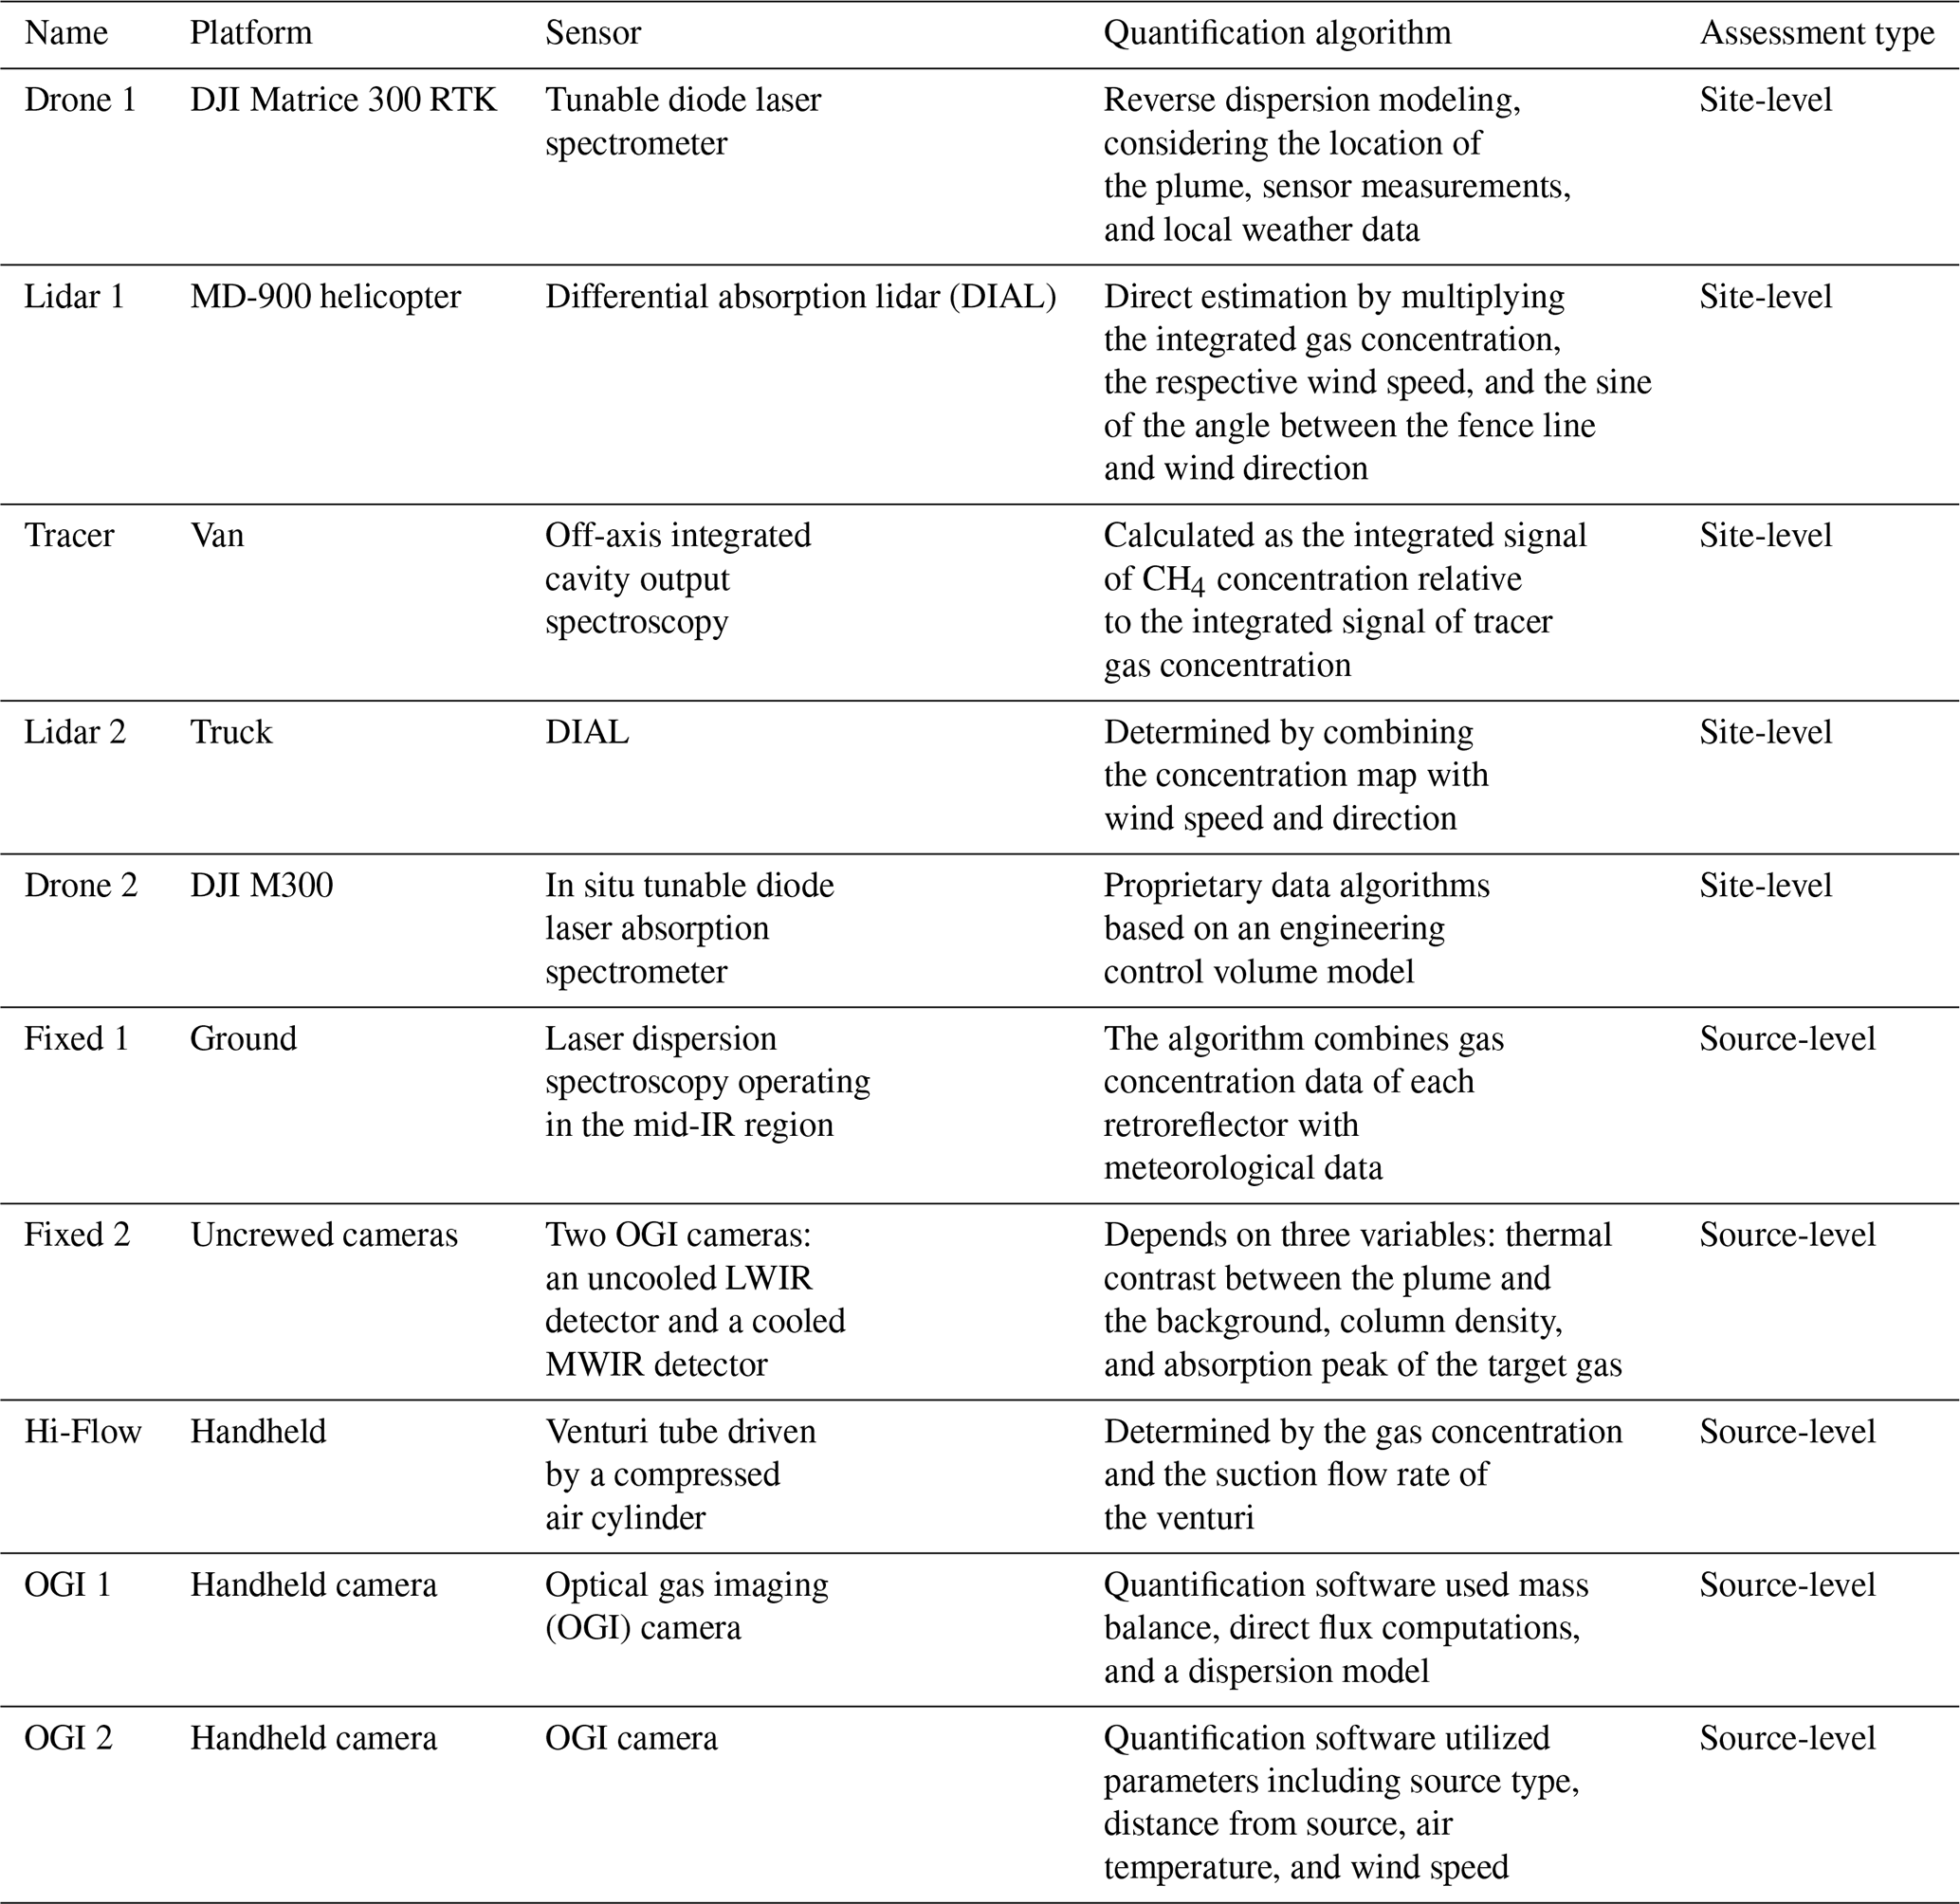
Table 2A summary of the systems participating in the campaign.
The lowest release rates (below 0.5 kg h−1) were dedicated to evaluating the quantification limit, defined here as the lower limit below which a technique does not provide relevant emission estimates.
Due to the linearity of CH4 atmospheric dispersion, we hypothesize that across the releases a threshold will emerge between a “low-concentration regime” (where measured concentrations are commensurate with instrumental accuracies) and a “high-concentration regime” (where instrumental accuracies of methane measurements become negligible compared to methodological approaches or ancillary measurements). This distinction aims to be generic and may not describe the behavior of a particular instrument or method. However, in a low-concentration regime, the relative uncertainties in emission rate estimates are expected to decrease with increasing release rates. The quantification limit should thus correspond to the emission threshold above which the measurement uncertainties are sufficiently low, so that the uncertainty in the emission estimate does not depend on the release rates.
Within each 2 h release, the series of measurements by the different participants were sequenced to minimize the impact of a specific quantification system on others. For example, drones flew sequentially to avoid any collision risk. The helicopter flew over the site only at the very end of the releases to avoid disturbing plume dispersion for other groups. The drones generate turbulence that can influence the structures of the plume measured by other platforms (in particular by Lidar 2), which can perturb the corresponding emission computation. An initial organizational briefing ensured the alignment of all technology providers and the smooth succession of releases and measurements. During the campaign week, constant radio coordination was applied between site coordinators and all involved groups. Experiment details and sequencing technologies were shared with all participants through a paperboard at the site. The different quantification systems relied on different measurement durations to provide release estimates due to this organization but also because they followed different operating protocols.
A sonic anemometer (Vaisala WXT530) attached to a post was located between Areas A and B at 5 m in height to perform wind measurements during the campaign.
The Drone 2 group performed daily background measurements prior to any release (using drone-based optical CH4 measurements). Morning daily concentrations remained within 2.2–2.5 ppm (reported range). These background measurements suggested that there was no large local CH4 source near the site. Therefore, it is unlikely that any significant CH4 enhancement from outside the site influenced the release experiment.
2.4 Participants and measurement systems
Twelve quantification systems were selected based on an internal review by the GERG consortium (GERG, 2021). The ability to detect leaks was not part of the criteria as the present study focuses on quantification. Besides the performance of each measurement system, the criteria included a high technology readiness level (TRL), demonstrated ability to perform such measurements on-site, and the possibility of the service to be performed commercially by an independent operator. Table 2 summarizes the main characteristics of these systems. These quantification systems combine measurement platforms, instruments, and post-processing algorithms to derive emission rates. The systems are based on handheld, vehicle, drone, and airborne mobile platforms and ground-based fixed measurements. The measurement devices include optical gas imaging cameras, DIAL, off-axis integrated cavity output spectroscopy, and tunable diode laser spectrometry, as well as an early prototype direct quantification device, a Venturi effect high flow sampling system, designated subsequently as Hi-Flow.
The operators of each system implemented their own quantification methodologies and developed associated quantification software to derive CH4 emission rates. These approaches include inverse dispersion modeling, mass balance, tracer ratio, and other proprietary data algorithms. The reporting of the emission rates was done according to a specific template.
The self-reporting of uncertainties, however, was not mandatory, and no specific reporting format was required. Six of the systems provided their diagnostics of uncertainties in the estimates (hereafter all uncertainties are provided in terms of 1σ values). Lidar 2 reported expanded uncertainty, providing a 95 % level of confidence.
A company operating two systems, one drone-based and another car-based, withdrew from the experiment and did not report their data. They reported that their measurement protocol was to be optimized.
In addition to these relatively mature technologies, a piece of direct quantification equipment for fugitives was included in the tests. The equipment is a handheld device that used a Venturi tube supplied by a compressed air cylinder (Hi-Flow). This equipment is a prototype with a low TRL, and it was included in this study to assess its performance for fugitive emission quantification.
The primary purpose of the experiments was to assess the ability to infer the total methane emission rate during each release. Therefore, the reporting focused on providing a total emission estimate for each release. During multiple-node releases, we also considered detailed reported estimates for individual nodes from the participants when available. The ability to provide estimates per individual source during a multiple release was considered a desirable feature of site-level quantification techniques.
As a normalized performance indicator, the absolute value of the relative error (called hereafter the “absolute error”; ) was computed for each release and each provider. Eestimate is the estimate provided by a given participant and Ereal is the actual emission rate. The distributions of absolute error are analyzed per release (considering each provider as a single realization) or per provider (considering each release as a different realization).
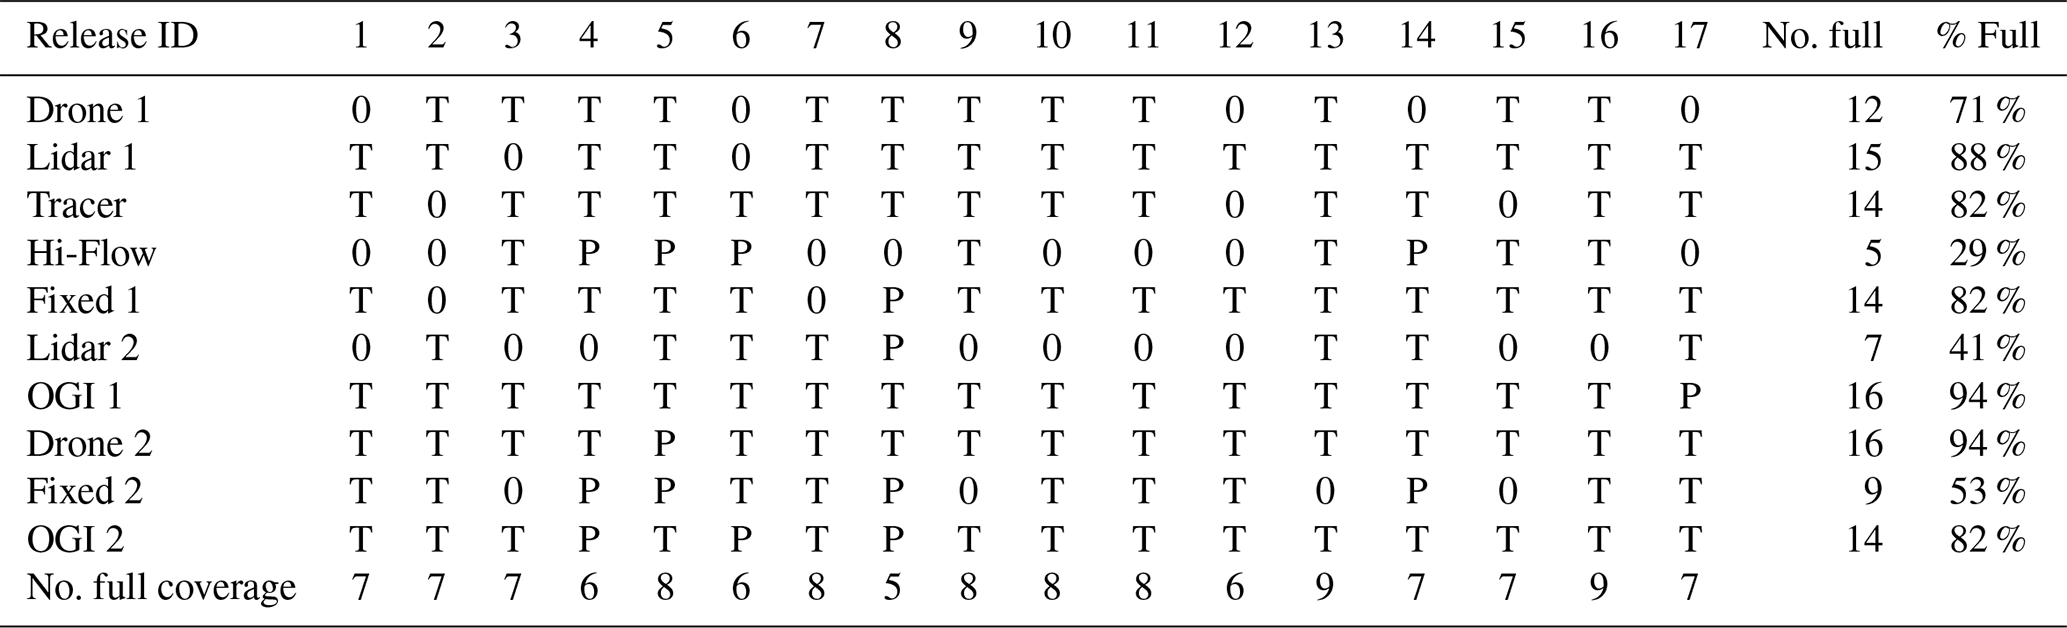
Table 3 gives an overview of the number of results provided by each participant. It indicates, for each experiment, whether a given participant provided the estimate for the total emission rate, a partial emission rate estimate where one or several nodes were missing, or an estimate that is not valid. Overall, there is no single release that was reported by all participants and no system reported all releases; the number of total emission estimates was between 5 and 9 for a given release and between 5 and 16 for a given system. The Hi-Flow prototype was not authorized to work on Nodes 1 and 2, as those nodes were considered risky (difficult to access) for the operator. The limited amount of data reported directly constrained our ability to identify robust statistical relationships between the errors in the release rate estimates and potential drivers of the quantification, such as the meteorological conditions or the type of CH4 releases.
All participants followed their own processes to provide quality control and validate their estimates. Some participants excluded data points considered poor and provided reduced coverage of the releases prioritizing lower uncertainty, while others provided extensive coverage. Each data provider relied on their own judgment and procedures to balance the quantity and quality of the estimates. This consideration is essential when evaluating the respective merits of each system as high overall precision may be a trade-off with high “coverage” of the release rates. It should be noted that in real-life operations, less stringent time constraints may apply, and more time may be available on-site compared to the 2 h per release of the present study. Each provider reported specific limitations and challenges explaining the coverage of the releases after the campaign.
Table 3Overview of valid emission estimates for each release, including the 0.01 and 0.1 kg h−1 releases. The letter indicates the availability of estimation. T: total emissions from emitting nodes were quantified. P: some emitting nodes were measured but not all. 0: no valid value or coverage of non-emitting nodes only. In the case of Lidar 2, some results were considered poor due to the influence of drones during the campaign.
4.1 Qualitative assessment of the total emission estimates per participant
In line with quantifying total site emissions, Fig. 3 compares the total emission estimates provided by each participant with actual total emission rates per release. It displays linear regressions between the estimated and actual emission rates (without weighting the estimates based on the diagnostics of uncertainties).
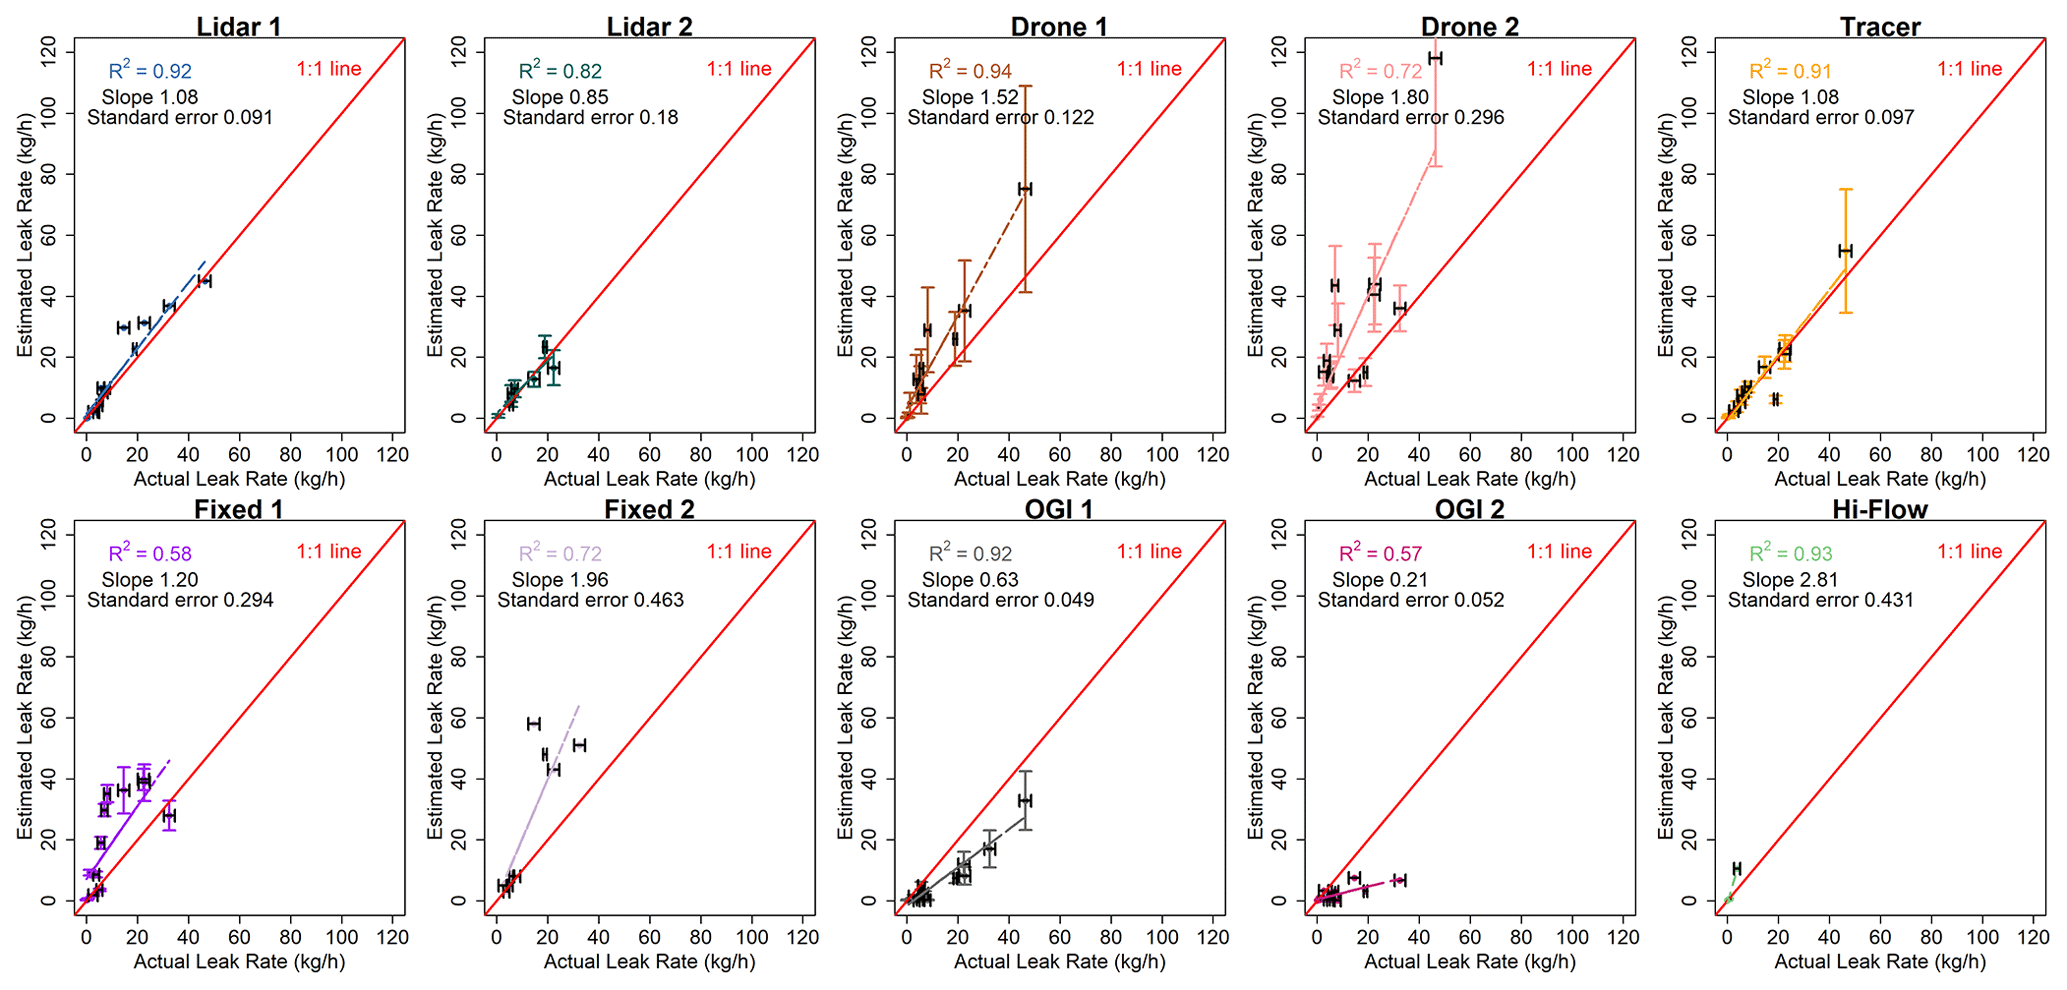
Figure 3Scatter plot of estimated and actual rates for the releases for each participant. Linear regression (dashed line) including the 1:1 line (red) shown for reference. The horizontal uncertainty bars are the 1σ uncertainties in the controlled-release facility. The vertical error bars are the uncertainties provided by the participant.
Regarding estimate biases, Lidar 1 slightly overestimated the emission rates, especially in the middle range of release rates. There was no significant bias in the release estimates from Lidar 2, limited to 22.4 kg h−1. Drone 1 and Drone 2 tended to overestimate emission rates. All estimates but one from Tracer bore errors that fit in the 1σ uncertainty specified for this system. Fixed 1 tended to overestimate the emission rates from 5 to 30 kg h−1. For Fixed 2, the performance was better for lower emissions (below 10 kg h−1) but tended to overestimate the emission rates above 10 kg h−1. In contrast, OGI 1 and OGI 2 tended to underestimate the emission rates, likely influenced by cases where the distance to the node was not be within the recommended range. There was no obvious bias in Hi-Flow's estimates, but it only provided estimates for three single-node releases in the lower rate range: 0.5–3.8 kg h−1.
In summary, the quantification systems of Lidar 1, drones, and both fixed sensors generally overestimated the emission rates (with regression slopes ranging from 1.08 for Lidar 1 to 1.96 for Fixed 2), and the systems of handheld OGI generally underestimated them. The lidars, Drone 1, Tracer, and OGI 1 had relatively high R-squared values (above 0.8). However, two site-level systems did not follow this trend. The estimates from Tracer and Lidar 2 were close to the actual rates. In the present study, the number of results provided by Lidar 2 is too small to assess any biases since they excluded the results for the release tests where the emitting nodes were not caught.
4.2 Total emission release estimates: quantitative synthesis
Figure 4 provides the distribution of absolute error for the series of estimates from each participant, excluding the results for the two smallest releases of 0.01 and 0.1 kg h−1, the specific goal of which was to assess the quantification limits.
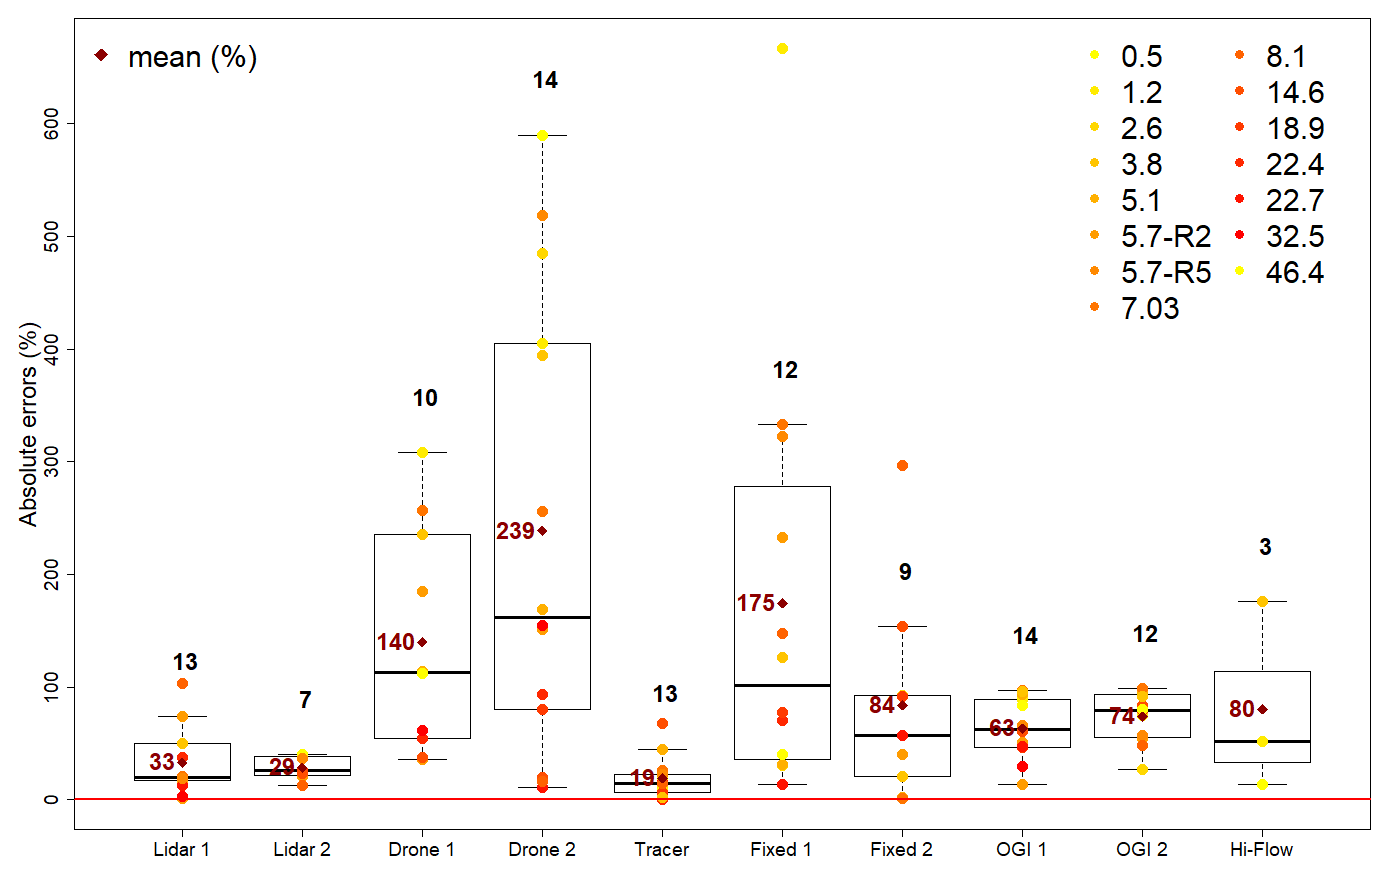
Figure 4Absolute errors for each system, in percent. The color scale corresponds to the actual rates of the different releases, given in the top-right corner (kg h−1). Whisker plots indicate the median, interquartile range, min., and max. (excluding outliers) of the distributions. The average values are also indicated (dark red dot, %). The number of points accounted for in the statistical distribution is indicated on top of each whisker plot. The quantification technologies are ordered from site-level systems (Lidar 1, Lidar 2, Drone 1, Drone 2, and Tracer) on the left to source-level systems (Fixed 1, Fixed 2, OGI 1, OGI 2, and Hi-Flow) on the right.
The absolute errors range from 0 % to 600 %, even when excluding the releases below 0.5 kg h−1. There is a large spread of typical errors in the results from one participant to the other, with average absolute errors per participant ranging from 19 % (for Tracer) to 239 % (for Drone 2). Among the site-level quantification systems, the lidars and Tracer provide estimates with absolute errors typically below 50 %, while estimates from both drones generally bear average absolute errors in excess of 100 %. Fixed sensors provide an intermediate performance, with an average absolute error of 84 % to 175 %. Low wind speeds (below 2 m s−1) combined with a short time window (20 min) to collect data may have challenged the modeling of the dispersion for the processing of drone measurements, and secondary turbulence possibly caused by the drones could explain the drones' high number of errors during the experiment. The different source-level quantification systems provide relatively consistent performance with 63 % to 80 % average absolute errors and absolute errors for any release that generally lie below 100 %. Hi-Flow, which is not commercially available and relies on a particular sampling principle, provided good performance among the source-level measurements but only on three complete release estimates due to deployment limitations, while OGI 1 and OGI 2 provided 14 and 12 estimates, respectively. Furthermore, it is shown in Fig. S2.2 in the Supplement how often the estimates from a system fall within a multiplicative range of the actual values, either between half and twice the actual value or within and 10 times the actual value. Notably, it highlights that some systems provide results with occasional discrepancies of more than 1 order of magnitude (OGI). The table excludes the releases of 0.01 and 0.1 kg h−1. The only system that limits 100 % of its total release estimates to within a factor of 2 (range 0.5–2) has the second-lowest coverage rate (Lidar 2). Conversely, OGI 1 and Drone 2 are within the range of a factor of 2 for only 36 % of the releases. Given its relevance for reconciliation, i.e., ensuring that there is no missing emission, we chose the total emissions from Table 3 to establish these statistics.
4.3 Parameters influencing total release estimates
4.3.1 Role of measurement duration
Measurement duration is one of the factors that influences deployment, along with mobilization and demobilization time. These durations were established by the technology suppliers and are supposed to optimize results. The influence of measurement duration is expected to be the result of two competing effects: (1) integrating more data leads to a decrease in measurement error, and (2) wind (and hence plume position) variation over time may “blur” the data. Here we find that the errors are not correlated with the amount of time used by the different participants to make measurements. Both fixed sensors (Fixed 1 and Fixed 2) integrate measurements over 2 h, while helicopter-based Lidar 1 relies on nearly instantaneous images of the concentration field, with total survey duration measured not in minutes but in seconds. Tracer records on average 2.5 min per measurement leg. To ensure appropriate uncertainty, 20 measurements were conducted per release (in total 45 min measurements). Drones had 20 min to take their measurement.
While the tests analyzed here did not perform sensitivity analysis of measurement duration for each technology, future experiments could support the investigation of how the performance of some techniques relying on integration over measurement durations that can vary would improve with increased duration. At the site level, increasing time coverage for Drone 1, Drone 2, and Lidar 2 can also improve the ability to cover all nodes. For others, this can lead to an overestimation if not considered in the estimation process.
4.3.2 Dependence of error on emission rate
Figure 5 shows the relation of absolute errors to the total emission rate for all 17 releases. The estimates of the 0.01 kg h−1 release bear errors systematically larger than 100 % (100 % for Lidar 1) for all participants' systems and often reach more than 500 % (3300 % for Fixed 1). Therefore, 0.01 kg h−1 could not be quantified by any of these systems. The wind conditions during the smallest release did not appear to be more challenging than during the other releases (wind speed was 2.6 m s−1; see Sect. 4.3.3). Therefore, the low magnitude of this release challenged all types of systems. This finding shows that this leak rate is below the quantification limit for most techniques. Besides this case and even considering the 0.1 kg h−1 release, the range of errors does not appear to decrease with increasing release rates, consistent with expectations in a high-concentration regime. Thus, the quantification limit for most systems (Tracer, Drone 1, Drone 2, Fixed 1, OGI 1, OGI 2, and Hi-Flow) appears to lie between 0.01 and 0.1 kg h−1.
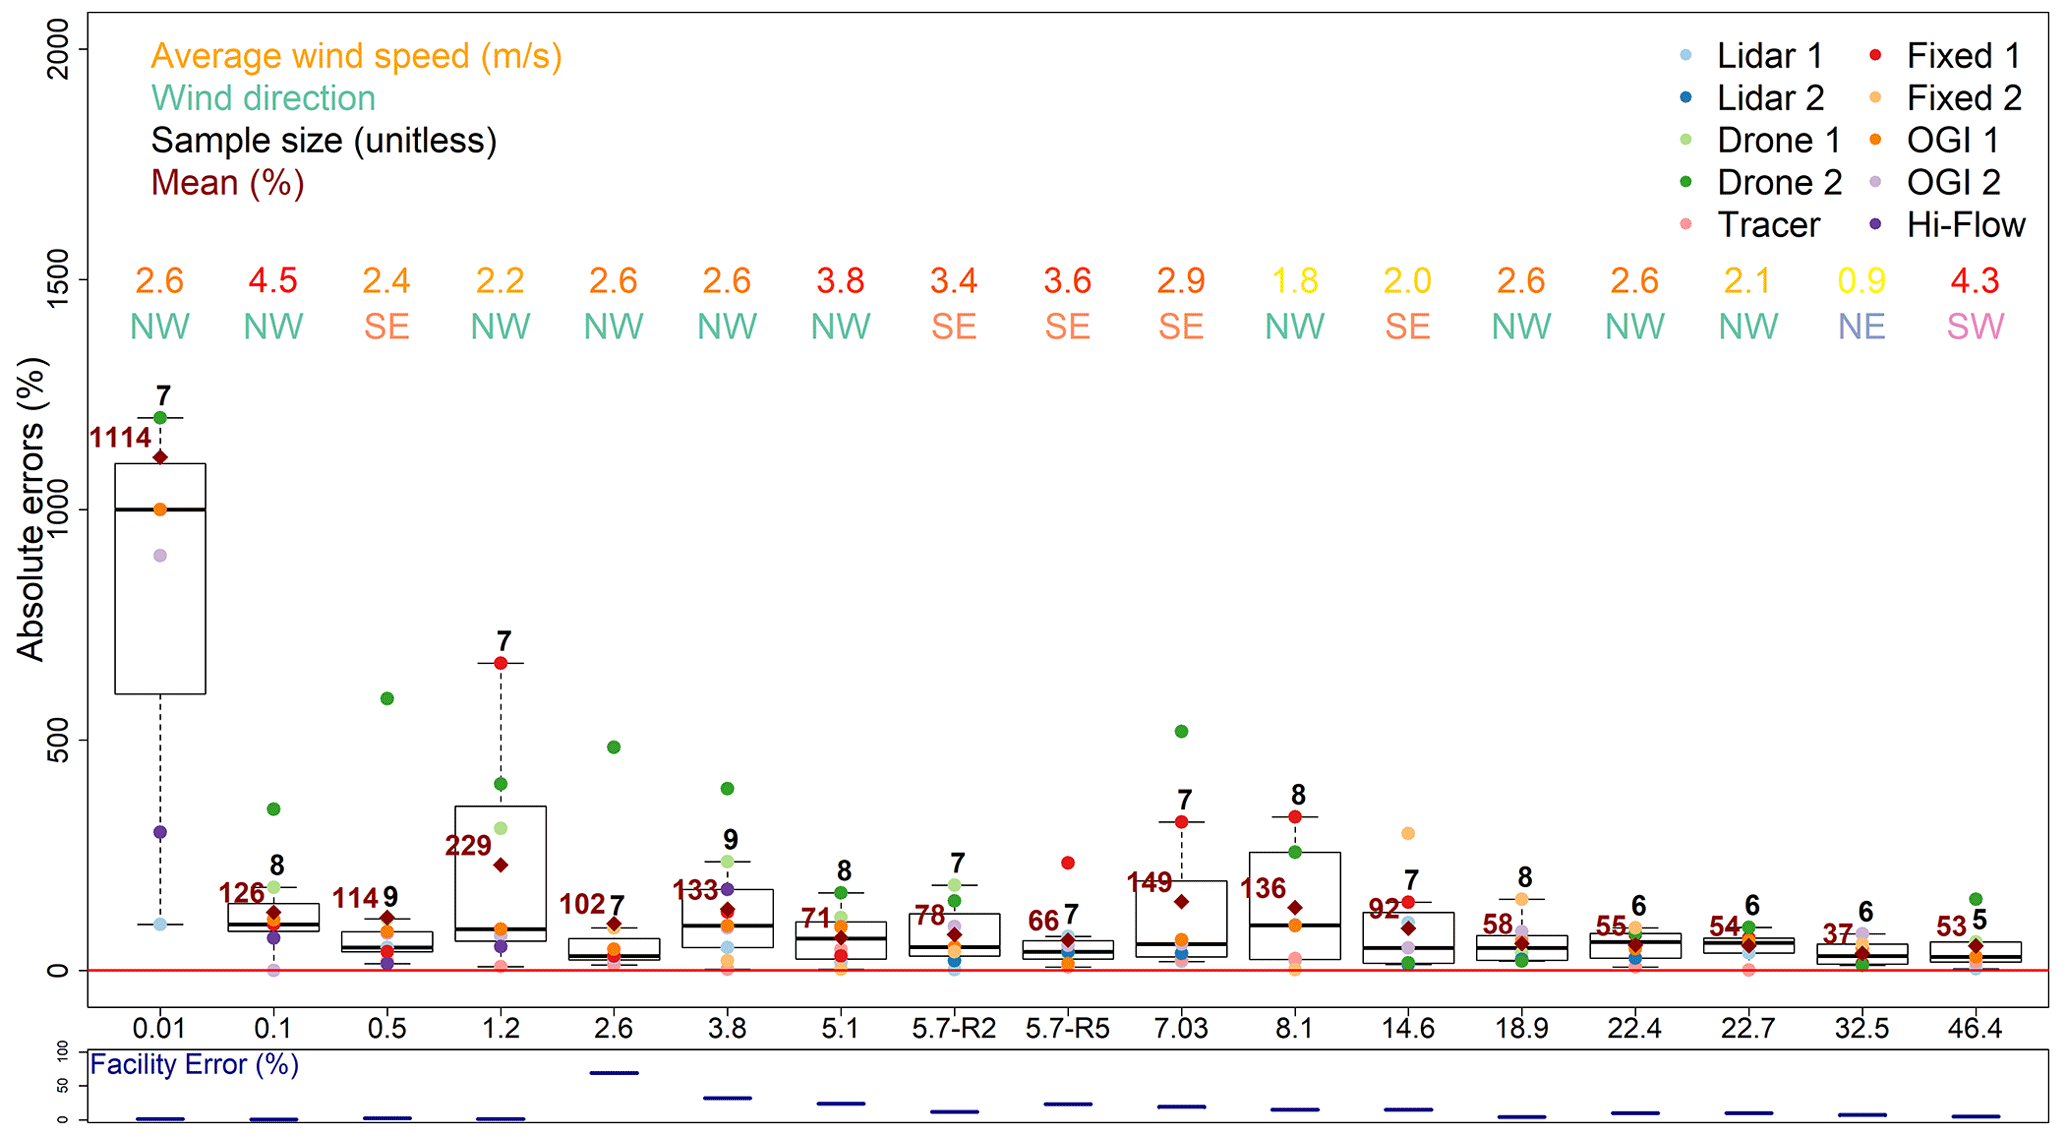
Figure 5Aggregated absolute errors as a function of total release rate. Dot colors correspond to individual participants (top-right legend). Whisker plots indicate the median, interquartile range, min., and max. (excluding outliers) for each release. The average values are also indicated. Average wind speed and direction per release are provided in the upper part of the top panel. The lower panel shows the uncertainty in the release rate (y axis ranging from 0 % to 100 %) for each release.
4.3.3 Role of wind
The amplitude of the signal and the accuracy of the modeling frameworks are expected to depend strongly on wind and turbulence conditions, primarily on wind speed. Low wind speed (below 2 m s−1) can be challenging for those participants relying on atmospheric dispersion models for the quantification of emission rates (Wilson et al., 1976). The wind direction likely plays a role since the positioning of the sensors is constrained by logistical issues, due to the potential overlapping or divergence of plumes from different nodes, and since some directions drive the plume against or close to obstacles impacting the atmospheric flows. Low wind speed values (below 2 m s−1) and specific wind directions prevented some participants from providing valid estimates during specific releases. However, considering the valid estimates, this study did not reveal any clear relationship between the wind speed or direction and the errors. Among the releases for which the errors were significantly larger than for the others is that of 1.2 kg h−1 from Node 5 only and that of 8.1 kg h−1 from Node 4 only, both at a height of 1.5 m and in a congested area. In these cases, the average wind speeds were relatively small, and the wind was blowing from the northwest. Only two other releases above 0.1 kg h−1 were performed from Node 4 and Node 5, with stronger northwest winds and lower scatter. Better performances were reported for other releases, which were conducted under weaker wind conditions and/or with northwest wind. A more thorough examination of individual releases with a high spread in performance is required. Overall, improving wind measurement protocols and upwind or downwind congestion characterization may lead to enhanced accuracy for the leak rate estimates.
4.3.4 Sensitivity to the different types of nodes
In this section, we investigate the influence of specific nodes (with a specific shape, configuration, and/or location; see Sect. 2.1) on the relative errors. Mean absolute errors for single-node releases from Node 1, Node 3, Node 4, and Node 5 are 68 %, 102 %, 113 %, and 172 %, respectively (Table 4). There was no single release from Node 2 only. Node 5 bears larger absolute errors than other nodes. This might be explained by the dedication of Node 5 to the lowest rates and its proximity to the ground. This position may induce a dispersion that is more complicated to capture.
Table 4Distributions of the mean absolute errors (%) across the available total release estimates from the different measurement systems for each release.
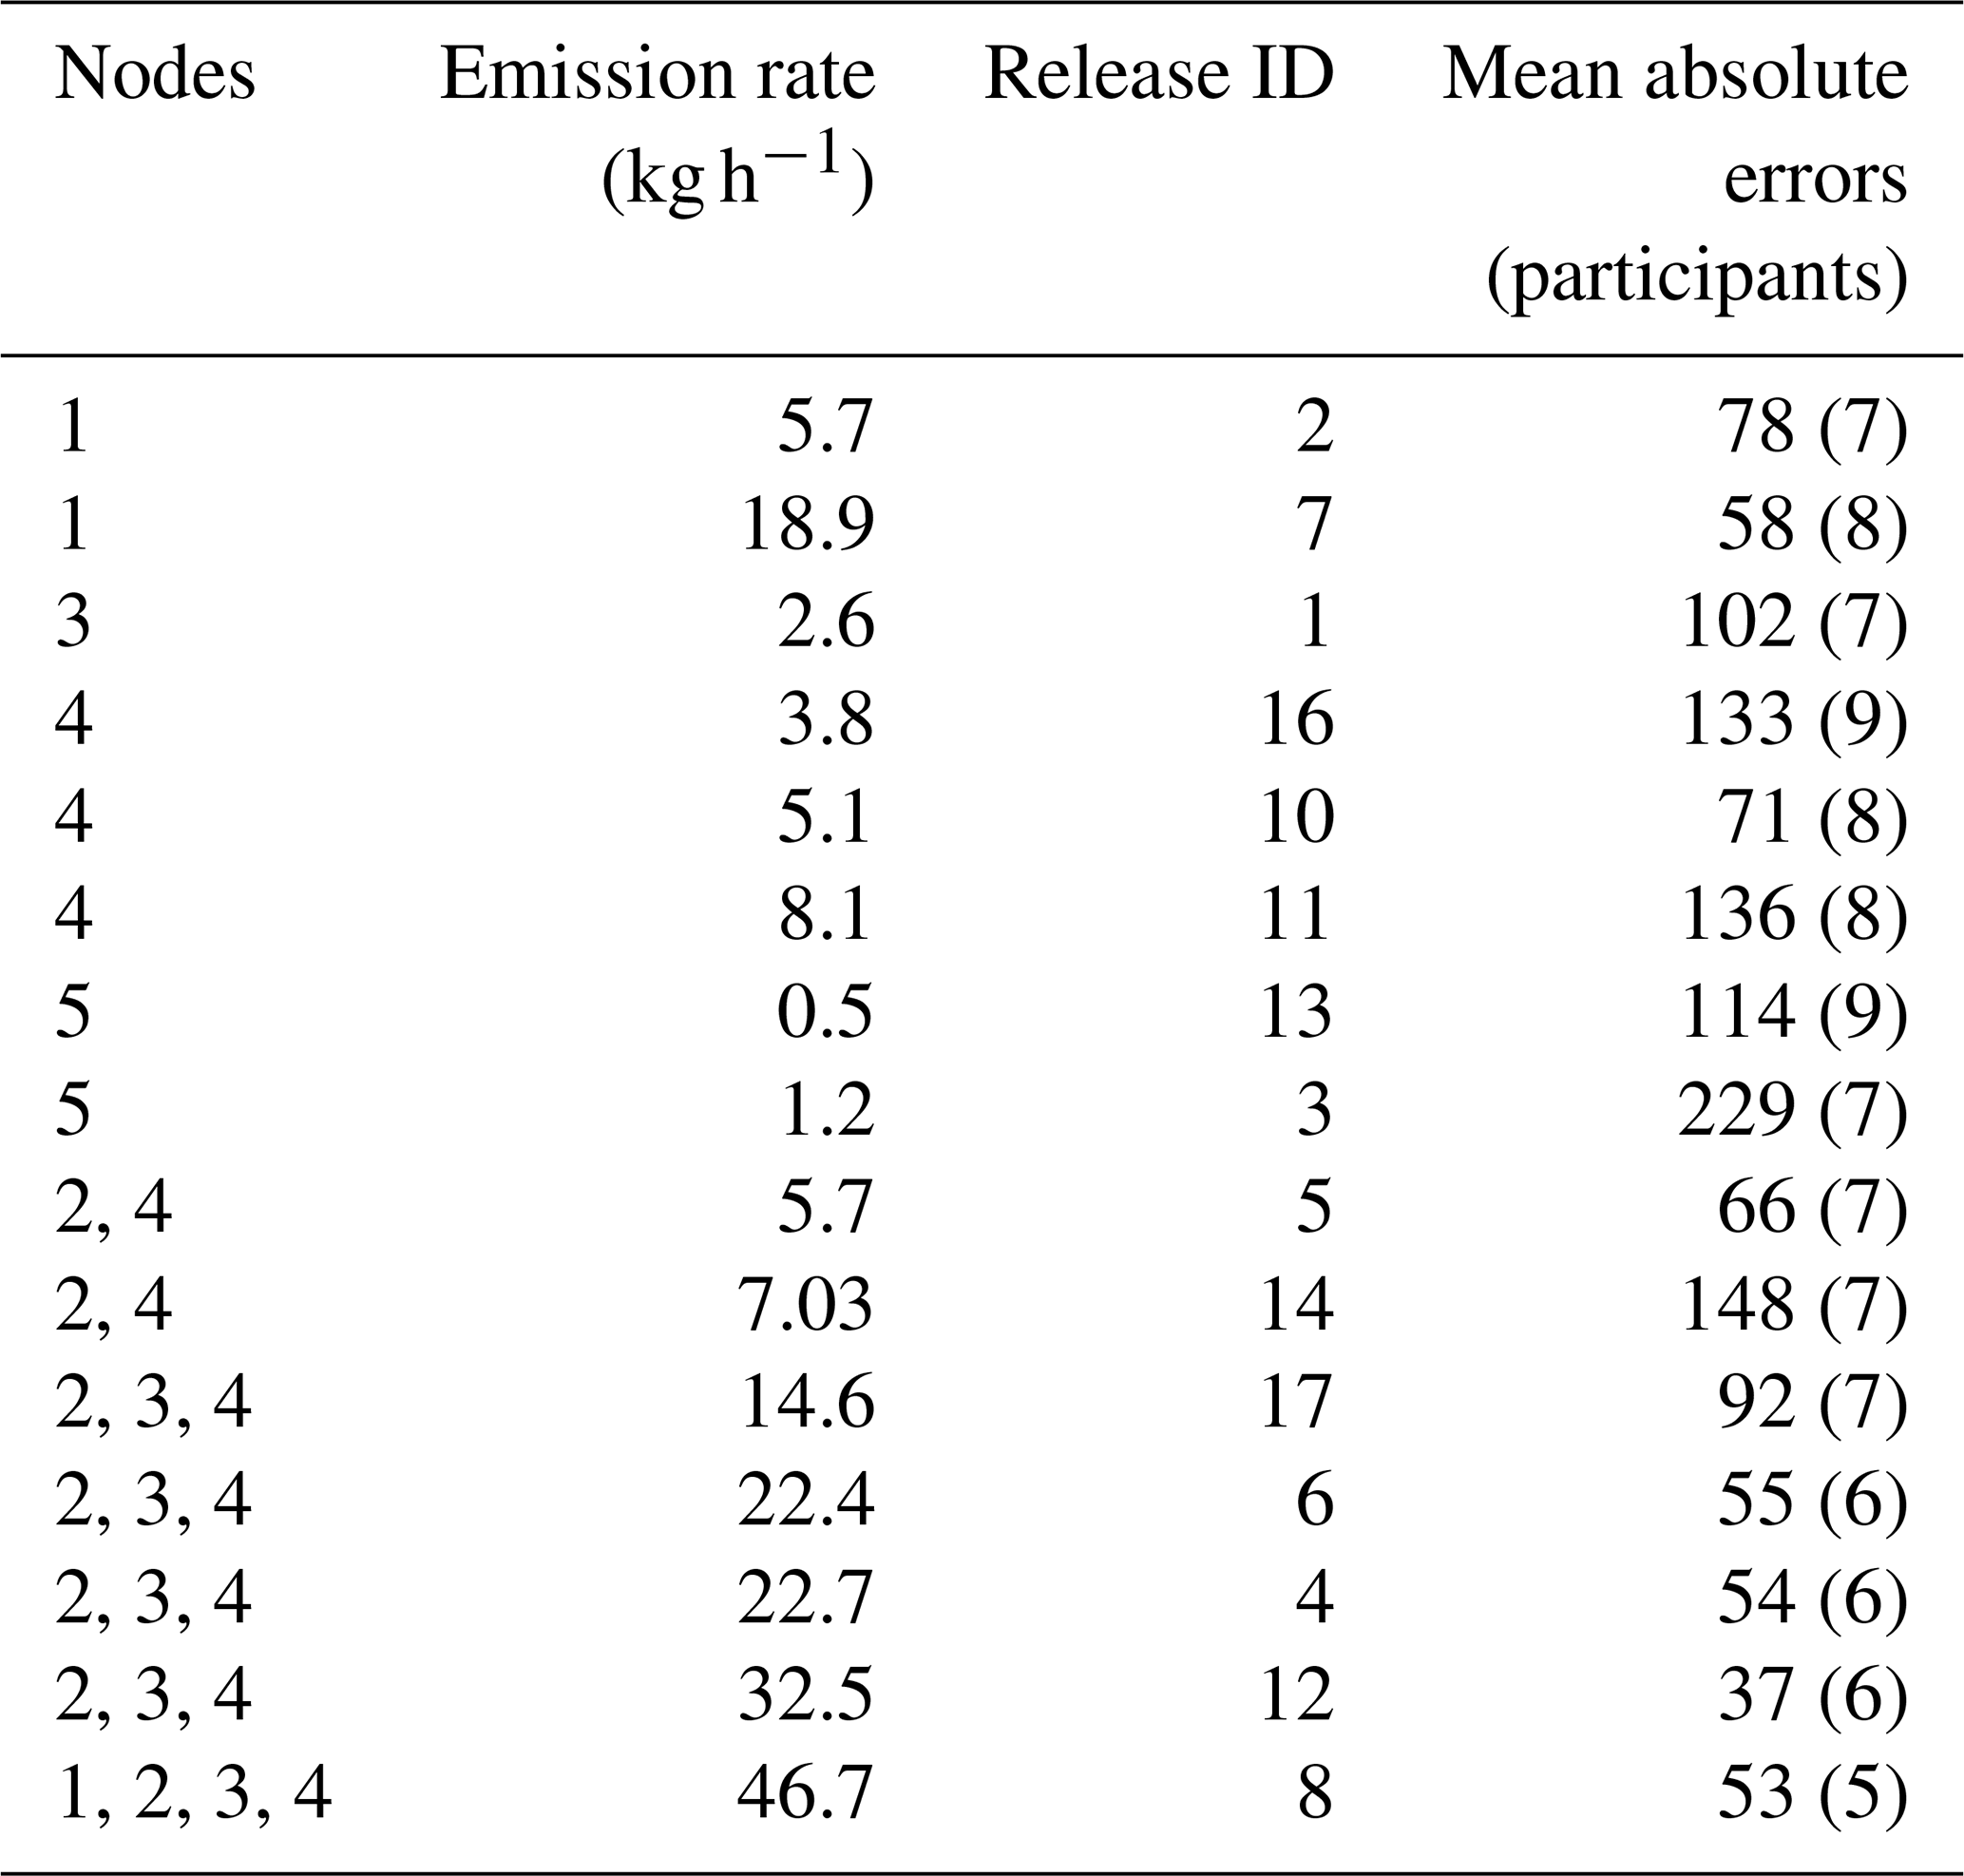
Some nodes may raise specific issues during multiple-node releases, e.g., because they are away from the others and thus require extensive sampling (which is notably the case for Node 1). This ability to perform extensive measurements can be considered a good discriminant of site-level techniques. However, we have only seven multiple-node releases, which systematically include Nodes 2 and 4 and exclude Node 5. This limits our ability to obtain robust conclusions regarding the impact of specific nodes during multiple-node releases.
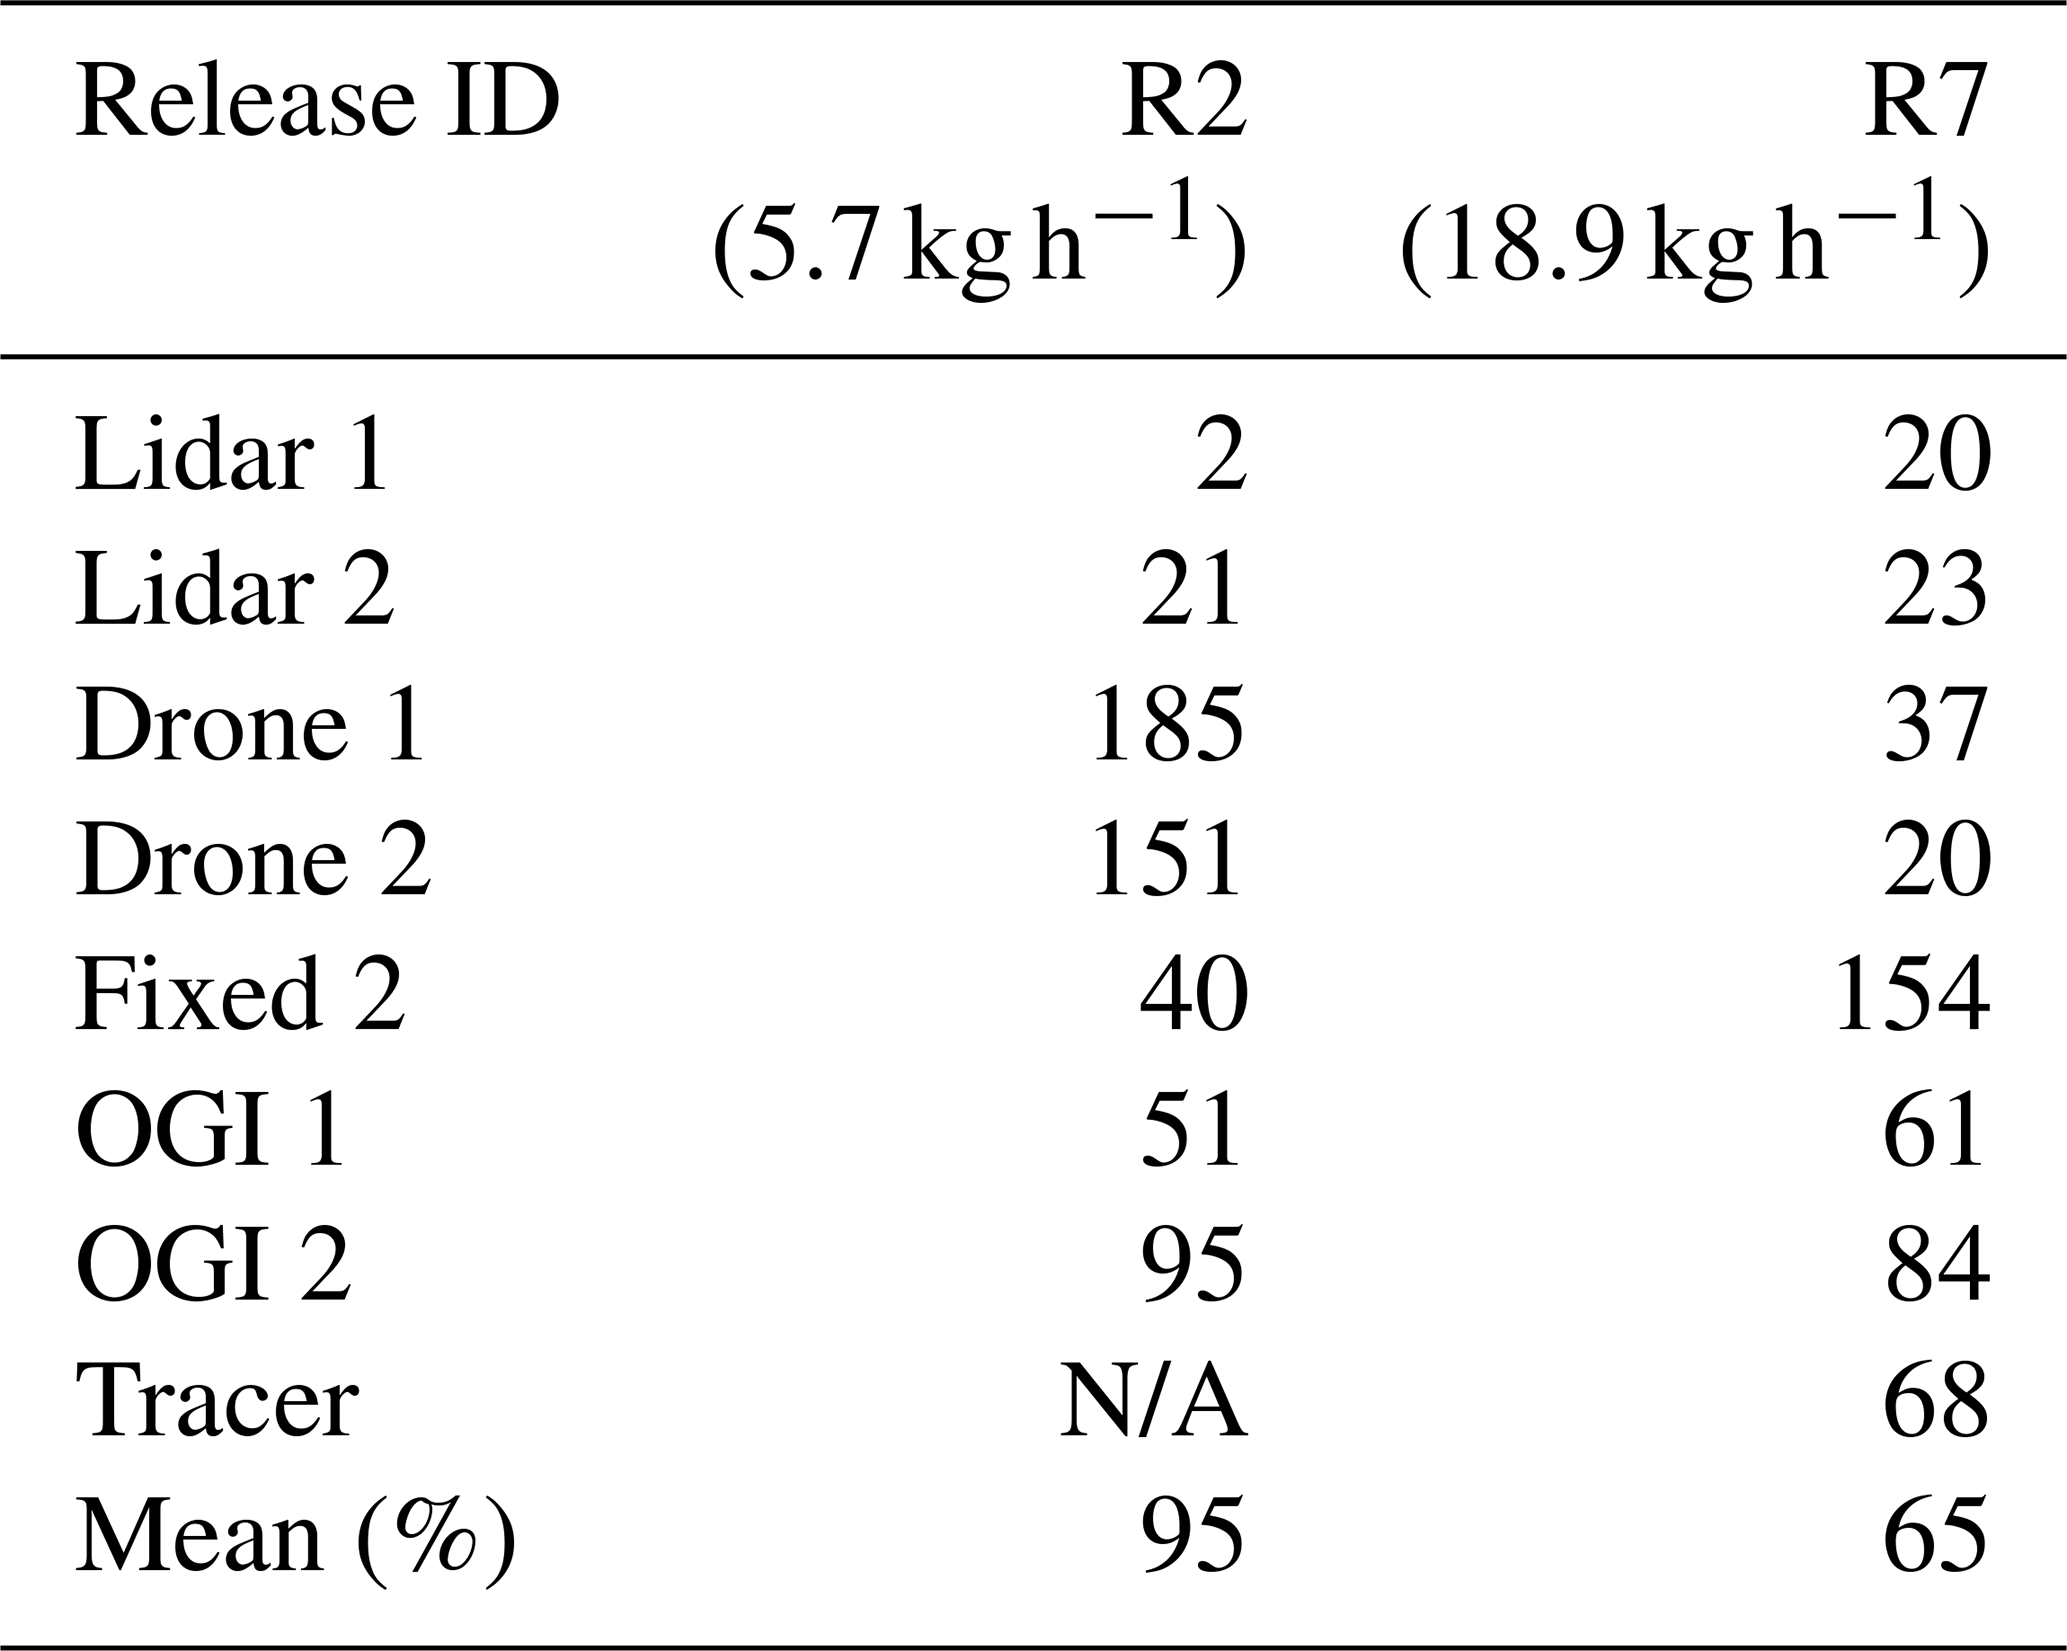
Node 1 (the vent stack) is far away from the other nodes and raises specific challenges for some systems. In particular, Tracer, Fixed 1, and Hi-Flow could not measure Node 1 due to accessibility issues. Its height exceeded the maximum distance of the operating range for OGI 2. Statistics for single-node releases (Table 4) showed that the results for releases from Node 1 are better than for other single-node releases. Table 5 details the results per measurement system for the releases with emissions from Node 1 only. For those releases, Lidar 1 and Lidar 2 provide estimates with less than 25 % absolute errors, and other systems yield more than 50 % absolute errors.
When releases from Node 1 are removed, the best-performing technologies are Tracer, followed by Lidar 2 (limited coverage) and Lidar 1 (see Fig. S2.1). Removing these three releases increases the mean errors in remaining techniques. These results indicate that emissions from Node 1 are easier to quantify than other nodes, likely due to the lack of airflow obstacles. This is put in balance by the challenge represented by measuring at this height for source-level systems.
Table 5Absolute errors (%) for releases from Node 1 (the vent stack).
4.3.5 Is site-level performance better during single-node releases?
Ignoring the releases of 0.01 and 0.1 kg h−1, we have eight single-node releases and seven multiple-node releases, as shown in Table 1. In general, most measurement systems' total estimates of multiple-node releases are better than their estimates of single-node releases (six out of nine systems, by 70 % on average, as shown in Table 6). This result is unexpected since, in principle, it is more challenging to sample and properly analyze information on multiple more-or-less overlapping plumes arising from more-or-less distant sources rather than to sample and analyze a single plume from a single source. It is unclear whether this result is statistically robust or if the number of data points is too limited to reach a robust conclusion on this topic. The result is reassuring, as the purpose of site-level systems is to check whether any emission source may have been missed through the source-level measurements. For some specific techniques (lidars and Fixed 2), the opposite is true: single-node estimates are more accurate than their total estimates for multiple-node releases.
Table 6Distributions of the mean absolute errors (%) of each measurement system of single-node releases, multiple-node releases, and all releases, according to the estimates provided by each participant.
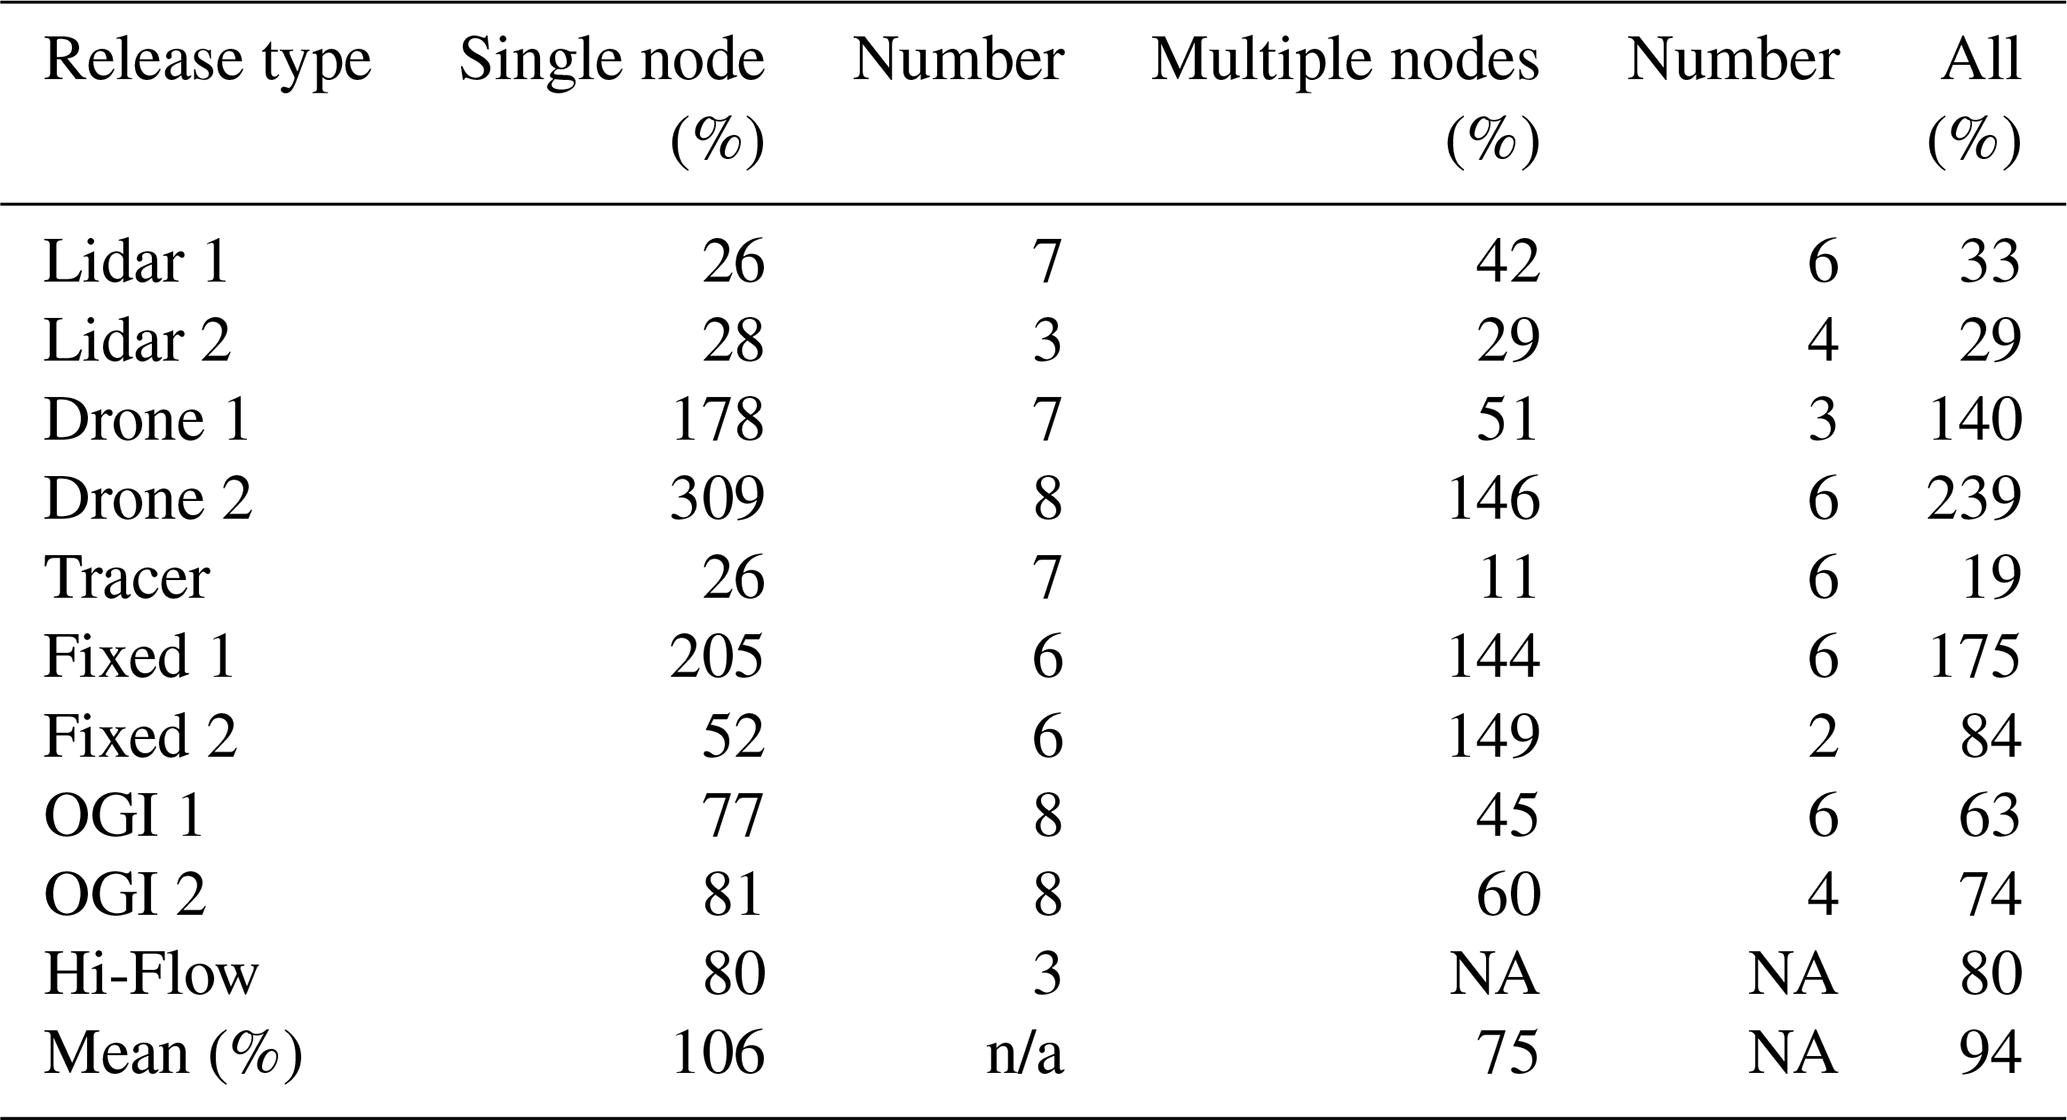
n/a: not applicable. NA: not available.
4.4 From site level to source level: node-level performance
This section aims to assess the potential for mapping and attributing the site-level emissions to different sources (to complement quantifying the total emissions) at an industrial site, focusing on individual nodes. Such single-node estimates were optionally provided during multiple-node releases by some of the measurement systems, which have the capability of distinguishing the signal from the different nodes. In principle, this is a defining feature of source-level systems. However, most site-level techniques had this ability as well. The accessibility of nodes and their location near other leaks have conditioned the provision of valid data by participants.
Figure 6 compares the collective performance of all techniques at the single-node level during single- and multiple-node releases for all the measurement systems. Multiple-node releases were available for all nodes, excluding Node 5. Single-node releases were unavailable from Node 2. The quantification systems perform better on average when no other node emits. Node 3 is quantified with a 51 % mean error when emitting alone, against 127 % when part of a multiple-node release.
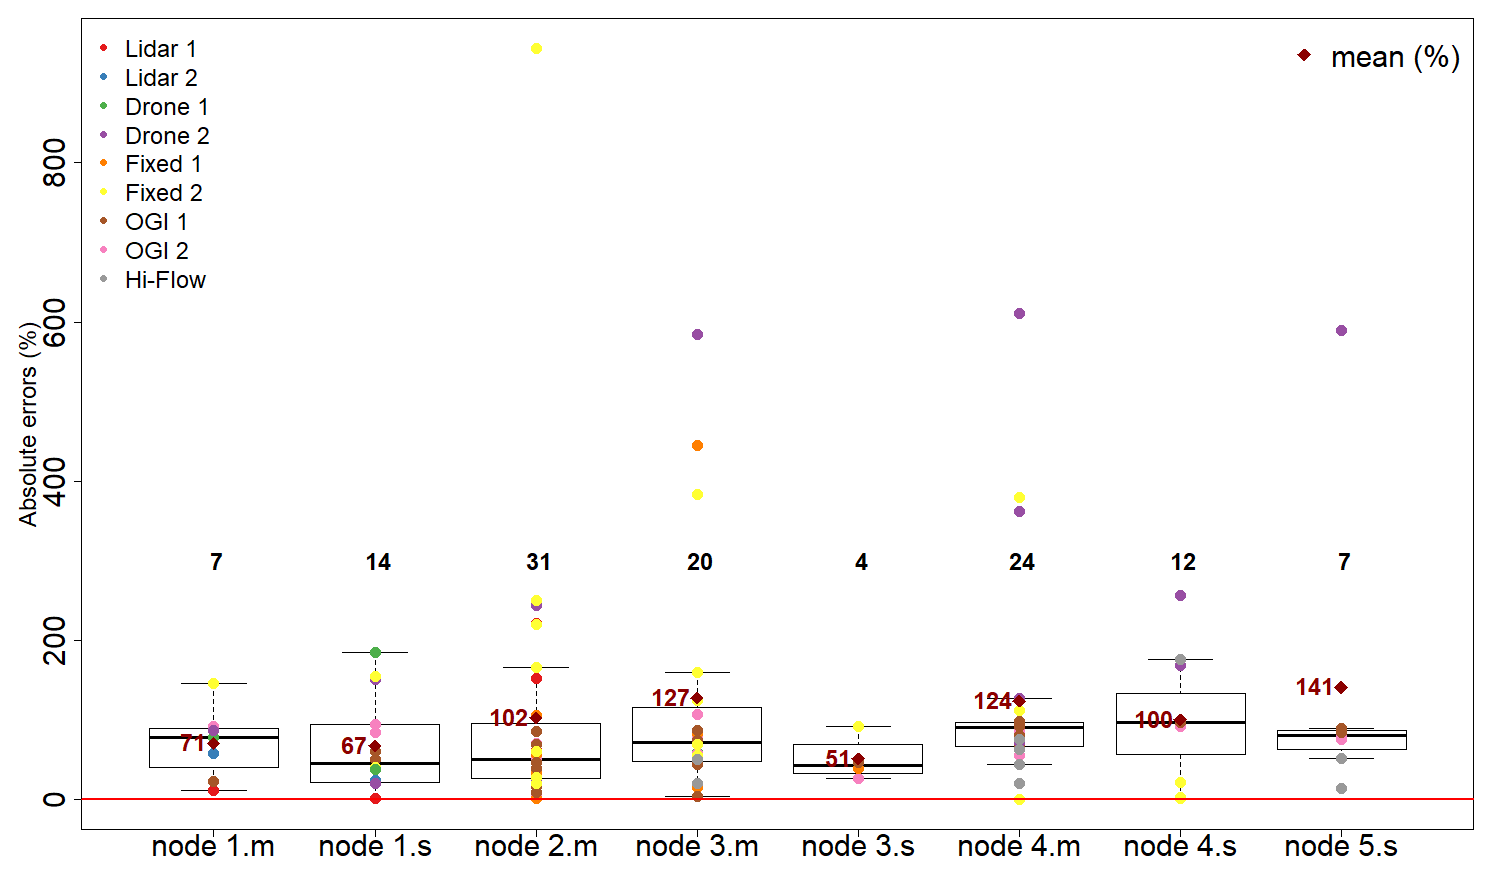
Figure 6Comparison of absolute errors for single-node releases (.s) and multiple-node releases (.m), excluding releases of 0.1 kg h−1 or less. Each point is a participant's node-level estimate.
Similarly, for Node 4, the mean error during the single-node releases is 100 %, increasing to 124 % during multiple-node releases. This effect is less obvious for Node 1 (comparing 67 % and 71 % errors). The generally better performance in quantifying individual nodes when no other node emits is likely linked to the influence of the signal from other emissions in quantifying the individual node. Source-level techniques perform equally well for individual nodes during single- and multiple-node releases. This highlights that good performance at site-level emission quantification does not necessarily imply equal performance at individual source-level quantification and that requirements for leak quantification need to be carefully specified prior to selecting a particular technique.
Focusing now on only single-node estimates during multiple-node releases, absolute errors in individual Nodes 1–4 are 71 %, 102 %, 127 %, and 124 %, respectively. These significantly higher uncertainties for Nodes 2–4 are linked to the fact that they are located in Area B, embedded in a large structure and with many nodes nearby. It could also mean that Node 1 was not accessible to less accurate techniques, creating an artificial favorable bias for Node 1. This directly impacts the uncertainties of Nodes 2–4, with the possibility of combining with a possible overlap in plume dispersion if the wind runs parallel to the alignment of these nodes.
Differences in node-level errors during multiple-node releases across Nodes 2–4 are not statistically significant. There is, therefore, no obvious detectable influence of the node shape on performance in the context of multiple-node releases.
The ability to distinguish individual nodes, even with a slightly degraded performance, is a desirable feature for site-level methods to facilitate reconciliation and verification that all sources are accounted for by source-level methods. This may be a criterion for trade-off between accuracy and the ability to resolve individual sources for a given facility.
Each measurement system had its specific performance for specific combinations of nodes. Fixed 2 showed relatively larger absolute errors for Area A, and Drone 2 showed relatively larger absolute errors for Area B. OGI measurement systems showed relatively stable and smaller absolute errors than other systems during multiple-node releases. In the case of Hi-Flow, its ability to correctly characterize leaks from only certain nodes is aligned with its specifications.
Unsurprisingly, source-level systems are not systematically able to capture all emissions during multiple-node releases due to constraints such as node configuration, wind speed, and wind direction. High-altitude sources like Node 1 may be out of reach for source-level quantification systems. Therefore, for a given need, the operating parameter range has to be accounted for when choosing a system for a specific type of source. Overall, this justifies OGMP 2.0's recommendation to perform reconciliation between two different quantification methods, e.g., a source-level one and a site-level one, to ensure a detailed and robust assessment of emissions.
Table 7 summarizes the findings of the present study. Most systems were able to report the controlled-release rate within an order of magnitude. Lidar 1 and Tracer have demonstrated average absolute errors below 50 % on more than two-thirds of releases. The absolute errors in Lidar 2 and Tracer denote comparable uncertainties (Table 7). Drones specified higher relative uncertainties compared with other measurement systems. Self-reported uncertainties were not available for some systems. Available self-reported uncertainties were determined as the standard deviation of a series of independent realizations based on a theoretical calculation or a fixed value. For most providers, site-level measurement system mean errors are higher than the self-reported uncertainties by technology providers.
Table 7A summary of findings from the present study.
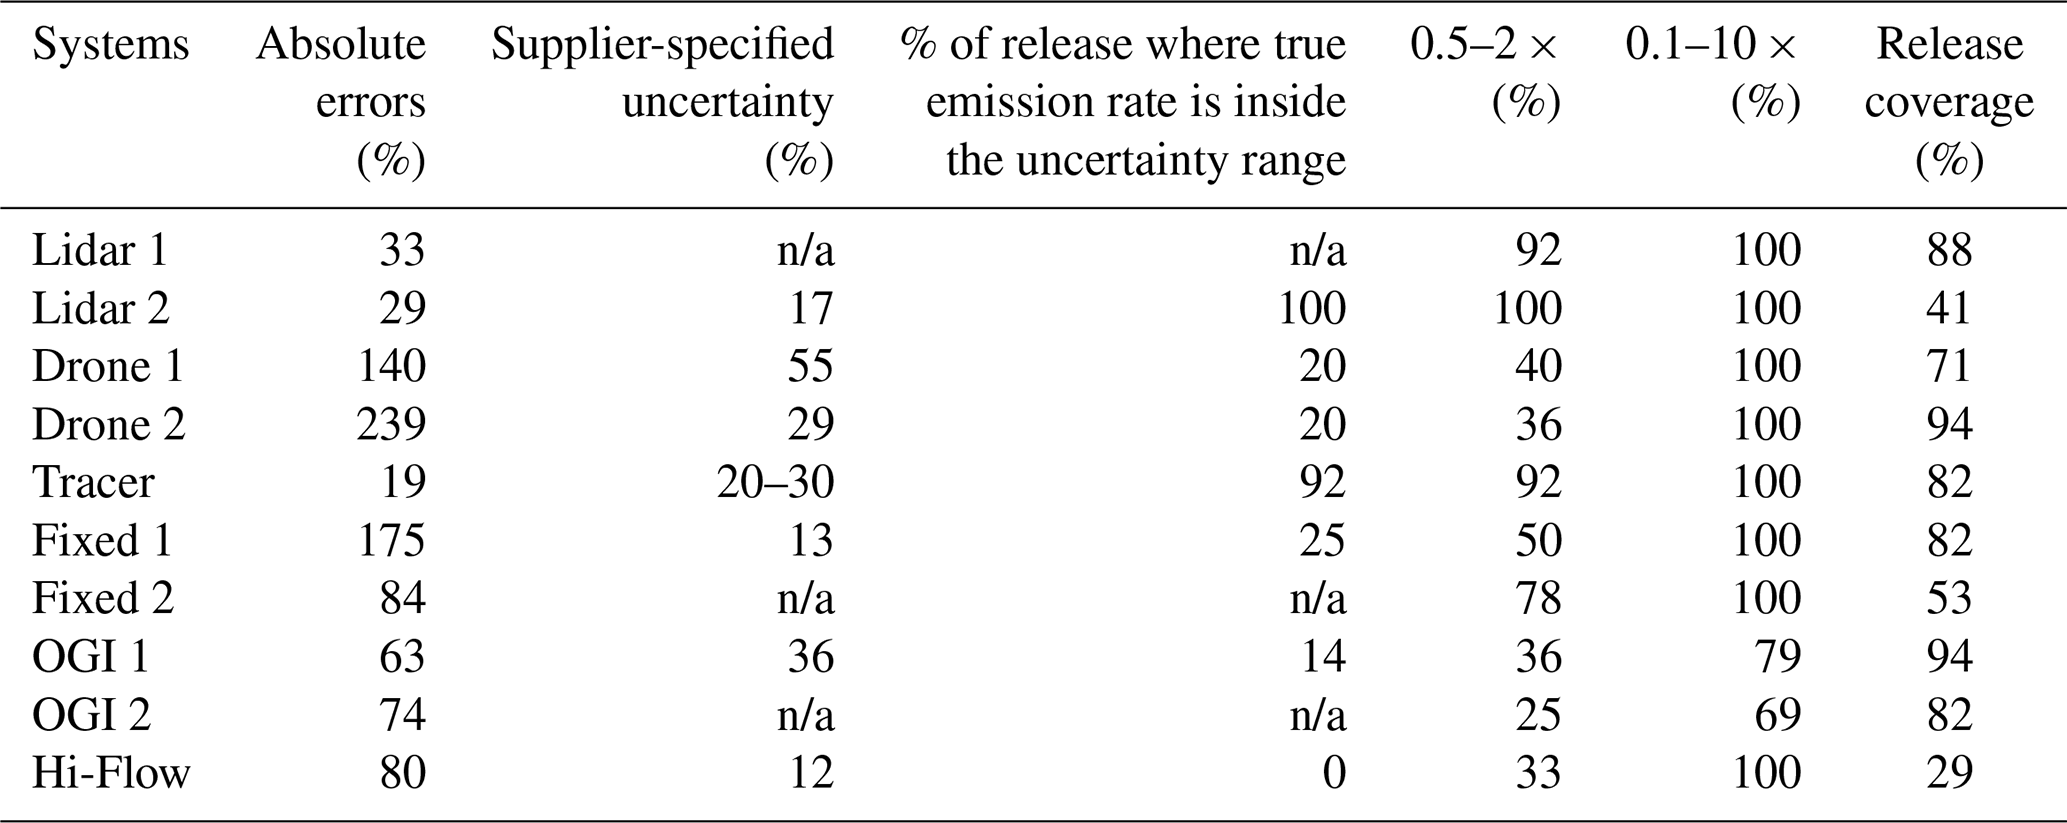
n/a: not applicable.
The limited number of releases (17) implemented did not allow a significant influence to emerge from wind speed and node shape. Nodes clustered in Area B and its structure induced challenging conditions for single-node measurement during multiple-node releases yet were representative of midstream facilities. More controlled-release experiments are needed to acquire more statistics and test the dependence on a wider range of environmental parameters, especially wind conditions. Several of the monitoring techniques would have benefited from longer release durations with longer measurement windows to yield more accurate estimates. However, some specific techniques lacked measurements or favorable measurement conditions during the 2 h releases. Sensor precision may play a role in small release rates but was not demonstrated to influence the releases above 0.1 kg h−1 significantly. There is an apparent random character, mostly technique-dependent, not elucidated in the frame of the present study that could likely be clarified with more data and by comparing atmospheric turbulence and building configurations; longer release duration; and controlled gas temperature, injection speed, and direction.
Only Lidar 1 appears to combine the advantage of site-level techniques and source-level precision, albeit at the cost and footprint of deploying a helicopter. Reliable site-level measurements are in principle useful to (a) identify all leak sources and (b) provide a check for source-level inventories. Source-level measurements allow us to rank fugitive emission sources and to plan lidar campaigns accordingly.
In the present study, the site was positioned in an environment selected for its isolation from other methane sources. In a real-life context with nearby sources (e.g., industrial complex and proximity to agriculture), our assessment of node-level performance in single vs. multiple-node releases (Sect. 4.4) suggests that most measurement systems would see their performance degraded to some extent, depending on the proximity to external sources. With the influence of nearby external sources, the distinction between low-concentration and high-concentration regimes might not hold. Sensor precision would then be expected to play a role in the ability to discern specific plumes of interest from other nearby sources.
The ambitious OGMP 2.0 Level 5 reporting requires complementary site-level measurements such as the ones scrutinized in our study. Level 5 is the highest grade and adds on top of Level 4 a source-level estimate of asset emission based on measurements. The site selected for our study is considered an archetypal site of the natural gas midstream industry that would be using this reporting system. Our study selected the state-of-the-art systems currently available in Europe and able to perform measurements such as those required by OGMP 2.0 for the reconciliation process for Level 5 reporting. In real-life applications, whether or not these measurement systems can fulfill the requirements of this reporting depends not only on individual technology performance but also on the frequency of deployment and reconciliation methodology. However, we have shown that the definition of “site-level” as considered in Level 5 reporting still represents a challenge for measurement systems. Indeed the site-level ability to distinguish individual sources is a bonus, as is the source-level ability to quantify at an area level. Careful consideration of the integration of detection along with quantification, including standalone detection and quantification capability or using complementary detection sensors, would be valuable. This outcome should be taken into account when defining how reconciliation is to be performed. Level 5 requires reconciliation with the source-level estimate, which should be investigated in future research. Finally, we expect a continuous improvement of the accuracy of site-level estimates which may require such intercomparison to be repeated in the future.
We assessed the performance of currently available quantification systems for midstream emissions, based on 17 blind controlled-release experiments. The controlled releases covered a wide range of situations, such as different flow rates (from 0.01 to 50 kg h−1), different release heights (ranging from 1 to 28 m), and different types of gas outlet shapes (e.g., open-ended, ring-shaped, and linear). The analysis attempts to identify environmental and configuration factors limiting performance. Although the measurements were conducted under partially controlled conditions, low wind speed and unavoidable interference between measurement systems have been identified as factors that affect quantification uncertainty.
Overall, the best performers are associated with deployment constraints. Lidar 1 requires the deployment of a helicopter. Although the present study did not investigate detection capability, Lidar 1 on board a helicopter lends itself to being integrated with routine pipeline patrolling. The mobile ground measurements (e.g., Tracer and Lidar 2) had difficulties accessing areas downwind of source emissions based on meteorological and road conditions. Tracer performs well if the acetylene release is well-positioned next to pre-identified leak areas, and roads are available downwind. Lidar 2 had challenges positioning the truck-based platform under certain wind conditions and could cover only 41 % of releases. Lidar 2's sensitivity to wind conditions may be a less stringent limitation in real life than in this experiment. Here, the time constraints of the experiment were fixed in advance and known to the participants. However, in real life, an operational application may allow for more relaxed time constraints and for the ability to wait for favorable wind conditions. Lidar 2's small coverage of tests may imply implementation issues when performing measurements that cover a whole site, as they need to find an appropriate truck location depending on the location of the emissions and the wind direction; further research is needed on this. Ground-based measurements such as Fixed 1, Fixed 2, and OGI have limited detection distances. However, today no single technique may be considered a practical working standard for quantification.
The tracer and helicopter-based lidar appear to be reliable and effective techniques to quantify the emissions accurately. The tracer does not require local dispersion modeling, and the helicopter technique is not constrained by the ground infrastructure. However, the tracer technique could be hampered by an inability to locate the tracer release appropriately to ensure that the tracer atmospheric dispersion reflects the methane one (Ars et al., 2017). Lidars and Tracer show better estimates (below 50 %) of the total emissions among site-level measurement systems, and OGIs (ranging from 63 % for OGI 1 to 74 % for OGI 2) show better and more stable estimates of the individual nodes during multiple-node releases compared with other source-level measurement systems. Therefore, lidars, drones, and Tracer applied together with OGIs have the potential to obtain not only accurate estimates of total emissions but also accurate estimates from each node. Further work is needed to determine how these systems can be applied together to reconcile source-level and site-level quantification.
Data are not publicly available in a repository but can be requested from the corresponding author.
The supplement related to this article is available online at: https://doi.org/10.5194/amt-17-1633-2024-supplement.
YL performed data comparison and synthesis and wrote the manuscript. JDP, GB, VBR, and TMF designed the study. JDP and GB contributed to data analysis, synthesis, and writing of the manuscript. MV, PB, and JS contributed to reviewing and editing the manuscript and provided advice for the study. OW, JGH, CG, CD, CL, ER, YC, AF, JH, FI, NY, RA, HGN, and EC contributed to instrument preparation, fieldwork, and data analysis. DW and RH contributed to field supervision and technical guidance. MI contributed to data acquisition. AM operated the drone. JM contributed to preparation and field supervision. TE and SD contributed to data processing and data analysis. MU contributed to coordination and supervision. AS and SH contributed to data processing and data analysis, as well as supervision of this study. FCM, ARB, PAR, and AFdlF contributed to preparation, fieldwork, supervision, and data analysis. VBR, TMF, and MZ contributed to coordination, supervision, and experiment design. RZ provided valuable feedback as a member of the advisory board.
The contact author has declared that none of the authors has any competing interests.
Publisher’s note: Copernicus Publications remains neutral with regard to jurisdictional claims made in the text, published maps, institutional affiliations, or any other geographical representation in this paper. While Copernicus Publications makes every effort to include appropriate place names, the final responsibility lies with the authors.
We would like to thank Nick Shepherd, Fritjof Biowski, Stefanie Ulbricht, Alberto Wahnon, and Alfredo Badolato for their on-site operations and supervision, making the 1-week experiment move smoothly and Luke Holehouse and Amy Paerson for the data analysis and data visualization. Additionally, we would like to thank pilots Andrew Lake and Juergen Zimmer for performing the drone and helicopter flights on-site.
This research has been supported by GERG members and the project Eastern Mediterranean Middle East-Climate & Atmosphere Research Center (EMME-CARE), which has received funding from the European Union's Horizon 2020 research and innovation programme under grant agreement no. 856612 and from the Cyprus Government.
This paper was edited by Dominik Brunner and reviewed by Andrew Feitz and one anonymous referee.
Albertson, J. D., Harvey, T., Foderaro, G., Zhu, P., Zhou, X., Ferrari, S., Amin, M. S., Modrak, M., Brantley, H., and Thoma, E. D.: A Mobile Sensing Approach for Regional Surveillance of Fugitive Methane Emissions in Oil and Gas Production, Environ. Sci. Technol., 50, 2487–2497, https://doi.org/10.1021/acs.est.5b05059, 2016.
Allen, D. T.: Methane emissions from natural gas production and use: reconciling bottom-up and top-down measurements, Curr. Opin. Chem. Eng., 5, 78–83, https://doi.org/10.1016/j.coche.2014.05.004, 2014.
Allen, D. T., Torres, V. M., Thomas, J., Sullivan, D. W., Harrison, M., Hendler, A., Herndon, S. C., Kolb, C. E., Fraser, M. P., Hill, A. D., Lamb, B. K., Miskimins, J., Sawyer, R. F., and Seinfeld, J. H.: Measurements of methane emissions at natural gas production sites in the United States, P. Natl. Acad. Sci. USA, 110, 17768–17773, https://doi.org/10.1073/pnas.1304880110, 2013.
Alvarez, R. A., Zavala-Araiza, D., Lyon, D. R., Allen, D. T., Barkley, Z. R., Brandt, A. R., Davis, K. J., Herndon, S. C., Jacob, D. J., Karion, A., Kort, E. A., Lamb, B. K., Lauvaux, T., Maasakkers, J. D., Marchese, A. J., Omara, M., Pacala, S. W., Peischl, J., Robinson, A. L., Shepson, P. B., Sweeney, C., Townsend-Small, A., Wofsy, S. C., and Hamburg, S. P.: Assessment of methane emissions from the U.S. oil and gas supply chain, Science, 361, eaar7204, https://doi.org/10.1126/science.aar7204, 2018.
Ars, S., Broquet, G., Yver Kwok, C., Roustan, Y., Wu, L., Arzoumanian, E., and Bousquet, P.: Statistical atmospheric inversion of local gas emissions by coupling the tracer release technique and local-scale transport modelling: a test case with controlled methane emissions, Atmos. Meas. Tech., 10, 5017–5037, https://doi.org/10.5194/amt-10-5017-2017, 2017.
Balcombe, P., Anderson, K., Speirs, J., Brandon, N., and Hawkes, A.: The Natural Gas Supply Chain: The Importance of Methane and Carbon Dioxide Emissions, ACS Sustainable Chem. Eng., 5, 3–20, https://doi.org/10.1021/acssuschemeng.6b00144, 2017.
Bell, C. S., Vaughn, T. L., Zimmerle, D., Herndon, S. C., Yacovitch, T. I., Heath, G. A., Pétron, G., Edie, R., Field, R. A., Murphy, S. M., Robertson, A. M., and Soltis, J.: Comparison of methane emission estimates from multiple measurement techniques at natural gas production pads, Elementa: Science of the Anthropocene, 5, 79, https://doi.org/10.1525/elementa.266, 2017.
Bell, C. S., Vaughn, T., and Zimmerle, D.: Evaluation of next generation emission measurement technologies under repeatable test protocols, Elementa: Science of the Anthropocene, 8, 32, https://doi.org/10.1525/elementa.426, 2020.
BP: Statistical Review of World Energy 2022, https://www.bp.com/content/dam/bp/bussiness-sites/en/global/corporate/pdfs/energy-economics/statistics/statistical-review/bp-stats-review-2022-full-report.pdf (last access: 29 September 2022), 2022.
Cooper, J., Balcombe, P., and Hawkes, A.: The quantification of methane emissions and assessment of emissions data for the largest natural gas supply chains, J. Clean. Prod., 320, 128856, https://doi.org/10.1016/j.jclepro.2021.128856, 2021.
Crow, D. J. G., Balcombe, P., Brandon, N., and Hawkes, A. D.: Assessing the impact of future greenhouse gas emissions from natural gas production, Sci. Total Environ., 668, 1242–1258, https://doi.org/10.1016/j.scitotenv.2019.03.048, 2019.
Defratyka, S. M., Paris, J.-D., Yver-Kwok, C., Loeb, D., France, J., Helmore, J., Yarrow, N., Gros, V., and Bousquet, P.: Ethane measurement by Picarro CRDS G2201-i in laboratory and field conditions: potential and limitations, Atmos. Meas. Tech., 14, 5049–5069, https://doi.org/10.5194/amt-14-5049-2021, 2021a.
Defratyka, S. M., Paris, J.-D., Yver-Kwok, C., Fernandez, J. M., Korben, P., and Bousquet, P.: Mapping Urban Methane Sources in Paris, France, Environ. Sci. Technol., 55, 8583–8591,https://doi.org/10.1021/acs.est.1c00859, 2021b.
Duren, R. M., Thorpe, A. K., Foster, K. T., Rafiq, T., Hopkins, F. M., Yadav, V., Bue, B. D., Thompson, D. R., Conley, S., Colombi, N. K., Frankenberg, C., McCubbin, I. B., Eastwood, M. L., Falk, M., Herner, J. D., Croes, B. E., Green, R. O., and Miller, C. E.: California's methane super-emitters, Nature, 575, 180–184, https://doi.org/10.1038/s41586-019-1720-3, 2019.
Feitz, A., Schroder, I., Phillips, F., Coates, T., Negandhi, K., Day, S., Luhar, A., Bhatia, S., Edwards, G., Hrabar, S., Hernandez, E., Wood, B., Naylor, T., Kennedy, M., Hamilton, M., Hatch, M., Malos, J., Kochanek, M., Reid, P., Wilson, J., Deutscher, N., Zegelin, S., Vincent, R., White, S., Ong, C., George, S., Maas, P., Towner, S., Wokker, N., and Griffith, D.: The Ginninderra CH4 and CO2 release experiment: An evaluation of gas detection and quantification techniques, Int. J. Greenh. Gas Con., 70, 202–224, https://doi.org/10.1016/j.ijggc.2017.11.018, 2018.
Edie, R., Robertson, A. M., Field, R. A., Soltis, J., Snare, D. A., Zimmerle, D., Bell, C. S., Vaughn, T. L., and Murphy, S. M.: Constraining the accuracy of flux estimates using OTM 33A, Atmos. Meas. Tech., 13, 341–353, https://doi.org/10.5194/amt-13-341-2020, 2020.
Foulds, A., Allen, G., Shaw, J. T., Bateson, P., Barker, P. A., Huang, L., Pitt, J. R., Lee, J. D., Wilde, S. E., Dominutti, P., Purvis, R. M., Lowry, D., France, J. L., Fisher, R. E., Fiehn, A., Pühl, M., Bauguitte, S. J. B., Conley, S. A., Smith, M. L., Lachlan-Cope, T., Pisso, I., and Schwietzke, S.: Quantification and assessment of methane emissions from offshore oil and gas facilities on the Norwegian continental shelf, Atmos. Chem. Phys., 22, 4303–4322, https://doi.org/10.5194/acp-22-4303-2022, 2022.
Gardiner, T., Helmore, J., Innocenti, F., and Robinson, R.: Field Validation of Remote Sensing Methane Emission Measurements, Remote Sens.-Basel, 9, 956, https://doi.org/10.3390/rs9090956, 2017.
GERG: 'Technology Benchmark for site-level methane emissions quantification' – Phase I-GERG, https://www.gerg.eu/projects/methane-emissions/gerg- technology-benchmark-for-site-level-methane-emissions- quantification-phase-ii-a/ (last access: 7 March 2024), 2021.
GIE (Gas Infrastructure Europe) and MARCOGAZ: Potential ways the gas industry can contribute to the reduction of methane emissions, https://ec.europa.eu/info/sites/default/files/gie-marcogaz_-_report_-_reduction_of_methane_emissions.pdf (last access: 13 October 2022), 2019.
Harriss, R., Alvarez, R. A., Lyon, D., Zavala-Araiza, D., Nelson, D., and Hamburg, S. P.: Using Multi-Scale Measurements to Improve Methane Emission Estimates from Oil and Gas Operations in the Barnett Shale Region, Texas, Environ. Sci. Technol., 49, 7524–7526, https://doi.org/10.1021/acs.est.5b02305, 2015.
IEA: International Energy Agency: Global Energy Review, https://www.iea.org/reports/global-energy-review-2021 (last access: 22 September 2022), 2021.
IPCC: Climate Change 2021: The Physical Science Basis. Contribution of Working Group I to the Sixth Assessment Report of the Intergovernmental Panel on Climate Change, edited by: Masson-Delmotte, V., Zhai, P., Pirani, A., Connors, S. L., Péan, C., Berger, S., Caud, N., Chen, Y., Goldfarb, L., Gomis, M. I., Huang, M., Leitzell, K., Lonnoy, E., Matthews, J. B. R., Maycock, T. K., Waterfield, T., Yelekçi, O., Yu, R., and Zhou, B., Cambridge University Press, Cambridge, United Kingdom and New York, NY, USA, in press, https://doi.org/10.1017/9781009157896, 2021.
Johnson, M. R., Tyner, D. R., and Szekeres, A. J.: Blinded evaluation of airborne methane source detection using Bridger Photonics LiDAR, Remote Sens. Environ., 259, 112418, https://doi.org/10.1016/j.rse.2021.112418, 2021.
Kumar, P., Broquet, G., Yver-Kwok, C., Laurent, O., Gichuki, S., Caldow, C., Cropley, F., Lauvaux, T., Ramonet, M., Berthe, G., Martin, F., Duclaux, O., Juery, C., Bouchet, C., and Ciais, P.: Mobile atmospheric measurements and local-scale inverse estimation of the location and rates of brief CH4 and CO2 releases from point sources, Atmos. Meas. Tech., 14, 5987–6003, https://doi.org/10.5194/amt-14-5987-2021, 2021.
Kumar, P., Broquet, G., Caldow, C., Laurent, O., Gichuki, S., Cropley, F., Yver-Kwok, C., Fontanier, B., Lauvaux, T., Ramonet, M., Shah, A., Berthe, G., Martin, F., Duclaux, O., Juery, C., Bouchet, C., Pitt, J., and Ciais, P.: Near-field atmospheric inversions for the localization and quantification of controlled methane releases using stationary and mobile measurements, Q. J Roy. Meteor. Soc., 148, 1886–1912, https://doi.org/10.1002/qj.4283, 2022.
Morales, R., Ravelid, J., Vinkovic, K., Korbeń, P., Tuzson, B., Emmenegger, L., Chen, H., Schmidt, M., Humbel, S., and Brunner, D.: Controlled-release experiment to investigate uncertainties in UAV-based emission quantification for methane point sources, Atmos. Meas. Tech., 15, 2177–2198, https://doi.org/10.5194/amt-15-2177-2022, 2022.
Olczak, M., Piebalgs, A., and Balcombe, P.: Methane regulation in the EU: Stakeholder perspectives on MRV and emissions reductions, Environ. Sci. Policy, 137, 314–322, https://doi.org/10.1016/j.envsci.2022.09.002, 2022.
Paris, J.-D., Riandet, A., Bourtsoukidis, E., Delmotte, M., Berchet, A., Williams, J., Ernle, L., Tadic, I., Harder, H., and Lelieveld, J.: Shipborne measurements of methane and carbon dioxide in the Middle East and Mediterranean areas and the contribution from oil and gas emissions, Atmos. Chem. Phys., 21, 12443–12462, https://doi.org/10.5194/acp-21-12443-2021, 2021.
Petäjä, T., Duplissy, E.-M., Tabakova, K., Schmale, J., Altstädter, B., Ancellet, G., Arshinov, M., Balin, Y., Baltensperger, U., Bange, J., Beamish, A., Belan, B., Berchet, A., Bossi, R., Cairns, W. R. L., Ebinghaus, R., El Haddad, I., Ferreira-Araujo, B., Franck, A., Huang, L., Hyvärinen, A., Humbert, A., Kalogridis, A.-C., Konstantinov, P., Lampert, A., MacLeod, M., Magand, O., Mahura, A., Marelle, L., Masloboev, V., Moisseev, D., Moschos, V., Neckel, N., Onishi, T., Osterwalder, S., Ovaska, A., Paasonen, P., Panchenko, M., Pankratov, F., Pernov, J. B., Platis, A., Popovicheva, O., Raut, J.-C., Riandet, A., Sachs, T., Salvatori, R., Salzano, R., Schröder, L., Schön, M., Shevchenko, V., Skov, H., Sonke, J. E., Spolaor, A., Stathopoulos, V. K., Strahlendorff, M., Thomas, J. L., Vitale, V., Vratolis, S., Barbante, C., Chabrillat, S., Dommergue, A., Eleftheriadis, K., Heilimo, J., Law, K. S., Massling, A., Noe, S. M., Paris, J.-D., Prévôt, A. S. H., Riipinen, I., Wehner, B., Xie, Z., and Lappalainen, H. K.: Overview: Integrative and Comprehensive Understanding on Polar Environments (iCUPE) – concept and initial results, Atmos. Chem. Phys., 20, 8551–8592, https://doi.org/10.5194/acp-20-8551-2020, 2020.
Ravikumar, A. P., Sreedhara, S., Wang, J., Englander, J., Roda-Stuart, D., Bell, C., Zimmerle, D., Lyon, D., Mogstad, I., Ratner, B., and Brandt, A. R.: Single-blind inter-comparison of methane detection technologies – results from the Stanford/EDF Mobile Monitoring Challenge, Elementa: Science of the Anthropocene, 7, 37, https://doi.org/10.1525/elementa.373, 2019.
Roscioli, J. R., Yacovitch, T. I., Floerchinger, C., Mitchell, A. L., Tkacik, D. S., Subramanian, R., Martinez, D. M., Vaughn, T. L., Williams, L., Zimmerle, D., Robinson, A. L., Herndon, S. C., and Marchese, A. J.: Measurements of methane emissions from natural gas gathering facilities and processing plants: measurement methods, Atmos. Meas. Tech., 8, 2017–2035, https://doi.org/10.5194/amt-8-2017-2015, 2015.
Rutherford, J. S., Sherwin, E. D., Ravikumar, A. P., Heath, G. A., Englander, J., Cooley, D., Lyon, D., Omara, M., Langfitt, Q., and Brandt, A. R.: Closing the methane gap in US oil and natural gas production emissions inventories, Nat. Commun., 12, 4715, https://doi.org/10.1038/s41467-021-25017-4, 2021.
Sherwin, E. D., Chen, Y., Ravikumar, A. P., and Brandt, A. R.: Single-blind test of airplane-based hyperspectral methane detection via controlled releases, Elementa: Science of the Anthropocene, 9, 00063, https://doi.org/10.1525/elementa.2021.00063, 2021.
Zimmerle, D., Vaughn, T., Luck, B., Lauderdale, T., Keen, K., Harrison, M., Marchese, A., Williams, L., and Allen, D.: Methane Emissions from Gathering Compressor Stations in the U.S., Environ. Sci. Technol., 54, 7552–7561, https://doi.org/10.1021/acs.est.0c00516, 2020.