the Creative Commons Attribution 4.0 License.
the Creative Commons Attribution 4.0 License.
 | 05 Apr 2024
Advantages of assimilating multispectral satellite retrievals of atmospheric composition: a demonstration using MOPITT carbon monoxide products
Benjamin Gaubert
Louisa Emmons
Daniel Ziskin
Debbie Mao
David Edwards
Avelino Arellano
Kevin Raeder
Jeffrey Anderson
Helen Worden
The Measurements Of Pollution In The Troposphere (MOPITT) is an ideal instrument to understand the impact of (1) assimilating multispectral and joint retrievals versus single spectral products, (2) assimilating satellite profile products versus column products, and (3) assimilating multispectral and joint retrievals versus assimilating individual products separately. We use the Community Atmosphere Model with chemistry with the Data Assimilation Research Testbed (CAM-chem+DART) to assimilate different MOPITT carbon monoxide (CO) products to address these three questions. Both anthropogenic and fire CO emissions are optimized in the data assimilation experiments. The results are compared with independent CO observations from TROPOspheric Monitoring Instrument (TROPOMI), the Total Carbon Column Observing Network (TCCON), NOAA Carbon Cycle Greenhouse Gases (CCGG) sites, In-service Aircraft for a Global Observing System (IAGOS), and Western wildfire Experiment for Cloud chemistry, Aerosol absorption and Nitrogen (WE-CAN). We find that (1) assimilating the MOPITT joint (multispectral; near-IR and thermal IR) column product leads to better model–observation agreement at and near the surface than assimilating the MOPITT thermal-IR-only column retrieval. (2) Assimilating column products has a larger impact and improvement for background and large-scale CO compared to assimilating profile products due to vertical localization in profile assimilation. However, profile assimilation can outperform column assimilations in fire-impacted regions and near the surface. (3) Assimilating multispectral and joint products results in similar or slightly better agreement with observations compared to assimilating the single spectral products separately.
- Article
(10175 KB) - Full-text XML
-
Supplement
(8804 KB) - BibTeX
- EndNote


With the increasing availability of satellite remote sensing instruments measuring atmospheric composition, there is potential to produce multispectral retrievals of several species, making use of thermal infrared (TIR) and near-infrared (NIR) radiances from colocated instruments on the same satellite, such as IASI (Infrared Atmospheric Sounding Interferometer) and GOME-2 (Global Ozone Monitoring Experiment-2) on the European MetOp satellites (Cuesta et al., 2013), or flying in close formation, such as on the NASA A-train and NOAA's JPSS (Joint Polar Satellite System), e.g., OMI (Ozone Monitoring Instrument, Levelt et al., 2018), AIRS (Atmospheric Infrared Sounder, Fu et al., 2018), OMPS (Ozone Mapping and Profiler Suite, Flynn et al., 2014), TROPOspheric Monitoring Instrument (TROPOMI, Veefkind et al., 2012), and CrIS (Cross-track Infrared Sounder, Fu et al., 2016). TIR retrievals use thermal contrast, while NIR retrievals use reflected solar radiance from the surface. Taking MOPITT as an example, the TIR retrieval can provide vertical profiles with limited sensitivity to the surface, while the NIR retrieval only provides a total column product with some sensitivity to the surface (Fig. 1).
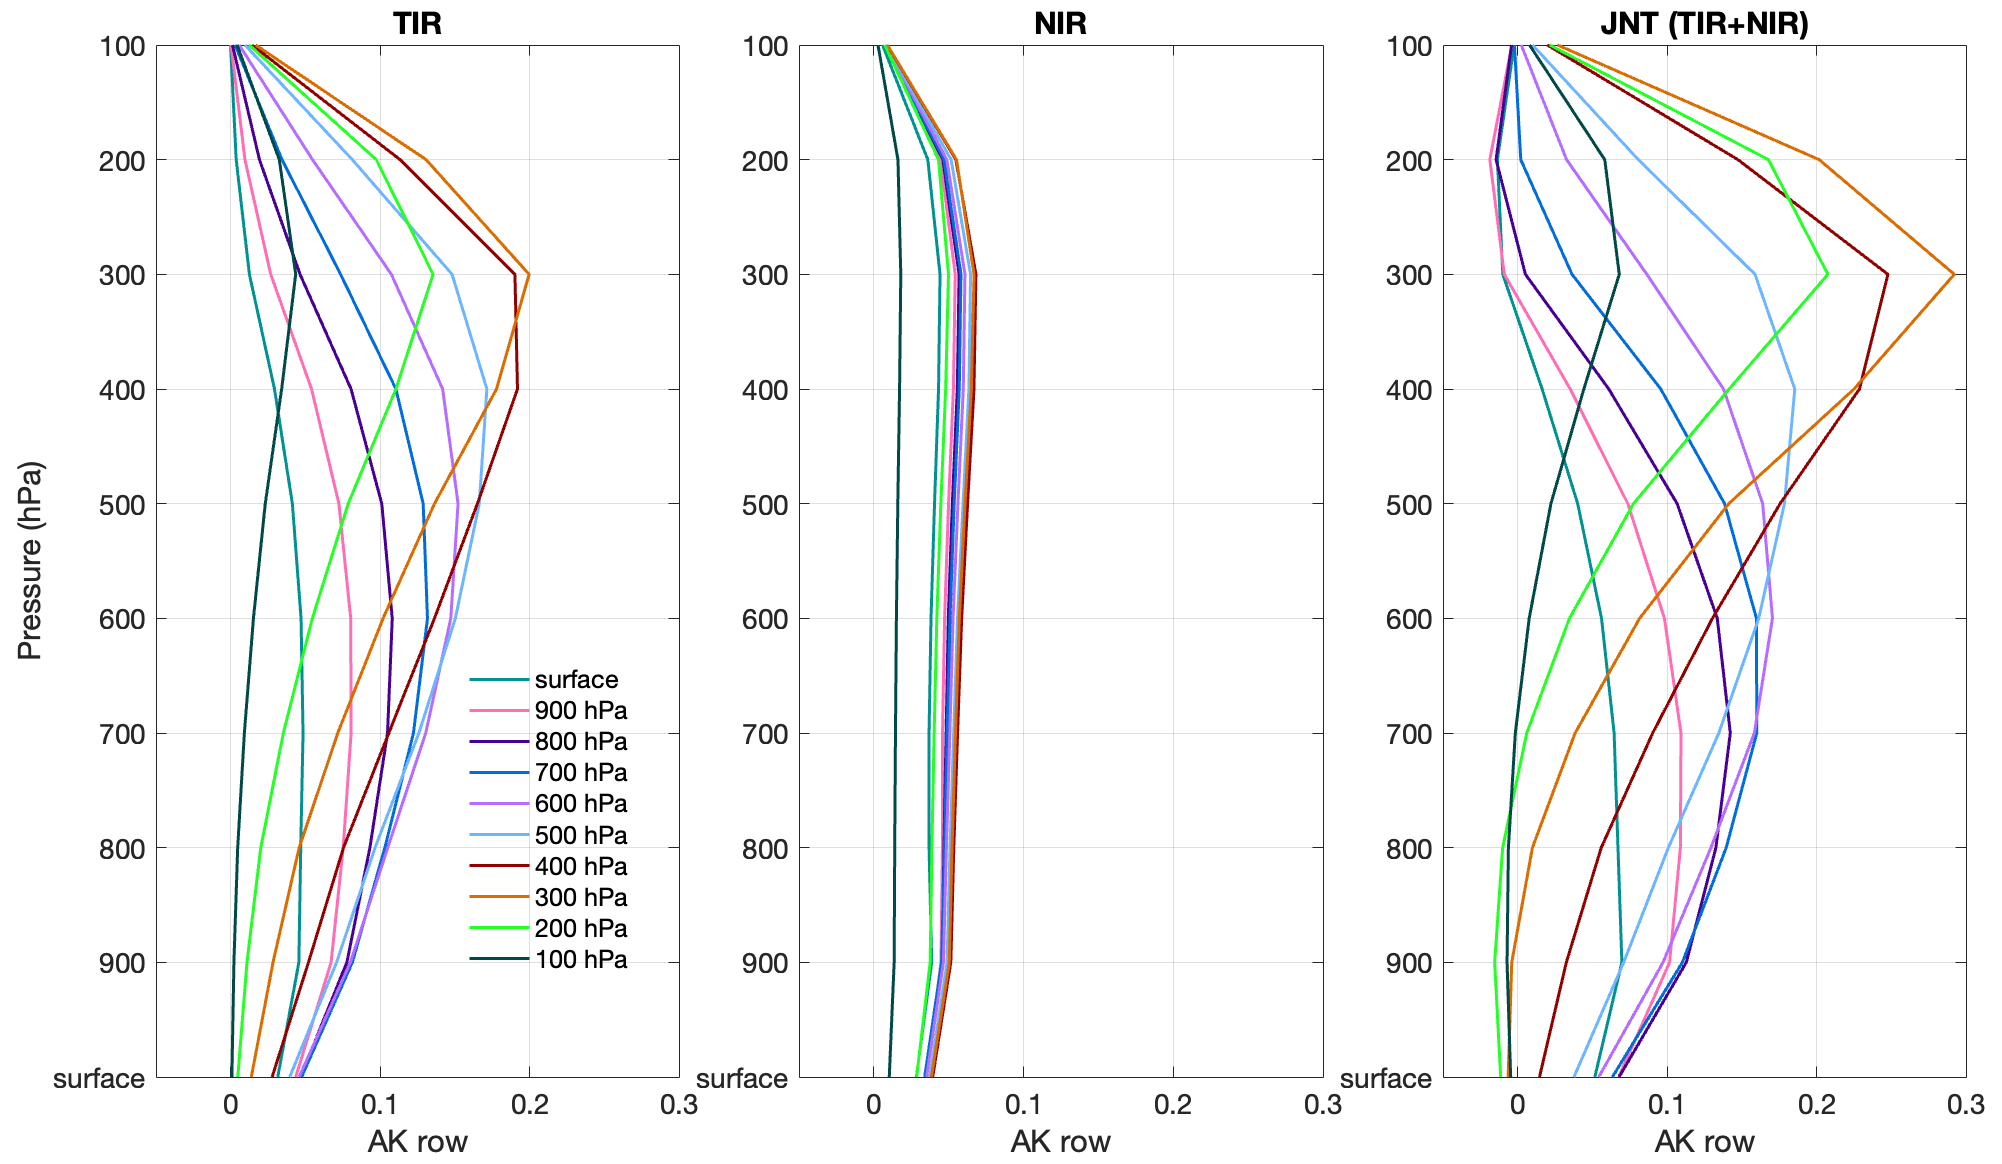
Figure 1Averaging kernel (AK) rows for MOPITT retrieval types TIR only, NIR only, and multispectral TIR+NIR. Global average of AKs during July and August 2018 are shown.
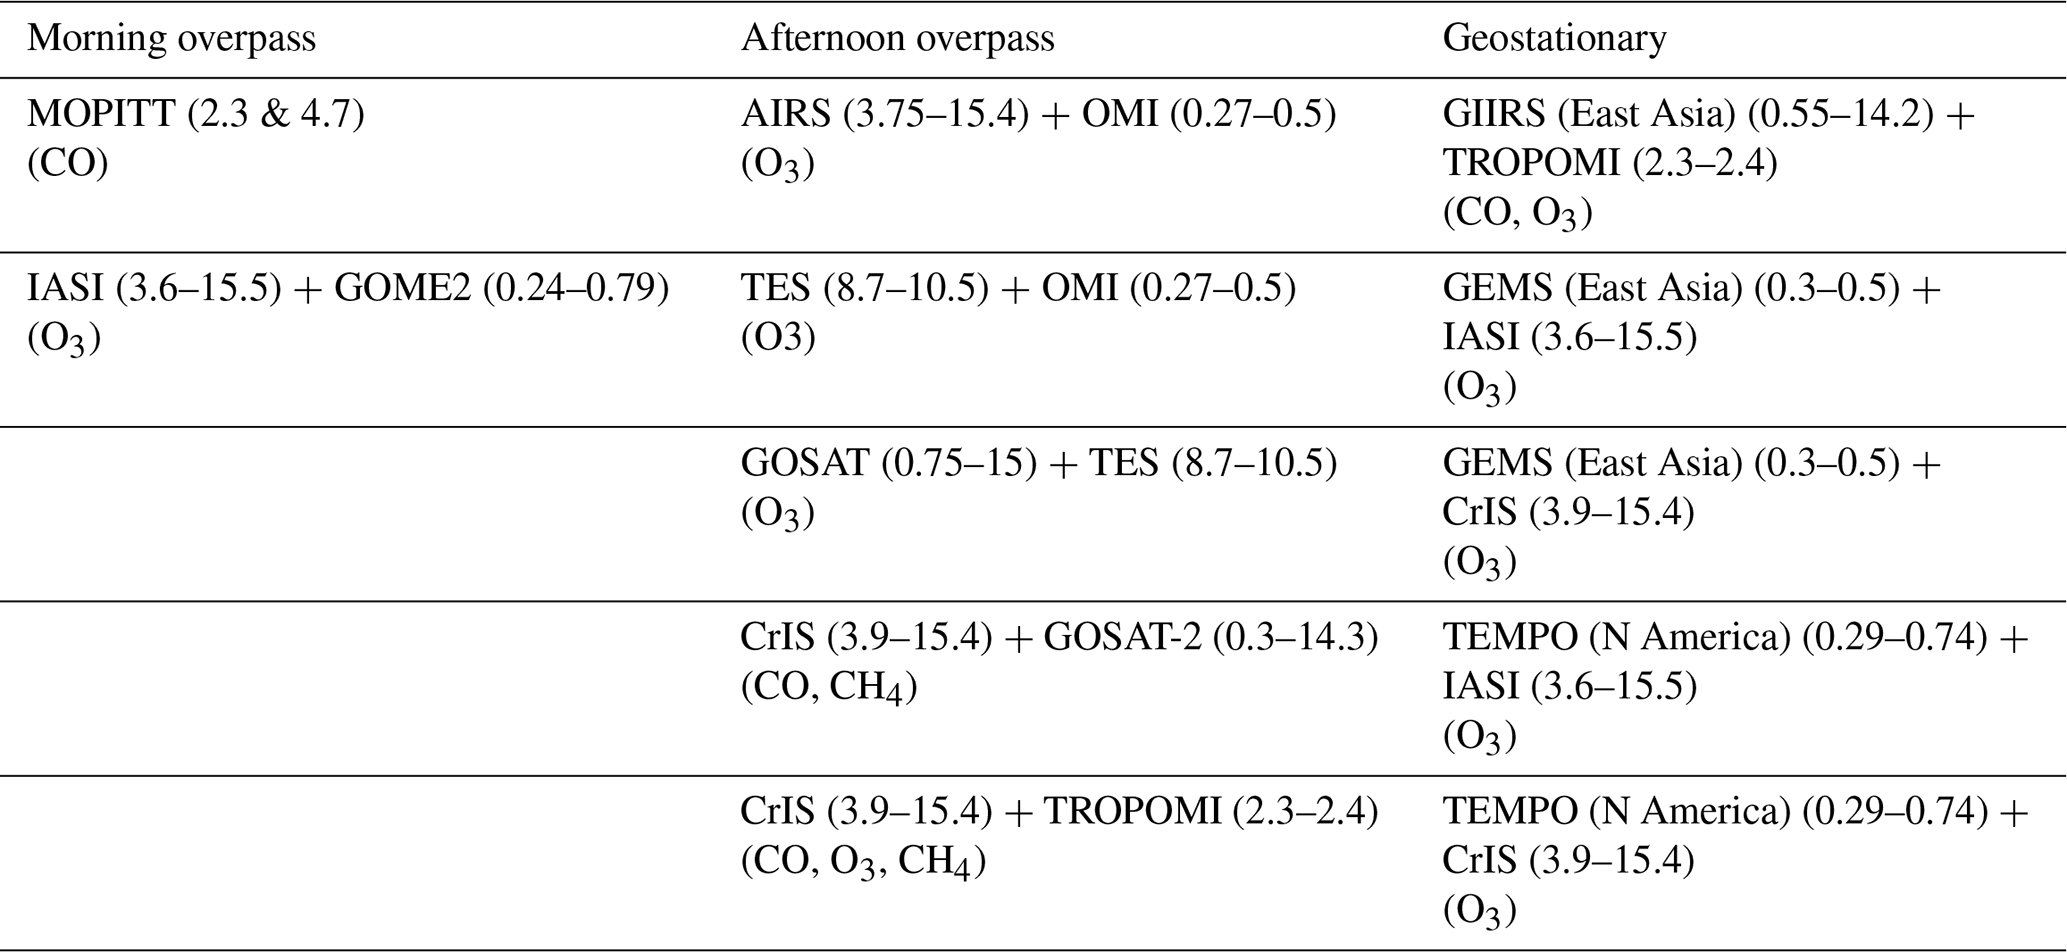
The multispectral products have shown considerable increases in the vertical sensitivity of the retrievals for lowermost-tropospheric ozone (O3) (e.g., Worden et al., 2007; Natraj et al., 2011; Fu et al., 2018), carbon monoxide (CO) (Worden et al., 2010; Fu et al., 2016), and methane (CH4) (Schneider et al. 2022). Multispectral retrievals could be made using the colocated overpass made by low-Earth-orbit and geostationary satellites such as, Geostationary Interferometric Infrared Sounder (GIIRS, Zeng et al., 2023), Geostationary Environment Monitoring Spectrometer (GEMS, Kim et al., 2020), Geostationary Extended Observations (GeoXO; Kopacz et al., 2023), and Tropospheric emissions: Monitoring of pollution (TEMPO, Chance et al., 2019). Table 1 shows the developed and potential multispectral products (e.g., Mettig et al., 2022). It is important to understand the value of assimilating a multispectral product versus assimilating a single-spectral-range product and the value of assimilating a multispectral product versus separately assimilating single-spectral-range products that are used to retrieve the multispectral products.
Table 1Developed and potential multispectral satellite retrievals. Shown in the table are satellites, their NIR and/or TIR spectral ranges (in µm), and potential chemical species from the multispectral retrievals.
Total column observations of O3, CO, and nitrogen dioxide (NO2) are now routinely assimilated in operational centers such as in the European Copernicus Atmosphere Monitoring Service (CAMS) program at the European Centre for Medium-Range Weather Forecasts (Inness et al., 2019, 2022). In addition, recently launched geostationary satellites such as GEMS and TEMPO will provide column products at high temporal resolution. While the satellite profile products are in general considered to contain more vertical information, it is important to understand the impacts of assimilating column products versus assimilating profile products and to understand what information is potentially missed by only assimilating column products. For example, Jiang et al. (2017) compared emission updates following the assimilation of the Measurements of Pollution in the Troposphere (MOPITT) lowermost surface profile, the tropospheric profile, or the columns and identified errors indicative of model transport error impacts on emission estimates.
The MOPITT instrument on board the NASA Terra satellite is an ideal instrument to address these questions. MOPITT retrieves total column amounts and vertical profiles of CO using both thermal infrared (TIR) and near-infrared (NIR) measurements. In addition, MOPITT also provides the multispectral TIR–NIR joint product, which has enhanced the sensitivity to near-surface CO (Deeter et al., 2011, 2013; Worden et al., 2010). By comparing the results of assimilating different combinations of MOPITT CO products, we will be able to address these questions.
To conduct the data assimilation experiments, we use the Community Atmosphere Model with chemistry and the Data Assimilation Research Testbed (Anderson et al., 2009). CAM-chem+DART has been previously used to assimilate MOPITT profile products (A. F. Arellano et al., 2007; Barré et al., 2015; Gaubert et al., 2016, 2017, 2020, 2023). Here we present the first assimilation of MOPITT column products within CAM-chem+DART. This new capability also allows us to assimilate other satellite column products of CO and other chemical species in the future. Anthropogenic and fire emissions are optimized separately in the data assimilation experiments.
This paper aims to understand the impacts of (1) assimilating multispectral and joint products versus single spectral products, (2) assimilating satellite profile products versus column products, and (3) assimilating multispectral and joint products versus assimilating individual products separately. The paper is organized as follows: Sect. 2 describes CAM-chem, DART, and methods, Sect. 3 describes datasets used for result evaluation, Sect. 4 presents data assimilation diagnostics, Sect. 5 shows comparisons between data assimilation results and independent observations, Sect. 6 discusses optimized emissions and CAM-chem simulations with updated emissions, Sect. 7 is discussion, and Sect. 8 concludes the study.
2.1 MOPITT products
The Measurements of Pollution in the Troposphere (MOPITT) instrument on board the NASA Terra satellite has provided both thermal infrared (TIR) and near-infrared (NIR) radiance measurements since March 2000 (Deeter et al., 2003). CO total column amounts and volume mixing ratio (VMR) profiles (10 vertical layers) are retrieved from the radiance measurements. TIR is used to retrieve the MOPITT TIR CO total column product and the MOPITT TIR CO vertical profile product; NIR is used to retrieve the MOPITT NIR CO column product. Besides the TIR-only and NIR-only products, multispectral (JNT) products are also provided by MOPITT by jointly retrieving from TIR and NIR. JNT retrievals provide both the MOPITT JNT CO total column product and the MOPITT JNT CO vertical profile product. JNT products have enhanced the sensitivity to near-surface CO (Deeter et al., 2011, 2013; Worden et al., 2010). MOPITT products can be accessed through https://search.earthdata.nasa.gov/search (last access: 26 March 2024). In this study, we assimilate daytime MOPITT version 9 products (Deeter et al., 2022) of TIR profile, TIR column, NIR column, JNT profile, and JNT column in our experiments.
We use the error-weighted average of the MOPITT data within 1° × 1° model grid and 6-hourly bin (i.e., super-observations). Averaged daily numbers of daytime total super-observations from MOPITT TIR, NIR, and JNT products during 16 July to 14 August 2018 are shown in Fig. 2. The NIR product only covers the land, while TIR and JNT products cover the land and ocean. Over the ocean, the JNT product is the same as the TIR product (Worden et al., 2010).
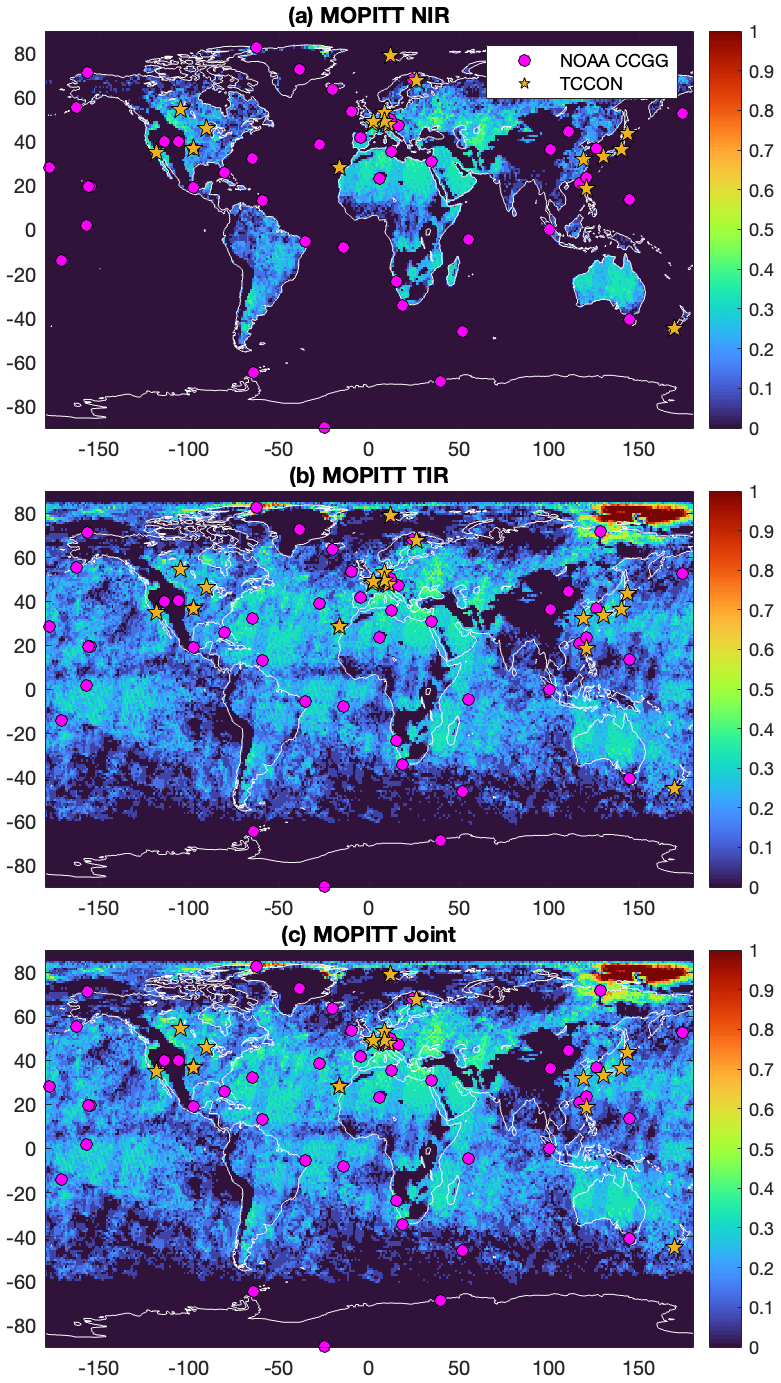
Figure 2Daily number of super-observations per day and per grid from MOPITT (a) TIR, (b) NIR, and (c) JNT products during 16 July to 14 August 2018. Total Carbon Column Observing Network (TCCON) sites are marked by yellow stars and NOAA Carbon Cycle Greenhouse Gases (CCGG) sites are marked by pink circles.
Data assimilation requires observation errors associated with the quantity assimilated. MOPITT provides three types of uncertainties and/or errors: total error, measurement error, and smoothing error in the products. Total error includes both measurement error and smoothing error. Since our observation operators include the smoothing by the MOPITT averaging kernels and the prior profiles, we only use the measurement error rather than total error provided by MOPITT for both column and profile products as smoothing error is already addressed by observation operators in the system (Rodgers, 2000). Specifically, for MOPITT profile products, measurement error is provided by the variable “MeasurementErrorCovarianceMatrix”, while for MOPITT column products, measurement error is provided by the variable second column of the variable “RetrievedCOTotalColumnDiagnosticsDay”.
2.2 CAM-chem
The Community Earth System Model (CESM) is a global Earth system model that includes atmosphere, land, ocean, and ice components (Danabasoglu et al., 2020). CAM-chem (Emmons et al., 2020; Tilmes et al., 2019) is a global chemistry–climate model as a configuration of CESM version 2.2 (https://www2.acom.ucar.edu/gcm/cam-chem, last access: 29 March 2024). CAM-chem accounts for physical, chemical, and dynamical processes with a spatial resolution of 1.25° in longitude and 0.95° in latitude as well as 32 vertical layers with ∼ 8 layers in boundary layer and ∼ 10 layers in the free troposphere (Tang et al., 2023). We use the default MOZART-TS1 chemical mechanism, which includes comprehensive tropospheric and stratospheric chemistry with ∼ 220 chemical species and 528 reactions (Emmons et al., 2020). The aerosol scheme used is the four-mode version of the Modal Aerosol Module (MAM4; Liu et al., 2016).
We use the CAMS-GLOB-ANT v5.1 inventory (Soulie et al., 2023) for anthropogenic emissions and FINNv2.4 (Wiedinmyer et al., 2023) for fire emissions. CAMS-GLOB-ANT v5.1 provides monthly emissions, and we generated daily files from the interpolation of the monthly values. The FINNv2.4 inventory provides daily fire emissions that are used directly. We update CO emission input files using the relative surface flux increments at every MOPITT CO assimilation step (6-hourly).
2.3 DART
DART is an open-source community facility for efficient ensemble data assimilation (https://dart.ucar.edu/, last access: 26 March 2024). It is developed and maintained at the National Center for Atmospheric Research (NCAR). DART has been coupled with Community Atmosphere Model (CAM) for global meteorological data assimilation (CAM+DART; Raeder et al., 2012, 2021). Based on CAM+DART, the capability of chemical data assimilation using CAM-chem online chemistry and DART is developed and applied for scientific research (CAM-chem+DART; A. F. Arellano et al., 2007; Barré et al., 2015; Gaubert et al., 2016, 2017, 2020). Here, we use the ensemble adjustment Kalman filter approach (EAKF; Anderson, 2001, 2003). The forecast ensemble is generated by 30 CAM-chem simulations with different initial conditions and emissions. The assimilation is performed using DART and produces an ensemble of optimized initial conditions and emissions, as described in Gaubert et al. (2023). Specifically, the state vector includes CO initial conditions and CO emission fluxes that are ascribed to fires and anthropogenic sources. We use the ensemble mean at the forecast and the analysis step in the sections discussing our results. The ensemble mean of the forecast is denoted by
where is the ensemble mean of the “forecast”, N is the ensemble size, and is the forecast value of the jth ensemble member. In our runs, DART uses EAKF, a deterministic ensemble square root filter, for the analysis step. Unless noted otherwise, our setup is the same as in Gaubert et al. (2023). We slightly change the emission update to include a correction to the previous day (t−1) in order to smooth the emission increments. Briefly, we apply multiplicative covariance inflation to the forecast ensemble before each analysis step to adjust the total error (model and observations) using the given observation error as a reference (Anderson, 2007, 2009). The inflation parameter is also sequentially updated (El Gharamti 2018) and varies in both space and time. Localization is commonly used in ensemble-based data assimilation to address insufficient ensemble sample size. Since the correlation is expected to decrease as separation increases, it empirically reduces the impact of an observation on the model state variable as a function of distance using the Gaspari–Cohn localization function (Gaspari and Cohn, 1999). The spatial localization horizontal half-width is 600 km and the vertical half-width is 1200 m. The main difference between the profile and the column assimilation resides in the vertical localization. For each MOPITT retrieval, profile products have multiple observations at different layers but their impacts are vertically localized around 100 hPa. Therefore, not all vertical layers will be impacted. For the column data assimilation, there is no vertical localization in the column data assimilation except that the stratospheric (top five) levels are not updated, as in the CO profile and meteorological DA. All vertical levels will be impacted by a single column value. In this case, if the mismatch is due to an underestimation of surface emissions rather than weak vertical transport, updating the upper-tropospheric CO might lead to erroneous adjustments in CO abundance.
Forward operators (denoted as H in DA terminology) are applied to project model field to observation space (i.e., expected observations). We use the forward operators introduced in Barré et al. (2015), consisting of (i) estimating the log of a pressure-weighted partial column volume mixing ratio that corresponds to the MOPITT grid and (ii) applying the MOPITT averaging kernel and prior information as mentioned in Sect. 2.1. In this study, we introduce an observation operator to assimilate the MOPITT columns in DART. That is, we estimate the retrieved column C (molecules cm−2) using the MOPITT prior column Ca and following Eq. (3) of the MOPITT version 9 user guide:
where xCAM-chem and xa are the modeled and the MOPITT a priori profiles expressed as log10(VMR), and a is the total column averaging kernel. In this study, we assimilate both MOPITT profile and column products and compare the results.
2.4 Data assimilation experiments setup
There are six CAM-chem+DART runs (Fig. 3). The first run is the spin-up and control run that starts on 1 July 2018. The spin-up and control run only assimilates meteorological observations and the state vector consists of wind, temperature, specific humidity, and surface pressure. Besides the spin-up and control run, there are five experiment runs that assimilate different MOPITT CO product(s) to update model CO. Note that the experiment runs assimilate not only MOPITT CO products but also meteorological variables as in the spin-up and control run. The chemical state vector (CO and CO emissions) and the meteorological state vector do not impact each other. However, the updated meteorology due to meteorological data assimilation will impact the transport and possibly chemistry of CO during the forecast step. The five experiment runs are
-
column JNT assimilation (Exp1-CJ),
-
profile JNT assimilation (Exp2-PJ),
-
column TIR assimilation (Exp3-CT),
-
column TIR and column NIR assimilation (Exp4-CT+CN), and
-
profile TIR and column NIR assimilation (Exp5-PT+CN).
These five experiment runs are designed to address a few scientific questions.
-
The comparisons of Exp1-CJ and Exp2-PJ will show the impacts of the assimilation of satellite profile versus column products.
-
The comparisons of Exp1-CJ and Exp3-CT will show the difference caused by the TIR-only product versus the joint product.
-
The comparisons of Exp1-CJ and Exp4-CT+CN will show the impacts of assimilating joint products (TIR+NIR) versus assimilating them separately for column products.
-
The comparisons of Exp2-PJ and Exp5-PT+CN will show the impacts of assimilating joint products (TIR+NIR) versus assimilating them separately for profile products.
The experiment runs start on 16 July 2018 and are initialized with the spin-up and control run. Each experiment runs for 35 d considering the cost and constraint of computational allocation. The first 20 d (11–15 July 2018) are CO spin-up and the last 15 d (31 July to 14 August 2018) are used for result analyses. The 15 d period is selected based on the spin-up time – as shown by fractions of observations rejected by the assimilation system (Fig. 4). Quality checks are common in data assimilation as the algorithms are employed operationally for near-real-time forecasting. We use the standard option in DART to do such quality checks. The absolute value of the difference between the observed value and the prior ensemble mean estimate is divided by the expected value of this difference. That expected value is the square root of the sum of the specified observation error variance and the prior ensemble variance. If this ratio is greater than a threshold, the observation is not used. The threshold ratio used here is 3, which is commonly used for large tropospheric applications in DART (e.g., Gaubert et al., 2023). Systematic errors are larger at the beginning of the spin-up, explaining the higher rejection rate. As the assimilation proceeds and the forecast bias is reduced, the rejection rate goes down. The experiments finished spinning up around 31 July. Each CAM-chem+DART run includes 30 ensemble members. These 30 ensemble members have different initial conditions and emissions to represent model uncertainties. The analysis step is done every 6 h. Anthropogenic and fire emissions are optimized separately on a daily basis following the method described in Gaubert et al. (2020, 2023).
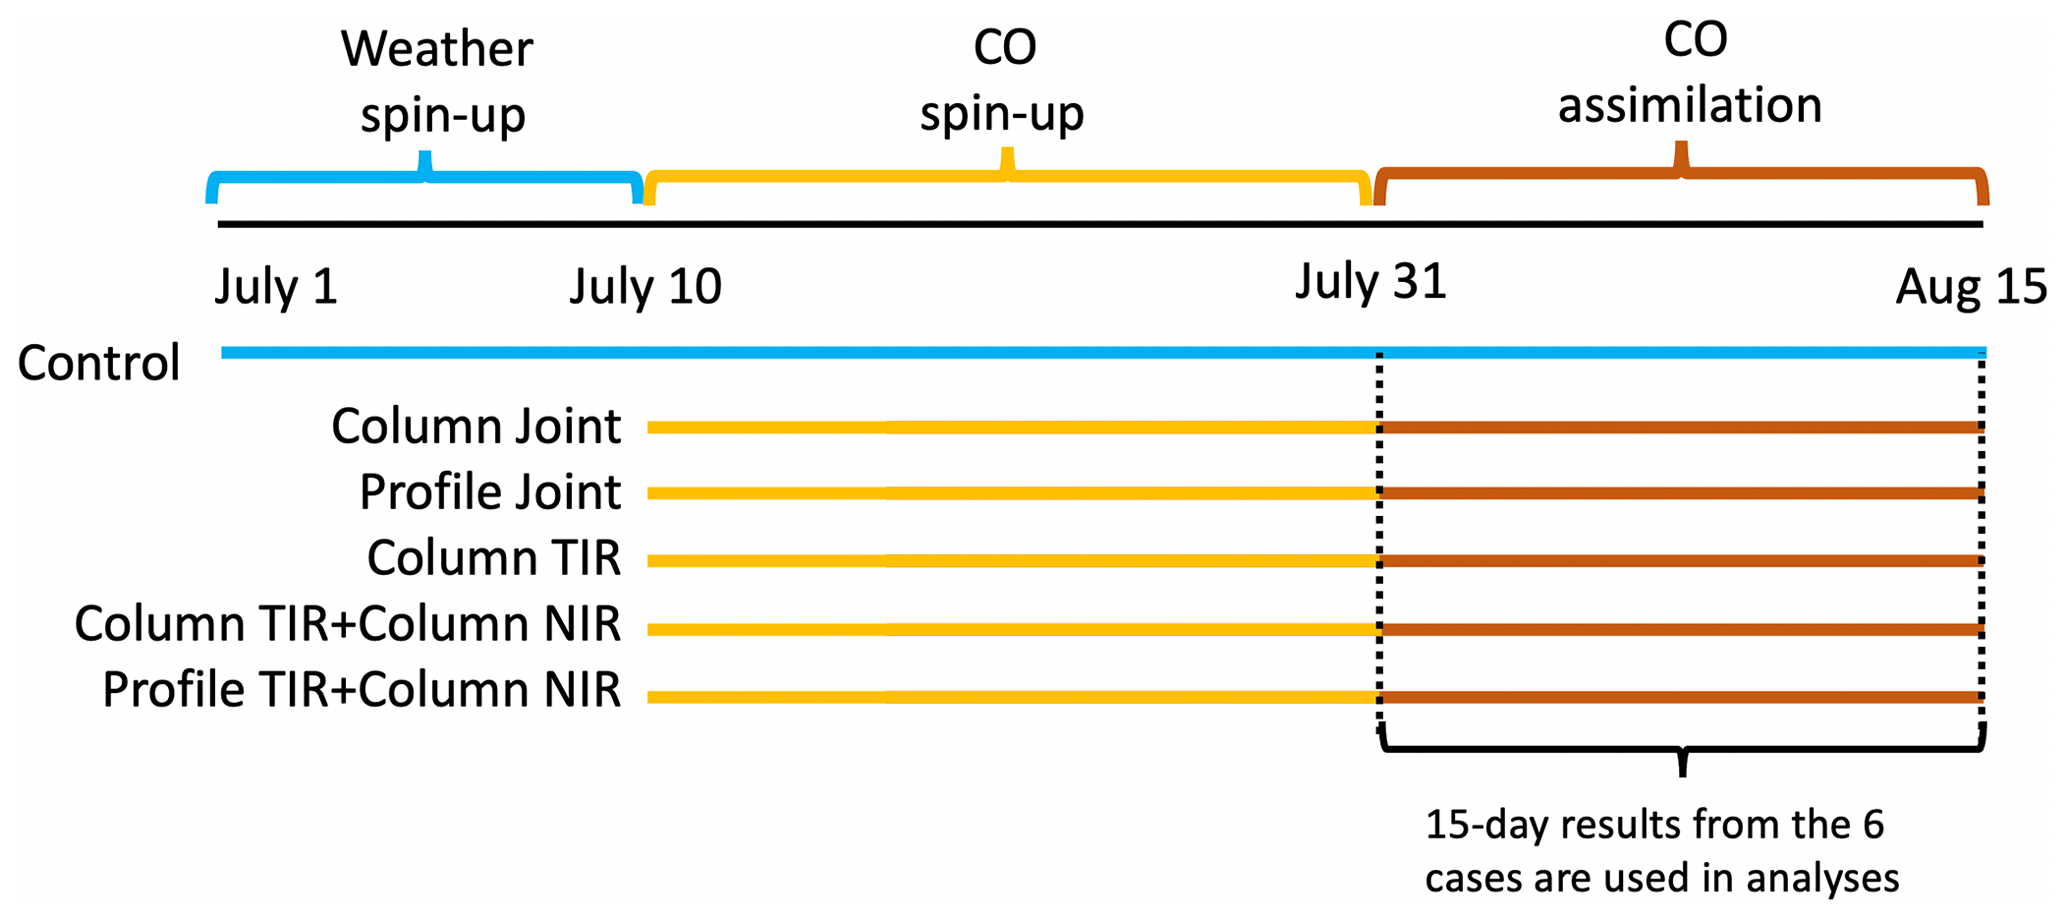
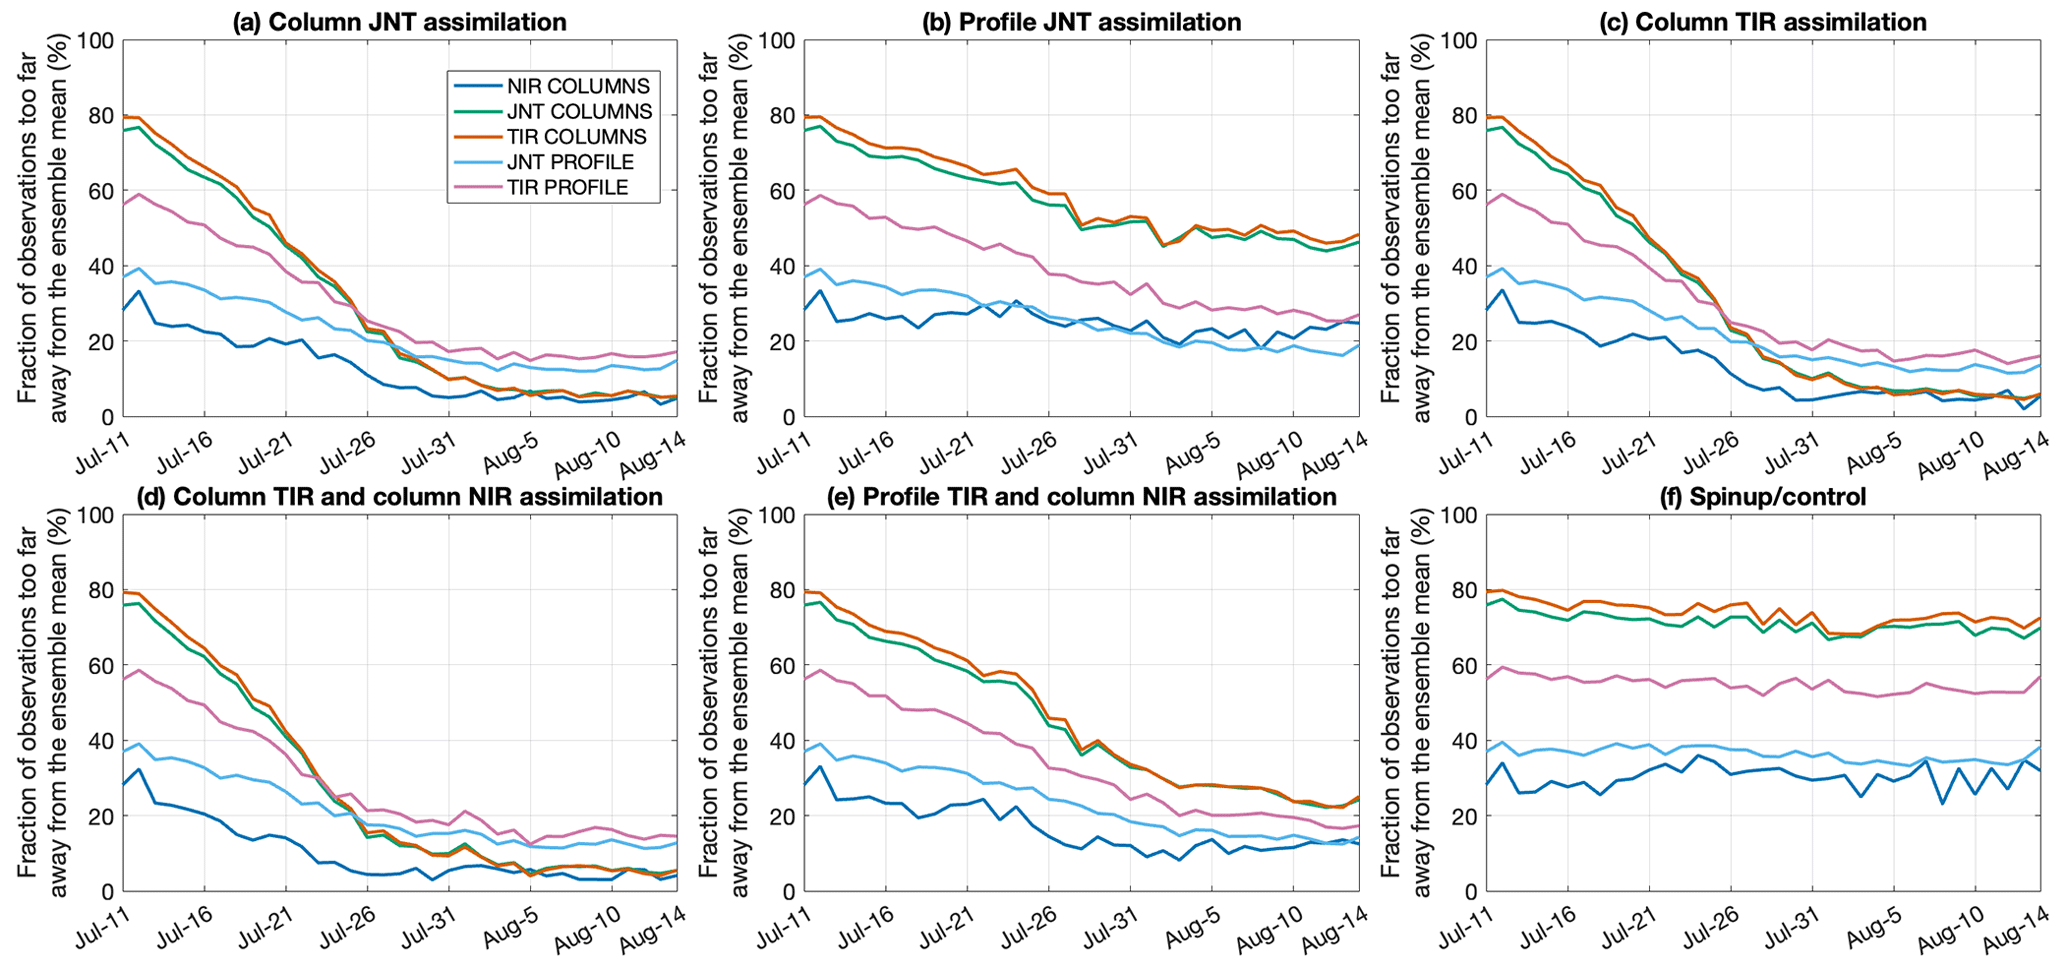
Figure 4Time series of the fractions of observations rejected by the assimilation system (%) due to the fact that they are too far from the ensemble mean.
2.5 CAM-chem simulations with updated emissions
To evaluate the updated emissions from the DA experiments, we conduct CAM-chem simulations for the same period using the ensemble mean of the updated fire and anthropogenic emissions. Hourly output is used for these simulations. Specifically, we conduct six CAM-chem simulations:
-
S1: simulation with emissions from Exp1-CJ,
-
S2: simulation with emissions from Exp2-PJ,
-
S3: simulation with emissions from Exp3-CT,
-
S4: simulation with emissions from Exp4-CT+CN,
-
S5: simulation with emissions from Exp5-PT+CN, and
-
SControl: simulation with original CAMS and FINN emissions.
3.1 TROPOspheric Monitoring Instrument (TROPOMI)
We use CO column retrieved from TROPOMI on board the ESA's Sentinel-5 Precursor (Veefkind et al., 2012) to evaluate model results. The spatial resolution of CO retrievals is ∼ 5.5 km × 7 km (Veefkind et al., 2012; Borsdorff et al., 2018). TROPOMI CO data can be downloaded from https://sentinels.copernicus.eu/web/sentinel/data-products/-/asset_publisher/fp37fc19FN8F/content/sentinel-5-precursor-level-2-carbon-monoxide (last access: 26 March 2024). The TROPOMI Level 2 CO (Apituley et al., 2018) is used here. The TROPOMI data are filtered following Landgraf et al. (2020). To compare the model results with TROPOMI CO, we interpolate model outputs spatially and temporally to match the locations and times of TROPOMI CO retrievals and then apply TROPOMI CO total column averaging kernels to the interpolated model CO profiles to obtain modeled total CO columns (Apituley et al., 2018). TROPOMI CO data were compared to MOPITT CO in Martínez-Alonso et al. (2020). TROPOMI and MOPITT data show good agreement in terms of temporal and spatial patterns with global average biases < 4 % between all MOPITT CO column products (TIR, NIR, and JNT) and TROPOMI. TROPOMI CO values were slightly lower than MOPITT in most regional comparisons.
3.2 The Total Carbon Column Observing Network (TCCON)
TCCON is a network of ground-based Fourier transform spectrometers that record direct solar spectra in the NIR spectral region (Wunch et al., 2011; Laughner et al., 2023). TCCON data have been previously used to evaluate MOPITT products (e.g., Hedelius, et al., 2019). Column-averaged mixing ratios of chemical species such as CO2, CH4, N2O, and CO are retrieved from these spectra. We use CO column data from the TCCON GGG2020 data release (https://tccondata.org/2020, last access: 26 March 2024; TCCON Team, 2022) to evaluate model results. Data from 18 TCCON sites are used (Buschmann et al., 2022; García et al., 2022; Hase et al., 2022; Iraci et al., 2022; Kivi et al., 2022; Liu et al., 2022; Morino et al., 2022a, b, c; Notholt et al., 2022; Pollard et al., 2022; Shiomi et al., 2022; Té et al., 2022; Warneke et al., 2022; Wennberg et al., 2022a, b; Wunch et al., 2022). We interpolate model results to TCCON data locations and time and apply TCCON averaging kernels to model results for proper comparisons.
3.3 NOAA Carbon Cycle Greenhouse Gases (CCGG) sites
We use the atmospheric CO dry-air mole fractions from the NOAA GML Carbon Cycle Cooperative Global Air Sampling Network (https://gml.noaa.gov/aftp/data/trace_gases/co/flask/surface/, last access: 26 March 2024; Petron et al., 2022). Event data are used. The reference scale is WMO CO_X2014A. We interpolate model results to CCGG site locations and time for proper comparisons. Note that on average, each site only has data on ∼ 4 d and approximately nine data points in total from 16 July to 14 August 2018.
3.4 In-service Aircraft for a Global Observing System (IAGOS)
IAGOS is a European research infrastructure developed for operations on commercial aircraft to monitor atmospheric composition (Petzold et al., 2015). The IAGOS instrument package 1 measures CO as well as O3, air temperature, and water vapor (https://www.iagos.org/iagos-core-instruments/package1/, last access: 26 March 2024). CO is measured by infrared absorption using the gas filter correlation technique (precision: ±5 %, accuracy: ±5 ppb). Here we use vertical profiles of CO from IAGOS for model evaluation. We use CO profiles in North and West Africa, tropical Asia, East Asia, Europe, eastern North America, western North America, Central and South America, and the Middle East and conduct evaluation in these regions separately. CO profiles used and regions are shown in Fig. S2. Note that IAGOS profiles are divided into regions based on their locations; however, the IAGOS profiles in a region are not representative of the whole region due to coverage (Fig. S2).
3.5 Western wildfire Experiment for Cloud chemistry, Aerosol absorption and Nitrogen (WE-CAN)
The WE-CAN field campaign was conducted over the northwestern US during July–September 2018 (https://data.eol.ucar.edu/project/WE-CAN, last access: 26 March 2024). There were 16 research flights of the NCAR/NSF C-130 research aircraft during the campaign. Our experiment runs start on 16 July and end on 14 August. We compare the model results to measurements from flights on 31 July and 2, 3, 6, 8, 9, and 13 August. We use 1 min averaged CO (Picarro G2401-mc) data. Model results are interpolated to match locations and time of the observations, and then both interpolated model results and observations are averaged back to the model spatial resolution (1.25° in longitude and 0.95° in latitude), 6-hourly bins, and 50 hPa vertical layers. This is because the model spatial and temporal resolutions are much lower than observations and model results cannot reproduce the high variability in the raw observations.
4.1 Observation space diagnostics
4.1.1 Fractions of observations rejected by the assimilation system
In all five experiments, the assimilation improves the agreement between model forecast and observations of not only the MOPITT products assimilated but also the MOPITT products that were not assimilated. Assimilating MOPITT CO column product(s) improves model agreement with MOPITT CO profile product(s) and vice versa. Figure 4 shows time series of the fraction of observations rejected by the assimilation system (%) when they are too far from the model ensemble mean. The decreasing fractions with time indicate more observations being accepted by the model; i.e., observations and modeled values are getting closer in later time steps. For a MOPITT product that is not assimilated in an experiment run, it is still used in the “evaluation mode”, where the ensemble is run through the observation operator but not assimilated. Therefore, the hypothetical fraction of observations rejected is still calculated for the MOPITT product for that experiment run, even though these observations are not assimilated. For the spin-up and control run, there is no significant trend for the fractions of rejected observations (Fig. 4f). For the five experiments, the fractions of rejected observations decrease with time. Assimilating (Fig. 4a–e) any MOPITT product(s) improves model agreement with all five MOPITT CO products regardless of whether they are column or profile products. When only assimilating column products (Exp1-CJ; Exp3-CT; and Exp4-CT+CN), the fraction of rejected observations decreases faster than that when assimilating both profile and column products (Exp5-PT+CN). For experiments that assimilate profiles (Exp2-PJ and Exp5-PT+CN), the fractions of rejected observations decrease slower than the other three experiments that only assimilate column products (Exp1-CJ, Exp3-CT, and Exp4-CT+CN). This is expected because profile assimilation has a relatively smaller impact than column assimilation overall due to vertical localization.
4.1.2 Reduced centered random variable (RCRV) and chi-square statistics χ2
We use the RCRV as a diagnostic of the ensemble bias (Candille et al., 2007). It has been previously used to validate assimilation results (e.g., Gaubert et al., 2014). Mean RCRV for P observations is defined by the ratio between the innovation and its associated error:
where is the value of ith observation, gives the expected observation from the model, is the observation error variance, and is the ensemble variance. The mean of the RCRV represents the weighted bias of the forecast, and hence a value close to 0 indicates the ensemble is representative (i.e., error variances are comparable to the innovations). Figure 5 shows daily . For a given experiment, only of MOPITT product(s) assimilated in the experiment is shown here. In most cases is close to zero, indicating that the ensemble is representative. The only exception is the NIR column product in Exp4-CT+CN and Exp5-PT+CN.
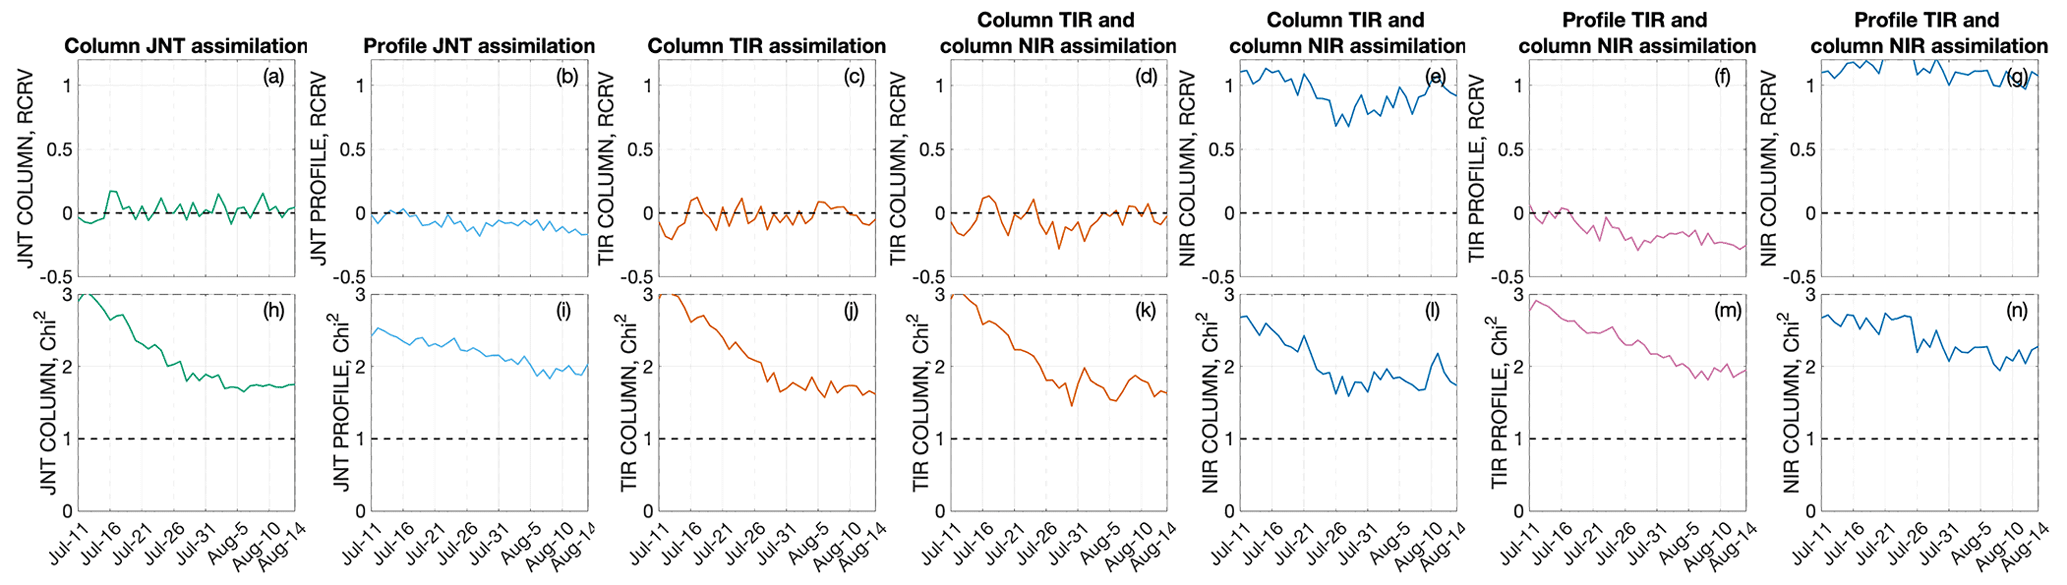
Figure 5Time series of (a–g) the daily mean of reduced centered random variable (RCRV) and (h–n) daily mean chi-square. For each experiment, only the RCRV and chi-square of the MOPITT product that was assimilated are shown.
Chi-square statistics (χ2) are also used to verify an effective assimilation by comparing error specifications and their balance with actual model–observation mismatch (Ménard and Chang, 2000). They have been previously used to evaluate assimilation results (e.g., Gaubert et al., 2016; Sekiya et al., 2021). Mean RCRV for P observations is defined as
A value lower than 1 indicates an overfitting of the observations, while a value higher than 1 suggests an underestimation of the actual model and observation mismatch. Daily is also shown in Fig. 5. The values are all higher than 1, indicating an underestimation of the actual model and observation mismatch. However, decreases with time and gradually approaches 1, indicating that the degree of such underestimation decreases with time.
4.2 Model space diagnostics
We analyze the impacts of assimilating MOPITT CO products by comparing the experiment runs with the control and spin-up run, which effectively isolate the signal resulting from the CO assimilation. Figure 6 shows the spatial distribution of CO difference caused by assimilation (CO from forecast of experiment minus CO from the control and spin-up run) for the five experiments (15 d average). At the surface, the spatial distributions of CO difference are similar among the five experiments. In line with Gaubert et al. (2023), the five experiments show overall higher CO in the Northern Hemisphere and lower CO in the tropics and India compared to the control and spin-up run. Exp2-PJ and Exp5-PT+CN reduce CO in California, which is not the case for other experiments. Exp2-PJ and Exp5-PT+CN are the only two experiments that involve profile product assimilation. In addition, profile JNT is retrieved with profile TIR and column NIR; therefore, Exp2-PJ is expected to assimilate similar information as Exp5-PT+CN. In addition, when comparing Exp1-CJ and Exp1-PJ, column assimilation has a larger downwind impact (e.g., the ocean between Africa and South America). At 500 hPa, the five experiments still show overall higher CO in the Northern Hemisphere compared to the control and spin-up run. However, Exp2-PJ and Exp5-PT+CN that involve profile assimilation have lower CO values than the other three experiments, especially in the high latitudes. At 200 hPa, the spatial distribution of the CO difference caused by assimilation is smallest in Exp2-PJ, followed by Exp5-PT+CN. On the contrary, for the other three experiments which do not involve profile assimilations, the spatial distribution of the CO difference caused by assimilation is relatively large, i.e., assimilating MOPITT profile product(s) only slightly changes CO values at 200 hPa, whereas assimilating MOPITT column product(s) changes CO values at 200 hPa dramatically. This is expected as vertical distribution is often an advantage of profile DA that column DA cannot represent.
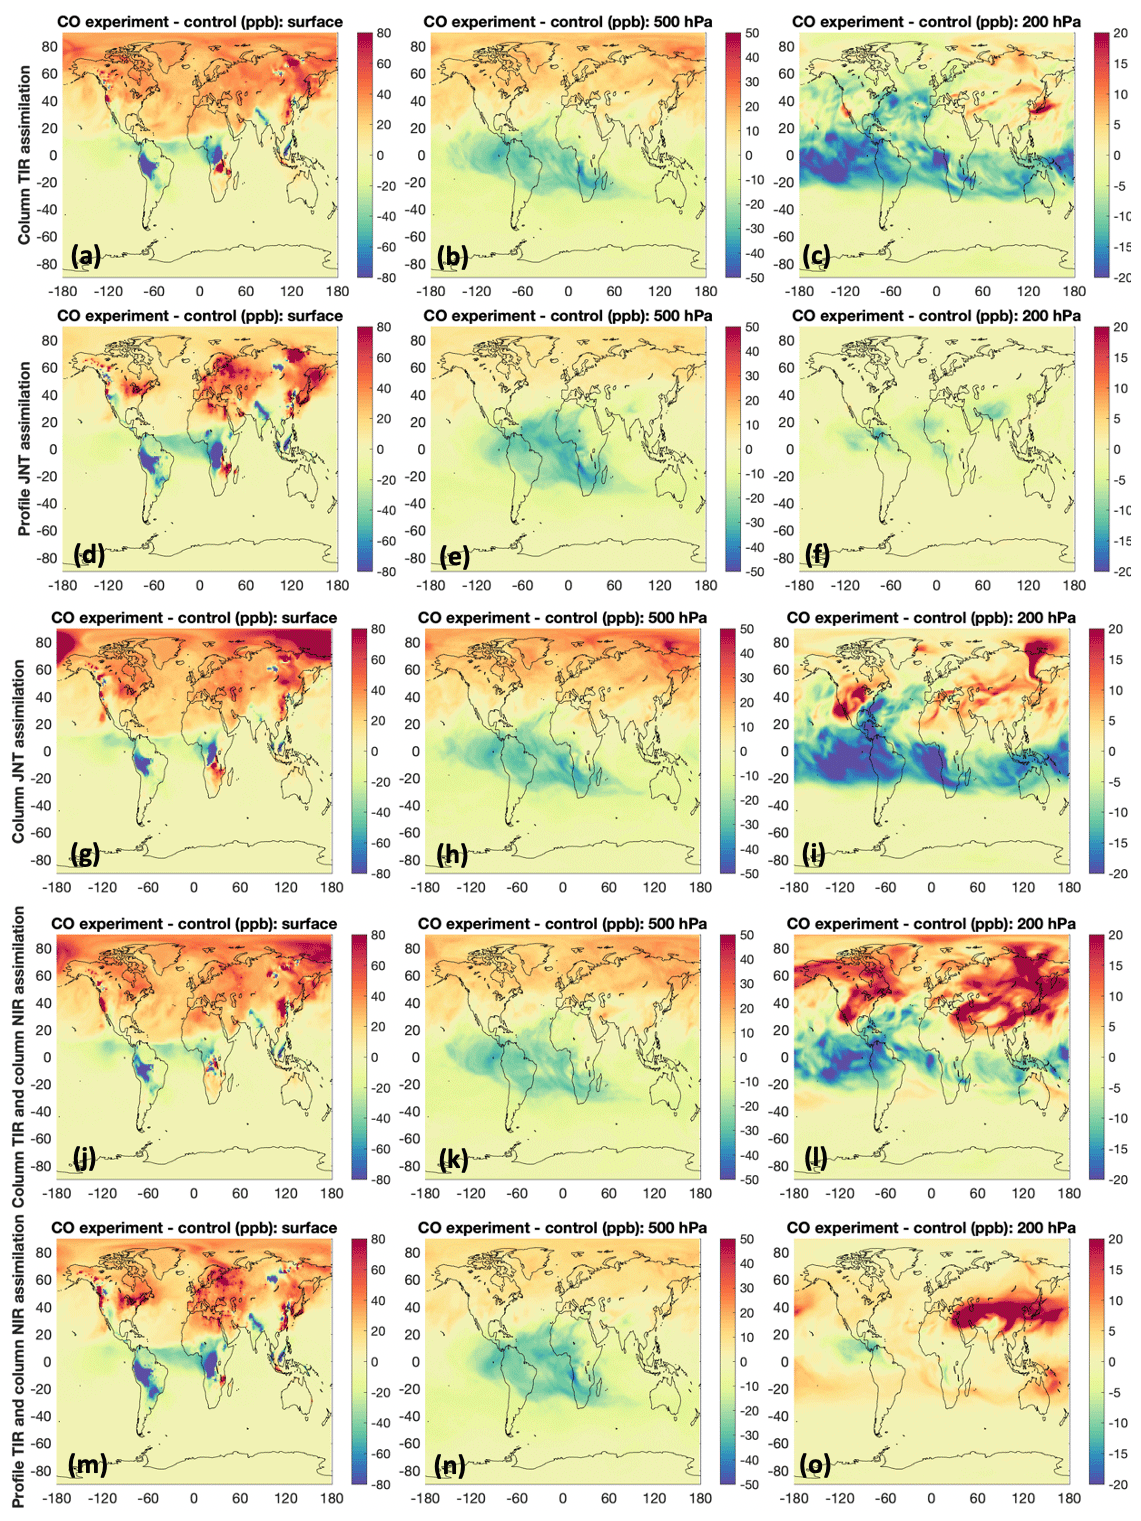
Figure 6The 15 d (31 July–14 August 2018) average of the difference in CO (forecast of experiment minus control run) for the five experiments at the model surface as well as 500 and 200 hPa. Note that the color scales for the model surface as well as 500 and 200 hPa are different.
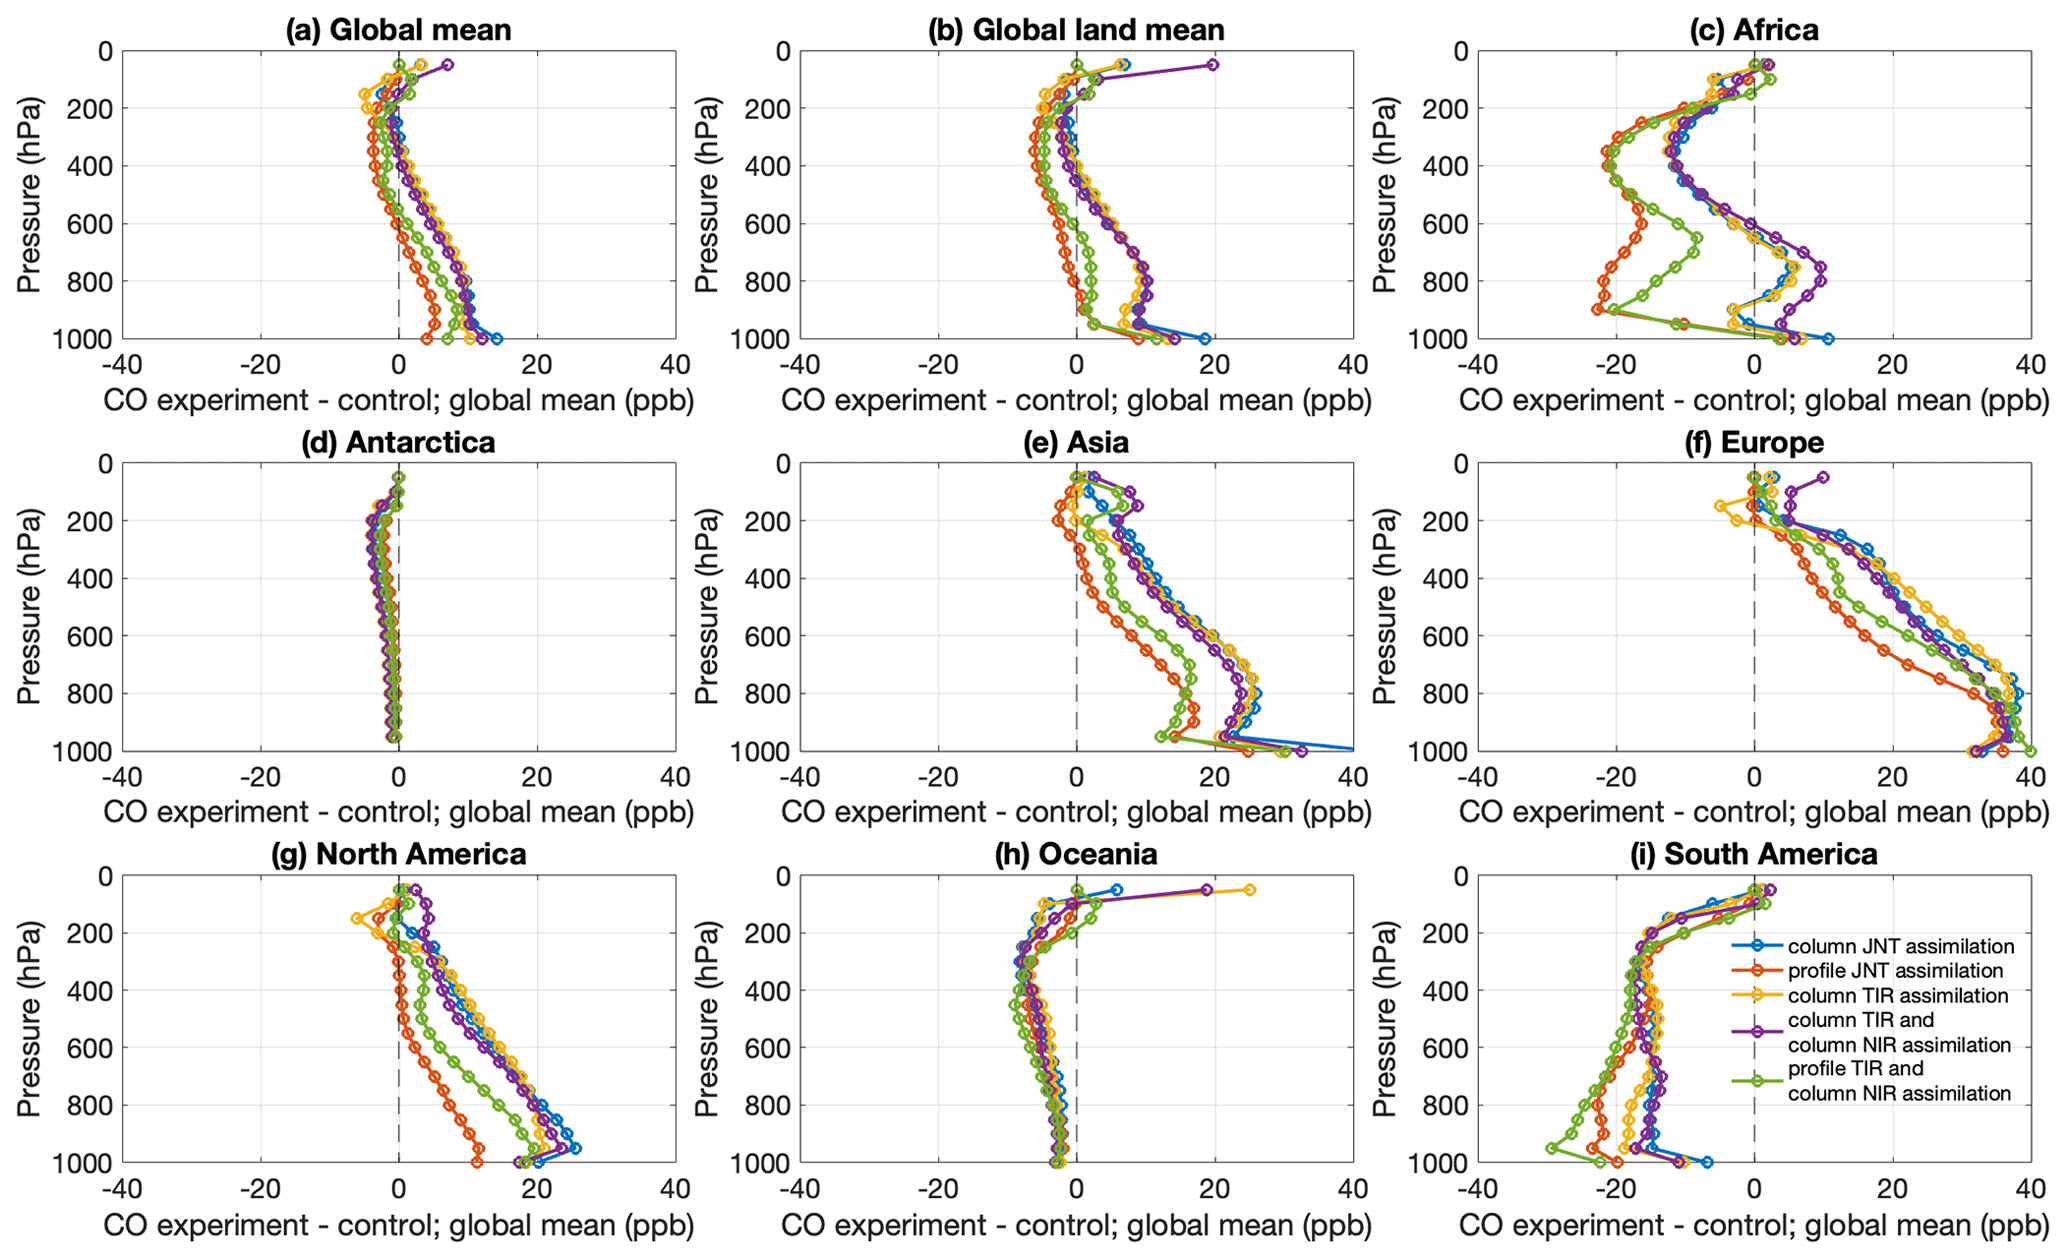
Figure 7Vertical profile of the 15 d (31 July–14 August 2018) average difference in CO (forecast of experiment minus control run) over different regions.
Assimilating profile products has different vertical impacts from assimilating column products (Fig. 7). Overall, the two experiments that involve profile assimilation (Exp2-PJ and Exp5-PT+CN) seem to be close to each other, while the other three experiments that only involve column assimilation (Exp1-CJ, Exp3-CT, and Exp4-CT+CN) also exhibit similarities among themselves. Globally speaking, experiments that assimilate only column product(s) have a larger impact at and near the surface compared to experiments that assimilate only profile product(s) (Fig. 7a and b). This is reasonable because profile assimilation is more localized vertically. Regional speaking, the impacts of the five experiments vary across continents.
The difference caused by assimilating profile products is in general smaller than the difference caused by assimilating column products. The exceptions are Africa and South America where the two experiments that assimilate profiles have lower CO than the three experiments that only assimilate columns between 900 and 600 hPa. CO over the two regions is dominated by fire emissions during the experiment period. It is known that FINN overestimates fire emissions in the tropics (Wiedinmyer et al., 2023; Gaubert et al., 2023), among CO which is transported to upper levels through fire plume rise and tropical convection. This overestimation between 900 and 600 hPa is corrected by assimilating MOPITT CO products, especially profile products that captured CO plumes between 900 and 600 hPa. Exp2-PJ and Exp5-PT+CN have some relatively small differences over some regions even though profile JNT is retrieved with profile TIR and column NIR. For example, over North America, Exp2-PJ has lower CO values than Exp5-PT+CN. Exp1-CJ and Exp4-CT+CN are in general similar with some exceptions. For example, over Africa between 900 and 600 hPa, the CO profile from Exp1-CJ is closer to Exp3-CT than Exp4-CT+CN.
5.1 TROPOMI
To evaluate the results, we compare the CO from DA forecasts with independent observations. Comparisons with TROPOMI CO column retrievals are shown in Fig. 8. The control run underestimates background CO in the Northern Hemisphere, while it overestimates CO near fire source regions in the tropics and Southern Hemisphere. Compared to the control run, all five of the experiments show improved agreement with TROPOMI CO by increasing background CO in the Northern Hemisphere and reducing CO near fire source regions in the tropics and Southern Hemisphere. The spatial distributions of the mean biases from the three experiments with only column assimilation are close, while those from the two experiments with profile assimilation are close. The two experiments with profile assimilations have smaller improvement for background CO in the Northern Hemisphere. This is reasonable because profile assimilation has a relatively smaller impact than column assimilation due to tight vertical localization. However, near the fire source regions, the two experiments with profile assimilations have lower biases than the three experiments with only column assimilation. This is the case not only in Africa, South America, and tropical Asia (Fig. 8), but also in California (fire region) and Nevada (downwind of the fire region), USA, during the study period, which is the fire season in the region (Fig. S5). This indicates that profile assimilation can outperform column assimilations in circumstances with fire impacts, which is likely due to transport errors and fire plume rise that requires vertical information to resolve plume locations.
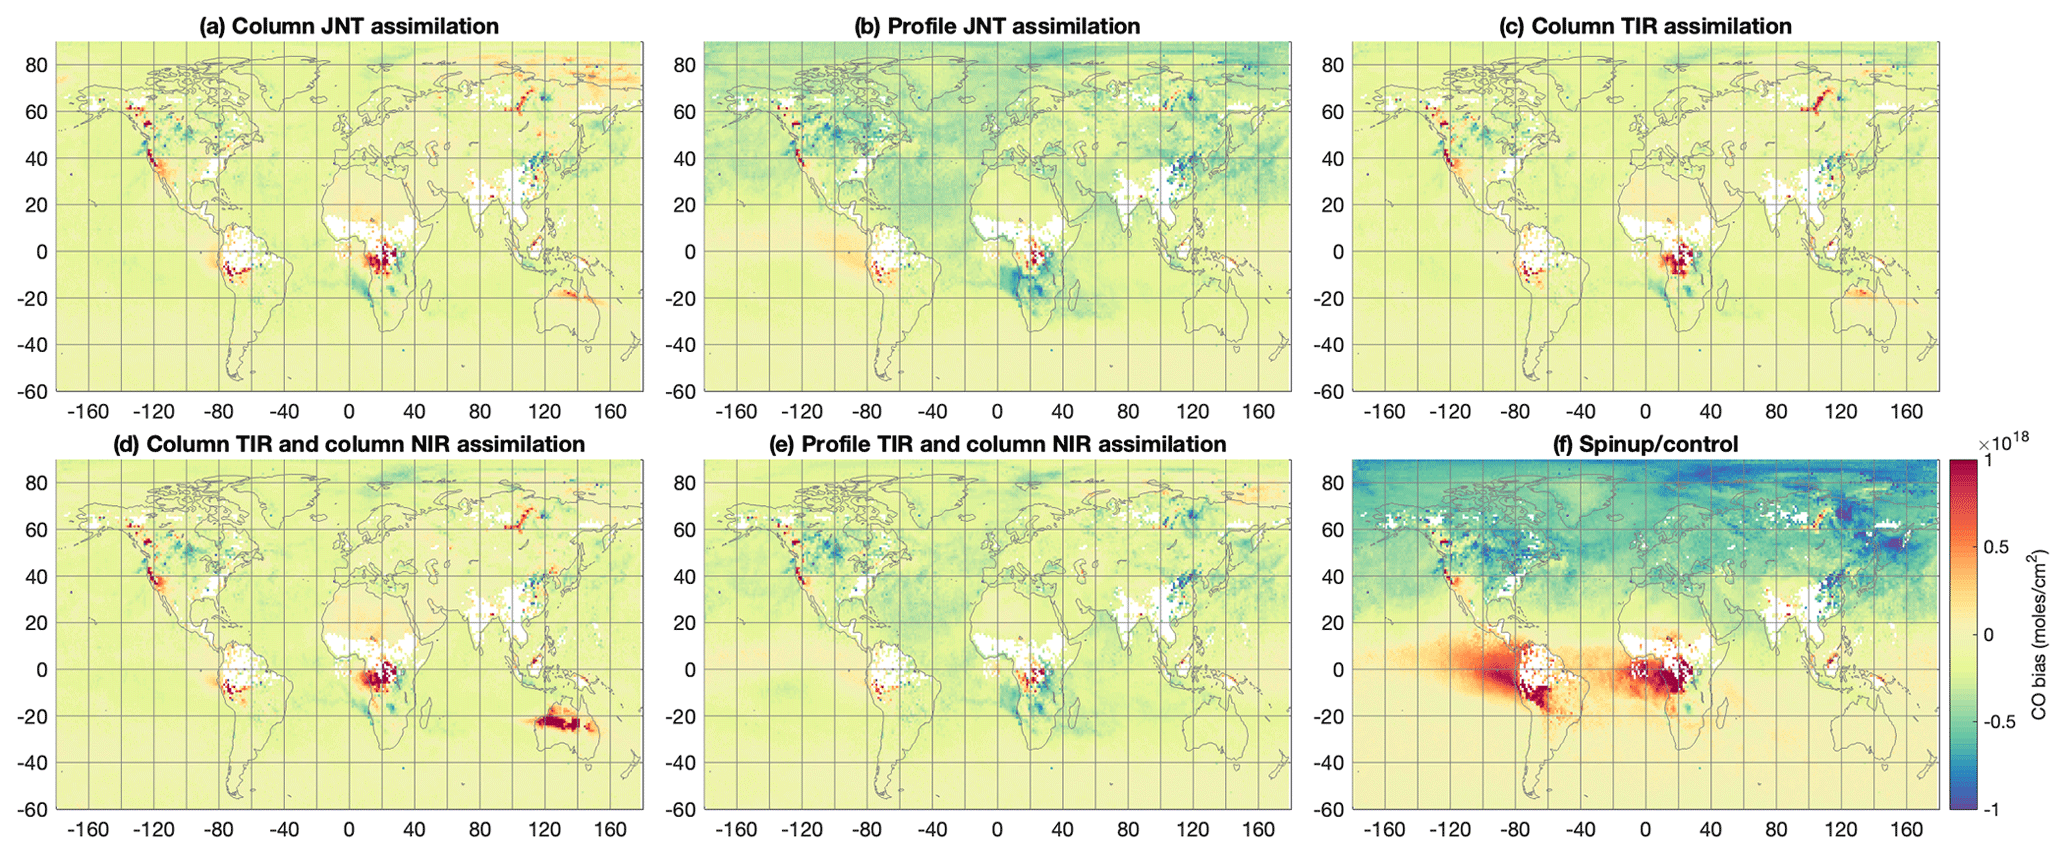
Figure 8The 15 d (31 July–14 August 2018) mean biases (ppb) of modeled CO against CO columns from the TROPOspheric Monitoring Instrument (TROPOMI) for the five experiments and the control run. TROPOMI averaging kernels are applied to model CO for the comparisons.
5.2 TCCON
Overall, the control run tends to underestimate CO and the five experiments all agree better with TCCON observations compared to the control run but still underestimates CO in general (Fig. 9). Column assimilations (Exp1-CJ, Exp3-CT, and Exp4-CT+CN) significantly overestimate CO at pasadena01 and edwards01 sites in California, USA, during 26 July to 4 August 2018, likely due to fire impacts. The significant overestimation is not seen in the two experiments with profile assimilations (Exp2-PJ and Exp5-PT+CN). This is consistent with the comparison results with TROPOMI and implies that profile assimilation can outperform column assimilations in fire-impacted regions. The model–observation discrepancies overall decrease with time. A time series of TCCON and modeled CO columns is shown in Fig. S6.
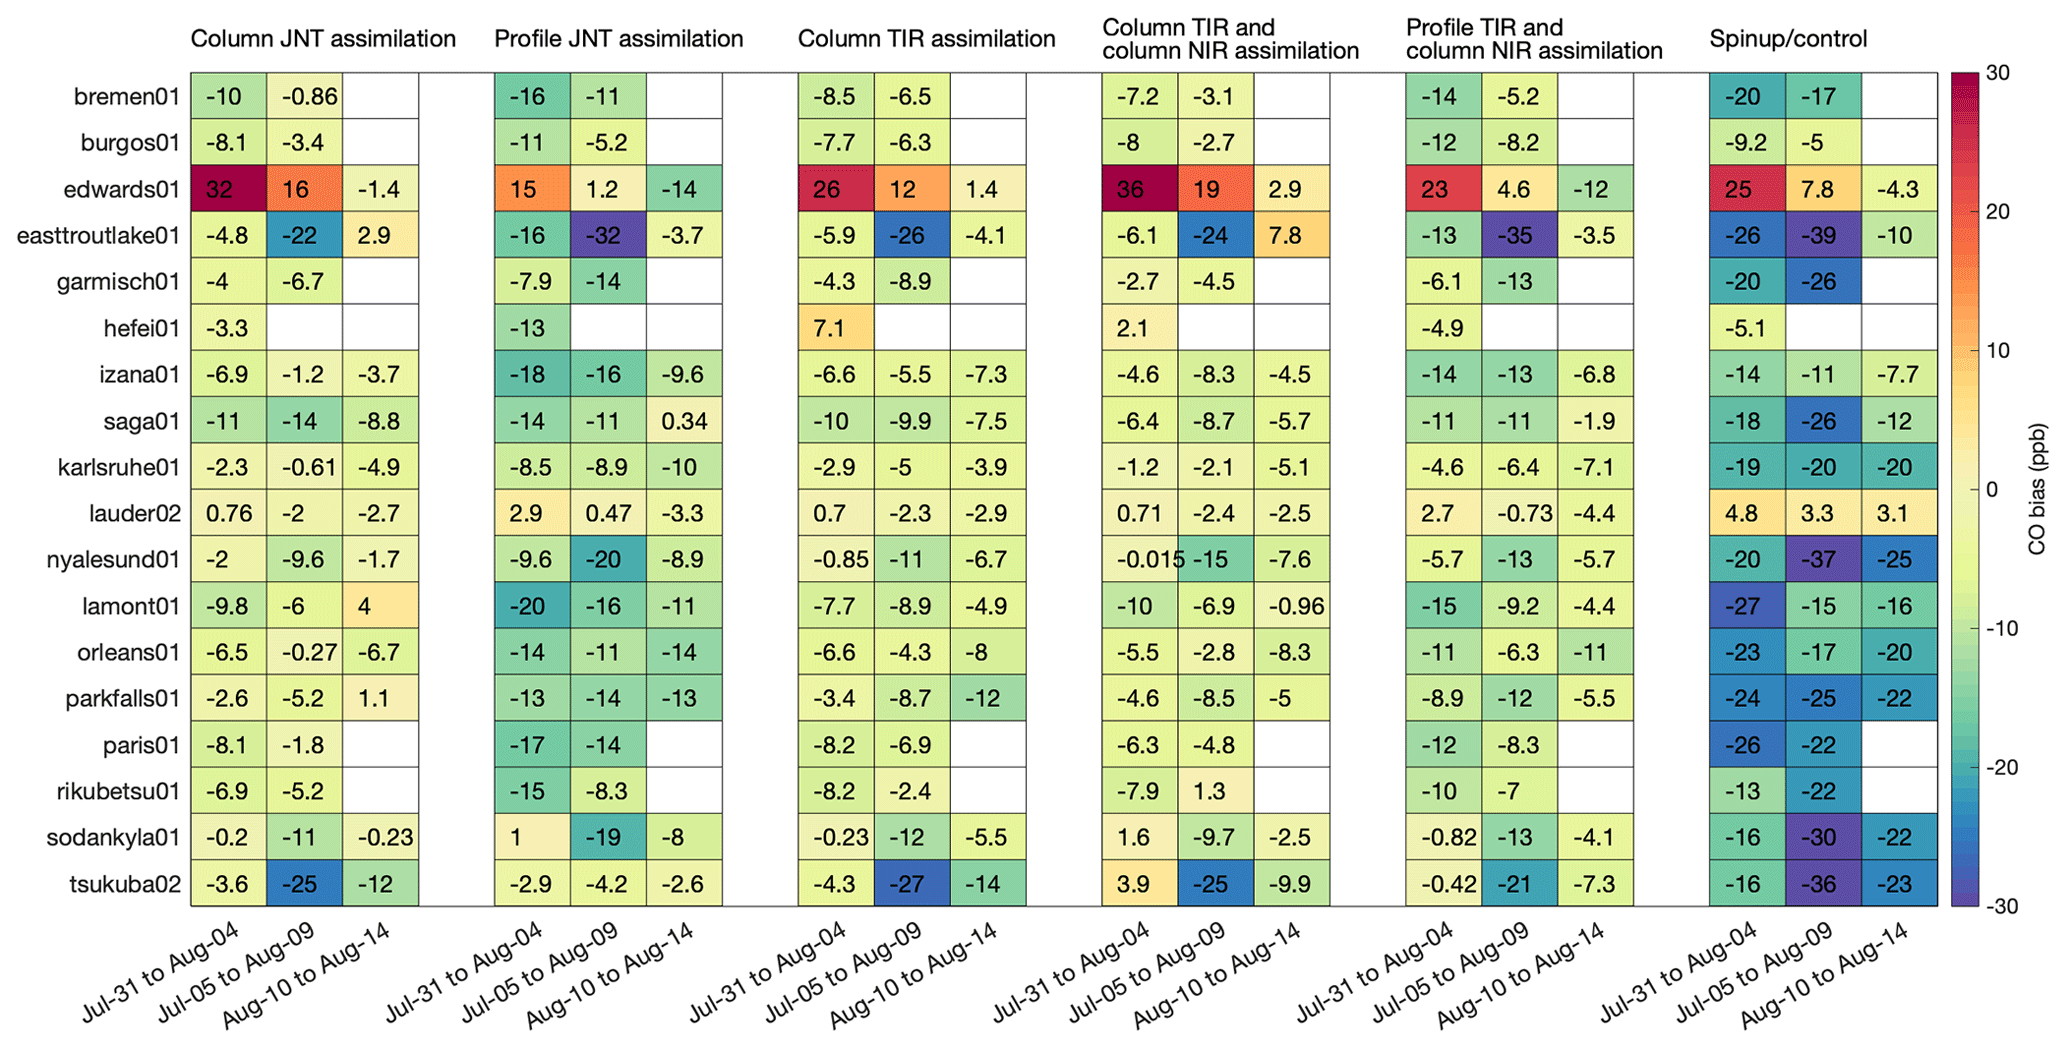
Figure 9Mean biases (ppb) of modeled CO against CO columns from the Total Carbon Column Observing Network (TCCON) for the five experiments and the control run. TCCON averaging kernels are applied to model CO for the comparisons. Spatial locations of TCCON sites can be found in Figs. 3 and S1. A time series of TCCON and modeled CO can be found in Fig. S4.
5.3 CCGG sites
All experiments show improved agreement with surface in situ CO observations from CCGG sites compared to the control run (Fig. 10), as shown by higher correlations (0.6–0.65 versus 0.56) and lower model biases (0.7–4.91 versus 8.6 ppb). As for RMSE, however, the experiments do not reduce RMSE compared to the control run (34–50 versus 36 ppb). Exp1-CJ has the lowest mean bias (5.7 ppb), while Exp5-PT+CN has the highest correlation (0.79).
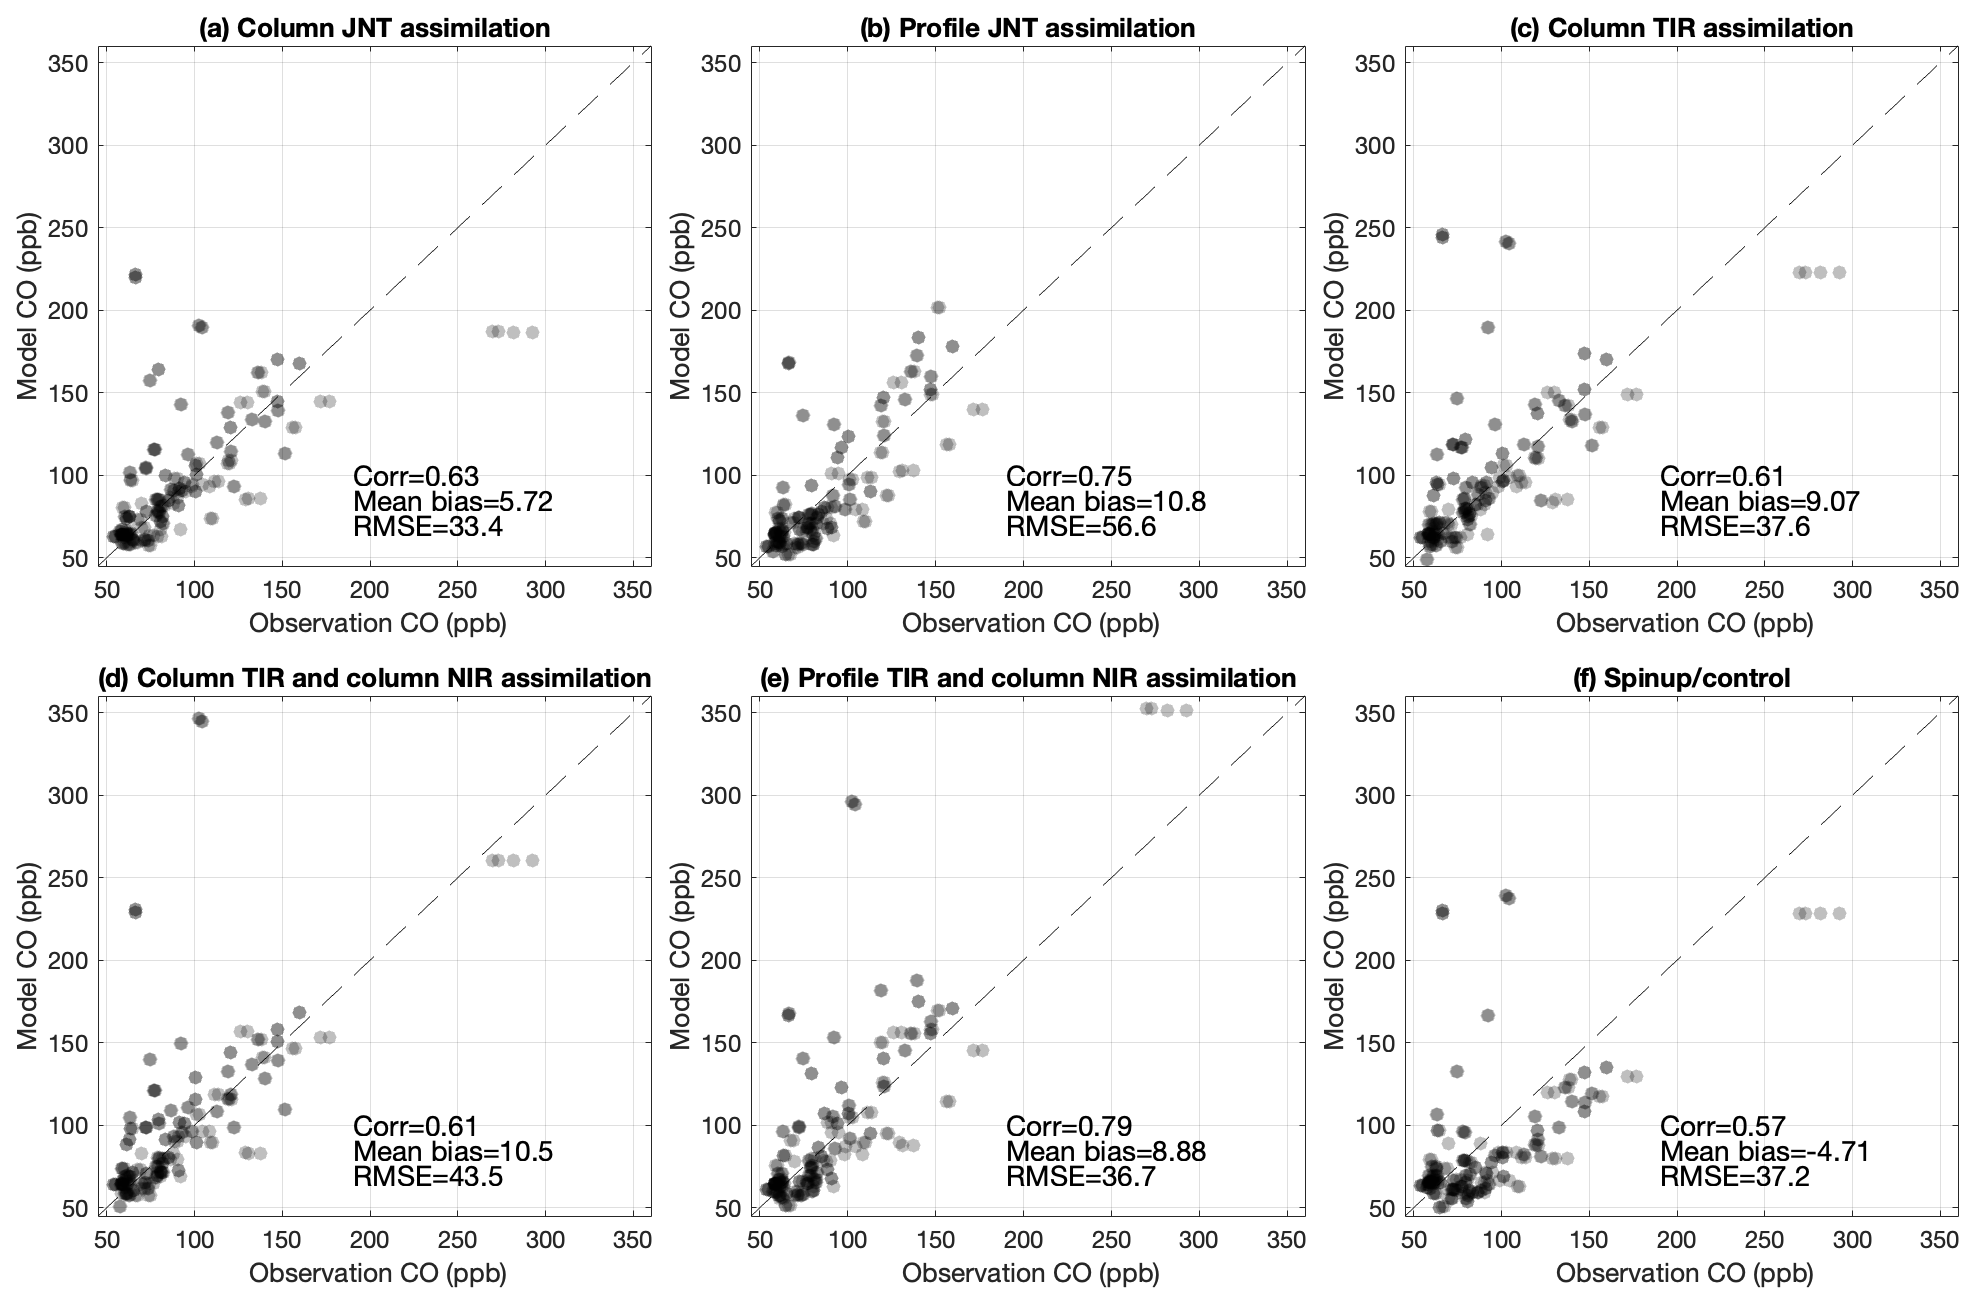
Figure 10Comparisons of modeled CO (ppb) and CO observations (ppb) from the NOAA Carbon Cycle Greenhouse Gases (CCGG) sites during 31 July to 14 August 2018 for the five experiments and the control run. Spatial locations of CCGG sites can be found in Figs. 3 and S1. A spatial distribution of model bias in CO against CO observations from CCGG sites can be found in Fig. S5.
Spatial distributions of model bias in CO (ppb) against CO observations from CCGG sites are shown in Figs. S7–S10. The UTA CCGG site is close to the two TCCON sites in California, USA (pasadena01 and edwards01). All five experiments significantly underestimate CO at the UTA surface site during 26 July to 4 August 2018, whereas the five experiments overestimate CO compared to the two TCCON sites (Fig. 9). This inconsistency is likely due to (1) the UTA CCGG site measuring CO at the surface, while the TCCON sites measure column total CO, and the fact that (2) there are only two data points during that period at the UTA site that are not comparable to the sampling of the two TCCON sites.
5.4 IAGOS
Globally, all five experiments agree better with IAGOS CO profiles compared to the control run (Fig. 11a). At the 900–1000 hPa layer, Exp2-PJ has the lowest bias, followed by Exp4-CT+CN. At layers above 800 hPa, the three experiments with only column assimilation have lower bias. CO biases of Exp1-CJ and Exp4-CT+CN are very similar using that of Exp3-CT as a reference. This is expected as the column JNT product contains similar information as the column TIR product and column NIR products together. Above 200 hPa, all five experiments overall agree better with IAGOS CO compared to the control run. However, experiments involving profile assimilation do not show obvious differences compared to experiments only involving column assimilation above 200 hPa. Over most regions, the five experiments show improved agreement with IAGOS data except for tropical Asia and Central and South America where the five experiments have similar or larger biases (Fig. 11). Over North and West Africa, the control run has a positive bias, whereas the five experiments have negative biases below 500 hPa, indicating that the system might overadjust in the region. The comparisons with IAGOS show that the experiments overall perform better in the Northern Hemisphere than in the tropics.
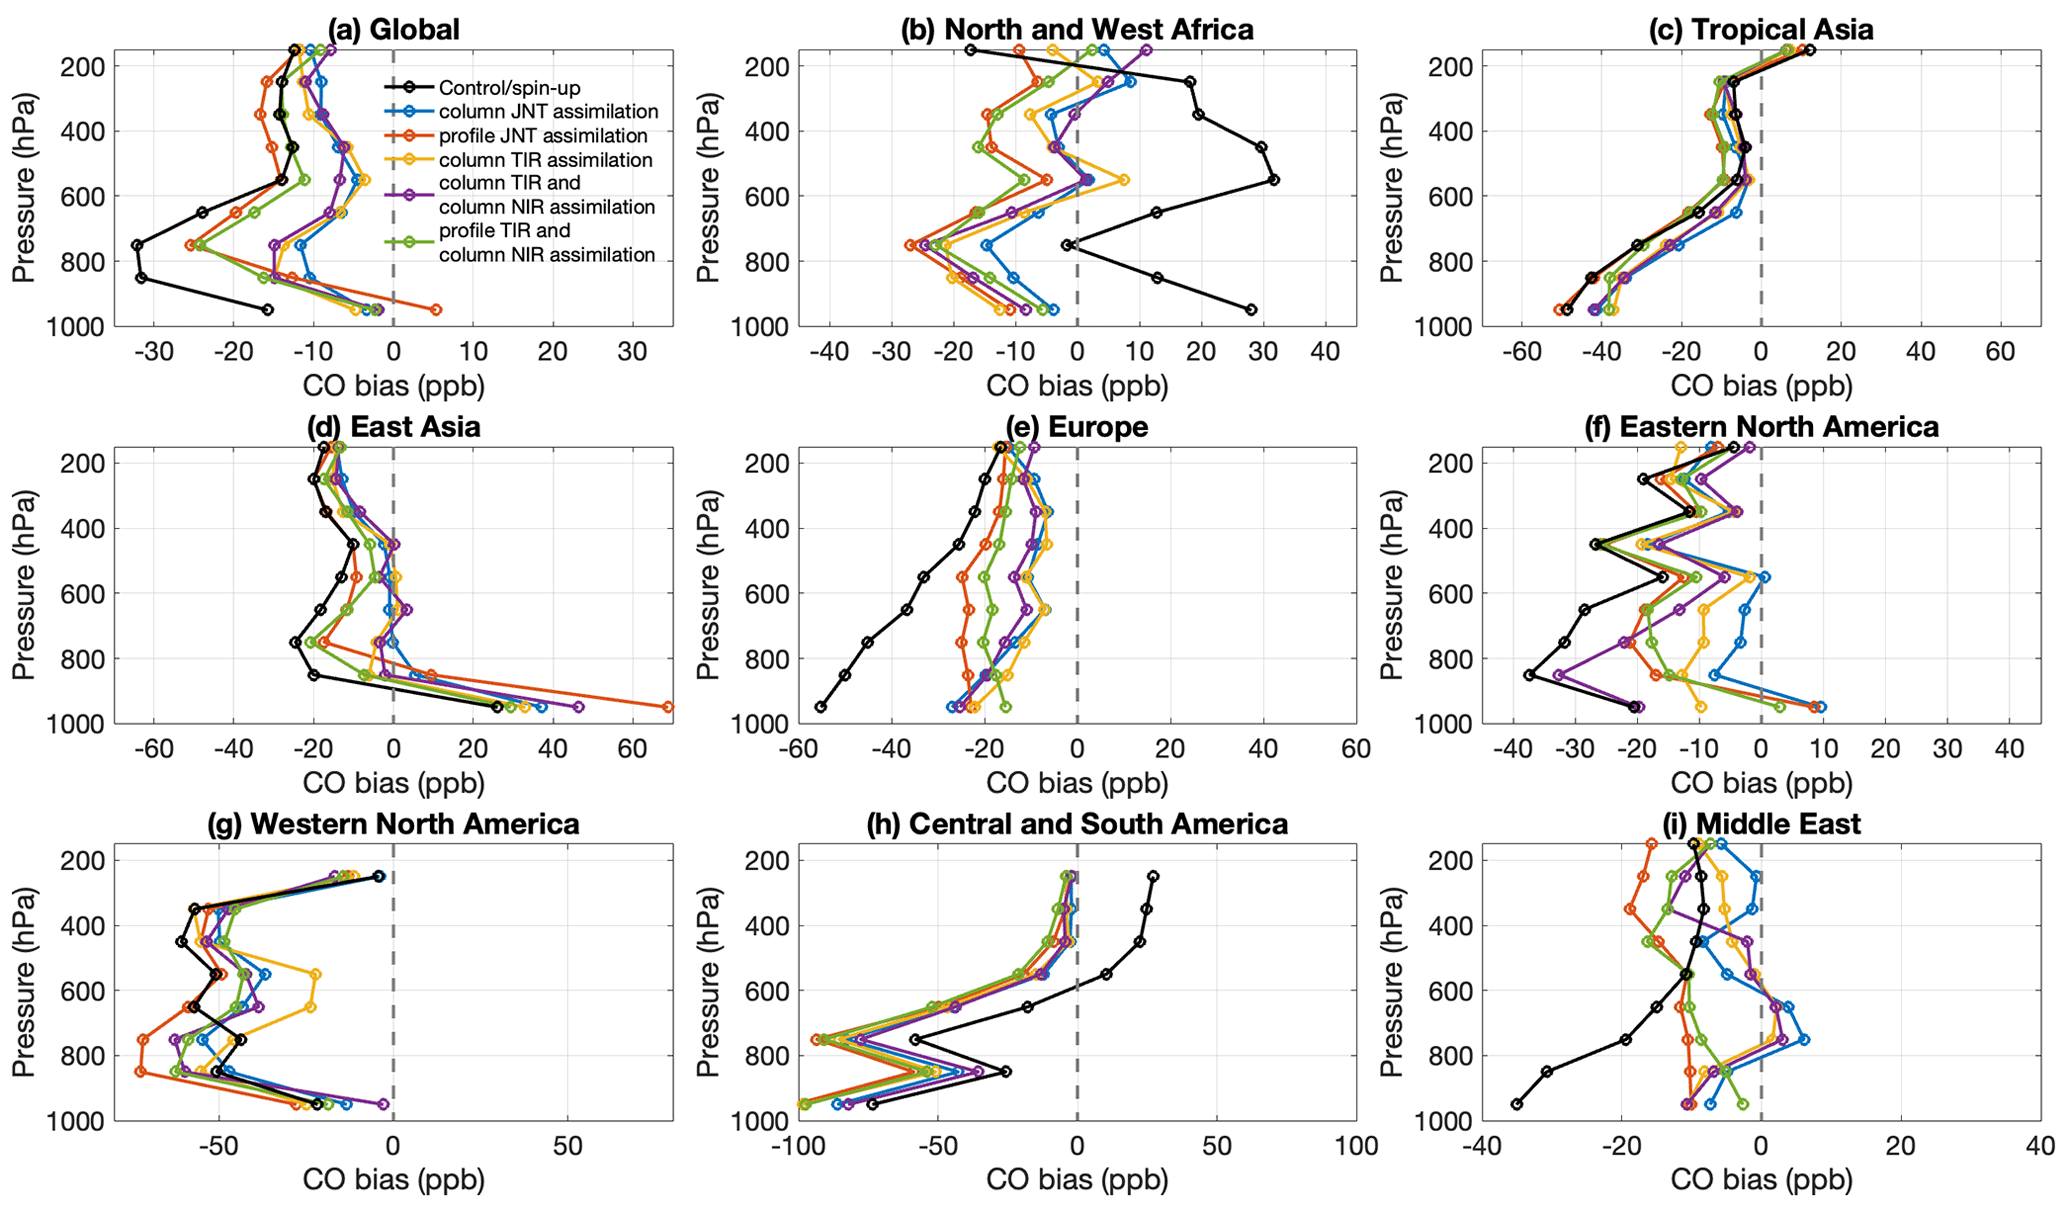
Figure 11Mean biases (ppb) of modeled CO against CO profiles from the In-service Aircraft for a Global Observing System (IAGOS) measurements for the five experiments (colored lines) and the control run (black line) at different vertical levels. Locations of IAGOS CO profiles can be found in Fig. S2.
5.5 WE-CAN
The experiments do not show improvement from the control run when compared to airborne measurements from WE-CAN (Fig. 12). This is expected because the airborne measurements during WE-CAN aimed to sample fire plumes and include extremely high CO concentrations which are challenging for a 1° global model to capture, not to mention the output is 6-hourly.
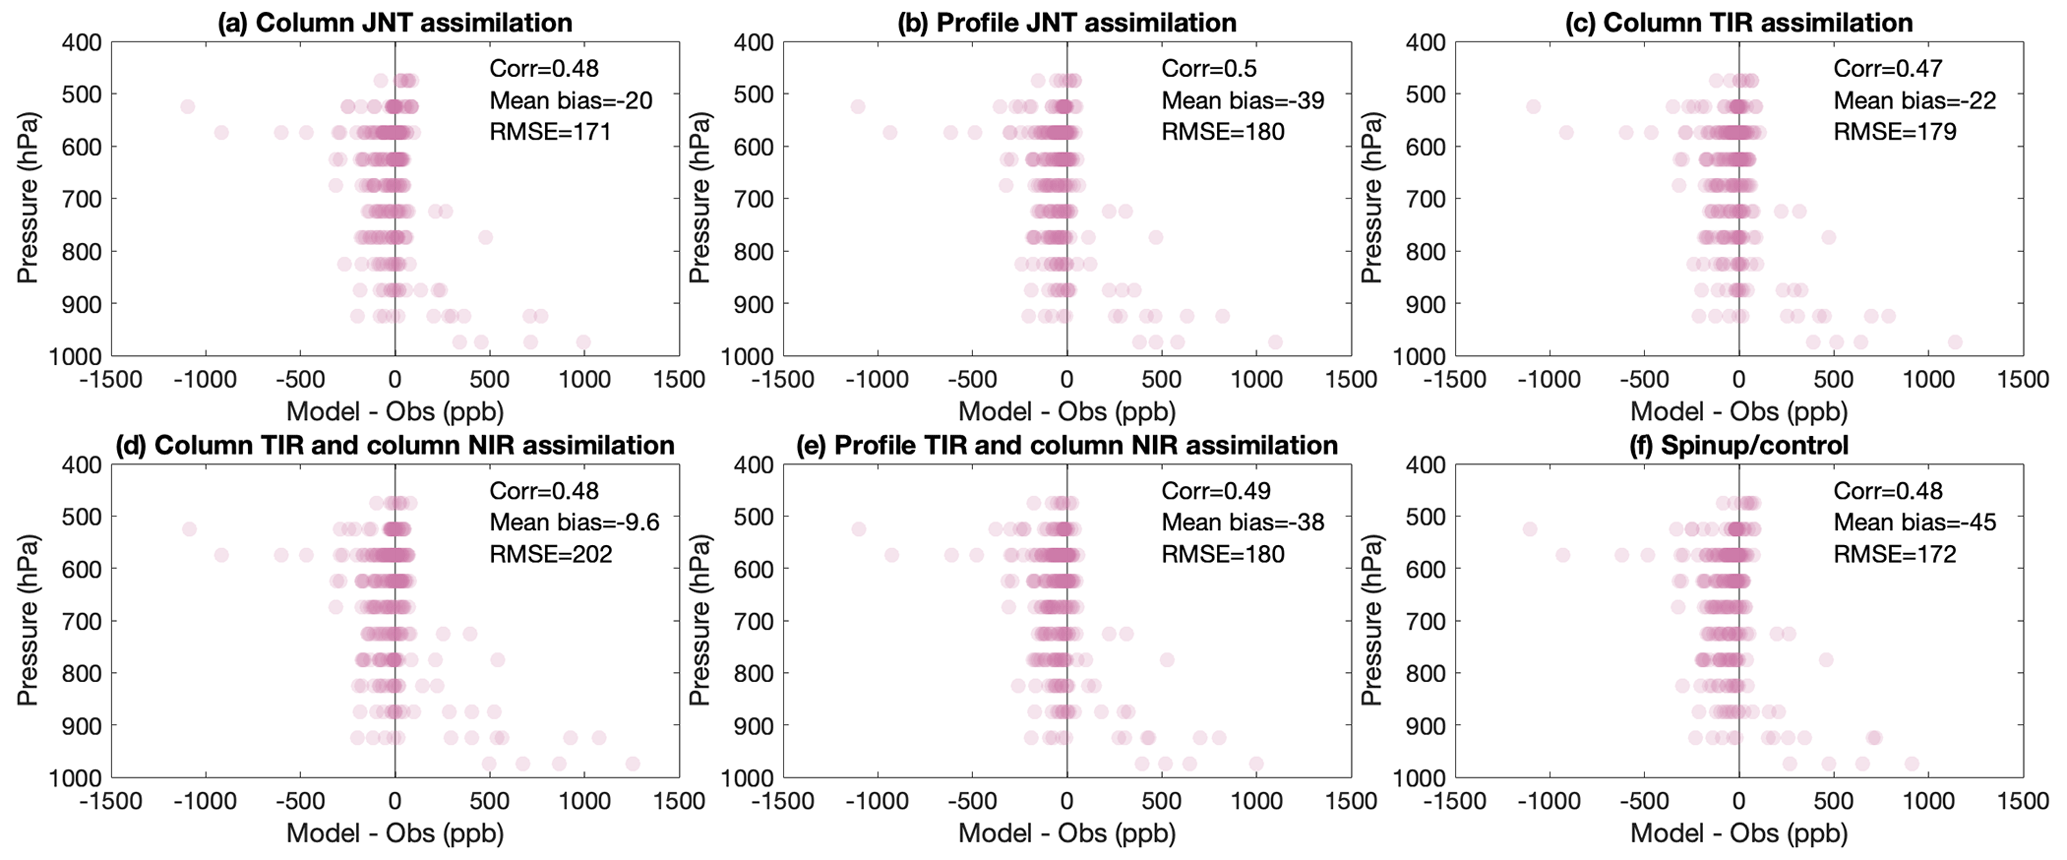
Figure 12Mean biases (ppb) of modeled CO against airborne CO observations from the Western wildfire Experiment for Cloud chemistry, Aerosol absorption and Nitrogen (WE-CAN) field campaign for the five experiments and the control run at different vertical levels.
The experiments show lower model bias than the control run (−24 to −48 versus −52 ppb); however, the difference between Exp2-PJ and Exp5-PT+CN from the control run is small. The correlation and RMSE of the experiments are not improved. The subtle improvement in the mean bias is likely driven by large-scale adjustment rather than improvement in resolving flight-scale features.
6.1 Emission updates
Assimilating profile products (Exp2-PJ and Exp5-PT+CN) tends to lead to a larger change to the emissions compared to only assimilating column products (Exp1-CJ, Exp3-CT, and Exp4-CT+CN). As shown previously, profile assimilation can outperform column assimilations near the surface due to vertical localization. Different CO concentrations at and near the surface resulted in different emission updates between profile assimilation and column assimilation. The five experiments overall increase anthropogenic CO emissions, while they reduce fire CO emissions (Fig. 13). For anthropogenic emissions, the two experiments that assimilate CO profiles (Exp2-PJ and Exp5-PT+CN) significantly increase anthropogenic CO emissions from ∼ 500 to ∼ 700 Tg yr−1 globally in August, which is not the case for the other experiments. Anthropogenic emissions in India are reduced by the experiments, while in East Asia they are increased (Fig. 14). Fire emissions are reduced by the five experiments in Africa and South America, and the reduction is the largest for the two experiments that assimilate CO profiles (Figs. 13 and 14). This is consistent with the conclusion in Wiedinmyer et al. (2023), which found that fire emissions in FINNv2.4 over Africa are too high and were consequently reduced in FINNv2.5. The experiments overall increase fire emissions in North America, indicating that FINNv2.4 underestimates fire emissions in the region during the assimilation period. Fire and anthropogenic emissions can have different injection heights and impact different vertical levels. This is especially the case for regions with strong convection (e.g., central Africa).
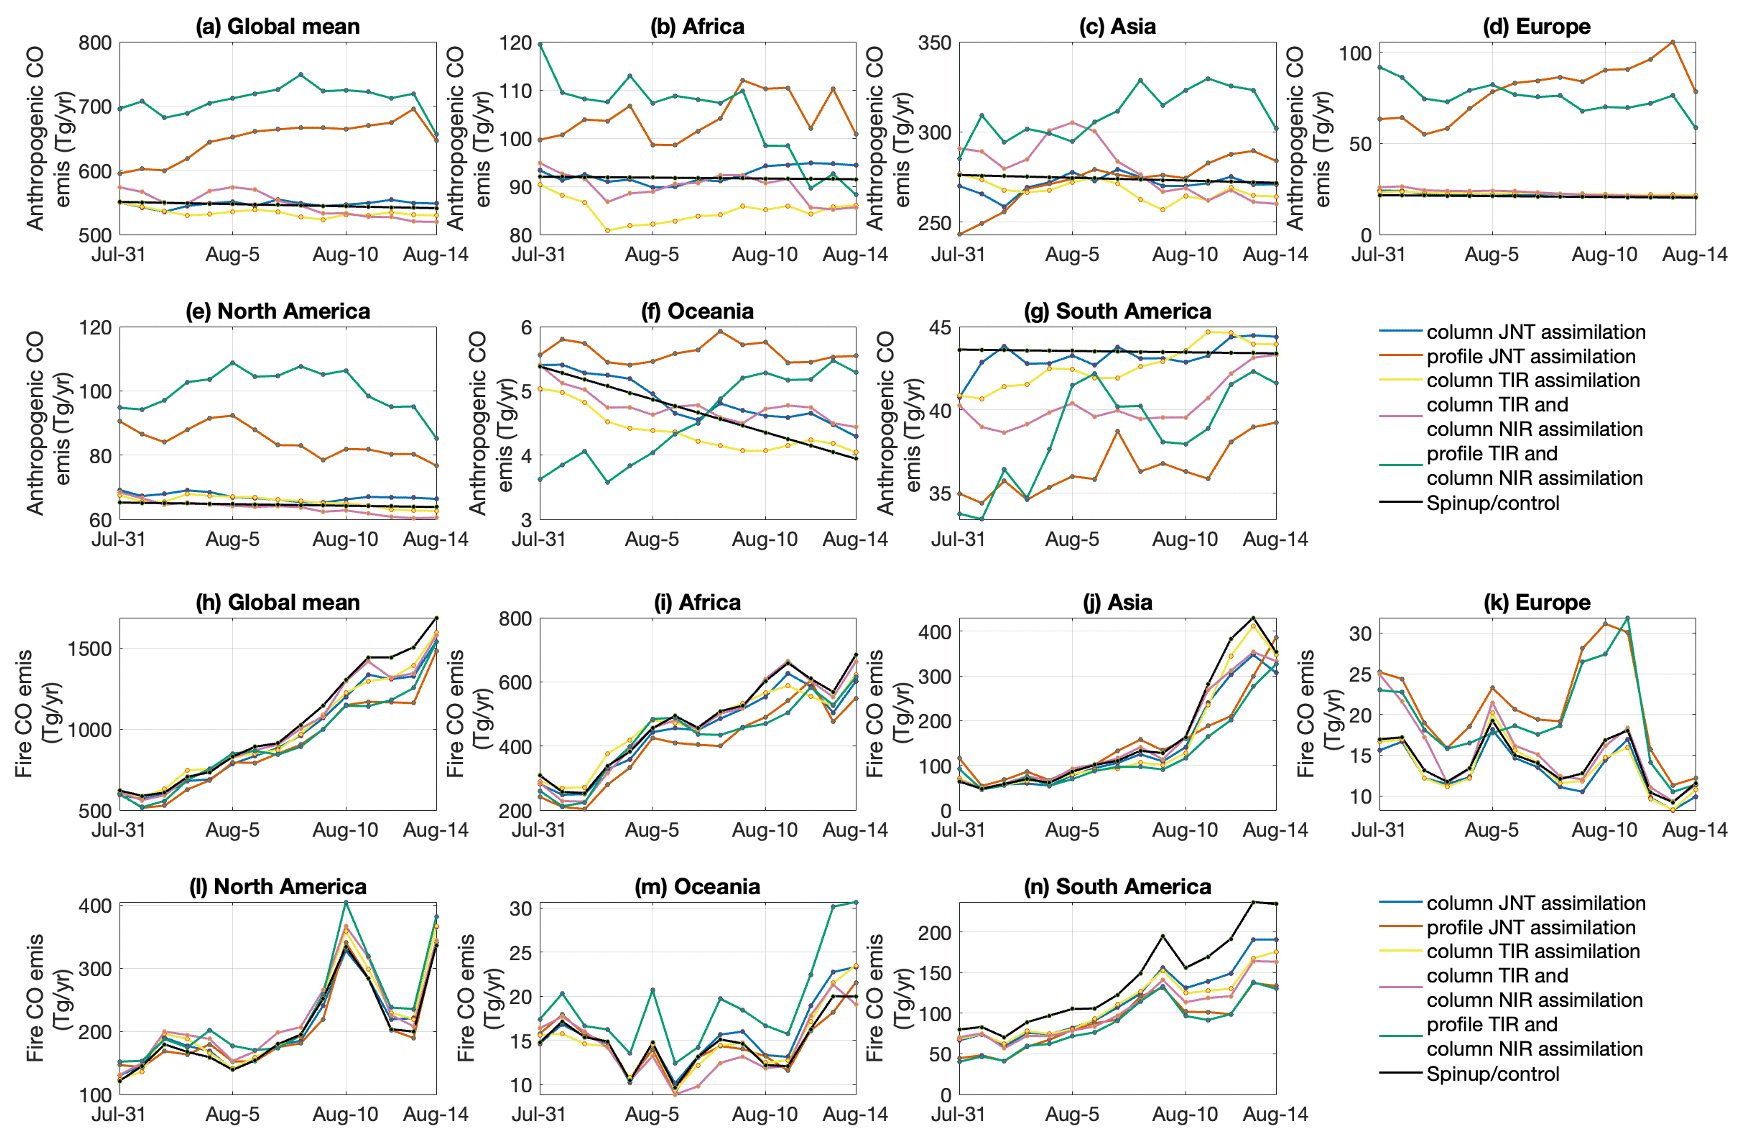
Figure 13Updated (a–g) CAMS anthropogenic CO emissions and (h–n) FINNv2.4 fire CO emissions as a result of assimilating different MOPITT products. The emissions from the spin-up and control run are the unchanged original emissions of CAMS and FINNv2.4.
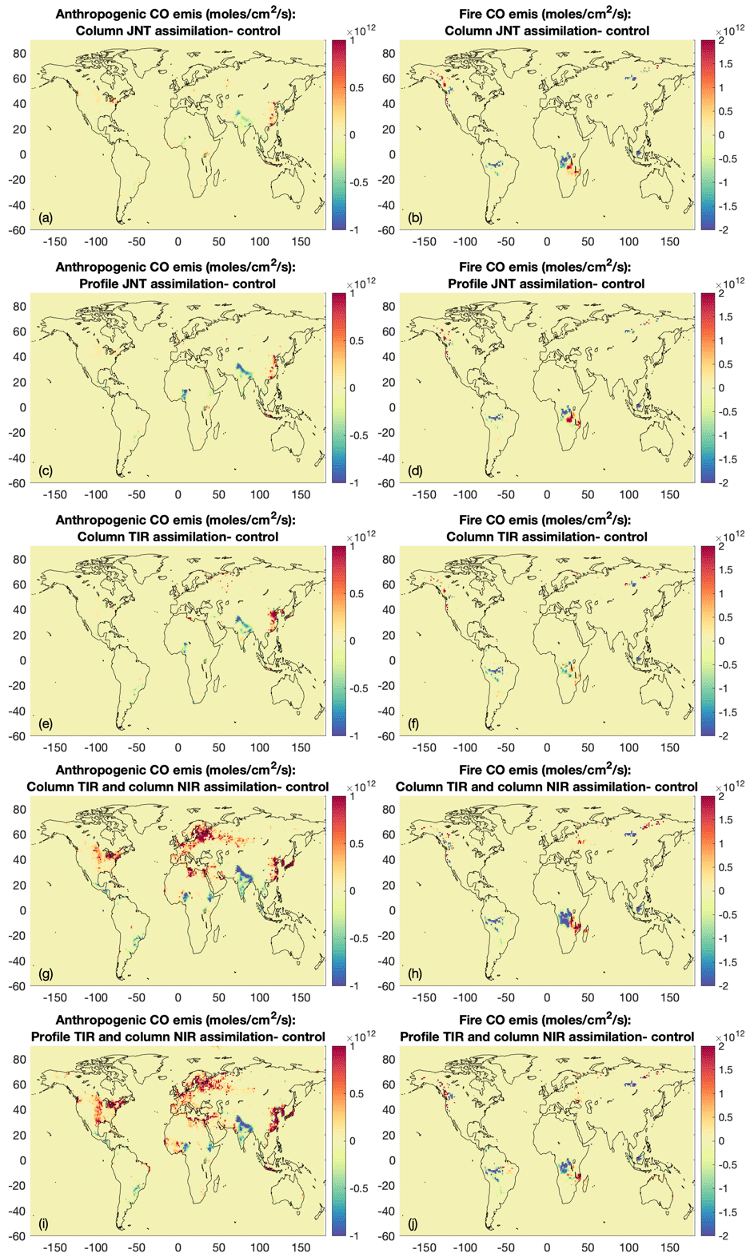
Figure 14Updates to the (a) CAMS anthropogenic CO emissions and (b) FINNv2.4 fire CO emissions as a result of assimilating the MOPITT column JNT product. Updates are calculated as CO from the experiment minus CO from the control run. Panels (c–j) are similar to (a–b) but for other experiments.
6.2 CAM-chem simulations with updated emissions
We compared the CAM-chem simulations with updated emissions and original emissions to CO observations from TROPOMI, TCCON, CCGG sites, IAGOS, and WE-CAN (Figs. S11–S18). The five simulations with updated emissions overall show better agreement with observations compared to the control run with original emissions. Simulations using emissions from profile assimilation experiments (simulations S2 and S5) in general perform better than column assimilation, especially near the surface (S17) and in fire source regions (Figs. S11, S12, and S14). This is consistent with the evaluation of DA experiments. This indicates that assimilating satellite profiles can perform better near the surface and have a larger impact on emissions compared to only assimilating column products.
7.1 Assimilating multispectral product versus TIR-only product
The comparisons between Exp1-CJ and Exp3-CT demonstrate the impacts of assimilating satellite multispectral and joint products versus TIR-only products. Overall, when comparing to independent CO column observations, assimilating joint products does not show clear improvement from assimilating TIR-only products (Figs. 8 and 9). However, when comparing to independent CO profile observations or surface CO observations, assimilating joint products leads to better model–observation agreement at and near the surface (Figs. 10 and 11). This is reasonable as the joint MOPITT product has enhanced sensitivity to near-surface CO (Worden et al., 2010).
7.2 Assimilating profile product versus column product
The comparisons between Exp1-CJ and Exp2-PJ demonstrate the impacts of assimilating satellite multispectral and joint products versus TIR-only products. The fractions of rejected observations for Exp3-CT decrease slower than Exp1-CJ due to vertical localization when assimilating profile products. For the same reason, assimilating column products has a larger impact on the analysis compared to assimilating profile products. Therefore, Exp2-PJ with profile assimilation has smaller improvement for background and large-scale CO in the Northern Hemisphere (Fig. 8) compared to Exp1-CJ with column assimilation. However, assimilating profile products can have different vertical impacts from assimilating column products (Fig. 7). Profile assimilation can outperform column assimilations in fire-impacted regions and near the surface (Fig. 11).
Assimilating profile products tends to lead to a larger change to the emissions compared to only assimilating column products. Simulations using emissions from profile assimilation experiments in general perform better than column assimilation, especially near the surface and in fire source regions.
7.3 Assimilating multispectral product versus assimilating TIR and NIR separately
For multispectral and joint products, we also compare the impacts of assimilating the joint product directly versus assimilating the single spectral products separately. MOPITT column JNT products are retrieved from MOPITT column TIR and column NIR products, while MOPITT profile JNT products are retrieved from MOPITT profile TIR and NIR products. Therefore, we compare Exp1-CJ to Exp4-CT+CN and Exp2-PJ to Exp5-PT+CN for demonstration. In general, assimilating multispectral and joint products results in similar or slightly better agreement with observations compared to assimilating the single spectral products separately. This is the case for both assimilating profile products (Exp2-PJ versus Exp5-PT+CN) and column products (Exp1-CJ versus Exp4-CT+CN). In addition, assimilating multispectral and joint products is more computationally efficient than assimilating single spectral products separately. These two reasons point to the benefit of developing multispectral and joint products for CO as well as other species such as O3 and CH4 and assimilating them into DA systems.
7.4 Limitation
Here we only conduct experiments for 15 d as the number of experiments and computational cost prohibit longer simulations. A previous study performed longer simulations for one experiment that assimilated the MOPITT profile product for a whole year (Gaubert et al., 2016) and found that there is no significant seasonal change in the performance of CAM-chem+DART. If observations of roughly the same qualities and quantities are available in other years, the performance of the DA might be expected to be similar. However, more research is needed to fully understand the impact of (1) assimilating multispectral and joint products versus single spectral products, (2) the comparison of satellite profiles and satellite columns with DA, and (3) assimilating multispectral products or each product separately. This study provides guidance for future work on the assimilation of multispectral satellite retrievals of atmospheric composition using MOPITT as a demonstration. However, whether the conclusions based on MOPITT CO are applicable to other species (e.g., CH4 and O3) needs further study. Nevertheless, the results and conclusions presented in this study are valid and shed light on the impacts of assimilating different satellite products of the same atmospheric composition.
The CAM-chem+DART experiments in this study overall show improvement in background and large-scale CO distributions compared to the control and spin-up run, as shown by the comparisons with global observations such as TROPOMI and TCCON. However, CAM-chem+DART improvement on small-scale features is challenging due to limitation in model resolution, as shown by the comparisons with airborne measurements during WE-CAN. A higher-resolution DA system is needed to resolve these features. We are currently developing the capability of DA using MUSICA+DART, which will address this issue (Pfister et al., 2020). MUSICA has already been shown to better resolve fires at higher resolution while still addressing global-scale impacts (Tang et al., 2022, 2023).
We conduct six CAM-chem+DART assimilation runs for 15 d (31 July to 14 August 2018) to understand the impact of (1) assimilating multispectral products versus single spectral products, (2) assimilating satellite profile products versus column products, and (3) assimilating multispectral products versus assimilating individual products separately. The DA runs include one control run that only assimilates meteorological variables and five experiment runs that assimilate meteorological variables and different MOPITT product(s), namely Exp1-CJ, Exp2-PJ, Exp3-CT, Exp4-CT+CN, and Exp5-PT+CN. We then compare the results with independent CO observations from satellite, ground-based remote sensing, surface, and aircraft observations (TROPOMI, TCCON, CCGG sites, IAGOS, and WE-CAN). Fire and anthropogenic emissions of CO are also optimized in the DA experiments. We conduct five CAM-chem runs with the five sets of optimized emissions to understand the impacts of assimilating different MOPITT products. We also conduct one additional CAM-chem run with original emissions for reference. The main findings are as follows.
-
Assimilating MOPITT profile products improves model agreement with MOPITT column products and vice versa.
-
All five DA experiments show improved agreement with CO observations from TROPOMI, TCCON, CCGG sites, and IAGOS compared to the control and spin-up run. Assimilating the MOPITT joint column product leads to better model–observation agreement at and near the surface than assimilating the MOPITT TIR-only column product.
-
Assimilating profile products tends to lead to a larger change to the emissions compared to only assimilating column products. The five experiments overall increase anthropogenic CO emissions while reducing fire CO emissions. The five CAM-chem simulations with updated emissions overall show better agreement with observations compared to the control run with original emissions. Simulations using emissions from profile assimilation experiments in general perform better than column assimilation, especially near the surface and in fire source regions.
-
Assimilating column products has larger impacts and improvement for background and large-scale CO compared to assimilating profile products due to vertical localization in profile assimilation. However, profile assimilation can outperform column assimilations in fire-impacted regions and near the surface.
-
Assimilating multispectral and joint products results in similar or slightly better agreement with observations compared to assimilating the single spectral products separately. Assimilating multispectral and joint products is also more computationally efficient than assimilating single spectral products separately. Therefore, it is advantageous to develop multispectral and joint products for CO as well as other species (e.g., O3 and CH4) and assimilating them into DA systems.
Code generated in this study can be accessed via https://doi.org/10.5281/zenodo.10882836 (Tang, 2024).
MOPITT products can be accessed through https://search.earthdata.nasa.gov/search (last access: 26 March 2024; https://doi.org/10.5067/TERRA/MOPITT/MOP02T.009, NASA/LARC/SD/ASDC, 2024a; https://doi.org/10.5067/TERRA/MOPITT/MOP02J.009, NASA/LARC/SD/ASDC, 2024b; https://doi.org/10.5067/TERRA/MOPITT/MOP02N.009, NASA/LARC/SD/ASDC, 2024c). TROPOMI CO data can be downloaded from https://doi.org/10.5270/S5P-bj3nry0 (Copernicus Sentinel-5P, 2021). TCCON data can be found at https://tccondata.org/2020 (last access: 26 March 2024; https://doi.org/10.14291/tccon.ggg2020.nyalesund01.R0, Buschmann et al., 2022; https://doi.org/10.14291/tccon.ggg2020.izana01.R1, García et al., 2022; https://doi.org/10.14291/tccon.ggg2020.karlsruhe01.R0, Hase et al., 2022; https://doi.org/10.14291/tccon.ggg2020.edwards01.R0, Iraci et al., 2022; https://doi.org/10.14291/tccon.ggg2020.sodankyla01.R0, Kivi et al., 2022; https://doi.org/10.14291/tccon.ggg2020.hefei01.R0, Liu et al., 2022; https://doi.org/10.14291/tccon.ggg2020.rikubetsu01.R0, Morino et al., 2022a; https://doi.org/10.14291/tccon.ggg2020.tsukuba02.R0, Morino et al., 2022b; https://doi.org/10.14291/tccon.ggg2020.burgos01.R0, Morino et al., 2022c; https://doi.org/10.14291/tccon.ggg2020.bremen01.R0, Notholt et al., 2022; https://doi.org/10.14291/tccon.ggg2020.lauder03.R0, Pollard et al., 2022; https://doi.org/10.14291/tccon.ggg2020.saga01.R0, Shiomi et al., 2022; https://doi.org/10.14291/tccon.ggg2020.paris01.R0, Té et al., 2022; https://doi.org/10.14291/tccon.ggg2020.orleans01.R0, Warneke et al., 2022; https://doi.org/10.14291/tccon.ggg2020.parkfalls01.R1, Wennberg et al., 2022a; https://doi.org/10.14291/tccon.ggg2020.lamont01.R0, Wennberg et al., 2022b; https://doi.org/10.14291/tccon.ggg2020.easttroutlake01.R0, Wunch et al., 2022). NOAA GML Carbon Cycle Cooperative Global Air Sampling Network data can be accessed through https://gml.noaa.gov/aftp/data/trace_gases/co/flask/surface/ (last access: 26 March 2024; Petron et al., 2022). IAGOS data are available at https://doi.org/10.25326/20 (Boulanger et al., 2019). WE-CAN data are available at http://data.eol.ucar.edu/master_lists/generated/we-can/ (last access: 29 March 2024; Campos, 2019).
The supplement related to this article is available online at: https://doi.org/10.5194/amt-17-1941-2024-supplement.
Conceptualization, HW; investigation, WT and BG; methodology, BG, WT, HW, and LE; formal analysis, WT and BG; data curation, DZ, DM, KR, and JA; validation, WT; visualization, WT; supervision, HW; Writing – original draft preparation, WT, BG, and HW; writing – review and editing, LE, DE, AA, DZ, DM, KR, and JA.
At least one of the (co-)authors is a member of the editorial board of Atmospheric Measurement Techniques. The peer-review process was guided by an independent editor, and the authors also have no other competing interests to declare.
Publisher's note: Copernicus Publications remains neutral with regard to jurisdictional claims made in the text, published maps, institutional affiliations, or any other geographical representation in this paper. While Copernicus Publications makes every effort to include appropriate place names, the final responsibility lies with the authors.
This project is partially supported by the NOAA Atmospheric Chemistry, Carbon Cycle and Climate (AC4) Program (award number: NA22OAR4310204). This material is based upon work supported by the National Center for Atmospheric Research, which is a major facility sponsored by the National Science Foundation under cooperative agreement no. 1852977. We would like to acknowledge high-performance computing support from Cheyenne (DOI: https://doi.org/10.5065/D6RX99HX, Computational and Information Systems Laboratory, 2019) provided by NSF NCAR's Computational and Information Systems Laboratory, sponsored by the National Science Foundation. We thank the TROPOMI, TCCON, NOAA CCGG, IAGOS, and WE-CAN teams for observational data. The TCCON data were obtained from the TCCON Data Archive hosted by CaltechDATA at https://tccondata.org (last access: 26 March 2024).
This research has been supported by the National Oceanic and Atmospheric Administration (grant no. NA22OAR4310204).
This paper was edited by Meng Gao and reviewed by two anonymous referees.
Anderson, J. L.: An ensemble adjustment Kalman filter for data assimilation, Mon. Weather Rev., 129, 2884–2903, 2001.
Anderson, J. L.: A local least squares framework for ensemble filtering, Mon. Weather Rev., 131, 634–642, 2003.
Anderson, J. L.: An adaptive covariance inflation error correction algorithm for ensemble filters, Tellus A, 59, 210–224, 2007.
Anderson, J.: Spatially and temporally varying adaptive covariance inflation for ensemble filters, Tellus A, 61, 72–83, 2009.
Anderson, J. L., Hoar, T., Raeder, K., Liu, H., Collins, N., Torn, R., and Arellano, A.: The Data Assimilation Research Testbed: A Community Facility, B. Am. Meteorol. Soc., 90, 1283–1296, https://doi.org/10.1175/2009BAMS2618.1, 2009.
Apituley, A., Pedergnana, M., Sneep, M., Pepijn Veefkind, J., Loyola, D., Landgraf, J., and Borsdorff, T.: Sentinel-5 precursor/TROPOMI Level 2 Product User Manual Carbon Monoxide, SRON-S5P-LEV2-MA-002, 1.0.0, SRON Netherlands Institute for Space Research, Utrecht, the Netherlands, https://sentinels.copernicus.eu/web/sentinel/technical-guides/sentinel-5p/products-algorithms (last access: 26 March 2024), 2018.
Arellano Jr., A. F., Raeder, K., Anderson, J. L., Hess, P. G., Emmons, L. K., Edwards, D. P., Pfister, G. G., Campos, T. L., and Sachse, G. W.: Evaluating model performance of an ensemble-based chemical data assimilation system during INTEX-B field mission, Atmos. Chem. Phys., 7, 5695–5710, https://doi.org/10.5194/acp-7-5695-2007, 2007.
Barré, J., Gaubert, B., Arellano, A. F. J., Worden, H. M., Edwards, D. P., Deeter, M., Anderson, J. L., Raeder, K. D., Collins, N. S., Tilmes, S., Francis, G., Clerbaux, C., Emmons, L., Pfister, G., Coheur, P.-F., and Hurtmans, D.: Assessing the impacts of assimilating IASI and MOPITT CO retrievals using CESM-CAM-chem and DART, J. Geophys. Res.-Atmos., 120, 10501–10529, https://doi.org/10.1002/2015JD023467, 2015.
Borsdorff, T., Campos, T., Kille, N., Zarzana, K. J., Volkamer, R., and Landgraf, J.: Vertical information of CO from TROPOMI total column measurements in context of the CAMS-IFS data assimilation scheme, Atmos. Meas. Tech., 16, 3027–3038, https://doi.org/10.5194/amt-16-3027-2023, 2023.
Boulanger, D., Thouret, V., and Petzold, A.: IAGOS Data Portal, AERIS [data set], https://doi.org/10.25326/20, 2019.
Buschmann, M., Petri, C., Palm, M., Warneke, T., and Notholt, J.: TCCON data from Ny-Ålesund, Svalbard (NO), Release GGG2020.R0 (Version R0), CaltechDATA [data set], https://doi.org/10.14291/tccon.ggg2020.nyalesund01.R0, 2022.
Campos, T.: Picarro G2401-m WS-CRDS CO2, CH4, CO and H2O in situ mixing ratio observations – ICARTT format, Version 1.2, UCAR/NCAR – Earth Observing Laboratory [data set], https://doi.org/10.26023/NNYM-Z18J-PX0Q, 2019 (data available at: http://data.eol.ucar.edu/master_lists/generated/we-can/, last access: 29 March 2024).
Candille, G., Côté, C., Houtekamer, P. L., and Pellerin, G.: Verification of an ensemble prediction system against observations, Mon. Weather Rev., 135, 2688–2699, 2007.
Chance, K., Liu, X., Miller, C. C., González Abad, G., Huang, G., Nowlan, C., Souri, A., Suleiman, R., Sun, K., Wang, H., Zhu, L., Zoogman, P., Al-Saadi, J., Antuña-Marrero, J. C., Carr, J., Chatfield, R., Chin, M., Cohen, R., Edwards, D., Fishman, J., Flittner, D., Geddes, J., Grutter, M., Herman, J. R., Jacob, D. J., Janz, S., Joiner, J., Kim, J., Krotkov, N. A., Lefer, B., Martin, R. V., Mayol-Bracero, O. L., Naeger, A., Newchurch, M., Pfister, G. G., Pickering, K., Pierce, R. B., Rivera Cárdenas, C., Saiz-Lopez, A., Simpson, W., Spinei, E., Spurr, R. J. D., Szykman, J. J., Torres, O., and Wang, J.: TEMPO Green Paper: Chemistry, Physics, and Meteorology Experiments with the Tropospheric Emissions: Monitoring of Pollution Instrument, in: Sensors, Systems, and Next-Generation Satellites XXIII, Strasbourg, France, 9–12 September 2019, edited by: Neeck, S. P., Kimura, T., and Martimort, P., Proc. SPIE, 11151, 10, https://doi.org/10.1117/12.2534883, 2019.
Computational and Information Systems Laboratory: Cheyenne: HPE/SGI ICE XA System (NCAR Community Computing), National Center for Atmospheric Research, Boulder, CO, https://doi.org/10.5065/D6RX99HX, 2019.
Copernicus Sentinel-5P (processed by ESA): TROPOMI Level 2 Carbon Monoxide total column products, Version 02, European Space Agency [data set], https://doi.org/10.5270/S5P-bj3nry0, 2021.
Cuesta, J., Eremenko, M., Liu, X., Dufour, G., Cai, Z., Höpfner, M., von Clarmann, T., Sellitto, P., Foret, G., Gaubert, B., Beekmann, M., Orphal, J., Chance, K., Spurr, R., and Flaud, J.-M.: Satellite observation of lowermost tropospheric ozone by multispectral synergism of IASI thermal infrared and GOME-2 ultraviolet measurements over Europe, Atmos. Chem. Phys., 13, 9675–9693, https://doi.org/10.5194/acp-13-9675-2013, 2013.
Danabasoglu, G., Lamarque, J. F., Bacmeister, J., Bailey, D. A., DuVivier, A. K., Edwards, J., Emmons, L. K., Fasullo, J., Garcia, R., Gettelman, A., and Hannay, C.: The community earth system model version 2 (CESM2), J. Adv. Model. Earth Syst., 12, e2019MS001916, https://doi.org/10.1029/2019MS001916, 2020.
Deeter, M. N., Emmons, L. K., Francis, G. L., Edwards, D. P., Gille, J. C., Warner, J. X., Khattatov, B., Ziskin, D., Lamarque, J.-F., Ho, S.-P., Yudin, V., Attie, J.-L., Packman, D., Chen, J., Mao, D., and Drummond, J. R.: Operational carbon monoxide retrieval algorithm and selected results for the MOPITT instrument, J. Geophys. Res., 108, 4399, https://doi.org/10.1029/2002JD003186, 2003.
Deeter, M. N., Worden, H. M., Gille, J. C., Edwards, D. P., Mao, D., and Drummond, J. R.: MOPITT multispectral CO retrievals: Origins and effects of geophysical radiance errors, J. Geophys. Res., 116, D15303, https://doi.org/10.1029/2011JD015703, 2011.
Deeter, M. N., Martínez-Alonso, S., Edwards, D. P., Emmons, L. K., Gille, J. C., Worden, H. M., Pittman, J. V., Daube, B. C., and Wofsy, S. C.: Validation of MOPITT Version 5 thermalinfrared, near-infrared, and multispectral carbon monoxide profile retrievals for 2000–2011, J. Geophys. Res., 118, 6710–6725, https://doi.org/10.1002/jgrd.50272, 2013.
Deeter, M., Francis, G., Gille, J., Mao, D., Martínez-Alonso, S., Worden, H., Ziskin, D., Drummond, J., Commane, R., Diskin, G., and McKain, K.: The MOPITT Version 9 CO product: sampling enhancements and validation, Atmos. Meas. Tech., 15, 2325–2344, https://doi.org/10.5194/amt-15-2325-2022, 2022.
El Gharamti, M.: Enhanced Adaptive Inflation Algorithm for Ensemble Filters, Mon. Weather Rev., 146, 623–640, https://doi.org/10.1175/MWR-D-17-0187.1, 2018.
Emmons, L. K., Schwantes, R. H., Orlando, J. J., Tyndall, G., Kinnison, D., Lamarque, J.-F., Marsh, D., Mills, M. J., Tilmes, S., Bardeen, C., Buchholtz, R. R., Conley, A., Gettelman, A., Garcia, R., Simpson, I., Blake, D. R., Meinardi, S., and Petron, G.: The chemistry mechanism in the Community Earth System Model version 2 (CESM2), J. Adv. Model. Earth Syst., 12, e2019MS001882, https://doi.org/10.1029/2019MS001882, 2020.
Flynn, L., Long, C., Wu, X., Evans, R., Beck, C. T., Petropavlovskikh, I., McConville, G., Yu, W., Zhang, Z., Niu, J., Beach, E., Hao, Y., Pan, C., Sen, B., Novicki, M., Zhou, S., and Seftor, C.: Performance of the Ozone Mapping and Profiler Suite (OMPS) products, J. Geophys. Res.-Atmos., 119, 6181–6195, https://doi.org/10.1002/2013JD020467, 2014.
Fu, D., Bowman, K. W., Worden, H. M., Natraj, V., Worden, J. R., Yu, S., Veefkind, P., Aben, I., Landgraf, J., Strow, L., and Han, Y.: High-resolution tropospheric carbon monoxide profiles retrieved from CrIS and TROPOMI, Atmos. Meas. Tech., 9, 2567–2579, https://doi.org/10.5194/amt-9-2567-2016, 2016.
Fu, D., Kulawik, S. S., Miyazaki, K., Bowman, K. W., Worden, J. R., Eldering, A., Livesey, N. J., Teixeira, J., Irion, F. W., Herman, R. L., Osterman, G. B., Liu, X., Levelt, P. F., Thompson, A. M., and Luo, M.: Retrievals of tropospheric ozone profiles from the synergism of AIRS and OMI: methodology and validation, Atmos. Meas. Tech., 11, 5587–5605, https://doi.org/10.5194/amt-11-5587-2018, 2018.
García, O. E., Schneider, M., Herkommer, B., Gross, J., Hase, F., Blumenstock, T., and Sepúlveda, E.: TCCON data from Izana (ES), Release GGG2020.R1 (Version R1), CaltechDATA [data set], https://doi.org/10.14291/tccon.ggg2020.izana01.R1, 2022.
Gaspari, G. and Cohn, S. E.: Construction of correlation functions in two and three dimensions. Q/ J. Roy. Meteor. Soc., 125, 723–757, https://doi.org/10.1002/qj.49712555417, 1999.
Gaubert, B., Coman, A., Foret, G., Meleux, F., Ung, A., Rouil, L., Ionescu, A., Candau, Y., and Beekmann, M.: Regional scale ozone data assimilation using an ensemble Kalman filter and the CHIMERE chemical transport model, Geosci. Model Dev., 7, 283–302, https://doi.org/10.5194/gmd-7-283-2014, 2014.
Gaubert, B., Arellano, A. F., Barreì, J., Worden, H. M., Emmons, L. K., Tilmes, S., Buchholz, R. R., Vitt, F., Raeder, K., Collins, N., Anderson, J. L., Wiedinmyer, C., Martiìnez-Alonso, S., Edwards, D. P., Andreae, M. O., Hannigan, J. W., Petri, C., Strong, K., and Jones, N.: Toward a chemical reanalysis in a coupled chemistry-climate model: An evaluation of MOPITT CO assimilation and its impact on tropo- spheric composition, J. Geophys. Res.-Atmos., 121, 7310–7343, https://doi.org/10.1002/2016JD024863, 2016.
Gaubert, B., Worden, H. M., Arellano, A. F. J., Emmons, L. K., Tilmes, S., Barreì, J., Martinez Alonso, S., Vitt, F., Anderson, J. L., Alkemade, F., Houweling, S., and Edwards, D. P.: Chemical feedback from decreasing carbon monoxide emissions, Geophys. Res. Lett., 44, 9985–9995, https://doi.org/10.1002/2017GL074987, 2017.
Gaubert, B., Emmons, L. K., Raeder, K., Tilmes, S., Miyazaki, K., Arellano Jr., A. F., Elguindi, N., Granier, C., Tang, W., Barré, J., Worden, H. M., Buchholz, R. R., Edwards, D. P., Franke, P., Anderson, J. L., Saunois, M., Schroeder, J., Woo, J.-H., Simpson, I. J., Blake, D. R., Meinardi, S., Wennberg, P. O., Crounse, J., Teng, A., Kim, M., Dickerson, R. R., He, H., Ren, X., Pusede, S. E., and Diskin, G. S.: Correcting model biases of CO in East Asia: impact on oxidant distributions during KORUS-AQ, Atmos. Chem. Phys., 20, 14617–14647, https://doi.org/10.5194/acp-20-14617-2020, 2020.
Gaubert, B., Edwards, D. P., Anderson, J. L., Arellano, A. F., Barré, J., Buchholz, R. R., Darras, S., Emmons, L. K., Fillmore, D., Granier, C., Hannigan, J. W., Ortega, I., Raeder, K., Soulié, A., Tang, W., Worden, H. M., and Ziskin, D.: Global Scale Inversions from MOPITT CO and MODIS AOD, Remote Sens., 15, 4813, https://doi.org/10.3390/rs15194813, 2023.
Hase, F., Herkommer, B., Groß, J., Blumenstock, T., Kiel, M. ä., and Dohe, S.: TCCON data from Karlsruhe (DE), Release GGG2020.R0 (Version R0), CaltechDATA [data set], https://doi.org/10.14291/tccon.ggg2020.karlsruhe01.R0, 2022.
Hedelius, J. K., He, T.-L., Jones, D. B. A., Baier, B. C., Buchholz, R. R., De Mazière, M., Deutscher, N. M., Dubey, M. K., Feist, D. G., Griffith, D. W. T., Hase, F., Iraci, L. T., Jeseck, P., Kiel, M., Kivi, R., Liu, C., Morino, I., Notholt, J., Oh, Y.-S., Ohyama, H., Pollard, D. F., Rettinger, M., Roche, S., Roehl, C. M., Schneider, M., Shiomi, K., Strong, K., Sussmann, R., Sweeney, C., Té, Y., Uchino, O., Velazco, V. A., Wang, W., Warneke, T., Wennberg, P. O., Worden, H. M., and Wunch, D.: Evaluation of MOPITT Version 7 joint TIR–NIR XCO retrievals with TCCON, Atmos. Meas. Tech., 12, 5547–5572, https://doi.org/10.5194/amt-12-5547-2019, 2019.
Inness, A., Ades, M., Agustí-Panareda, A., Barré, J., Benedictow, A., Blechschmidt, A.-M., Dominguez, J. J., Engelen, R., Eskes, H., Flemming, J., Huijnen, V., Jones, L., Kipling, Z., Massart, S., Parrington, M., Peuch, V.-H., Razinger, M., Remy, S., Schulz, M., and Suttie, M.: The CAMS reanalysis of atmospheric composition, Atmos. Chem. Phys., 19, 3515–3556, https://doi.org/10.5194/acp-19-3515-2019, 2019.
Inness, A., Aben, I., Ades, M., Borsdorff, T., Flemming, J., Jones, L., Landgraf, J., Langerock, B., Nedelec, P., Parrington, M., and Ribas, R.: Assimilation of S5P/TROPOMI carbon monoxide data with the global CAMS near-real-time system, Atmos. Chem. Phys., 22, 14355–14376, https://doi.org/10.5194/acp-22-14355-2022, 2022.
Iraci, L. T., Podolske, J. R., Roehl, C., Wennberg, P. O., Blavier, J.-F., Allen, N., Wunch, D., and Osterman, G. B.: TCCON data from Edwards (US), Release GGG2020.R0 (Version R0), CaltechDATA [data set], https://doi.org/10.14291/tccon.ggg2020.edwards01.R0, 2022.
Jiang, Z., Worden, J. R., Worden, H., Deeter, M., Jones, D. B. A., Arellano, A. F., and Henze, D. K.: A 15-year record of CO emissions constrained by MOPITT CO observations, Atmos. Chem. Phys., 17, 4565–4583, https://doi.org/10.5194/acp-17-4565-2017, 2017.
Kim, J., Jeong, U., Ahn, M.-H., Kim, J. H., Park, R. J., Lee, H., Song, C. H., Choi, Y.-S., Lee, K.-H., Yoo, J.-M., Jeong, M.-J., Park, S. K., Lee, K.-M., Song, C.-K., Kim, S.-W., Kim, Y. J., Kim, S.-W., Kim, M., Go, S., Liu, X., Chance, K., Chan Miller, C., Al-Saadi, J., Veihelmann, B., Bhartia, P. K., Torres, O., Abad, G. G., Haffner, D. P., Ko, D. H., Lee, S. H., Woo, J.-H., Chong, H., Park, S. S., Nicks, D., Choi, W. J., Moon, K.-J., Cho, A., Yoon, J., Kim, S.-k., Hong, H., Lee, K., Lee, H., Lee, S., Choi, M., Veefkind, P., Levelt, P. F., Edwards, D. P., Kang, M., Eo, M., Bak, J., Baek, K., Kwon, H.-A., Yang, J., Park, J., Han, K. M., Kim, B.-R., Shin, H.-W., Choi, H., Lee, E., Chong, J., Cha, Y., Koo, J.-H., Irie, H., Hayashida, S., Kasai, Y., Kanaya, Y., Liu, C., Lin, J., Crawford, J. H., Carmichael, G. R., Newchurch, M. J., Lefer, B. L., Herman, J. R., Swap, R. J., Lau, A. K. H., Kurosu, T. P., Jaross, G., Ahlers, B., Dobber, M., McElroy, C. T., and Choi, Y.: New Era of Air Quality Monitoring from Space: Geostationary Environment Monitoring Spectrometer (GEMS), B. Am. Meteorol. Soc., 101, E1–E22, https://doi.org/10.1175/bams-d-18-0013.1, 2020.
Kivi, R., Heikkinen, P., and Kyrö, E.: TCCON data from Sodankylä (FI), Release GGG2020.R0 (Version R0), CaltechDATA [data set], https://doi.org/10.14291/tccon.ggg2020.sodankyla01.R0, 2022.
Kopacz, M., Breeze, V., Kondragunta, S., Frost, G., Anenberg, S., Bruhwiler, L., Davis, S., da Silva, A., de Gouw, J., Duren, R., and Flynn, L.: Global Atmospheric Composition Needs from Future Ultraviolet–Visible–Near-Infrared (UV–Vis–NIR) NOAA Satellite Instruments, B. Am. Meteorol. Soc., 104, E623–E630, https://doi.org/10.1175/BAMS-D-22-0266.1, 2023.
Landgraf, J., Borsdorff, T., Langerock, B., and Keppens, A.: S5P Mission Performance Centre Carbon Monoxide [L2 CO] Readme, S5P-MPC-SRON-PRF-CO, 1.5, SRON Netherlands Institute for Space Research, Utrecht, the Netherlands, https://sentinels.copernicus.eu/web/sentinel/technical-guides/sentinel-5p/products-algorithms (last access: 29 March 2024), 2020.
Laughner, J. L., Toon, G. C., Mendonca, J., Petri, C., Roche, S., Wunch, D., Blavier, J.-F., Griffith, D. W. T., Heikkinen, P., Keeling, R. F., Kiel, M., Kivi, R., Roehl, C. M., Stephens, B. B., Baier, B. C., Chen, H., Choi, Y., Deutscher, N. M., DiGangi, J. P., Gross, J., Herkommer, B., Jeseck, P., Laemmel, T., Lan, X., McGee, E., McKain, K., Miller, J., Morino, I., Notholt, J., Ohyama, H., Pollard, D. F., Rettinger, M., Riris, H., Rousogenous, C., Sha, M. K., Shiomi, K., Strong, K., Sussmann, R., Té, Y., Velazco, V. A., Wofsy, S. C., Zhou, M., and Wennberg, P. O.: The Total Carbon Column Observing Network's GGG2020 Data Version, Earth Syst. Sci. Data Discuss. [preprint], https://doi.org/10.5194/essd-2023-331, in review, 2023.
Levelt, P. F., Joiner, J., Tamminen, J., Veefkind, J. P., Bhartia, P. K., Stein Zweers, D. C., Duncan, B. N., Streets, D. G., Eskes, H., van der A, R., McLinden, C., Fioletov, V., Carn, S., de Laat, J., DeLand, M., Marchenko, S., McPeters, R., Ziemke, J., Fu, D., Liu, X., Pickering, K., Apituley, A., González Abad, G., Arola, A., Boersma, F., Chan Miller, C., Chance, K., de Graaf, M., Hakkarainen, J., Hassinen, S., Ialongo, I., Kleipool, Q., Krotkov, N., Li, C., Lamsal, L., Newman, P., Nowlan, C., Suleiman, R., Tilstra, L. G., Torres, O., Wang, H., and Wargan, K.: The Ozone Monitoring Instrument: overview of 14 years in space, Atmos. Chem. Phys., 18, 5699–5745, https://doi.org/10.5194/acp-18-5699-2018, 2018.
Liu, C., Wang, W., Sun, Y., and Shan, C.: TCCON data from Hefei (PRC), Release GGG2020.R0 (Version R0), CaltechDATA [data set], https://doi.org/10.14291/tccon.ggg2020.hefei01.R0, 2022.
Liu, X., Ma, P.-L., Wang, H., Tilmes, S., Singh, B., Easter, R. C., Ghan, S. J., and Rasch, P. J.: Description and evaluation of a new four-mode version of the Modal Aerosol Module (MAM4) within version 5.3 of the Community Atmosphere Model, Geosci. Model Dev., 9, 505–522, https://doi.org/10.5194/gmd-9-505-2016, 2016.
Martínez-Alonso, S., Deeter, M., Worden, H., Borsdorff, T., Aben, I., Commane, R., Daube, B., Francis, G., George, M., Landgraf, J., Mao, D., McKain, K., and Wofsy, S.: 1.5 years of TROPOMI CO measurements: comparisons to MOPITT and ATom, Atmos. Meas. Tech., 13, 4841–4864, https://doi.org/10.5194/amt-13-4841-2020, 2020.
Ménard, R. and Chang, L. P.: Assimilation of stratospheric chemical tracer observations using a Kalman filter. Part II: χ2-validated results and analysis of variance and correlation dynamics, Mon. Weather Rev., 128, 2672–2686, https://doi.org/10.1175/1520-0493(2000)128<2672:AOSCTO>2.0.CO;2, 2000.
Mettig, N., Weber, M., Rozanov, A., Burrows, J. P., Veefkind, P., Thompson, A. M., Stauffer, R. M., Leblanc, T., Ancellet, G., Newchurch, M. J., Kuang, S., Kivi, R., Tully, M. B., Van Malderen, R., Piters, A., Kois, B., Stübi, R., and Skrivankova, P.: Combined UV and IR ozone profile retrieval from TROPOMI and CrIS measurements, Atmos. Meas. Tech., 15, 2955–2978, https://doi.org/10.5194/amt-15-2955-2022, 2022.
Morino, I., Ohyama, H., Hori, A., and Ikegami, H.: TCCON data from Rikubetsu (JP), Release GGG2020.R0 (Version R0), CaltechDATA [data set], https://doi.org/10.14291/tccon.ggg2020.rikubetsu01.R0, 2022a.
Morino, I., Ohyama, H., Hori, A., and Ikegami, H.: TCCON data from Tsukuba (JP), 125HR, Release GGG2020.R0 (Version R0), CaltechDATA [data set], https://doi.org/10.14291/tccon.ggg2020.tsukuba02.R0, 2022b.
Morino, I., Velazco, V. A., Hori, A., Uchino, O., and Griffith, D. W. T.: TCCON data from Burgos, Ilocos Norte (PH), Release GGG2020.R0 (Version R0), CaltechDATA [data set], https://doi.org/10.14291/tccon.ggg2020.burgos01.R0, 2022c.
NASA/LARC/SD/ASDC: MOPITT Derived CO (Thermal Infrared Radiances) V009, NASA Langley Atmospheric Science Data Center DAAC [data set], https://doi.org/10.5067/TERRA/MOPITT/MOP02T.009, last access: 2024a.
NASA/LARC/SD/ASDC: MOPITT Derived CO (Near and Thermal Infrared Radiances) V009, NASA Langley Atmospheric Science Data Center DAAC [data set], https://doi.org/10.5067/TERRA/MOPITT/MOP02J.009, last access: 2024b.
NASA/LARC/SD/ASDC: MOPITT Derived CO (Near Infrared Radiances) V009, NASA Langley Atmospheric Science Data Center DAAC [data set], https://doi.org/10.5067/TERRA/MOPITT/MOP02N.009, last access: 2024c.
Natraj, V., Liu, X., Kulawik, S., Chance, K., Chatfield, R., Edwards, D. P., Eldering, A., Francis, G., Kurosu, T., Pickering, K., Spurr, R., and Worden, H. M.: Multi-spectral sensitivity studies for the retrieval of tropospheric and lowermost tropospheric ozone from simulated clear-sky geo-cape measurements Atmos. Environ., 45, 7151-7165, https://doi.org/10.1016/j.atmosenv.2011.09.014, 2011.
Notholt, J., Petri, C., Warneke, T., and Buschmann, M.: TCCON data from Bremen (DE), Release GGG2020.R0 (Version R0), CaltechDATA [Data set], https://doi.org/10.14291/tccon.ggg2020.bremen01.R0, 2022.
Petron, G., Crotwell, A. M., Crotwell, M. J., Dlugokencky, E., Madronich, M., Moglia, E., Neff, D., Thoning, K., Wolter, S., and Mund, J. W.: Atmospheric Carbon Monoxide Dry Air Mole Fractions from the NOAA GML Carbon Cycle Cooperative Global Air Sampling Network, 1988–2021, Version: 2022-07-28, https://doi.org/10.15138/33bv-s284, 2022 (data available at: https://gml.noaa.gov/aftp/data/trace_gases/co/flask/surface/, last access: 26 March 2024).
Pfister, G., Eastham, S., Arellano, A. F., Aumont, B., Barsanti, K., Barth, M., Conley, A., Davis, N., Emmons, L., Fast, J., Fiore, A., Gaubert, B., Goldhaber, S., Granier, C., Grell, G., Guevara, M., Henze, D., Hodzic, A., Liu, X., Marsh, D., Orlando, J., Plane, J., Polvani, L., Rosenlof, K., Steiner, A., Jacob, D., and Brasseur, G.: The Multi-Scale Infrastructure for Chemistry and Aerosols (MUSICA), B. Am. Meteorol. Soc., 101, E1743–E1760, https://doi.org/10.1175/bams-d-19-0331.1, 2020.
Petzold, A., Thouret, V., Gerbig, C., Zahn, A., Brenninkmeijer, C. A. M., Gallagher, M., Hermann, M., Pontaud, M., Ziereis, H., Boulanger, D., Marshall, J., Nédélec, P., Smit, H. G. J., Friess, U., Flaud, J.-M., Wahner, A., Cammas, J.-P., and Volz-Thomas, A.: Global-scale atmosphere monitoring by in-service aircraft – current achievements and future prospects of the European Research Infrastructure IAGOS, Tellus B, 67, 28452, https://doi.org/10.3402/tellusb.v67.28452, 2015.
Pollard, D. F., Robinson, J., and Shiona, H.: TCCON data from Lauder (NZ), Release GGG2020.R0 (Version R0), CaltechDATA [data set], https://doi.org/10.14291/tccon.ggg2020.lauder03.R0, 2022.
Raeder, K., Anderson, J. L., Collins, N., Hoar, T. J. Kay,, J. E., Lauritzen, P. H., and Pincus, R.: DART/CAM: An Ensemble Data Assimilation for CESM Atmospheric Models, J. Climate, 25, 6304–6317, https://doi.org/10.1175/JCLI-D-11-00395.1, 2012.
Raeder, K., Hoar, T. J., El-Gharamti, M., Johnson, B. K., Collins, N., Anderson, J. L., and Steward, J.: Coady, M. A new CAM6 + DART reanalysis with surface forcing from CAM6 to other CESM models, Sci. Rep., 11, 16384, https://doi.org/10.1038/s41598-021-92927-0, 2021.
Rodgers, C. D.: Inverse Methods for Atmospheric Sounding: Theory and Practice, World Scientific, River Edge, USA, ISBN 978-9810227401, 2000.
Schneider, M., Ertl, B., Tu, Q., Diekmann, C. J., Khosrawi, F., Röhling, A. N., Hase, F., Dubravica, D., García, O. E., Sepúlveda, E., Borsdorff, T., Landgraf, J., Lorente, A., Butz, A., Chen, H., Kivi, R., Laemmel, T., Ramonet, M., Crevoisier, C., Pernin, J., Steinbacher, M., Meinhardt, F., Strong, K., Wunch, D., Warneke, T., Roehl, C., Wennberg, P. O., Morino, I., Iraci, L. T., Shiomi, K., Deutscher, N. M., Griffith, D. W. T., Velazco, V. A., and Pollard, D. F.: Synergetic use of IASI profile and TROPOMI total-column level 2 methane retrieval products, Atmos. Meas. Tech., 15, 4339–4371, https://doi.org/10.5194/amt-15-4339-2022, 2022.
Sekiya, T., Miyazaki, K., Ogochi, K., Sudo, K., Takigawa, M., Eskes, H., and Boersma, K. F.: Impacts of horizontal resolution on global data assimilation of satellite measurements for tropospheric chemistry analysis, J. Adv. Model. Earth Syst., 13, e2020MS002180, https://doi.org/10.1029/2020MS002180, 2021.
Shiomi, K., Kawakami, S., Ohyama, H., Arai, K., Okumura, H., Ikegami, H., and Usami, M.: TCCON data from Saga (JP), Release GGG2020.R0 (Version R0), CaltechDATA [data set], https://doi.org/10.14291/tccon.ggg2020.saga01.R0, 2022.
Soulie, A., Granier, C., Darras, S., Zilbermann, N., Doumbia, T., Guevara, M., Jalkanen, J.-P., Keita, S., Liousse, C., Crippa, M., Guizzardi, D., Hoesly, R., and Smith, S.: Global Anthropogenic Emissions (CAMS-GLOB-ANT) for the Copernicus Atmosphere Monitoring Service Simulations of Air Quality Forecasts and Reanalyses, Earth Syst. Sci. Data Discuss. [preprint], https://doi.org/10.5194/essd-2023-306, in review, 2023.
Tang, W.: Code produced by the study “Advantages of assimilating multi-spectral satellite retrievals of atmospheric composition: A demonstration using MOPITT carbon monoxide products”, Zenodo [code], https://doi.org/10.5281/zenodo.10882836, 2024.
Tang, W., Emmons, L. K., Buchholz, R. R., Wiedinmyer, C., Schwantes, R. H., He, C., Kumar, R., Pfister, G. G., Worden, H. M., Hornbrook, R. S., Apel, E. C., Tilmes, S., Gaubert, B., Martinez-Alonso, S., Lacey, F., Holmes, C. D., Diskin, G. S., Bourgeois, I., Peischl, J., Ryerson, T. B., Hair, J. W., Weinheimer, A. J., Montzka, D. D., Tyndall, G. S., and Campos, T. L.: Effects of Fire Diurnal Variation and Plume Rise on U.S. Air Quality During FIREX-AQ and WE-CAN Based on the Multi-Scale Infrastructure for Chemistry and Aerosols (MUSICAv0), J. Geophys. Res.-Atmos., 127, e2022JD036650, https://doi.org/10.1029/2022JD036650, 2022.
Tang, W., Pfister, G. G., Kumar, R., Barth, M., Edwards, D. P., Emmons, L. K., and Tilmes, S.: Capturing High-Resolution Air Pollution Features Using the Multi-Scale Infrastructure for Chemistry and Aerosols Version 0 (MUSICAv0) Global Modeling System, J. Geophys. Res.-Atmos., 128, e2022JD038345, https://doi.org/10.1029/2022JD038345, 2023.
Té, Y., Jeseck, P., and Janssen, C.: TCCON data from Paris (FR), Release GGG2020.R0 (Version R0), CaltechDATA [data set], https://doi.org/10.14291/tccon.ggg2020.paris01.R0, 2022.
Tilmes, S., Hodzic, A., Emmons, L. K., Mills, M. J., Gettelman, A., Kinnison, D. E., Park, M., Lamarque, J. -F., Vitt, F., Shrivastava, M., Campuzano Jost, P., Jimenez, J., and Liu, X.: Climate forcing and trends of organic aerosols in the Community Earth System Model (CESM2), J. Adv. Model. Earth Syst., 11, 4323–4351, https://doi.org/10.1029/2019MS001827, 2019.
Total Carbon Column Observing Network (TCCON) Team: 2020 TCCON Data Release (Version GGG2020), CaltechDATA [data set], https://doi.org/10.14291/TCCON.GGG2020, 2022.
Veefkind, J. P., Aben, I., McMullan, K., Förster, H., de Vries, J., Otter, G., Claas, J., Eskes, H. J., de Haan, J.F., Kleipool, Q., van Weele, M., Hasekamp, O., Hoogeveen, R., Landgraf, J., Snel, R., Tol, P., Ingmann, P., Voors, R., Kruizinga, B., Vink, R., Visser, H. and Levelt, P. F.: TROPOMI on the ESA Sentinel-5 Precursor: A GMES mission for global observations of the atmospheric composition for climate, air quality and ozone layer applications, Remote Sens. Environ., 120, 70–83, https://doi.org/10.1016/j.rse.2011.09.027, 2012.
Warneke, T., Petri, C., Notholt, J., and Buschmann, M.: TCCON data from Orléans (FR), Release GGG2020.R0 (Version R0), CaltechDATA [data set], https://doi.org/10.14291/tccon.ggg2020.orleans01.R0, 2022.
Wennberg, P. O., Roehl, C. M., Wunch, D., Toon, G. C., Blavier, J.-F., Washenfelder, R., Keppel-Aleks, G., and Allen, N. T.: TCCON data from Park Falls (US), Release GGG2020.R1 (Version R1), CaltechDATA [data set], https://doi.org/10.14291/tccon.ggg2020.parkfalls01.R1, 2022a.
Wennberg, P. O., Wunch, D., Roehl, C. M., Blavier, J.-F., Toon, G. C., and Allen, N. T.: TCCON data from Lamont (US), Release GGG2020.R0 (Version R0), CaltechDATA [data set], https://doi.org/10.14291/tccon.ggg2020.lamont01.R0, 2022b.
Wiedinmyer, C., Kimura, Y., McDonald-Buller, E. C., Emmons, L. K., Buchholz, R. R., Tang, W., Seto, K., Joseph, M. B., Barsanti, K. C., Carlton, A. G., and Yokelson, R.: The Fire Inventory from NCAR version 2.5: an updated global fire emissions model for climate and chemistry applications, Geosci. Model Dev., 16, 3873–3891, https://doi.org/10.5194/gmd-16-3873-2023, 2023.
Worden, H. M., Logan, J. A., Worden, J. R., Beer, R., Bowman, K., Clough, S. A., Eldering, A., Fisher, B. M., Gunson, M. R., Herman, R. L., Kulawik, S. S., Lampel, M. C., Luo, M., Megretskaia, I. A., Osterman, G. B., and Shephard, M. W.: Comparisons of Tropospheric Emission Spectrometer (TES) ozone profiles to ozonesondes: Methods and initial results, J. Geophys. Res., 112, D03309, https://doi.org/10.1029/2006JD007258, 2007.
Worden, H. M., Deeter, M. N., Edwards, D. P., Gille, J. C., Drummond, J. R., and Nédélec, P.: Observations of near-surface carbon monoxide from space using MOPITT multispectral retrievals, J. Geophys. Res., 115, D18314, https://doi.org/10.1029/2010JD014242, 2010.
Wunch, D., Toon, G. C., Blavier, J.-F. L., Washenfelder, R. A., Notholt, J., Connor, B. J., Griffith, D. W. T., Sherlock, V., and Wennberg, P. O.: The Total Carbon Column Observing Network, Philos. Trans. R. Soc. A Math. Phys. Eng. Sci., 369, 2087–2112, https://doi.org/10.1098/rsta.2010.0240, 2011.
Wunch, D., Mendonca, J., Colebatch, O., Allen, N. T., Blavier, J.-F., Kunz, K., Roche, S., Hedelius, J., Neufeld, G., Springett, S., Worthy, D., Kessler, R., and Strong, K.: TCCON data from East Trout Lake, SK (CA), Release GGG2020.R0 (Version R0), CaltechDATA [data set], https://doi.org/10.14291/tccon.ggg2020.easttroutlake01.R0, 2022.
Zeng, Z.-C., Lee, L., and Qi, C.: Diurnal carbon monoxide observed from a geostationary infrared hyperspectral sounder: first result from GIIRS on board FengYun-4B, Atmos. Meas. Tech., 16, 3059–3083, https://doi.org/10.5194/amt-16-3059-2023, 2023.
- Abstract
- Introduction
- Methods and data
- Datasets used for result evaluation
- Diagnostics of the assimilation results
- Comparisons with independent observations
- Emissions
- Discussion
- Conclusions
- Code availability
- Data availability
- Author contributions
- Competing interests
- Disclaimer
- Acknowledgements
- Financial support
- Review statement
- References
- Supplement