the Creative Commons Attribution 4.0 License.
the Creative Commons Attribution 4.0 License.
 | 17 Apr 2024
The High lAtitude sNowfall Detection and Estimation aLgorithm for ATMS (HANDEL-ATMS): a new algorithm for snowfall retrieval at high latitudes
Andrea Camplani
Daniele Casella
Paolo Sanò
Giulia Panegrossi
The High lAtitude sNow Detection and Estimation aLgorithm for ATMS (HANDEL-ATMS) is a new machine-learning (ML)-based snowfall retrieval algorithm for Advanced Technology Microwave Sounder (ATMS) observations that has been developed specifically to detect and quantify high-latitude snowfall events that often form in cold, dry environments and produce light snowfall rates. ATMS and the future European MetOp-SG Microwave Sounder offer good high-latitude coverage and sufficient microwave channel diversity (23 to 190 GHz), which allows surface radiometric properties to be dynamically characterized and the non-linear and sometimes subtle passive microwave response to falling snow to be detected. HANDEL-ATMS is based on a combined active–passive microwave observational dataset in the training phase, where each ATMS multichannel observation is associated with coincident (in time and space) CloudSat Cloud Profiling Radar (CPR) vertical snow profiles and surface snowfall rates. The main novelty of the approach is the radiometric characterization of the background surface (including snow-covered land and sea ice) at the time of the overpass to derive the multichannel surface emissivities and clear-sky contribution to be used in the snowfall retrieval process. The snowfall retrieval is based on four different artificial neural networks (ANNs) for snow water path (SWP) and surface snowfall rate (SSR) detection and estimate. HANDEL-ATMS shows very good detection capabilities, POD = 0.83, FAR = 0.18, and HSS = 0.68, for the SSR detection module. Estimation error statistics show a good agreement with CPR snowfall products for SSR mm h−1 (RMSE = 0.08 mm h−1, bias = 0.02 mm h−1). The analysis of the results for an independent CPR dataset and of selected snowfall events is evidence of the unique capability of HANDEL-ATMS to detect and estimate SWP and SSR also in the presence of extremely cold and dry environmental conditions typical of high latitudes.
- Article
(11183 KB) - Full-text XML
- BibTeX
- EndNote


Snowfall retrieval is one important topic in the atmospheric science field. On a global scale, snowfall represents only 5 % of the total global precipitation, but it is predominant above 60–70° N/S (Levizzani et al., 2011). In recent years, several studies have highlighted the strong influence of global warming on snowfall distribution and regimes, especially at high latitudes (J. Liu et al., 2012; Y. Liu et al., 2012; Bintanja and Selten, 2014; Vihma et al., 2016). However, global snowfall quantification is a challenging topic in weather science. Ground-based instruments such as rain gauges or snow gauges provide only punctual measurements which cannot fully capture the spatial variability in precipitation phenomena (Kidd et al., 2017); moreover, the variability in snowflake shape and density strongly influences particle fall speed and trajectory and therefore reduces the gauge-based measurement accuracy of falling snow, especially compared to rain measurements (Skofronick-Jackson et al., 2015). Weather radars can provide areal measurements of precipitation – the rate estimation is based on the conversion of the measured backscattered radiation to precipitating hydrometeor content – but such operations present some technical limitations (Kidd and Huffman, 2011). Finally, most of the regions where snowfall is predominant – such as Greenland, Siberia, Canada, and Antarctica – are uninhabited or otherwise sparsely populated areas where weather observation networks are very scarce or totally absent. Therefore, the development of satellite-based methods for snowfall retrieval is necessary for global monitoring of snowfall. Passive microwave (PMW) sensors on board polar-orbiting satellites can be exploited for snowfall detection purposes because the microwave (MW) signal is directly responsive to the spatial distribution and microphysics properties of precipitation-sized hydrometeors in the clouds; at the same time, the use of PMW sensors guarantees a high spatial coverage and high temporal resolution (Kidd and Huffman, 2011).
PMW snowfall detection and quantification are typically based on the ability to interpret the snowfall scattering signature in the high-frequency channels (> 90 GHz), which respond more effectively to ice microphysics and are less prone to surface effects than low-frequency channels, and to distinguish it from the clear-sky (surface and atmosphere) contribution (e.g., Panegrossi et al., 2017). However, several factors make the PMW snowfall signal ambiguous and the relationship between multichannel measurements and surface snowfall intensity highly non-linear, especially in extremely cold/dry environmental conditions (Panegrossi et al., 2022). The snowfall scattering signal is relatively weak and is highly dependent on the complex microphysical properties of snowflakes (Kim et al., 2008; Kulie et al., 2010; Kongoli et al., 2015), it is often masked by supercooled liquid water emission signal (Wang et al., 2013; Battaglia and Delanoë, 2013; Panegrossi et al., 2017; Rysman et al., 2018; Battaglia and Panegrossi, 2020; Panegrossi et al., 2022), and it can be contaminated by the extremely variable background surface emissivity (Liu and Seo, 2013; Takbiri et al., 2019; Rahimi et al., 2017), especially in cold and dry conditions typical of the high-latitude regions (Camplani et al., 2021). In this context, the availability of the latest-generation MW radiometers, such as the conically scanning radiometer GPM Microwave Imager (GMI) and the cross-track scanning radiometer Advanced Technology Microwave Sensor (ATMS), whose channels cover a wide range of frequencies, offers new possibilities for global snowfall monitoring. The multichannel PMW observations can be used for both a dynamic radiometric characterization of the background surface – using the low-frequency channels (< 90 GHz) – and for the detection and the estimation of snowfall using the high-frequency channels (> 90 GHz) (Panegrossi et al., 2022).
The PMW capability to characterize physically and radiometrically the background surface varies from sea to land, especially for the identification of cold/frozen surfaces. As far as the ocean is concerned, sea ice detection using PMW observations has been a well-documented topic in the remote-sensing science field since the 1970s. This is due to the strong contrast between sea ice (≈ 0.9) and open-water (≈ 0.5) emissivity values at the MW low-frequency range (∼ 19 GHz) (Comiso, 1983). Other studies highlighted the ability to discriminate between different types of ice using a set of low-frequency window channels because the differences between the emissivities of the different types of sea ice increase with increasing frequency: in particular, at higher frequencies (30–50 GHz) the contrast between the emissivity of “new” ice and “old” ice increases, with a decrease in the emissivity at higher frequencies for “older” sea ice (Comiso, 1983; Ulaby and Long, 2014). Moreover, it has been observed that the simultaneous presence of open water and sea ice causes a decrease in the low-frequency-channel emissivity: the observed emissivity can be regarded as a linear combination of the emissivity spectra of sea ice and open water (Ulaby and Long, 2014). As far as continental areas are concerned, the detection of snow-covered land surfaces using MW measurements becomes more difficult. In dry conditions, a snowpack acts as a volume scatterer: the scattering effect is dependent on the grain size and shape and on the depth of the snowpack (Clifford, 2010). However, the presence of liquid water can mask the scattering signature (Mätzler and Hüppi, 1989). At the same time, large areas of Greenland and Antarctica, while covered by dry snowpacks throughout the year, do not show a significant difference between the two ATMS low-frequency channels. Finally, some snow-free areas, such as rocky mountains and cold deserts, present a scattering signature very similar to that of the snowpack (see Grody and Basist, 1996). Therefore, the detection of snow-covered areas is very complex. A set of several tests, each of which identifies snowpacks characterized by different physical and radiometric characteristics, may be used.
This paper describes the development of a machine-learning-based algorithm for snowfall retrieval (the High lAtitude sNowfall Detection and Estimation aLgorithm for ATMS, HANDEL-ATMS), exploiting Advanced Technology Microwave Sounder (ATMS) radiometer multichannel measurements and using the CloudSat Cloud Profiling Radar (CPR) snowfall products as a reference. The algorithm has been developed by focusing on the typical conditions of high-latitude regions: low humidity, low temperature, presence of snowpack on land or sea ice over the ocean, and light snowfall intensity.
The main novelty of the approach is the exploitation of ATMS' wide range of channels (from 22 to 183 GHz) to obtain the dynamic radiometric characterization of the background surface at the time of the overpass. The derived surface emissivities are used to infer the clear-sky contribution to the measured brightness temperatures (TBs) in the high-frequency channels in the snowfall retrieval process. This approach is similar to the work of Zhao and Weng (2002) for Advanced Microwave Sounding Unit (AMSU) observations limited to non-scattering surfaces (i.e., ocean and vegetated land); however, the application to surfaces with a very complex and time-varying emissivity (such as snow cover and sea ice) required a far-away, more advanced algorithm taking advantage of machine learning techniques. Moreover, the algorithm also exploits an observational dataset composed of ATMS multichannel observations and coincident (time and space) CloudSat CPR vertical snow profiles and surface snowfall rates (hereafter the ATMS-CPR coincident dataset).
Several snowfall retrieval algorithms for cross-track scanning radiometers have evolved in the last 20 years starting from the Advanced Microwave Sounding Unit-B (AMSU-B) (Zhao and Weng, 2002; Kongoli et al., 2003; Skofronick-Jackson et al., 2004; Noh et al., 2009; Liu and Seo, 2013) and Microwave Humidity Sounder (MHS) (see Liu and Seo, 2013; Edel et al., 2020) and evolving to ATMS (Kongoli et al., 2015; Meng et al., 2017; Kongoli et al., 2018; You et al., 2022; Sanò et al., 2022). Some of them are based on radiative transfer simulations of observed snowfall events (Kongoli et al., 2003; Skofronick-Jackson et al., 2004; Kim et al., 2008) or on in situ data (Kongoli et al., 2015; Meng et al., 2017; Kongoli et al., 2018), while others are based on CPR observations (Edel et al., 2020; You et al., 2022; Sanò et al., 2022) or a combination of the above (Noh et al., 2009; Liu and Seo, 2013). In the last 5 years, there has been an increasing use of machine learning (ML) approaches trained with CPR-based coincidence datasets. These approaches have proven to be very effective for snowfall retrieval. On the one hand, ML techniques are suitable to handle the complex, non-linear PMW multichannel response to snowfall (Rysman et al., 2018; Edel et al., 2020; Sanò et al., 2022). On the other hand, the use of CPR-based datasets overcomes some of the limitations deriving from the use of cloud radiation model simulations, which are particularly challenging for snowfall events. However, some limitations of the radar product used as a reference and issues related to the spatial and temporal matching between the CPR and the PMW radiometer measurements introduce some uncertainty. Moreover, the 2-C-SNOW-PROFILE (2CSP) product is based on assumptions on snow microphysics, uses optimal estimation to retrieve snow parameters, uses a simplified radar reflectivity equation, and is affected by CloudSat CPR limitations as outlined in Battaglia and Panegrossi (2020).
As far as ATMS is concerned, the ML-based Snow retrievaL ALgorithm fOr gpM–Cross Track (SLALOM-CT) (Sanò et al., 2022) has been developed within the EUMETSAT Satellite Application Facility for Hydrology (H SAF) in preparation for the launch of the EPS-SG Microwave Sounder (MWS). Similarly to HANDEL-ATMS, it is trained on an ATMS-CPR coincidence dataset. SLALOM-CT is the evolution for cross-track scanning radiometers of the Snow retrievaL ALgorithm fOr GMI (SLALOM) (Rysman et al., 2018, 2019), which was the first ML algorithm for snowfall detection and retrieval for GMI trained and tested on GMI-CPR coincident observations made available in the NASA GPM-CloudSat coincidence dataset (Turk et al., 2021a). One of the novelties in the SLALOM (SLALOM-CT) approach is the use of the GMI (ATMS) low-frequency channels to better constrain the snowfall retrieval to the characteristics of the surface at the time of the overpass (Turk et al., 2021b). SLALOM-CT is based on a modular scheme; i.e., four separate modules are used for snowfall detection, supercooled water layer detection, snow water path (SWP) estimates, and surface snowfall rate (SSR) estimates. The predictor set is composed of ATMS TBs and some environmental variables: 2 m Temperature (T2 m), Total Precipitable Water (TPW), and principal components derived from temperature and humidity profiles.
However, none of the algorithms mentioned here were tailored specifically to the extreme conditions typical of high latitudes. The present work aims to develop an algorithm for snowfall detection and estimation by exploiting the large frequency range typical of the last-generation radiometers and to obtain a dynamic radiometric characterization of the background surface at the time of the satellite overpass in order to highlight the complex relationship between upwelling radiation and snowfall signature, which makes the detection very difficult in the typical conditions of high latitudes.
This article is organized as follows: Sect. 2 provides background information on ATMS and CPR, on the methodology used to build the coincidence dataset, and on the machine learning approaches used to develop the algorithm. In Sect. 3 the algorithm structure is described. In Sect. 4 the overall performance scores are reported and analyzed, a case study is analyzed, and a comparison with SLALOM-CT is reported. Section 5 is dedicated to the summary of the main results and to the conclusions.
2.1 Advanced Technology Microwave Sounder (ATMS)
ATMS is a total-power cross-track scanning radiometer within 52.7° off the nadir direction. It has a total of 22 channels, with the first 16 channels primarily used for temperature sounding from the surface to about 1 hPa (45 km) and the remaining channels used for water vapor sounding in the troposphere from the surface to about 200 hPa (10 km) and for cloud properties and precipitation retrieval. There are two receiving antennas: one serving channels 1–15 below 60 GHz and the other for channels above 60 GHz. The beamwidth changes with frequency and is 5.2° for channels 1–2 (23.8–31.4 GHz), 2.2° for channels 3–16 (50.3–57.29 and 88.2 GHz), and 1.1° for channels 17–22 (165.5–183.3 GHz). The corresponding nadir resolutions are 74.78, 31.64, and 15.82 km, respectively. The outmost field of view (FOV) sizes are 323.1 km × 141.8 km (cross-track × along-track), 136.7 km × 60.0 km, and 68.4 km × 30.0 km, respectively (Weng et al., 2012). ATMS is currently carried by three near-polar-orbiting satellites, Suomi National Polar-orbiting Partnership (SNPP), NOAA-20, and NOAA-21, providing global coverage including polar regions. Each satellite revisiting time is equal to 12 h at the Equator, but drops to 100 min over the polar regions, ensuring a very high temporal resolution for the research area of interest in this work. Moreover, the operational nature of the mission guarantees observations for the next decades. It is worth noting that the polarization of ATMS channels is not defined as vertical or horizontal but as “quasi-vertical” or “quasi-horizontal”. The “quasi” prefix is used to indicate that ATMS (and any other cross-track scanner) measures vertical or horizontal polarization only when looking at nadir and a mixture of V and H polarization for off-nadir scan angles.
2.2 Cloud Profiling Radar (CPR)
CPR is a 94 GHz nadir-looking radar on board CloudSat. CloudSat was launched on 28 April 2006; the W-band (94 GHz) Cloud Profiling Radar (CPR) operations began on 2 June 2006. CPR has been acquiring the first-ever continuous global time series of vertical cloud structures and vertical profiles of cloud liquid and ice water content with a 485 m vertical resolution and a 1.4 km antenna 3 dB footprint. The reference CloudSat snowfall product is the 2C-SNOW-PROFILE (2CSP) product (Version 5 is used in this work). It provides estimates of snowfall characteristics for each observed profile. In particular, it provides an estimate of the snow water path (SWP), i.e., the total snow water content integrated over the atmospheric column, and of the surface snowfall rate (SSR) (Stephens et al., 2008). The SWP is also estimated when there is no snowfall at the ground level; therefore, the presence of the SWP is not always linked to the SSR, especially in warmer near-surface conditions (Wood and L'Ecuyer, 2018). 2CSP has several limitations, such as the contamination of the signal in the lowest 1000–1500 m of the profile due to ground-clutter; the underestimation of the heavy snowfall due to attenuation of the radar signal in these conditions; the limited temporal sampling (although it is higher in the polar regions); and the day-only operation mode since 2011, which limits its use during the winter seasons (Milani and Wood, 2021; Panegrossi et al., 2022). However, 2CSP has been demonstrated to be more accurate than GPM Dual-frequency Precipitation Radar (DPR) snowfall products (Casella et al., 2017) and is in good agreement with estimates obtained by ground-based radars (e.g., Mroz et al., 2021), although it is affected by underestimation for medium-heavy snowfall events. Moreover, the polar orbit and the W-band high sensitivity make CPR suitable for snowfall monitoring at higher latitudes (as demonstrated in several studies, e.g., Kulie et al., 2016; Milani et al., 2018) typically characterized by light/moderate intensity (Behrangi et al., 2016). These features appear to be an advantage compared to the GPM-Core Observatory (GPM-CO), which provides observations only between 67° N and 67° S, and to the Ku- and Ka-band DPR, has low sensitivity, and is not suitable to effectively detect light snowfall events (Casella et al., 2017).
2.3 ATMS-CPR coincidence dataset
The present study is based on a coincidence dataset between CPR and ATMS observations between January 2014 and August 2016. The same dataset has been used for the development of SLALOM-CT (Sanò et al., 2022). Each coincidence comes from observations from CloudSat CPR and ATMS within a maximum 15 min time window. In the period considered within the dataset, only the SNPP satellite was in orbit, so the dataset is composed only of observations obtained from ATMS on board this satellite. Moreover, the elements in the dataset have been selected by removing all corrupted data and by applying an additional filter based on the minimum distance between the instantaneous field of view (IFOV) centers (22 km) of CPR and ATMS. The zonal distribution of the coincidences is due to the orbital geometry of CloudSat and SNPP, which are both sun-synchronous with a relatively small difference in the satellite height (i.e., about 689 and 833 km for CloudSat and SNPP, respectively). Therefore, the coincidence dataset is built from longer orbit fragments (often semi-orbits) and by a very large number of elements near the poles. There is an asymmetry in the CPR sampling between the Northern and the Southern hemispheres that can be observed in the dataset due to the CPR daytime-only mode operation since 2011, which influences mostly the acquisitions in the southern polar region (Milani and Wood, 2021).
The database has been built considering the horizontal resolution of the high-frequency channels of ATMS. The CPR snowfall product used as a reference is the 2CSP (V5) product. Some model-derived variables, specifically the Total Precipitable Water (TPW), the 2 m Temperature (T2 m), the Skin Temperature, the Freezing Level Height, and the temperature and humidity profiles, have been added to the dataset to be used as ancillary parameters. Both 2D and 3D environmental variables have been obtained from the European Centre for Medium-Range Weather Forecasts (ECMWF). In particular, they are obtained from the CPR ECMWF-AUX product where the set of ancillary ECMWF atmospheric state variable data is associated with each CloudSat CPR bin (the product is described by Partain, 2022). Moreover, a cloud cover fraction index, which indicates the fraction of CPR observations where cloud is observed in the total CPR observations within each ATMS pixel, is added to the dataset.
Information about the presence of supercooled water is added to the coincidence dataset to be used towards the correct interpretation of the snowfall signal in the presence of supercooled water layers. The supercooled water information has been extracted from the DARDAR product (DARDAR, 2023; Delanoë and Hogan, 2010). DARDAR, which stands for raDAR+liDAR, combines CPR radar and Cloud-Aerosol Lidar with Orthogonal Polarization (CALIOP) lidar observations, on board the Cloud-Aerosol Lidar and Infrared Pathfinder Satellite Observations (CALIPSO) satellite, and estimates both the cloud water phase and the ice water content and ice particle effective radius (Battaglia and Delanoë, 2013; Ceccaldi et al., 2013). In particular, the coincidence dataset includes an index indicating the presence of supercooled cloud liquid water within each ATMS pixel, calculated as the fraction of DARDAR observations where supercooled water within and on the top of the cloud is observed to the total DARDAR observations within each pixel.
The association of ATMS TBs and CPR products has been done by averaging the CPR snow products with a Gaussian function approximating the ATMS high-frequency antenna pattern (varying with the scan angle). It is worth noting, however, that the ATMS IFOV is undersampled by the narrow swath of the CPR (see Sanò et al., 2022 for details). Moreover, it is worth noting that CPR 2CSP limitations for snowfall detection and estimation (see Sect. 2.2) might affect the ATMS-based snowfall estimates.
In this work, the dataset has been filtered based on humidity (TPW < 10 mm), temperature (T2 m< 280 K), and elevation conditions (the working limits of the PMW Empirical Cold Surface Classification Algorithm (PESCA), see Camplani et al., 2021), leading to a good representation of the higher latitudes with 80 % of the dataset elements located above 60° N/S. The dataset is made of 2.14×10⁶ elements, including 1.07×10⁶ elements with falling snow (2CSP SWP > 0 kg m−2) and 9.99×10⁵ with snowfall at the surface (2CSP SSR > 0 mm h−1). The training and test phases have been conducted by randomly splitting the dataset, with one-third of the elements in the training and two-thirds of the elements in the test dataset.
2.4 Machine learning approaches
The algorithm is based on different machine learning (ML) techniques. Moreover, clustering techniques have been used to characterize the background surface from a radiometric point of view. In particular, an unsupervised clustering technique has been used to identify emissivity clusters with small internal variability, and a supervised clustering technique has been used to identify an emissivity spectrum based on other parameters.
2.4.1 Artificial neural networks
The HANDEL-ATMS snowfall detection and estimation modules have been developed using feedforward multilayer neural network architectures, i.e., a neural network architecture where the neurons are arranged in layers. This architecture, which is defined by the number of layers, the number of neurons for each layer, and the transfer function of each neuron, has to be designed beforehand. The weights of connection links and the bias values for each layer are estimated with a training process, based on the Levenberg–Marquardt algorithm (Sanò et al., 2015). The specific network architectures and the training and optimization procedure of the HANDEL-ATMS algorithm are described in detail in Sect. 3.2.
2.4.2 Self-organizing maps
The unsupervised clustering method used for the background surface classification is the self-organizing map (SOM) method (Fausett, 1994; Kohonen, 2012). The characteristic of this method is that classes that are close to each other from a topological point of view can be considered similar also from a physical and radiometric point of view (Munchak et al., 2020). SOMs have been used in previous studies for the classification of the background surface by creating clusters based on emissivity values (Prigent et al., 2001; Cordisco et al., 2006; Prigent et al., 2008; Munchak et al., 2020).
2.4.3 Linear discriminant analysis
Several supervised clustering methods have been tested in this study, such as the linear discriminant analysis (LDA), the quadratic discriminant analysis, the classification tree, and the nearest neighbor method. The final choice came down to linear discriminant analysis (see Hastie et al., 2009) because this method guarantees satisfactory accuracy in the results, with a difference between the performances of the training and the test phase which is not too significant and a computational effort which is not too high.
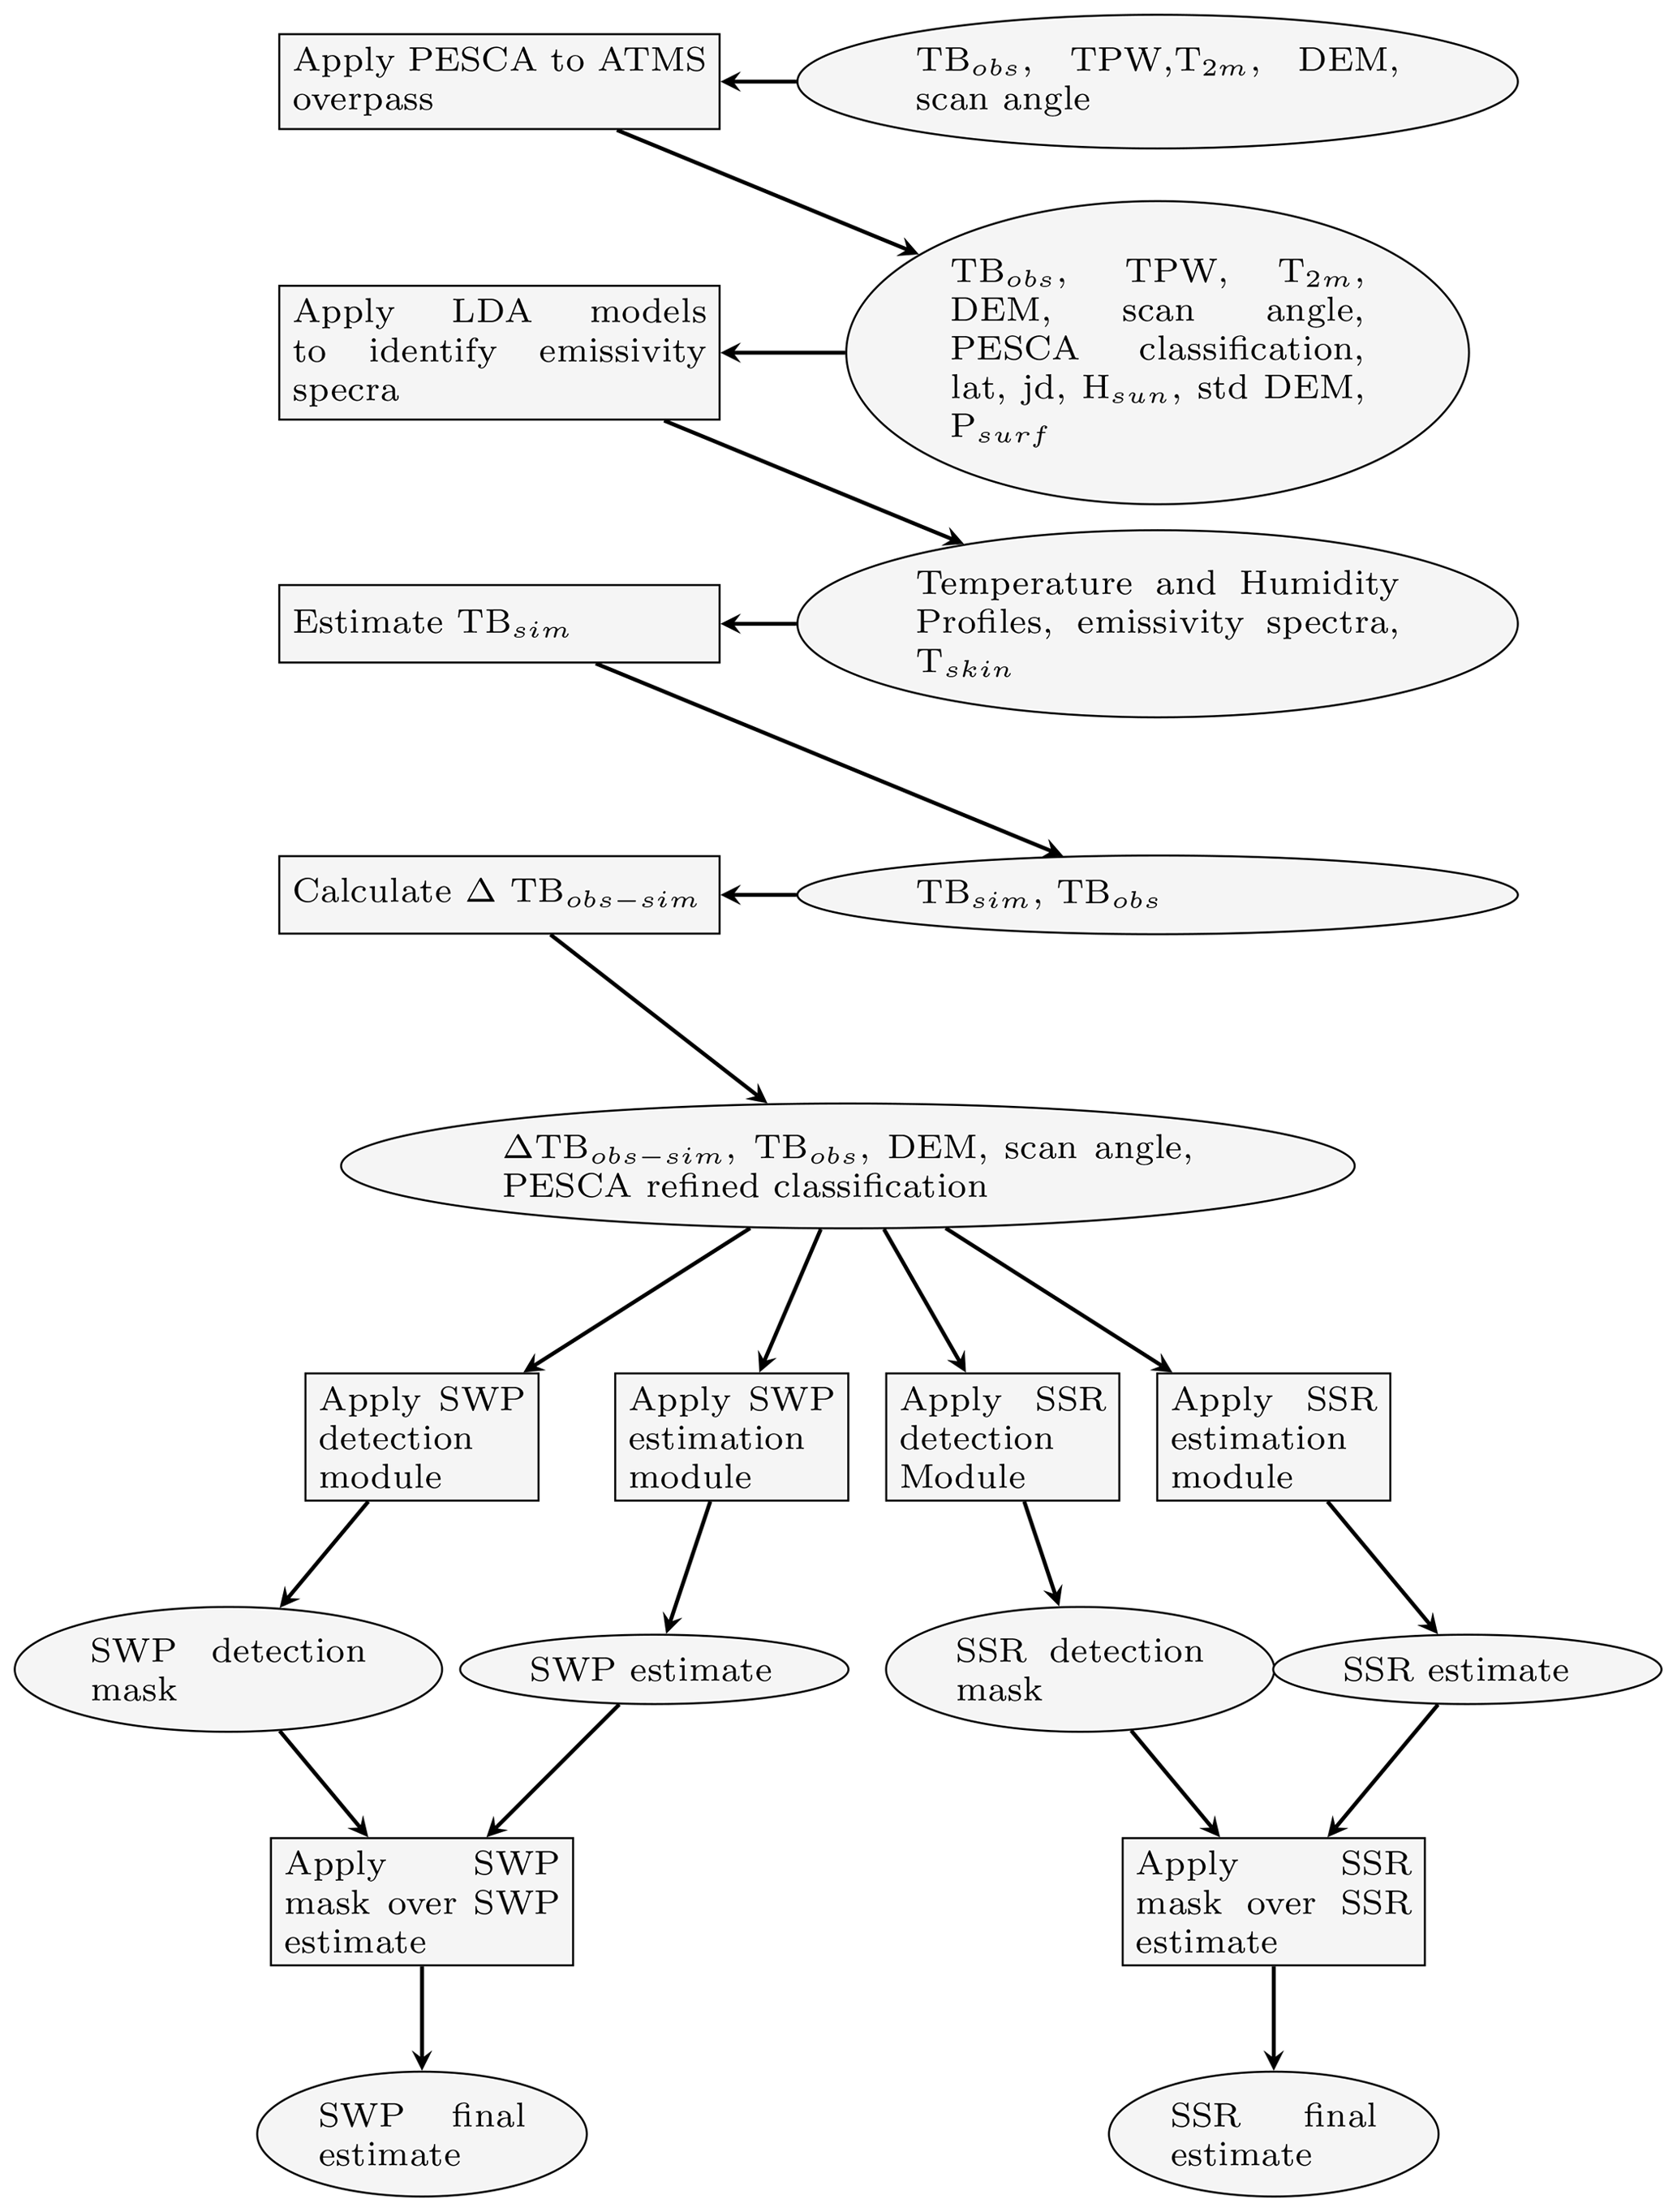
The configuration of HANDEL-ATMS is summarized in the flowchart in Fig. 1. The process begins with the classification of the background surface using the PMW Empirical Cold Surface Classification Algorithm (PESCA; see Camplani et al., 2021). Then, the surface emissivity spectra are derived through a refinement process based on LDA, and these are used to estimate clear-sky simulated TB (TBsim) using the ECMWF-AUX atmospheric temperature and water vapor profiles. Then, the differences between the clear-sky simulated TB and the ATMS observed TB (TBobs) are evaluated ( TBobs−TBsim). Four artificial neural networks (ANNs) are then applied to a predictor set consisting of ATMS TBobs, ΔTBobs−sim, a surface classification flag, and other ancillary parameters (elevation and ATMS viewing angle for the final version). Finally, the pixels classified with the presence of snowfall by the detection modules are used in the estimation modules, while for no-snowfall-flagged pixels the SWP value is set to 0 kg m−2 and the SSR value is set to 0 mm h−1. In the following sections, the main blocks of the algorithm are described in detail.
3.1 Surface classification and emissivity spectra estimation
3.1.1 PESCA design and performances
The dynamic classification and radiometric characterization of the background surface at the time of the satellite overpass is based on PESCA exploiting ATMS low-frequency channels (Camplani et al., 2021). The algorithm discriminates between frozen and unfrozen surfaces (sea ice and open water, snow-covered land and snow-free land) and identifies 10 surface classes (4 over ocean, 5 over land, 1 for coast). The algorithm has been tuned against the NOAA AutoSnow product (Romanov, 2019), which gives daily maps of sea ice and snow cover. For each ATMS observation, a flag reporting the AutoSnow class percentage (sea ice, open water, snow-covered land, snow-free land) has been calculated, and a threshold has been applied to discriminate between sea ice and open water pixels (sea ice AutoSnow class > 10 %) and between snow-covered and snow-free land pixels (snow-covered land AutoSnow class > 50 %). ATMS pixels have been classified into land, ocean, and coast pixels using a land–sea mask.
The land module discriminates between snow-free land and snow-covered land and identifies four different snow cover classes (Perennial, Winter Polar, Thin, and Deep Dry). It is based on a decision tree that makes use of a limited number of inputs: the ratio between TB23QV and TB31QV (ratio); the difference between TB23QV and TB88QV, or Scattering Index (SI); and 23 GHz pseudo-emissivity (pem23) (i.e., the ratio between the 23 GHz observed TB and the near-surface temperature value). The module has been described by Camplani et al. (2021).
As far as the ocean module is concerned, a simple relationship to distinguish between sea ice and open water observations has been identified. In Fig. 2 a Cartesian plane where the x axis represents 23 GHz observed TBs and the y axis represents the T2 m is shown. In the figure, each point represents a pseudo-emissivity value, and the color describes the mean AutoSnow sea ice percentage within each bin (see Fig. 2a). It is possible to observe that open water (0 % of sea ice, blue) and sea ice (100 % of sea ice, red) are characterized by very different pseudo-emissivities. There is a transition area between open water and sea ice pseudo-emissivity values for IFOVs where both open water and sea ice are present. The simple relationship for sea ice identification is reported in panel (a) as a green line where the condition for sea ice identification is defined by Eq. (1).
Downstream of the sea ice/open water identification, information about sea ice characteristics is obtained from the analysis of the two low-frequency pseudo-emissivity values (pem23 and pem31) (defined as the ratio between the observed TB and the near-surface temperature value), which can be considered a good approximation of sea-ice emissivity for low-frequency channels especially in cold and dry conditions. In Fig. 3a it is possible to observe that there are sea-ice-classified observations characterized by the contemporary presence of open water and sea ice above the bisector of the plane and in correspondence with low emissivity values. In Fig. 3b, where the color represents sea ice occurrences, the presence of one cluster is evident, in correspondence with high pseudo-emissivity, with two “tails” above and below the bisector. This behavior has been used to identify three different sea ice classes (New Sea Ice, Broken Sea Ice, and Multilayer Sea Ice) using a nearest neighbor method based on a set of reference points that define the areas of interest for each sea ice class. In Fig. 3c a classification representation is reported, where the markers represent the reference points. The labels of the classes have been chosen by analyzing their physical properties and by comparing the estimated emissivity spectra with those reported in previous studies (Hewison and English, 1999; Munchak et al., 2020).
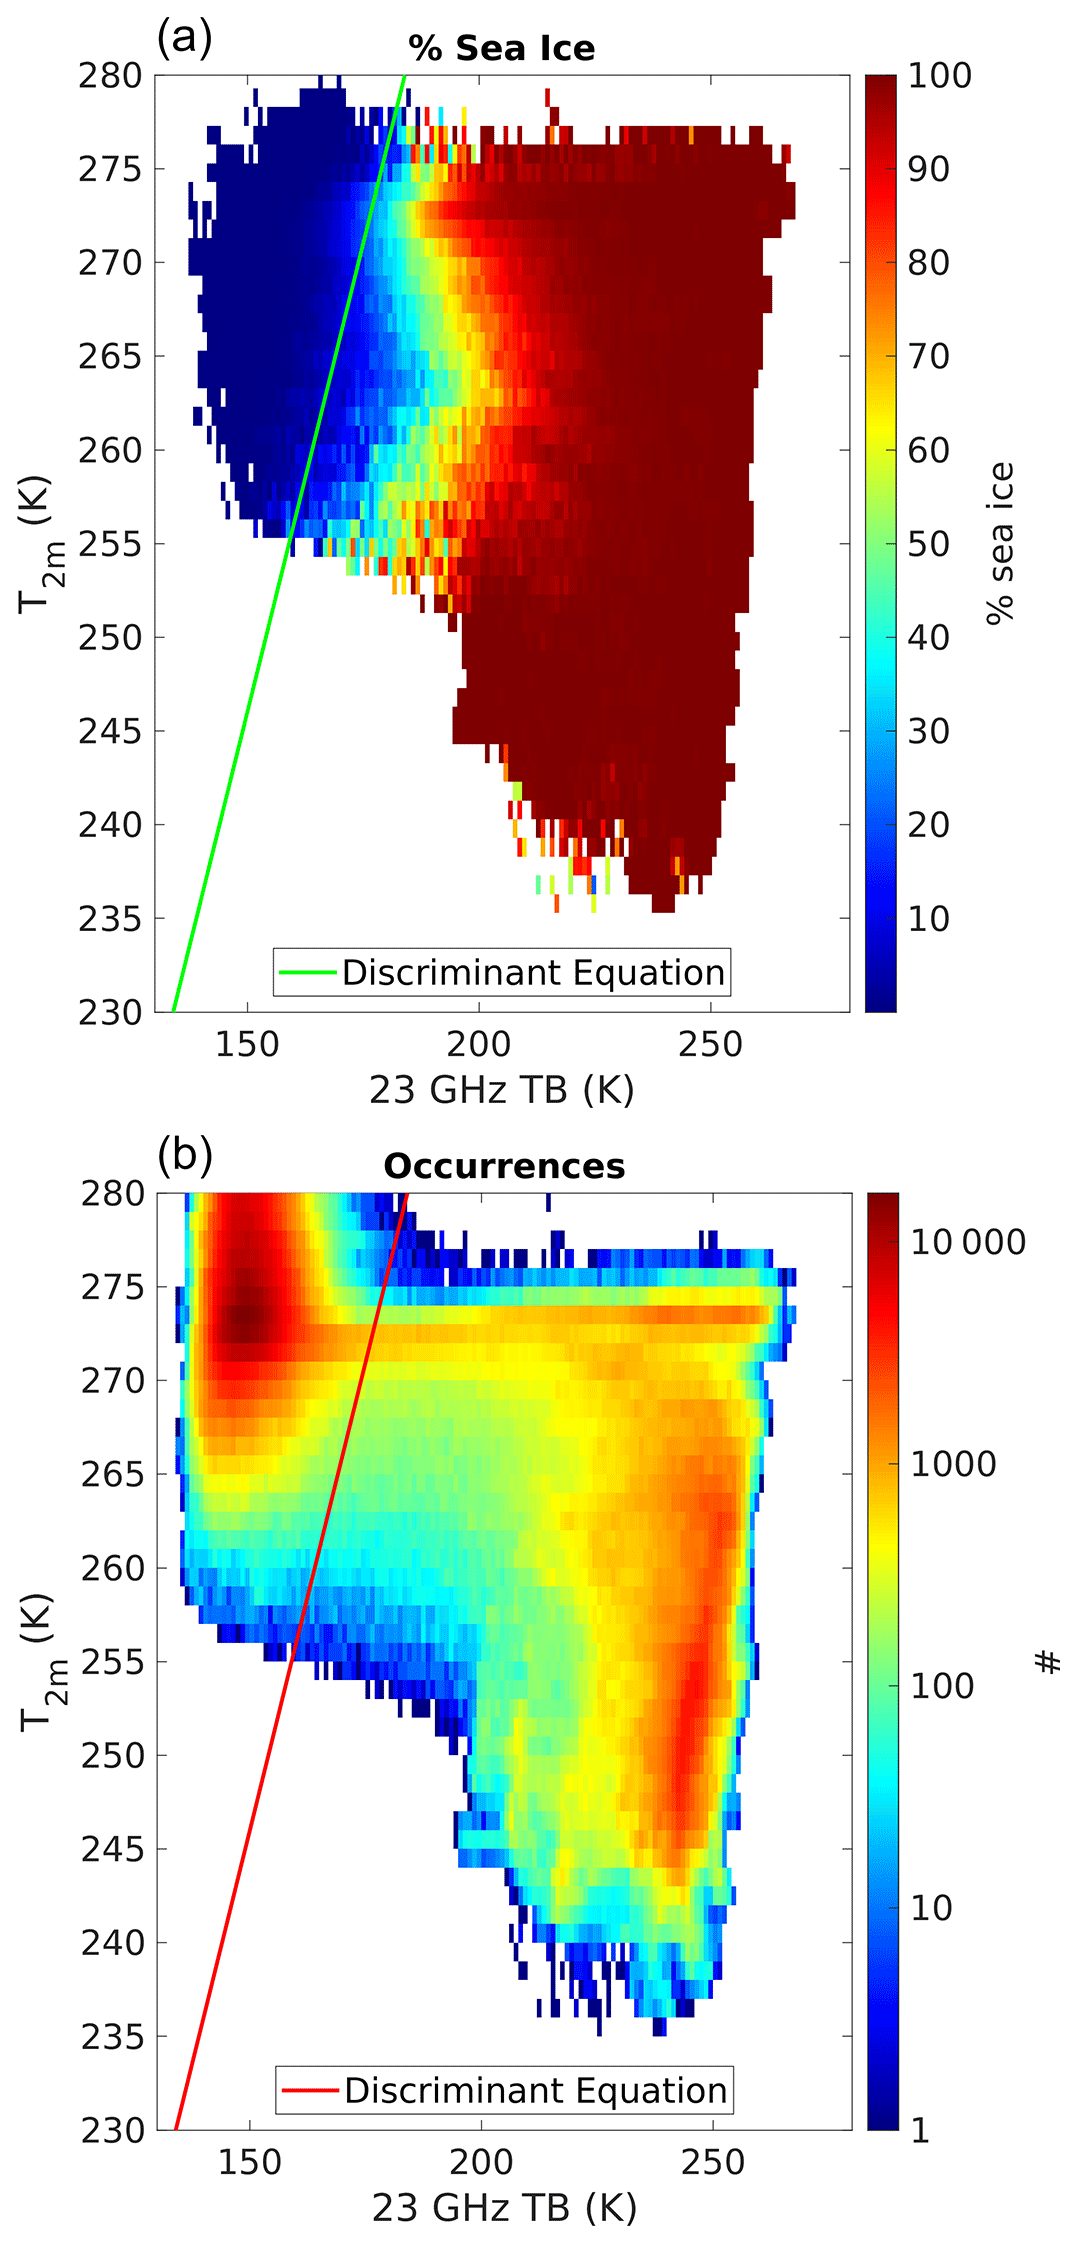
Figure 2Sea ice detection representation on a 23 GHz TB–T2 m plane. The color represents the mean AutoSnow sea ice percentage within each bin (a) and the observation occurrence (b). The green (a) and red (b) lines represent the discriminant equation (Eq. 1) between sea ice and ocean.
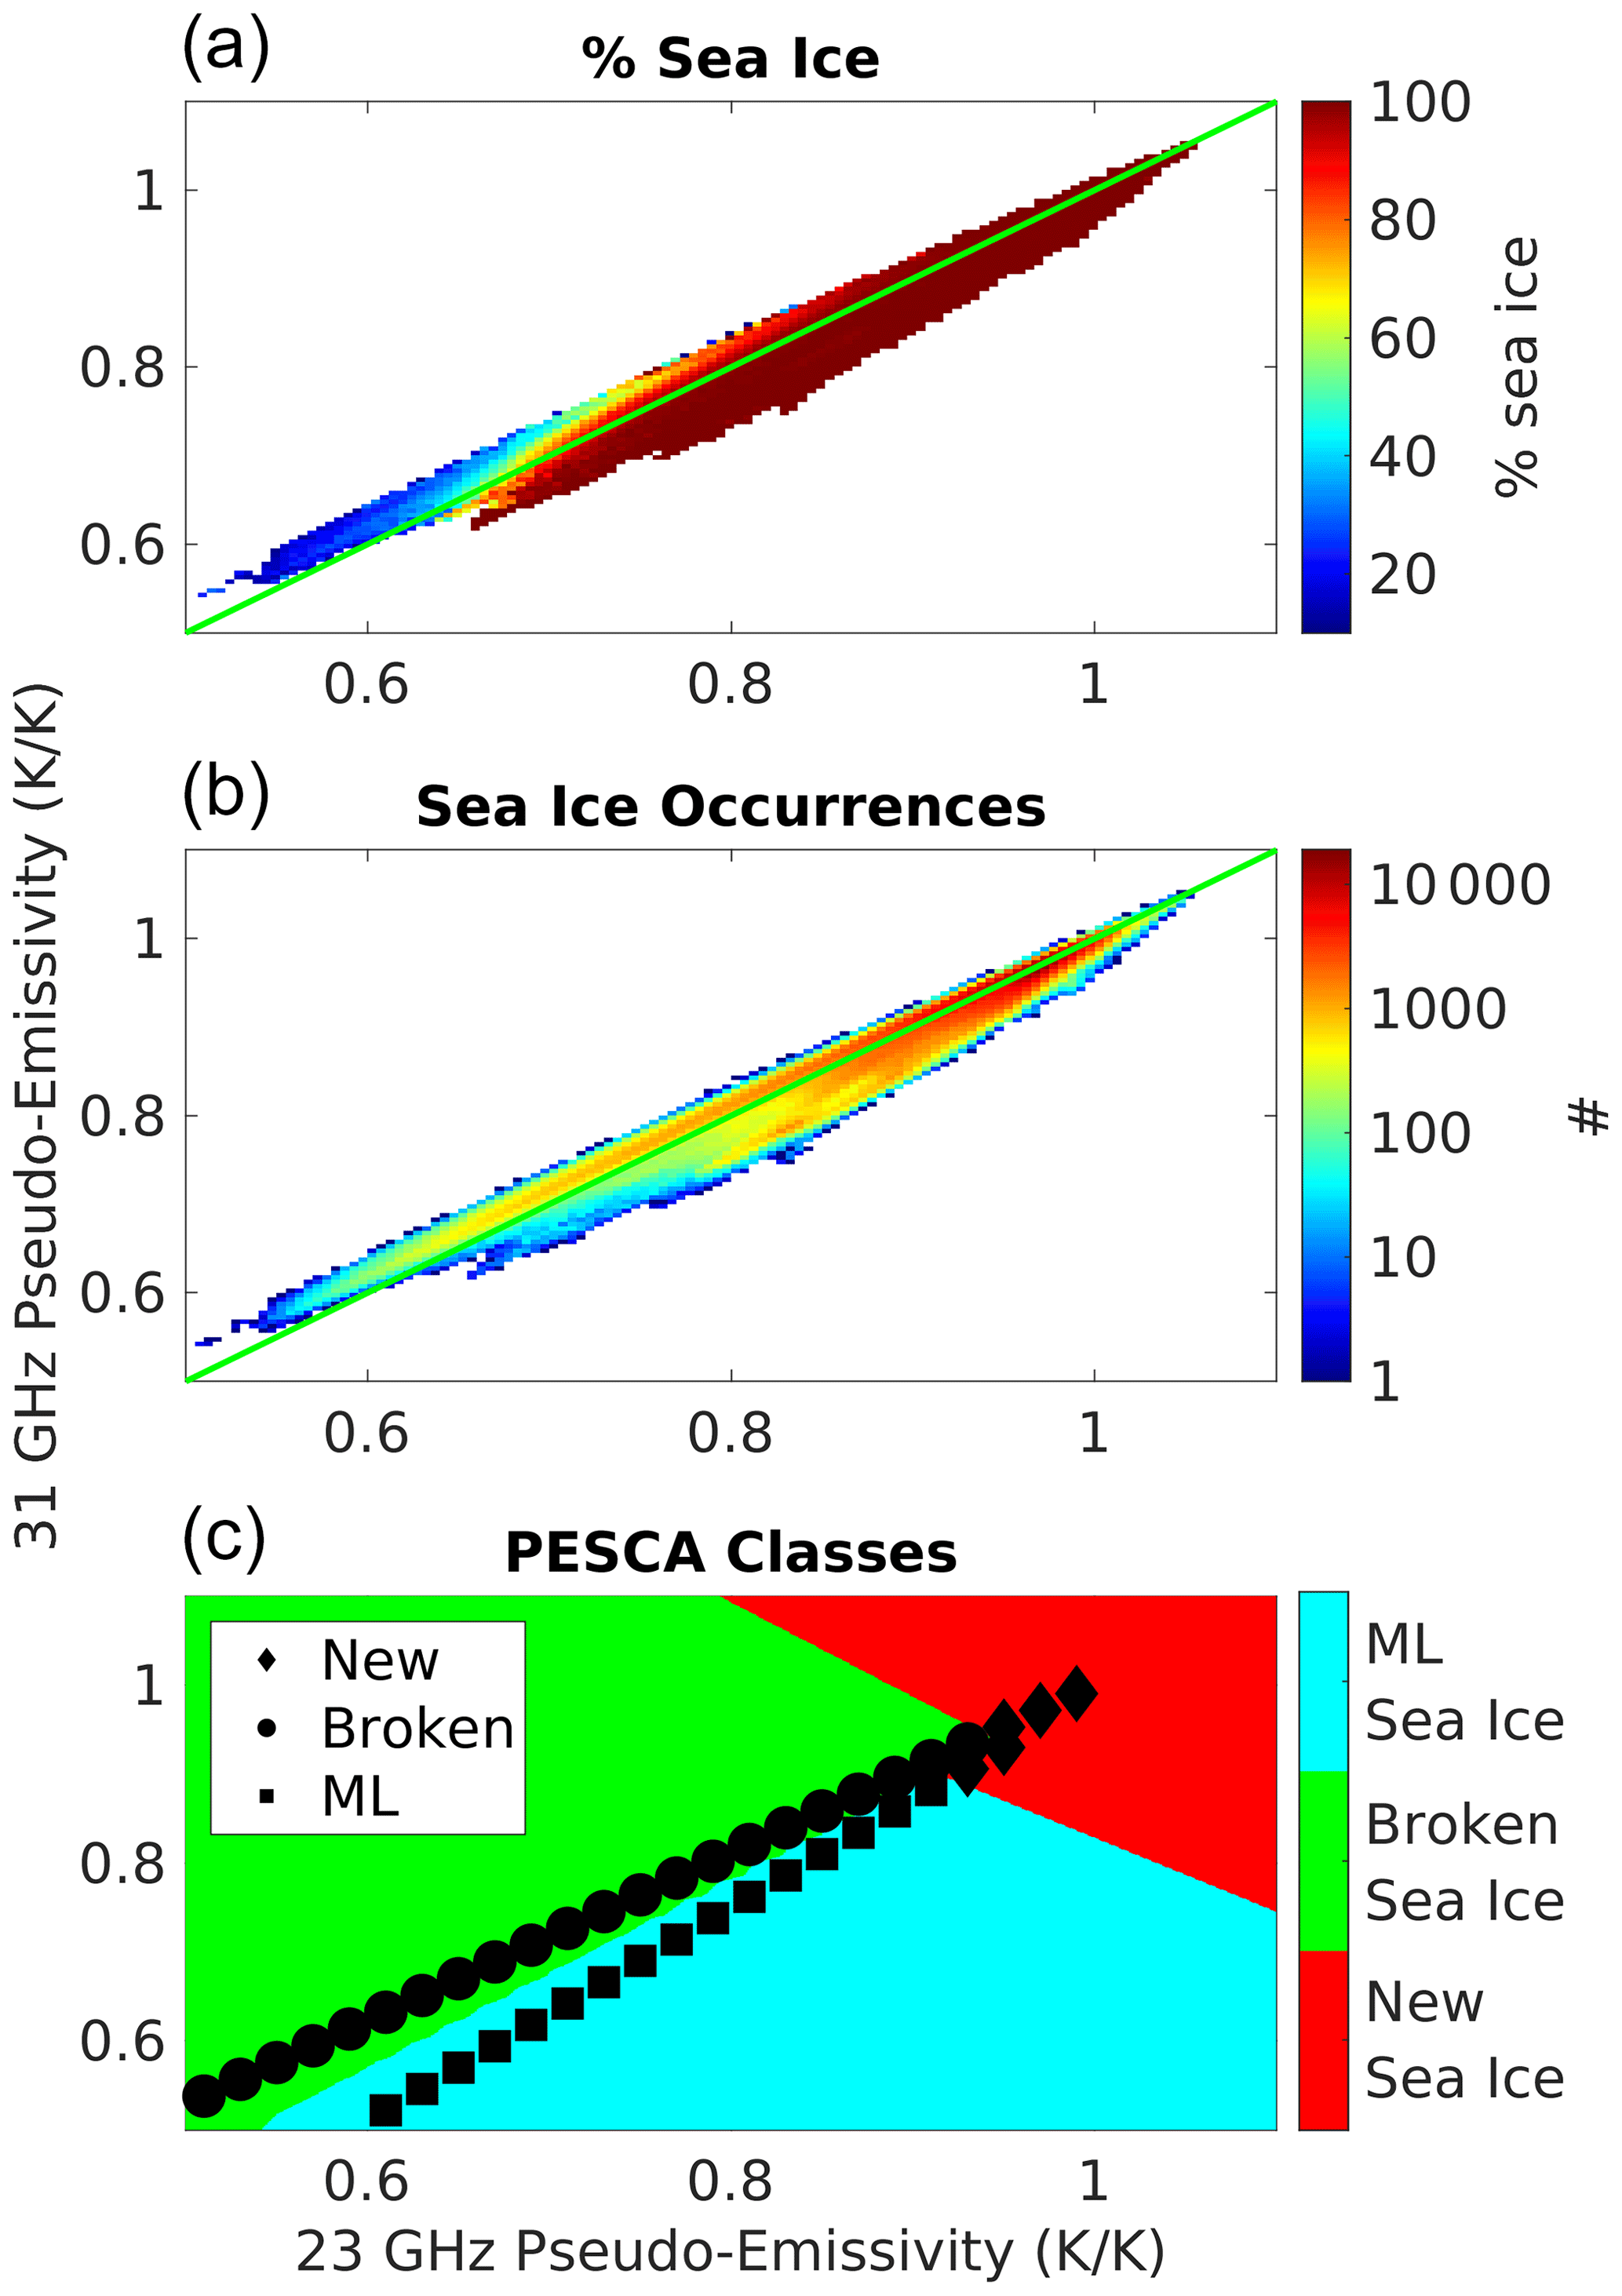
Figure 3Sea ice detection and classification: relationship between 31 GHz pseudo-emissivity (y axis) and 23 GHz pseudo-emissivity (x axis). The color represents the mean AutoSnow sea ice percentage within each bin (a), the observation occurrence (b), and the PESCA classification (Multilayer (ML), Broken, and New Sea Ice) with the nearest neighbor markers (c). The continuous green lines in panels (a) and (b) represent the bisector.
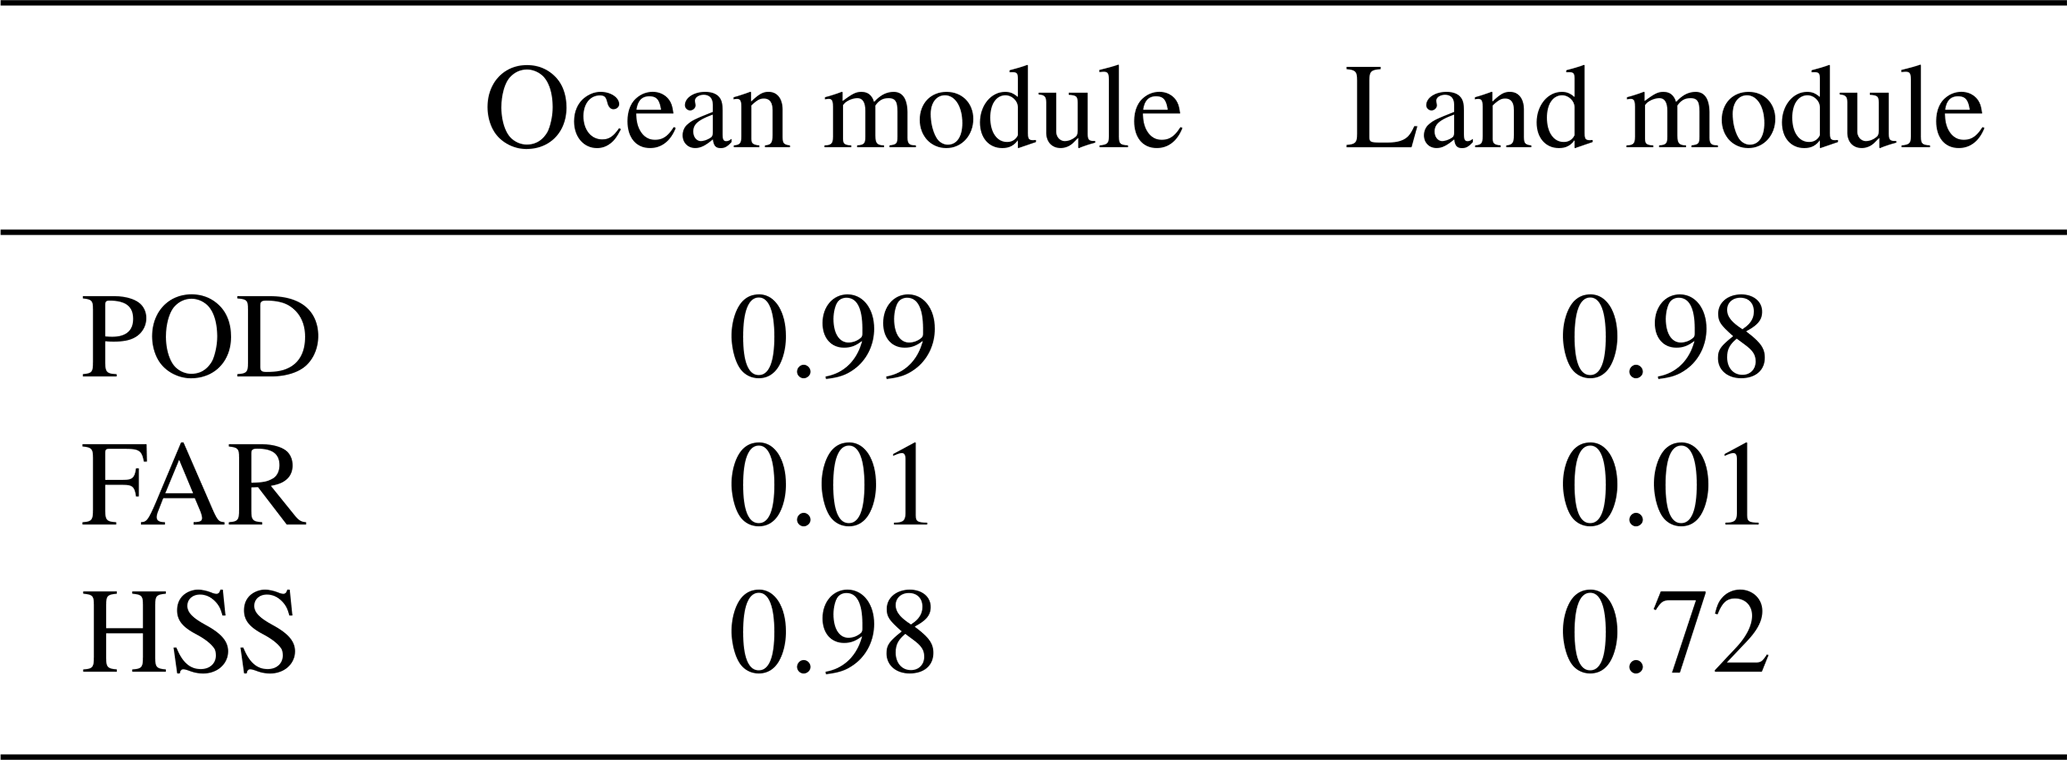
PESCA's upper working limits for T2 m and TPW have been established to 280 K and 10 mm, respectively (see Camplani et al., 2021, for details). Moreover, the land module does not work in the high-elevation areas outside the polar regions (surface elevation > 2500 m for latitude < 67° N/S) because ATMS' low spatial resolution does not allow depiction of the small-scale snow cover variability that characterizes the orographic regions. An analysis carried out using the ATMS-CPR coincidence dataset highlights that the presence of cloud cover does not influence the overall PESCA performances (not shown). Within these well-defined limits, PESCA manages to optimally discriminate between sea ice, open water, snow-free land, and snow-covered land. The statistical scores of PESCA identification of sea ice and snow cover (using AutoSnow as a reference truth) are summarized in Table 1. In particular, the probability of detection (POD), the false alarm ratio (FAR), and the Heidke skill score (HSS) are reported. POD, FAR, and HSS are defined by Eqs. (2), (3), and (4).
where h represents the hits, f represents the false alarms, m represents the misses, and cn represents the correct negatives. PESCA manages to optimally detect the presence of a frozen background (sea ice over the ocean, snow-covered land over the continental part) at the time of the satellite overpass. It is important to underline that the variability in the HSS compared to POD and FAR is due to the different number of correct negatives. An analysis of the physical characteristics of the PESCA classes has been conducted by considering the mean T2 m and the geographical and seasonal distribution associated with each class. For corresponding information on the land classes, please refer to Camplani et al. (2021). As far as sea ice is concerned, the New Sea Ice class, which is detected during the winter at high latitudes and for low temperatures, represents the sea ice that forms during the winter. The Broken Sea Ice class, which is predominant in the lower latitudes and whose occurrence increases during spring, represents the co-presence of sea ice and water. The Multilayer Sea Ice class, which is detected only at high latitudes, for very low temperatures, and constantly throughout the year, represents the ice pack typical of those regions and extremely cold conditions.
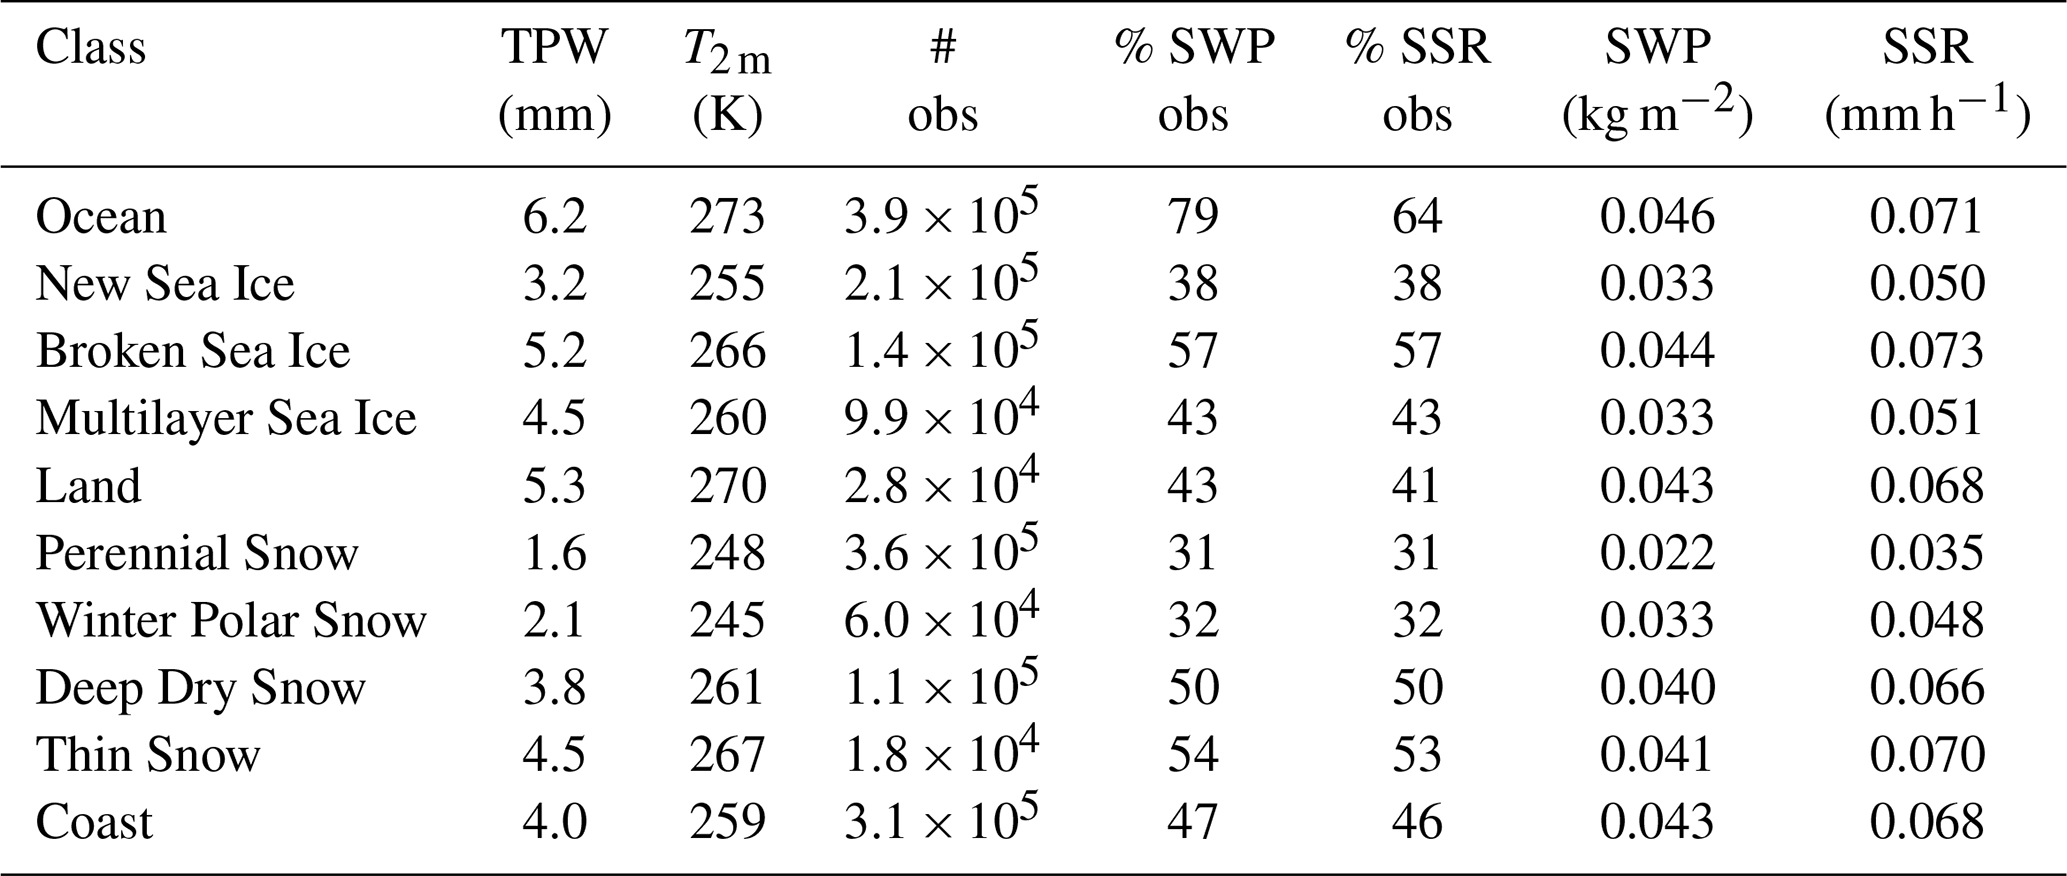
In Table 2 the number of PESCA class occurrences, the percentage of snowfall observations, and the most significant environmental characteristics in the ATMS-CPR coincident dataset are reported. It can be observed that the Land and Ocean classes are characterized by the warmest/moistest conditions and by the most intense snowfall events (on average), while the Perennial and Winter Polar Snow classes and the New and Multilayer Sea Ice classes are characterized by the coldest/driest environmental conditions and by the lightest snowfall events (on average). The Thin Snow and Broken Sea Ice classes show intermediate environmental conditions and snowfall intensity values. It is also interesting to highlight that a mismatch between the percentage of SWP and SSR observations is observed mostly over the Ocean class and less frequently over other classes (Land, Thin Snow, and Coast), where warmer and moister environmental conditions are found.
Table 2Environmental characteristics for each PESCA class (test dataset): the number of occurrences, the mean TPW and T2 m values, the percentage of SWP/SSR observations (over the total occurrences), and the mean SWP and SSR values are shown.
3.1.2 PESCA emissivity spectra estimation
The emissivity spectra of each class have been estimated by applying PESCA to the cloud-free (0 % CPR cloud mask fraction) ATMS observations in the ATMS-CPR dataset satisfying PESCA working limits. The ATMS clear-sky TBs measured for each PESCA surface class have been used as input to an inverse radiative transfer model (RTM) based on plane-parallel approximation (Ulaby and Long, 2014) and the Rosenkranz (1998) gas absorption model. The emissivity spectra have been estimated by calculating the mean and the standard deviation of the emissivity values for each class (excluding the values lower than the 10th percentile and higher than the 90th percentile). The emissivity spectra dependence on the ATMS viewing angle for polarized surfaces has been neglected because an analysis of such dependence in the ATMS-CPR coincidence dataset has shown that it is not significant (emissivity difference smaller than 0.05 for angles up to 52.7°). This is due to the fact that cross-track scanning radiometers measure a signal (off-nadir) that derives from a mixture between the two polarizations (e.g., quasi-vertical, QV, and quasi-horizontal, QH). As a consequence, although the emissivities of polarized surfaces, such as open water surfaces, are strongly influenced by the viewing angle, the emissivity variation is compensated by the effect of the mixture of the two polarizations (Felde and Pickle, 1995; Prigent et al., 2000; Mathew et al., 2008; Prigent et al., 2017).
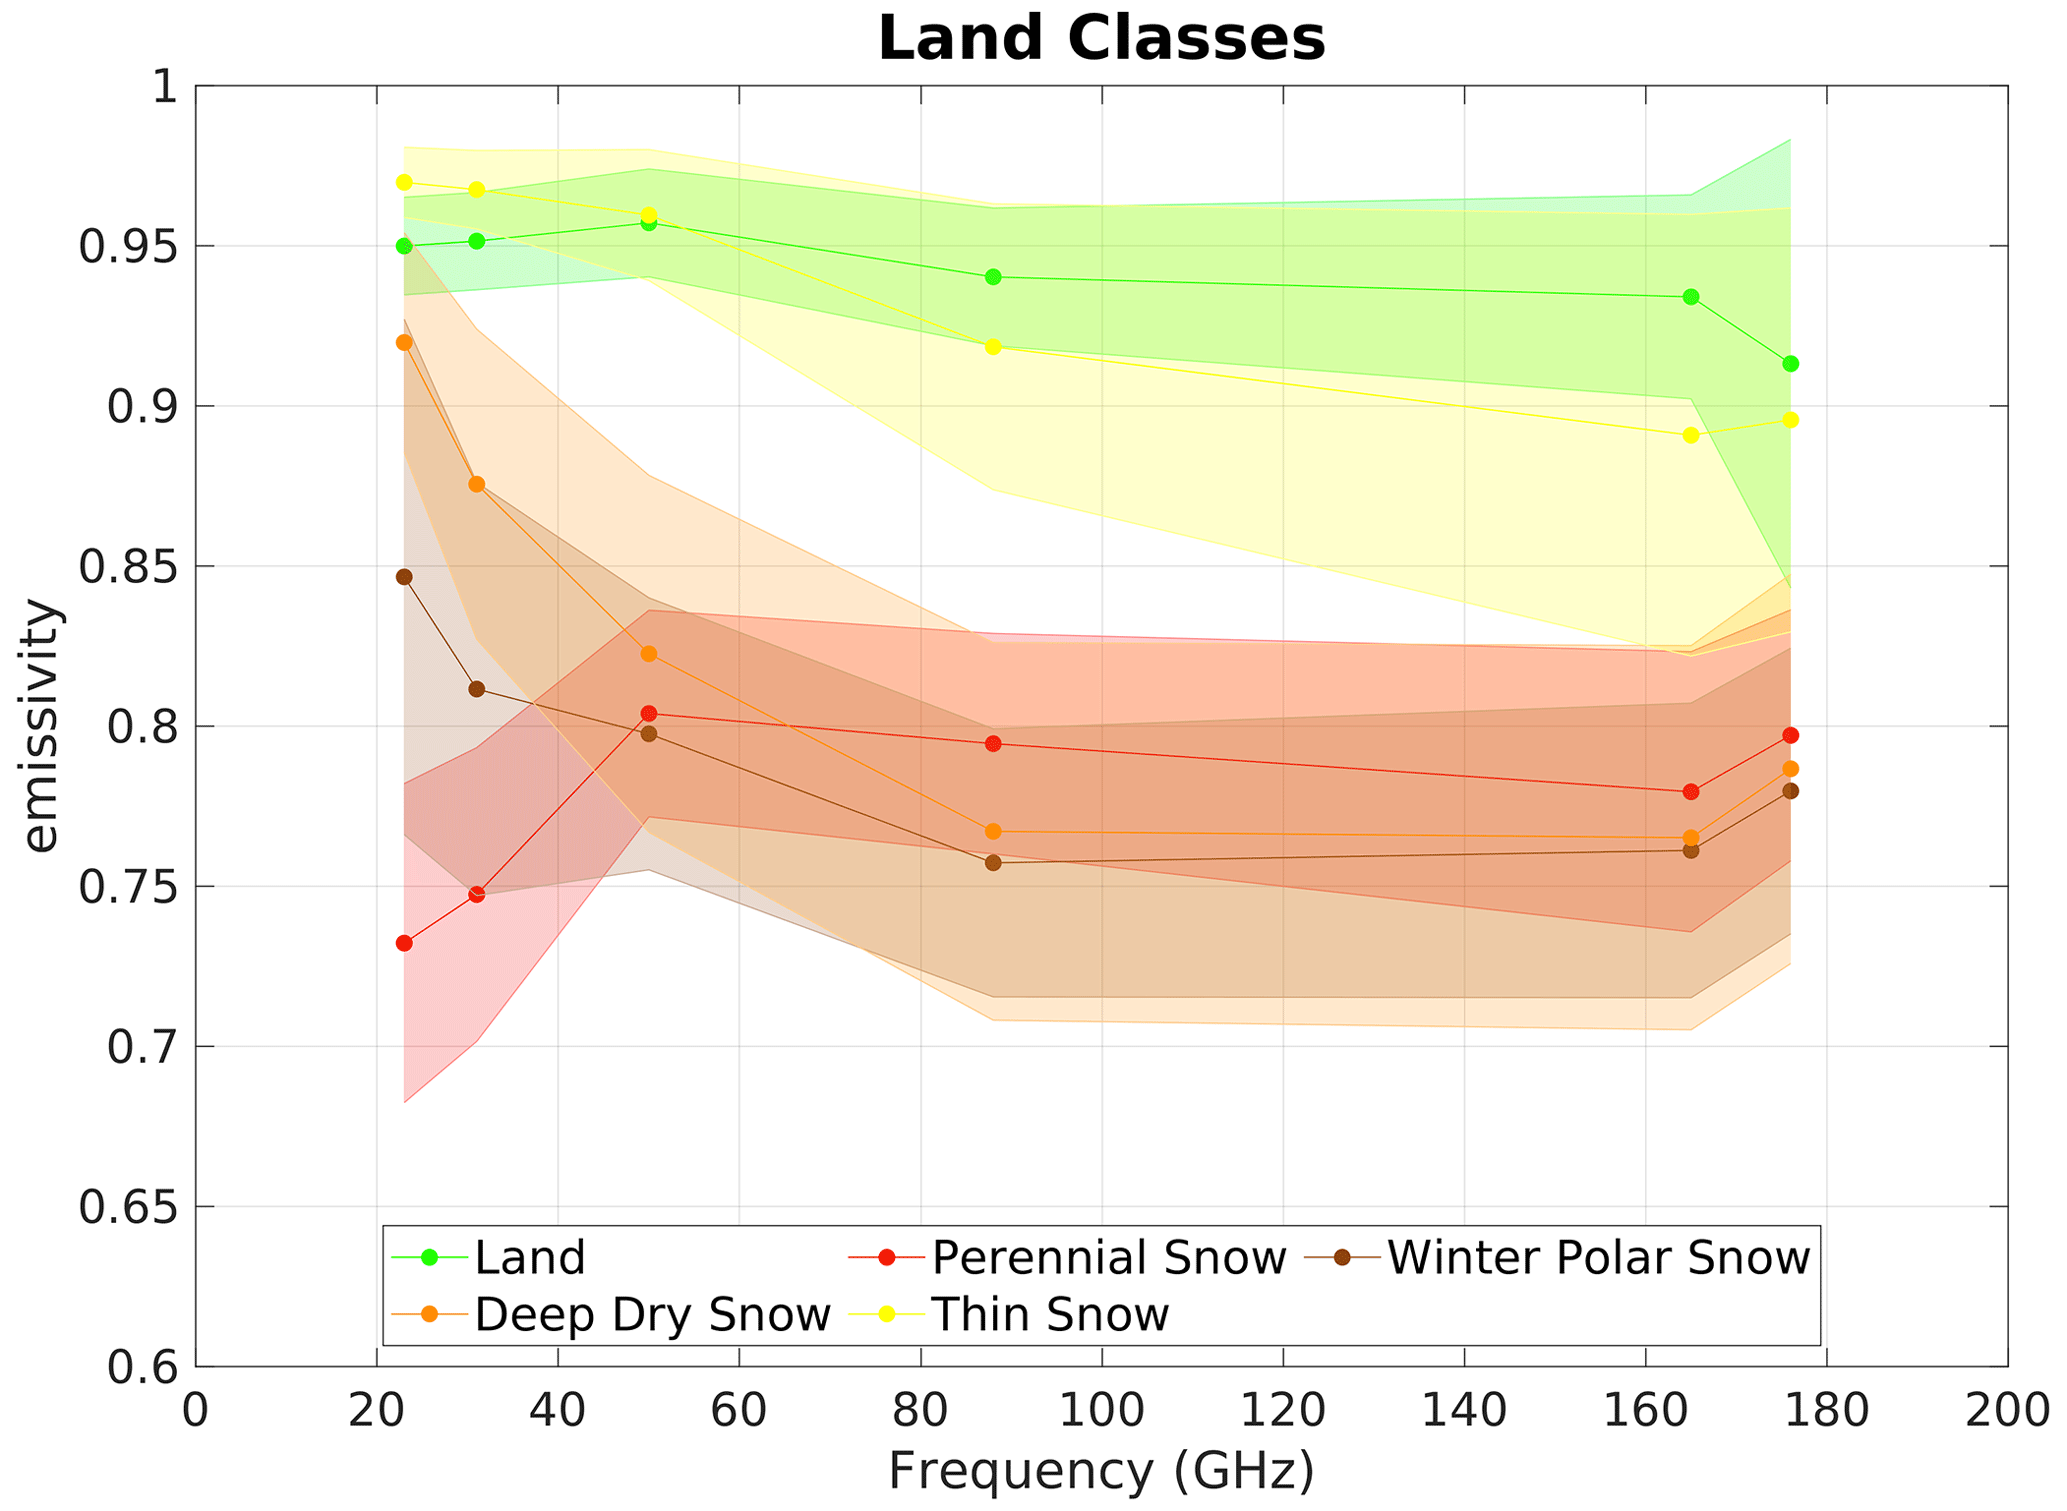
The estimated spectra are shown in Figs. 4 and 5 for Ocean and Land classes, respectively (the coast has also been considered as a separate class; however, its spectrum is not shown in Figs. 4–5). It is possible to observe that the classes are well-characterized from a radiometric point of view, showing distinct behavior of the emissivity spectra (e.g., the mean values). However, all the classes present significant standard deviations at high frequency, and some classes – such as the snow classes and the Broken Sea Ice class – present a high value of standard deviation also at low frequency.
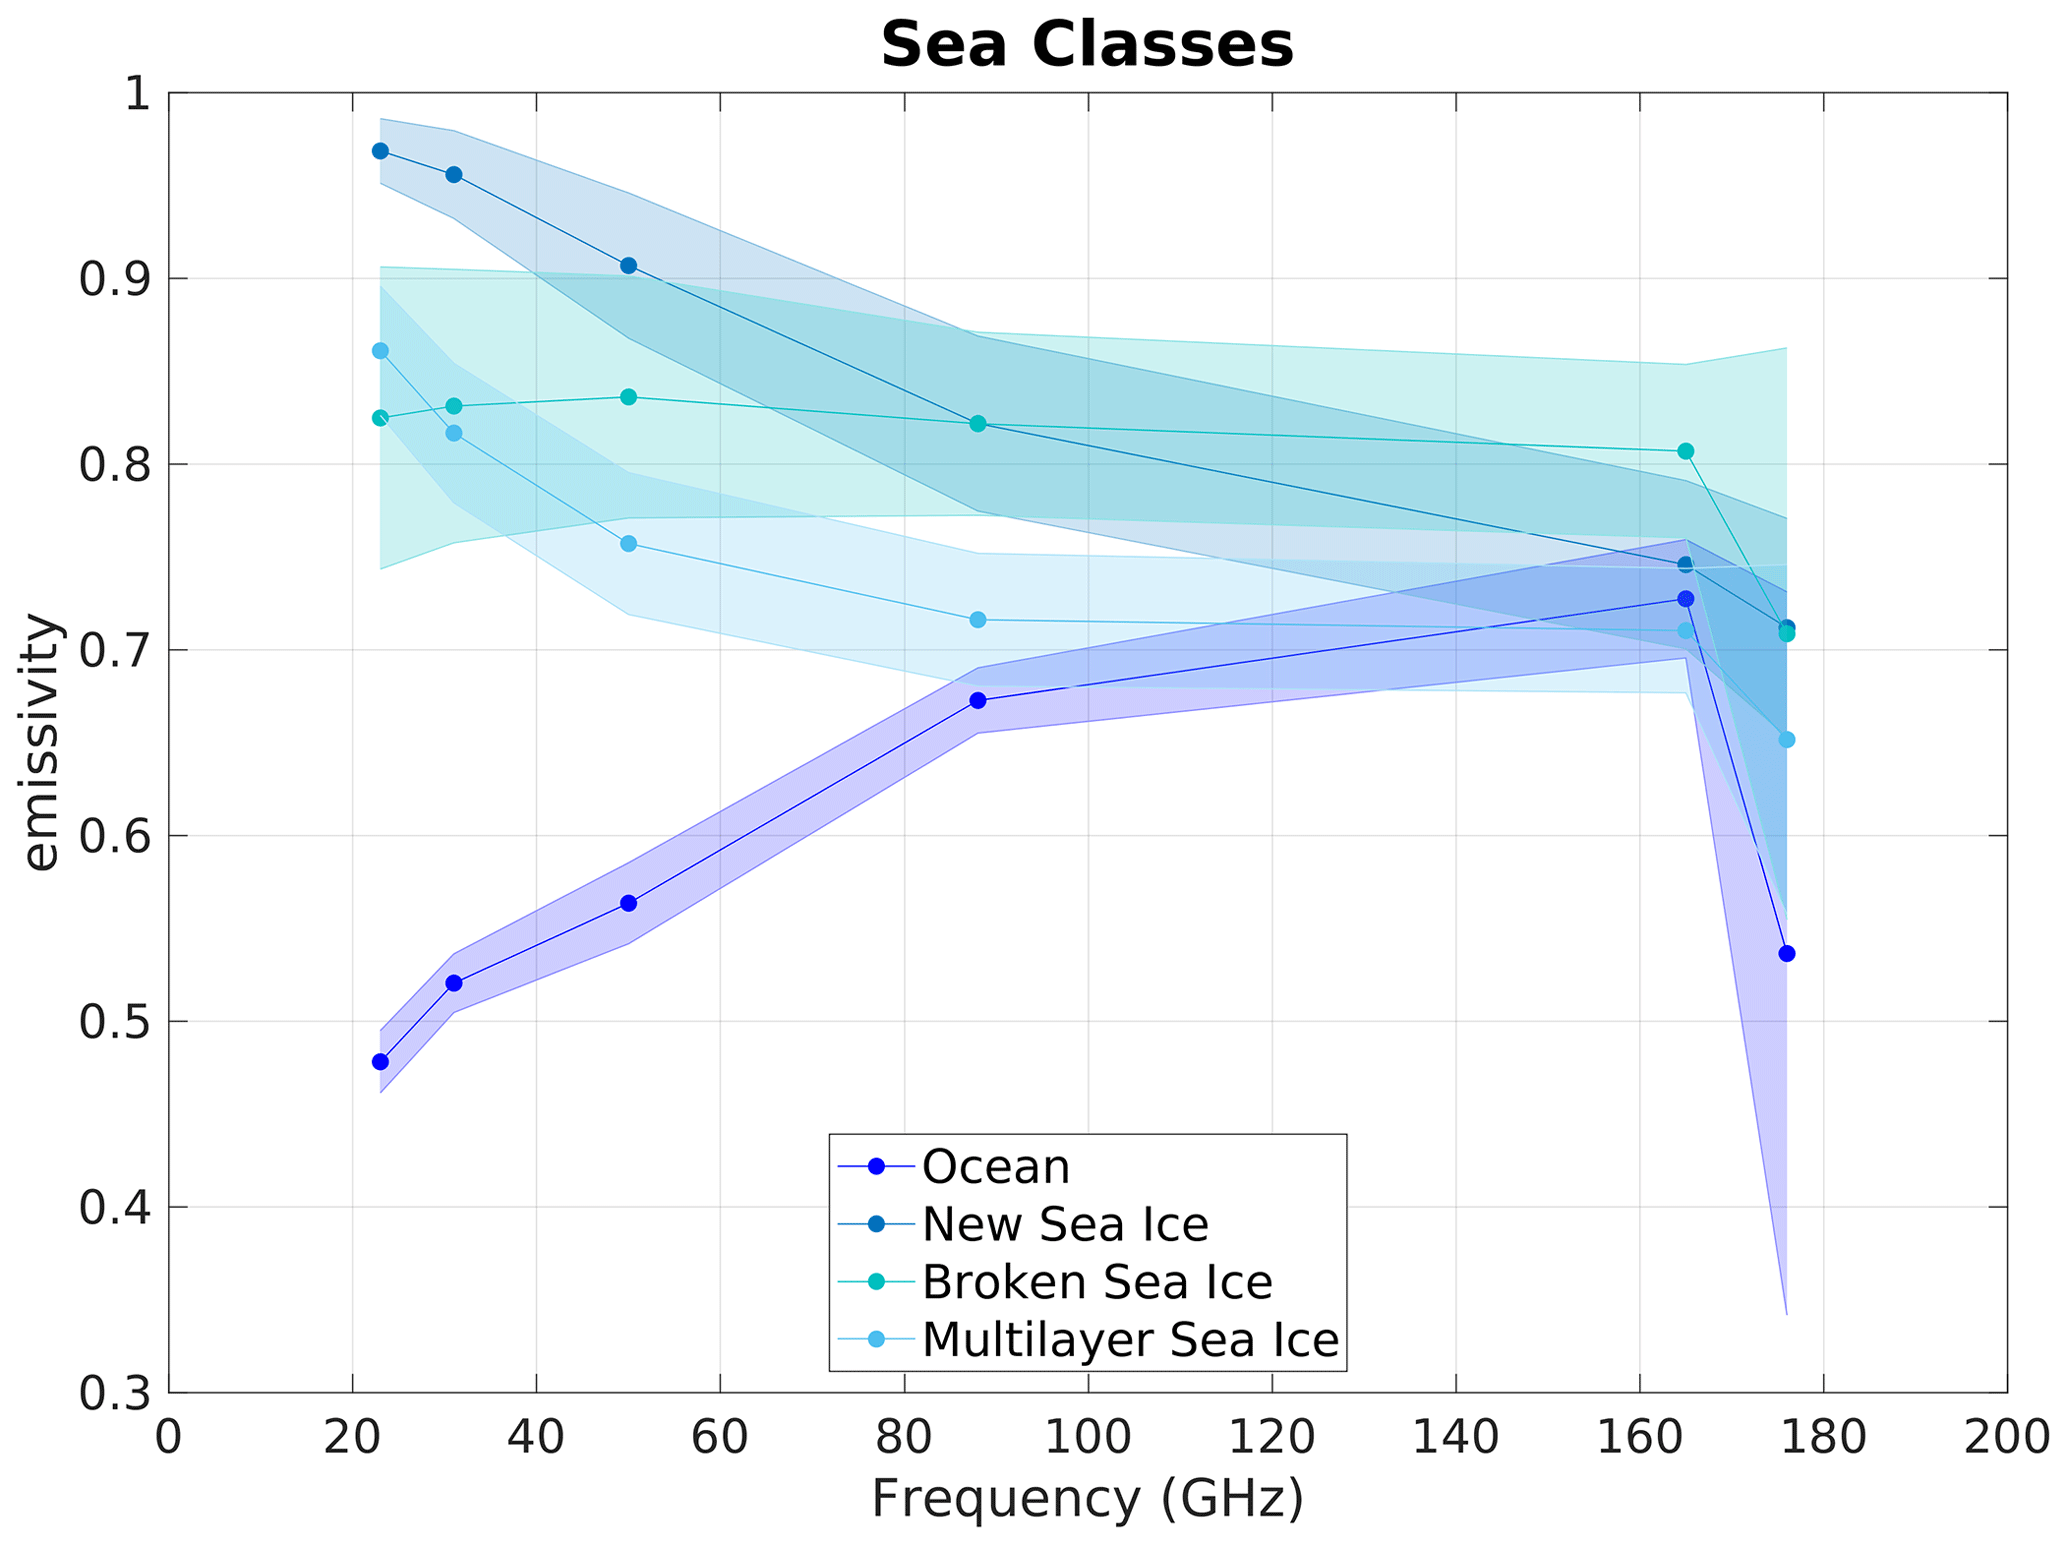
Figure 4Emissivity spectra for PESCA sea classes. The continuous lines represent the mean values of the emissivity, while the shaded areas represent the standard deviation calculated at the ATMS reference frequencies (23.8, 31.4, 50.3, 88.2, 165.5, and 183.3 ± 7 GHz) represented by the dots.
The clear-sky RTM simulations based on the mean emissivity values estimated for each class have been compared to the coincident observed clear-sky TBs, but the RMSE between simulated and observed clear-sky TBs appeared to be too high to implement a robust signal analysis (> 10 K). For this reason, a refinement process for the emissivity spectra estimation based on machine learning techniques has been developed downstream of the PESCA classification.
The refinement process has been based on a combination of an unsupervised classification technique (SOM) and a supervised technique (LDA). The unsupervised classification identifies clusters characterized by the minimum inner variability from a radiometric point of view. The supervised technique, instead, has the goal to identify the previously obtained clusters and the associated emissivity spectra by using only input variables that are not affected by the presence of clouds. The final emissivity spectra are estimated as the mean emissivity for each frequency within each cluster identified by the supervised technique. Therefore, as a first step, the emissivity spectra have been clusterized in order to minimize the emissivity variability in each cluster by arranging the retrieved emissivity values for six ATMS channels (23.8, 31.4, 50.3, 88.2, 165.5, and 183.31 ± 7 GHz) in a one-dimensional SOM architecture. Then, an LDA model has been trained using the previously obtained clusters as a reference and using the PESCA input parameters (pem23, pem31, ratio, and SI), some environmental parameters (TPW, T2m, and surface pressure (Psurf)), and ancillary variables (latitude (lat), Julian day (jd), altitude (DEM), and the maximum solar height during the day (Hsun)) as input. The use of the LDA is necessary to associate an emissivity spectrum to all the observations that are classified by PESCA, independently of the presence of clouds. It is worth noting that the whole predictor set of the LDA has resulted in being redundant; therefore, a subset of the predictors has been selected for each class. The accuracy of the LDA classification is given by the ratio between the number of hits (observations where LDA identifies the associated SOM class) and the total number of observations; it can be regarded as an indicator of the effectiveness of the LDA model in rebuilding the SOM results.
The evaluation of the refinement process is based on the comparison between the simulated clear-sky TBs and the observed clear-sky TBs. For each PESCA surface class, the number of clusters that simultaneously lowers the errors (RMSE) between the simulated and observed clear-sky TBs at high frequency (without lowering the classification accuracy too much) is chosen.
In Table 3 the number of clusters, the predictors selected, the accuracy, the RMSE, and the percentage normalized root mean squared error (NRMSE%) (Gareth et al., 2013) estimated on the test dataset are reported for the 165.5 GHz channel. NRMSE% is defined by Eq. (5).
where σ represents the standard deviation of the measured clear-sky TBs dataset in each PESCA class. It can be regarded as an indicator of the effectiveness of the refinement process.
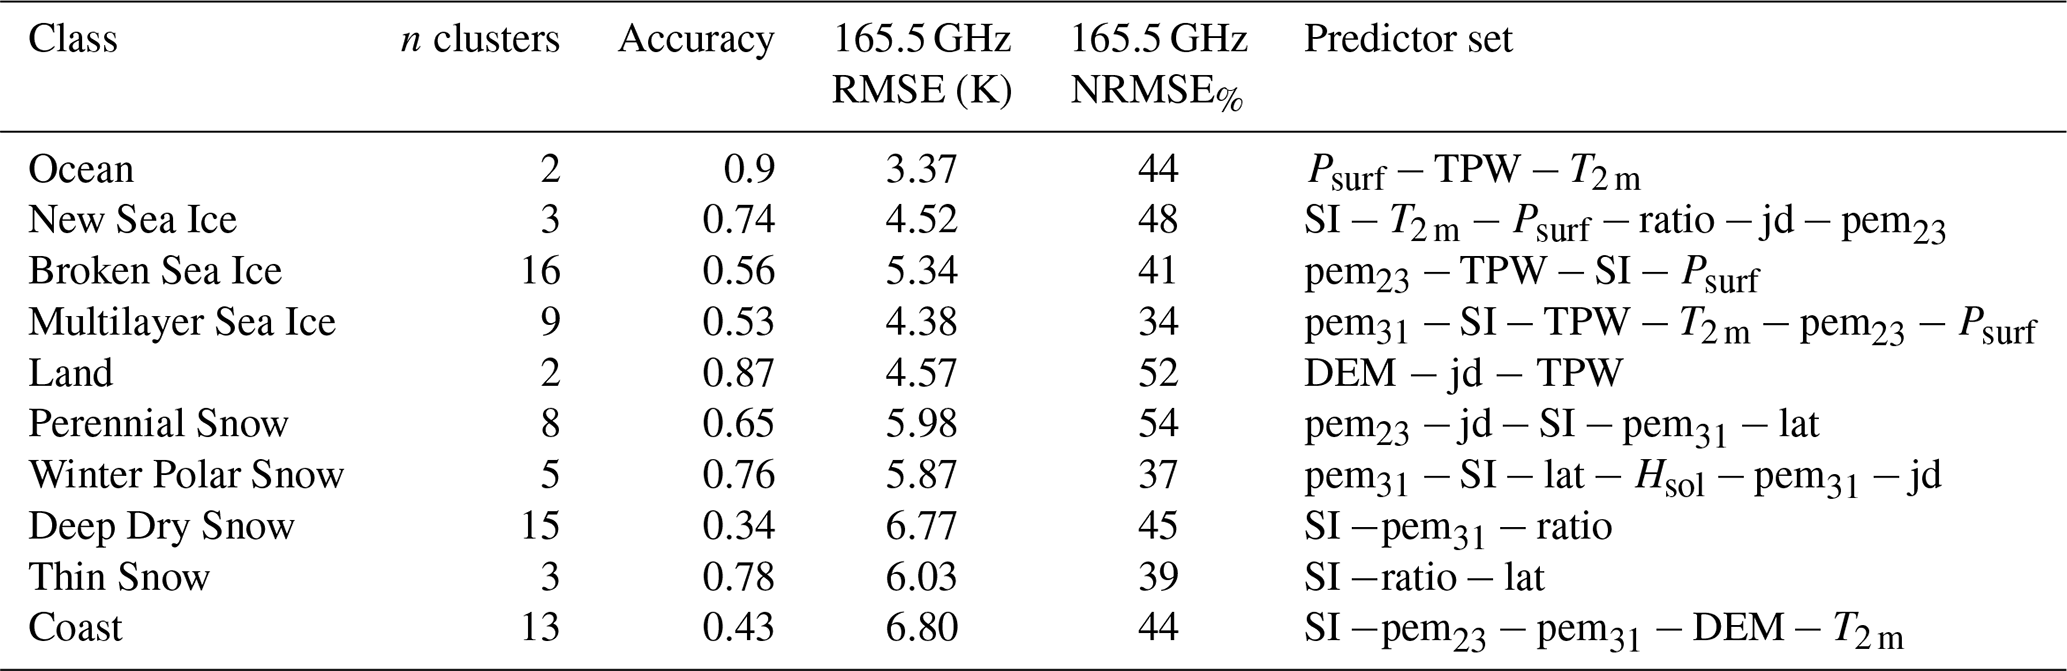
For some classes, such as the Ocean class, the refinement process leads to low RMSE values (< 4 K). For other classes, such as Deep Dry Snow and Broken Sea Ice, RMSE remains > 5 K even with a high number of clusters, although there is a significant reduction compared to the initial variance in each class (NRMSE%< 50). This is due to the variability in snow-covered background within each class; in the worst-case scenario, the limited number of predictors is insufficient to infer the emissivity spectrum at high frequency. Overall, the refinement process allows us to obtain a general improvement in the accuracy of the dynamic emissivity estimation for the PESCA classes; however, for some classes, the high-frequency channel uncertainty remains significant. The emissivity spectra obtained by PESCA refinement are used as inputs for the RTM to obtain clear-sky simulated TBs (TBsim) to be compared to the actual observations (TBobs). The comparison between clear-sky simulated TBs and observed TBs allows us to highlight and interpret the MW signal in the presence of snowfall.
In Fig. 6, the snowfall signal is represented as a function of the SWP for the 165.5 GHz channel and different PESCA classes. The red lines and shaded areas represent the mean values and standard deviations of the difference between observed TBs and clear-sky simulated TBs () for SWP bins calculated for observations where 2CSP SWP > 0 kg m−2. The blue lines represent the uncertainty due to surface emissivity variability in each PESCA class. They are centered on the estimated bias for each class (close to 0 K), and the dashed lines correspond to the standard deviation of ΔTBobs−sim in clear-sky conditions. A clear scattering signal ( 0) is observed over all the classes considered for intense snowfall events (SWP > 1 kg m−2). For lower SWP values, the signal is more ambiguous and changes with the background surface. While over Land there is a clear scattering signal for SWP > 0.1 kg m−2, over the Perennial Snow class a scattering signal can be observed only for SWP > 0.5 kg m−2. For SWP < 0.1 kg m−2, the mean ΔTBobs−sim for snowfall observations is less than its standard deviation in clear-sky. This is due mainly to the emissivity variability in each surface class and to the error introduced by the use of model-derived temperature and water vapor profiles in the RT simulations. However, while for the Land class the mean 0 K can be explained as a predominant scattering effect for all SWP values, for the Perennial Snow class the mean 0 K can be interpreted as a predominant emission signal with respect to the radiatively cold background (see Fig. 5). The Thin Snow class shows an intermediate behavior: for SWP < 0.1 kg m−2 the red shaded area within the RMSE limits (blue lines) of the RT simulations denotes the difficulty in interpreting the signal, while a clear scattering signal can be observed for SWP > 0.3 kg m−2. As far as the Ocean and New Sea Ice classes are concerned, a clear scattering signal is visible only for high SWP values (> 1 kg m−2), while for low SWP values a significant emission signal is observed. The emission effect observed over ocean and sea ice is likely generated by supercooled cloud liquid water. The ubiquitous presence of supercooled water layers in snow clouds (Wang et al., 2013; Battaglia and Panegrossi, 2020), especially over oceans (Battaglia and Delanoë, 2013), generates an emission effect that is particularly significant over radiatively cold surfaces (such as Perennial Snow, Ocean, and New Sea Ice at high frequency; see Fig. 4) and can mask or overcome the weak scattering signal generated by falling snow, especially in light snowfall events. It is also important to underline that the DARDAR product identifies mostly supercooled water layers at the cloud top (Rysman et al., 2018; Panegrossi et al., 2017), while it has been shown that the impact of supercooled water layers embedded in the clouds can be very significant on the measured TBs at MW high-frequency window channels (Battaglia and Panegrossi, 2020; Panegrossi et al., 2022).

Figure 6Snowfall signature at 165.5 GHz as a function of SWP for five PESCA surface classes. The red lines and shaded areas represent the mean values and standard deviations of ΔTBobs−sim (i.e., the snowfall signature), while the blue lines are centered on the estimated bias and standard deviation of ΔTBobs−sim in clear-sky conditions for the corresponding PESCA surface class.
3.2 ANN design for snowfall retrieval
The snowfall detection and estimation modules have been based on ANNs. Four ANNs have been developed: two for the detection of SWP and SSR and two for the SWP and SSR estimate. The performances of more than 50 architectures have been tested by varying the number of layers, the number of neurons for each layer, and the activation functions. The final architecture for all modules is composed of four layers: an input layer with a neuron number equal to the predictor number, a hyperbolic tangent function as the activation function, a first hidden layer (60 neurons), a hyperbolic tangent function, and a second hidden layer (30 neurons) with a sigmoid function (for more information about the neural network characteristics, see Sanò et al., 2015). At the same time, several predictor sets have been tested, combining in different ways ATMS TBobs, ΔTBobs−sim, PESCA surface class, ATMS angle of view, ancillary information (surface elevation from a digital elevation model), and model-derived environmental variables (T2 m, TPW, and the Freezing Level Height). In Table 4 the statistical scores of the algorithm performance for the SSR detection module obtained for different predictor sets are reported. It is possible to see that the best performance is obtained when the predictor set is composed of ATMS TBobs and ΔTBobs−sim (besides the PESCA surface flag, the pixel surface elevation, and the cosine of the viewing angle). In particular, there is a notable improvement in the detection capabilities with respect to a predictor set composed of ATMS TBobs and environmental parameters, which is used in other approaches such as that of SLALOM-CT. On the other hand, the simultaneous use of both the ΔTBobs−sim and the environmental parameters shows scores almost equal to that obtained by using only ΔTBobs−sim. This indicates that the computation of the multichannel clear-sky TBs at the time of the overpass through the estimation of the dynamic surface class emissivity spectra and its deviation from the measured TBs plays a fundamental role in snowfall retrieval, in particular in cold/dry environmental conditions. It provides essential information for the ANN to be able to exploit the subtle snowfall-related signal in ATMS measurements. This is the most innovative aspect of HANDEL-ATMS.
Table 4HANDEL-ATMS SSR detection performance: statistical scores for different predictor sets. The statistical scores have been calculated for the test dataset.
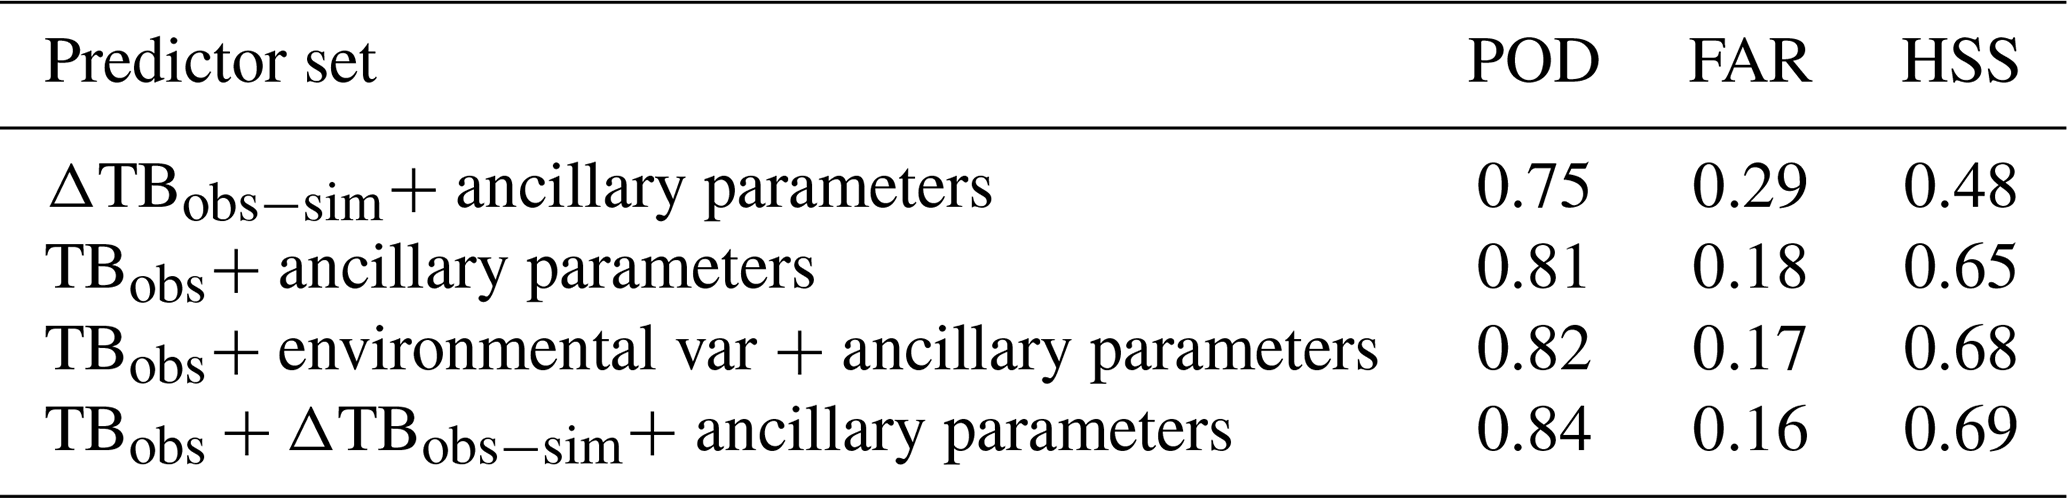
Based on these results, the final set of predictors for HANDEL-ATMS is composed of the TBobs in 16 ATMS channels (1–9 and 16–22; channels 10–15 have not been considered because their weighting function peaks above the tropopause), the corresponding ΔTBobs−sim, the PESCA classification flag, the pixel elevation (obtained from a DEM), and the cosine of the viewing angle.
4.1 HANDEL-ATMS performances
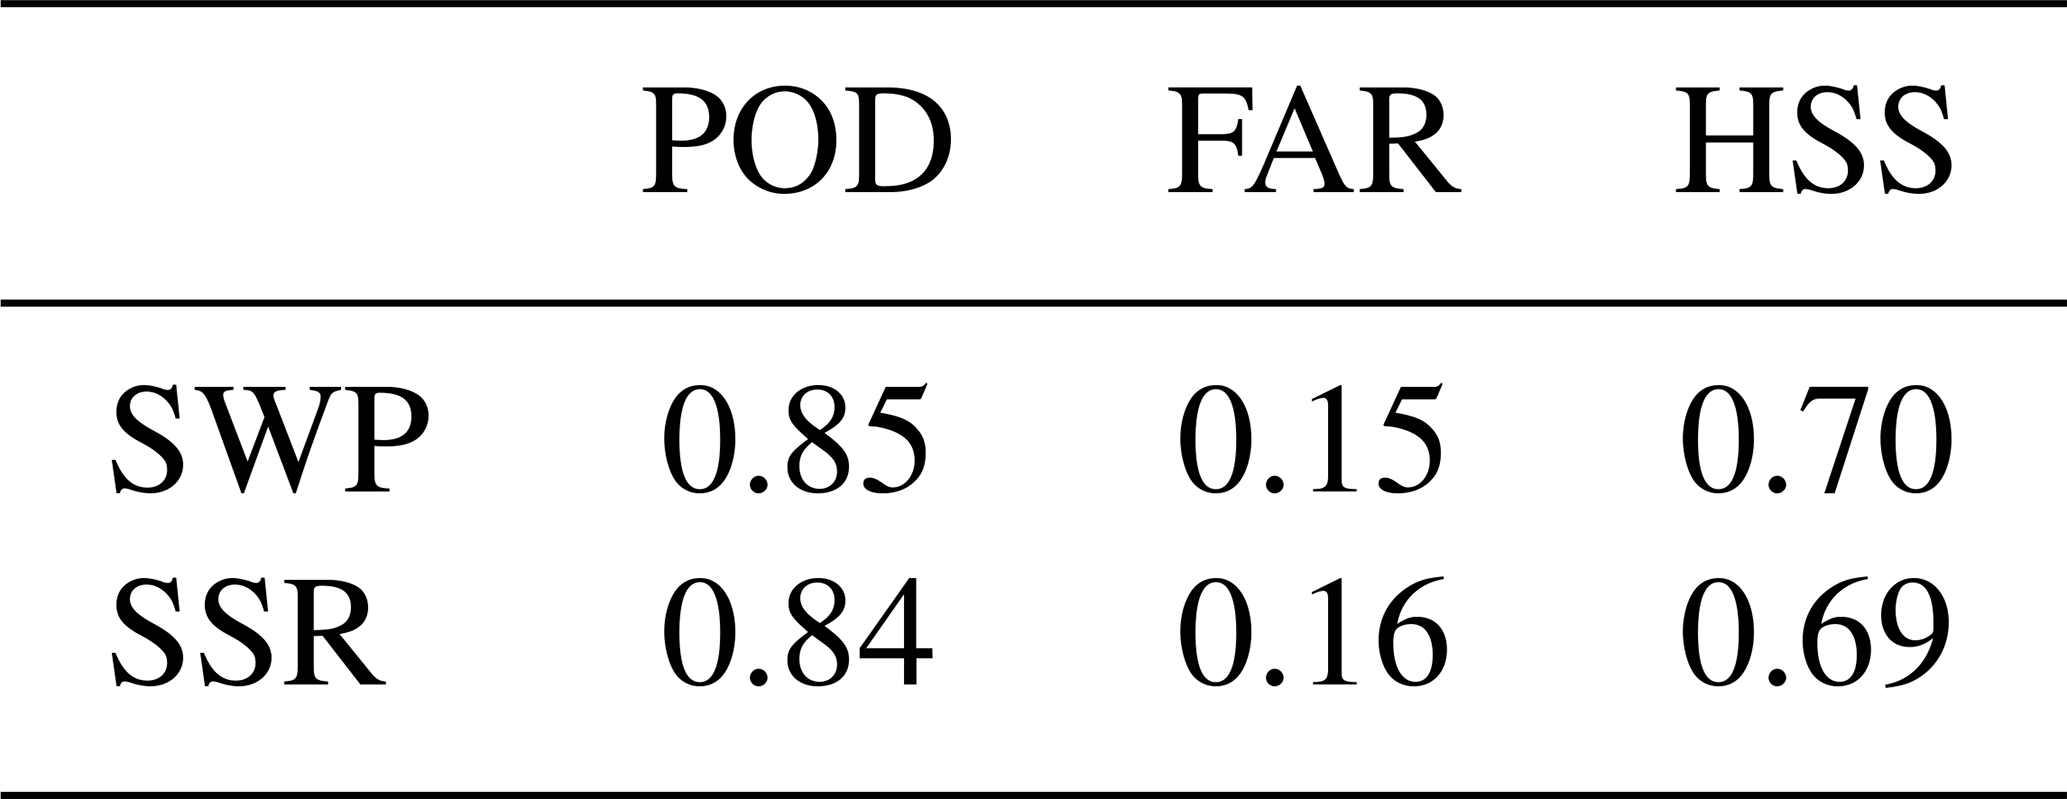
In Table 5 the statistical scores of HANDEL-ATMS detection module performances are reported in terms of POD, FAR, and HSS. These statistical scores – and the plot reported in the next figures – have been calculated for the test dataset.
Table 5HANDEL-ATMS detection performance: SWP and SSR detection module statistical scores. The statistical scores have been calculated for the test dataset.
In Figs. 7 and 8 the dependence of HANDEL-ATMS snowfall detection statistical scores on TPW and T2 m is reported. In both figures, it is possible to observe that the SWP detection capabilities improve (with an increase in POD and HSS and a decrease in FAR) with increasing humidity and temperature. This is due to the combined effect of a stronger scattering signal associated with more intense snowfall events – linked to moister and warmer environmental conditions, as can be observed in Fig. 12 and Table 2 – and to the lower transmissivity of the atmosphere which masks the background surface signal, reducing its impact and the uncertainties linked to its variability. On the other hand, colder and drier conditions are usually linked to background surface types characterized by high radiometric variability such as the Perennial Snow and Winter Polar Snow classes, which cause uncertainty in emissivity estimation. It is possible to observe that in Fig. 7 SSR detection capabilities show a maximum HSS value for TPW between 3 and 5 mm, and then there is a slight decrease due to the decrease of POD. A similar situation can be observed in Fig. 8, where HSS reaches a maximum between 250 and 275 K, and it is lower than for SWP. This is due to the fact that PMW measurements respond mostly to the snow in the atmospheric column, and in moister/warmer conditions the presence of snow in the atmosphere is not always linked to surface snowfall. In both cases, it is worth noting that, also considering very dry (TPW ≈ 2 mm) or very cold (T2 m ≈ 240 K) conditions, HANDEL-ATMS shows good detection capabilities, in spite of the uncertainties linked to the modeling of the background surface and the weakness of the signal in such conditions. In Fig. 9 the dependence of HANDEL-ATMS snowfall detection statistical scores on SWP and SSR values retrieved by CPR 2CSP is reported. Only POD is reported because the statistics are calculated for snowfall observations only (2CSP SWP > 0 kg m−2 and 2CSP SSR > 0 mm h−1). It is possible to observe that, also considering very low SWP and SSR values (SWP ≈ 0.001 kg m−2, SSR ≈ 0.001 mm h−1), HANDEL-ATMS manages to detect around 60 % of the snowfall events.

Figure 7Dependence of HANDEL-ATMS SWP and SSR detection statistical scores on TPW calculated for the test dataset. Each star represents the statistical score value for a different 1 mm bin of TPW. The left y axis reports POD, FAR, and HSS values, while the right y axis reports the number of total and snowfall observations in the test dataset.
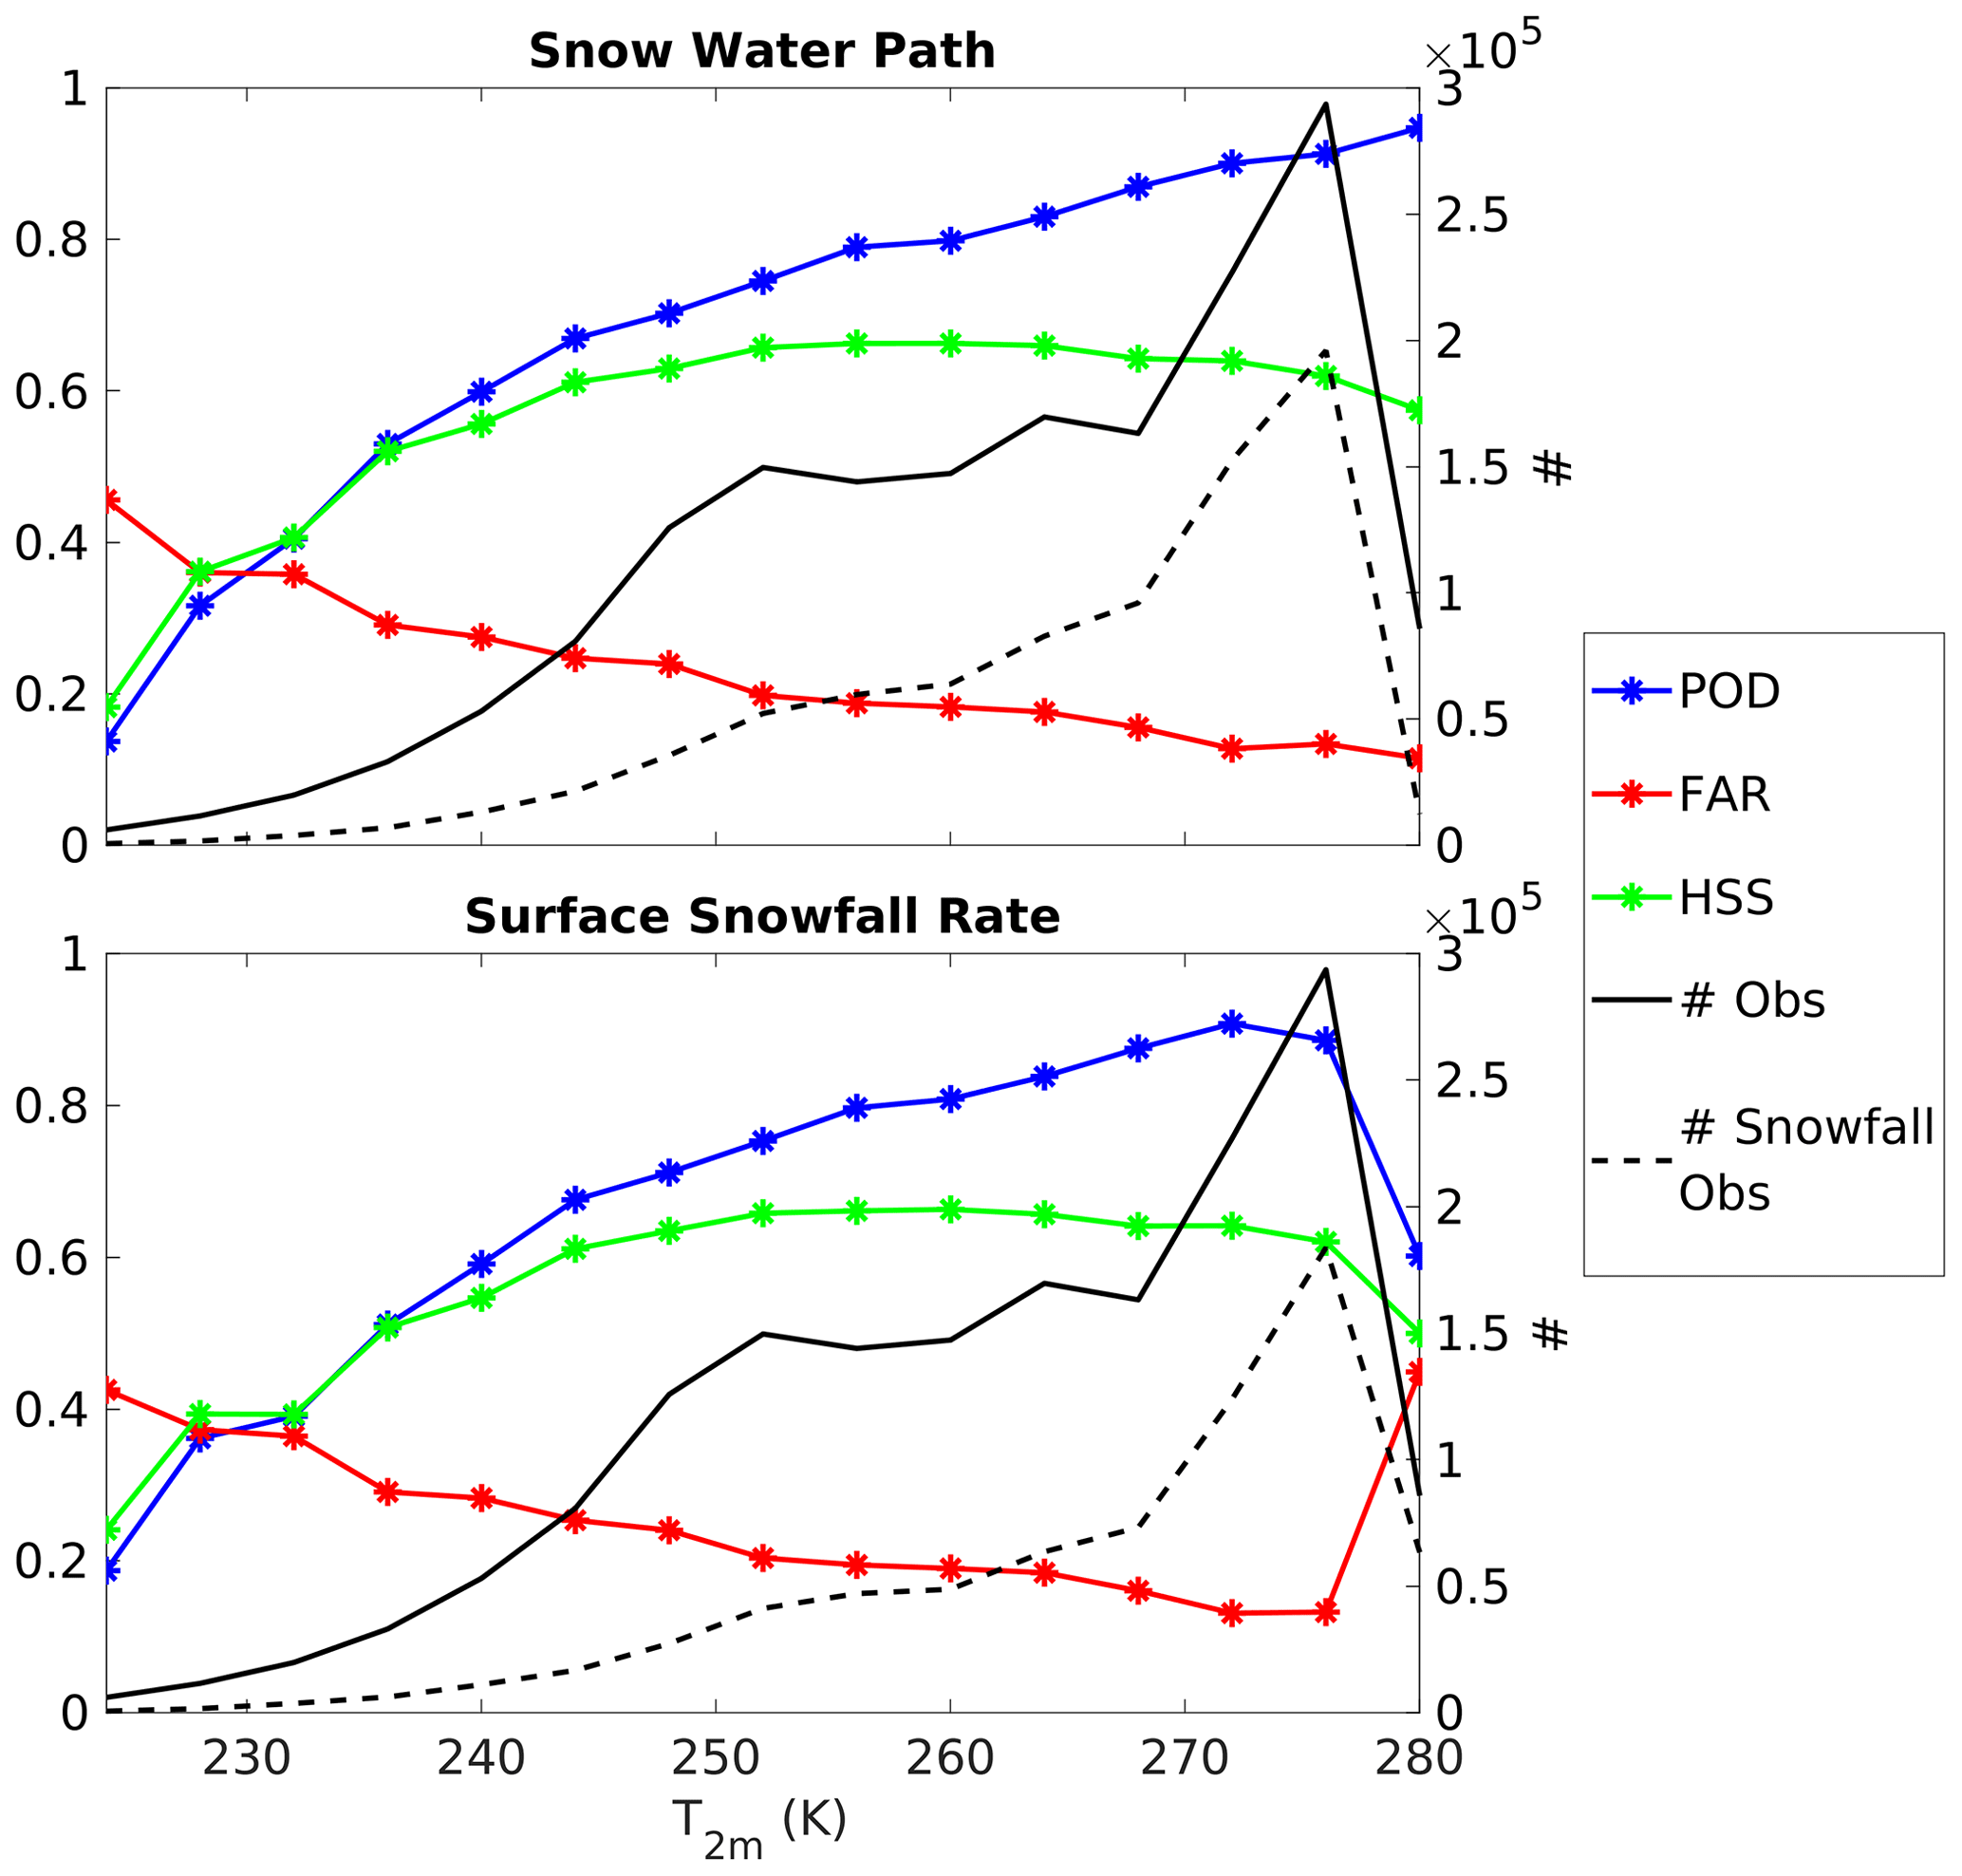

Figure 9Dependence of HANDEL-ATMS SWP and SSR POD on SWP/SSR values. Each star represents the statistical score value for different SWP/SSR bins. The left y axis reports POD values, while the right y axis reports the number of snowfall observations in the test dataset. Only POD has been reported because the index has been calculated for observations where CPR 2CSP detects the presence of SWP/SSR.
The detection capabilities are influenced both by the typical environmental conditions of each PESCA class and by the uncertainties linked to the emissivity estimation. In Fig. 10 the statistical scores of the algorithm performance, calculated by considering each PESCA class for both the SWP and the SSR detection module, are reported. It can be observed that, also considering specifically the classes associated with extremely dry and cold environmental conditions such as Perennial Snow or Winter Polar Snow (see Camplani et al., 2021 and Table 2), where the detection is more problematic due to low snowfall intensity (see Table 2) and to the uncertainties in the emissivity retrieval (see Table 3), HANDEL-ATMS has good detection capabilities (POD and FAR values greater than 0.7 and less than 0.25, respectively, for both SWP and SSR). On the other hand, for surface classes characterized by the highest emission estimation uncertainties, such as Deep Dry Snow, the statistical scores are coherent with the general scores and better than those obtained in presence of extremely dry/cold environmental conditions. Therefore, it is possible to conclude that the extremely cold/dry environmental conditions have more influence on the detection than the uncertainties on clear-sky emissivity estimation do. Generally, these results provide evidence that HANDEL-ATMS can be used to analyze snowfall occurrence in the polar regions.
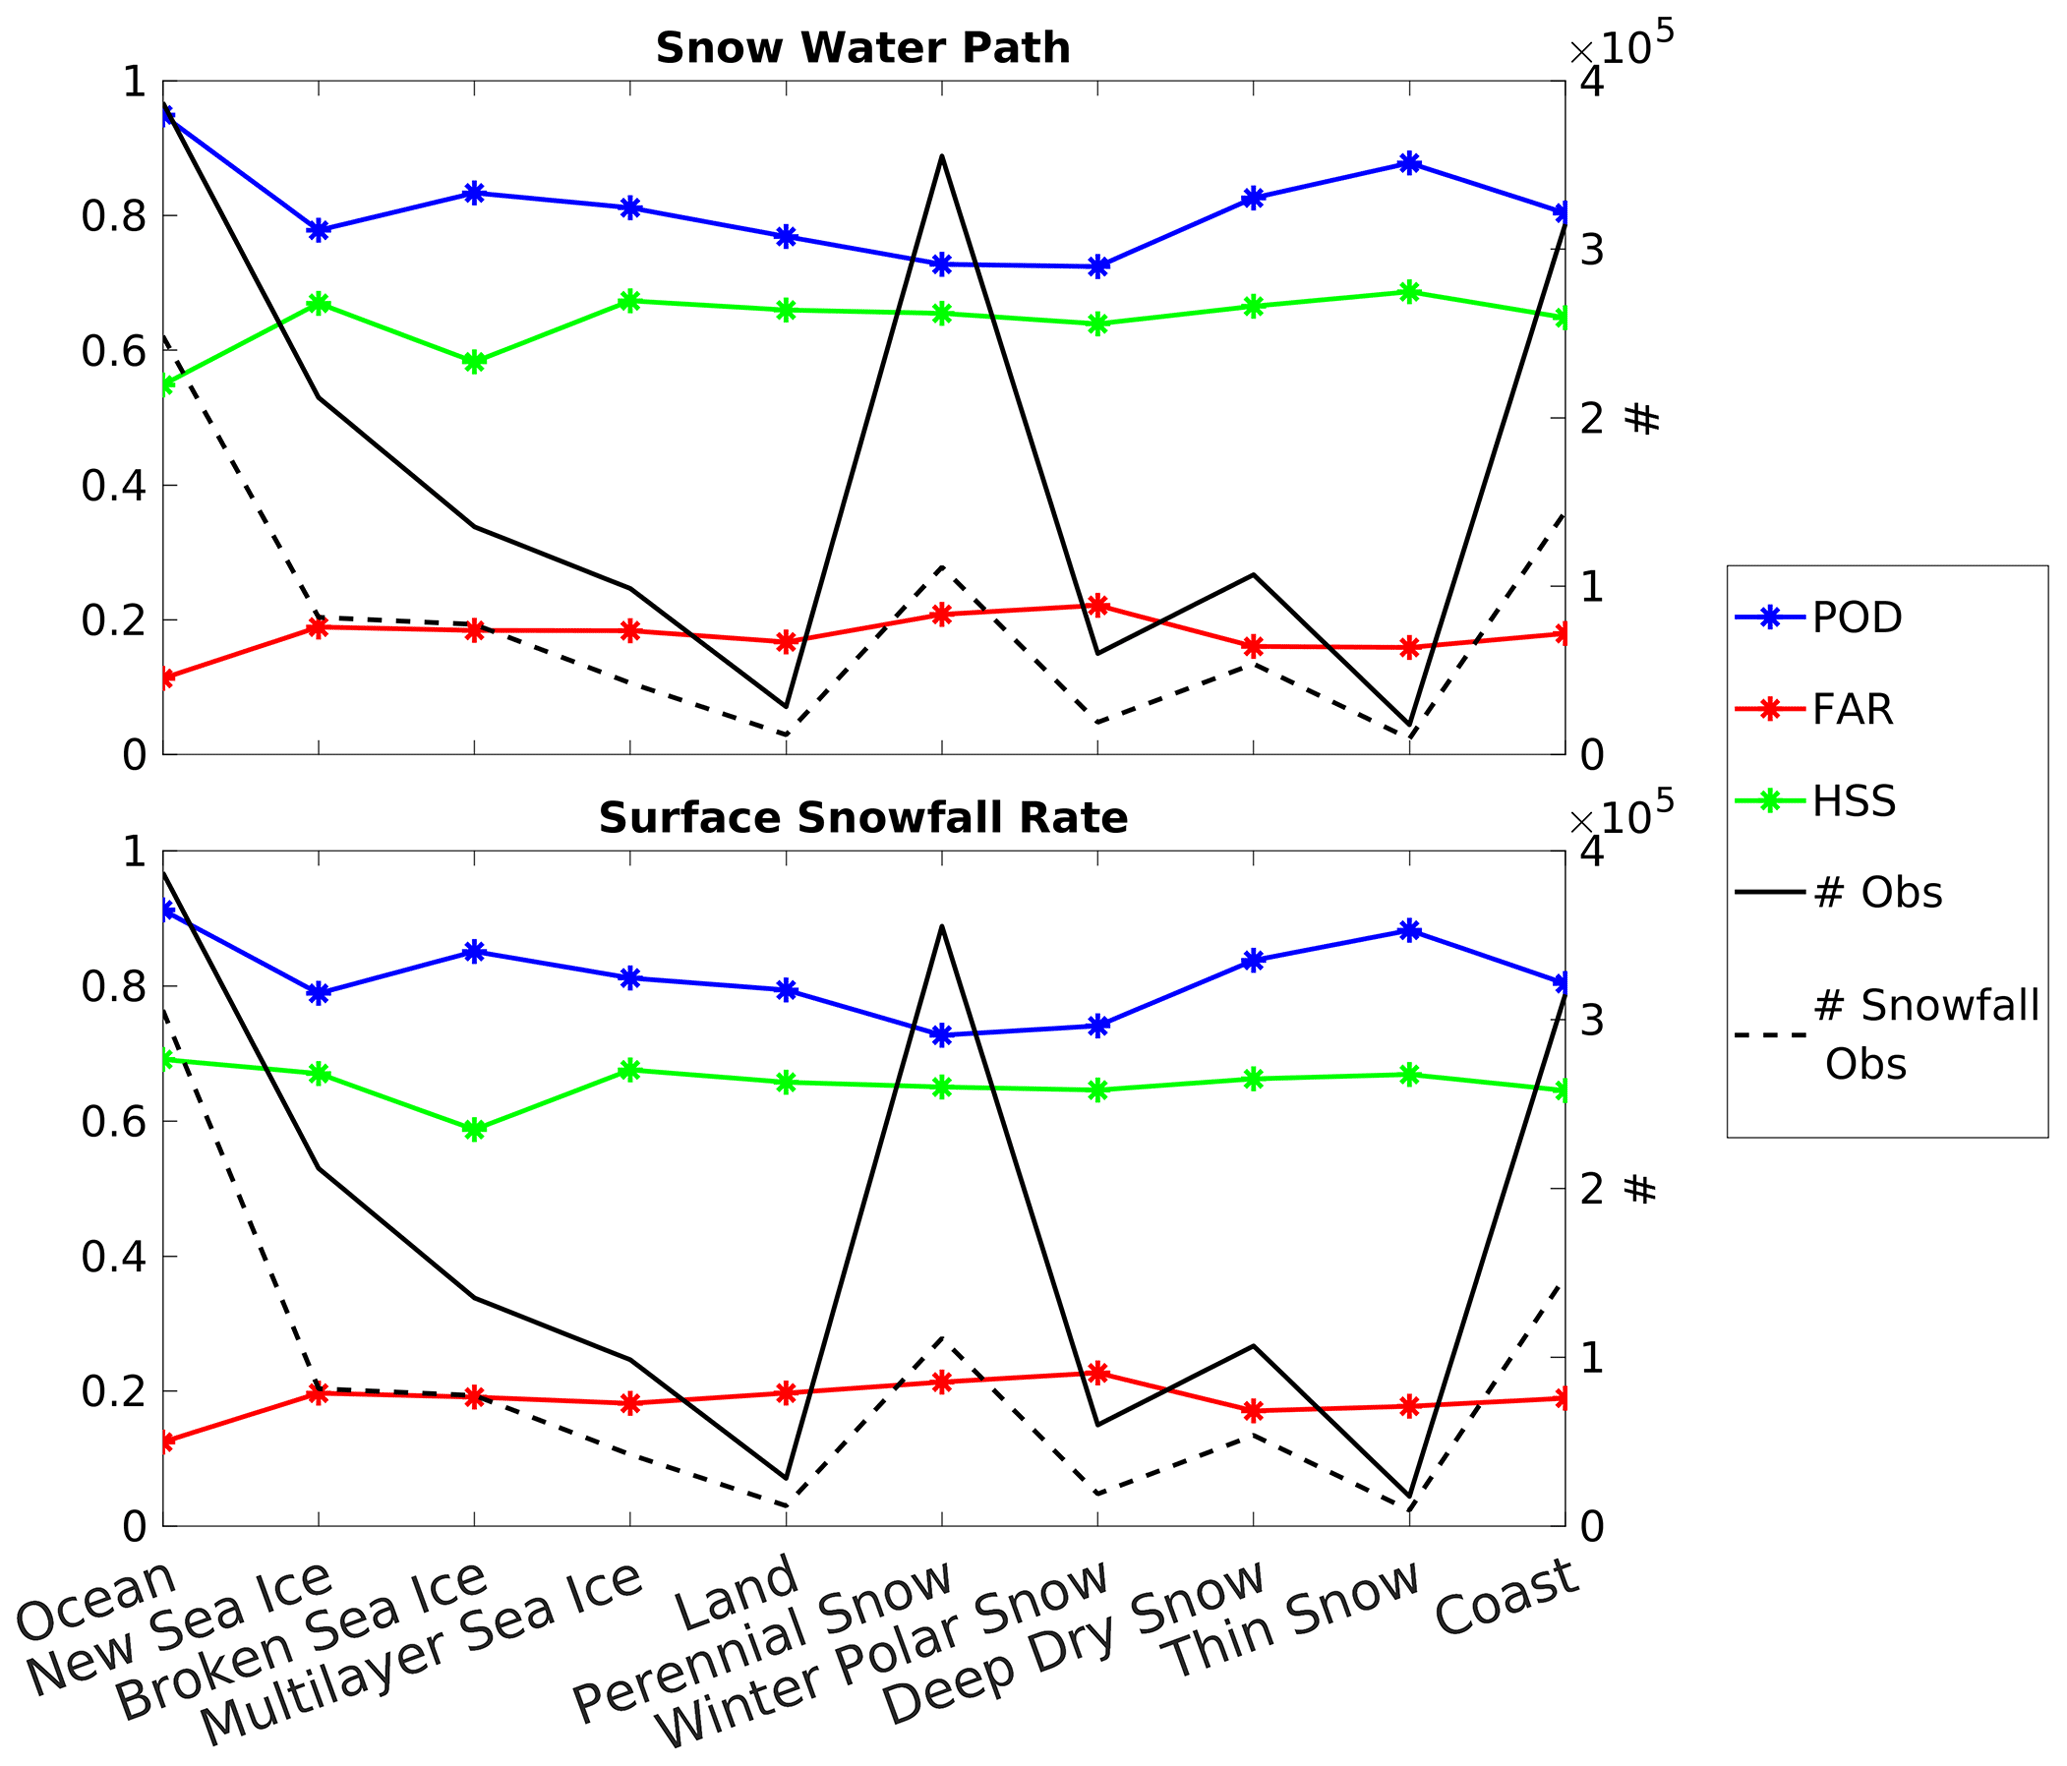
Figure 10Same as Fig. 7 but for PESCA surface classes. Each star represents the value of the statistical score for each surface category.
The error statistics of the two estimation modules are reported in Table 6 in terms of bias; RMSE; and the coefficient of determination R2, which is defined by Eq. (6).
It is worth noting that the biases are negligible for both modules while RMSE values are comparable to the light events recorded in the dataset. Moreover, as expected, RMSE and R2 values are respectively higher and lower for the SSR module than for the SWP module. In Fig. 11 the density scatterplots between the SWP and SSR values retrieved by HANDEL-ATMS and 2CSP corresponding values are reported. For both modules, an overestimation can be observed for very light snowfall (SWP kg m−2 and SSR mm h−1), while there is a very good agreement for higher SWP and SSR values. In order to relate these results to the environmental conditions, Fig. 12 shows the dependence of HANDEL-ATMS snowfall estimation error statistics and of SWP and SSR on TPW. The curves represent, for each 1 mm TPW bin, the mean 2CSP SWP or SSR computed, the RMSE, and the relative bias (the ratio between the bias and the SWP/SSR mean value for each bin). As expected, TPW and snowfall intensity are strongly correlated. An increase in the absolute RMSE can be observed as TPW increases, and it is larger than the SWP/SSR mean value for TPW < 8 mm. A similar behavior can be observed by analyzing the dependence of HANDEL-ATMS snowfall estimation error statistics on T2 m (not shown). A very moderate overestimation is observed for TPW < 8 mm and for lower SWP and SSR values (< 0.1 mm h−1), with relative bias around 5 % (up to 8% only for extremely low TPW values and very low number of observations, see Fig. 7), while underestimation (relative bias up to −5 %) is observed for higher TPW values and higher SWP and SSR values. Generally, light snowfall events are linked to the very cold/dry environmental conditions typical of high-latitude regions. Therefore, the algorithm also manages to estimate the very light SWP and SSR typical of high latitudes but tends to slightly overestimate snowfall intensity in such conditions.
Table 6HANDEL-ATMS estimation performance: SWP and SSR estimation module error statistics. The error statistics have been calculated for the test dataset.

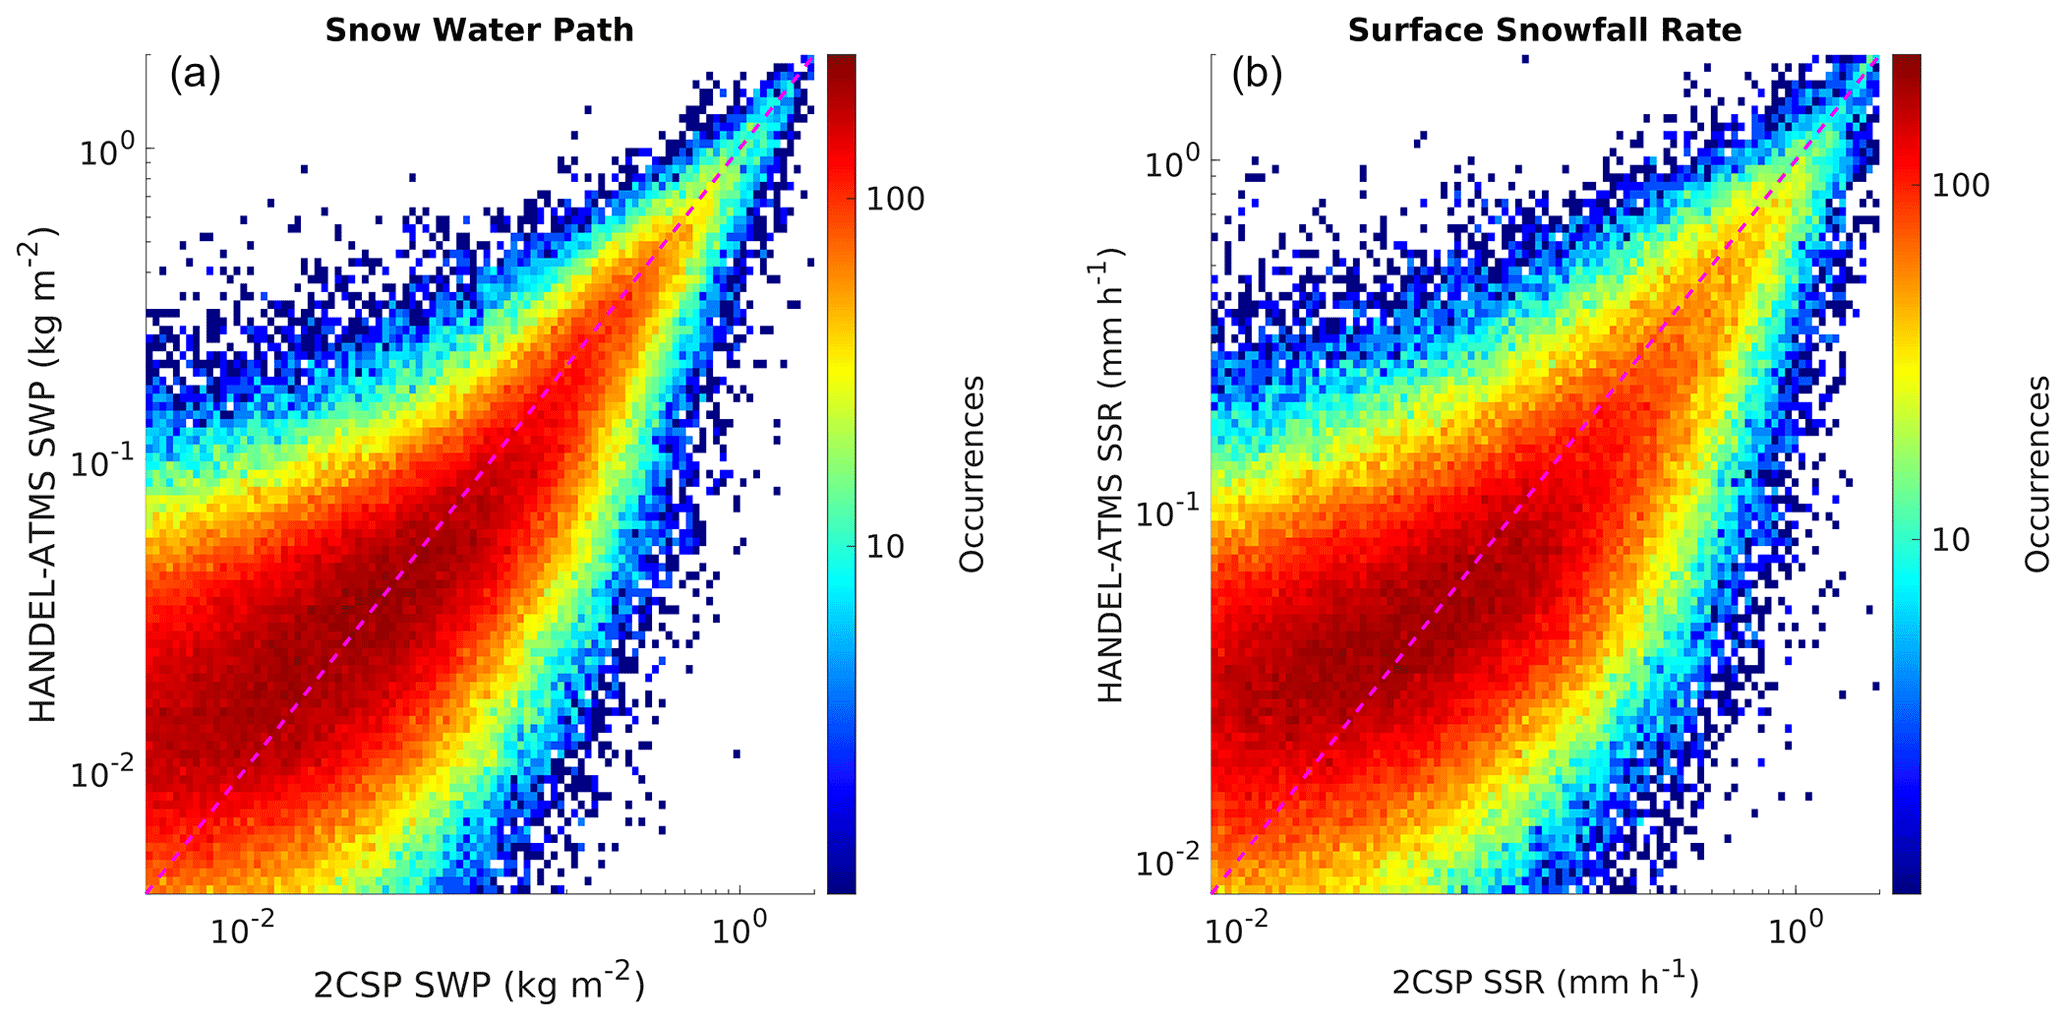
Figure 112D histogram reporting HANDEL-ATMS SWP (a) and SSR (b) estimation (y axis) and 2CSP estimation (x axis). The color bar represents the number of observations for each HANDEL ATMS/2CSP bin (test dataset). The dashed violet line represents the bisector.

Figure 12Dependence of HANDEL-ATMS SWP and SSR estimation on TPW calculated for the test dataset. Each star represents the value of the statistical score for different 1 mm TPW bins. The left y axis reports the RMSE and the mean intensity SWP and SSR value for each 1 mm TPW bin, while the right y axis reports the relative bias, calculated as the ratio between the bias and the SWP/SSR mean value for each bin.
From the analysis of Figs. 7–12, it can be concluded that HANDEL-ATMS has good detection capabilities (also for extremely light snowfall), but it shows some limitations in correctly estimating its intensity, with slight overestimation of the very light snowfall typical of high latitudes.
4.2 A case study: Greenland – 24 April 2016
The case study reported corresponds to the observation of a moderately light snowfall event over the central part of Greenland that occurred on 24 April 2016. ATMS overpass is between 14:51:23 and 14:57:47 UTC, while the CPR overpass is between 15:05:25 and 15:11:45 UTC, with a time difference of 14 min and 2 s. This event presents several characteristics typical of high latitudes, such as light snowfall rate, dry and cold atmospheric conditions, and the presence of a frozen background surface – a typical case of interest for the application of HANDEL-ATMS.
In Fig. 13 PESCA classification is reported. The entire territory of Greenland, except for a narrow area on the southwestern coast, is identified as a snow-covered surface: the PESCA identifies the Perennial Snow class in the central part of Greenland and along the CloudSat track and the Polar Winter Snow class near the northern shoreline. CloudSat passes over the central part of the island, and the CPR track is along the central part of the ATMS swath.
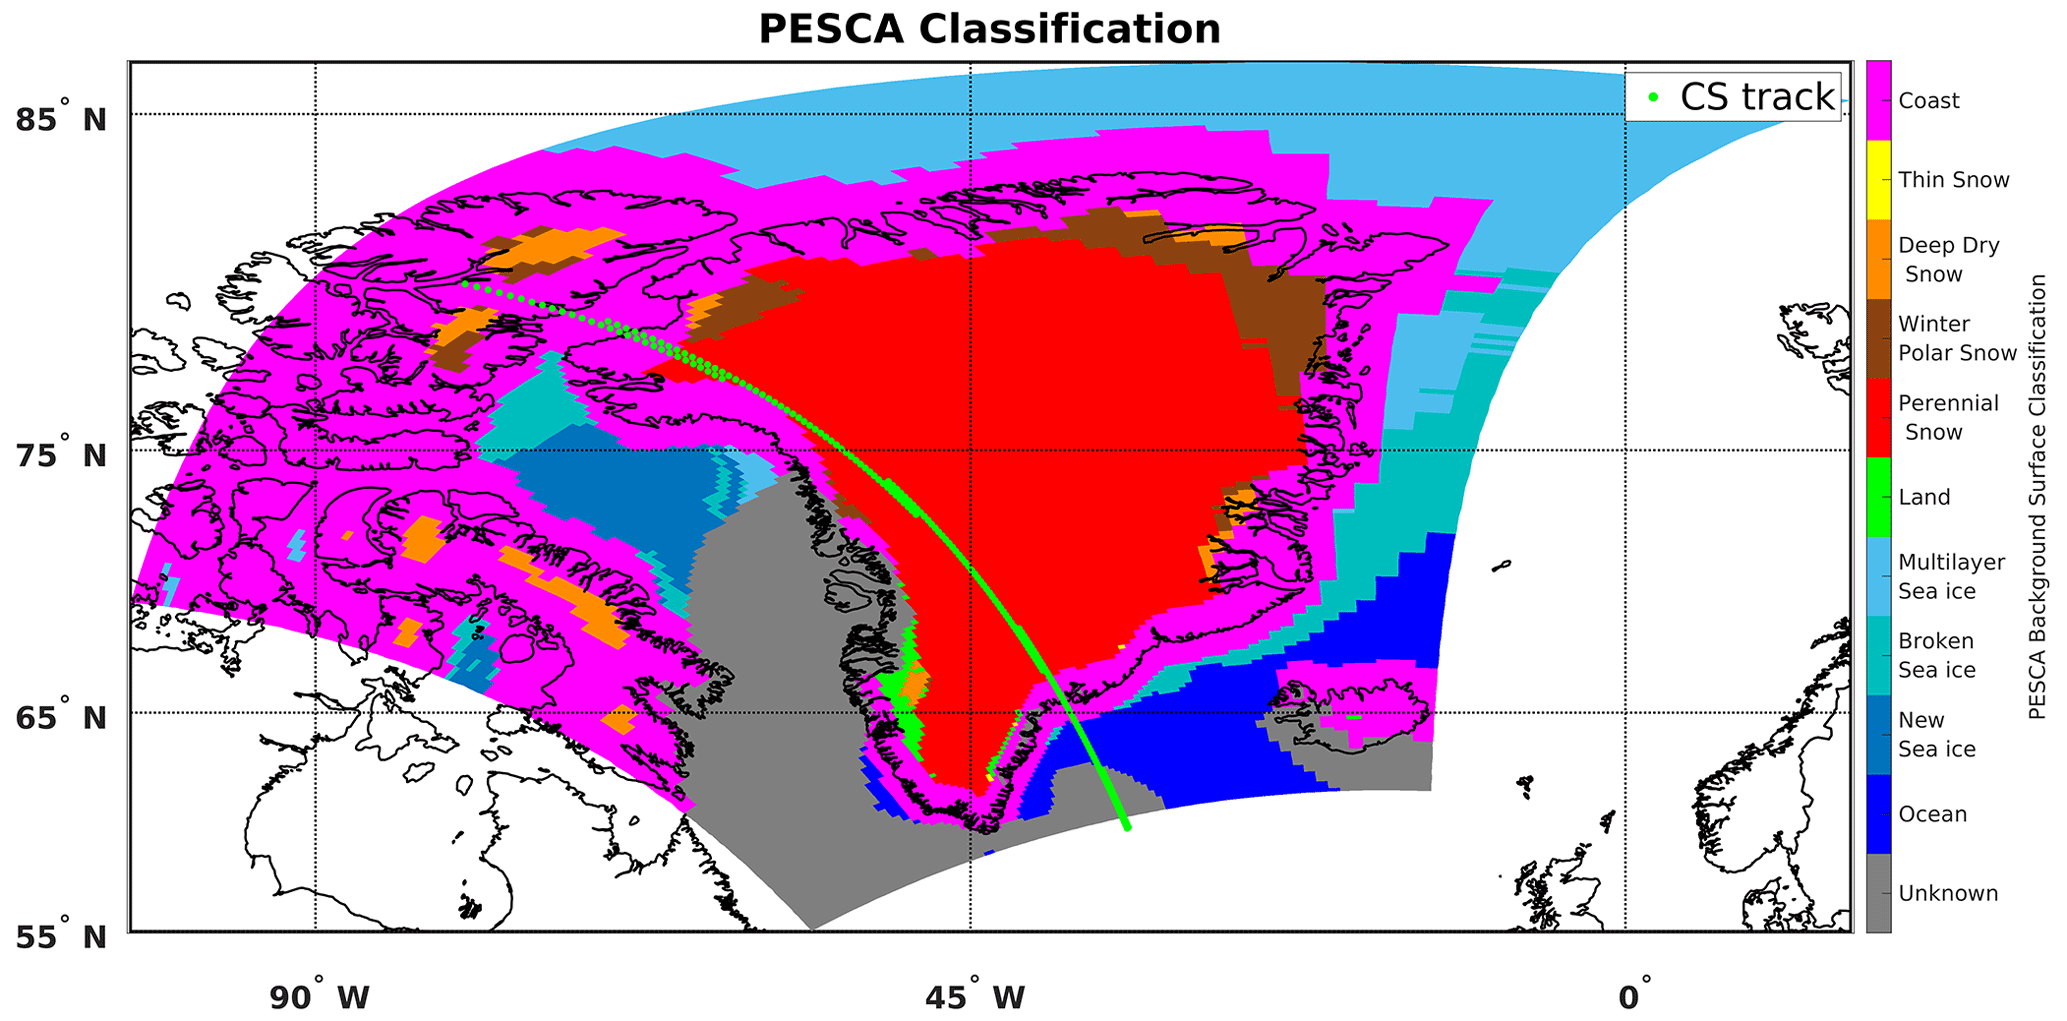
Figure 13Greenland, 24 April 2016. The ATMS overpass is between 14:54 and 14:58 UTC, while the CPR overpass is between 15:05 and 15:12 UTC. Map of the PESCA background surface classification. The dotted green line represents the CloudSat track.
In Fig. 14 a synopsis of the event along the CPR track is reported, showing T2 m and TPW; the 2CSP SWP and SSR values; and the cross-section of CPR reflectivity, with the DARDAR supercooled water information superimposed (in magenta). Moreover, the PESCA surface classification and the TBs of the main ATMS high-frequency channels along the CloudSat track are also shown. The event is characterized by dry conditions (TPW < 5 mm) and T2 m below 273 K, except over the coast. CPR observes a cloud system associated with the snowfall event between 68 and 76° N; DARDAR detects the presence of a supercooled water layer at the cloud top between 68 and 72° N and indicates the presence of supercooled droplets embedded in the deeper cloud associated with the more intense snowfall. According to the 2CSP product, a light shallow snowfall system is found in the inner part of the island, while deeper, more intense snowfall, with a peak of intensity between 72 and 76° N, is found near the shoreline. As far as the associated ATMS observations are concerned, an increase in the 88 and 165 GHz TBs is observed in correspondence with the supercooled water layer, while only a slight decrease in 165.5 and 183.31 ± 7 GHz TBs can be observed in coincidence with the snowfall intensity peak.
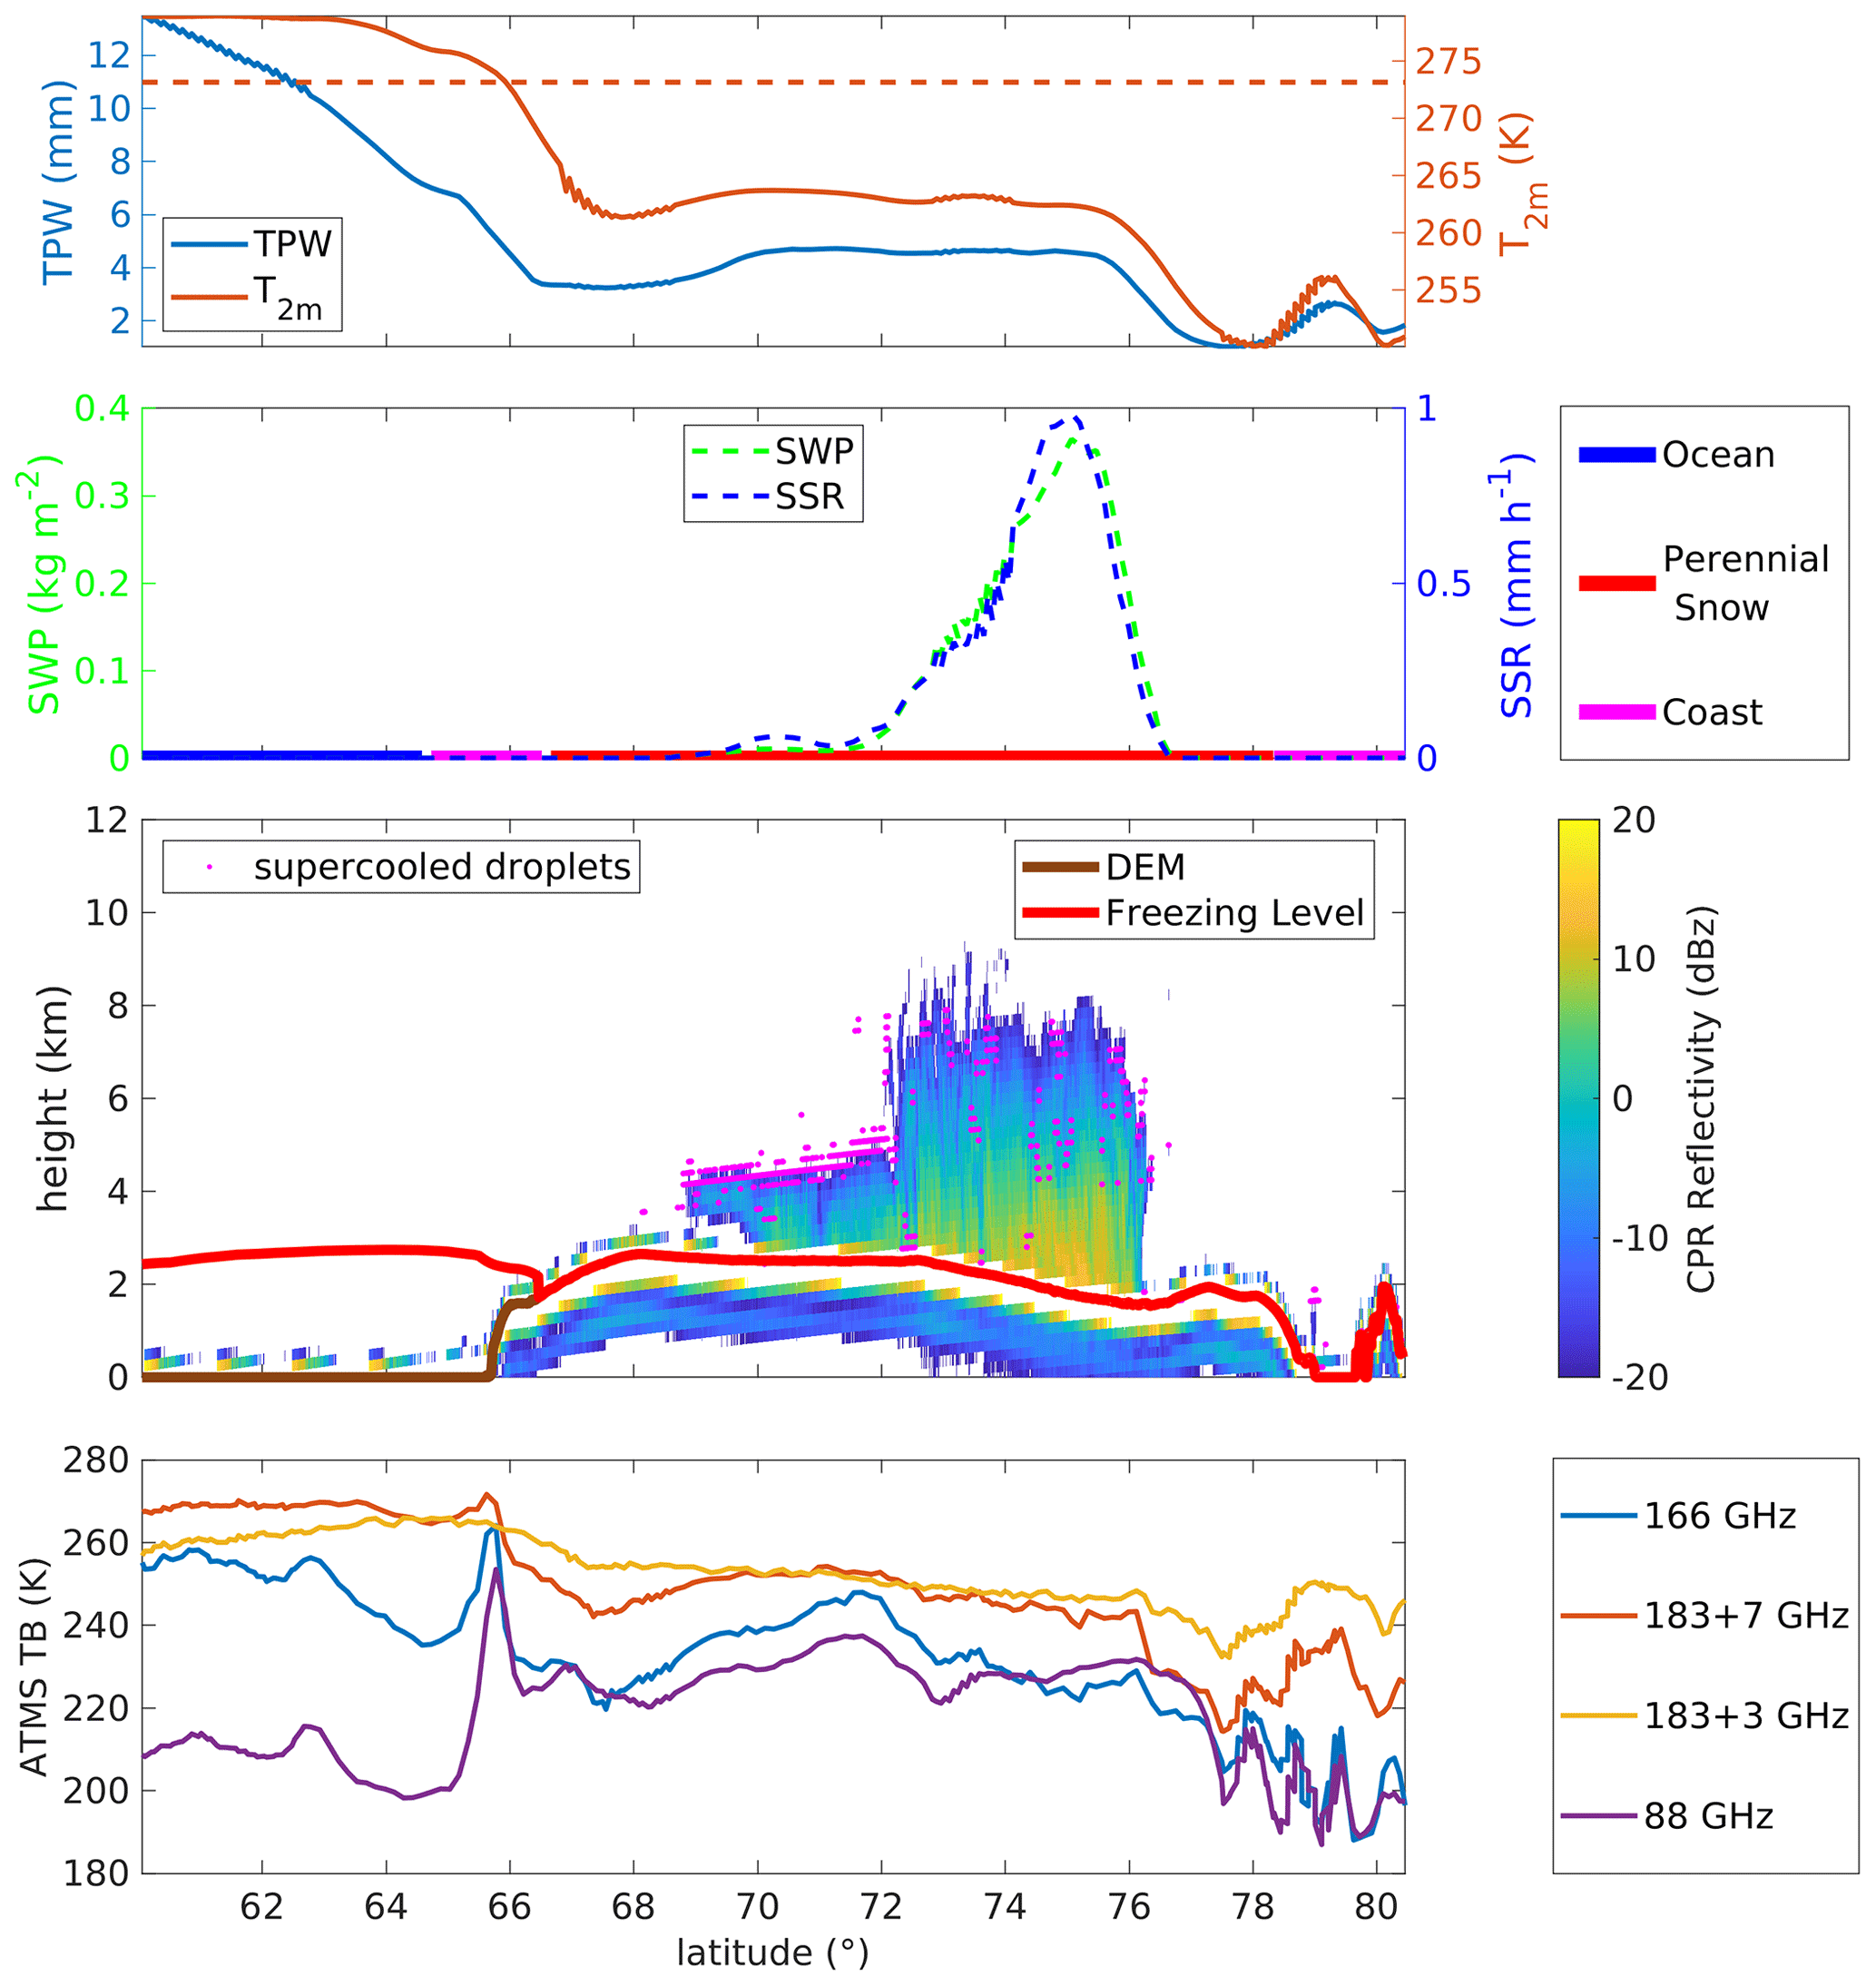
Figure 14Greenland, 24 April 2016. Synopsis along CloudSat Track. First row: ECMWF TPW and T2 m values along the CloudSat track. Second row: the 2CSP SWP (left) and SSR (right) and the PESCA classification along the CloudSat track. Third row: CPR reflectivity (values are reported in the color bar on the right) and supercooled water droplets detected by DARDAR (magenta points), digital elevation model (brown line) and the ECMWF freezing level (red line) along the CloudSat track. Bottom row: the ATMS TBs of the high-frequency channels (88, 166, 183 + 3, and 183 + 7 GHz) along the CloudSat track.
In Fig. 15 the maps of the TBobs at 165.5 GHz (top panel) and the ΔTBobs−sim at 165.5 GHz (bottom panel) are reported. In the top panel, it is possible to observe that, despite the snowfall event, there is not a clear TB scattering signal in the area where 2CSP detects snowfall (70–76° N, 40–70° W); instead, a slight increase in the TBs can be observed in the area where DARDAR detects the supercooled water layer at the cloud top. The map of ΔTBobs−sim shows an emission signal ( 0) over the central part of the ATMS swath due to the combined effect of the emission by the supercooled liquid water layers at the cloud top, as evidenced by DARDAR (evidently exceeding the scattering signal of the weak and shallow snowfall), over a radiatively cold surface background. Only near the shoreline, the observed TBs are slightly lower than the clear-sky simulated TBs ( 0) due to the stronger scattering signal of the deeper snowfall system. In Fig. 16 the results of the four HANDEL-ATMS modules are reported. It is worth noting that both detection modules find snowfall in the central region of Greenland and near the northern coast. The estimated snowfall intensity for this event is generally low (SWP < 0.1 kg m−2 and SSR < 0.1 mm h−1), except over the western coast, where SWP reaches 0.5 kg m−2 and SSR reaches 1 mm h−1. It is worth noting that HANDEL-ATMS also detects snowfall where there is an emission signal ( 0) and that discontinuities in snowfall retrievals are not observed in correspondence with surface class changes.
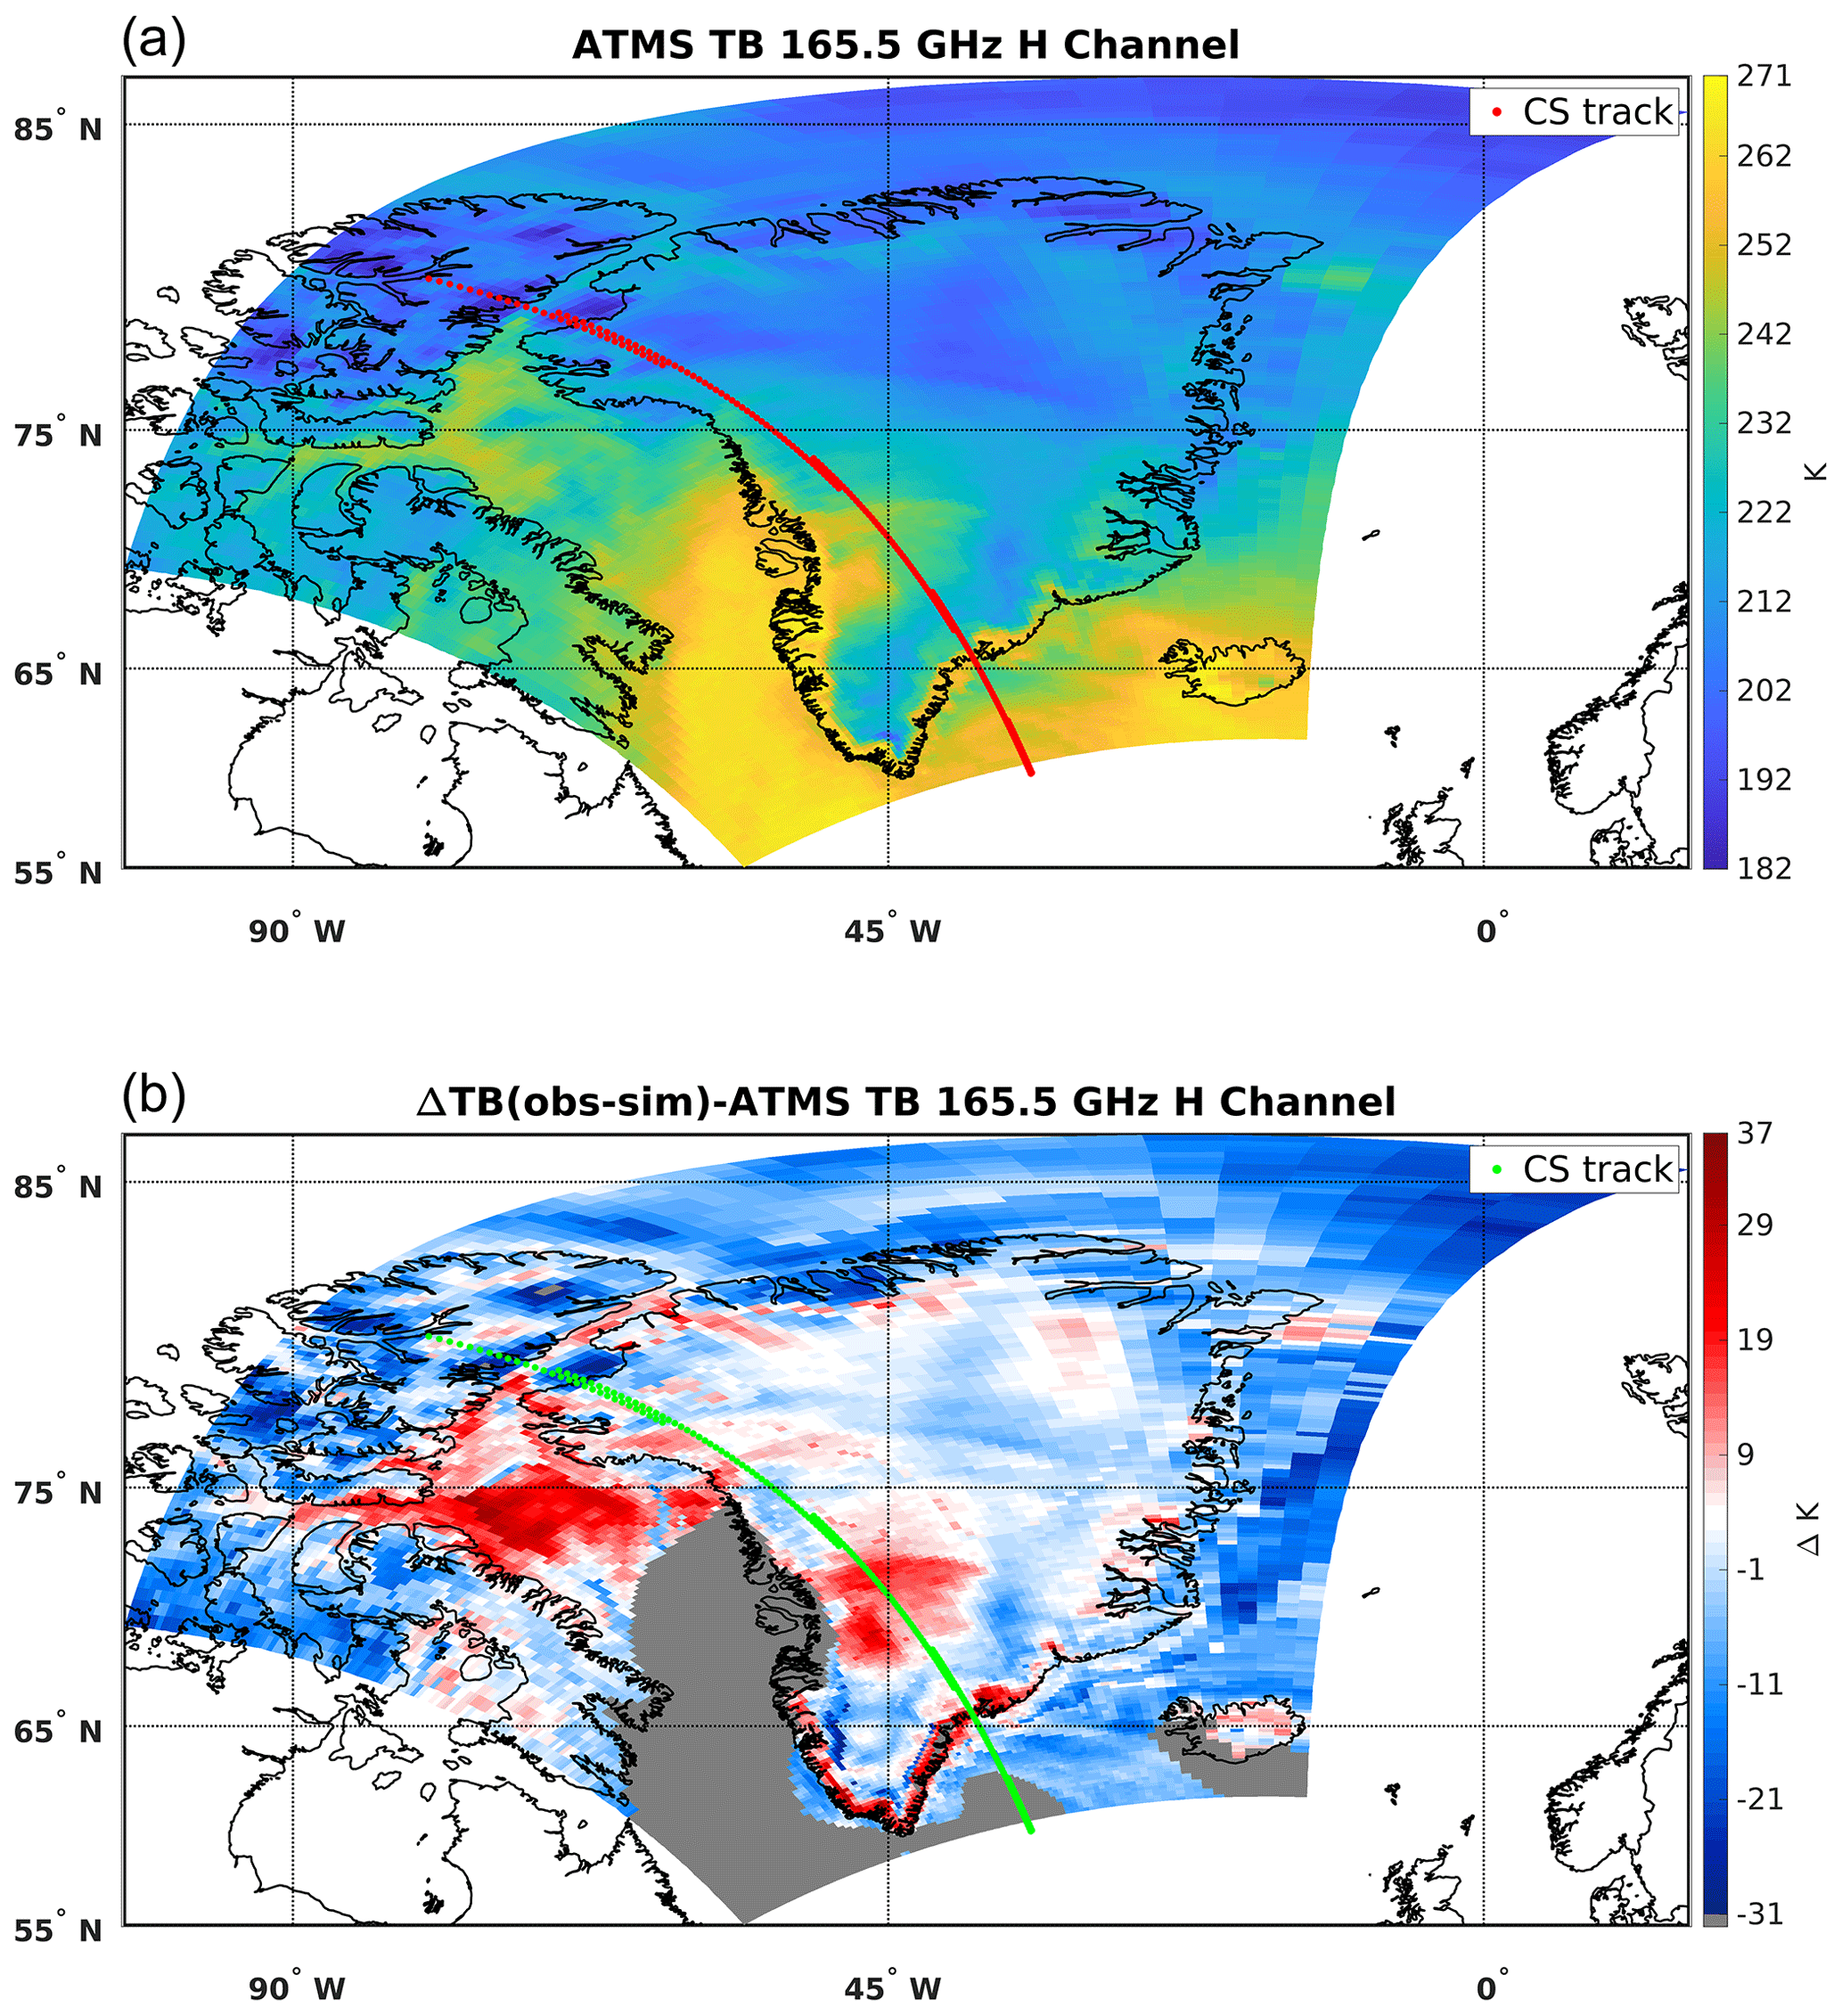
Figure 15Greenland, 24 April 2016. TB measured by the 165 GHz channel (TBobs) (a) and the deviation of TBobs from the simulated clear-sky TBs (ΔTBobs−sim) (b). The dotted red line (a) and the dotted green line (b) represent the CloudSat track.
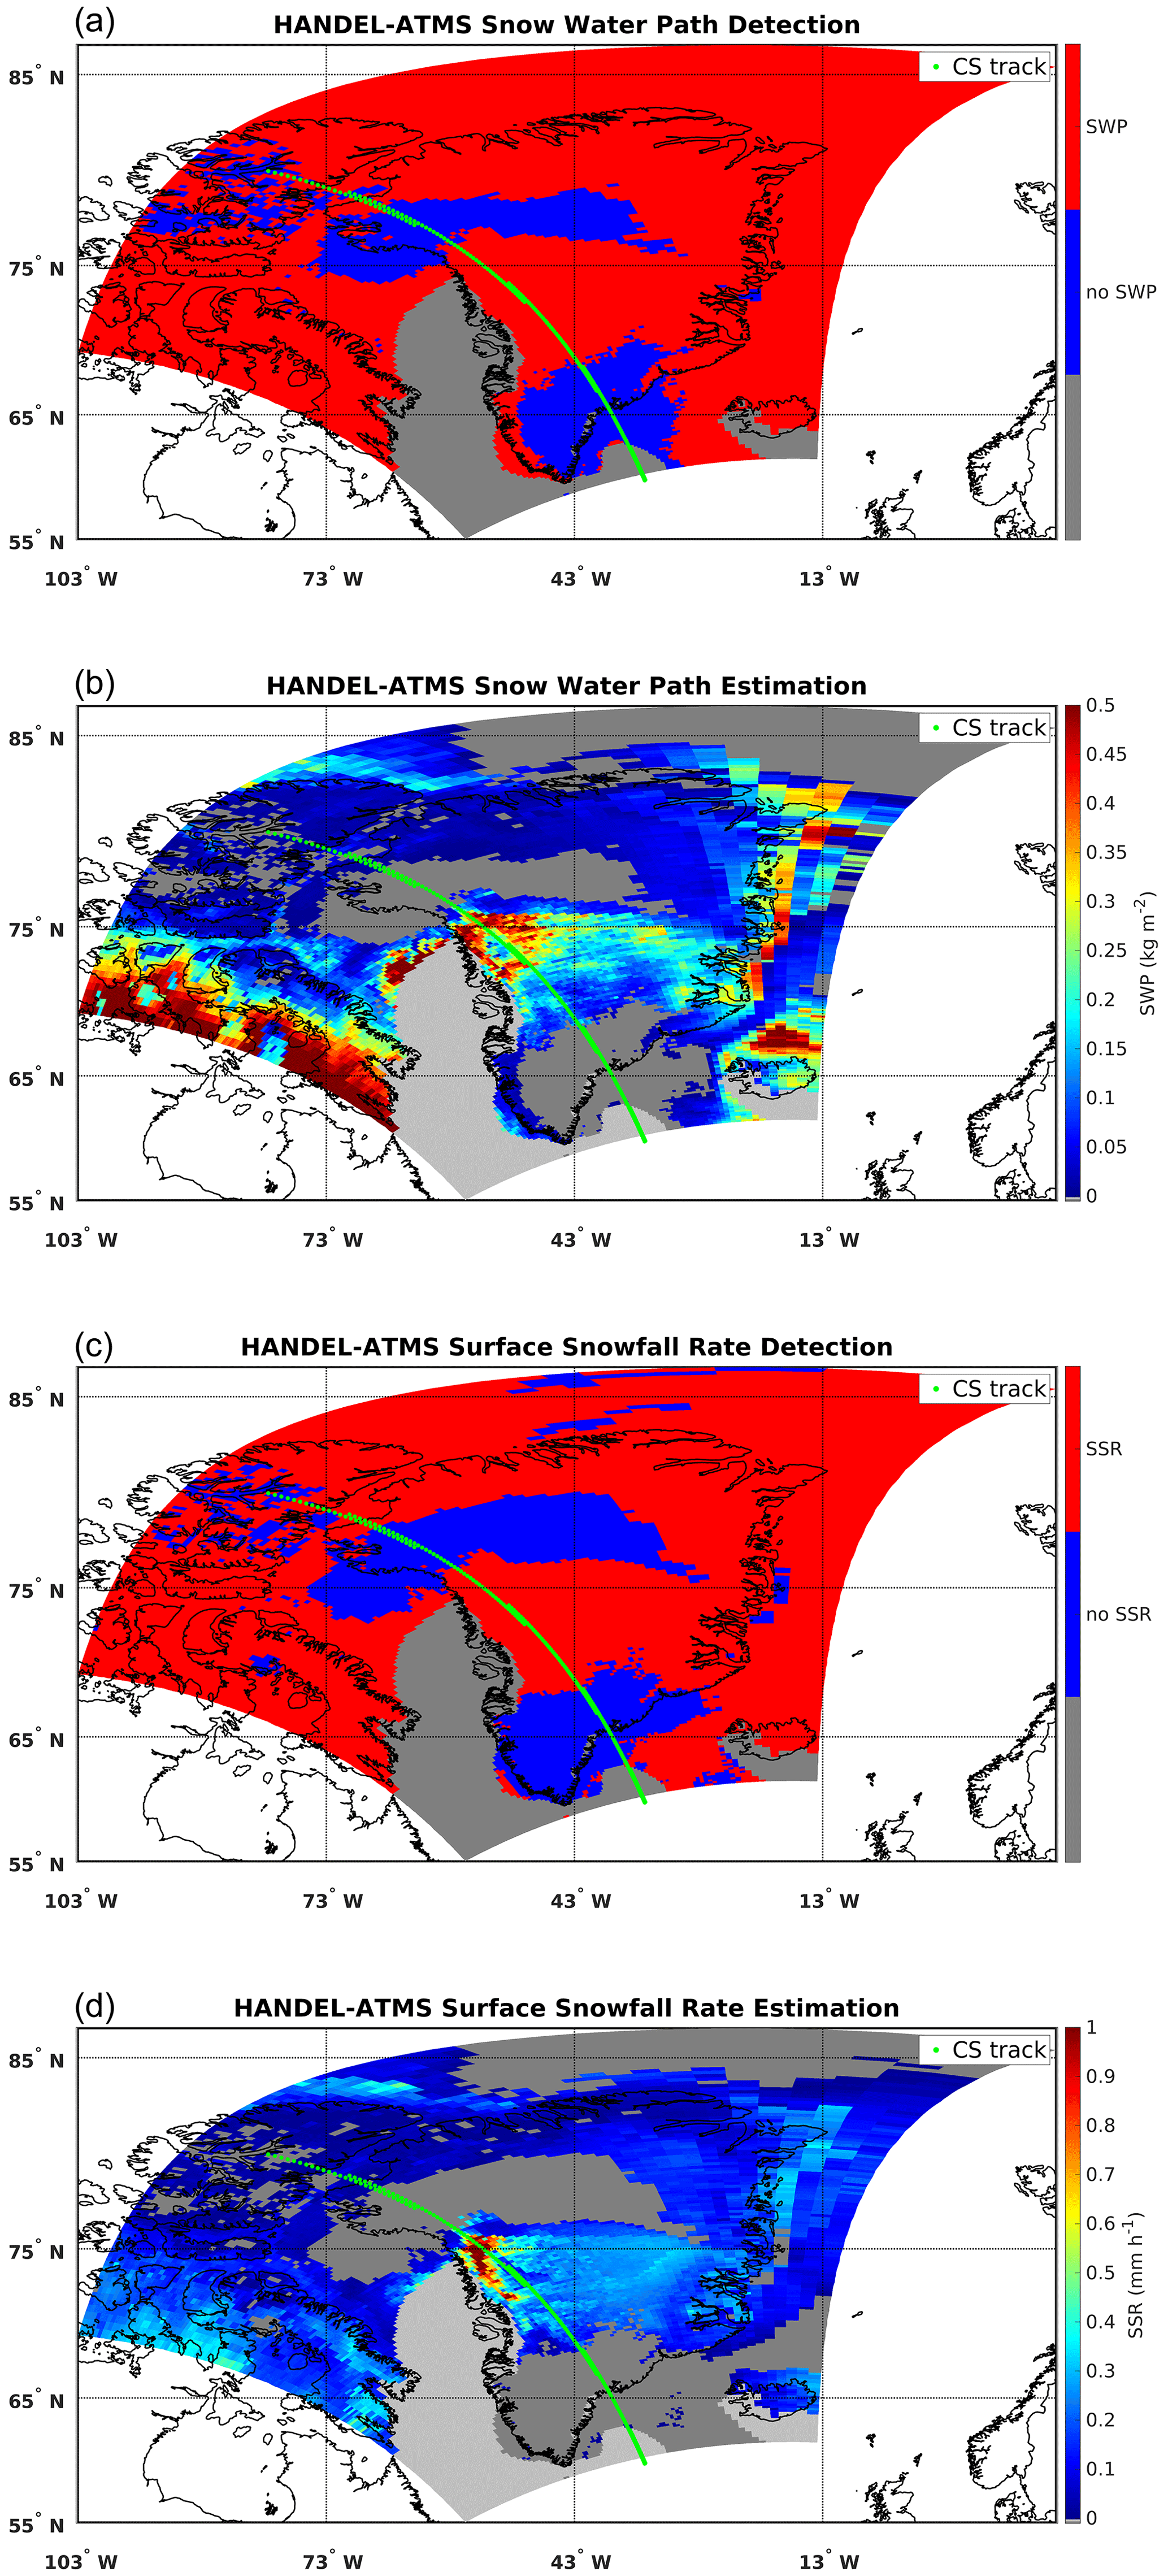
Figure 16Greenland, 24 April 2016. Maps of the HANDEL-ATMS module's output: the SWP detection mask (a), the estimated SWP (kg m−2) (b), the SSR detection mask (c), and the estimated SSR (mm h−1) (d). The dotted green lines represent the CloudSat track.
Finally, a comparison between HANDEL-ATMS and 2CSP is reported in Fig. 17. There is a substantial agreement on the snowfall detection of the two products. HANDEL-ATMS tends to overestimate very light SWP and SSR in the presence of the shallow system (2CSP SWP < 0.05 kg m−2 and SSR < 0. 1 mm h−1, between 68 and 72° N), consistently with what is shown in Fig. 10, while there is a good agreement between 72 and 76° N, where snowfall intensity increases.
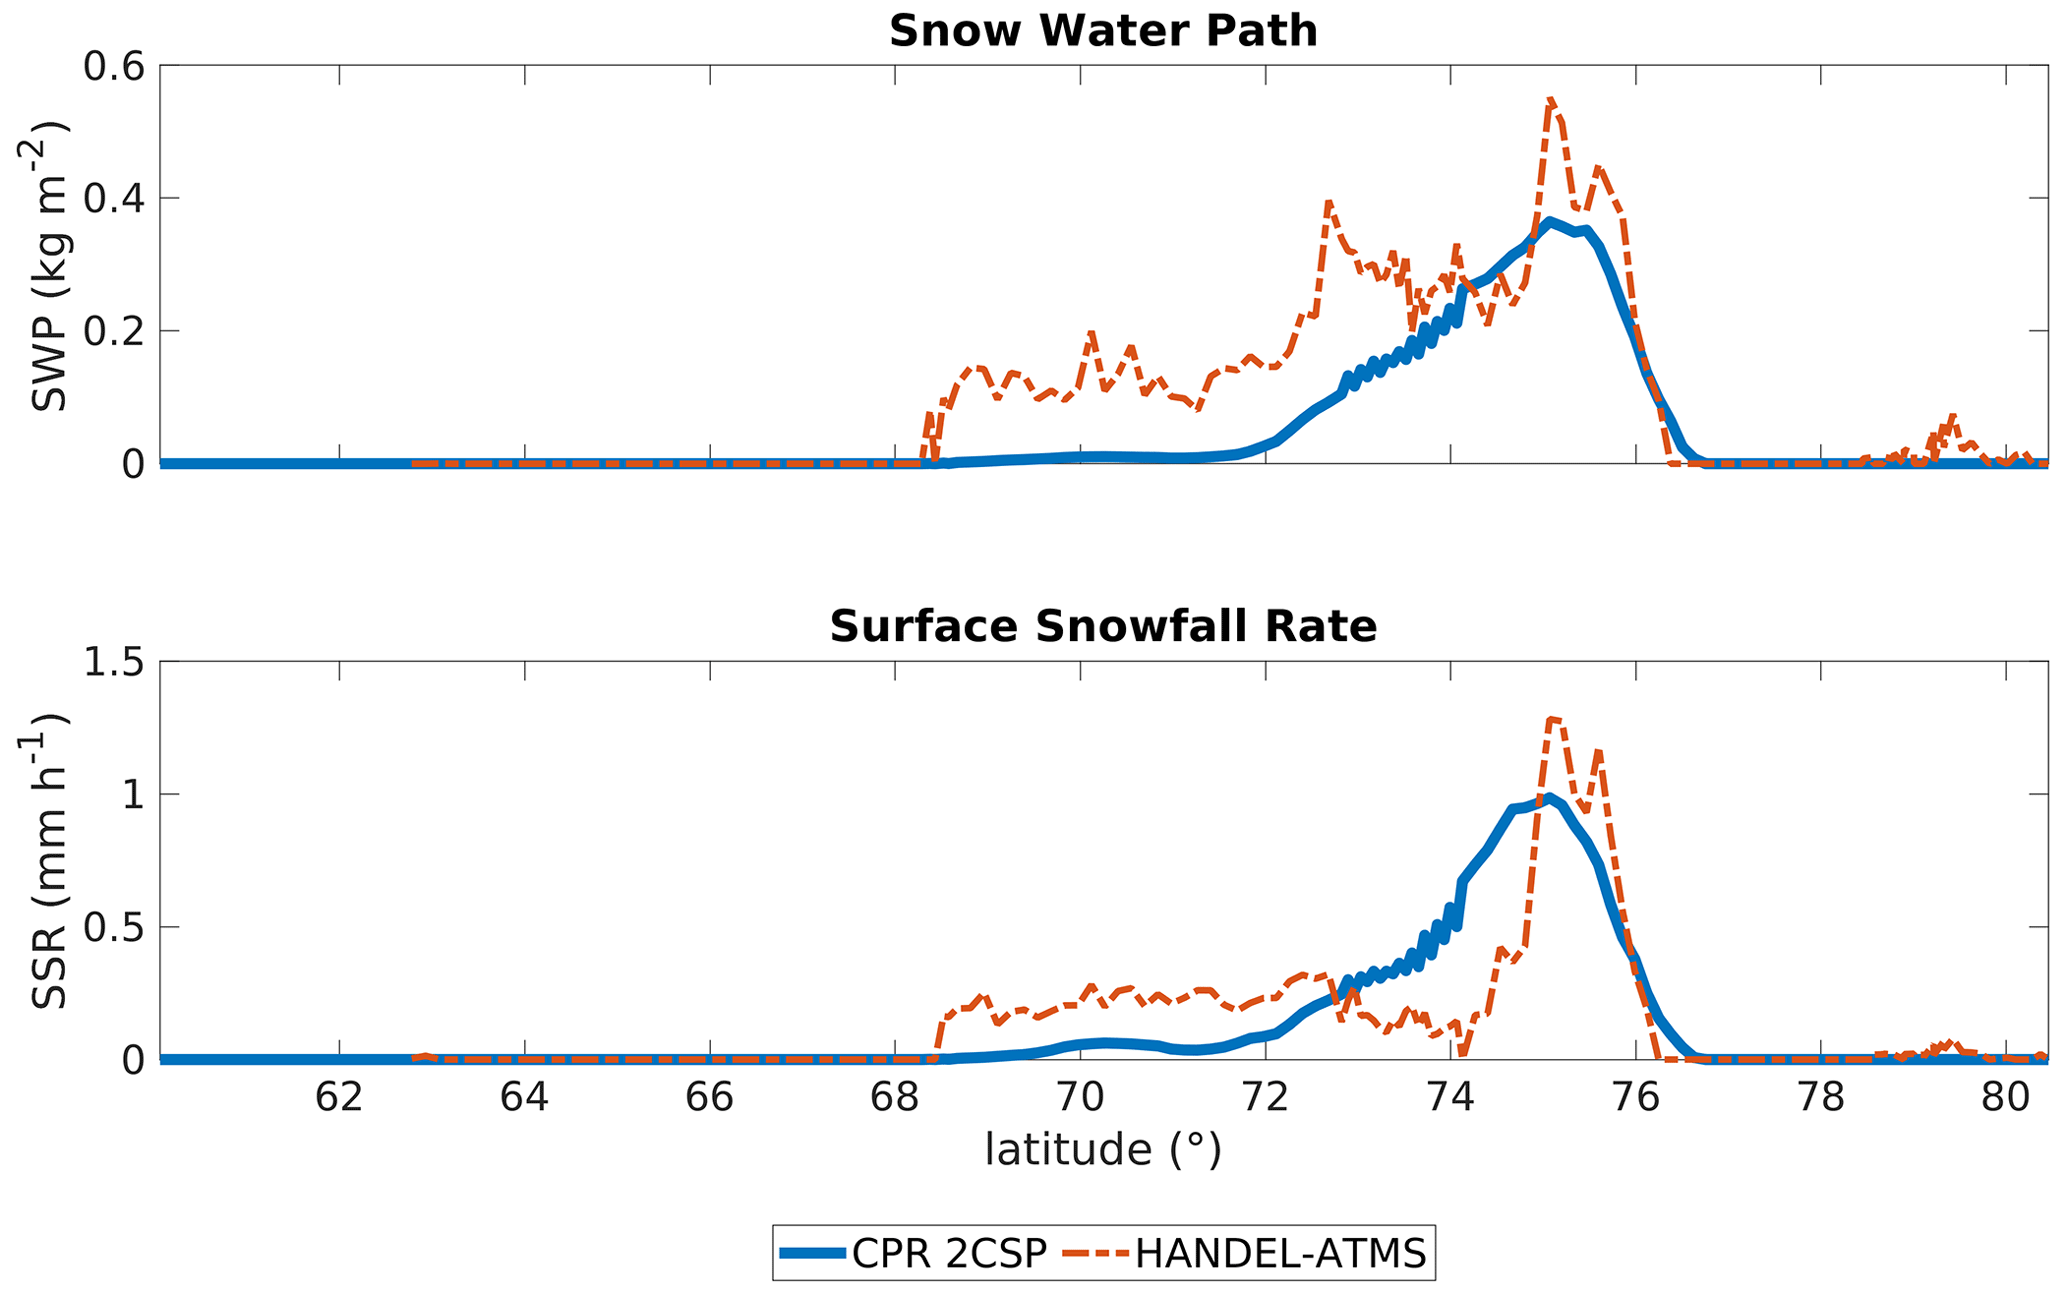
Figure 17Greenland, 24 April 2016. Comparison between CPR 2C-SNOW-PROFILE and HANDEL-ATMS SWP and SSR estimates along the CloudSat track.
The analysis of this case study demonstrates that the algorithm can interpret the ambiguity of the emission/scattering signal often associated with snowfall events at high latitudes (as described in Sect. 4.1) and efficiently detect (and, to a lesser extent, quantify) snowfall even in extremely cold and dry conditions.
4.3 Comparison with SLALOM-CT
Recently, several MW-based snowfall retrieval algorithms have been developed, but HANDEL-ATMS is the only one tailored for high-latitude regions. Algorithms developed for the GMI on board GPM-CO, based on machine learning techniques and on the use of CPR 2CSP as a reference (e.g., Rysman et al., 2018, 2019), do not retrieve snowfall at high latitudes; therefore, a direct comparison with HANDEL-ATMS can not be carried out. Other snowfall retrieval algorithms based on ATMS observations (e.g., Kongoli et al., 2015; Meng et al., 2017) are trained over specific geographical areas (the continental US region) and are not representative of the extreme, high-latitude environmental conditions; therefore, a comparison with HANDEL-ATMS could be not very significant. In another study by You et al. (2022), a retrieval algorithm for ATMS, trained using the CPR 2CSP product and based on logistic regression methods, provides snowfall retrieval only over specific background surfaces: ocean, sea ice, and coastal areas. However, it is interesting to observe a qualitative consistency with HANDEL-ATMS. The two algorithms show higher statistical scores over open water (ocean) with respect to sea ice or coast and better detection capabilities in the presence of higher SWP/SSR values. A quantitative comparison between SLALOM-CT and HANDEL-ATMS is presented below, since both algorithms are based on a machine learning approach and are trained using a global ATMS-CPR coincidence dataset.
SLALOM-CT was introduced in Sect. 1. It presents some similarities with HANDEL-ATMS: it is based on an ANN approach and uses the CPR 2CSP product as a reference. On the other hand, substantial differences have to be highlighted: SLALOM-CT was designed to operate on a global scale, while HANDEL-ATMS has been developed specifically for the environmental conditions typical of high latitudes. Moreover, the predictor sets are different: in addition to TB observations, SLALOM-CT relies on several model-derived environmental parameters, while HANDEL-ATMS relies on differences between simulated clear-sky TBs, based on the dynamic estimation of the background surface emissivity (i.e., at the time of the satellite overpass) and observed TBs (ΔTBobs−sim), as described in Sect. 3.
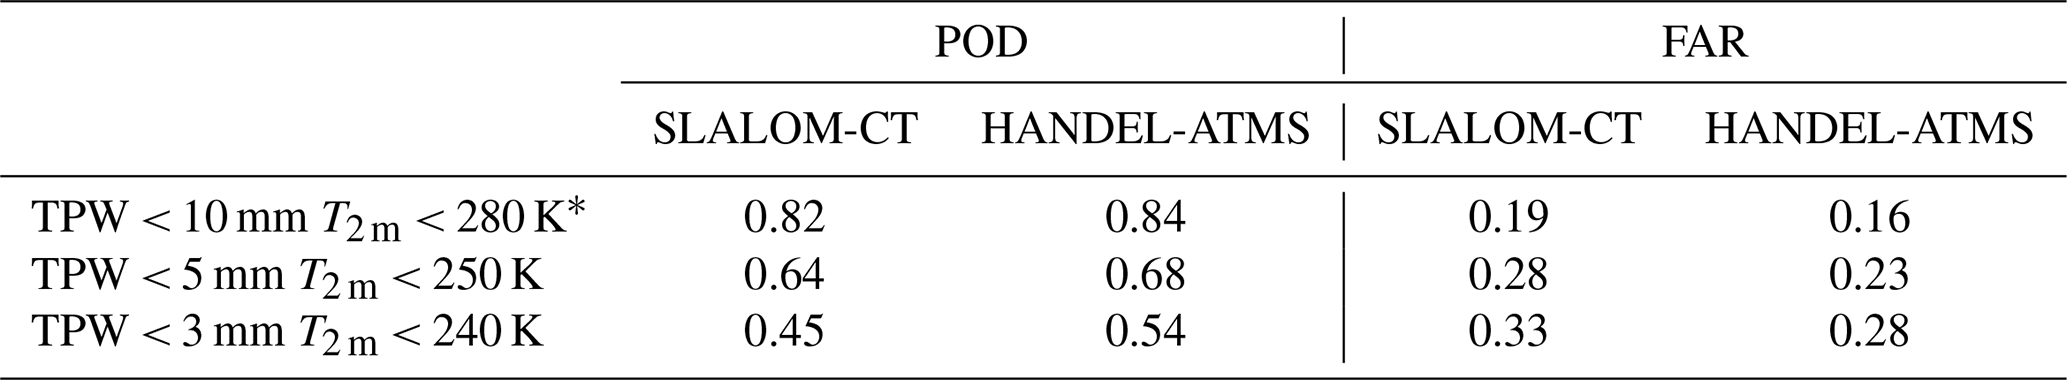
In Table 7 a comparison between the statistical scores of the detection performances of the two algorithms is reported for different environmental conditions. The comparison has been carried out considering the same elements of the ATMS-CPR coincidence dataset. It can be observed that the differences between the two algorithm performances increase as the environmental conditions become more extreme (i.e., lower T2 m and TPW), with consistently better snowfall detection capabilities of HANDEL-ATMS than SLALOM-CT. Considering the working limits of HANDEL-ATMS, POD increases by 2 %, and FAR decreases by 8 %, while for very cold/dry conditions (T2 m< 250 K, TPW < 5 mm), POD increases by 7 %, and FAR decreases by 16 %. For extremely dry/cold conditions (T2 m< 240 K, TPW < 3 mm), typical of the inner part of Greenland and Antarctica, POD increases by 18 %, and FAR decreases by 16 %.
Table 7Comparison between HANDEL-ATMS and SLALOM-CT detection performances for different environmental conditions (* HANDEL-ATMS working limits).
In this paper, a new snowfall retrieval algorithm, the High lAtitude sNow Detection and Estimation aLgorithm for ATMS (HANDEL-ATMS), is described. The algorithm is based on machine learning techniques trained with the CPR 2CSP snowfall product, and it is designed specifically for the cold and dry environmental conditions typical of high-latitude regions. The driving and innovative principle in the algorithm development is the exploitation of the full range of ATMS channel frequencies to characterize the background surface radiative properties at the time of the overpass to be able to better isolate and interpret the snowfall-related contribution to the measured multichannel upwelling radiation. A similar approach has been used by Zhao and Weng (2002); however, their application was limited to non-scattering surfaces and was based on empirical relationships. This approach is proven to be effective for snowfall detection and quantification at high latitudes, particularly in the presence of a frozen (snow-covered land or sea ice) background surface, also compared to other state-of-the-art machine-learning-based methods.
HANDEL-ATMS can detect snowfall at high latitudes in good agreement with CPR. The estimation modules tend to slightly overestimate the intensity of light snowfall events (SWP kg m−2), with mean relative bias < 5 % for SSR < 0.1 mm h−1, but they shows good accuracy for more intense snowfall events (SWP kg m−2, SWP < 1 kg m−2). It is worth noting, however, that the uncertainty associated with the surface emissivity estimation in some conditions affects the capabilities of HANDEL-ATMS to correctly interpret the snowfall signature. Such uncertainty propagates in the RTM simulation of clear-sky TBs used as input in the algorithm. Despite these limitations, it is worth noting that the development of an algorithm capable of retrieving snowfall at high latitudes with good accuracy is an important development in the climate science field. The possibility to exploit the high temporal sampling of the near-polar operational satellites carrying ATMS radiometers allows us to achieve full coverage of the polar regions. Moreover, the future European MetOp Second Generation (MetOp-SG) mission, with the launch of the Sat-A Microwave Sounder (MWS), with characteristics very similar to ATMS, will soon provide additional coverage to improve global snowfall monitoring. HANDEL-ATMS methodology will be adapted to be able to exploit MWS measurements in the future. The capability to estimate snowfall at high temporal resolution is ancillary to the development of a snowfall monitoring system for the high latitudes and to the analysis of the snowfall climatology in these areas, with possible applications in climate change studies in the polar regions.
Future research will address some open issues. The estimation of the surface emissivity and the simulated clear-sky multichannel TBs needs to be further improved, either by considering other predictor sets or by using a different technique for the emissivity spectra definition including a more advanced RTM. Another important aspect is the quantification of the error linked to the background surface emissivity estimation on the snowfall detection capabilities. This would also be useful for the development of modules for mountainous areas, which have not been considered in the current version of the algorithm. Moreover, the effect on the algorithm snowfall detection capabilities of the uncertainties linked to the model-derived environmental variables (e.g., temperature and water vapor profile), which are used in the clear-sky TB simulations, should be investigated. The use of the ATMS water vapor (183 GHz band) and temperature (50 GHz band) sounding channels to characterize the atmospheric conditions at the time of the overpass in order to complement or avoid the use of model-derived data is another subject of future research. Moreover, the development of a separate supercooled liquid water detection module will be also evaluated, similarly to what is done in other PMW snowfall detection and estimation algorithms (Rysman et al., 2018; Sanò et al., 2022). Such information can be exploited to improve snowfall detection and estimation capabilities, since the emission by the cloud droplets in dry conditions tends to mask the snowfall scattering signal (Panegrossi et al., 2017, 2022) and adds larger uncertainties in the CPR snowfall products used as a reference (Battaglia and Panegrossi, 2020). Moreover, recent studies have highlighted that TBs correlate more strongly with lagged surface precipitation (with a time lag of 30–60 min for snowfall) than the simultaneous precipitation rate (You et al., 2019). Therefore, an analysis based on a coincident dataset characterized by different time lags will be conducted. The results of this analysis will be compared with HANDEL-ATMS performances in order to identify a way to exploit this information towards the improvement of SSR detection and estimation. Finally, since the algorithm has been developed only for specific environmental conditions typical mostly of high latitudes, an integration with other approaches, such as that of the SLALOM-CT, designed for global estimation of snowfall, could be considered in the future to improve global snowfall monitoring based on ATMS and on future cross-track scanning radiometers.
ATMS data are provided by the NOAA CLASS facility, https://www.avl.class.noaa.gov/ (NOAA, 2023); CPR data are distributed by the CloudSat Data Processing Center, https://www.cloudsat.cira.colostate.edu/ (CloudSat DPC, 2023); DARDAR data are available from the ICARE FTP server at ftp://ftp.icare.univ-lille1.fr (University of Lille, 2023, registration required); and ECMWF operational forecasts are distributed by ECMWF through the MARS facility via the ECGATE cluster. AutoSnow data are provided at https://satepsanone.nesdis.noaa.gov/northern_hemisphere_multisensor.html (NOAA Satellite and Information Service, 2023).
Conceptualization: AC, PS, and DC. Methodology: AC, PS, and DC. Software, validation, and formal analysis: AC. Investigation: AC, PS, DC, and GP. Data curation: AC and DC. Writing (original draft preparation): AC. Writing (review and editing): AC, PS, DC, and GP. Visualization: AC. Supervision, project administration, and funding acquisition: GP. All authors have read and agreed to the published version of the paper.
The contact author has declared that none of the authors has any competing interests.
The funders had no role in the design of the study; in the collection, analyses, or interpretation of data; in the writing of the paper; or in the decision to publish the results.
Publisher's note: Copernicus Publications remains neutral with regard to jurisdictional claims made in the text, published maps, institutional affiliations, or any other geographical representation in this paper. While Copernicus Publications makes every effort to include appropriate place names, the final responsibility lies with the authors.
This work was carried out under the Raincast study (ESA contract no. 4000125959/18/NL/NA) and by the EUMETSAT Operational Hydrology and Water Management Satellite Application Facility (H SAF) third and fourth Continuous Development and Operations Phases (CDOP-3 and CDOP-4). Andrea Camplani was supported by the PhD program in Infrastructures, Transport Systems, and Geomatics at the Department of Civil, Constructional, and Environmental Engineering at Sapienza University of Rome. The authors would like to thank EUMETSAT and the NASA Precipitation Measurement Mission (PMM) research program for supporting scientific collaborations between H SAF, GPM, and the PMM Science Team. The authors wish to express their sincere gratitude to Joe Turk (NASA JPL) and Alessandro Battaglia, who are warmly acknowledged for useful interactions and discussions during the algorithm development and validation, and to Mattia Crespi for the scientific support to Andrea Camplani during the PhD program.
This work was carried out under the Raincast study (ESA contract no. 4000125959/18/NL/NA) and by the EUMETSAT Operational Hydrology and Water Management Satellite Application Facility (H SAF) third and fourth Continuous Development and Operations Phases (CDOP-3 and CDOP-4). Andrea Camplani was supported by the PhD program in Infrastructures, Transport Systems, and Geomatics at the Department of Civil, Constructional, and Environmental Engineering at Sapienza University of Rome.
This paper was edited by S. Joseph Munchak and reviewed by four anonymous referees.
Battaglia, A. and Delanoë, J.: Synergies and complementarities of CloudSat-CALIPSO snow observations, J. Geophys. Res.-Atmos., 118, 721–731, https://doi.org/10.1029/2012JD018092, 2013.
Battaglia, A. and Panegrossi, G.: What can we learn from the CloudSat radiometric mode observations of snowfall over the ice-free ocean?, Remote Remote Sensing, 12, 3285, https://doi.org/10.3390/rs12203285, 2020.
Behrangi, A., Christensen, M., Richardson, M., Lebsock, M., Stephens, G., Huffman, G. J., Bolvin, D., Adler, R. F., Gardner, A., Lambrigtsten, B., and Fetzer, E.: Status of high-latitude precipitation estimates from observations and reanalyses, J. Geophys. Res.-Atmos., 121, 4468–4486, https://doi.org/10.1002/2015JD024546, 2016.
Bintanja, R. and Selten, F.: Future increases in Arctic precipitation linked to local evaporation and sea-ice retreat, Nature, 509, 479–482, https://doi.org/10.1038/nature13259, 2014.
Camplani, A., Casella, D., Sanò, P., and Panegrossi, G.: The Passive microwave Empirical cold Surface Classification Algorithm (PESCA): Application to GMI and ATMS, J. Hydrometeorol., 22, 1727–1744, https://doi.org/10.1175/JHM-D-20-0260.1, 2021.
Casella, D., Panegrossi, G., Sanò, P., Marra, A. C., Dietrich, S., Johnson, B. T., and Kulie, M. S.: Evaluation of the GPM-DPR snowfall detection capability: Comparison with CloudSat-CPR, Atmos. Res., 197, 64–75, https://doi.org/10.1016/j.atmosres.2017.06.018, 2017.
Ceccaldi, M., Delanoë, J., Hogan, R. J., Pounder, N. L., Protat, A., and Pelon, J.: From CloudSat-CALIPSO to EarthCare: Evolution of the DARDAR cloud classification and its comparison to airborne radar-lidar observations, J. Geophys. Res.-Atmos., 118, 7962–7981, https://doi.org/10.1002/jgrd.50579, 2013.
Clifford, D.: Global estimates of snow water equivalent from passive microwave instruments: history, challenges and future developments, Int. J. Remote Sens., 31, 3707–3726, https://doi.org/10.1080/01431161.2010.483482, 2010.
CloudSat Data Processing Center (DPC): CPR data, CloudSat DPC, Colorado State University, https://www.cloudsat.cira.colostate.edu/ (last access: 4 April 2023.
Comiso, J. C.: Sea ice effective microwave emissivities from satellite passive microwave and infrared observations, J. Geophys. Res.-Oceans, 88, 7686–7704, https://doi.org/10.1029/JC088iC12p07686, 1983.
Cordisco, E., Prigent, C., and Aires, F.: Snow characterization at a global scale with passive microwave satellite observations, J. Geophys. Res.-Atmos., 111, D19102, https://doi.org/10.1029/2005JD006773, 2006.
DARDAR: Retrieve cloud properties by combining the CloudSat radar and the CALIPSO lidar measurements, CNS-CNRS-Universiteé de Lille, https://www.icare.univ-lille.fr/dardar/, last access: 4 April 2023.
Delanoë, J. and Hogan, R. J.: Combined CloudSat-CALIPSO-MODIS retrievals of the properties of ice clouds, J. Geophys. Res., 115, D00H29, https://doi.org/10.1029/2009JD012346, 2010.
Edel, L., Rysman, J.-F., Claud, C., Palerme, C., and Genthon, C.: Potential of Passive Microwave around 183 GHz for Snowfall Detection in the Arctic, Remote Sens.-Basel, 11, 2200, https://doi.org/10.3390/rs11192200, 2019.
Fausett, L. V.: Fundamentals of neural networks: architectures, algorithms and applications, Pearson Education India, ISBN-13: 978-0133341867, 1994.
Felde, G. W. and Pickle, J. D.: Retrieval of 91 and 150 GHz Earth surface emissivities, J. Geophys. Res.-Atmos., 100, 20855–20866, https://doi.org/10.1029/95JD02221, 1995.
Gareth, J., Daniela, W., Trevor, H., and Robert, T.: An introduction to statistical learning: with applications in R, Spinger, ISBN-13:978-1461471370, 2013.
Grody, N. C. and Basist, A. N.: Global identification of snowcover using SSM/I measurements, IEEE T. Geosci. Remote, 34, 237–249, https://doi.org/10.1109/36.481908, 1996.
Hastie, T., Tibshirani, R., Friedman, J. H., and Friedman, J. H.: The elements of statistical learning: data mining, inference, and prediction, Springer, New York, Vol. 2, 1–758, https://doi.org/10.1007/b94608, 2009.
Hewison, T. J. and English, S. J.: Airborne retrievals of snow and ice surface emissivity at millimeter wavelengths, IEEE T. Geosci. Remote, 37, 1871–1879, https://doi.org/10.1109/36.774700, 1999.
Kidd, C. and Huffman, G.: Global precipitation measurement, Meteorol. Appl., 18, 334–353, https://doi.org/10.1002/met.284, 2011.
Kidd, C., Becker, A., Huffman, G. J., Muller, C. L., Joe, P., Skofronick-Jackson, G., and Kirschbaum, D. B.: So, how much of the Earth's surface is covered by rain gauges?, B. Am. Meteorol. Soc., 98, 69–78, https://doi.org/10.1175/BAMS-D-14-00283.1, 2017.
Kim, M. J., Weinman, J. A., Olson, W. S., Chang, D. E., Skofronick-Jackson, G., and Wang, J. R.: A physical model to estimate snowfall over land using AMSU-B observations, J. Geophys. Res.-Atmos., 113, D09201, https://doi.org/10.1029/2007JD008589, 2008.
Kohonen, T.: Self-organization and associative memory, Springer Science and Business Media, Vol. 8, https://doi.org/10.1007/978-3-642-88163-3, 2012.
Kongoli, C., Pellegrino, P., Ferraro, R. R., Grody, N. C., and Meng, H.: A new snowfall detection algorithm over land using measurements from the Advanced Microwave Sounding Unit (AMSU), Geophys. Res. Lett., 30, 1756, https://doi.org/10.1029/2003GL017177, 2003.
Kongoli, C., Meng, H., Dong, J., and Ferraro, R.: A snowfall detection algorithm over land utilizing high-frequency passive microwave measurements–Application to ATMS, J. Geophys. Res.-Atmos., 120, 1918–1932, https://doi.org/10.1002/2014JD022427, 2015.
Kongoli, C., Meng, H., Dong, J., and Ferraro, R.: A hybrid snowfall detection method from satellite passive microwave measurements and global forecast weather models, Q. J. Roy. Meteor. Soc., 144, 120–132, https://doi.org/10.1002/qj.3270, 2018.
Kulie, M. S., Bennartz, R., Greenwald, T. J., Chen, Y., and Weng, F.: Uncertainties in microwave properties of frozen precipitation: Implications for remote sensing and data assimilation, J. Atmos. Sci., 67, 3471–3487, https://doi.org/10.1175/2010JAS3520.1, 2010.
Kulie, M. S., Milani, L., Wood, N. B., Tushaus, S. A., Bennartz, R., and L'Ecuyer, T. S.: A shallow cumuliform snowfall census using spaceborne radar, J. Hydrometeorol., 17, 1261–1279, https://doi.org/10.1175/JHM-D-15-0123.1, 2016.
Levizzani, V., Laviola, S., and Cattani, E.: Detection and measurement of snowfall from space, Remote Sens.-Basel, 3, 145–166, https://doi.org/10.3390/rs3010145, 2011.
Liu, G. and Seo, E. K.: Detecting snowfall over land by satellite high-frequency microwave observations: The lack of scattering signature and a statistical approach, J. Geophys. Res.-Atmos., 118, 1376–1387, https://doi.org/10.1002/jgrd.50172, 2013.
Liu, J., Curry, J. A., Wang, H., Song, M., and Horton, R. M.: Impact of declining Arctic sea ice on winter snowfall, P. Natl. Acad. Sci. USA, 109, 4074–4079, https://doi.org/10.1073/pnas.1114910109, 2012.
Liu, Y., Key, J. R., Liu, Z., Wang, X., and Vavrus, S. J.: A cloudier Arctic expected with diminishing sea ice, Geophys. Res. Lett., 39, L05705, https://doi.org/10.1029/2012GL051251, 2012.
Mathew, N., Heygster, G., Melsheimer, C., and Kaleschke, L.: Surface emissivity of Arctic sea ice at AMSU window frequencies, IEEE T. Geosci. Remote, 46, 2298–2306, https://doi.org/10.1109/TGRS.2008.916630, 2008.
Mätzler, C. and Hüppi, R.: Review of signature studies for microwave remote sensing of snowpacks, Adv. Space Res., 9, 253–265, https://doi.org/10.1016/0273-1177(89)90493-6, 1989.
Meng, H., Dong, J., Ferraro, R., Yan, B., Zhao, L., Kongoli, C., Wang, N., and Zavodsky, B.: A 1DVAR-based snowfall rate retrieval algorithm for passive microwave radiometers, J. Geophys. Res.-Atmos., 122, 6520–6540, https://doi.org/10.1002/2016JD026325, 2017.
Milani, L. and Wood, N. B.: Biases in cloudsat falling snow estimates resulting from daylight-only operations, Remote Sens.-Basel, 13, 2041, https://doi.org/10.3390/rs13112041, 2021.
Milani, L., Kulie, M. S., Casella, D., Dietrich, S., L'Ecuyer, T. S., Panegrossi, G., Porcù, F., Sanò, P., and Wood, N. B.: CloudSat snowfall estimates over Antarctica and the Southern Ocean: An assessment of independent retrieval methodologies and multi-year snowfall analysis, Atmos. Res., 213, 121–135, https://doi.org/10.1016/j.atmosres.2018.05.015, 2018.
Mroz, K., Montopoli, M., Battaglia, A., Panegrossi, G., Kirstetter, P., and Baldini, L.: Cross validation of active and passive microwave snowfall products over the continental United States, J. Hydrometeorol., 22, 1297–1315, https://doi.org/10.1175/JHM-D-20-0222.1, 2021.
Munchak, S. J., Ringerud, S., Brucker, L., You, Y., de Gelis, I., and Prigent, C.: An active–passive microwave land surface database from GPM, IEEE T. Geosci. Remote, 58, 6224–6242, https://doi.org/10.1109/TGRS.2020.2975477, 2020.
NOAA: Comprehensive Large Array-data Stewardship System (CLASS), https://www.avl.class.noaa.gov/, last access: 4 April 2023.
NOAA Satellite and Information Service: Snow/Ice Maps, https://satepsanone.nesdis.noaa.gov/northern_hemisphere_multisensor.html, last access: 4 April 2023.
Noh, Y. J., Liu, G., Jones, A. S., and Vonder Haar, T. H.: Toward snowfall retrieval over land by combining satellite and in situ measurements, J. Geophys. Res.-Atmos., 114, D24205, https://doi.org/10.1029/2009JD012307, 2009.
Panegrossi, G., Rysman, J. F., Casella, D., Marra, A. C., Sanò, P., and Kulie, M. S.: CloudSat-based assessment of GPM Microwave Imager snowfall observation capabilities, Remote Sens.-Basel, 9, 1263, https://doi.org/10.3390/rs9121263, 2017.
Panegrossi, G., Casella, D., Sanò, P., Camplani, A., and Battaglia, A.: Recent advances and challenges in satellite-based snowfall detection and estimation, Precipitation Science, Chap. 12, 333–376, https://doi.org/10.1016/B978-0-12-822973-6.00015-9, 2022.
Partain, P.: CloudSat ECMWF-AUX Auxiliary Data Product Process Description and Interface Control Document, Product Version P1_R05, NASA JPL CloudSat project document revision 0, 16 pp., https://www.cloudsat.cira.colostate.edu/cloudsat-static/info/dl/ecmwf-aux/ECMWF-AUX.PDICD.P1_R05.rev0.pdf (last access: 4 April 2023), 2022
Prigent, C., Wigneron, J. P., Rossow, W. B., and Pardo-Carrion, J. R.: Frequency and angular variations of land surface microwave emissivities: Can we estimate SSM/T and AMSU emissivities from SSM/I emissivities?, IEEE T. Geosci. Remote, 38, 2373–2386, https://doi.org/10.1109/36.868893, 2000.
Prigent, C., Aires, F., Rossow, W., and Matthews, E.: Joint characterization of vegetation by satellite observations from visible to microwave wavelengths: A sensitivity analysis, J. Geophys. Res.-Atmos., 106, 20665–20685, https://doi.org/10.1029/2000JD900801, 2001.
Prigent, C., Jaumouille, E., Chevallier, F., and Aires, F.: A parameterization of the microwave land surface emissivity between 19 and 100 GHz, anchored to satellite-derived estimates, IEEE T. Geosci. Remote, 46, 344–352, https://doi.org/10.1109/TGRS.2007.908881, 2008.
Prigent, C., Aires, F., Wang, D., Fox, S., and Harlow, C.: Sea-surface emissivity parametrization from microwaves to millimetre waves, Q. J. Roy. Meteor. Soc., 143, 596–605, https://doi.org/10.1002/qj.2953, 2017.
Rahimi, R., Ebtehaj, A., Panegrossi, G., Milani, L., Ringerud, S. E., and Turk, F. J.: Vulnerability of Passive Microwave Snowfall Retrievals to Physical Properties of Snowpack: A Perspective From Dense Media Radiative Transfer Theory, IEEE T. Geosci. Remote, 60, 1–13, https://doi.org/10.1109/TGRS.2022.3184530, 2017.
Romanov, P.: Global multisensor automated satellite-based snow and ice mapping system (GMASI) for cryosphere monitoring, Remote Sens. Environ., 196, 42–55, https://doi.org/10.1016/j.rse.2017.04.023, 2017.
Rosenkranz, P. W.: Water vapor microwave continuum absorption: A comparison of measurements and models, Radio Sci., 33, 919–928, https://doi.org/10.1029/98RS01182, 1998.
Rysman, J. F., Panegrossi, G., Sanò, P., Marra, A. C., Dietrich, S., Milani, L., and Kulie, M. S.: SLALOM: An all-surface snow water path retrieval algorithm for the GPM Microwave Imager, Remote Sens.-Basel, 10, 1278, https://doi.org/10.3390/rs10081278, 2018.
Rysman, J. F., Panegrossi, G., Sano, P., Marra, A. C., Dietrich, S., Milani, L., Kulie, M. S., Casella, D., Camplani, A., Claud, C., and Edel, L.: Retrieving surface snowfall with the GPM Microwave Imager: A new module for the SLALOM algorithm, Geophys. Res. Lett., 46, 13593–13601, https://doi.org/10.1029/2019GL084576, 2019.
Sanò, P., Panegrossi, G., Casella, D., Di Paola, F., Milani, L., Mugnai, A., Petracca, M., and Dietrich, S.: The Passive microwave Neural network Precipitation Retrieval (PNPR) algorithm for AMSU/MHS observations: description and application to European case studies, Atmos. Meas. Tech., 8, 837–857, https://doi.org/10.5194/amt-8-837-2015, 2015.
Sanò, P., Casella, D., Camplani, A., D'Adderio, L. P., and Panegrossi, G.: A Machine Learning Snowfall Retrieval Algorithm for ATMS, Remote Sens.-Basel, 14, 1467, https://doi.org/10.3390/rs14061467, 2022.
Skofronick-Jackson, G. M., Kim, M. J., Weinman, J. A., and Chang, D. E.: A physical model to determine snowfall over land by microwave radiometry, IEEE T. Geosci. Remote, 42, 1047–1058, https://doi.org/10.1109/TGRS.2004.825585, 2004.
Skofronick-Jackson, G., Hudak, D., Petersen, W., Nesbitt, S. W., Chandrasekar, V., Durden, S., Kristin, J. G., Huang, G., Joe, P., Kollias, P., Reed, K., A., Schwaller, M.,R., Stewart, R., Tanelli, S., Tokay, A., Wang, J., R., and Wolde, M.: Global precipitation measurement cold season precipitation experiment (GCPEX): For measurement's sake, let it snow, B. Am. Meteorol. Soc., 96, 1719–1741, https://doi.org/10.1175/BAMS-D-13-00262.1, 2015.
Stephens, G. L., Vane, D. G., Tanelli, S., Im, E., Durden, S., Rokey, M., Reinke, D., Partain, P., Mace, G. G., Austin, R., L'Ecuyer, T., Haynes, J., Lebsock, M., Suzuki, K, Waliser, D., Wu, D., Kay, J., Gettelman, A., Zhien Wang, Z., and Marchand, R.: CloudSat mission: Performance and early science after the first year of operation, J. Geophys. Res.-Atmos., 113, D00A18, https://doi.org/10.1029/2008JD009982, 2008.
Takbiri, Z., Ebtehaj, A., Foufoula-Georgiou, E., Kirstetter, P. E., and Turk, F. J.: A prognostic nested k-nearest approach for microwave precipitation phase detection over snow cover, J. Hydrometeorol., 20, 251—274, https://doi.org/10.1175/JHM-D-18-0021.1, 2019.
Turk, F. J., Ringerud, S. E., Camplani, A., Casella, D., Chase, R. J., Ebtehaj, A., Gong, J., Kulie, M., Liu, G., Milani, L., Panegrossi, G., Padullés, R., Rysman, J. F., Sanò, P., Vahedizade, S., and Wood, N. B.: Applications of a CloudSat-TRMM and CloudSat-GPM satellite coincidence dataset, Remote Sens.-Basel, 13, 2264, https://doi.org/10.3390/rs13122264, 2021a.
Turk, F. J., Ringerud, S. E., You, Y., Camplani, A., Casella, D., Panegrossi, G., Sanò, P., Ebtheaj, A., Guilloteau, C., Utsumi, N., Prigent, C., and Peters-Lidard, C.: Adapting passive microwave-based precipitation algorithms to variable microwave land surface emissivity to improve precipitation estimation from the GPM constellation, J. Hydrometeorol., 22, 1755–1781, https://doi.org/10.1175/JHM-D-20-0296.1, 2021b.
Ulaby, F. and Long, D.: Microwave radar and radiometric remote sensing, 1st edn., the Univ. of Michigan Press, ISBN: 978-0-472-11935-6, 2014.
University of Lille: DARDAR data, ICARE FTP server, ftp://ftp.icare.univ-lille1.fr, last access: 4 April 2023.
Vihma, T., Screen, J., Tjernström, M., Newton, B., Zhang, X., Popova, V., Deser, C., Holland, M., and Prowse, T.: The atmospheric role in the Arctic water cycle: A review on processes, past and future changes, and their impacts, J. Geophys. Res.-Biogeo., 121, 586–620, https://doi.org/10.1002/2015JG003132, 2016.
Wang, Y., Liu, G., Seo, E. K., and Fu, Y.: Liquid water in snowing clouds: Implications for satellite remote sensing of snowfall, Atmos. Res., 131, 60–72, https://doi.org/10.1016/j.atmosres.2012.06.008, 2013.
Weng, F., Zou, X., Wang, X., Yang, S., and Goldberg, M. D.: Introduction to Suomi national polar-orbiting partnership advanced technology microwave sounder for numerical weather prediction and tropical cyclone applications, J. Geophys. Res.-Atmos., 117, D19112, https://doi.org/10.1029/2012JD018144, 2012.
Wood, N. B. and L'Ecuyer, T. S.: Level 2C Snow Profile Process Description and Interface Control Document, Product Version P1 R05, NASA JPL CloudSat project document revision 0, 26 pp., https://www.cloudsat.cira.colostate.edu/cloudsat-static/info/dl/2c-snow-profile/2C-SNOW-PROFILE_PDICD.P1_R05.rev0_.pdf (last access: 4 April 2023), 2018.
You, Y., Meng, H., Dong, J., and Rudlosky, S.: Time-lag correlation between passive microwave measurements and surface precipitation and its impact on precipitation retrieval evaluation, Geophys. Res. Lett., 46, 8415–8423, https://doi.org/10.1029/2019GL083426, 2019.
You, Y., Meng, H., Dong, J., Fan, Y., Ferraro, R. R., Gu, G., and Wang, L.: A Snowfall Detection Algorithm for ATMS Over Ocean, Sea Ice, and Coast, IEEE J. Sel. Top. Appl., 15, 1411–1420, https://doi.org/10.1109/JSTARS.2022.3140768, 2022.
Zhao, L. and Weng, F.: Retrieval of ice cloud parameters using the Advanced Microwave Sounding Unit, J. Appl. Meteorol. Clim., 41, 384–395, https://doi.org/10.1175/1520-0450(2002)041<0384:ROICPU>2.0.CO;2, 2002.