the Creative Commons Attribution 4.0 License.
the Creative Commons Attribution 4.0 License.
 | 19 Apr 2024
Identifying the seeding signature in cloud particles from hydrometeor residuals
Benjamin Werden
Edward C. Fortner
Sudarsan Bera
Mercy Varghese
Subharthi Chowdhuri
Kurt Hibert
Philip Croteau
John Jayne
Manjula Canagaratna
Neelam Malap
Sandeep Jayakumar
Shivsai A. Dixit
Palani Murugavel
Duncan Axisa
Darrel Baumgardner
Peter F. DeCarlo
Doug R. Worsnop
Thara Prabhakaran
Cloud seeding experiments for modifying clouds and precipitation have been underway for nearly a century; yet practically all the attempts to link precipitation enhancement or suppression to the presence of seeding materials within clouds remain elusive. In 2019, the Cloud–Aerosol Interaction and Precipitation Enhancement Experiment (CAIPEEX) investigated residuals of cloud hydrometeors in seeded and non-seeded clouds with an airborne mini aerosol mass spectrometer (mAMS). The mAMS was utilized in conjunction with a counterflow virtual impactor (CVI) inlet with a cutoff diameter size of approximately 7 µm. The evaporated cloud droplets from the CVI inlet as cloud residuals were evaluated through the mAMS. The chlorine (Cl) associated with hygroscopic materials, i.e. calcium chloride (CaCl2) and potassium (K), which serve as the oxidizing agents in the flares, is found in relatively higher concentrations in the seeded clouds compared to the non-seeded clouds. In convective clouds, Cl and K as cloud residuals were found even at a vertical distance of 2.25 km from the cloud base. Major findings from the seeding impact are an increase in the number concentration of small (< 20 µm) droplets and an indication of raindrop formation at 2.25 km above the cloud base. It is demonstrated that the seed particle signature can be traced inside clouds along with the microphysical impacts.
- Article
(2614 KB) - Full-text XML
-
Supplement
(3240 KB) - BibTeX
- EndNote


E. G. Bowen first proposed in 1952 that hygroscopic particles can foster collision–coalescence (CC) processes in a cloud (Bowen, 1952). Since then, cloud seeding experiments have been conducted worldwide to mitigate and respond to the ever-increasing urban water demand during a drought season or in drought-prone regions. More than 50 countries are involved in weather modification projects (Flossmann et al., 2019). Over the years, the interest in rain enhancement projects has increased due to the accumulating evidence of a potentially positive effect (i.e. enhancement in rainfall) in several seeding experiments (Mather et al., 1996, 1997; Bruintjes, 1999; WMO, 2000; Gayatri et al., 2023; Prabhakaran et al., 2023). However, scepticism remains within the broader cloud physics community because the efficacy of many cloud seeding experiments remains inconclusive (Ryan and King, 1997; Silverman, 2003; Flossmann et al., 2019). In addition to the existing challenges of evaluating the effectiveness of cloud seeding experiments, other pivotal long-standing issues revolve around accurately detecting the hygroscopic particles released within a cloud, identifying the seeded cloud, and comprehending the impact of seeding on the cloud microphysical properties.
Traditionally, in a cloud seeding experiment tracers such as the inert gas, sulfur hexafluoride (SF6) (Stith et al., 1986, 1990; Bruintjes et al., 1995; Rosenfeld et al., 2010), or radar chaff at cloud bases are released, and then efforts are made to measure these tracers higher in the cloud. However, the tracing of SF6 in a seeded cloud is challenging, and successful trials have been reported only on a few occasions near the cloud base (Rosenfeld et al., 2010). The detection of SF6 and chaff traces is hampered by detection limits, especially in the presence of high background concentrations. Using these tracers as proxies for tracking air masses carrying seeding material is limited by the challenge of unambiguously connecting their presence with the seeding material due to their non-reactive nature with cloud particles. Consequently, several questions arise during these experiments. For instance, does the dispersed seeding material effectively enter the targeted cloud region? Up to what altitude do these materials reach? Are the in situ measurements being conducted within the intended cloud volume? How can transported flare particles be located within large clouds? Due to these uncertainties and the need to more quantitatively evaluate the direct link between seeding materials and the formation of cloud hydrometeors, the development of a low-impact but more effective tracer has been recommended by, for example, Tessendorf et al. (2012).
A critical question in any cloud seeding experiment is whether the observed changes in the cloud microphysical properties after seeding are due to the introduction of seeding material or to natural cloud processes. There are two requirements necessary to address this question: (i) can the trajectory of seeding material be successfully traced in the cloud, and (ii) can changes in cloud microphysical processing be linked to seeding materials? In this study, an instrumented aircraft was deployed to acquire convincing evidence that addresses these questions. This work primarily addresses how to trace seed particles' signatures in clouds and focuses on the question of changes in cloud microphysical properties due to the introduction of seeding particles. This novel technique uses a mini aerosol mass spectrometer (mAMS) (Jayne et al., 2000) behind a counterflow virtual impactor (CVI) (Noone et al., 1988; Shingler et al., 2012) to identify seeding material in the cloud droplet residuals, i.e. the aerosols that remain after the evaporation of the cloud droplets.
The hygroscopic cloud seeding hypothesis relies on a chain of microphysical processes. The dispersal of giant cloud condensation nuclei (CCN), hygroscopic particles with diameters between 1–10 µm, in the updraft region of the cloud base adds larger drops to the tail of the natural cloud droplet size distribution (DSD), known as the “tail effect”. This effect further accelerates the formation of raindrops through CC (Segal et al., 2004, 2007; Kuba and Murakami, 2010; Konwar et al., 2023). With the initial activation and growth of these larger CCN, the supersaturation over water droplets (SSw) decreases above the cloud base. As a result, the smaller, natural CCN do not activate. This effect reduces the total droplet number concentration (Nt, cm−3) and broadens the DSDs, a phenomenon known as the “competition effect”. This broadening fosters the droplet growth rate by intensifying the CC process, which accelerates the formation of precipitation (Cooper et al., 1997; Rosenfeld et al., 2010). Past studies used in situ measurements to evaluate well-formed seeded clouds whose formation revealed a broadening of the DSDs by hygroscopic seeding in marine stratocumulus clouds (Ghate et al., 2007). Researchers reported that an increased concentration of small cloud droplets occurred at an earlier stage, while at a later stage, an increased concentration in the large size range of 20–40 µm was noted. In another study, SF6 was used to track air parcels in a seeded cloud, where milled salt particles were used as the seeding agent. In this study a broadening of the DSD was observed (Rosenfeld et al., 2010). Linking the evolution of cloud microphysical processes to hygroscopic seeding remains elusive despite worldwide hygroscopic cloud seeding experiments (Flossmann et al., 2019; Silverman 2003; Tessendorf et al., 2012). The major hurdle is that the physical processes leading to precipitation formation are dynamic and complex and difficult to directly and quantitatively track and link to the seeding (Tessendorf et al., 2012).
In the current study, using an mAMS, we demonstrate that the seeding signatures within stratus and convective clouds are detectable with an evidence-based approach without using tracer gasses. We further show that the seeding materials and the seeding-activated cloud droplets in convective clouds can propagate to higher altitudes while also modulating the cloud's microphysical properties. The ultimate goal is to investigate the microphysical pathways that are modified in cloud seeding operations. These experiments took place in the region near Solapur (17.66° N, 75.90° E), India, during the Cloud–Aerosol Interaction and Precipitation Enhancement Experiment (CAIPEEX) (Prabha et al., 2011; Kulkarni et al., 2012; Prabhakaran et al., 2023) in 2019 (phase IV).
2.1 Measurements of cloud properties
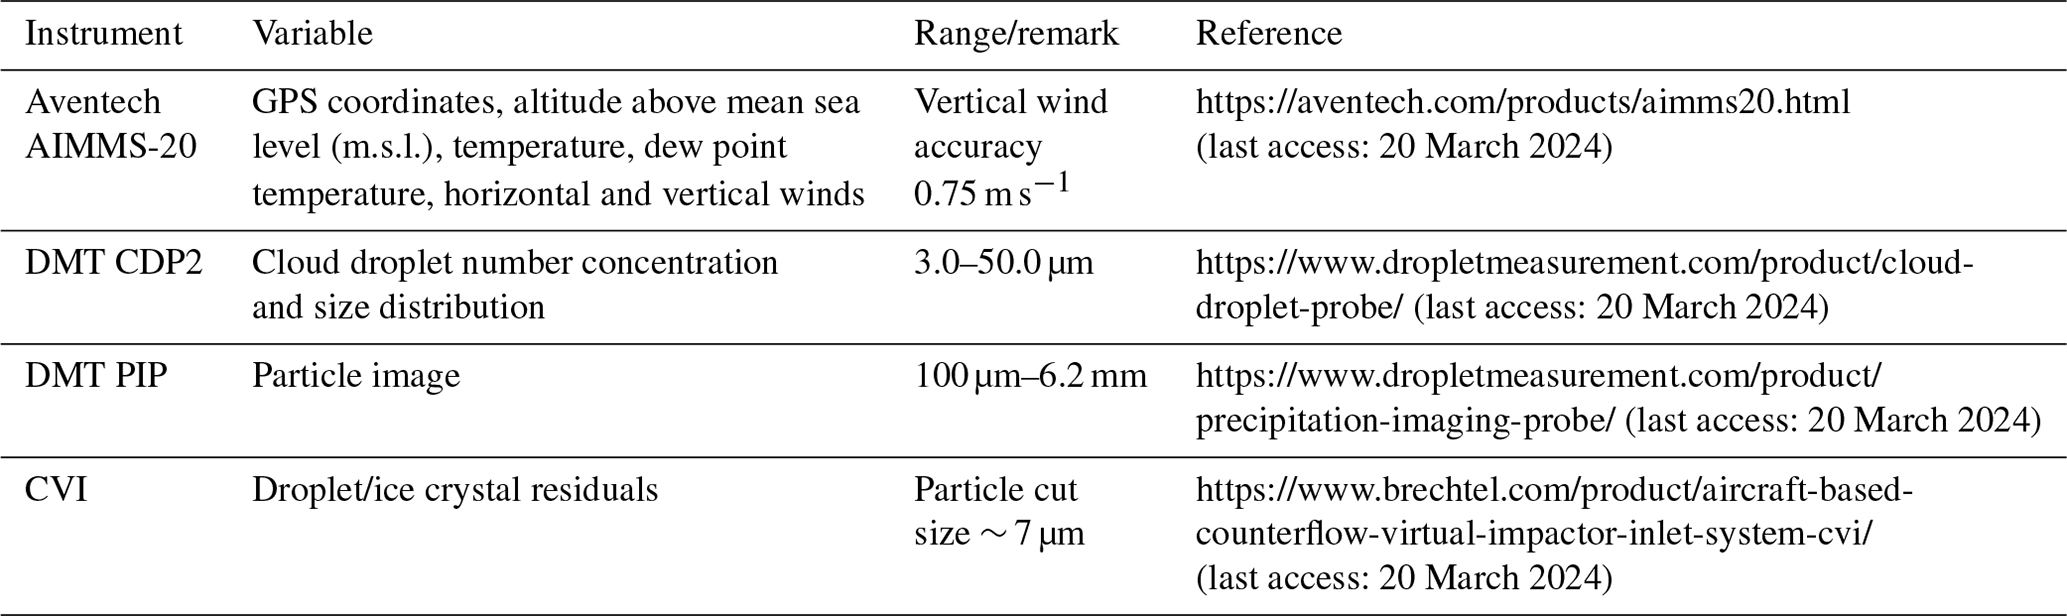
Three cloud seeding events carried out on 21, 23, and 24 August in 2019 are selected here for the evaluation of seeding signatures and plausible links to microphysical properties. Instruments for the measurement of flare particles, aerosol, and cloud properties were operated on a Beechcraft B200 aircraft. This aircraft was equipped with flare racks located under both the wings and the belly. The flare racks in the wings are used for warm cloud seeding operations (Mather et al., 1997), while the belly is utilized for cold cloud seeding operations (French et al., 2018; Friedrich et al., 2020). The temperature (T, °C), relative humidity (RH %), wind speed (m s−1), and wind directions were measured with the Airborne Integrated Meteorological Measurement System (AIMMS-20). The DSD in the size range of 2–50 µm was measured with a cloud droplet probe (CDP-2) manufactured by Droplet Measurement Technologies, LLC, USA. The bulk microphysical properties are derived from the measured DSDs, e.g. the total number concentration (Nt, cm−3) and liquid water content (LWC, g m−3). The effective radius (re, µm) was calculated from the ratio between the third and second moments of the DSDs (Martin et al., 1994). The precipitation imaging probe (PIP) was used to document drizzle drops in the clouds over the size range of 100–6200 µm. The technical specifications of these instruments are shown in Table 1. The uncertainties associated with the CDP and single-particle light-scattering instruments like the CDP have been well characterized and documented (Baumgardner, 1983; Baumgardner et al., 2001, 2016; Lance et al., 2010). In water droplets the sizing uncertainty is ±20 % and counting accuracy ±16 %, which propagates into a LWC uncertainty of ±38 %.
Table 1Details of instruments used on the aircraft and for offline analysis in the study.
Cloud properties are altered by the entrainment of cloud-free air masses at the edges of the cloud; hence to minimize the influences of entrainment and mixing processes in the seeded and non-seeded clouds, only clouds with near-adiabatic or slightly diluted cloud parcels are considered to evaluate cloud microphysical properties. Only cloud passes with LWC in the range of 0.75 < LWC/LWCmax < 1 (Konwar et al., 2021) were selected for this study. Here, LWCmax represents the maximum measured value of LWC during a cloud pass. Note that this cloud regime may be considered the cloud core, typically located within the strongest updraft zone. Our main aim is to select the DSDs located within the cloud core regime. Note that in most naturally developing clouds the LWCmax values are less than the adiabatic LWC (LWCad) values because of the entrainment of drier air, mixing, precipitation fallout, and radiative heating/cooling (Korolev et al., 2007). The maximum adiabatic fraction, AFmx= LWC LWCad, indicates the extent of dilution that has occurred in the cloud core regime. During their development and dissipation stages clouds undergo significant changes; therefore, it is practically impossible to find two clouds identical in all states, let alone their lifetimes. It is to be noted that the AF values may not accurately represent the mixing state when CC is significant and drizzle particles form within the clouds. Additionally, studies of the seeding effect using parcel model simulations without the inclusion of mixing processes indicate a significant change in the LWC profile compared to the non-seeded cloud (Konwar et al., 2023). Such changes in LWC values at different vertical distances from the cloud base of the seeded clouds do not necessarily imply the true dilution rate in the observations. Since the cloud seeding flare produces high concentrations of small-sized particles, they can be activated into cloud droplets in strong updraft regimes with high supersaturation (Konwar et al., 2023; Prabhakaran et al., 2023). In a parcel model simulation, small aerosols released from flares are found to be activated due to an increase in supersaturation when the collision–coalescence process is active (Konwar et al., 2023). For details on the nucleation process within the zone of intense collision, where a rapid decrease in drop concentration leads to an increase in supersaturation, readers are referred to Pinsky and Khain (2002). At a given height, however, seeding does not change the adiabatic value, but activation of new particles at a given level due to seeding can alter the AF. Another aspect is that near the cloud base the LWCad values are quite small (e.g. < 1 g m−3); therefore any small change in the measured LWC could indicate a large change in AF. With this background information in mind, the DSDs for seed cloud (SCl) and non-seed cloud (NSCl) conditions are compared at different vertical distances above the cloud base (D*, km). The lowest unbroken visible section of a convective cloud was selected as the cloud base. The cloud top is defined as the maximum altitude attained by these clouds at any given moment during their development.
2.2 Measurement of hygroscopic flare particles by mAMS and correcting time trends of slow-vaporizing species
We utilized an mAMS to analyse the chemical compositions of residual particles from cloud droplets, specifically to trace flare particles within the seed clouds. The CVI is manufactured by Brechtel Manufacturing Inc. (BMI, Model 1204, https://www.brechtel.com/, last access: 20 March 2024). The cloud droplets were passed through the CVI to obtain the droplet residuals that were sampled by the mAMS. Through the use of inertial impaction, the CVI inlet allows cloud hydrometeors with aerodynamic diameters larger than a certain size to pass through, depending on the velocity of the counterflow. A warm, particle-free dry nitrogen gas is directed towards the inlet against the direction of the ambient airflow. This causes a separation in the incoming free-stream air, with particles > 7 µm in the sampled air having enough inertia to penetrate the counterflow and join the sample flow. The CVI adjusted flow rates with its internal software based on true air speed (TAS) obtained from the AIMMS-20. The cut size is a function of various factors, e.g. air pressure, air speed, and the average angle of attack, and is known to have an uncertainty of approximately ±1 µm. The heated air evaporates cloud droplets, and the remaining dried residuals enter the mAMS where their chemical compositions are classified. Details of the operational principles of the CVI can be found in Ogren et al. (1985, 1987), Noone et al. (1988), Shingler et al. (2012), Golderger et al. (2020), and references therein.
The mAMS measured the residual particles with vacuum aerodynamic diameters of less than 1 µm, sampling through an aerodynamic lens. The aerosol sample stream is intermittently blocked to measure background signals. The aerosol signal is the difference between unblocked (“open”) measurements and those obtained during the blocked (“closed”) period. The mAMS sampled 10 s of closed signal for every 110 s of open signal. The heater, operated at 600 °C, vaporized the sample, electron impacts ionized the vapours, and the resultant ions were extracted into the mass analyser for the measurement of chemical composition and mass distributions (Jayne et al., 2000; DeCarlo et al., 2006; Canagaratna et al., 2007; Drewnick et al., 2015; Giordano et al., 2018; Salcedo et al., 2006).
Ice Crystal Engineering (ICE) Inc. (USA) manufactured the hygroscopic flares used in this work. The flares were composed of an aggregated mixture of potassium perchlorate (KClO4) and calcium chloride (CaCl2) (Hindman, 1978; Bruintjes et al., 2012).
For non-refractory ambient aerosol species (i.e. NH4, NO3, SO4) aerosol concentrations are obtained from the difference between the open and closed signals. The vaporization of non-refractory aerosol species at 600 °C is typically completed on the timescale of hundreds of microseconds; however, semi-refractory species such as metals and salts may take minutes to completely vaporize (Canagaratna et al., 2007; Salcedo et al., 2006).
As discussed below, the Cl, HCl, and K from the KClO4 and CaCl2 in flares are semi-refractory species which exhibit slow vaporization. These slow-vaporizing species were analysed using only the open signals. The background signal was calculated from measurements obtained immediately before the cloud intercept of interest.
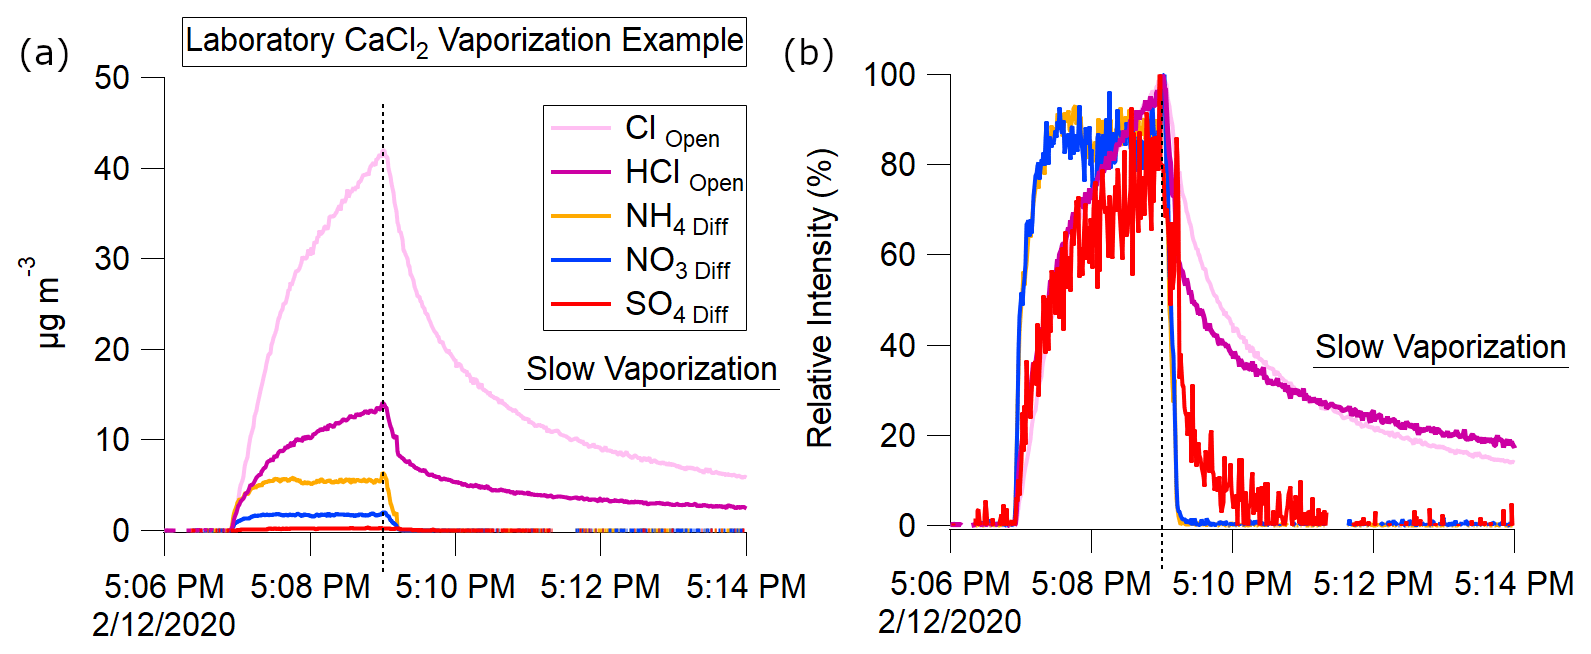
Figure 1Laboratory atomized CaCl2 AMS measurements observing slow vaporization of semi-refractory Cl species on 2 December 2020. Atomization begins at 17:07 and ends at 17:09 UTC. Slow vaporization is evident after 17:10 UTC. The presence of NO3, NH4, and SO4 is from calibration species (NH4NO3, NH4SO4) contaminants in the atomizer.
CaCl2, the seeding component in the flares, has a melting point of 774 °C. Laboratory measurements of atomized CaCl2, primarily detected as Cl and HCl ions, exhibit the same slow vaporization seen in refractory salts (Drewnick et al., 2015). Figure 1 shows a comparison of vaporization timescales of CaCl2, NH4NO3, and (NH4)2SO4 obtained with an AMS during laboratory measurements of CaCl2 in solution with H2O which had been atomized and passed through a drier before sampling. This behaviour differs from that observed from non-refractory NH4NO3 and (NH4)2SO4, which were present as tracers.
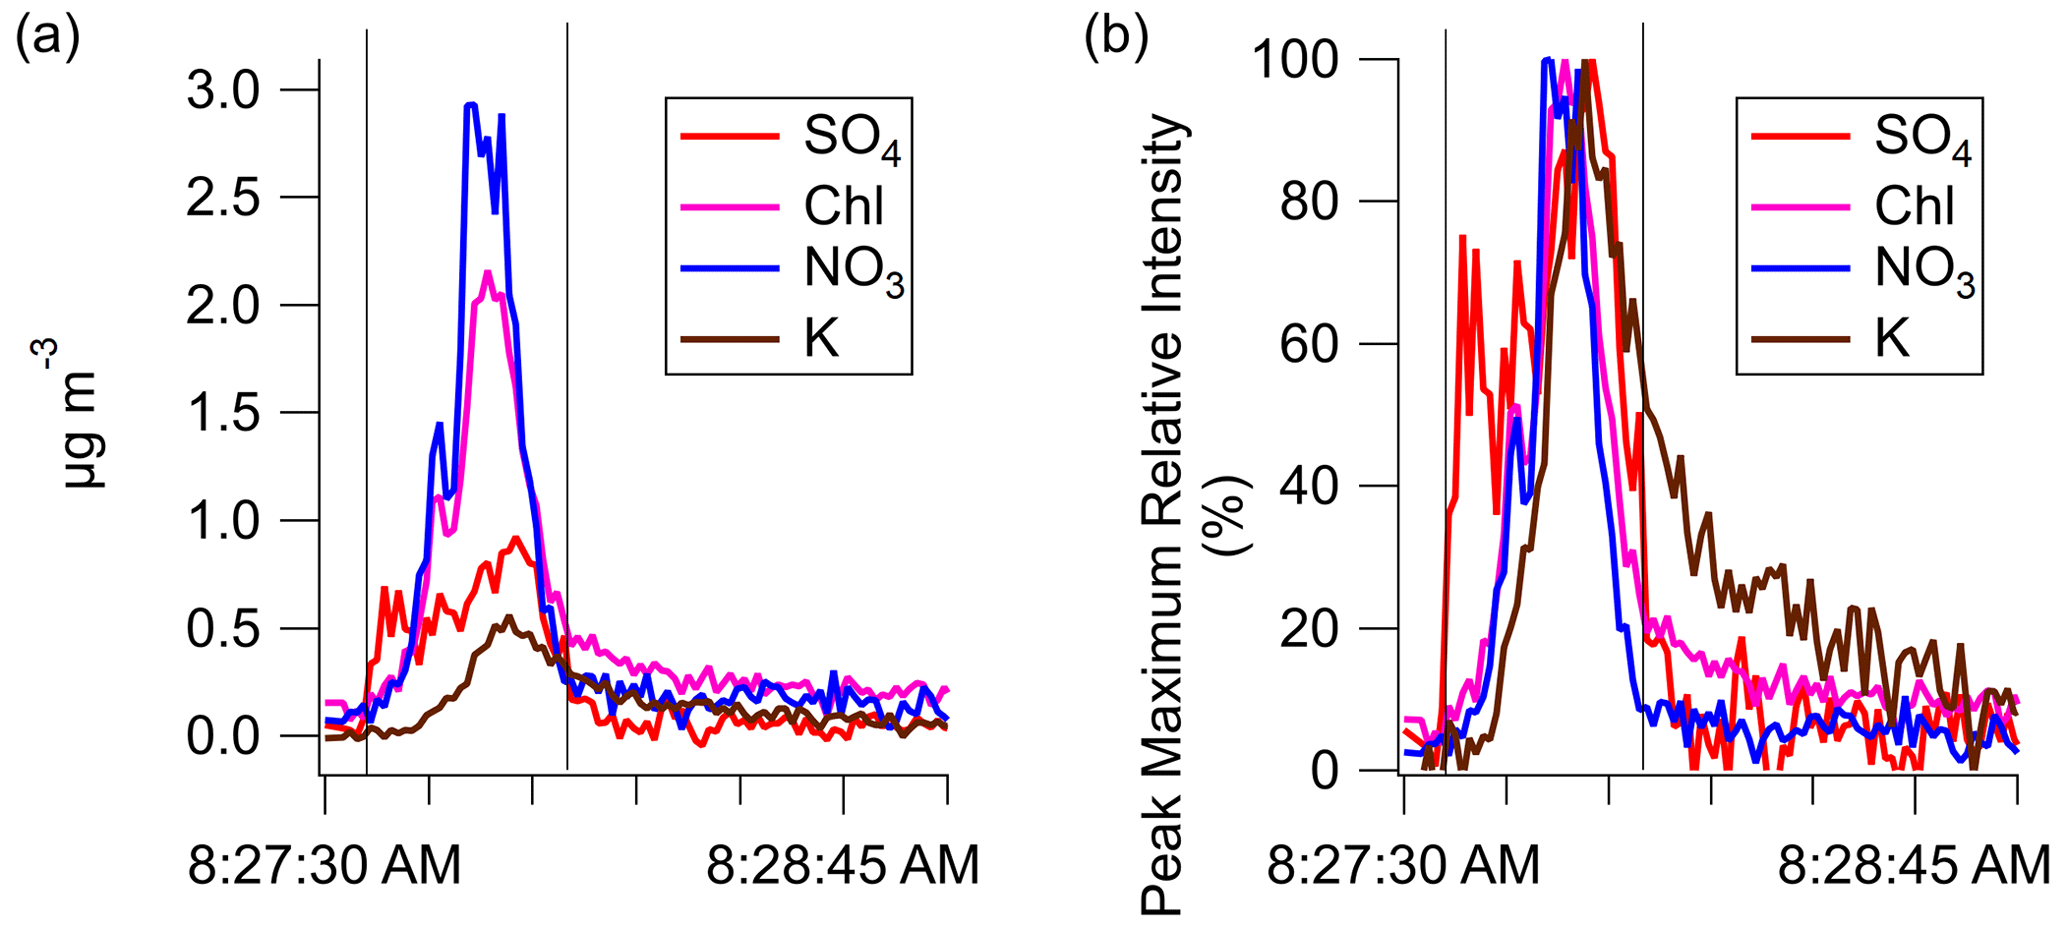
Figure 2Panel (a) shows the slowed time response of the species K and Cl for a seeded cloud pass on 23 August. (b) The relative intensity with respect to peak maximum of each species highlights the slowed decay of K and Chl compared to SO4 or NO3.
The seeded cloud pass shown in Fig. 2a illustrates a single seeded cloud pass. The K and Cl time series have a delayed decay to background compared to sulfate or nitrate. The relative intensity shown in Fig. 2b highlights the delayed response in the decay of the two flare-associated species (K, Cl).
An exponential decay was fit to each cloud intercept, from the signal peak to five e-folding times. The average decay exponential (τ) for Cl and K across all seeded cloud intercepts is shown in Table 2.
Table 2Average decay time constants from seeded cloud intercepts during CAIPEEX-IV on 23 August 2019.
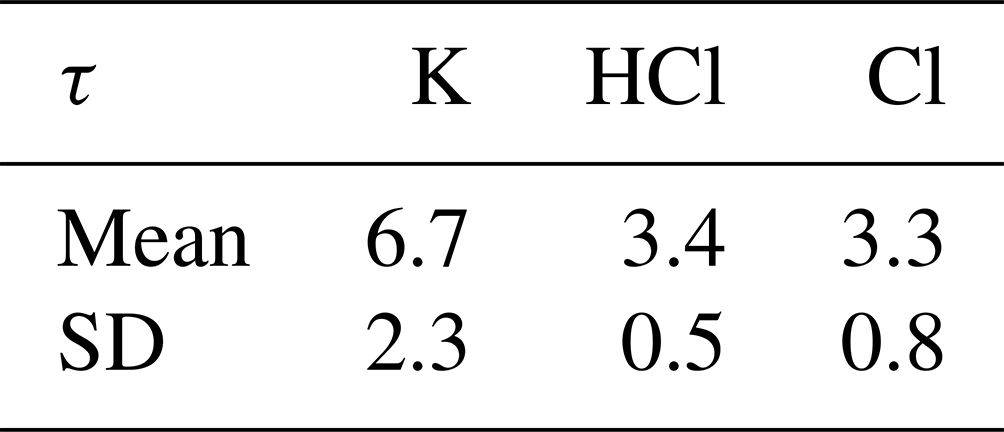
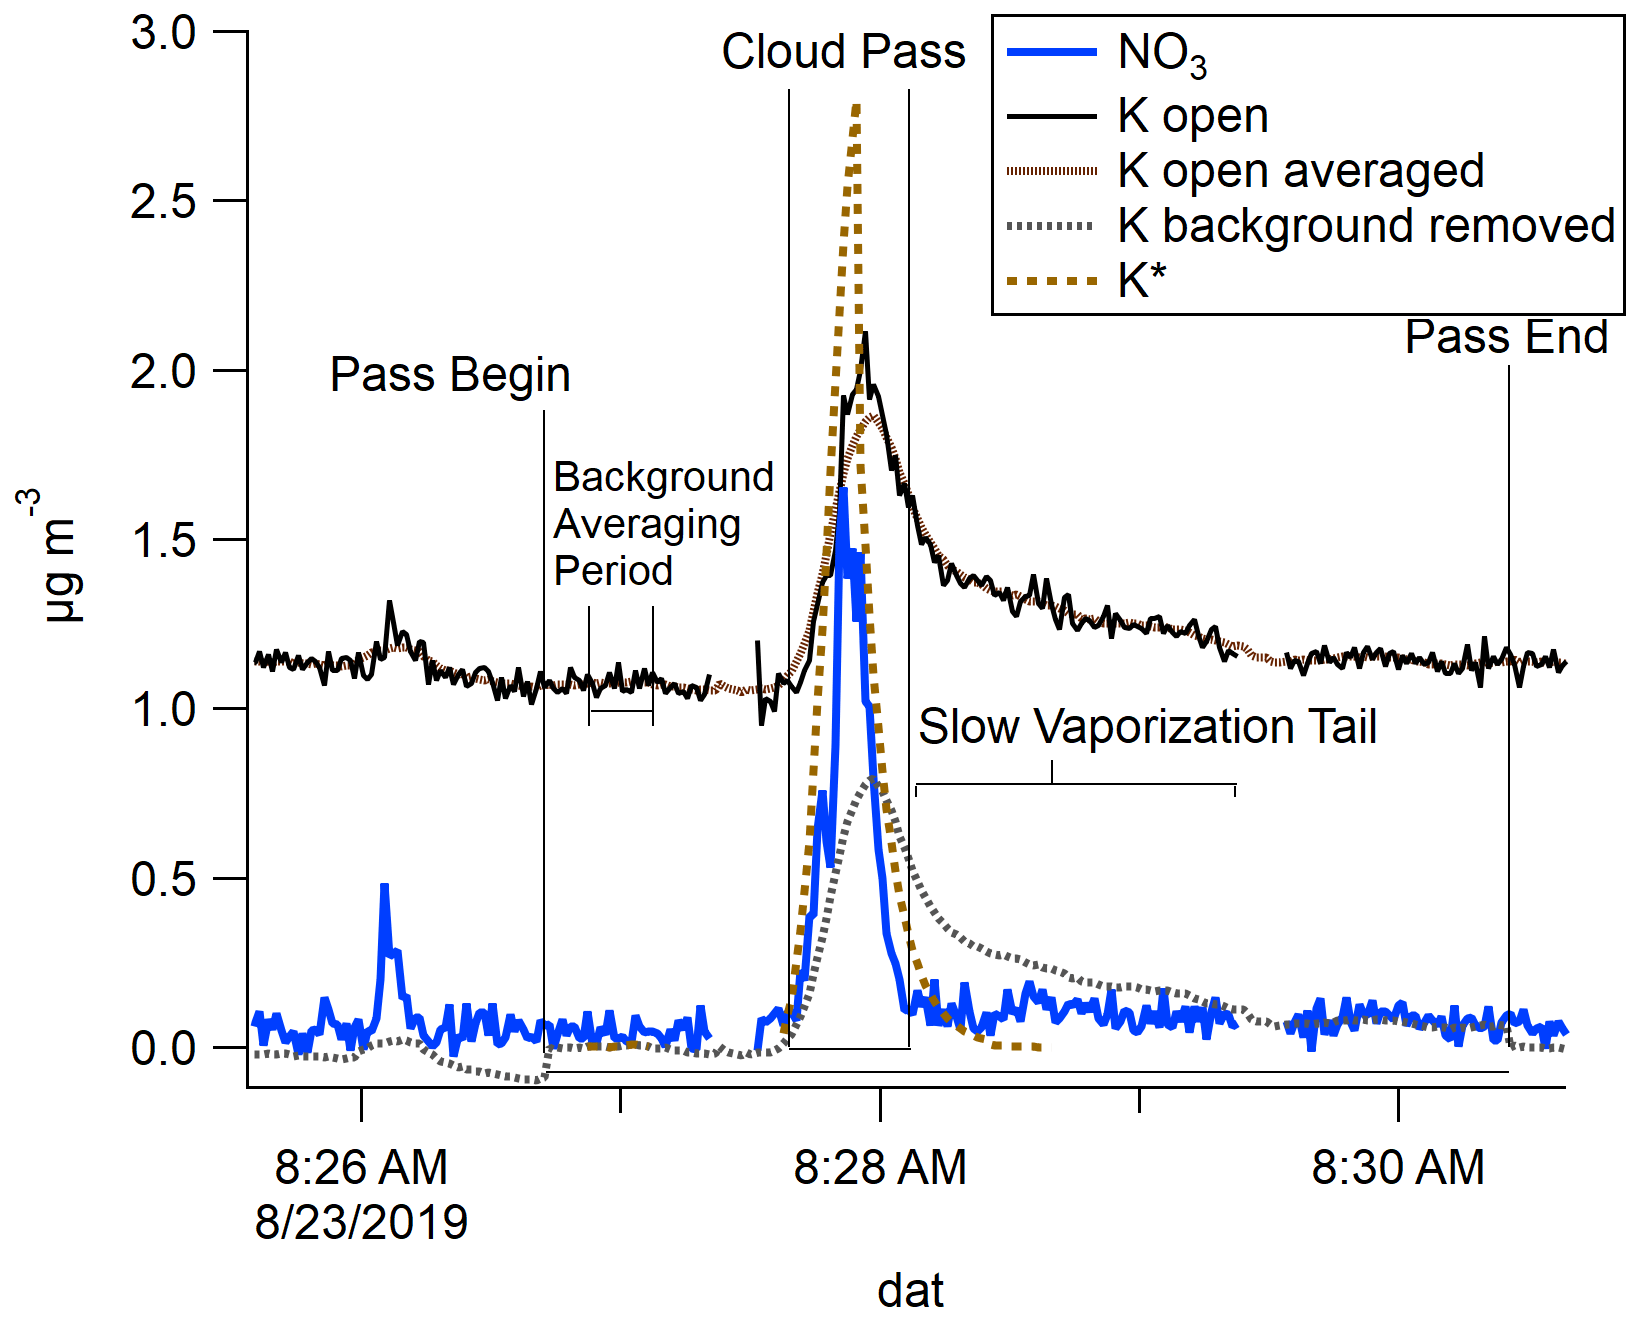
Figure 3The measured semi-refractory open K signal and corrected K* signal from the mAMS are depicted for a seeded cloud pass on 23 August 2019. The periods from the beginning to the end of the cloud passes are also shown.
For each slowly vaporizing species, a new corrected time series was created. The start, stop, and maximum total mass times were identified for each cloud pass (Fig. 3). For each species, a background signal was determined from measurements during the non-cloud period preceding each pass. This background was subtracted from the signal observed during each cloud intercept.
The cloud intercept time series peak at the same time as the uncorrected series. However, the tails were corrected to decay within five e-folding times while preserving the total mass. The equations used in these calculations are shown below.
The measured mass from the start of the pass to the end of the slow-vaporization regime was scaled by the ratio of the total area divided by the area of fast vaporization (Eq. 1).
The decay of this normalized mass is adjusted to the exponential decay fit (Table 2) to the slow-vaporized mass (Eq. 2). This decay extends from the cloud pass peak to the end of the normal vaporization period plus five e-folding times (Giordano et al., 2018).
This decay-corrected time-shifted time series is normalized to the unmodified slow-vaporizing total mass (Eq. 3).
Finally, we applied an enhancement factor correction to the mAMS data resulting from the ambient aerosol concentration being concentrated in the CVI by following Shingler et al. (2012).
2.3 Results
2.4 Slow vaporization of semi-refractory seed aerosols
Although many aerosol species readily vaporize at 600 °C, some semi-refractory materials in nature do not. Submicron aerosol particles in the troposphere, which contain Cl, are rarely semi-refractory and vaporize quickly in the mAMS. However, Cl in seeded clouds was found to vaporize slowly. The Cl measured in clouds seeded using CaCl2 and KClO4 exhibited the same slow vaporization (Fig. 2) as atomized CaCl2 in the laboratory (Fig. 1). The majority of atmospheric Cl-containing aerosols are non-refractory. In our study the slowly vaporizing Cl was only observed in seeded clouds; thus, we assume that the source of the slow-vaporizing Cl was from the flare material. Aerosol K is uncommon except as super-micron mineral dust. As shown in Fig. 2b, slowly vaporizing signals of Cl and K were observed in the campaign during seeded cloud intercepts.
The combination of the isolation of cloud residuals by the CVI and the presence of K and semi-refractory Cl allows for the discrimination of the particles containing the flare combustion products.
The element Ca was also present in the flare. The boiling point of Ca of 1484 °C at ambient pressure means that this species was not vaporized inside the AMS and is thus considered a refractory species. Since Ca could not be observed in our study, the focus remained on the other species present.
As previously discussed, the time series of semi-refractory Cl and K signals are corrected to account for the difference in the decay response of slowly vaporizing species in the mAMS. Figure 3 depicts the corrected (K*) and uncorrected semi-refractory K signals in the mAMS measurements for a seeded cloud pass, defining the periods for the start, peak, end, and tail of the pass.
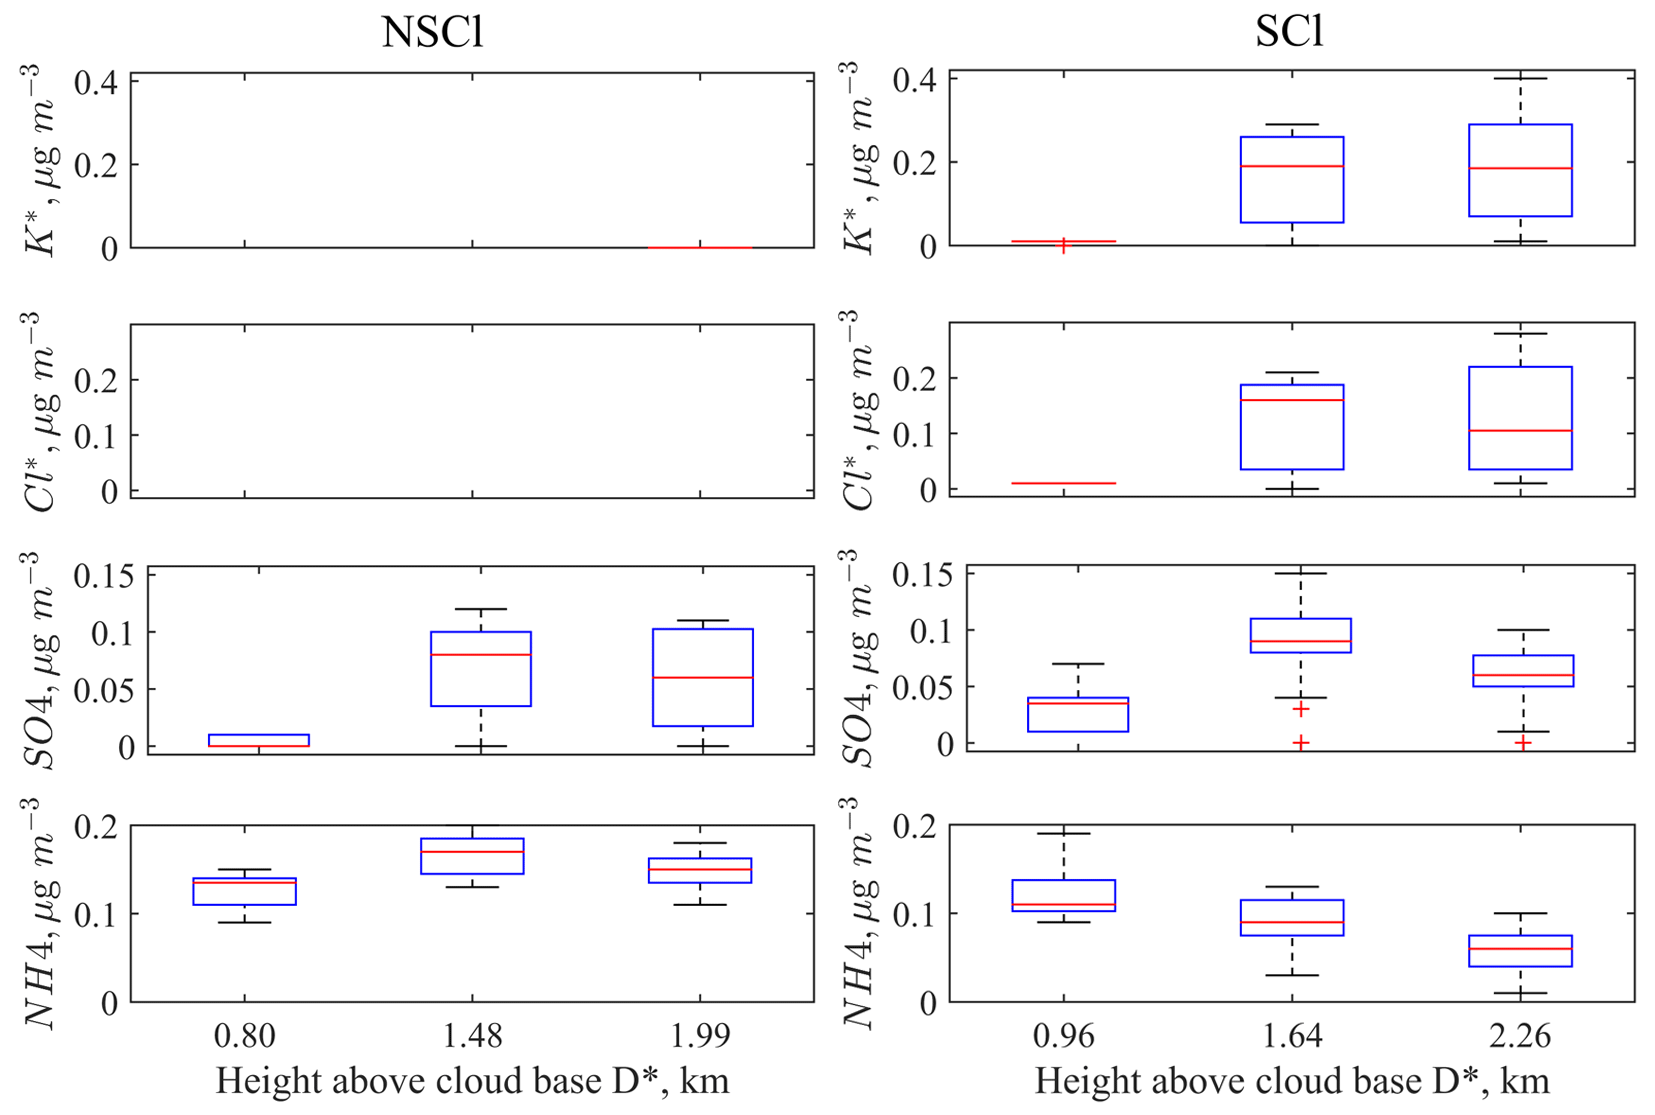
Figure 4Several mAMS measurements of the mass concentrations of Cl*, K*, NO3, and SO4 versus D* (km) for cloud particle residuals from six cloud passes through the same cloud on 23 August 2019. The vertical profile box plots of each mAMS species at different altitudes show median concentration and range (25–75th percentiles). Three non-seeded clouds (NSCl) and three seeded clouds (SCl) are shown.
A vertical profile of cloud residual aerosols within the same cloud taken before and after seeding provides a platform for measuring and observing cloud physical and chemical changes. The resultant mAMS measurements from one such experiment, on 23 August 2019, with three cloud passes of the same cloud before and three passes after seeding are shown in Fig. 4.
In the mid-level, all chemical species were found in higher quantities in the seeded cloud than in the non-seeded cloud. Cl and K concentrations were significantly increased for all seeded cloud passes compared to non-seeded cloud passes. The measurement of the flare chemical species in the seeded cloud indicates that the mAMS could successfully identify the cloud droplets that contain seeding material.
An additional observation is the increased NO3 and SO4 concentration in the cloud drops of seeded clouds at upper heights. We hypothesized that the increased concentrations of these two chemical species could be linked with the activation of the flare particles and other organics while mixing with the naturally available NO3 and SO4 aerosols. The increased concentration of NO3 in the seeded cloud may also be due to the presence of more LWC. The additional water drives nitric acid (HNO3) from gas to liquid NO3 (Wang and Laskin, 2014).
This example highlights the ability of the mAMS to identify flare-associated species, by both increased concentration and time response, in order to confirm the presence of seeding material in cloud droplet residuals.
2.5 Seeding experiment, seeding signature, and cloud properties
2.5.1 Case i: 21 August 2019
The flight pattern of the aircraft during the cloud seeding experiment conducted on 21 August 2019 in a warm stratus layer is shown in Fig. 5a. The objective was to identify the seeding materials and record the cloud microphysical properties. The wind direction was north-westerly at an altitude of nearly 4.10 km with a mean wind speed of 7 m s−1. Cloud passes (T=5.14 °C, H=4.39 km) were made through the stratus layer before the dispersal of seeding materials. Four hygroscopic flares were burned, two at a time, inside the layer cloud from 08:01–08:08 UTC at H=4.10 km. Weak updrafts ( m s−1) prevailed, indicating that the flare material might have drifted horizontally. Increased mass concentrations of K* and Cl* are noted downwind after the dispersal of the seeding agents, as shown in Fig. 5b and c. Repeated crosswind cloud passes at a similar level (T=6.44 °C, H=4.10 km) were made downwind of the seeding. The aircraft could release non-volatile and fine aerosol particles through exhaust emission (Anderson et al., 1998), which may also contaminate the cloud mass. Prabhakaran et al. (2023) measured aerosol size distribution of background air mass and then the background with aircraft exhaust during CAIPEEX. They reported that the aircraft exhaust can impact mean radius, spectral width, and number concentrations of different modes of log-normal aerosol size distribution (see the Supplement; https://doi.org/10.1175/BAMS-D-21-0291.2). The solution of simple advection equations indicates dispersal of seeding plumes in the downwind region after nearly 3 min (not shown here) where the aircraft also recorded enhanced concentrations of K* and Cl*. Gayatri et al. (2023) illustrated the seeding impact downwind of the seeded area through the high-resolution numerical model in a similar monsoon environment with the monsoon low-level jet (LLJ) as detailed in the present study. The cloud bases are situated very close to the region with high wind speeds in the monsoon LLJ, and the advection of the seeding plume downwind of the seeded location is noted. However, seeding was done specifically in the strong updraft zones, the seed particles were also lifted inside the cloud, and more cloud droplets were noted both in the observations and simulations. Earlier, the Seeded and Natural Orographic Wintertime Clouds: The Idaho Experiment (SNOWIE) (Xue et al., 2022) noted seeding plumes dispersed within orographic clouds in more than 1 h along the slanted downwind direction.
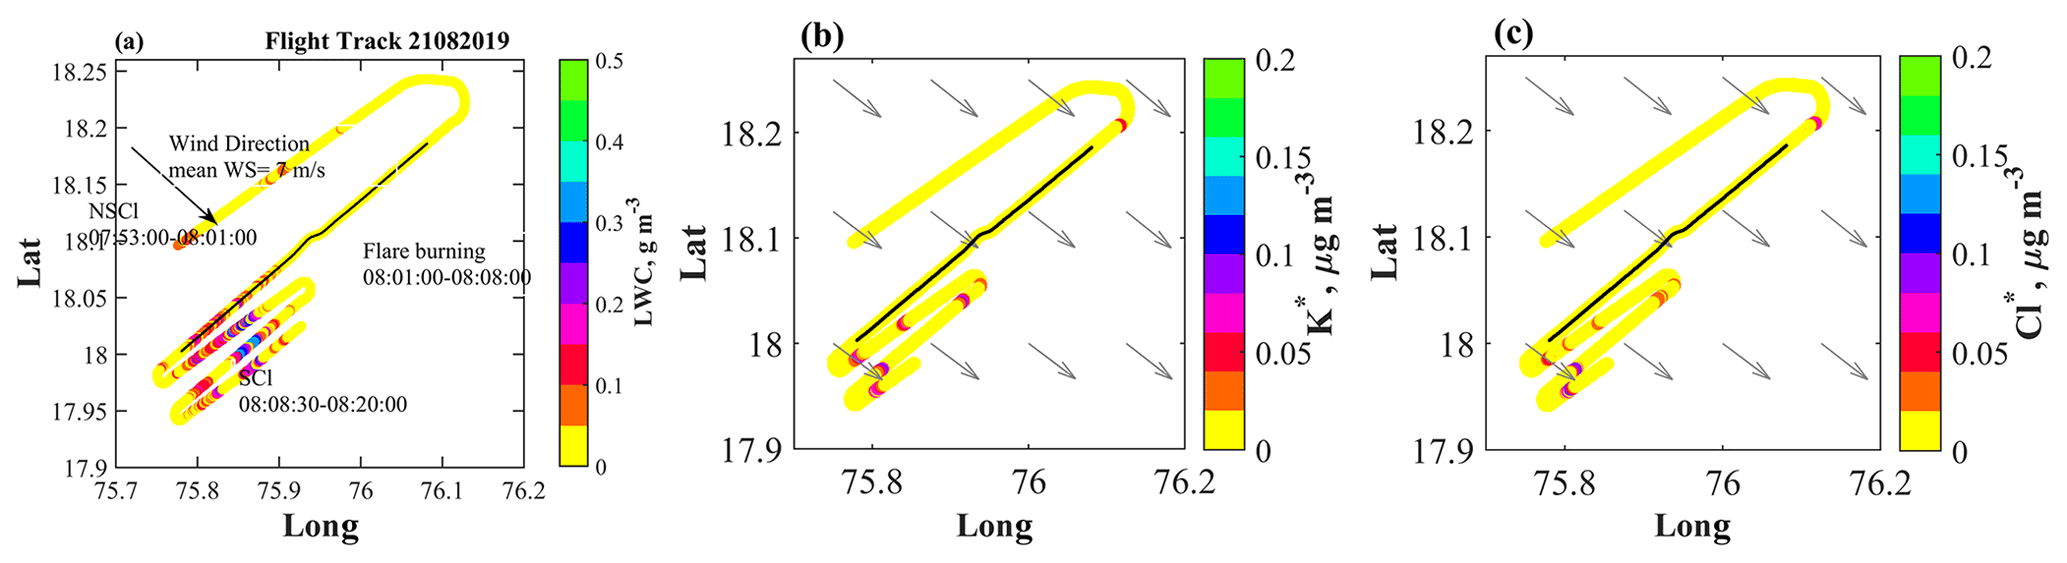
Figure 5(a) The flight path during the seeding experiment on 21 August 2019 colour coded by LWC at 1 Hz resolution. Periods during which cloud measurements were made for non-seeded clouds (NSCl) and seeded clouds (SCl) are annotated. Mass concentrations of (b) K* and (c) Cl* during the seeding experiment are shown along the flight track. The ambient wind fields shown as arrows are obtained from https://cds.climate.copernicus.eu/ (last access: 25 September 2020) (0.25° × 0.25°), which are resampled to 0.125° × 0.125°. A small area of elevated K and Cl prior to the flare burning is noted. This was measured outside the cloudy region as suggested by the LWC values, and it might be due to other unknown sources.
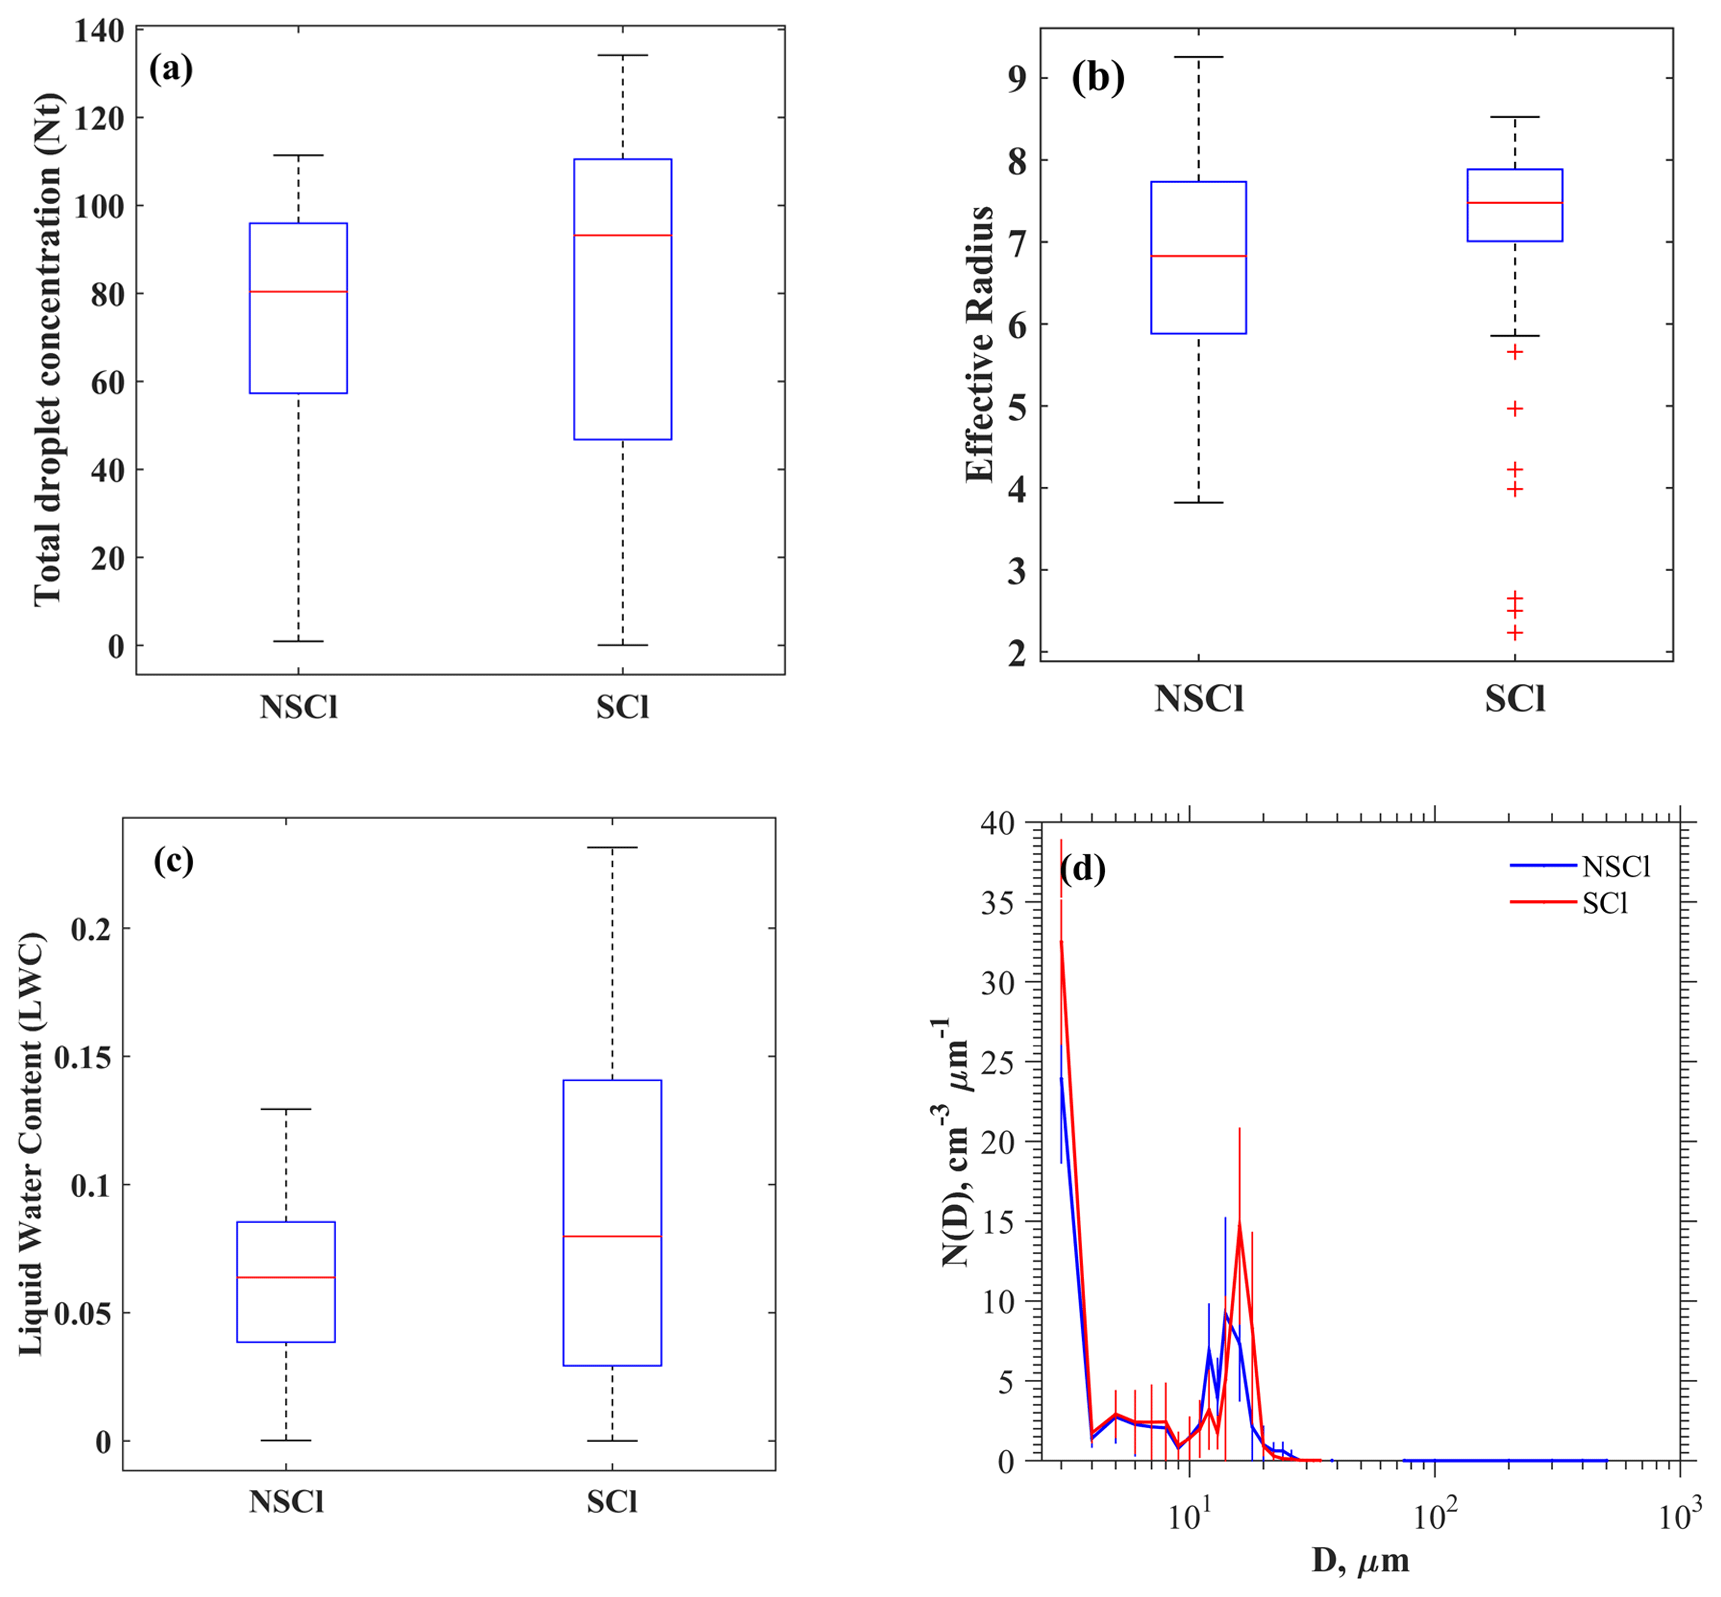
Figure 6Box plots of (a) total droplet concentrations, (b) effective radius, and (c) LWC shown for NSCl and SCl. (d) Mean cloud DSDs with standard deviations (vertical bars) are depicted indicating the variability. The selected DSDs fall within the criteria of 0.75< LWC/LWCmax<1.
Stratus cloud passes were selected for study based on two criteria: a cloud pass duration greater than or equal to 5 s and Nt>10 cm−3. Two NSCl cloud passes made during 07:53:00–07:53:31 and 07:55:17–07:55:41 UTC were chosen for the analysis. After the flares had dispersed, three passes during 08:08:37–08:08:45, 08:09:42–08:09:53, and 08:09:59–08:10:39 UTC were selected based on the elevated levels of detection of K and Cl (see Fig. 5b and c). Box plots of Nt, re, and LWC are displayed for NSCl and SCl in Figs. 6a, b, and c, respectively. It is worth noting that the SCl cases exhibit greater median values for these three parameters. The properties of DSDs along the cloud pass are shown in the Supplement (Figs. S1 and S2). The DSD properties and mass concentrations of K* and Cl* are provided in Table 3. Increased droplet concentrations in the smallest-sized bin are noted after a few minutes from the seeding time, while drizzle drops were not observed in the SCl. Comparisons are made for mean SCl DSD and NSCl DSD in the range 0.75< LWC/LWCmax<1, as illustrated in Fig. 6d. An increase in N(D) at D≈3 µm and in the size range µm are noted in the SCl, while N(D) decreased in the size range µm. The increase in the smallest cloud droplets may be due to freshly nucleated aerosols, likely due to the activation of seeding materials. The increase in the mid-size droplet concentrations could be due to the activation of coarse-mode aerosols and subsequent diffusional growth. Since drizzle drops were not formed, it may suggest that hygroscopic seeding in stratus cloud with low LWC values, e.g. <0.5 g m−3, may not yield a significant positive seeding effect for the production of drizzle.
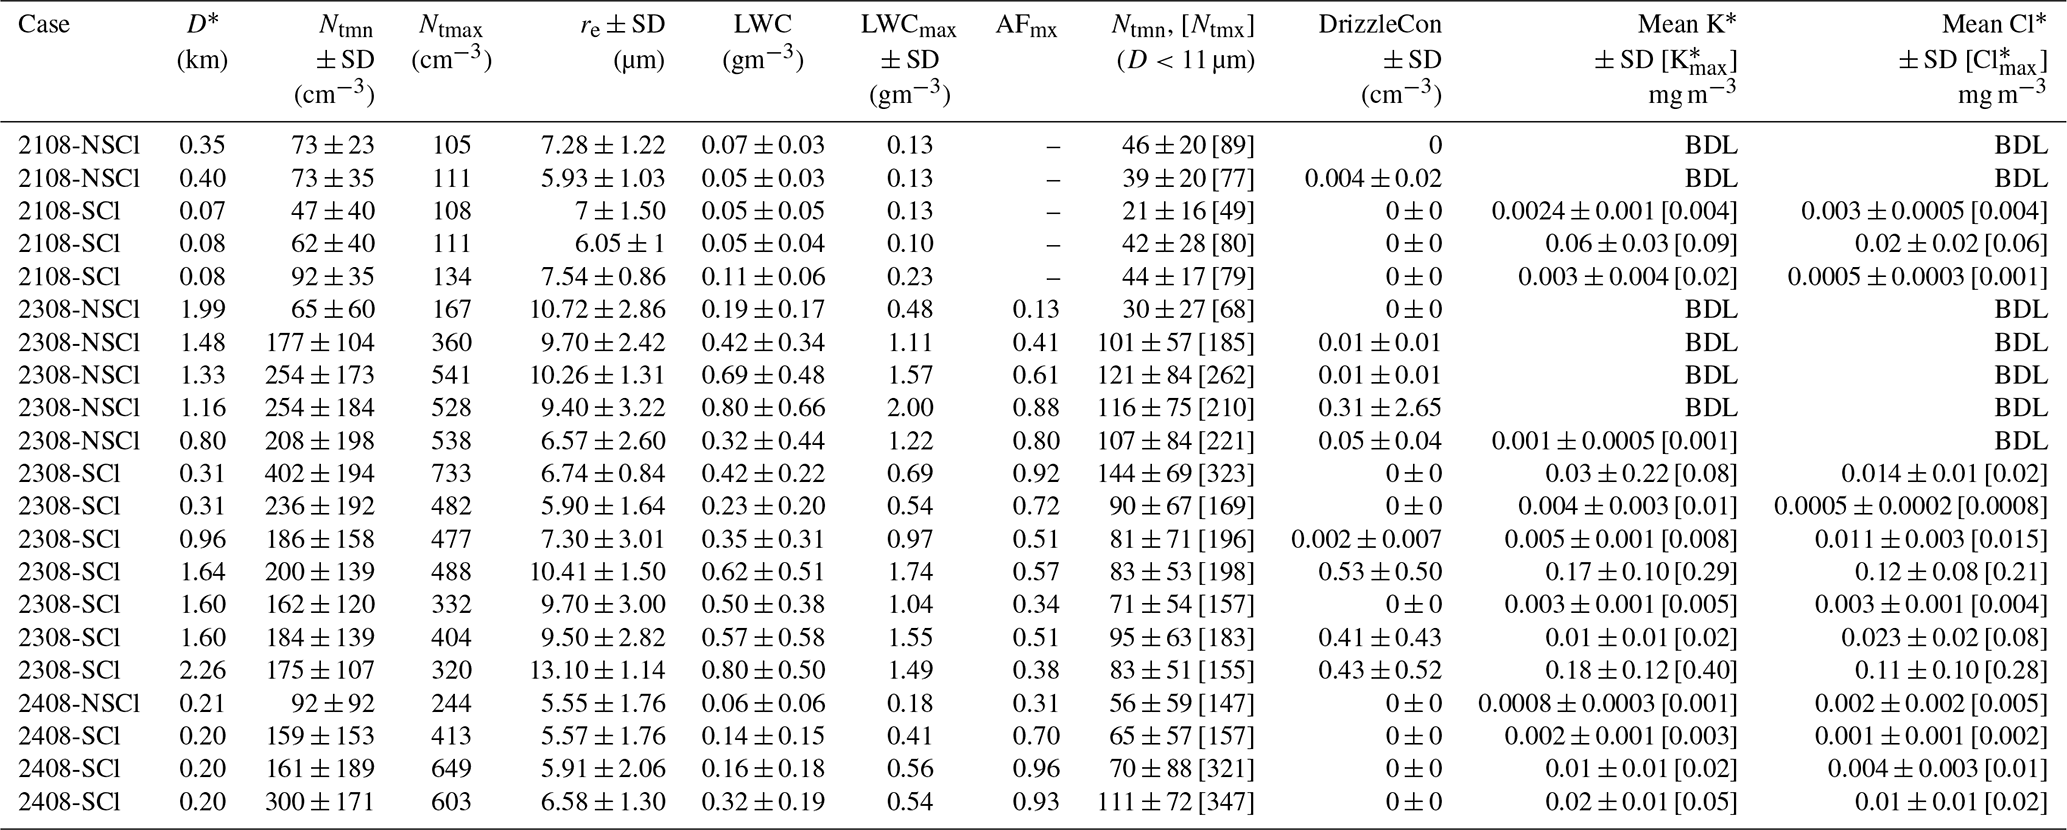
Table 3Cloud properties of non-seeded cloud (NSCl) and seeded cloud (SCl) along the cloud transect are shown. Vertical distance above the cloud base (D*, km), Mean values and standard deviation of total droplet concentration Nt (cm−3) in the diameter range 2–50 µm, maximum droplet concentration (Ntmax, cm−3), mean effective radius (re, µm), liquid water content (LWC, gm−3), maximum LWC (LWCmax), and maximum adiabatic fraction (AFmx= LWCmax/LWCad, where LWCad is the adiabatic LWC calculated from a parcel model). AFmx for layer clouds on 21 August 2019 is not calculated. The mean of small droplet concentration (D<11 µm) and the maximum of small droplet concentration and the drizzle concentration (DrizzleCon; cm−3) are also shown. Concentrations of K* and Cl* (in µg m−3) during NSCl and SCl observations are indicated. Due to limited field calibrations, the concentrations presented here are nitrate equivalent. Below detection limit (BDL) data are indicated. The maximum values of K* and Cl* in a cloud pass are indicated by and .
2.5.2 Case ii: 23 August 2019
Figure 7a depicts the flight patterns for the case on 23 August 2019. This seeding event is selected for evaluation because (i) the SCl and NSCl convective clouds were isolated and in the growing and non-precipitating stages; (ii) the cloud top was below freezing level (5 km) and therefore ideal for studying warm rain microphysics; (iii) the SCl and NSCl were formed within the same area (20 km × 20 km); and, lastly, (iv) both the SCl and NSCl grew to similar cloud top altitudes (≈ 4 km) and were therefore roughly at similar growth stages. These conditions made this case suitable for evaluating the seeding effect on warm rain. The cloud base height over the observational area was nearly 1.80 km. North-westerly winds (mean wind speed of 12 m s−1) prevailed in the boundary layer at 1.30 km (850 mb). Before the dispersal of flare materials at cloud base, the cloud microphysical properties of NSCl were measured from 07:49 to 08:06 UTC by multiple step-wise cloud penetrations from the top (≈ 3.90 km) to near the cloud base (≈ 1.80 km). A maximum updraft of 4.40 m s−1 was observed at the cloud base. After completion of NSCl measurements, the aircraft then circled below the cloud base and burned four hygroscopic flares (two on each wing) in the updrafts during 08:08–08:12 UTC, followed by several step-wise cloud penetrations at nearly 1000 ft intervals, from near the cloud base to cloud top during the period 08:14–08:28 UTC.
The profiles of Nt and re with respect to the D*s are shown in Fig. 7b and c. The mass concentrations of K* and Cl* corresponding to Nt and re, respectively, are also indicated. The statistical properties of the DSD parameters are presented in Table 3. The variations in DSDs along the cloud transects, values of re, drizzle concentration, LWC, and W are shown in the Supplement (Figs. S3–S4). Note that the SCl and NSCl were not identical due to the natural variability discussed previously. With this background the following observations are noted.
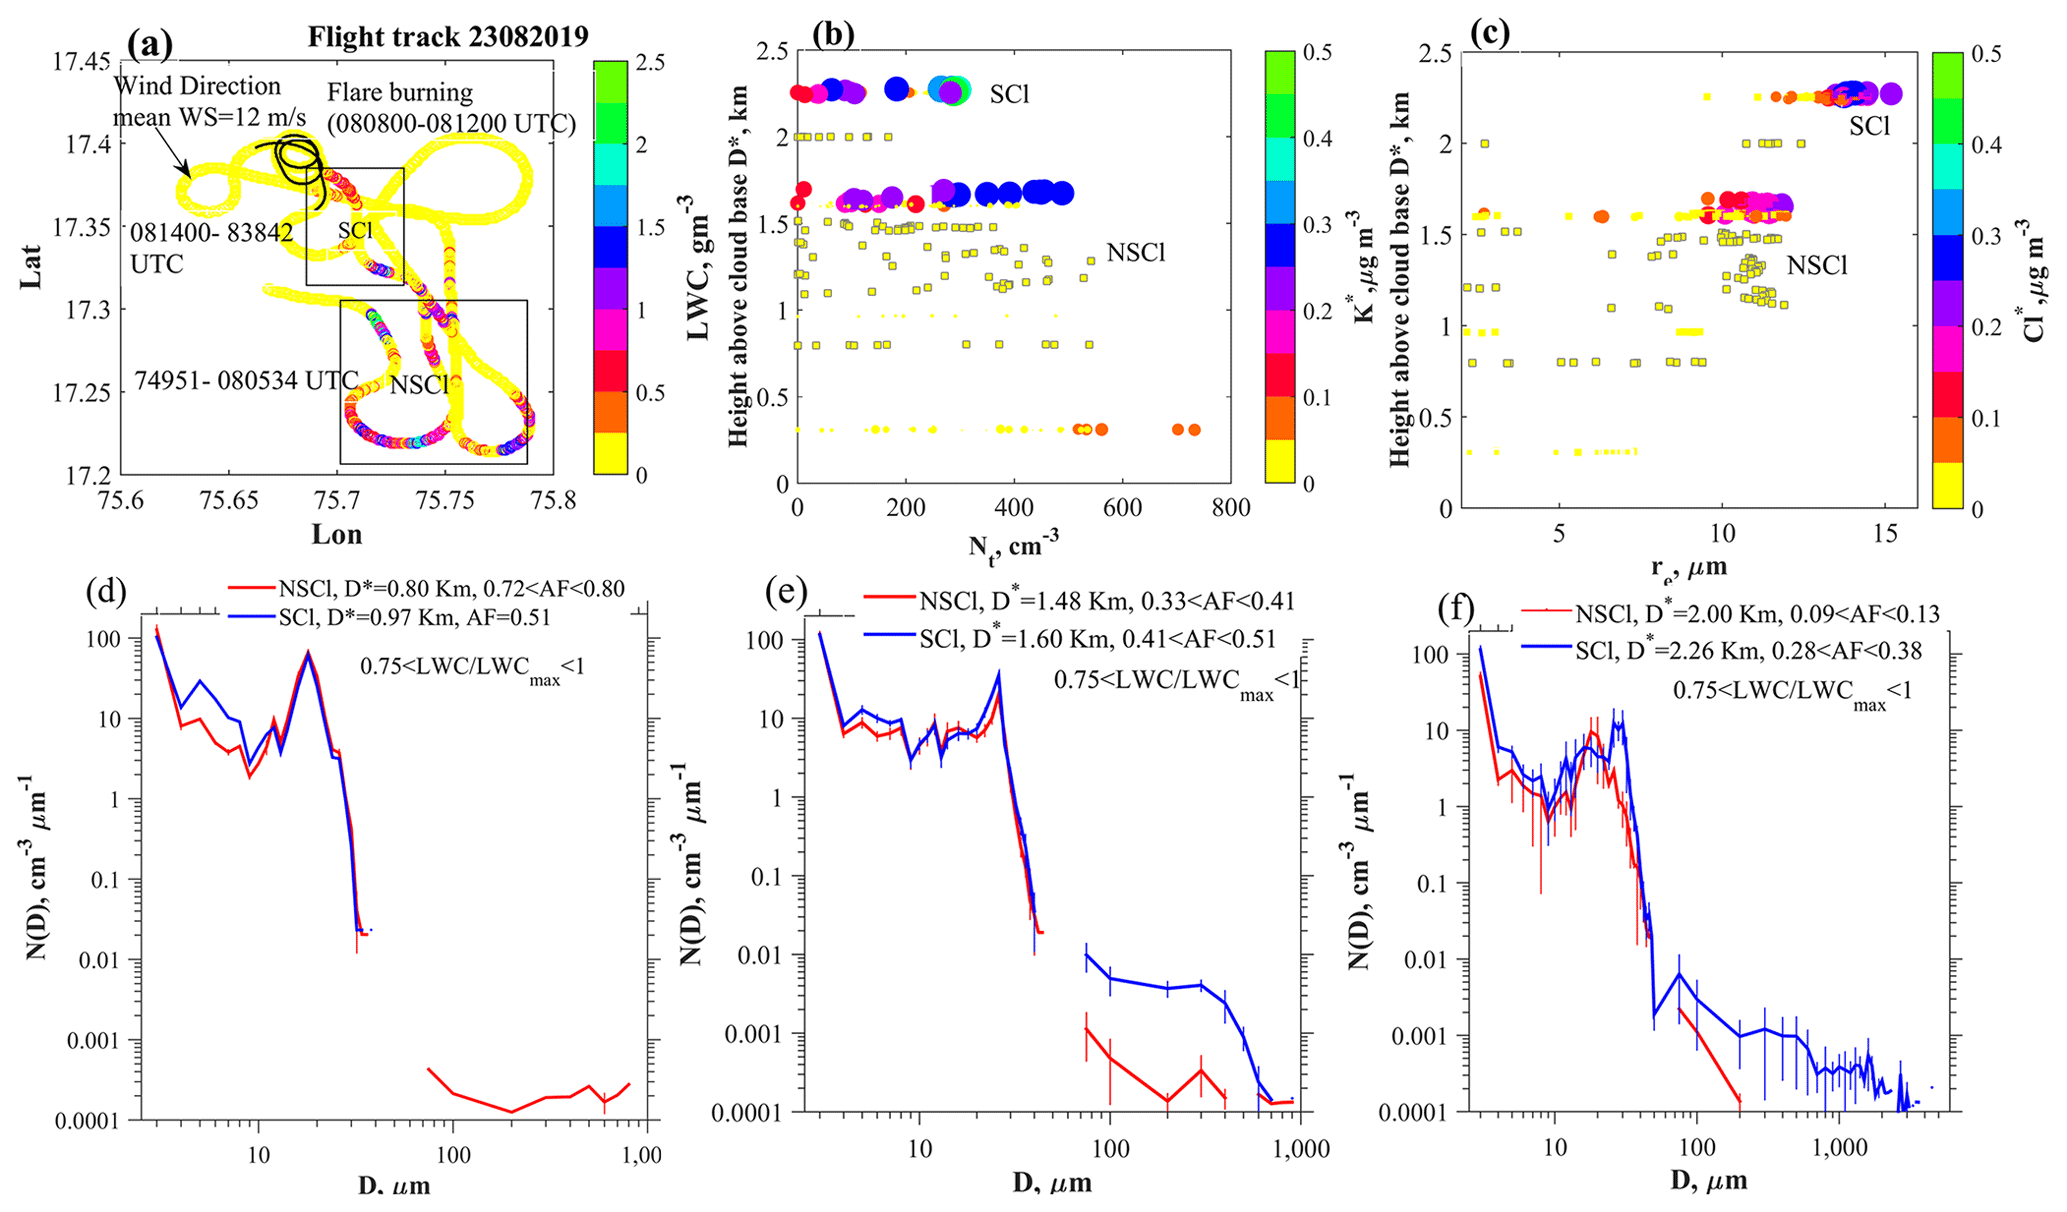
Figure 7(a) Flight track during the seeding experiment on 23 August 2019. The flight track during the flare burning period is overlaid with black colour. The areas of seeded cloud (SCl) and non-seeded cloud (NSCl) are indicated in the figure panels. The arrow indicates the wind direction near the cloud base height of 1.80 km. The colour bar indicates the liquid water content (LWC, gm−3) of clouds. Profiles of (b) Nt (cm−3) and (c) re (µm) with respect to height above cloud base, D* (km), are shown. The parameters are indicated in the colour bars with the mass densities of K* and Cl* (µg m−3). The squares with black edges indicate NSCl, while filled circles indicate SCl. The sizes of the symbols increase with increasing mass of the chemical components. (d, e, f) Mean cloud drop size distributions with standard deviations indicated by the error bars of slightly diluted clouds (0.75 < LWC/LWCmax<1) at various D* (km) for NSCl and SCl.
At nearly km, smaller mean concentrations of Nt (186±158 cm−3) are noted for SCl compared to the NSCl ( cm−3) cloud pass at km. At these two nearly similar levels, the mean re values for the SCl case ( µm) were greater than those for the NSCl case ( µm). At greater D* of 1.60 km ( µm) and 2.26 km ( µm), drizzle drops (see Table 3) were noted in the SCl cases. This may indicate an active CC process in the SCl case. The mean DSDs are shown in Fig. 7d and e, selected considering the criteria 0.75 < LWC/LWCmax < 1 of the cloud transects. The corresponding AF values indicated in the panels suggest active entrainment and mixing processes in these clouds. The production of drizzle in some of the clouds may also lower the AF values, which means that the dilution rate is not accurate in such clouds. The seeding effect may give rise to the initial production of drizzle particles, which were seen within the tail of the DSDs. Hence, the tail effect of the seeding particles appears to be active. Note that since the cloud passes were made in the developing stage of the cloud, these drizzle drops were formed spontaneously and did not fall from the cloud tops because their terminal velocities are less than the updraft velocities. The broadening of the DSDs will serve to further increase the efficiency of the CC process (Andreae et al., 2004; Rosenfeld et al., 2008; Rosenfeld and Gutman, 1994; Freud and Rosenfeld, 2012; Konwar et al., 2012), leading to the production of drizzle drops at higher D*s. Also, stronger updrafts (≈ 5 m s−1) were observed in SCl (see Fig. S4n), which helped in the growth of larger-sized droplets.
The formation of drizzle drops (D>100 µm) in the SCl was noted (Figs. 7e, f and S4), while no significant drizzle concentrations were noticed for NSCl (Fig. S3). The difference in drizzle concentration suggests that the flare particles modulate the mid-size cloud droplets (D≈14 µm) that grow further by diffusion process. As the drizzle drops fall under the influence of gravity, stronger downdrafts are most likely due to the cooling by evaporation (see Fig. S4n). Moreover, small droplets of D≤11 µm were observed at high altitudes for both clouds (Table 3). The scatter plots between re-K* and re-Cl* are shown in Fig. S5. The prevailing dynamical conditions, e.g. vertical velocity, are also indicated. It is found that the larger-sized droplets (greater re values) are associated with the larger mass concentrations of K* and Cl* in the SCl. In both the updrafts and downdrafts, all these chemical species were present. Having found the seeding tracers Cl* and K* at different altitudes, it may be emphasized that the modification of cloud properties occurs due to the dispersal of seeding particles through the cloud base. Seeding particles were present at deeper D*s as the cloud droplets were transported through updrafts and re-circulated as the cloud developed (Khain et al., 2013).
It is important to note that the differences in cloud microphysical properties observed between the seeded and unseeded clouds could be a result of natural variability, and more data are needed to arrive at a statistically significant result. However, given that these differences were accompanied by statistically different concentrations of chemical composition in the cloud droplet residues in the same environmental conditions, the evidence is compelling that (a) seed material has transported to altitudes above the cloud base where it was released and (b) these aerosol particles have influenced cloud microphysical processes.
2.5.3 Case iii: 24 August 2019
The third cloud seeding case was carried out on an isolated convective cloud. The flight path is shown in Fig. 8a. South-westerly winds with a mean speed of 9 m s−1 were noted near the cloud base at 2.1 km with a maximum updraft of 8 m s−1. One cloud pass before the flare dispersal was made from 08:55–08:59 UTC above the cloud base at ≈ 2.3 km. Three downwind cloud passes during 09:05–09:07 UTC were made at ≈ 2.3 km after the flares were burned. The variations in Nt and re with respect to D* are shown in Fig. 8b and c. Increased mass concentrations of K* and Cl* are noted in SCl cases that identify the seeded clouds. The DSD properties of the clouds are shown in Figs. S6 and S7, and their parameters are indicated in Table 3. The mean DSDs (Fig. 8d) indicate increased droplet concentration in the small and middle drop diameter ranges. Note that the AF values indicated strong dilution in the NSCl DSDs, which may also impact the observed differences in the droplet number densities. No marginal increment in re values was observed in the SCl. Another aspect to consider here is the effect of a strong updraft of 8 m s−1. Using the Twomey (1959) equation the maximum droplet concentration formed in an updraft (W) can be expressed in terms of W and CCN SS spectra, i.e. NCCN=CSSk (Roger and Yau, 1989):
Here, W is in centimetres per second (cm s−1) and NCCN=799 SS0.43, which is obtained from the CCN counter (Roberts and Nenes, 2005; Nenes et al., 2001, and reference therein) operated in the research aircraft. During the cloud passes, maximum updrafts of W=2.89, 1.00, and 1.91 m s−1 were obtained. These values suggest that droplets formed in these updrafts could be 593, 448, and 531 cm−3, respectively. If we use the maximum updraft speed of 8 m s−1 measured below cloud base, the droplet concentrations formed in this updraft could be as high as 777 cm−3. In this scenario, the supersaturation could be greater than 1 %, which can activate small-sized CCN. Therefore, the presence of strong updrafts that yield high SS could be one reason for the increasing Nt in the seeded clouds, while dry air mixing in the NSCl cases could be another reason for the smaller concentration of Nt. These processes may be attributed to the change in LWC values in the SCl cases.
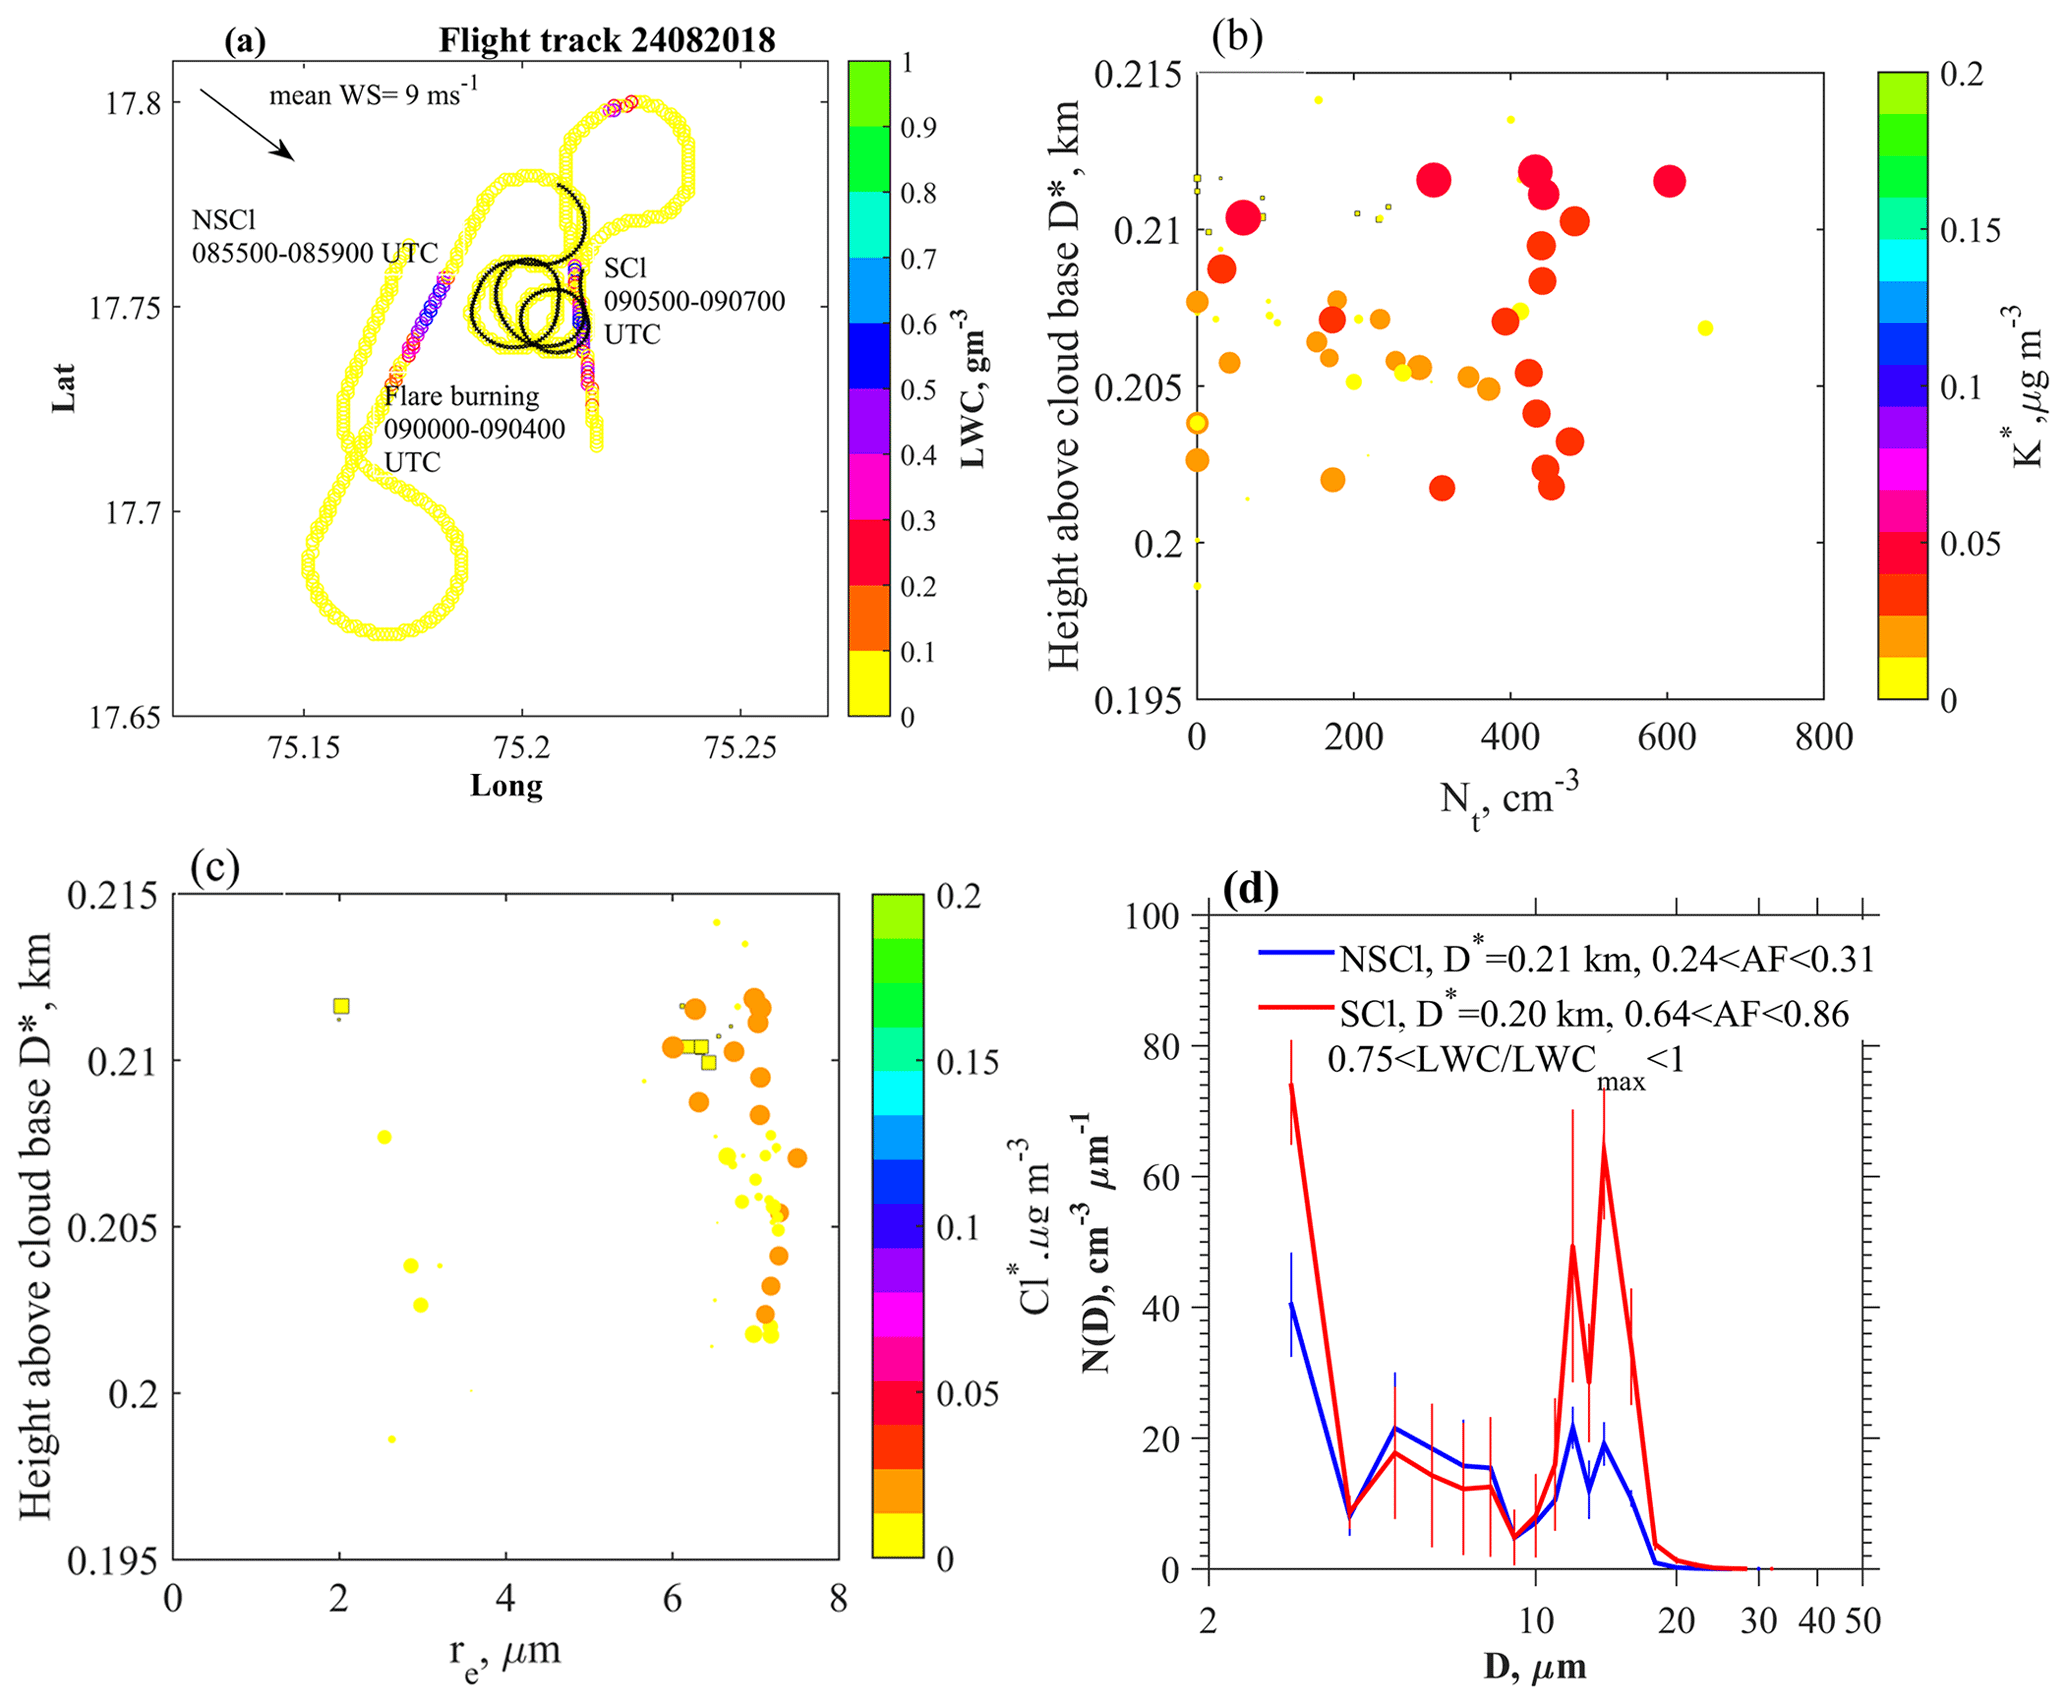
Figure 8(a) Flight path during the seeding experiment on 24 August 2019. Periods during which cloud measurements were made for NSCl and SCl are indicated. The black line indicates the flare burning. Profiles of (b) Nt and (c) re with respect to D* (km). The parameters are indicated with the mass concentrations of K* (µg m−3) and Cl* (µg m−3). (d) Mean DSDs with standard deviations indicated by the vertical bars of clouds (0.75 < LWC/LWCmax<1) above the cloud base for NSCl and SCl. The adiabatic LWC fractions corresponding to the DSDs are also indicated.
The successful identification of seeded cloud hydrometeors and the tracing back to their seeding origins in cloud seeding experiments have been an outstanding challenge for cloud seeding operations. The unequivocal identification of seeding material within clouds was the primary difficulty in such experiments. During the CAIPEEX 2019 seeding experiments conducted in India, we measured cloud microphysical properties and traced the seeding material with an mAMS behind a CVI in convective and stratus clouds.
In our experiments, the mAMS identified an enhancement of both K and Cl mass concentrations, most likely from the oxidizing agent (KClO) and seed material (CaCl2). In stratus and convective clouds, such enhanced concentrations of refractory K and Cl should be considered a seeding signature.
Enhanced small-sized droplet concentrations that were measured near the cloud base of convective clouds and in a warm stratus layer are noted. This result indicates that during the monsoon season with an available moisture supply, even the small-sized CCN present in the seed material could be activated into cloud droplets. The presence of strong updrafts near the cloud base of isolated convective clouds could also play a major role in the activation of small-sized CCN to cloud droplets. These strong updrafts would yield high supersaturation values, thus activating small-sized CCN. The impact of strong updrafts on the activation of cloud droplets, especially when seeding agents are dispersed below the cloud base, requires more focused attention and study.
In the case of a convective cloud, clear differences in the cloud microphysical properties of SCl compared to NSCl are noted. The flare materials released below the cloud base were lifted to a height of 2.25 km above the cloud base. In the lower part of the SCl larger droplet concentrations were noted. The SCl also had a larger re than the NSCl at similar heights above the cloud base. The seeded clouds contained more drizzle drops, suggesting that they reached the threshold for warm rain initiation at a lower distance from the cloud base than the non-seeded clouds. These results from the limited sample indicate the plausible tail effect of the largest particles in the flares, initiating large cloud drops and drizzle. Though this case study indicate the importance of tail effects, conclusive evidence would require much more data.
Whether competition or the tail effect is important in a successful cloud experiment remains to be examined, as the prevailing dynamical conditions can play a significant role in controlling the cloud microphysical processes. These complexities need to be addressed with more experiments using mAMS.
This study identifies a novel methodology to simultaneously track and measure the cloud seeding signatures and to assess how the seeding alters the microphysical properties of clouds leading to raindrop formation. The utilization of an mAMS in cloud seeding experiments together with a CVI allows for identifying the seeded cloud parcels of interest, leading to a better understanding of the effects on the microphysical properties of the cloud. Although these measurements of flare material in seeded clouds are associated with changes in physical properties, the data set is too limited to unequivocally assert that this methodology will always be successful. Future studies with a much larger data set will provide more statistical evidence linking seed aerosol and increases in precipitation.
The mAMS and cloud data are available at https://iitmcloud.tropmet.res.in/index.php/apps/files/?'dir=/mAMS_Cloud_data&fileid=209642 (Konwar, 2024; login required).
The supplement related to this article is available online at: https://doi.org/10.5194/amt-17-2387-2024-supplement.
TP and DRW designed the mAMS experiment; MK, BW, and ECF prepared the initial draft; KH, MK, BW, ECF, SC, SB, NM, MV, SJ, and TP participated in the aircraft experiment; and DB, TP, DW, DA, PM, MK, BW, ECF, MV, SC, SB, and SAD reviewed the manuscript. All authors agree with the final version of the manuscript.
The contact author has declared that none of the authors has any competing interests.
Publisher’s note: Copernicus Publications remains neutral with regard to jurisdictional claims made in the text, published maps, institutional affiliations, or any other geographical representation in this paper. While Copernicus Publications makes every effort to include appropriate place names, the final responsibility lies with the authors.
We thank the director of IITM for continuous supports. The authors are grateful to the team members; the ground staff; Vinayak Ruge and Sachin Patil of M/S Tesscorn AeroFluid, Inc.; and the pilots for their dedicated efforts in conducting the project. The authors are grateful to the editor and two anonymous reviewers for their insightful suggestions that helped improve the manuscript.
The Indian Institute of Tropical Meteorology, Pune, and the CAIPEEX project are funded by the Ministry of Earth Sciences, Government of India.
This paper was edited by Pierre Herckes and reviewed by two anonymous referees.
Anderson, B. E., Cofer, W. R., Bagwell, D. R., Barrick, J. W., and Hudgins, C. H.: Airborne observations of aircraft aerosol emissions I: Total nonvolatile particle emission indices, Geophys. Res. Lett., 25, 1689–1692, 1998.
Andreae, M. O., Rosenfeld, D., Artaxo, P., Costa, A. A., Frank, G. P., Longo, K. M., and Silva-Dias, M. A. F.: Smoking rain clouds over the Amazon, Science, 303, 1337–1342, 2004.
Baumgardner, D.: An analysis and comparison of five water droplet measuring instruments, J. Appl. Meteor., 22, 891–910, 1983.
Baumgardner, D., Jonsson, H., Dawson, W., O'Connor, D. and Newton, R.: The cloud, aerosol and precipitation spectrometer (CAPS): A new instrument for cloud investigations, Atmos. Res., 59–60, 251–264, 2001.
Baumgardner, D., Abel, S., Axisa, D., Cotton, R., Crosier, J., Field, P., Gurganus, C., Heymsfield, A., Korolev, A., Krämer, M., Lawson, P., McFarquhar, G., Ulanowski, J. Z., and Shik Um, J.: Chapter 9: Cloud Ice Properties – In Situ Measurement Challenges, AMS Monograph on Ice Formation and Evolution in Clouds and Precipitation: Measurement and Modeling Challenges, edited by: Baumgardner, D., McFarquhar, G., and Heymsfield, A., Boston, MA, 58, 9.1–9.22, 2016.
Bowen, E. G.: A new method of stimulating convective clouds to produce rain and hail, Q. J. Roy. Meteorol. Soc., 78, 37–45, 1952.
Bruintjes, R. T.: A review of cloud seeding experiments to enhance precipitation and some new prospects, B. Am. Meteorol. Soc., 80, 805–820, 1999.
Bruintjes, R. T., Clark, T. L., and Hall, W. D.: The dispersion of tracer plumes in mountainous regions in central Arizona: Comparisons between observations and modeling results, J. Appl. Meteorol., 34, 971–988, 1995.
Bruintjes, R. T., Salazar, V., Semeniuk, T. A., Buseck, P., Breed, D. W., and Gunkelman, J.: Evaluation of Hygroscopic Cloud Seeding Flares, The J. Weather Modi., 44, 69–94, 2012.
Canagaratna, M. R., Jayne, J. T., Jimenez, J. L., Allan, J. D., Alfarra, M. R., Zhang, Q., Onasch, T. B., Drewnick, F., Coe, H., Middlebrook, A., Delia, A., Williams, L. R., Trimborn, A. M., Northway, M. J., DeCarlo, P. F., Kolb, C. E., Davidovits, P., and Worsnop, D. R.: Chemical and microphysical characterization of ambient aerosols with the aerodyne aerosol mass spectrometer, Mass Spectro. Rev., 26, 185–222, 2007.
Cooper, W. A., Bruintjes, R. T., and Mather, G. K.: Calculations pertaining to hygroscopic seeding with flares, J. Appl. Meteorol., 36, 1449–1469, 1997.
DeCarlo, P. F., Kimmel, J. R., Trimborn, A., Northway, M. J., Jayne, J. T., Aiken, A. C., Gonin, M., Fuhrer, K., Horvath, T., Docherty, K. S., Worsnop, D. R., and Jimenez, J. L.: Field-deployable, high-resolution, time-of-flight aerosol mass spectrometer, Anal. Chem., 78, 8281–8289, 2006.
Drewnick, F., Diesch, J.-M., Faber, P., and Borrmann, S.: Aerosol mass spectrometry: particle–vaporizer interactions and their consequences for the measurements, Atmos. Meas. Tech., 8, 3811–3830, https://doi.org/10.5194/amt-8-3811-2015, 2015.
Flossmann, A., Michael, M., Abshaev, A., Bruintjes, R., Masataka, M., Prabhakaran, T., and Zhanyu, Y.: Review of advances in precipitation enhancement research, B. Am. Meteorol. Soc., 100, 1465–1480, 2019.
Freud, E. and Rosenfeld, D.: Linear relation between convective cloud drop number concentration and depth for rain initiation, J. Geophys. Res.-Atmos., 117, D02207, https://doi.org/10.1029/2011JD016457, 2012.
French, J. R., Friedrich, K., Tessendorf, S. A., Rauber, R. M., Geerts, B., Rasmussen, R. M., Xue, L., Kunkel, M. L., and Blestrud, D. R.: Precipitation formation from orographic cloud seeding, P. Natl. Acad. Sci. USA, 115, 1168–1173, 2018.
Friedrich, K., Ikeda, K., Tessendorf, S. A., French, J. R., Rauber, R. M., Geerts, B., Xue, L., Rasmussen, R. M., Blestrud, D. R., Kunkel, M. L., Dawson, N., and Parkinson, S: Quantifying snowfall from orographic cloud seeding, P. Natl. Acad. Sci. USA, 117, 5190–5195, https://doi.org/10.1073/pnas.1917204117, 2020.
Gayatri, K., Prabhakaran, T., Malap, N., Konwar, M., Gurnule, D., Bankar, S., and Murugavel, P.: Physical evaluation of hygroscopic cloud seeding in convective clouds using in situ observations and numerical simulations during CAIPEEX, Atmos. Res., 284, 1–17, https://doi.org/10.1016/j.atmosres.2022.106558, 2023.
Ghate, V. P., Albrecht, B. A., Kollias, P., Jonsson, H. H., and Breed, D. W.: Cloud seeding as a technique for studying aerosol-cloud interactions in marine stratocumulus, Geophys. Res. Lett., 34, L14807, https://doi.org/10.1029/2007GL029748, 2007.
Giordano, M. R., Kalnajs, L. E., Goetz, J. D., Avery, A. M., Katz, E., May, N. W., Leemon, A., Mattson, C., Pratt, K. A., and DeCarlo, P. F.: The importance of blowing snow to halogen-containing aerosol in coastal Antarctica: influence of source region versus wind speed, Atmos. Chem. Phys., 18, 16689–16711, https://doi.org/10.5194/acp-18-16689-2018, 2018.
Golderger, L. A., Pekour, M. S., and Hubbe, J. M.: Counterflow Virtual Impactor (CVI) Inlet Aboard Aircraft (INLETCVI-AIR) Instrument Handbook, DOE/SC-ARM-TR-254, https://www.arm.gov/publications/tech_reports/handbooks/doe-sc-arm-tr-254.pdf (last access: 20 March 2024), 2020.
Hindman, E. E.: Water droplet fogs formed from pyrotechnically generated condensation nuclei, J. Weather. Modif., 10, 77–96, 1978.
Jayne, J. T., Leard, D. C., Zhang, X., Davidovits, P., Smith, K. A., Kolb, C. E., and Worsnop, D. R.: Development of an Aerosol Mass Spectrometer for Size and Composition Analysis of Submicron Particles, Aerosol Sci. Technol., 33, 49–70, https://doi.org/10.1080/027868200410840, 2000.
Khain, A. P, Prabha, T. V., Benmoshe, N., Pandithurai, G., and Ovchinnikov, M.: The mechanism of first raindrops formation in deep convective clouds, J. Geophys. Res., 118, 9123–9140, 2013.
Konwar, M.: mAMS and cloud data, IITM, Pune, https://iitmcloud.tropmet.res.in/index.php/apps/files/?'dir=/mAMS_Cloud_data&fileid=209642 (last access: 20 March 2024), 2024.
Konwar, M., Maheskumar, R. S., Kulkarni, J. R., Freud, E., Goswami, B. N., and Rosenfeld, D.: Aerosol control on depth of warm rain in convective clouds, J. Geophys. Res., 117, D13204, https://doi.org/10.1029/2012JD017585, 2012.
Konwar, M., Prabhakaran, T., Khain, A., and Pinsky, M.: Cloud microphysical structure analysis based on high-resolution in-situ measurements, J. Atmos. Sci., 78, 2265–2285, 2021.
Konwar, M., Malap, N., Hazra, A., Axisa, D., Prabhakaran, T., and Khain, A.: Measurement of Flare Size Distribution and Simulation of Seeding Effect with a Spectral Bin Parcel Model, Pure Appl. Geophys., 180, 3019–3034, https://doi.org/10.1007/s00024-023-03293-z, 2023.
Korolev, A. V., Isaac, G. A., Strapp, J. W., Cober, S. G., and Barker, H. W.: In situ measurements of liquid water content profiles in midlatitude stratiform clouds, Q. J. Roy. Meteorol. Soc., 133, 1693–1699, https://doi.org/10.1002/qj.147, 2007.
Kuba, N. and Murakami, M.: Effect of hygroscopic seeding on warm rain clouds – numerical study using a hybrid cloud microphysical model, Atmos. Chem. Phys., 10, 3335–3351, https://doi.org/10.5194/acp-10-3335-2010, 2010.
Kulkarni, J. R., Maheshkumar, R. S., Morwal, S. B., Padma Kumari, B., Konwar, M., Deshpande, C. G., Joshi, R. R., Bhalwankar, R. V., Pandithurai, G., Safai, P. D., Narkhedkar, S. G, Dani, K. K., Nath, A., Nair, S., Sapre, V. V, Puranik, P. V., Kandalgaonkar, S., Mujumdar, V. R., Khaladkar, R. M., Vijayakumar, R., Thara, P., and Goswami, B. N.: The cloud aerosol interaction and precipitation enhancement experiment (CAIPEEX): Overview and preliminary results, Curr. Sci., 12, 413–425, 2012.
Lance, S., Brock, C. A., Rogers, D., and Gordon, J. A.: Water droplet calibration of the Cloud Droplet Probe (CDP) and in-flight performance in liquid, ice and mixed-phase clouds during ARCPAC, Atmos. Meas. Tech., 3, 1683–1706, https://doi.org/10.5194/amt-3-1683-2010, 2010.
Martin, G. M., Johnson, D. W., and Spice, A.: The measurement and parameterisation of effective radius of droplets in warm stratocumulus clouds, J. Atmos. Sci., 51, 1823–1842, 1994.
Mather, G. K., Dixon, M. J., and de Jager, J. M.: Assessing the potential for rain augmentation – the Nelspruit randomized convective cloud seeding experiment, J. Appl. Meteorol., 35, 1465–1482, 1996.
Mather, G. K., Terblanche, D. E., Steffens, F. E., and Fletcher, L.: Results of the South African cloud seeding experiments using hygroscopic flares, J. Appl. Meteorol., 36, 1433–1447, 1997.
Nenes, A., Chuang, P., Flagan, R. C., and Seinfeld, J. H.: A Theoretical Analysis of Cloud Condensation Nucleus (CCN) Instruments, J. Geophys. Res., 106, 3449–3474, 2001.
Noone, K. J., Ogren, J. A., Heintzenberg, J., Charlson, R. J., and Covert, D. S.: Design and calibration of a counterflow virtual impactor for sampling of atmospheric fog and cloud droplets, Aerosol Sci. Technol., 8, 235–244, https://doi.org/10.1080/02786828808959186, 1988.
Ogren, J. A., Heintzenberg, J., and Charlson, R. J.: In-situ sampling of clouds with a droplet to aerosol converter, Geophys. Res. Lett.,12, 121–124, 1985.
Ogren, J. A., Heintzenberg, J., and Charlson, R. J.: Virtual impactor, US Patent No. 4,689,052, https://gml.noaa.gov/aero/about/ogren/index.html (last access: 20 March 2024), 1987.
Pinsky, M. and Khain, A. P.: Effects of in-cloud nucleation and turbulence on droplet spectrum formation in cumulus clouds, Quart. J. Roy. Meteorol. Soc., 128, 1–33, 2002.
Prabha, T. V., Khain, A., Maheshkumar, R. S., Pandithurai, G., Kulkarni, J. R., Konwar, M., and Goswami, B. N.: Microphysics of premonsoon and monsoon clouds as seen from in situ measurements during the Cloud Aerosol Interaction and Precipitation Enhancement Experiment (CAIPEEX), J. Atmos. Sci., 68, 1882–1901, 2011.
Prabhakaran, T., Murugavel, P., Konwar M., Malap, N., Gayatri, K., Dixit, S., Samanta, S., Chowdhuri., S., Bera, S., Varghese, M., Rao, J., Sandeep, J., Safai, P. D., Sahai, A. K., Axisa, D., Karipot, A., Baumgardner, D., Werden, B., Fortner, Ed, Hibert, K., Nair, S., Bankar, S., Gurnule, D., Todekar, K., Jose, J., Jayachandran, V., Soyam, P. S., Gupta, A., Choudhary, H., Aravindhavel, A., Kantipudi, S. B., Pradeepkumar, P., Krishnan, R., Nandakumar, K., DeCarlo, P. F., Worsnop, D., Bhat, G. S., Rajeevan, M., and Nanjundiah, R.: CAIPEEX – Indian cloud seeding scientific experiment, B. Am. Meteorol. Soc., 104, E2095–E2120, https://doi.org/10.1175/BAMS-D-21-0291.1, 2023.
Roberts, G. C. and Nenes, A.: A Continuous-Flow Streamwise Thermal-Gradient CCN Chamber for Atmospheric Measurements, Aeros. Sci. Tech., 39, 206–221, 2005.
Rosenfeld, D. and Gutman, G.: Retrieving microphysical properties near the tops of potential rain clouds by multispectral analysis of AVHRR data, Atmos. Res., 34, 259–283, 1994.
Rosenfeld, D., Woodley, W. L., Axisa, D., Freud, E., Hudson, J. G., and Givati, A.: Aircraft measurements ofthe impacts of pollution aerosols on clouds and precipitation over the Sierra Nevada, J. Geophys. Res., 113, D15203, https://doi.org/10.1029/2007JD009544, 2008.
Rosenfeld, D., Axisa, D., Woodley, W., and Lahav, R.: A quest for effective hygroscopic cloud seeding, J. Appl. Meteorol. Climatol., 49, 1548–1562, 2010.
Ryan, B. F. and King, W. D.: A critical review of the Australian experience in cloud seeding, B. Am. Meteorol. Soc., 78, 239–254, 1997.
Salcedo, D., Onasch, T. B., Dzepina, K., Canagaratna, M. R., Zhang, Q., Huffman, J. A., DeCarlo, P. F., Jayne, J. T., Mortimer, P., Worsnop, D. R., Kolb, C. E., Johnson, K. S., Zuberi, B., Marr, L. C., Volkamer, R., Molina, L. T., Molina, M. J., Cardenas, B., Bernabé, R. M., Márquez, C., Gaffney, J. S., Marley, N. A., Laskin, A., Shutthanandan, V., Xie, Y., Brune, W., Lesher, R., Shirley, T., and Jimenez, J. L.: Characterization of ambient aerosols in Mexico City during the MCMA-2003 campaign with Aerosol Mass Spectrometry: results from the CENICA Supersite, Atmos. Chem. Phys., 6, 925–946, https://doi.org/10.5194/acp-6-925-2006, 2006.
Segal, Y., Khain, A., Pinsky, M., and Rosenfeld, D.: Effects of hygroscopic seeding on raindrop formation as seen from simulations using a 2000-bin spectral cloud parcel model, Atmos. Res., 71, 3–34, 2004.
Segal, Y., Pinsky, M., and Khain, A.: The role of competition in raindrop formation, Atmos. Res., 83, 106–118, 2007.
Shingler, T., Dey, S., Sorooshian, A., Brechtel, F. J., Wang, Z., Metcalf, A., Coggon, M., Mülmenstädt, J., Russell, L. M., Jonsson, H. H., and Seinfeld, J. H.: Characterisation and airborne deployment of a new counterflow virtual impactor inlet, Atmos. Meas. Tech., 5, 1259–1269, https://doi.org/10.5194/amt-5-1259-2012, 2012.
Silverman, B. A.: A critical assessment of hygroscopic seeding of convective clouds for rainfall enhancement, B. Am. Meteorol. Soc., 84, 1219–1230, 2003.
Stith, J. L., Griffith, D. A., Lynn Rose, R., Flueck, J. A., Miller Jr., J. R., and Smith, P. L.: Aircraft observations of transport and diffusion in cumulus clouds, J. Appl. Meteorol. Climatol., 25, 1959–1970, 1986.
Stith, J. L., Detwiler, A. G., Reinking, R. F., and Smith, P. L.: Investigating transport, mixing, and the formation of ice in cumuli with gaseous tracer techniques, Atmos. Res., 25, 195–216, 1990.
Tessendorf, S. A.; Bruintjes, R. T., Weeks, C., Wilson, J. W., Knight, C. A., Roberts, R. D., Peter, J. R., Collis, S., Buseck, P. R., Freney, E., Dixon, M., Pocernich, M., Ikeda, K., Axisa, D., Nelson, E., May, P. T., Richter, H., Piketh, S., Burger, R. P., Wilson, L., Siems, S. T., Manton, M., Stone, R. C., Pepler, A., Collins, D. R., Bringi, V. N., Thurai, M., Turner, L., and McRae, D.: The Queensland Cloud Seeding Research Program. B. Am. Meteorol. Soc., 89, 75–90, https://doi.org/10.1175/BAMS-D-11-00060.1, 2012.
Twomey, S.: The nuclei of natural cloud formation, Part II: The supersaturation in natural clouds and the variation of cloud droplet concentration, Geofisica pura e applicata, 43, 243–249, 1959.
Wang, B. and Laskin, A.: Reactions between water-soluble organic acids and nitrates in atmospheric aerosols: Recycling of nitric acid and formation of organic salts, J. Geophys. Res., 119, 3335–3351, 2014.
WMO: Report on the WMO international workshop on hygroscopic seeding: Experimental results, physical processes, and research needs, WMP Report Series No. 35, WMO/TD-No. 1006, 68 pp., https://library.wmo.int/idurl/4/36954 (last access: 20 March 2024), 2000.
Xue, L., Weeks, C., Chen, S., Tessendorf, S. A., Rasmussen, R. M., Ikeda, K., Kosovic, B., Behringer, D., French, J. R., Friedrich, K., Zaremba, T. J., Rauber, R. M., Lackner, C. P., Geerts, B., Blestrud, D., Kunkel, M., Dawson, N., and Parkinson, S.: Comparison between Observed and Simulated AgI Seeding Impacts in a Well-Observed Case from the SNOWIE Field Program J. Appl. Meteorol. Climatol., 61, 345–367, https://doi.org/10.1175/JAMC-D-21-0103.1, 2022.
Yau, M. K. and Rogers, R. R.: Short Course in Cloud Physics, 3rd edn., Butterworth-Heinemann, https://shop.elsevier.com/books/a-short-course-in-cloud-physics/yau/978-0-08-057094-5 (last access: 20 March 2024), 1989.