the Creative Commons Attribution 4.0 License.
the Creative Commons Attribution 4.0 License.
 | 23 Apr 2024
Assessment of the spectral misalignment effect (SMILE) on EarthCARE's Multi-Spectral Imager aerosol and cloud property retrievals
David P. Donovan
Rene Preusker
Jürgen Fischer
Jan Fokke Meirink
Piet Stammes
Michael Eisinger
The Multi-Spectral Imager (MSI) on board the Earth Cloud, Aerosol and Radiation Explorer (EarthCARE) will provide horizontal information about aerosols and clouds. These measurements are needed to extend vertical cloud and aerosol property information, which is obtained from EarthCARE's active sensors, in order to obtain a full three-dimensional view of cloud and aerosol conditions. Mesoscale weather systems, in particular, will be characterized. The discovery of a non-compliance of the MSI visible–near-infrared–shortwave infrared (VNS) camera’s visible (VIS) and shortwave infrared (SWIR1) channels regarding a spectral central wavelength (CWVL) shift across-track of up to 14 nm (VIS) and 20 nm (SWIR1) led to the need for an analysis regarding its impact on MSI Level-2A aerosol and cloud products. A significant influence of the spectral misalignment effect (SMILE) on MSI retrievals is identified due to the spectral variation in gas absorption, surface reflectance, and aerosol and cloud properties within the spectral ranges of these MSI bands. For example, the VIS channel is positioned in close proximity to the red edge of green vegetation and is impacted by residual absorption of water vapor and ozone. Small central wavelength variations introduce uncertainties due to the rapid change in surface reflectance for conditions with low optical thickness. The present central wavelength shift in the VIS towards shorter wavelengths than at nadir introduces a relative error in transmission of up to 3.3 % due to the increasing influence of water vapor and ozone absorption. We found relative errors in the top-of-atmosphere (TOA) signal due to the SMILE of up to 30 % for low optical thickness over a land surface in that band. Since the magnitude of the impact strongly depends on the underlying surface and atmospheric conditions, we conclude that accounting for the SMILE in Level-2 retrievals or correcting the Level-1 signal will improve MSI aerosol and cloud product quality.
- Article
(3680 KB) - Full-text XML
- BibTeX
- EndNote


The European and Japanese Earth Cloud, Aerosol and Radiation Explorer (EarthCARE) mission aims to evaluate and enhance the representation of aerosols, clouds and precipitation in numerical weather prediction and climate models (Wehr et al., 2023). Three of the four instruments are used to measure profile and columnar information of aerosols and clouds. These are the ATmospheric LIDar (ATLID), the Cloud Profiling Radar (CPR) and the Multi-Spectral Imager (MSI).
The imager provides information about aerosol and clouds in the horizontal direction. It complements vertical information gained by the active instruments. In particular, the horizontal variability in atmospheric conditions and mesoscale cloud field structures in weather systems are supposed to be identified and characterized with MSI. In order to achieve that goal, the imager swath is broader than the active instrument and Broadband Radiometer (BBR) footprints (Wehr, 2006). MSI's swath is 150 km. It is tilted away from sun-glint-affected regions. This results in roughly 35 km of the swath being situated west of nadir and roughly 115 km east of nadir taking into account EarthCARE's afternoon orbit. In the past, a non-compliance of the MSI visible–near-infrared–shortwave infrared (VNS) camera's visible (VIS), near-infrared (NIR), and shortwave infrared 1 and 2 (SWIR1 and SWIR2, respectively) channels has been noticed regarding a spectral central wavelength shift as a function of the across-track pixel or viewing angle (Wehr et al., 2023). This spectral misalignment effect (SMILE) is caused by imperfections in the band-pass filters on the curved optical lenses (e.g., Wehr et al., 2023; Wang et al., 2023). Consequently, mitigation strategies have been implemented by the ESA and industry: a lens barrel rotation for the VIS channel and a full redesign of the NIR channel have been accomplished (Helière et al., 2017). However, no efficient technical solution was found for the SWIR1 and SWIR2 channels. Even though the VIS channel offers a more consistent central wavelength (CWVL) close to nadir now, a significant shift is still present when the entire across-track dimension is considered. Other imagers, like the Medium Resolution Imaging Spectrometer (MERIS), Hyperion or OLCI (Ocean and Land Colour Instrument), also had to handle spatial misalignments of the wavelength and different correction schemes have been developed (e.g., Bourg et al., 2008; Dadon et al., 2010; Kritten et al., 2020). Before any SMILE correction methodology can be developed, it is important to quantify the SMILE itself. Wang et al. (2023) studied the influence of MSI's SMILE on cloud retrievals for shallow warm and deep convective clouds over ocean surfaces and found a negligible impact, judging from an associated error typically staying within 10 %. We pick up where this study has started. However, our main focus here is on smaller optical thicknesses (OT < 1) of not only clouds, but also aerosols over land surfaces. A higher impact and larger errors are expected due to the increasing spectral influence of these surface types. The spectral response functions, the resulting CWVL for MSI VNS bands and the error metrics used in this study are presented in Sect. 2. Further, we quantitatively assess the influence of the SMILE on the forward models used for the European Level-2A MSI aerosol and cloud algorithms (called M-AOT and M-CLD, respectively) and their underlying assumptions in Sect. 3. In Sect. 4, we investigate the SMILE impact on the corresponding products of aerosol optical thickness (M-AOT; Docter et al., 2023) and cloud optical and physical properties (M-COP; Hünerbein et al., 2024). Finally, a summary of the results and an outlook for the respective products are given in Sect. 5.
The MSI VNS camera has four bands. The VNS channels are needed for cloud detection, cloud type, cloud phase, cloud optical and microphysical properties, scene identification (Hünerbein et al., 2024, 2023), aerosol properties (Docter et al., 2023), and surface reflectance estimation in a non-cloudy atmosphere.
Spectral response functions are available for each of MSI's bands and across-track pixels (Fig. 1). Additionally, the associated across-track angle is shown. This angle is based on MSI pointing information, which is also available for each across-track pixel. In particular, the across-track angle is based on the viewing elevation angle in the satellite coordinate system, which is first converted to the viewing zenith angle. However, here, negative viewing zenith angles are used for pixels west of nadir and positive angle values are used east of nadir in order to distinguish both sides. Consequently, for the purpose of avoiding any confusion of negative zenith angle values with measurements from the ground, we call this angle the across-track angle instead of the viewing zenith angle from now on. In particular, the VIS and SWIR1 channels show a strong shift in the response function center across-track compared to nadir.

Figure 1MSI response functions as a function of the across-track pixel (bottom x axis) or across-track angle (top x axis) and wavelength (y axis) for each MSI band: (a) VIS, (b) NIR, (c) SWIR1 and (d) SWIR2. Dashed vertical white lines indicate the nadir pixel, and dashed horizontal white lines represent the corresponding central wavelength.
The corresponding CWVLs (Fig. 2) can be calculated based on these response functions (ηp,λ) for each across-track pixel (p) with
The integration bounds considering wavelength λ that are used for the respective bands are λ1= 600 nm and λn= 750 nm for the VIS band, λ1= 790 nm and λn= 930 nm for the NIR band, λ1= 1530 nm and λn= 1770 nm for the SWIR1 band, and λ1= 1800 nm and λn= 2300 nm for the SWIR2 band.
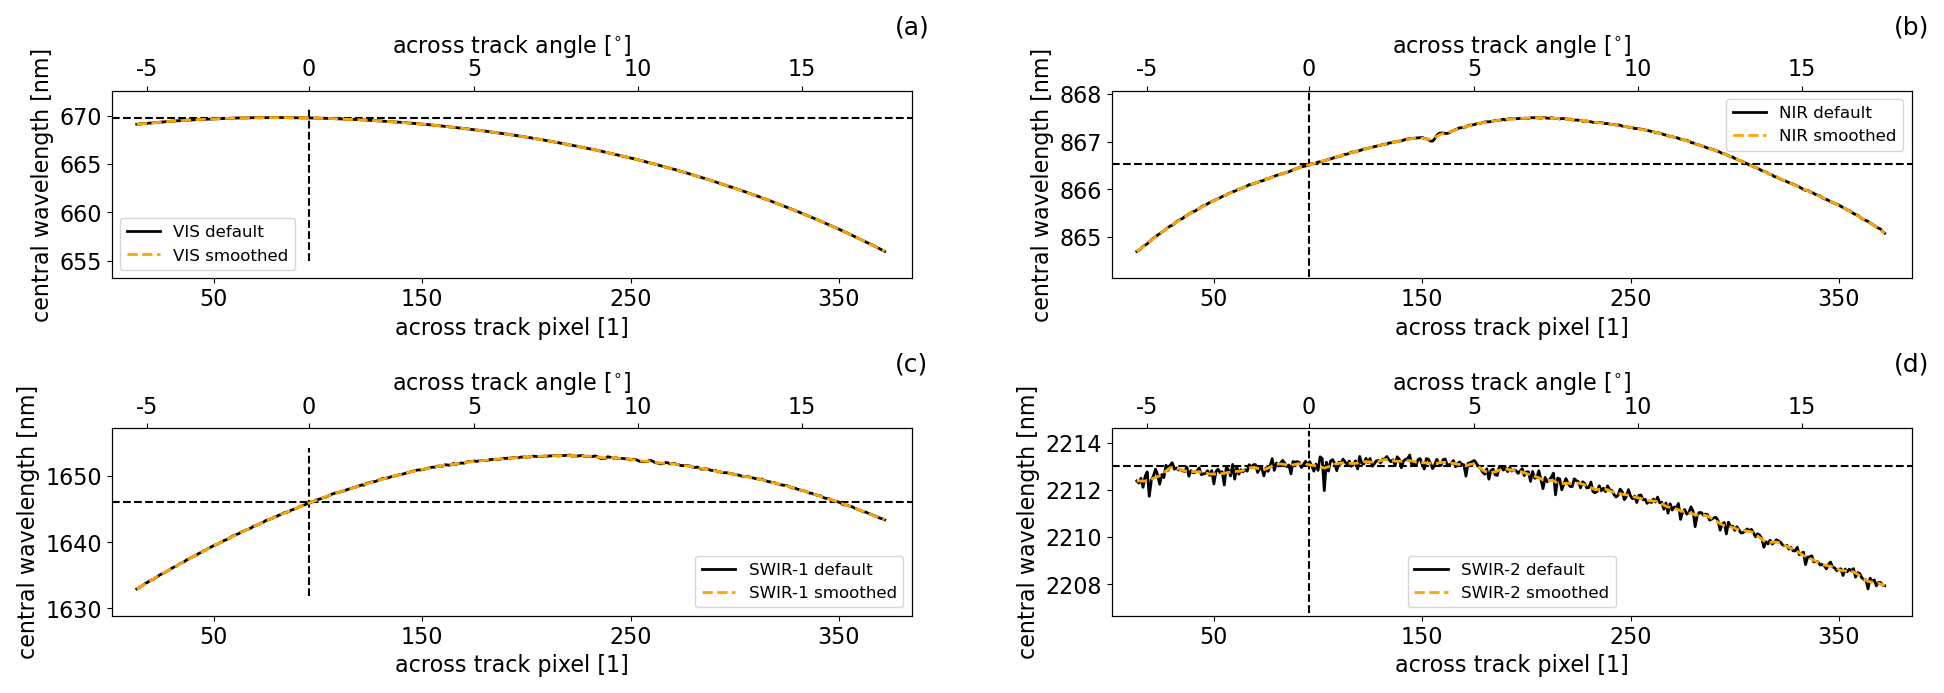
Figure 2MSI CWVL as a function of across-track pixel (bottom x axis) or across-track angle (top x axis) for each MSI band: (a) VIS, (b) NIR, (c) SWIR1 and (d) SWIR2. Black lines show the CWVL based on the default response functions, while yellow lines show the CWVL for smoothed response functions.
Only CWVLs, which are based on smoothed response functions, are used in the following. This is mainly done in order to suppress noise present in the measured response functions of the SWIR2. The noise is caused by imperfections in the measuring setup and is not expected to be physically present in the channel itself. While the choice of smoothed versus default response functions has no significant impact on the VIS, NIR and SWIR1 CWVL estimates, it enhances the CWVL across-track shape for the SWIR2 band.
The CWVL variation (Table 1) is about 3 and 5 nm for the NIR and SWIR2 channels, respectively. However, it exceeds 10 nm for the VIS and SWIR1 channels if the entire across-track dimension is considered. The corresponding total CWVL variation is about 14 nm for the VIS band and about 20 nm for the SWIR1 band. Considering only the nadir region ±50 px (corresponding to approximately ±25 km), this CWVL variation decreases for all bands.
(Wehr et al., 2023)Table 1Across-track central wavelength variation for the four VNS bands of EarthCARE's MSI.

Variations in the spectral response functions and CWVLs of MSI bands impact the measurement accuracy itself and impose an additional uncertainty on retrieval algorithms if not accounted for or corrected beforehand. In particular, the impact of not accounting for the SMILE in the forward models on which M-AOT and M-COP rely is investigated in the following. We analyze the errors introduced due to only using the nadir spectral response function or nadir CWVL (nadir) instead of the ones corresponding to an individual across-track pixel (true). We quantify the uncertainty introduced due to the SMILE using the relative error (δx):
First, we analyze the impact on the forward model assumptions considering spectral gas absorption, surface albedo, and aerosol and cloud optical properties in Sect. 3.1. Secondly, we quantify the errors introduced to the forward-simulated normalized radiance in Sect. 3.2 for each band individually.
3.1 Impact on spectral forward-simulation inputs
3.1.1 Impact on gas absorption description
Gas concentrations, temperature and pressure of the US standard atmosphere (Anderson et al., 1986) have been used to extract high-resolution absorption cross sections from the CKDMIP (Correlated K-Distribution Model Intercomparison Project; Hogan and Matricardi, 2020) database. These have then been used to calculate highly resolved transmissions, which are convolved with the spectral response functions of MSI. Figure 3 shows the gaseous transmissions for all four MSI VNS channels. Bands that have quite a strong shift in CWVL in the across-track dimension (i.e., the VIS and SWIR1 bands) also shift towards stronger gas absorption features. In particular, the VIS channel is affected by the absorption of ozone and water vapor in general. The shift in the center of the response function towards shorter wavelength for the easternmost across-track pixels exposes these pixels to higher water vapor and ozone absorption than what would be expected for the nadir pixel. Considering the SWIR1 band, the across-track shift from west to east will expose a pixel to less methane absorption than at nadir in the first place. However, considering across-track pixels in the easternmost part of the track, their response functions then shift not only out of methane absorption but also partly into the carbon dioxide absorption feature at about 1595 to 1615 nm.
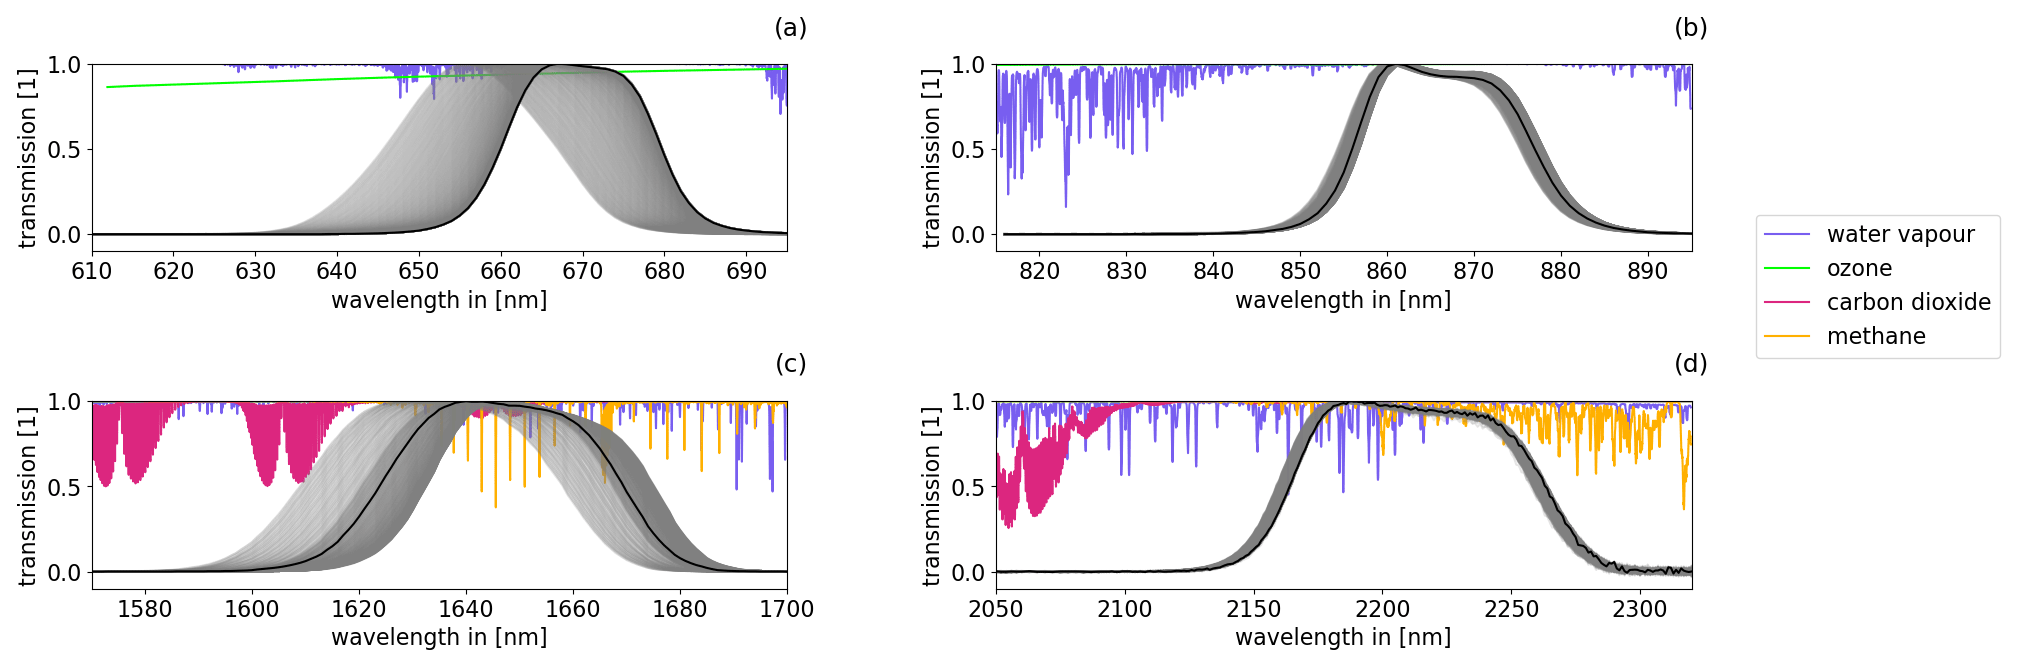
Figure 3Gas transmission for MSI (a) VIS, (b) NIR, (c) SWIR1 and (d) SWIR2 channels. Grey lines indicate MSI spectral response functions across the track, black lines indicate the MSI nadir filter function and colored lines represent different gases of the atmosphere.
In order to quantify the error introduced by the SMILE to gas transmission assumptions, Eq. (2) is applied to these transmissions. The resulting impact can be seen in Fig. 4. While the relative error is below ±0.5 % for the NIR, SWIR1 and SWIR2 band, it is 3.3 % for the VIS channel for the outermost across-track pixel on the east part of the swath.

Figure 4Relative error in convolved transmission if the nadir central wavelength were assumed across-track instead of the true central wavelength based on spectral response functions as a function of the across-track pixel (bottom x axis) or across-track angle (top x axis) for MSI (a) VIS, (b) NIR, (c) SWIR1 and (d) SWIR2 channels. Dashed vertical black lines indicate nadir.
As a consequence of the underestimation of absorption in that part of the track for the VIS band, an ordinary atmospheric correction scheme would produce underestimated top-of-atmosphere (TOA) signals corrected for gaseous absorption. The Level-2A algorithms for cloud optical and physical properties and aerosol optical thickness apply such atmospheric correction schemes. For the retrievals, it will be crucial to correct gaseous absorption accurately since, for example, optical thickness due to gases alone for nadir VIS is about 0.07 for the US standard atmosphere. This, in turn, is on the order of expected common background aerosol optical thickness. Due to the shift, the error in gas optical thickness in the VIS band can be up to −0.03 across-track. This uncertainty alone could potentially lead to a failure of the absolute accuracy requirement of 0.02 over ocean (Wehr, 2006) for aerosol optical thickness if the SMILE is not taken into account for spectral gas assumptions.
3.1.2 Impact on the land surface description
Surface reflectances for different land surface types are used to quantify the error as a consequence of neglect of the SMILE. Grass reflectance is taken from Bowker et al. (1985). Snow (medium-grained) reflectance is taken from the ECOSTRESS (ECOsystem Spaceborne Thermal Radiometer Experiment on Space Station) spectral library version 1.0 (Meerdink et al., 2019; Baldridge et al., 2009). The spectral surface for barren vegetated surface and evergreen broad-leaf forest follows the description applied to synthetic EarthCARE test data (Donovan et al., 2023). There, the highly spectrally resolved surface spectra are built following Vidot and Borbás (2014). The corresponding errors if only the nadir CWVL were assumed instead of the actual across-track CWVL are summarized in Fig. 5. The VIS channel is located close to the red edge of green vegetation surface reflectance. Small central wavelength shifts can lead to uncertainties due to the rapid change in surface reflectance that is characteristic of these spectra. The nadir central wavelength is situated closer to the red edge than the central wavelength corresponding to viewing zenith angles towards +15°, causing the relative error (Fig. 5a) in surface reflectance to vary between 0.9 % (evergreen broad-leaf forest) and 60 % (grass) depending on the spectral signature of the vegetation itself. For cloud (clouds with an optical thickness lower than 10) and aerosol retrievals, an overestimation of surface reflectance alone would lead to an underestimation of the cloud or aerosol optical thickness over vegetated land. This is due to an overestimation of the surface reflectance towards shorter central wavelength, causing a lower part of the TOA signal to be associated with cloud or aerosol in the VIS channel. The NIR channel has low relative errors (Fig. 5b) in surface reflectance when assuming the nadir reflectance instead of the true central wavelength reflectance. They are most pronounced for the evergreen broad-leaf forest and vary between −0.44 % and 0.29 %. The relative error in surface reflectance in the SWIR1 channel (Fig. 5c) expresses a similar behavior for snow, grass and evergreen broad-leaf forest surfaces. Towards shorter wavelength than the nadir central wavelength, the surface reflectance is overestimated by up to 16.3 %, 4.5 % and 0.4 %, respectively. Underestimations of surface reflectance of −7.3 %, −2.1 % and −0.5 %, respectively, can be found towards longer wavelengths than nadir. The SWIR2 shows relative errors (Fig. 5d) of up to 1 % for grass and up to 5.3 % for a snow surface.
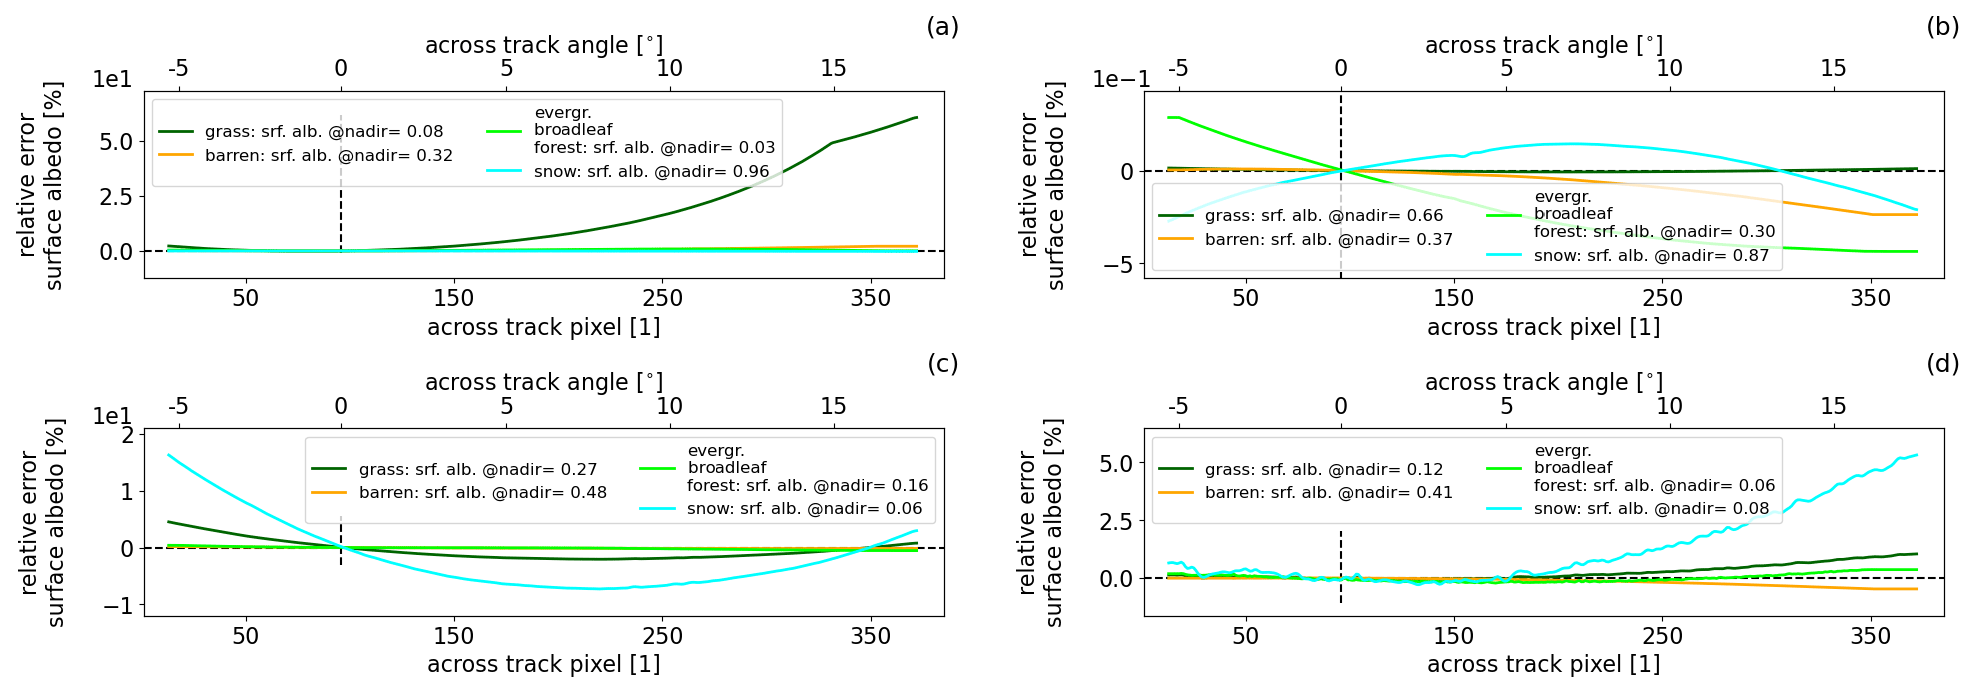
Figure 5Same as Fig. 4 but for surface reflectance. Colored lines indicate different surface types.
The cloud detection and type retrieval (Hünerbein et al., 2023) is based on the combination of VIS, NIR and SWIR signals. The thresholds rely on the assumption that the spectral signatures of cloud-free pixels and pixels covered by different cloud types differ. Consequently, each threshold test is dedicated to a certain surface classification and cloud type as the measured TOA signal of a cloud with an optical thickness lower than 10 includes a significant component from the surface, which has to be characterized accurately. In general, uncertainties in surface reflectance will reduce the accuracy of the cloud mask, cloud and aerosol retrievals.
3.1.3 Impact on aerosol and cloud optical property descriptions
In order to investigate erroneous assumptions about aerosol and cloud optical properties in the respective look-up tables (LUTs) used in the MSI Level-2A aerosol and cloud retrievals, we rely on the HETEAC (Hybrid-End-To-End Aerosol Classification; Wandinger et al., 2023) model for EarthCARE for aerosols and on the description of the general habit mixture model from Baum et al. (2014) for ice clouds and spherical water droplet for liquid clouds. The effective radii associated with these two cloud types and presented in the following are 10 and 5 µm, respectively. These effective radii examples are not intended to represent the natural variability in all cloud observations.
Figures 6, 7 and 8 show relative errors in optical property assumptions: normalized extinction, single-scattering albedo and scattering phase function, respectively. As to be expected, based on each channel's response function and the spectral behavior of each individual quantity, the most affected channels are VIS and SWIR1 across all quantities and scatter types.
Aerosol optical properties are prone to erroneous assumptions if not spectrally resolved in M-AOT. In particular, aerosol in the VIS and SWIR1 bands needs to be resolved. The M-AOT forward model would be exposed to optical thickness errors of up to −4 % in the VIS (Fig. 6a) and −3 % to 2 % in the SWIR1 channel (Fig. 6c) for both HETEAC fine-mode aerosol types if aerosol extinction in these bands is not properly spectrally resolved for radiative transfer simulations. Theoretically, such an underestimation in spectral AOT, as for the VIS channel, would result in an overestimation of retrieved AOT if only the nadir central wavelength were used in look-up tables (LUTs) since the TOA radiance that is forward-simulated for a given optical thickness would be lower than the true TOA radiance measured.

Figure 6Same as Fig. 4 but for the relative error in extinction. Colored lines indicate different scatter types: liquid cloud (dark blue), ice cloud (light blue), sea salt aerosol (abbreviated as salt; yellow), dust (red), fine-mode less-absorbing aerosol (abbreviated as fmless; pink) and fine-mode strongly absorbing aerosol (abbreviated as fmstrg; purple).
While relative errors in the single-scattering albedo (Fig. 7) of HETEAC dust and fine-mode strongly absorbing aerosol are also most prominent in these two bands (VIS and SWIR1), they hardly reach 1 %. Nonetheless, relative errors in the scattering phase function (Fig. 8) used for radiative transfer simulations could reach up to 2.3 % to 2.7 % for fine-mode aerosol and 4 % to 5 % for coarse-mode aerosol in the VIS and still be 1.4 % in the SWIR1 band for sea salt if one ignored the spectral dependency within the bands.


Figure 8Relative error in scattering phase functions if the nadir central wavelength were assumed across-track instead of the true central wavelength based on spectral response functions for MSI VIS (first column), NIR (second column), SWIR1 (third column) and SWIR2 (fourth column) channels. Rows correspond to different scatter types: liquid cloud with an effective radius of 5 µm (first row), ice cloud with an effective radius of 10 µm (second row), HETEAC sea salt (third row), HETEAC non-spherical dust (fourth row), HETEAC fine-mode less-absorbing aerosol (fifth row) and fine-mode strongly absorbing aerosol (sixth row).
In contrast, only the SWIR1 and SWIR2 bands, which are the water and ice absorption channels, exhibit a slight sensitivity to the spectral across-track variation in the single-scattering albedo as to be theoretically expected based on the spectral dependency of the imaginary parts of water and ice. Further, the water and ice absorption channels (SWIR1 and SWIR2) are primarily a function of cloud particle size; this is reflected in the results. The relative error for the single-scattering albedo gets stronger for larger cloud particles (not shown here). Nonetheless, relative errors hardly ever reach even 0.1 %. In Fig. 8, as an example, the relative error in the phase function is given for a water cloud with an effective radius of 5 µm. The phase functions for VIS and SWIR1 bands are most affected. A relative error of up to 3 % is found.
3.2 Effect on aerosol and cloud TOA normalized radiances
Radiative transfer simulations have been carried out using the doubling-adding KNMI (DAK; de Haan et al., 1987; Stammes et al., 1989; Stammes, 2001) model for cloud considerations and the matrix operator model (MOMO; Fell and Fischer, 2001; Hollstein and Fischer, 2012) for aerosol investigations in order to better understand the following:
-
How are these assumption errors interacting?
-
How would they affect the forward-simulated TOA signal in M-AOT and M-CLD if the SMILE were neglected there?
Each of MSI's bands has been resolved in 1 nm steps between each band's minimum and maximum central wavelength. This leads to 16 simulations for the VIS (655–670 nm), 5 simulations for the NIR (864–868 nm), 23 simulations for the SWIR1 (1632–1654 nm) and 8 simulations for the SWIR2 (2207–2214 nm) band. These spectrally resolved simulations can be used to quantify errors for different cloud and aerosol settings if one sticks to the heritage single central wavelength per band setting as used in current MSI Level-2A processors. For the following quantification, we will rely on the normalized TOA radiance, which is defined as the ratio of spectral radiance to spectral irradiance. Further, gas absorption is not accounted for here since the respective Level-2 aerosol and cloud retrievals correct MSI Level-1 measurements outside of the respective forward models.
For example, Fig. 9 shows the relative error in normalized radiance for each of the four HETEAC aerosol types with an AOT (550 nm) of 0.3, one liquid cloud (effective radius is 5 µm) and one ice cloud (effective radius is 10 µm) with a cloud optical thickness (COT) of 10 for one observation geometry. The surface type chosen for aerosol cases is grass, relying on surface albedo values as used for relative error calculations in Fig. 5. For cloud cases, the influence of the surface has been neglected due to higher optical thicknesses used for these scenarios. Hence, the surface albedo is 0.05.

Figure 9Same as Fig. 6 but for the relative error in the normalized TOA radiance over a grass surface. Sun zenith angle is 40°, relative azimuth difference is 130°, COT is 10 and AOT (550 nm) is 0.3. Colored lines show different scatter types.
Whenever optical thickness is rather low, as for aerosol cases, and the influence of the spectral variation in the surface becomes non-negligible within a band, the relative error becomes larger (Seidel and Popp, 2012). As expected, based on relative errors present for the optical properties and the surface albedo, the VIS band is most sensitive to any omission of the SMILE, while the effect is insignificant for the NIR band.
The relative error in TOA normalized radiance for aerosol cases slightly increases with decreasing particle size for the VIS (Fig. 9a), SWIR1 (Fig. 9c) and SWIR2 (Fig. 9d) bands. The relative error reaches up to 27 % for coarse-mode (CM) and 30 % for fine-mode (FM) aerosols for across-track angles larger than 15° for the VIS band. Relative errors in TOA normalized radiance closely resemble surface albedo errors, vary between −1.9 % (CM) and −2 % (FM) and between 4.2 % (CM) and 4.4 (FM) for the SWIR1, and can still reach up to 0.9 % (CM) and 1 % (FM) for the SWIR2 band. The relative error is most pronounced for ice clouds. The VIS band exhibits errors of up to 2 % with an across-track angle greater than 10 ° (Fig. 9a). The SWIR1 band shows a significant error over the whole across-track dimension (1.4 % to −0.8 % for ice and 0.4 % to −0.2 % for water). As the combination of VIS and SWIR1 is the base to retrieve COT and effective radius (Hünerbein et al., 2024), this finding has to be considered. The relative errors in the NIR and SWIR2 are less than 0.1 % and 0.05 %, respectively.
4.1 Synthetic SMILE scene
To quantify errors introduced into the Level-2A retrievals, M-CLD and M-AOT, due to the SMILE of MSI, the European EarthCARE simulator (ECSIM; Donovan et al., 2023) sub-module of MSI is used to generate an MSI SMILE block scene. A first set of artificial sub-cases has been defined within one EarthCARE MSI frame. Seven aerosol cases are present over ocean and over evergreen broad-leaf forest. Additionally, two cloud types (stratocumulus and cirrus) are defined with two different cloud effective radii (40 µm for cirrus and 6 µm for the water cloud) and two cloud optical thicknesses (1 for cirrus and 10 for the water cloud) over land (Fig. 10), which is divided into two different surface types: green vegetation and barren to sparsely vegetated land. Cloud and aerosol quantities vary along-track and stay constant across-track. Atmospheric conditions are constant regarding skin temperature (293.8 K), surface pressure (1007.14 hPa), horizontal wind speed (4 m s−1) and total column gas amounts (29.3 kg m−2 of water vapor, 0.006 kg m−2 of ozone and 5.2 kg m−2 of carbon dioxide). The scene, which includes a limited subset of real-world conditions, can be used to do a first investigation of uncertainties introduced solely due to the SMILE if M-CLD and M-AOT processors are not accounting for it.
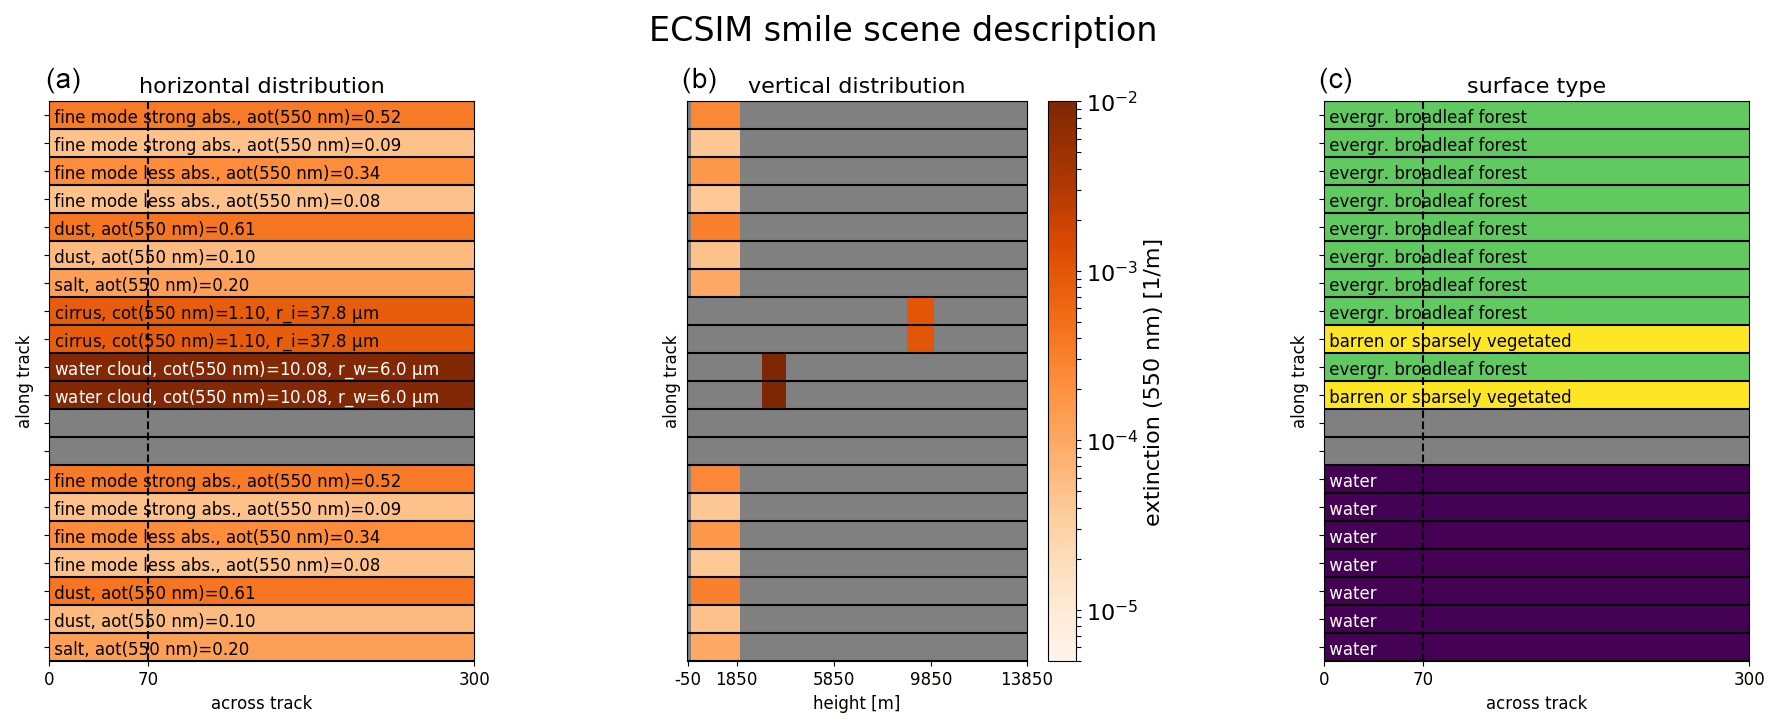
Figure 10(a) Horizontal and (b) vertical distribution of aerosols and clouds and their classification within the respective stripes along with the (c) surface distribution in the synthetic MSI SMILE scene. Dashed black lines in panels (a) and (c) indicate nadir.
Two ECSIM runs have been carried out for this artificial subset of an EarthCARE MSI frame. The first run assumed ideal conditions that correspond to what would be observed if the across-track response functions all corresponded exactly to the nadir one. The other run contains the SMILE-affected quantities for which the SMILE has been implemented in the model radiative transfer. Surface, gas, aerosol and cloud properties, and Rayleigh and solar in-band irradiance have been spectrally resolved. In order to use these two scenes in M-AOT and M-CLD processors, surface and particle types have been prescribed for this artificial scene as defined in Fig. 10. This is due to the dependence of M-AOT and M-CLD on background climatologies such as surface setting or aerosol type over land.
The resulting differences between the two runs are once again shown using the relative error in normalized TOA radiances in Fig. 11 over land and Fig. 12 over ocean. Some residual noise is present in the simulations of the synthetic scenes, which is caused by numerical inaccuracies in the very highly resolved spectral calculations.
As to be expected, the strongest effects on the SMILE are present for the VIS and SWIR1 bands. When comparing the VIS channel over land (Fig. 11a) and water (Fig. 12a), it can be seen that the chosen spectral surface characteristics over land decrease the relative error in normalized TOA radiance. Over ocean, a relative error of up to −6.7 % is present for fine-mode aerosols with a low loading. Over land, the relative error in the TOA normalized radiance of the VIS channel only reaches −2 % for aerosols. This is due to a relatively flat spectral behavior of the forest example. Relative errors in the bidirectional reflectance distribution function (not shown) used for the synthetic scene creation only reach up to 1.5 % for the VIS band. However, since the synthetic scene includes absorption due to gases, the overestimated water vapor and ozone absorption towards the across-track pixel in the east of the swath would lead to an overall underestimation in TOA normalized radiance there. Similarly to the aerosol cases, the TOA signal of the cirrus example is mainly influenced by the surface and gas absorption and follows the behavior for the same reason. In contrast, the relative error in cirrus over barren land is up to 1.3 %, which comes from the different spectral behavior of this surface type. The optically thicker clouds, such as the stratocumulus clouds, the effects due to the spectral variation are hardly noticeable.
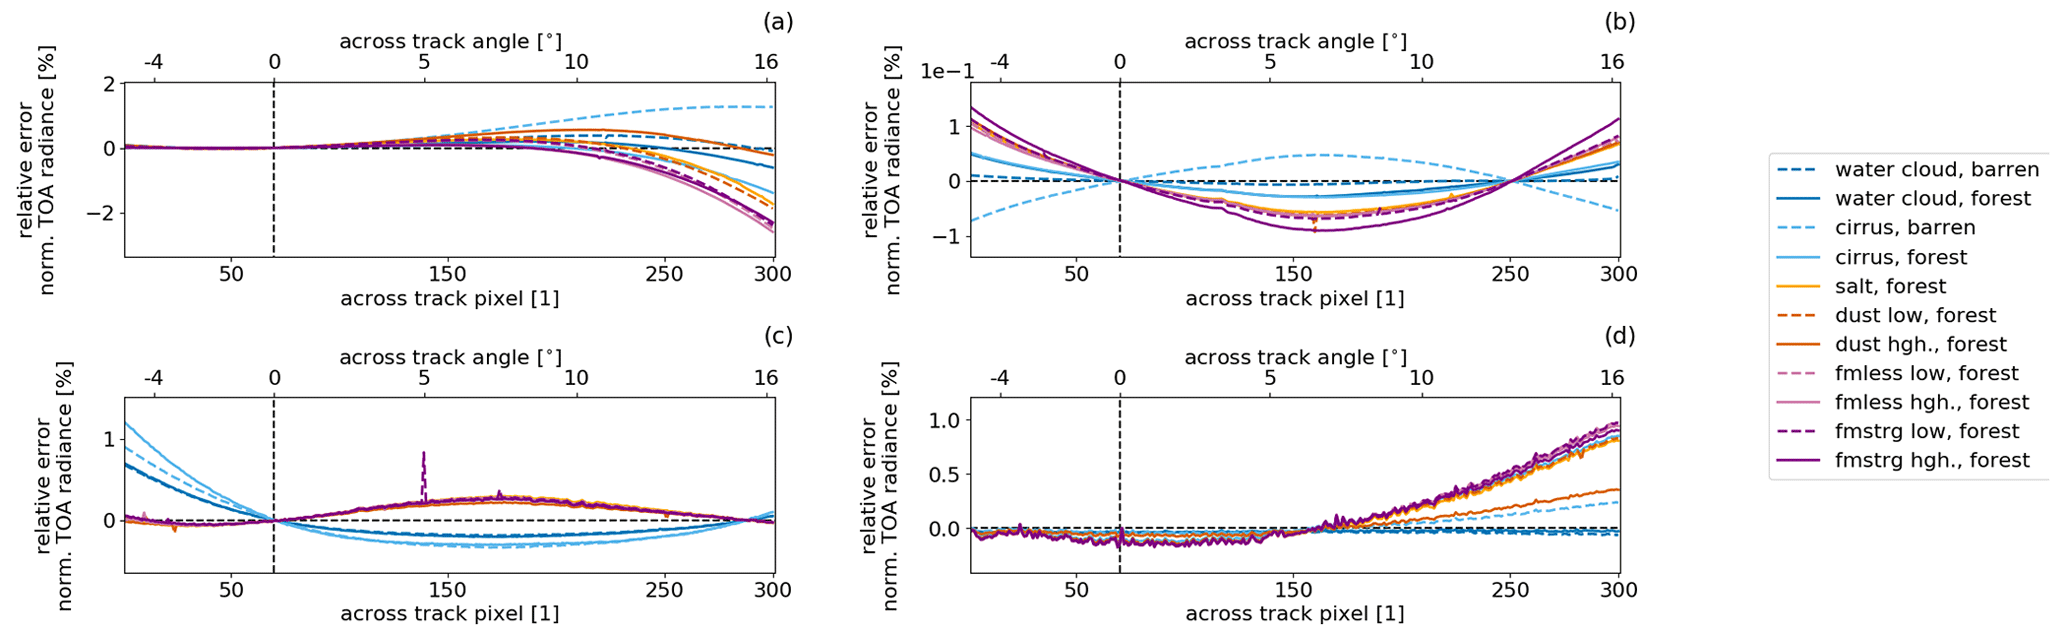
Figure 11Relative error in TOA normalized radiance as a function of the across-track pixel (bottom x axis) or across-track angle (top x axis) for (a) VIS, (b) NIR, (c) SWIR1 and (d) SWIR2 channels over land in the synthetic MSI SMILE scene. Dashed vertical black lines indicate nadir.
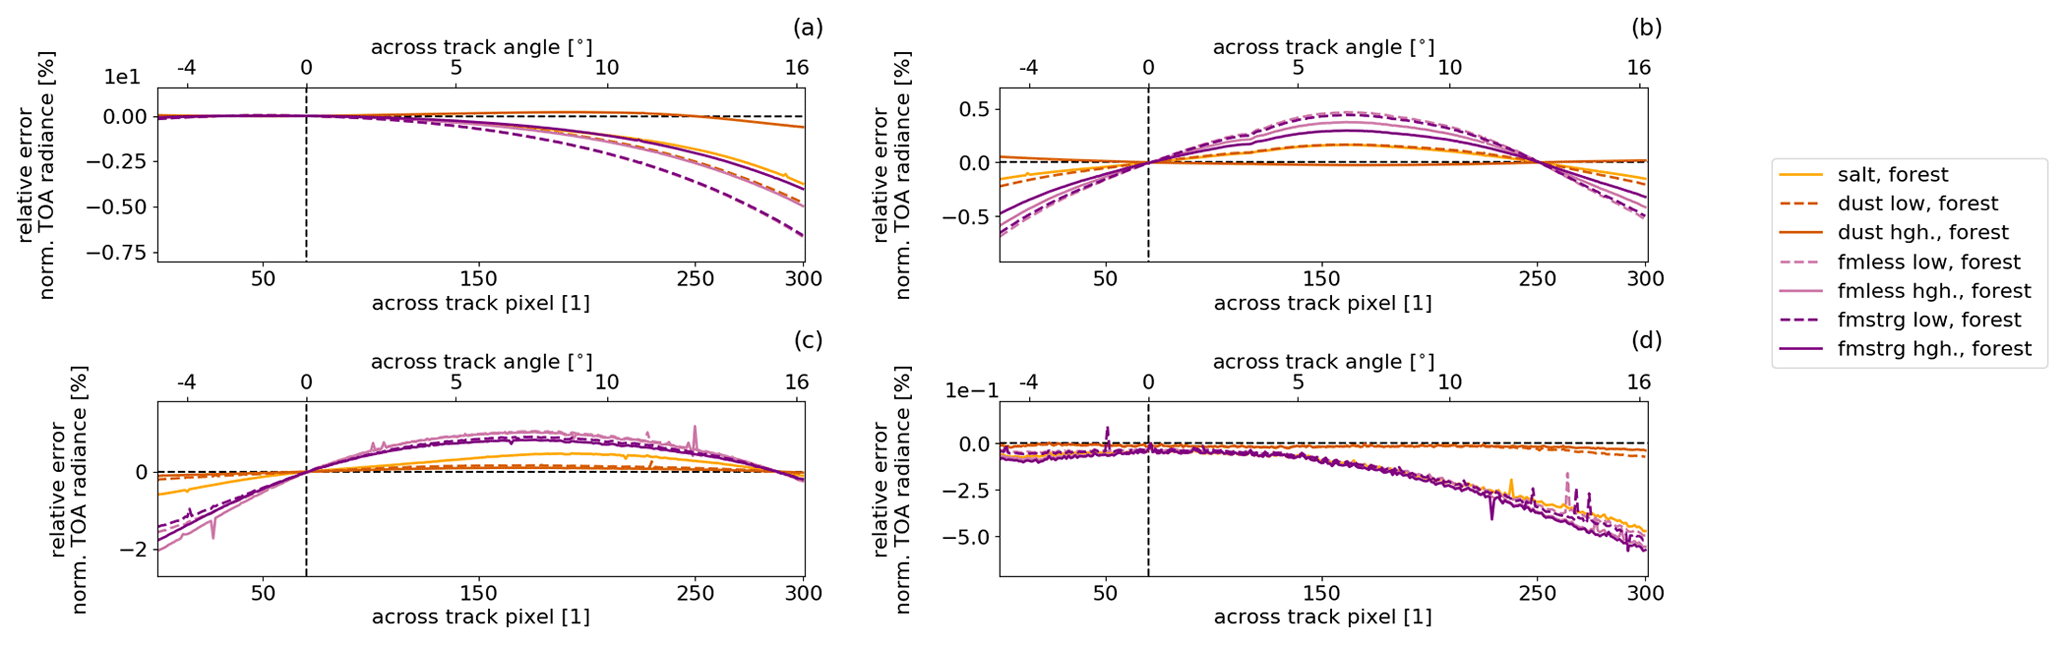
For the SWIR1 channel, the relative error in TOA normalized radiance can vary between −2 % (west of nadir) and 1.1 % (east of nadir at an across-track angle of about 7.5 °) over ocean (Fig. 12c) for fine-mode aerosols. Over land, relative errors in TOA normalized radiance can vary between −0.3 % (east of nadir at an across-track angle of about 7.5 °, cirrus over sparsely vegetated land) and 1.2 % (west of nadir, cirrus over forest) for clouds. The effects of the SMILE for the NIR and SWIR2 channels are below ±1 % over ocean (Fig. 12b, d) and land (Fig. 11b, d).
4.2 Error implications for MSI aerosol and cloud optical thickness
Using the two synthetic scenes in the cloud algorithm that has yet to be mitigated to account for the SMILE allows us to compare the two resulting M-COP products and study their differences. The same applies to the aerosol algorithm and the M-AOT products. Consequently, this enables the quantification of errors solely introduced due to the SMILE if the Level-2A processor did not account for it and Level 1 was not corrected.
Figure 13 shows the relative error in COT and AOT at 670 nm over land and ocean. The relative error in retrieved AOT at 670 nm is highest (−48 %) over land (Fig. 13a) east of nadir for fine-mode strongly absorbing aerosol with a low aerosol loading. The error decreases for higher AOT loading and bigger particles such as dust or salt aerosols over land. Therefore, AOT at 670 nm over land can be underestimated by up to 0.03 for the fine-mode less-absorbing forest example with an actual AOT of 0.06.
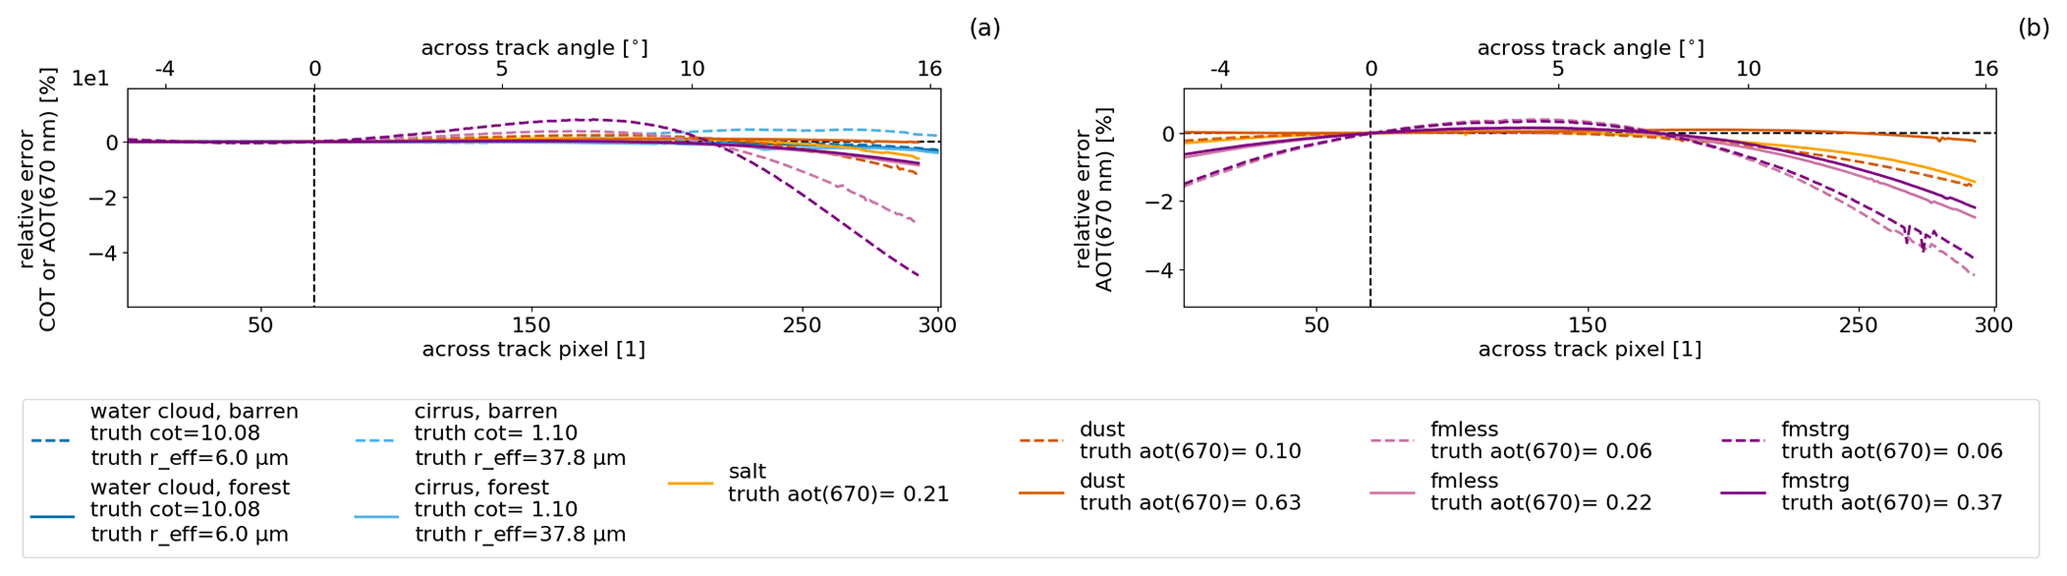
Figure 13Relative error in (a) M-COP COT and M-AOT AOT at 670 nm over land and (b) M-AOT AOT at 670 nm over ocean as a function of the across-track pixel (bottom x axis) or across-track angle (top x axis) for the MSI SMILE scene. Dashed vertical black lines in panels (a) and (b) indicate nadir.
Over ocean, the general behavior of the relative error in aerosol optical thickness at 670 nm (Fig. 13b) appears to be similar to the one over land even though the absolute values are lower, reaching up to only −4 %.
The cloud optical and physical property retrieval (M-COP) is based on the VIS, SWIR1 and thermal infrared (TIR) bands. COT is mainly a function of the VIS band and the cloud effective radius of the SWIR1 band. The relative error for COT is dominated by the surface properties for the optical thin cirrus, and the optical thicker stratocumulus cloud is affected by the SMILE by up to −3 % (Fig. 13a). The relative error in the cloud effective radius with a small effective radius (6 µm) is low; with a higher cloud effective radius (20 µm), the results show a pronounced relative error from 7.5 % up to −5 % (not shown; curve follows Fig. 11c). The results are reasonable. However, as the uncertainty of the effective radius for optically thin clouds is generally very high, this value has to be taken with caution.
Passive imager measurements of MSI on EarthCARE are needed for additional knowledge about the horizontal cloud and aerosol distribution in addition to active measurements that provide information about the vertical distribution. In order to achieve good quality of Level-2A aerosol and cloud products based on MSI measurements, a reasonable accuracy and a good characterization of the instrument are needed. A small SMILE is not an uncommon effect for imagers. However, MSI shows across-track CWVL variations in the VIS and SWIR1 bands of up to 14 and 20 nm, respectively. The main purpose of this study is to assess MSI's SMILE on the European Level-2A aerosol and cloud retrievals in order to establish a way forward in accounting or correcting for it in the retrieval procedures. We investigated its impact on the forward models and on their underlying spectral assumptions (e.g., of gas absorption, surface reflectance, and aerosol and cloud optical properties) within each band. Additionally, we created an artificial MSI SMILE scene to directly assess the error introduced to M-AOT and M-COP products if this effect were ignored within the retrieval algorithms.
Only considering the impact on gas absorption, the relative error is up to 3.3 % in the VIS related to the absorption of ozone and water vapor. While the effect of MSI's SMILE on the retrieved optical properties is less pronounced over ocean surfaces than over land, it still persists – in particular for low optical thickness and small particles. Errors there are about 1.4 % for coarse-mode aerosols and 5 % for fine-mode aerosols with a low AOT. Depending on the underlying surface and its associated spectral variation within the VIS band, relative errors in surface albedo can reach up to 60 % for grass if any retrieval relying on such information did not account for the SMILE. Smaller surface variations within MSI bands (e.g., the presented example over forest) can lead to an underestimation in the AOT of up to −50 % for fine-mode aerosol with a low loading or an underestimation in the COT of up to −4 % for thin cirrus. However, such smaller variations in the spectral surface reflectance within a band become less significant with increasing AOT and COT. Nonetheless, the overall error over land is expected to vary strongly depending on the actual underlying land surface type. Since there are larger absolute relative errors in TOA normalized radiance present for grass in the VIS band than for forest, the retrieved OT over grass is also expected to show larger errors if the SMILE is not accounted for. Additionally, a reverse behavior of relative error in TOA normalized radiance was found for the VIS band for grass and forest. This seems to indicate that the influence of errors in the surface assumptions becomes more important with increasing variation in the spectral surface for the measured TOA signal. Hence, ultimately, this effect could also lead to an overestimation for surfaces like the grass example instead of an underestimation of OT, as for the forest example, as long as the present OT is low.
Even using this basic approach to quantify errors induced due to SMILE neglect, our results show that the relative error over land for optical thin OT cannot be ignored. In order to avoid errors introduced due to the SMILE independent of its actual magnitude and in order to allow for easier interpretation of the Level-2A products, any future developments or improvements to existing algorithms should take this effect into account. In theory, there are two potential approaches to consider the SMILE: a correction of the measured Level-1 signal, following, e.g., Bourg et al. (2008), Dadon et al. (2010), Kritten et al. (2020), or Jänicke et al. (2023), or accounting for the SMILE directly in the Level-2A retrieval procedures. The latter approach is identified as the one to be used for M-AOT and M-CLD product algorithms.
With the knowledge gained by this study, we are planning to adapt the auxiliary input data of cloud and aerosol look-up tables (LUTs), gas correction coefficients, and surface parameterization coefficients to account for varying wavelength in the MSI Level-2A cloud and aerosol retrievals. This will be accomplished by re-generating the auxiliary data. In particular, the spectral variation in central wavelength will be represented in the across-track angle dimension, which replaces the viewing zenith angle dimension in the respective LUTs. In fact, every viewing direction has an analogous across-track angle direction and an individual instrument response. Therefore, the number of LUT dimensions will not increase. Currently, all these changes to the existing MSI Level-2A processors are a work in progress. While the mitigation to account for the SMILE is aimed to be ready before the launch of EarthCARE in 2024, close attention should still be paid to the SMILE when exploiting, interpreting and validating Level-2A data, in particular during the commission phase.
MSI's spectral response functions and Level-2 software, M-AOT and M-CLD, are intended to become available after the commissioning phase of EarthCARE. The CKDMIP data set is available at http://confluence.ecmwf.int/display/CKDMIP (Hogan, 2019). Vegetation spectra of the ECOSTRESS spectral library (Meerdink et al., 2019) can be ordered at https://speclib.jpl.nasa.gov/ (Hook, 2017). Due to the age of the publication, spectral reflectance data of Bowker et al. (1985) are attached to the actual publication – i.e., the data set is printed in the paper itself. The radiative transfer models MOMO and DAK are not publicly available. Access requests for these two models should be directed to the original authors of the software via e-mail. Inputs for both radiative transfer models and the ECSIM SMILE scene can be made available upon reasonable request.
The paper was prepared by ND and AH. ND, RP and AH conceptualized the central wavelength calculation and analysis. DD generated the SMILE scene simulations. Gracious advice and help were received from JFM and PS for the DAK simulation. JF provided the theoretical basis of the MOMO aerosol simulations. ME extracted the spectral response functions of the MSI from ESA's Characterization and Calibration Database (CCDB) and provided the MSI pointing information file. All authors were involved in discussions and contributed material and/or text to the paper.
At least one of the (co-)authors is a member of the editorial board of Atmospheric Measurement Techniques. The peer-review process was guided by an independent editor, and the authors also have no other competing interests to declare.
Publisher's note: Copernicus Publications remains neutral with regard to jurisdictional claims made in the text, published maps, institutional affiliations, or any other geographical representation in this paper. While Copernicus Publications makes every effort to include appropriate place names, the final responsibility lies with the authors.
This article is part of the special issue “EarthCARE Level 2 algorithms and data products”. It is not associated with a conference.
This work has been funded by European Space Agency (ESA) grant nos. 4000112018/14/NL/CT (APRIL) and 4000134661/21/NL/AD (CARDINAL). The authors thank Tobias Wehr for his support over many years and the EarthCARE developer teams for valuable discussions in various meetings.
This research has been supported by the European Space Agency (grant nos. 4000134661/21/NL/AD and 4000112018/14/NL/CT).
The article processing charges for this open-access publication were covered by the Freie Universität Berlin.
This paper was edited by Pavlos Kollias and reviewed by three anonymous referees.
Anderson, G. P., Clough, S. A., Kneizys, F. X., Chetwynd, J. H., and Shettle, E. P.: AFGL (Air Force Geophysical Laboratory) atmospheric constituent profiles (0. 120km), Environmental research papers, https://www.osti.gov/biblio/6862535 (last access: 8 April 2024), 1986. a
Baldridge, A., Hook, S., Grove, C., and Rivera, G.: The ASTER spectral library version 2.0, Remote Sens. Environ., 113, 711–715, https://doi.org/10.1016/j.rse.2008.11.007, 2009. a
Baum, B. A., Yang, P., Heymsfield, A. J., Bansemer, A., Cole, B. H., Merrelli, A., Schmitt, C., and Wang, C.: Ice cloud single-scattering property models with the full phase matrix at wavelengths from 0.2 to 100 µm, J. Quant. Spectrosc. Ra., 146, 123–139, https://doi.org/10.1016/j.jqsrt.2014.02.029, 2014. a
Bourg, L., D’Alba, L., and Colagrande, P.: MERIS Smile Effect Characterization and Correction, Tech. rep., European Space Agency, Paris, France, https://earth.esa.int/ eogateway/documents/20142/37627/MERIS-Smile-Effect- Characterisation-and-correction.pdf (last access: 8 April 2024), 2008. a, b
Bowker, D., Davis, R., Myrick, D., Stacy, K., and Jones, W.: Spectral Reflectances of Natural Targets for Use in Remote Sensing Studies, Nasa Reference Publication, Report No. RP-1139, https://ntrs.nasa.gov/api/citations/19850022138/downloads/19850022138.pdf (last access: 8 April 2024), 1985. a, b
Dadon, A., Ben-Dor, E., and Karnieli, A.: Use of Derivative Calculations and Minimum Noise Fraction Transform for Detecting and Correcting the Spectral Curvature Effect (Smile) in Hyperion Images, IEEE T. Geosci. Remote, 48, 2603–2612, https://doi.org/10.1109/TGRS.2010.2040391, 2010. a, b
de Haan, J. F., Bosma, P., and Hovenier, J.: The adding method for multiple scattering calculations of polarized light, Astron. Astrophys., 183, 371–391, 1987. a
Docter, N., Preusker, R., Filipitsch, F., Kritten, L., Schmidt, F., and Fischer, J.: Aerosol optical depth retrieval from the EarthCARE Multi-Spectral Imager: the M-AOT product, Atmos. Meas. Tech., 16, 3437–3457, https://doi.org/10.5194/amt-16-3437-2023, 2023. a, b
Donovan, D. P., Kollias, P., Velázquez Blázquez, A., and van Zadelhoff, G.-J.: The generation of EarthCARE L1 test data sets using atmospheric model data sets, Atmos. Meas. Tech., 16, 5327–5356, https://doi.org/10.5194/amt-16-5327-2023, 2023. a, b
Fell, F. and Fischer, J.: Numerical simulation of the light field in the atmosphere–ocean system using the matrix-operator method, J. Quant. Spectrosc. Ra., 69, 351–388, https://doi.org/10.1016/S0022-4073(00)00089-3, 2001. a
Helière, A., Wallace, K., do Carmo, J. P., Eisinger, M., Wehr, T., Lefebvre, A., and Koopman, R.: EarthCARE instruments description, edited by: Koopman, R., Tech. rep., ESA, https://earth.esa.int/eogateway/documents/20142/37627/EarthCARE-instrument-descriptions.pdf (last access: 8 April 2024), 2017. a
Hogan, R. J.: CKDMIP: Correlated K-Distribution Model Intercomparison Project Home, ECMWF [data set], http://confluence.ecmwf.int/display/CKDMIP (last access: 4 December 2020), 2019. a
Hogan, R. J. and Matricardi, M.: Evaluating and improving the treatment of gases in radiation schemes: the Correlated K-Distribution Model Intercomparison Project (CKDMIP), Geosci. Model Dev., 13, 6501–6521, https://doi.org/10.5194/gmd-13-6501-2020, 2020. a
Hollstein, A. and Fischer, J.: Radiative transfer solutions for coupled atmosphere ocean systems using the matrix operator technique, J. Quant. Spectrosc. Ra., 113, 536–548, https://doi.org/10.1016/j.jqsrt.2012.01.010, 2012. a
Hook, S. J.: ECOSTRESS Spectral Library - Version 1.0, Jet Propulsion Laboratory, California Institute of Technology [data set], Pasadena, California, https://speclib.jpl.nasa.gov/ (last access: 8 April 2024), 2017. a
Hünerbein, A., Bley, S., Horn, S., Deneke, H., and Walther, A.: Cloud mask algorithm from the EarthCARE Multi-Spectral Imager: the M-CM products, Atmos. Meas. Tech., 16, 2821–2836, https://doi.org/10.5194/amt-16-2821-2023, 2023. a, b
Hünerbein, A., Bley, S., Deneke, H., Meirink, J. F., van Zadelhoff, G.-J., and Walther, A.: Cloud optical and physical properties retrieval from EarthCARE multi-spectral imager: the M-COP products, Atmos. Meas. Tech., 17, 261–276, https://doi.org/10.5194/amt-17-261-2024, 2024. a, b, c
Jänicke, L. K., Preusker, R., Docter, N., and Fischer, J.: Estimation of Aerosol Layer Height from OLCI Measurements in the O2A-Absorption Band over Oceans, Remote Sens.-Basel, 15, 4080, https://doi.org/10.3390/rs15164080, 2023. a
Kritten, L., Preusker, R., and Fischer, J.: A new retrieval of sun-induced chlorophyll fluorescence in water from ocean colour measurements applied on olci l-1b and l-2, Remote Sens.-Basel, 12, 3949, https://doi.org/10.3390/rs12233949, 2020. a, b
Meerdink, S. K., Hook, S. J., Roberts, D. A., and Abbott, E. A.: The ECOSTRESS spectral library version 1.0, Remote Sens. Environ., 230, 111196, https://doi.org/10.1016/j.rse.2019.05.015, 2019. a, b
Seidel, F. C. and Popp, C.: Critical surface albedo and its implications to aerosol remote sensing, Atmos. Meas. Tech., 5, 1653–1665, https://doi.org/10.5194/amt-5-1653-2012, 2012. a
Stammes, P.: Spectral radiance modeling in the UV-visible range, in: IRS 2000: Current problems in atmospheric radiation, edited by: Smith, W. L. and Timofeyev, Y. M., A. Deepak Publishing, Hampton, VA, 385–388, ISBN-10: 0937194433, 2001. a
Stammes, P., De Haan, J., and Hovenier, J.: The polarized internal radiation field of a planetary atmosphere, Astron. Astrophys., 225, 239–259, 1989. a
Vidot, J. and Borbás, E.: Land surface VIS/NIR BRDF atlas for RTTOV-11: model and validation against SEVIRI land SAF albedo product, Q. J. Roy. Meteor. Soc., 140, 2186–2196, https://doi.org/10.1002/qj.2288, 2014. a
Wandinger, U., Floutsi, A. A., Baars, H., Haarig, M., Ansmann, A., Hünerbein, A., Docter, N., Donovan, D., van Zadelhoff, G.-J., Mason, S., and Cole, J.: HETEAC – the Hybrid End-To-End Aerosol Classification model for EarthCARE, Atmos. Meas. Tech., 16, 2485–2510, https://doi.org/10.5194/amt-16-2485-2023, 2023. a
Wang, M., Nakajima, T. Y., Roh, W., Satoh, M., Suzuki, K., Kubota, T., and Yoshida, M.: Evaluation of the spectral misalignment on the Earth Clouds, Aerosols and Radiation Explorer/multi-spectral imager cloud product, Atmos. Meas. Tech., 16, 603–623, https://doi.org/10.5194/amt-16-603-2023, 2023. a, b
Wehr, T. (Ed.): EarthCARE Mission Requirements Document, Earth and Mission Science Division, European Space Agency, https://doi.org/10.5270/esa.earthcare-mrd.2006, 2006. a, b
Wehr, T., Kubota, T., Tzeremes, G., Wallace, K., Nakatsuka, H., Ohno, Y., Koopman, R., Rusli, S., Kikuchi, M., Eisinger, M., Tanaka, T., Taga, M., Deghaye, P., Tomita, E., and Bernaerts, D.: The EarthCARE mission – science and system overview, Atmos. Meas. Tech., 16, 3581–3608, https://doi.org/10.5194/amt-16-3581-2023, 2023. a, b, c, d
- Abstract
- Introduction
- MSI's spectral misalignment effect (SMILE)
- Impact of the SMILE on the MSI aerosol and cloud retrieval assumptions
- Error quantification for MSI L2 aerosol and cloud products
- Conclusions and outlook
- Code and data availability
- Author contributions
- Competing interests
- Disclaimer
- Special issue statement
- Acknowledgements
- Financial support
- Review statement
- References