the Creative Commons Attribution 4.0 License.
the Creative Commons Attribution 4.0 License.
 | 07 May 2024
Micro-PINGUIN: microtiter-plate-based instrument for ice nucleation detection in gallium with an infrared camera
Corina Wieber
Mads Rosenhøj Jeppesen
Kai Finster
Claus Melvad
Ice nucleation particles play a crucial role in atmospheric processes; for example, they can trigger ice formation in clouds and thus influence their lifetime and optical properties. The quantification and characterization of these particles require reliable and precise measurement techniques. In this publication, we present a novel droplet freezing instrument to measure the immersion freezing of biotic and abiotic ice-nucleating particles within the temperature range of 0 to −25 °C. Immersion freezing of the samples is investigated using 384-well PCR plates with a sample volume of 30 µL. Nucleation events are detected with high precision using a thermal camera that records the increase in infrared emission due to the latent heat release. To maximize the thermal contact between the PCR plate and the surrounding cooling unit, we use a gallium bath as a mount for the PCR plate. The instrument was validated relative to a calibrated temperature standard and through reproducibility measurements employing the same suspension. We find that the combination of good thermal connectivity and precise temperature recording enables accurate (±0.81 °C at −10 °C) and reproducible (±0.20 °C) detection of the nucleation temperatures. Consequently, the results that are produced using the MICROtiter-Plate-based instrument for Ice Nucleation detection in GalliUm with an INfrared camera (micro-PINGUIN) are of good quality and the instrument can be used to study the immersion freezing of various ice-nucleating particles.
For comparison with already existing instruments, Snomax® (hereafter Snomax) and illite NX suspensions are measured with the new ice nucleation instrument, micro-PINGUIN. Further, we investigated the reproducibility of experiments using Snomax suspensions and found poor reproducibility when suspensions were prepared freshly even if the same batch of Snomax is used. This could be attributed to substrate heterogeneity, aging effects, and dilution errors. The reproducibility of the measurements is greatly improved for Snomax suspensions that are prepared in advance and stored frozen in aliquots. Thus, we suggest the use of suspensions frozen in aliquots for further reproducibility measurements and intercomparison studies.
- Article
(2473 KB) - Full-text XML
-
Supplement
(3501 KB) - BibTeX
- EndNote


Clouds play an important role in the Earth's radiative balance and climate. Cloud properties such as reflectivity and lifetime are, to a large extent, determined by the properties of atmospheric aerosols. Precipitation from mixed-phase and cold clouds that is initiated via the formation of ice particles significantly contributes to the global water cycle (Mülmenstädt et al., 2015). While homogenous freezing of cloud droplets only takes place in cold clouds (< −37 °C), ice-nucleating particles (INPs) are required to initiate freezing in mixed-phase clouds (between 0 and −37 °C) (Murray et al., 2012). So far, only biological INPs have been shown to initiate ice formation at temperatures higher than −15 °C at atmospherically relevant concentrations (Murray et al., 2012). This can result in a large fraction (up to 83 % in the Arctic) of ice-containing clouds within this temperature range (Griesche et al., 2021).
To study the nature and concentration of INPs, a variety of droplet freezing techniques have been developed. These droplet freezing techniques essentially differ in (1) the sample volume, (2) the number of droplets investigated per run, (3) the cooling system, and (4) the method used for the detection of nucleation events and temperatures. An overview of various droplet freezing techniques is given by Miller et al. (2021). The sample volume used to investigate the ice nucleation efficiency has a big impact on the type of INPs that can be detected. Instruments with nanoliter and picoliter volumes are primarily used to investigate abundant INPs active at low temperatures (Peckhaus et al., 2016; Reicher et al., 2018; Chen et al., 2018; Budke and Koop, 2015). For these small volumes, the probability of contamination in the negative control is lower, which leads to low freezing temperatures, typically between −30 and −37 °C. Thus, activity can be investigated for samples that nucleate close to the temperatures at which homogenous freezing is initiated. However, low-volume instruments require a high concentration of INPs in the sample for them to be detected. Therefore, small-volume instruments are less suitable for the analysis of high-temperature INPs, which are often present at low concentrations. In contrast, instruments with larger sample volumes allow for the study of rare INPs. However, with larger volumes, the presence of impurities in the water control becomes more likely, leading to a higher background freezing temperature. Consequently, it is challenging to study INPs that are active at low temperatures with large-volume droplet freezing techniques, as the freezing curves at lower temperatures start to overlap with the curves of the pure water background. For instruments with a sample volume of 50 µL, freezing events in the negative control are reported between −20 and −27 °C (Schiebel, 2017; Harrison et al., 2018; Miller et al., 2021; Beall et al., 2017; Barry et al., 2021; David et al., 2019; Gute and Abbatt, 2020). To obtain a high quality of the freezing spectra, a sufficient number of droplets must be analyzed. This can be achieved by investigating a large number of droplets per run or by repeated experiments with the same substance. A recent modeling study has shown that a small number of droplets (< 100) leads to poor statistics and can cause misrepresentation of the underlying INP distribution (de Almeida Ribeiro et al., 2023). Furthermore, droplet freezing techniques differ in the method they use to cool the samples. The cooling system for the droplet freezing techniques is often composed of a liquid cooling bath (Gute and Abbatt, 2020; Chen et al., 2018; David et al., 2019; Miller et al., 2021) or thermostats circulating a cooling liquid through the cooling block (Beall et al., 2017; Schiebel, 2017; Kunert et al., 2018). Other instruments are based on a cold stage cooled by liquid nitrogen (Peckhaus et al., 2016), Peltier elements (Budke and Koop, 2015; Chen et al., 2018), or a Stirling-engine-based cryocooler (Harrison et al., 2018; Tobo et al., 2019). Another difference between the droplet freezing techniques is the way they determine the freezing of the samples. To detect the freezing events, several instruments use an optical camera combined with a temperature sensor to measure the freezing temperatures. As the temperature is measured only at positions where a temperature sensor is placed, gradients within the instrument lead to a reduced accuracy of the detected freezing points. To minimize these gradients, good thermal conductivity of the materials used between the cooling unit and the sample is of great importance. Further, the detection of the freezing temperatures with an optical camera is usually not based on the detection of the ice nucleation event but is instead based on the change in optical properties such as the brightness of the sample during the process of the whole droplet freezing. As a result, the detection of the nucleation temperature based on changing optical properties is challenged by the fact that the total freezing time can take up to several minutes, particularly at larger volumes and temperatures relevant for biogenic INPs. Consequently, it is difficult to determine the exact starting point of ice nucleation using an optical camera. Harrison et al. (2018), for example, reported a freezing time of 100 s for a 50 µL droplet freezing at −12 °C. The delay between the nucleation event and the freezing of the whole droplet can thus result in an error of > 1.5 °C at −12 °C, assuming a cooling rate of 1 °C min−1, and larger errors are expected at higher nucleation temperatures that are relevant for biogenic INPs.
Despite the differences in the design of various droplet freezing techniques, the results they produce have to be comparable across the instruments. Therefore, a series of intercomparison studies with various instruments using compounds such as Snomax (Wex et al., 2015) and illite NX (Hiranuma et al., 2015) were carried out. Snomax is a commercially available product that consists of freeze-dried cell material of the ice-nucleation-active bacterium Pseudomonas syringae, with freezing temperatures as high as −2 °C, and illite NX is a mineral mix that contains illite, kaolinite, quartz, carbonate, and feldspar ice nucleation active at temperatures below −11 °C. Both substances were found to be suitable for intercomparison studies when taken from the same batch, used at similar concentrations, and stored only short-term. However, Polen et al. (2016) observed that the ice nucleation ability of very active proteins in the Snomax powder changes over time during storage in the freezer, which they suggest is due to aging, thus emphasizing the necessity of short storage times. The fact that the ice nucleation capacity of Snomax is unstable over time causes problems in intercomparison studies and leads to deviations in the measured ice nucleation activity that can span several orders of magnitude.
In this publication, we present a novel ice nucleation instrument, the MICROtiter-Plate-based instrument for Ice Nucleation detection in GalliUm with an INfrared camera (micro-PINGUIN). High accuracy is achieved by combining good thermal contact between the sample and the surrounding cooling unit with the detection of freezing events by an infrared camera. The working principle and the validation of micro-PINGUIN are described in the following sections. Furthermore, we address the challenges existent due to inhomogeneities of the product and due to aging effects and propose a possible solution for using Snomax as a suspension for intercomparison studies and reproducibility measurements.
Figure 1 shows a schematic drawing of the micro-PINGUIN instrument. It is composed of three main parts: the cooling unit, the camera tower with an infrared camera for the detection of freezing events, and the electronic components to control the instrument and measure the temperatures. A photograph of the instrument is provided in the Supplement (Fig. S1).
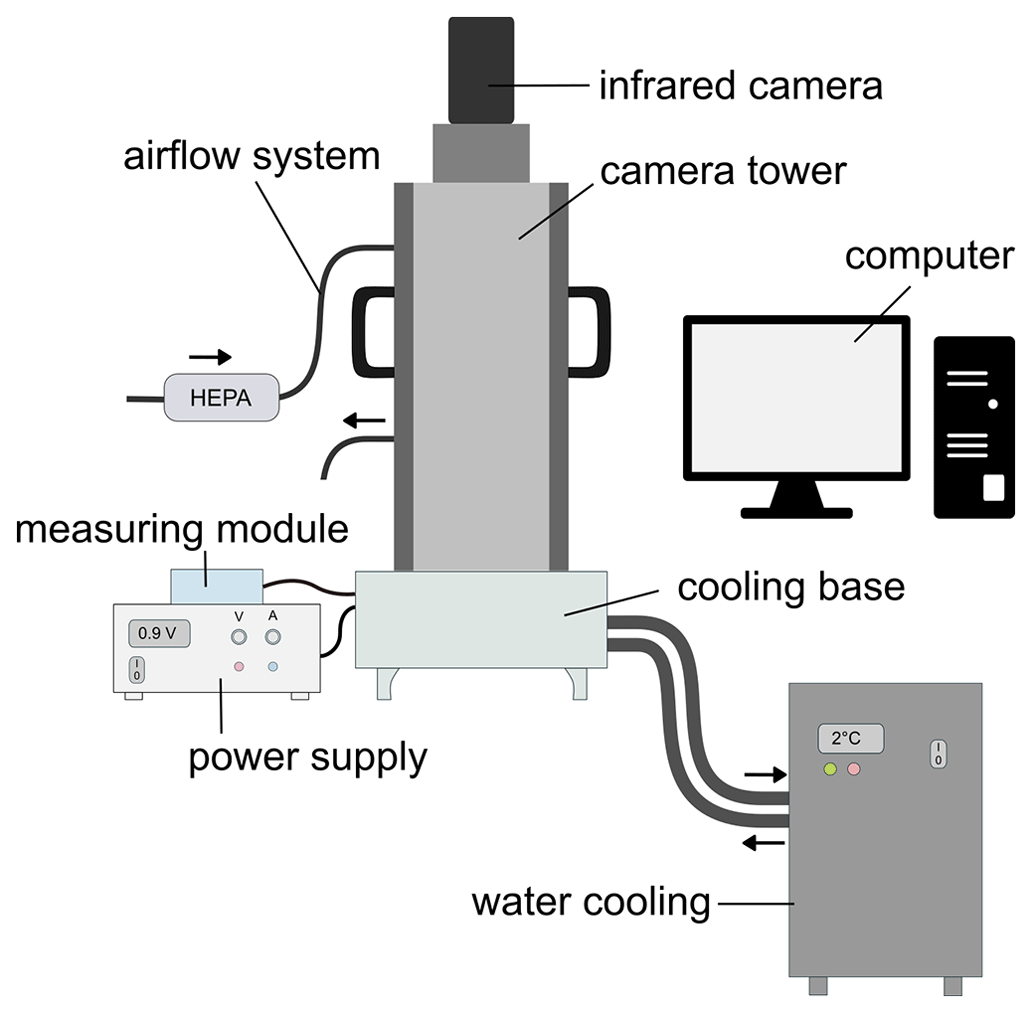
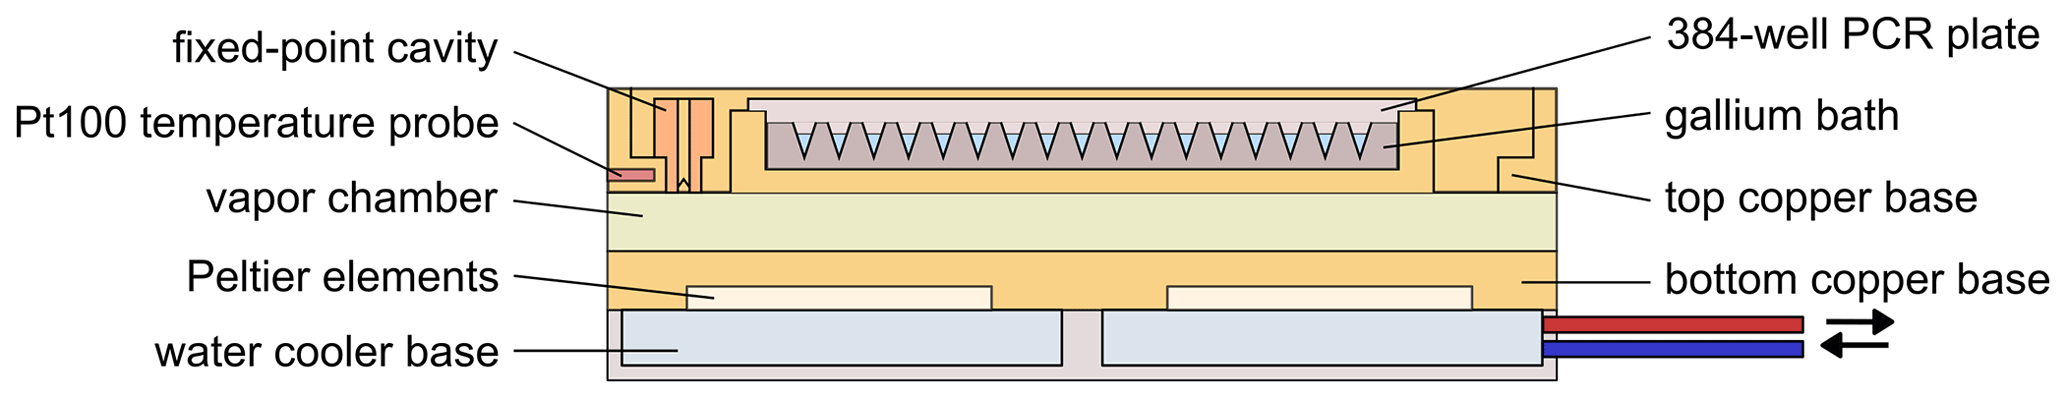
Figure 2Schematic drawing of the cooling base. The red and blue tubes connected to the water cooler base indicate the circulation of cooled water which removes the heat generated by the Peltier elements.
The cooling base of the micro-PINGUIN instrument (Fig. 2) is built up from several layers. Primarily, two Peltier elements, a vapor chamber, and a gallium bath are used to achieve good thermal conductivity, reduce horizontal gradients, and optimize the cooling capacity of the instrument. The temperature and the cooling gradients are controlled by two PID-regulated Peltier elements (QC-241-1.6-15.0M; Quick-Cool, Germany). By applying voltage to the Peltier elements, a temperature difference is achieved between the two sides of the element. A water-cooling bath (Eiszeit 2000; Alphacool, Germany) is connected to the cooling unit and circulates precooled water (2 °C) through the water cooler base plates (Cuplex kryos NEXT sTRX4 FC; Aqua Computer, Germany). Thereby, the heat generated on the lower side of the Peltier elements is removed. The Peltier elements are positioned within a copper base, to which they are connected by thermal pads. Above the lower copper plate, a vapor chamber is used to distribute the temperature evenly and thus minimize horizontal temperature gradients within the instrument. A second copper base is positioned above the vapor chamber. It contains a fixed-point cavity for the temperature measurement with the infrared camera and a Pt100 temperature probe (RTDCAP-100A-2-P098-050-T-40; OMEGA, Denmark) in the same position to achieve precise temperature measurements as described in detail in Sect. 2.3. The upper copper base contains a gallium bath that melts at around 30 °C. A 384-well PCR plate (384 PCR plate full skirt; Sarstedt, Germany) is submerged in the melted gallium bath that solidifies when cooled to room temperature. Thereby, thermal contact between the PCR plate and the cooling unit is obtained. The freezing events are detected with a thermal camera (FLIR A655sc/25° Lens; Teledyne FLIR, US) that is mounted in a black-painted camera tower and positioned above the PCR plate. A continuous flow (10 L min−1) of air with a low relative humidity (< 10 % RH) is circulated within the camera tower to keep the humidity low and to avoid the condensation of water vapor on the PCR plate, which would interfere with the experiments. The instrument is controlled by a custom-made software (Ice Nucleation Controller). By default, a cooling run is started at 10 °C with a cooling rate of 1 °C min−1 until the final temperature of −30 °C is reached.
2.1 The role of the gallium bath
For an optimal cooling performance of the instruments, materials with high thermal conductivity are used. Aluminum is a commonly used material in PCR-plate-based instruments (Schiebel, 2017; Kunert et al., 2018; Beall et al., 2017; Hill et al., 2014) as it has a good thermal conductivity and is easy to shape, which makes it suitable for the PCR plate mount. However, it cannot be avoided that a thin layer of air between the PCR plate and the aluminum plate forms, and because of the insulating properties of air, the thermal contact between the cooling system and the samples is hampered. To maximize thermal contact with the sample while minimizing the manufacturing process of the PCR mounting plate, we used gallium as a mount for the PCR plate (Fig. S2 in the Supplement). Gallium is a metal with a low melting temperature (29.8 °C) and high thermal conductivity (29.3–37.7 ) (Prokhorenko et al., 2000). In the micro-PINGUIN instrument, we use gallium to connect the 384-well PCR plates to the cooling system. By reversing the polarity on the Peltier elements, the instrument can be heated to 40 °C, causing the gallium to melt. The PCR plate is then inserted into the liquid gallium and the instrument is cooled to 10 °C. During this process, the gallium solidifies when close contact with the PCR plate is made, and any excess air is pushed out. To achieve uniform contact for the whole plate, a predetermined weight is placed on top of the PCR plate during the solidification of the gallium. After mounting the PCR plate, 30 µL of the samples per well is distributed using an automatic eight-channel pipette (PIPETMAN P300; Gilson, US). For future versions of this instrument, we plan to make small modifications to demonstrate that the use of gallium has further advantages. As heating can have an impact on the ice nucleation activity of the samples, the wells are usually filled with the suspension after the heating–cooling cycle. However, this procedure can be an additional advantage of using gallium as a mount for the PCR plate. The use of gallium as a heat-conductive medium allows for the application of precise heat treatments of the samples by controlling the temperature of the gallium bath. Consequently, previously measured plates could be remeasured after heating the gallium to the desired temperatures. Heat treatments are a commonly used method to differentiate between different biogenic and inorganic INPs, assuming that the ice nucleation activity of biogenic INPs decreases when they are heated to sufficiently high temperatures (an overview of studies using heat treatments is given in Daily et al., 2022). The approach presented here could substitute traditional heating methods such as ovens or water baths for treating the samples. This would not only simplify the experimental process but also facilitate accurate and reproducible heat treatments for ice nucleation activity studies. Further, when using gallium as a mount for the PCR plates, the instrument is not limited to one type of PCR plate. Small modifications to the instrument allow the use of 96-well plates instead of 384-well plates, thus extending the range of sample volumes and INP concentrations that can be investigated.
2.2 The airflow system
During initial tests of the micro-PINGUIN instrument, freezing temperatures as high as −13 °C were observed for the negative control. Similar freezing temperatures were found for Milli-Q water, tap water, and ultrapure water for molecular work and were not affected by filtration or autoclaving of the water, indicating that these high freezing temperatures are not caused by impurities in the water. During the experiments, the condensation of water vapor on the copper base and the PCR plate was observed. Tests with a flow of compressed air with low humidity (< 10 % RH) passing through the camera tower showed that condensation was avoided during the experiment and that the freezing temperatures decreased with increasing airflow until T50 temperatures, corresponding to the temperature where 50 % of the droplets are frozen, of around −25 °C were reached (Fig. 3). These background freezing temperatures are common for freezing experiments with volumes in the microliter range. Other instruments using volumes of 50 µL (Schiebel, 2017; Harrison et al., 2018; Miller et al., 2021) reported comparable frozen fraction curves obtained by measurements of their negative controls. These airflow experiments indicated that under high-humidity conditions, the freezing was caused by condensed water on the plates instead of INPs in the suspension. Thus, we decided to apply a flow of dry air that is injected at the top part of the camera tower to lower the humidity in the micro-PINGUIN instrument. Before each run, the camera tower is flushed with a high flow of dry air (20 L min−1). The flow is reduced to 10 L min−1 during the measurement to minimize the disturbance of the samples and the introduction of warm air. We measured the relative humidity in the camera tower for this procedure and found that a flow of 10 L min−1 is sufficient for maintaining a low relative humidity during the experiment. Further, we evaluated the sample loss due to evaporation and found that this factor is negligible as only 0.36 % of liquid was lost during an experiment. With this procedure, the T50 temperatures of the negative control were usually as low as −25 °C. Other droplet freezing techniques apply a flow of dry air or N2 to the instrument to avoid frost formation (Schiebel, 2017; Budke and Koop, 2015).
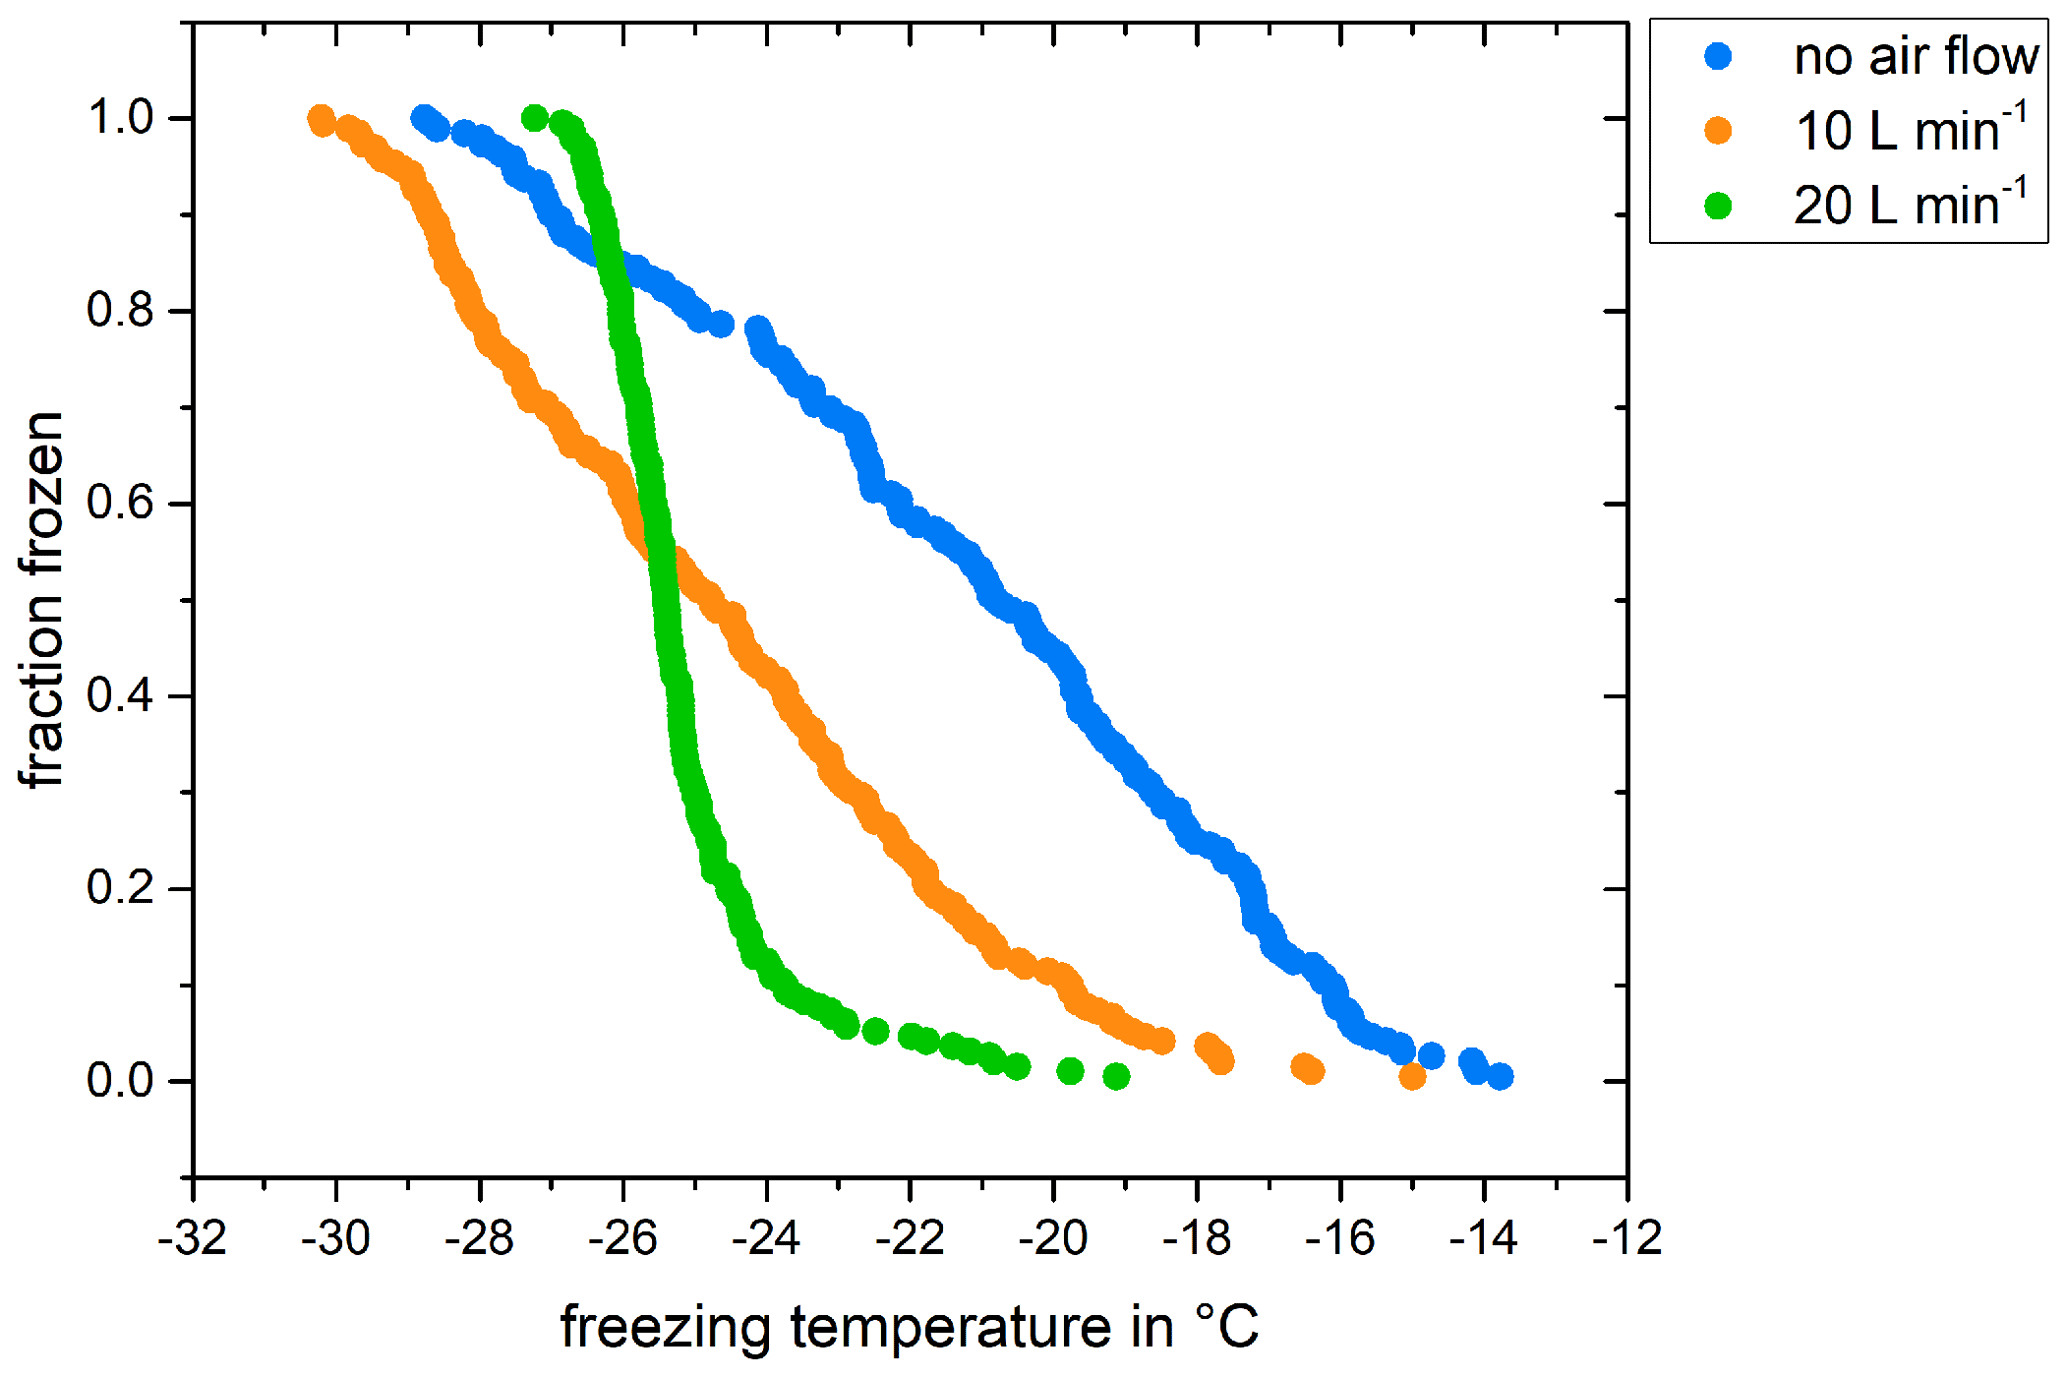
Figure 3Effect of a dry airflow on the freezing behavior of the negative control (Milli-Q water). These freezing curves were obtained without flushing the camera tower with dry air prior to the experiment.
2.3 Temperature measurement and detection of freezing events with a thermal camera
The temperature of the micro-PINGUIN instrument is measured with a thermal camera and a Pt100 temperature probe as a reference. The thermal camera detects the infrared radiation emitted by an object – in this case, a microtiter plate well – and converts it into a visual image. As objects with a higher temperature emit more infrared radiation than objects with a lower temperature and as the temperature increases due to latent heat release once the droplet nucleates, this technique can be used to measure the freezing temperatures of the samples. The camera is sensitive within a wavelength range of 7.5 to 14.0 µm and has a resolution of 640×480 pixels. However, while the thermal camera has high relative precision for the temperature reading (0.06 °C; Appendix A6), it has low absolute precision of ±2 °C; therefore, a fixed-point cavity is used as a reference measurement. The fixed-point cavity is a copper tube with an angled bottom and a black inner surface. The radiation measured by the camera is scattered inside the cavity, which allows for a precise reading of the actual temperature, Tcavity. The Pt100 reference temperature probe is positioned directly against the fixed-point cavity and therefore measures the temperature, TPt100, at the same position in the upper cooper base.
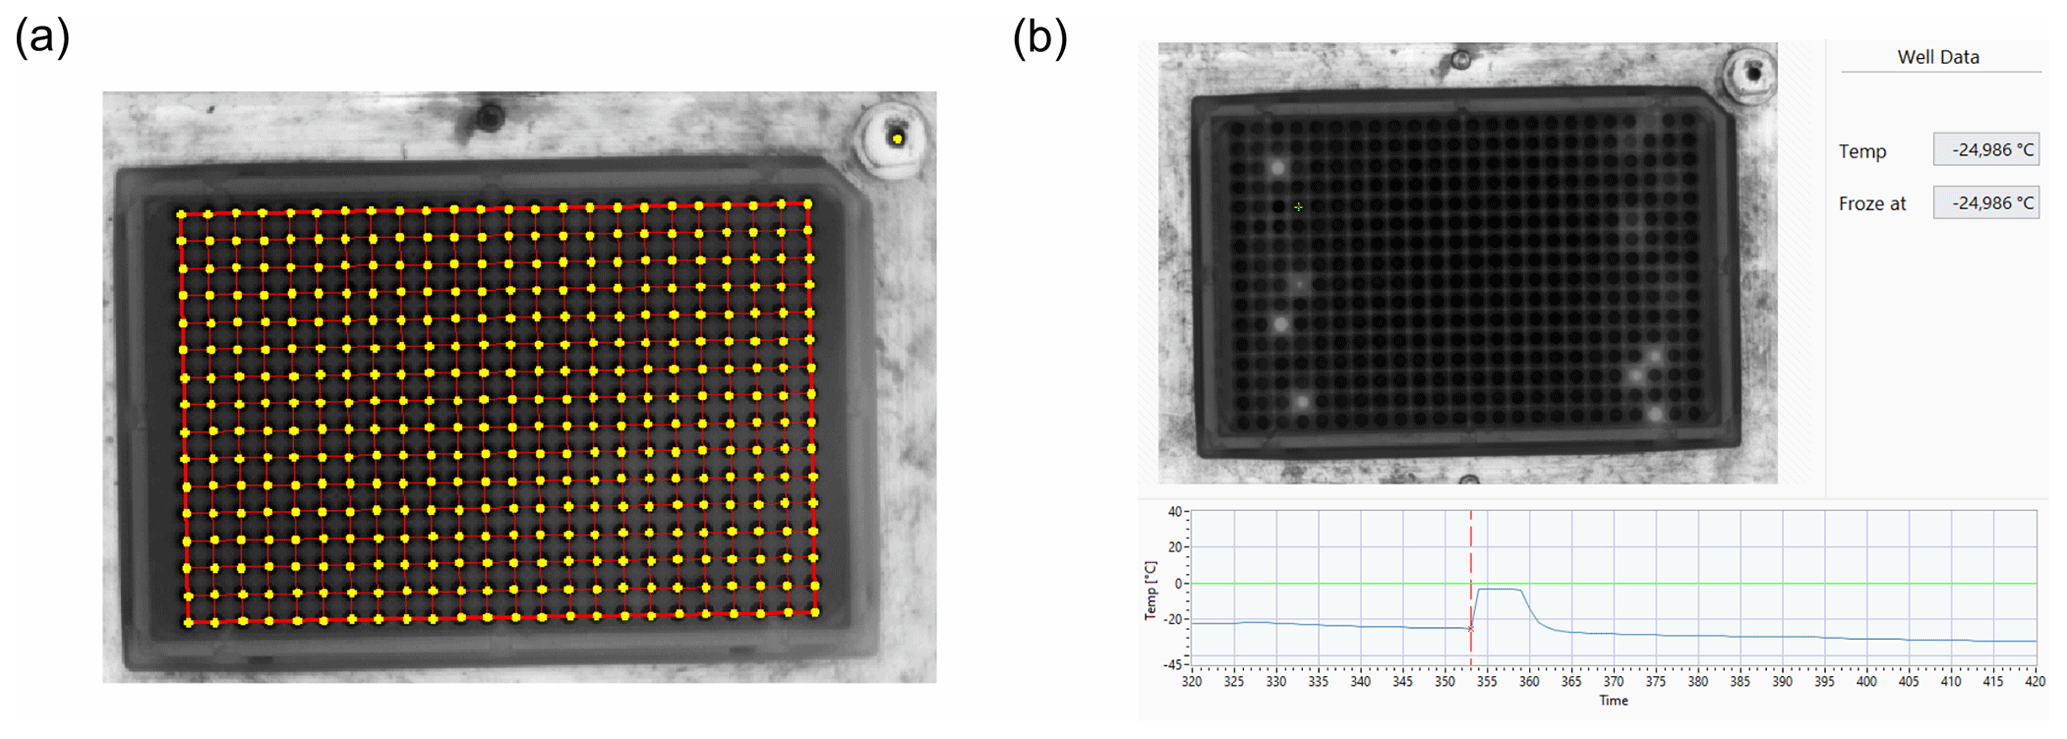
Figure 4(a) Mask created for the freezing point detection. The yellow circles mark the pixels taken for the analysis. (b) Temperature profile of the droplet marked in green. The red line indicates the point in time with the highest temperature gradient.
This temperature measurement is used as a reference temperature and its offset is applied to the temperature reading of the camera during the cooling experiment, Tcamera:
Further, the Pt100 temperature measurement serves as the input for the PID-regulated Peltier elements during the heating and cooling of the instrument. During the freezing of the sample, latent heat is released by the sample because of the phase change from water to ice. The initial phase of freezing when ice crystals start to form is a fast process resulting in an immediate temperature increase in the sample to 0 °C. If this phase change is ongoing, the temperature stays at 0 °C and a plateau forms. When the sample is completely frozen, the release of latent heat stops, and the droplet cools down to ambient temperature. This results in a characteristic temperature profile for a freezing event, as shown in Fig. 4b. The length of this plateau at 0 °C is among other factors dependent on the temperature where the nucleation is initiated. For nucleation events close to 0 °C, which is the case for some highly active biogenic INPs, the temperature of the system when a droplet nucleates can differ significantly from the temperature of the system when the same droplet is completely frozen (Fig. S3 in the Supplement). Using an infrared camera for the detection of the freezing event, we detect this immediate temperature increase upon nucleation to be the freezing temperature of the sample. This is an advantage compared to the freezing point detection based on the change in the optical properties of the droplet. As long as the phase change is ongoing, there are minor changes in optical properties of a droplet, which may be difficult to identify. Often, only once a droplet is completely frozen, the optical properties are large enough to be detected. Such variations in freezing point detection are especially crucial when investigating highly active INPs such as biogenic INPs.
Thus, in the micro-PINGUIN instrument, a thermal camera captures an image of the PCR plate every 5 s, and after each run, the data are processed by custom-made software. This is done as follows: (1) a grid is created by the user, making sure that the location of every well is marked in the program (Fig. 4a). (2) The temperature profile is then processed for each well, and the freezing event is detected as a change in the slope of the temperature of each well (Fig. 4b).
As the change in temperature is smaller for freezing events close to 0 °C, these temperatures can cause problems in the automatic recognition of the nucleation temperature. By default, a freezing event is recognized when the temperature gradient shows a deviation in the temperature profile that is larger than 2 times the standard deviation. This value can be lowered to identify nucleation events at high temperatures. To avoid false detections, the value with the largest deviation in temperature is always used as the freezing temperature.
2.4 Data analysis
Methods to detect droplet freezing events rely on dividing samples into multiple equal volumes and observing the freezing process of these volumes at varying temperatures (known as freezing curves), while maintaining a consistent cooling rate. However, it is important to note that droplet freezing assays have limitations when distinguishing solely between the liquid and frozen states of the droplets. Once the most active INPs among the mixture of INPs initiate freezing and prompt droplet crystallization, the influence of less active INPs is hidden. To comprehensively investigate the freezing characteristics of highly active samples across a broad spectrum of temperatures, it is necessary to study the dilutions of the sample. Thereby, the most active INPs will be diluted out, enabling the analysis of the INPs that are only active at lower temperatures. Calculating the quantity of INPs based on the proportion of frozen droplets requires considering the particle concentration within the solution, the volume of the droplets, and the dilution factor. Following the approach by Vali (1971) and assuming time independence of freezing, the cumulative spectrum, K(T), corresponding to the number of sites active above temperature T per unit sample volume, is described by the following equation:
where V is the droplet volume, Nf(T) is the number of frozen droplets at a given temperature T, and N0 is the number of total droplets per sample. Based on this equation, the number of ice-nucleation-active sites per mass of sample nm(T) is calculated as
using the dilution factor, d, and the particle mass concentration, cm.
2.5 Measurement accuracy
The measurement accuracy of the micro-PINGUIN instrument is determined relative to a calibrated temperature standard. The individual components that contribute to the temperature uncertainty of the instrument are listed in Table 1 and were examined in separate experiments. A detailed description of the measurements and analysis is given in Appendix A1 to A6.
Table 1Quantities contributing to the temperature uncertainty of micro-PINGUIN. The standard uncertainty was determined experimentally, and the contribution to the uncertainty is estimated by taking the distribution of the uncertainty into account.

We found that the largest contribution to the uncertainty of the instrument is the vertical gradient within the well. As the freezing temperature of the sample is determined by the infrared camera measurement, which is a surface-sensitive technique, any vertical gradient in the well leads to an uncertainty in the temperature measurement. The total vertical gradient was 0.20 °C at 0 °C and increased by 0.015 °C per degree when the temperature was lowered. Given that temperature measurements are performed at the surface, all temperature readings should be corrected by half the vertical gradient at a given temperature, resulting in a symmetrical contribution. Thus, the freezing temperatures determined within the experiments are corrected by this temperature correction, Tcorrection:
where ΔT is the difference between the room temperature, TR (22 ± 1 °C), and the surface temperature, TS, measured by the infrared camera in the well (). The vertical gradient was not dependent on the cooling rate in the range between 0.3 and 3 °C min−1 (Fig. S4 in the Supplement), and thus we conclude that the gradient is not attributed to a poor thermal conductivity between the individual parts of the instrument but rather to the warm air above the sample surface.
The individual uncertainty contributions result in an overall temperature-dependent standard uncertainty (k=1) for measurements with micro-PINGUIN of
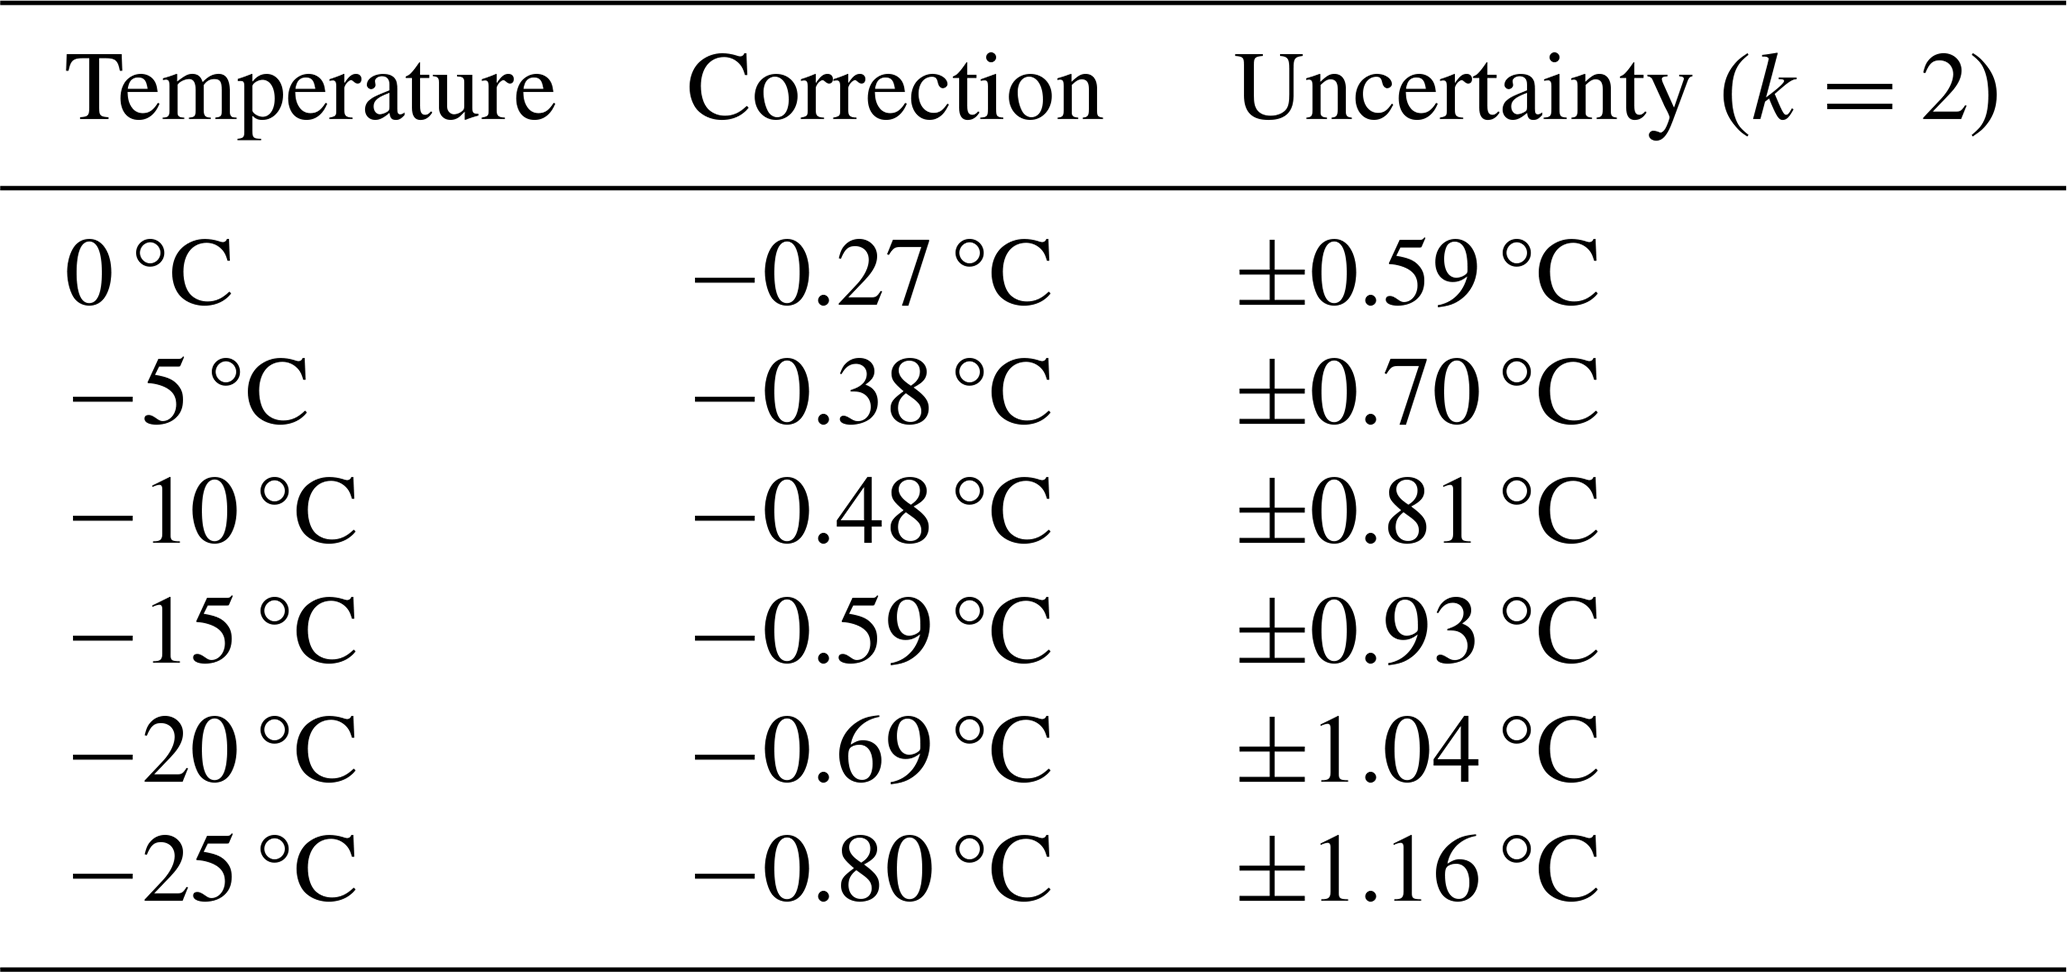
Exemplary uncertainty and correction values for different temperatures are given in Table A1. The horizontal gradient of the instrument was below the sensitivity of the infrared camera (< 0.06 °C) and therefore not included in the calculations. Further factors such as the deviation of the fixed-point cavity from a black body or the thermal anchoring between the fixed-point cavity and the Pt100 temperature probe are considered to have only a minor impact on the accuracy of the instrument and were therefore not investigated in detail here.
3.1 Snomax
The characterization of the micro-PINGUIN instrument involved the use of extensively researched materials, and the obtained outcomes were juxtaposed with outcomes from established ice nucleation instruments. As part of the INUIT (Ice Nuclei research UnIT) initiative, comparative assessments of various ice nucleation instruments were conducted, employing Snomax (Wex et al., 2015) and illite NX (Hiranuma et al., 2015). Snomax is commercially available and consists of the freeze-dried cell material of the ice-nucleation-active bacterium Pseudomonas syringae and is ice-nucleation-active already at temperatures as high as −2 °C (Wex et al., 2015). As the activity of Snomax was proposed to decrease over time, a new batch was ordered from the manufacturer and stored at −20 °C until usage. Care was taken that the Snomax batch was not subjected to many temperature changes, as recommended by the manufacturer. To cover the temperature range of INPs that are active at lower temperatures, illite NX powder was used. Illite NX powder consists of different minerals including illite, kaolinite, quartz, carbonate, and feldspar. As the same batch of illite NX is used as in the INUIT intercomparison study, our results can be directly compared to the results reported by Hiranuma et al. (2015). Measurements with Snomax suspensions of concentrations ranging from 10−2 to 10−7 mg mL−1 were repeated three times. Results are showcased in Fig. 5a alongside the data acquired by Wex et al. (2015). The measurements obtained with the micro-PINGUIN instrument show freezing of Snomax at temperatures as high as −3.5 °C. At −12 °C, concentrations of INPs reach a plateau at 109 INPs per mg of Snomax. At the knee point around −10 °C, INP concentrations obtained in this study are slightly below the values of previous measurements with other instruments, but the plateau reached by the curve is in agreement with that reported by Wex et al. (2015). We noted significant discrepancies in repeated Snomax measurements, even when employing the identical instrument and the same batch of Snomax. As Snomax contains not only the freeze-dried cells of P. syringae bacteria, but also the fragments of the cell membrane, remains of the culture medium, and another unknown material, the number of INPs can vary within the prepared suspension, leading to large variations in the measured freezing curves. Consequently, minor disparities in freezing spectra measured by diverse instruments are expected if different suspensions are used. Furthermore, the variance in ice nucleation activity could potentially stem from the utilization of distinct batches of Snomax in the two studies, variations within the substrate, or the possibility of a marginal reduction in Snomax activity due to storage. We could significantly improve the reproducibility of the measurements using aliquots of a Snomax suspension that were stored frozen until measurements were performed, as shown in Fig. 5b. This observation points at the key role that substance heterogeneity plays for measurement reproducibility. The lower onset freezing temperature in Fig. 5b is attributed to the large variability between freshly prepared Snomax suspensions and not due to a decrease in activity upon freezing. We evaluated the impact of freezing and thawing on the suspension and found that the variations are within the measurement uncertainty (Figs. S5 and S6 in the Supplement). Thus, we propose the use of Snomax suspensions that are prepared in advance and stored frozen in aliquots for reproducibility measurements and further instrument intercomparison studies. The reproducibility of measurements using frozen aliquots is further discussed in Sect. 3.3.
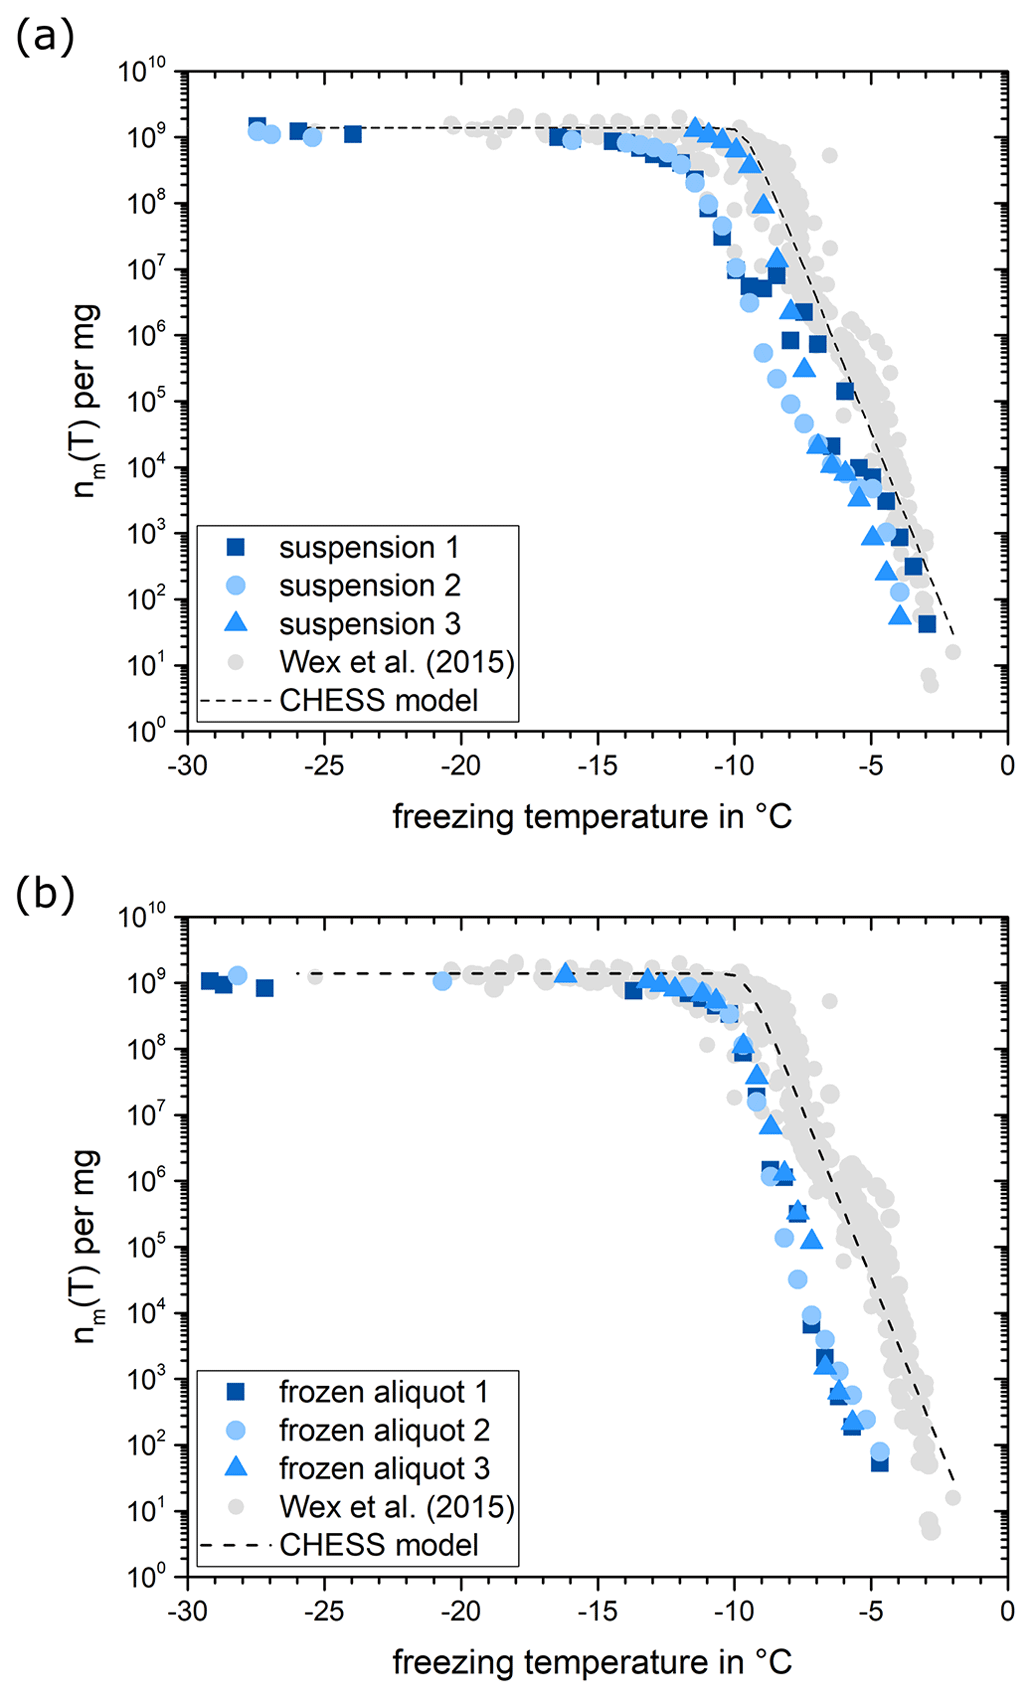
Figure 5(a) Number of INPs per mg Snomax measured for suspensions, with 10−2 to 10−7 mg mL−1 of Snomax prepared freshly on 3 different days. The data were binned in 0.5 °C temperature bins. Grey data points represent the results from various ice nucleation instruments investigated by Wex et al. (2015). The dashed line is based on the CHESS model by Hartmann et al. (2013). (b) The same is shown as in panel (a) but with the Snomax suspension that was prepared once and stored frozen in aliquots and the measurement repeated on freshly thawed aliquots three times.
3.2 Illite NX
The number of INPs normalized for the surface area, ns,BET(T), measured for illite NX suspensions of concentrations between 10 and 0.1 mg mL−1 is shown in Fig. 6 in comparison with data from other devices analyzing illite NX suspensions. The surface area, ns,BET(T), was derived from the nm(T) spectrum following the approach by Hiranuma et al. (2015):
with the specific surface area, θ, obtained from gas adsorption measurements (BET-derived surface area) of 124.4 m2 g−1. We assume the same surface area, as we used an aliquot sourced from the same batch of illite NX as the one used by Hiranuma et al. (2015). The data displayed in Fig. 6 present three measurements with freshly prepared suspensions. The measurements conducted on illite NX demonstrated fair reproducibility. On average, freezing started at around −7.1 °C, with a concentration of INPs per m2 of illite NX. The measurements obtained in this investigation fall in the lower end of the spectra recorded by other devices using a polydisperse illite NX suspension (Hiranuma et al., 2015; Beall et al., 2017; Harrison et al., 2018; David et al., 2019). Thus, our data extend the concentrations of INPs reported for illite NX suspensions.

Figure 6(a) Number of INPs per surface area of illite NX (orange data). The grey data points represent measurements for comparable instruments (Hiranuma et al., 2015; Harrison et al., 2018; Beall et al., 2017; David et al., 2019). The black line shows the fit for all suspension measurement techniques in the logarithmic representation, and the dashed blue line shows the fit from Atkinson et al. (2013) for K-feldspar multiplied by a factor of 0.000014 as discussed in Hiranuma et al. (2015). (b) The right panel shows the same data, zooming in on the range m−2.
3.3 Reproducibility of the measurements
To assess the consistency of measurements conducted with the micro-PINGUIN instrument, successive experiments were carried out employing the identical suspension. This approach aimed at mitigating the influence of dilution errors and variations within the substrates that we used in the tests. Initial trials involving Snomax, illite, and feldspar suspensions revealed an aging phenomenon over the course of the day despite storing the suspensions in the refrigerator between the individual experiments. As a result, the suspensions were freshly prepared immediately prior to each experiment or the suspension was divided into aliquots that were frozen for preservation until needed. In the latter case, the samples were thawed just before conducting the ice nucleation experiment, and all measurements were executed within the same day to minimize disparities in freezer storage time. To characterize this procedure, Snomax was chosen as the test substance due to its biogenic origin and the notable deviations in previous measurements. Figure 7 shows the mean value and standard deviation of the fraction frozen curves for three measurements with a concentration between 10−2 and 10−7 mg mL−1 of Snomax. The experiment's standard deviations range from 0.006 to 1.191 °C, showing outliers for exceedingly high and low INP counts, respectively. Bacterial ice-nucleating proteins show distinct freezing behavior depending on the size of the proteins and can be divided into different classes (Turner et al., 1990; Yankofsky et al., 1981; Hartmann et al., 2013; Budke and Koop, 2015). Budke and Koop (2015) identified two classes of INPs for Snomax: the highly active but less abundant class A INPs nucleate ice at around −3.5 °C, while class C INPs are frequently observed but nucleate at a lower temperature of −8.5 °C. Reproducibility within freezing temperatures ranging from −7 to −10 °C outperformed that at higher temperatures, likely due to the prevalence of class C INPs over the class A INPs, which results in a higher class C homogeneity. The mean standard deviation for this dataset is 0.20 °C, leading to an estimated reproducibility of ±0.20 °C for the micro-PINGUIN instrument. We suggest that this is a conservative estimate due to the difference in the prevalence of class A and class C INPs in the sample. Thus, while the standard deviations observed for the temperature range where class A INPs show predominant activity are due to a combined effect of the technical reproducibility of our instrument and inhomogeneity of the INPs across the droplets, the standard deviations observed for the temperature range where class C INPs show predominant activity primarily reflect the technical reproducibility of our instrument. The results of these reproducibility measurements are in agreement with the measurement uncertainty determined earlier. Further, we could demonstrate that the reproducibility of the measurements is greatly improved when suspensions are stored frozen in aliquots. Storage of the sample for 4 months at −20 °C resulted in a slightly higher standard deviation for the freezing curves, but no clear reduction in ice nucleation activity was observed. The freezing spectra were partly within the standard deviation of the three initial measurements, while other dilutions showed slightly higher or lower freezing temperatures (Figs. S7 and S8 in the Supplement). Overall, the reproducibility was improved compared to freshly prepared Snomax suspensions.

Figure 7(a) Fraction frozen for Snomax suspensions with a concentration between 10−2 and 10−7 mg mL−1. The data for 10−5 and 10−6 mg mL−1 are not shown for illustrative purposes. Data points represent the mean values of three measurements, and the horizontal error bars indicate the standard deviation between these three measurements. (b) Standard deviations for the different concentrations are shown as box plots with 25th and 75th percentiles.
We developed a novel ice nucleation instrument that supports accurate nucleation temperature detection within the temperature range of 0 to −25 °C. The distinctive feature of this instrument is the utilization of a gallium bath, which acts as a platform that holds the PCR plates with the samples. The gallium bath ensures tight contact between the sample and the surrounding cooling unit and thus results in good thermal conductivity. Further, the freezing events are detected with high precision by an infrared camera based on a sudden rise in temperature following the nucleation event. This facilitates the recognition of nucleation events instead of freezing events, further reducing the uncertainty in assigned freezing temperatures. The instrument was thoroughly analyzed for its reproducibility and accuracy of the temperature measurements and can therefore be used for reliable and intercomparable ice nucleation studies. Based on the reproducibility experiments, we recommend that the Snomax suspensions are prepared in advance and stored frozen in aliquots for future reproducibility and instrument intercomparison measurements.
A1 Vertical temperature gradient (δTV)
The vertical temperature profile measurements were performed with a thin thermistor (PSB-S9 Thermistor, PB9-43-SD6) to minimize the disturbance of the measurement by the thermistor and to allow for measurements at several depths in the well. The wells of the 384-well PCR plate were filled with 30 µL of sterile filtered Milli-Q water, and the thermistor was mounted on a micromanipulator positioned above the well. The first measurement was performed with the thermistor approximately 1 mm below the water surface. The cooling experiment was started with 1 °C min−1 until −15 °C, while the temperatures measured with the small thermistor inside the well and a reference temperature probe were recorded by the instrument. After the cooling cycle, the instrument reached a steady-state temperature at around 2 °C (temperature of the cooling water), and the thermistor was lowered by 1.5 mm using the micromanipulator.
The gradient measurements were performed both in the center and at a corner of the 384-well PCR plate. The temperature profiles were recorded for several depths and then evaluated relative to the reference temperature probe. As some freezing events occurred during the measurements, a linear regression analysis was performed for the temperature profiles in the temperature range between 0 and −6 °C to determine the vertical gradient of the instrument.
We observed slightly more gentle gradients at the corner of the plate than in the center of the plate, and thus the steepest gradient was used to estimate the total vertical gradient of the instrument. The vertical gradient contribution in the center well was measured to be 0.20 °C at 0 °C and increased 0.015 °C per degree with lower temperatures (Fig. A1). Given that temperature measurements are done at the surface, all temperature readings should be corrected by half the vertical gradient at a given temperature, resulting in a symmetrical contribution. During the measurements, we observed that the temperature reading was slightly different if the thermistor was touching the wall of the well, probably due to the different thermal conductivity of the plastic material. Due to the conical shape of the wells, it was not possible to lower the thermistor further without making contact with the plastic wall. Due to these limitations, the gradient measurement covers only a depth of approximately 3 mm and would be ideally extrapolated to cover the full depth of the well. To be conservative in our evaluation, we assume a linear relationship and therefore multiply the vertical gradient by a factor of , as the sample in the well has a depth of approximately 8 mm. Thus, the temperature correction due to the vertical gradient is given by the following equation:
where ΔT is the difference between the room temperature, TR (22 ± 1 °C), and the surface temperature, TS, measured by the infrared camera in the well (). The contribution of the vertical gradient represented as the standard uncertainty can be expressed by the following equation:

Figure A1Vertical gradient measurements for well G13 in the middle of the 384-well PCR plate. (a) Temperature profiles measured for three positions in the well. (b) Deviation of the temperature from the mean temperature reading at 0 °C for the three depths.
A2 Pt100 uncertainty (δTT), long-term drift (δTTL), and Pt100 calibrator uncertainty (δTTC)
The temperature measurement of the Pt100 temperature probe is based on a change in its resistance as a function of temperature change and is measured using a National Instruments measurement module (NI-9219; National Instruments, US). Calibration correction parameters were determined using an AMETEK reference temperature calibrator (RTC-157; AMETEK, US) with an external reference temperature probe (Pt100 resistance probe STS 200 A915; AMETEK, US) within the temperature range of 35 to −35 °C. The micro-PINGUIN Pt100 temperature probe was submerged in ethanol inside the RTC calibrator and data were recorded for 5 min in steady-state conditions at 5 °C intervals. This resulted in a maximum residual mean error of 0.0081 °C within the temperature range of 35 to −35 °C. Additionally, the uncertainty of the calibration device, δTTC, which is given by a calibration certificate (δTTC=0.02 °C), must be considered. After a 2-month operation time, the temperature probe will be recalibrated to determine the long-term drift of the temperature reading δTTL. The manufacturer guarantees a long-term stability better than 0.05 °C per 5 years. Initially, the micro-PINGUIN instrument was equipped with a thermistor for the reference temperature measurement. However, during the detailed examination of the uncertainty, we noticed that the thermistor had a high long-term drift. Thus, the thermistor was replaced by the aforementioned Pt100 temperature probe. The vertical gradient measurements and the examination of the infrared camera repeatability, distortion, and non-uniformity correction were conducted with the previous thermistor probe; however, the results are not influenced by the exchange of the reference temperature probe. The measurements of both sensors are accurate and the exchange was only due to the better long-term stability of the Pt100 probe.
A3 Pt100 repeatability (δTTR)
After the calibration, the stability of the Pt100 temperature probe reading was examined by recording the temperature in steady-state conditions at 0 °C for 3 min. The standard deviation of the temperature reading was calculated to be 0.0016 °C and is used to derive the temperature probe repeatability contribution, δTTR.
A4 Thermal camera repeatability (δTCR)
For accurate results, the camera's manufacturer recommends powering up the camera before the measurement. We evaluated the camera warm-up time by recording the deviation between the temperatures measured by the infrared camera relative to the reference temperature probe at the fixed-point cavity (calibration offset). This experiment was performed in steady-state conditions (room temperature) for 1.5 h after powering the camera. Improved stability of the temperature measurement was found after a 40 min operating time of the camera. The repeatability of the temperature reading by the infrared camera is calculated by the standard deviation of the temperature reading in steady-state conditions recorded after the warm-up period. The standard deviation of the temperature readings is ±0.05 °C.
A5 Non-uniformity correction (δTNUC)
The infrared camera constantly records its internal temperature and performing a non-uniformity correction to account for minor detector drifts that occur over time due to internal temperature changes. We observed that the temperature measured before and after this correction can differ slightly. Thus, we evaluated this impact by manually performing several non-uniformity corrections while recording the temperature in steady-state conditions (room temperature). The non-uniformity correction contribution was measured to be 0.15 °C.
A6 Thermal camera distortion (δTCD)
The inhomogeneity of the camera lens has an impact on the temperature measurements across the PCR plate. To evaluate this contribution, the camera was attached to a movable plate and the black-body radiation of the fixed-point cavity was measured for several positions of the camera under steady-state conditions. The offset between the infrared camera and the temperature measured by the temperature probe for several positions gives an estimate of the lens distortion of the camera. The average temperature offset for each position is calculated over a 2 min measurement period with an image frequency of 120 images per minute to minimize the impact of repeatability contributions. The lens distortion contribution was measured to be 0.06 °C.
A7 Measurement uncertainty values
Table A1Measurement uncertainty and temperature corrections for various temperatures at 5 °C steps. The measurement uncertainties are expanded to a coverage of 95 %.
Data and software code will be made available by the corresponding author upon request.
The supplement related to this article is available online at: https://doi.org/10.5194/amt-17-2707-2024-supplement.
All authors contributed to the development and design of micro-PINGUIN. The instrument was manufactured and tested by CM and MRJ. The ice nucleation and uncertainty experiments were conducted by CW. MRJ developed the analysis software and calculated the uncertainty budget. The paper was written by CW, with contributions from all co-authors. The project was supervised by TST and KF.
The contact author has declared that none of the authors has any competing interests.
Publisher's note: Copernicus Publications remains neutral with regard to jurisdictional claims made in the text, published maps, institutional affiliations, or any other geographical representation in this paper. While Copernicus Publications makes every effort to include appropriate place names, the final responsibility lies with the authors.
We are very grateful to Andrey Chuhutin, Frederik Voldbirk, Peter Melvad, Lorenz Meire, and Sigurd Agerskov Madsen for their contributions to the development of the initial instrument. The authors would like to thank Jeppe Fogh Rasmussen for providing the small thermistors and his assistance with the gradient measurements. Further, we acknowledge Mikkel Bo Nielsen for his guidance on the temperature and accuracy measurements. We thank Heike Wex for providing the data of the Snomax intercomparison study and Alexei Kiselev for providing data and the illite samples.
This research has been supported by the Villum Fonden (grant nos. 23175 and 37435), the Carlsbergfondet (grant no. CF21-0630), and the Novo Nordisk Fonden (grant no. NNF19OC0056963).
This paper was edited by Mingjin Tang and reviewed by two anonymous referees.
Atkinson, J. D., Murray, B. J., Woodhouse, M. T., Whale, T. F., Baustian, K. J., Carslaw, K. S., Dobbie, S., O'Sullivan, D., and Malkin, T. L.: The importance of feldspar for ice nucleation by mineral dust in mixed-phase clouds, Nature, 498, 355–358, https://doi.org/10.1038/nature12278, 2013.
Barry, K. R., Hill, T. C. J., Jentzsch, C., Moffett, B. F., Stratmann, F., and DeMott, P. J.: Pragmatic protocols for working cleanly when measuring ice nucleating particles, Atmos. Res., 250, 105419, https://doi.org/10.1016/j.atmosres.2020.105419, 2021.
Beall, C. M., Stokes, M. D., Hill, T. C., DeMott, P. J., DeWald, J. T., and Prather, K. A.: Automation and heat transfer characterization of immersion mode spectroscopy for analysis of ice nucleating particles, Atmos. Meas. Tech., 10, 2613–2626, https://doi.org/10.5194/amt-10-2613-2017, 2017.
Budke, C. and Koop, T.: BINARY: an optical freezing array for assessing temperature and time dependence of heterogeneous ice nucleation, Atmos. Meas. Tech., 8, 689–703, https://doi.org/10.5194/amt-8-689-2015, 2015.
Chen, J., Wu, Z., Augustin-Bauditz, S., Grawe, S., Hartmann, M., Pei, X., Liu, Z., Ji, D., and Wex, H.: Ice-nucleating particle concentrations unaffected by urban air pollution in Beijing, China, Atmos. Chem. Phys., 18, 3523–3539, https://doi.org/10.5194/acp-18-3523-2018, 2018.
Daily, M. I., Tarn, M. D., Whale, T. F., and Murray, B. J.: An evaluation of the heat test for the ice-nucleating ability of minerals and biological material, Atmos. Meas. Tech., 15, 2635–2665, https://doi.org/10.5194/amt-15-2635-2022, 2022.
David, R. O., Cascajo-Castresana, M., Brennan, K. P., Rösch, M., Els, N., Werz, J., Weichlinger, V., Boynton, L. S., Bogler, S., Borduas-Dedekind, N., Marcolli, C., and Kanji, Z. A.: Development of the DRoplet Ice Nuclei Counter Zurich (DRINCZ): validation and application to field-collected snow samples, Atmos. Meas. Tech., 12, 6865–6888, https://doi.org/10.5194/amt-12-6865-2019, 2019.
de Almeida Ribeiro, I., Meister, K., and Molinero, V.: HUB: a method to model and extract the distribution of ice nucleation temperatures from drop-freezing experiments, Atmos. Chem. Phys., 23, 5623–5639, https://doi.org/10.5194/acp-23-5623-2023, 2023.
Griesche, H. J., Ohneiser, K., Seifert, P., Radenz, M., Engelmann, R., and Ansmann, A.: Contrasting ice formation in Arctic clouds: surface-coupled vs. surface-decoupled clouds, Atmos. Chem. Phys., 21, 10357–10374, https://doi.org/10.5194/acp-21-10357-2021, 2021.
Gute, E. and Abbatt, J. P. D.: Ice nucleating behavior of different tree pollen in the immersion mode, Atmos. Environ., 231, 117488, https://doi.org/10.1016/j.atmosenv.2020.117488, 2020.
Harrison, A. D., Whale, T. F., Rutledge, R., Lamb, S., Tarn, M. D., Porter, G. C. E., Adams, M. P., McQuaid, J. B., Morris, G. J., and Murray, B. J.: An instrument for quantifying heterogeneous ice nucleation in multiwell plates using infrared emissions to detect freezing, Atmos. Meas. Tech., 11, 5629–5641, https://doi.org/10.5194/amt-11-5629-2018, 2018.
Hartmann, S., Augustin, S., Clauss, T., Wex, H., Šantl-Temkiv, T., Voigtländer, J., Niedermeier, D., and Stratmann, F.: Immersion freezing of ice nucleation active protein complexes, Atmos. Chem. Phys., 13, 5751–5766, https://doi.org/10.5194/acp-13-5751-2013, 2013.
Hill, T. C. J., Moffett, B. F., DeMott, P. J., Georgakopoulos, D. G., Stump, W. L., and Franc, G. D.: Measurement of Ice Nucleation-Active Bacteria on Plants and in Precipitation by Quantitative PCR, Appl. Environ. Microb., 80, 1256–1267, https://doi.org/10.1128/AEM.02967-13, 2014.
Hiranuma, N., Augustin-Bauditz, S., Bingemer, H., Budke, C., Curtius, J., Danielczok, A., Diehl, K., Dreischmeier, K., Ebert, M., Frank, F., Hoffmann, N., Kandler, K., Kiselev, A., Koop, T., Leisner, T., Möhler, O., Nillius, B., Peckhaus, A., Rose, D., Weinbruch, S., Wex, H., Boose, Y., DeMott, P. J., Hader, J. D., Hill, T. C. J., Kanji, Z. A., Kulkarni, G., Levin, E. J. T., McCluskey, C. S., Murakami, M., Murray, B. J., Niedermeier, D., Petters, M. D., O'Sullivan, D., Saito, A., Schill, G. P., Tajiri, T., Tolbert, M. A., Welti, A., Whale, T. F., Wright, T. P., and Yamashita, K.: A comprehensive laboratory study on the immersion freezing behavior of illite NX particles: a comparison of 17 ice nucleation measurement techniques, Atmos. Chem. Phys., 15, 2489–2518, https://doi.org/10.5194/acp-15-2489-2015, 2015.
Kunert, A. T., Lamneck, M., Helleis, F., Pöschl, U., Pöhlker, M. L., and Fröhlich-Nowoisky, J.: Twin-plate Ice Nucleation Assay (TINA) with infrared detection for high-throughput droplet freezing experiments with biological ice nuclei in laboratory and field samples, Atmos. Meas. Tech., 11, 6327–6337, https://doi.org/10.5194/amt-11-6327-2018, 2018.
Miller, A. J., Brennan, K. P., Mignani, C., Wieder, J., David, R. O., and Borduas-Dedekind, N.: Development of the drop Freezing Ice Nuclei Counter (FINC), intercomparison of droplet freezing techniques, and use of soluble lignin as an atmospheric ice nucleation standard, Atmos. Meas. Tech., 14, 3131–3151, https://doi.org/10.5194/amt-14-3131-2021, 2021.
Mülmenstädt, J., Sourdeval, O., Delanoë, J., and Quaas, J.: Frequency of occurrence of rain from liquid-, mixed-, and ice-phase clouds derived from A-Train satellite retrievals, Geophys. Res. Lett., 42, 6502–6509, https://doi.org/10.1002/2015GL064604, 2015.
Murray, B. J., O'Sullivan, D., Atkinson, J. D., and Webb, M. E.: Ice nucleation by particles immersed in supercooled cloud droplets, Chem. Soc. Rev., 41, 6519–6554, https://doi.org/10.1039/C2CS35200A, 2012.
Peckhaus, A., Kiselev, A., Hiron, T., Ebert, M., and Leisner, T.: A comparative study of K-rich and Na/Ca-rich feldspar ice-nucleating particles in a nanoliter droplet freezing assay, Atmos. Chem. Phys., 16, 11477–11496, https://doi.org/10.5194/acp-16-11477-2016, 2016.
Polen, M., Lawlis, E., and Sullivan, R. C.: The unstable ice nucleation properties of Snomax® bacterial particles, J. Geophys. Res.-Atmos., 121, 11666–11678, https://doi.org/10.1002/2016JD025251, 2016.
Prokhorenko, V., Roshchupkin, V., Pokrasin, M., Prokhorenko, S., and Kotov, V.: Liquid Gallium: Potential Uses as a Heat-Transfer Agent, High Temp.+, 38, 954–968, https://doi.org/10.1023/A:1004157827093, 2000.
Reicher, N., Segev, L., and Rudich, Y.: The WeIzmann Supercooled Droplets Observation on a Microarray (WISDOM) and application for ambient dust, Atmos. Meas. Tech., 11, 233–248, https://doi.org/10.5194/amt-11-233-2018, 2018.
Schiebel, T.: Ice Nucleation Activity of Soil Dust Aerosols, PhD thesis, Karlsruher Institut für Technologie (KIT), https://doi.org/10.5445/ir/1000076327, 2017.
Tobo, Y., Adachi, K., DeMott, P. J., Hill, T. C. J., Hamilton, D. S., Mahowald, N. M., Nagatsuka, N., Ohata, S., Uetake, J., Kondo, Y., and Koike, M.: Glacially sourced dust as a potentially significant source of ice nucleating particles, Nat. Geosci., 12, 253–258, https://doi.org/10.1038/s41561-019-0314-x, 2019.
Turner, M. A., Arellano, F., and Kozloff, L. M.: Three separate classes of bacterial ice nucleation structures, J. Bacteriol., 172, 2521–2526, https://doi.org/10.1128/jb.172.5.2521-2526.1990, 1990.
Vali, G.: Quantitative Evaluation of Experimental Results an the Heterogeneous Freezing Nucleation of Supercooled Liquids, J. Atmos. Sci., 28, 402–409, https://doi.org/10.1175/1520-0469(1971)028<0402:Qeoera>2.0.Co;2, 1971.
Wex, H., Augustin-Bauditz, S., Boose, Y., Budke, C., Curtius, J., Diehl, K., Dreyer, A., Frank, F., Hartmann, S., Hiranuma, N., Jantsch, E., Kanji, Z. A., Kiselev, A., Koop, T., Möhler, O., Niedermeier, D., Nillius, B., Rösch, M., Rose, D., Schmidt, C., Steinke, I., and Stratmann, F.: Intercomparing different devices for the investigation of ice nucleating particles using Snomax® as test substance, Atmos. Chem. Phys., 15, 1463–1485, https://doi.org/10.5194/acp-15-1463-2015, 2015.
Yankofsky, S. A., Levin, Z., Bertold, T., and Sandlerman, N.: Some Basic Characteristics of Bacterial Freezing Nuclei, J. Appl. Meteorol. Clim., 20, 1013–1019, https://doi.org/10.1175/1520-0450(1981)020<1013:Sbcobf>2.0.Co;2, 1981.
- Abstract
- Introduction
- Description of the instrument
- Ice nucleation activity of Snomax and illite
- Conclusion
- Appendix A: Description of the uncertainty measurements
- Code and data availability
- Author contributions
- Competing interests
- Disclaimer
- Acknowledgements
- Financial support
- Review statement
- References
- Supplement