the Creative Commons Attribution 4.0 License.
the Creative Commons Attribution 4.0 License.
 | 21 May 2024
Full characterization and calibration of a transfer standard monitor for atmospheric radon measurements
Claudia Grossi
Stefan Röttger
Arturo Vargas
In this work, a full characterization of the new user-friendly version of the Atmospheric Radon MONitor (ARMON), used to measure very low activity concentrations of the radioactive radon gas in the outdoor atmosphere, is carried out. The ARMON is based on the electrostatic collection of 218Po+ particles on a semiconductor detector surface. A main advantage of this instrument is that it offers high-resolution alpha-energy spectra, which will allow us to separate radon progeny (210Po, 218Po, and 214Po). The monitor feature may also allow measurements of thoron (220Rn) by collection of 216Po+, although the instrument is not calibrated for this gas.
In the paper, the physical principle; the hardware configuration; and the software development of the automatic and remotely controlled ARMON, conceived and constructed within the MAR2EA and the traceRadon projects, are described. The monitor efficiency and its linearity over a wide span of radon concentration activities have been evaluated and tested here using theoretical and experimental approaches. Finally, a complete budget analysis of the total uncertainty of the monitor was also achieved.
Results from the application of a simplified theoretical approach show a detection efficiency for 218Po+ of about 0.0075 (Bq m−3)−1 s−1. The experimental approach, consisting of exposing the ARMON at controlled radon concentrations between a few hundreds to a few thousands of becquerels per cubic metre (Bq m−3), gives a detection efficiency for 218Po+ of 0.0057 ± 0.0002 (Bq m−3) s−1. This last value and its independence from the radon levels were also confirmed thanks to a new calibration method which allows us, using low-emanation sources, to obtain controlled radon levels of a few tens of becquerels per cubic metre (Bq m−3).
The total uncertainty of the ARMON detection efficiency obtained for hourly radon concentrations above 5 Bq m−3 was lower than 10 % (k= 1). The characteristic limits of the ARMON – being those dependent on the presence of thoron in the sampled air – were also calculated. A detection limit of 0.132 Bq m−3 was estimated in the absence of thoron. At a typical thoron concentration at atmospheric sites of 0.017 min−1, the detection limit was calculated to be 0.3 Bq m−3, but this can be reduced if using a delay volume, obtaining a decision threshold of 0.0045 Bq m−3. Current results may allow us to confirm that the ARMON is suitable to measure low-level radon activity concentrations (1–100 Bq m−3) and to be used as a transfer standard to calibrate secondary atmospheric radon monitors.
- Article
(7511 KB) - Full-text XML
- BibTeX
- EndNote


Radon-222 (222Rn) is a radioactive noble gas naturally generated from radium (226Ra) within the primordial uranium-238 (238U) decay chain (Nazaroff and Nero, 1988). Its exhalation from soils depends mainly on the uranium content, soil properties (such as porosity or bulk density), and soil moisture (Conen and Robertson, 2002). The global 222Rn source into the atmosphere is mainly restricted to land surfaces (Szegvary et al., 2009; Karstens et al., 2015), with the 222Rn flux from water surfaces considered to be negligible for most applications (Schery and Huang, 2004). Radon has a half-life of 3.82 d and, due to the fact that it does not have any other significant atmospheric sink apart from its radioactive decay, has largely been used in the last decades as a tracer for atmospheric studies; 222Rn has been used to understand atmospheric processes such as the dynamics of the boundary layer (Chambers et al., 2011; Pal et al., 2015; Vargas et al., 2015), to improve inverse transport models (Hirao et al., 2010), to assess the accuracy of chemical transport models (Jacob and Prather, 1990; Arnold et al., 2010; Chambers et al., 2019), and to study atmospheric transport and mixing processes within the planetary boundary layer (Zahorowski et al., 2004; Galmarini, 2006; Baskaran, 2011, 2016; Williams et al., 2016). When measured together with another gas (e.g. air pollutants or greenhouse gases such as carbon dioxide or methane), it can be also used to detect sources and to indirectly quantify fluxes of that gas. The radon tracer method (RTM) (Levin et al., 1999) is one of the methodologies used to indirectly determine regional and nocturnal fluxes of greenhouse gases and air pollutants (Vogel et al., 2012; Wada et al., 2013; Levin et al., 2021). In addition, if the RTM is used together with back-trajectory analyses, it will allow a better quantification of the different local versus regional contributions and an estimation of the effective radon flux seen by the station under study (Grossi et al., 2018).
For its utility, 222Rn measurements are so far not mandatory but are recommended at the atmospheric stations of the Integrated Carbon Observation System network (ICOS RI, 2020). Atmospheric radon activity concentrations usually range between a few hundreds of megabecquerels per cubic metre (mBq m−3) and tens of becquerels per cubic metre (Bq m−3), depending on whether the measurements are carried out at coastal or continental sites, respectively (Chambers et al., 2016; Grossi et al., 2016). Thus, high-precision radon measurements are required for atmospheric applications.
Available commercial radon monitors, usually used in the radiation protection field or for geophysical research goals, are so far not suitable for high-quality atmospheric measurements (Radulescu et al., 2022). In the last years, three research entities have designed and developed highly sensitive 222Rn and 222Rn progeny monitors, which are currently running at different European atmospheric stations: (i) the Heidelberg monitor, developed at the Institute of Environmental Physics of Heidelberg University (Schmidt et al., 1996; Levin et al., 2002), determines the atmospheric 222Rn activity concentration using the measured 214Po daughter activity with a static-filter method and assuming a constant equilibrium factor between radon and its short-lived progeny in air (Schmithüsen et al., 2017); (ii) the monitor from the Australian Nuclear Science and Technology Organisation (ANSTO) determines the atmospheric 222Rn activity concentration using the dual-flow-loop two-filter method (Whittlestone and Zahorowski, 1998; Zahorowski et al., 2004); and (iii) the Atmospheric Radon MONitor (ARMON), designed and built at the Institute of Energy Technologies (INTE) of the Universitat Politècnica de Catalunya (UPC) is based on alpha spectrometry from the positive ions of 218Po electrostatically collected on a passivated implanted planar silicon (PIPS) detector surface (Grossi et al., 2012; Vargas et al., 2004, 2015). Several monitors of this last type have been displaced at atmospheric Spanish stations for atmospheric research studies (Grossi, 2012; Hernández-Ceballos et al., 2015; Vargas et al., 2015; Grossi et al., 2018; Gutiérrez-Álvarez et al., 2019). The response of the ARMON under different field conditions was also compared with the response of other atmospheric radon monitors as the ANSTO or the Heidelberg Radon Monitor in an intercomparison campaign in the south of Paris in 2016 (Grossi et al., 2020).
In the framework of the Catalan MAR2EA project (High efficiency monitor of atmospheric radon concentration for radioprotection and environmental applications, LLAVOR program, 2020–2021) and of the Working Package 1 (WP1) of the European traceRadon project (Röttger et al., 2021), an improved ARMON prototype was developed (here labelled as the ARMON v2). The main objective of the traceRadon project was the development of a metrological infrastructure to ensure the traceability of low-level radon measurements. Specifically, the WP1 aimed to develop traceable methods, according to IEC 61577, for the measurement of outdoor low-level radon activity concentrations in the range of 1 to 100 Bq m−3, with uncertainties lower than 10 % (k= 1), to be used in climate and radiation protection networks. Within this WP1, the INTE-UPC group was in charge of designing and building a mobile and user-friendly transfer standard instrument useful for the calibration of radon monitors running at atmospheric and radiological stations. This new user-friendly monitor is an improved version of the previous ARMON, mainly with regard to its robustness, portability, sensitivity, settings, and automatic control.
In the present paper, the design and setup of the ARMON v2 are described in detail together with the theoretical and experimental methodologies applied to evaluate the detection efficiency of the monitor. The total uncertainty of the ARMON detection efficiency was also calculated considering the different parameters and variables that could influence it, such as the statistic number of counts of each alpha spectrum measured by the ARMON v2, the effect of the water content of the sampled air, the STP (standard temperature and pressure) correction, and the monitor background.
The ARMON was calibrated at the INTE-UPC radon chamber using reference radon concentrations between a few hundred becquerels per cubic metre (Bq m−3) and a few thousand becquerels per cubic metre (Bq m−3). In order to check if the detection efficiency obtained thanks to the INTE-UPC exposures was also confirmed for very low radon activity concentrations (tens of Bq m−3), an independent experiment was carried out at the Physikalisch-Technische Bundesanstalt (PTB) facility using new low-radon-emanation sources and methods also generated within the WP1 of the traceRadon project.
The ARMON v2 presented in this paper, thanks to its sensitivity and robustness, has the potential to help in the improvement of the sources, transport, and fate of 222Rn in the environment. The full characterization of this instrument and its uncertainty budget may be useful in supporting the development of accurate atmospheric studies and in enhancing the capabilities of the radon tracer method for estimating greenhouse gas fluxes.
2.1 Physical principles of the ARMON v2
The physical principle of operation of the ARMON is based on the collection of the positively charged 218Po particles resulting from the alpha decay of the 222Rn within the detection volume on the surface of a semiconductor detector. This methodology is well known and has been used in the past by other researchers (Grossi et al., 2012; Hopke, 1989; Tositti et al., 2002; Wada et al., 2010). The 218Po+ particles, generated within a known volume, are found to be in the form of singly charged positive ions 88 % of the time, while the neutral ions occur the remaining 12 % of the time (Goldstein and Hopke, 1985); 218Po+ can be due to the stripping of orbital electrons by the departing α particle or by the recoil motion. When a high electric potential is applied to the internal surface of the detection volume, with the detector itself maintained at 0 V, an electrostatic field (EF) is generated inside the volume, causing the charged 218Po+ particles to be collected at the detector surface within a short time.
In the case of the ARMON, a passivated implanted planar silicon (PIPS) detector is used. A preamplifier and an amplifier are then used to amplify and shape the electric signal coming from the detector into a Gaussian function in order for the electric signal to be read by a multichannel analyser (MCA) that transforms it into counts for specific energy bins. The spectra generated are then analysed with the software MAESTRO (Multichannel Analyzer Emulation Software, ORTEC). A typical 1 h spectrum for atmospheric radon in air obtained with the ARMON v2 is shown in the Appendix A (Fig. A1).
Using this previous methodology, the 218Po counts (with an α decay at 6.0 MeV) can be separated in the spectrum from other 222Rn progeny isotopes such as 214Po (α decay at 7.7 MeV) and 210Po (α decay at 5.3 MeV). Using the same principle, the ARMON v2 is also able to measure 220Rn by detection of its progeny, 216Po (α decay at 6.8 MeV) and 212Po (8.78 MeV). However, in the present paper, the full characterization of the instrument was only carried out for radon measurements due to the lack of a metrology chain for low-level thoron measurements. In this regard, it is needed to be clarified that if 220Rn (thoron) is also present within the sampled air, then 212Bi particles are also formed through β decay of 212Pb, coming from the 220Rn progeny. The 36 % of this 212Bi α decays to 208Tl at a similar energy as 218Po (6.05 MeV) and affects the net counts of 218Po and thus the uncertainty of the final radon measurements, as explained in Grossi et al. (2012) and Vargas et al. (2015). The other 64 % of the 212Bi particles β decay to 212Po ( s), which α decays at 8.78 MeV to the stable nuclide 208Pb. Thanks to the high energy resolution of the ARMON spectra, the decay of the 212Po particles can be registered, separated, and counted. Therefore, the 212Bi counts can be estimated by multiplying the factor by the 212Po counts, and its contribution may be subtracted from the gross 218Po counting. The radon concentration is thus calculated for each spectrum of real time length t (in seconds) using Eq. (1):
where ncPo218 is the number of counts of 218Po detected within the ROI (region of interest); ncPo212 is the number of counts of 212Po detected within the ROI; t is the integration time of the spectrum; ε is the detection efficiency of the instrument, defined as the detected 218Po count rate per 222Rn air concentration and expressed here in counts per second (cps, s−1) per becquerel per cubic metre (Bq m−3).
It is also important to underline that charged 218Po ions present within the detection volume may be neutralized due to the interaction with water vapour present in the sampled air via the formation of hydroxyl radicals (OH) (Hopke, 1989). Therefore, water vapour particles must be kept as low as possible inside the detection volume in order to maximize the collection efficiency, and the response of the monitor, under different water vapour content conditions, must be corrected as shown here. Assuming a linear correction of the efficiency due to water vapour concentration (Hopke, 1989), the real efficiency of our monitor can be expressed by Eq. (2), where ε0 is the efficiency under dry conditions (0 ppmv of H2O), b is the trend of the linear correction, and [H2O] is the water vapour concentration.
2.2 ARMON setup: hardware and software
A schematic design of the ARMON v2 is shown in Fig. 1a. A photograph of the external case is shown in Fig. 1b. Before entering the detection volume, the air, sampled with a pump (blue line in Fig. 1a), passes through a 0.5 µm filter to prevent the entry of dust- and aerosol-attached 222Rn progeny into the detection volume. Then the air enters into the detection volume, which is made of a glass sphere that is internally silver-plated, with a neck of 45 mm inner diameter. The PIPS detector of 300 mm2 active area (Mirion Technologies A300-17) is located on the upper part of the sphere, tangent to it, and at the bottom of the neck. This last configuration was used to maximize the collection of the polonium by the EF, as shown later, and it was obtained using a solid Teflon stopper. A high-voltage power supply (Glassman MJ15P1000) provides a potential of 10 kV between the PIPS detector (at 0 V) and the sphere walls to create the EF. The pulse pre-amplifier and amplifier (model: CR-10 from Pyramid Technical Consultants Inc.) are located outside the sphere to shape and amplify the signal and to send it to the MCA (model: ORTEC EASY-MCA 2k). When the sampled air exits the detection volume, it passes through a series of sensors: a digital flow meter (SMC PFM710S-F019), a temperature meter (JUMO PT100), and a dew point meter (VAISALA DMT 143). The sensors are controlled by a data logger (Advantech USB4622CE) connected to a laptop. All the hardware is installed inside a flight-case box of 128 × 50 × 50 cm3, with the inlet and outlet air-sampling connectors located on the backside of the case (Fig. 1b). The different components of the instrument are placed on different trays and drawers for purposes of easy access and to conduct the necessary maintenance if needed. A drawing and photos of the monitor are shown in Appendix A (Fig. A2). The inlet flow required for the monitor is about 2 L min−1 of dried air.
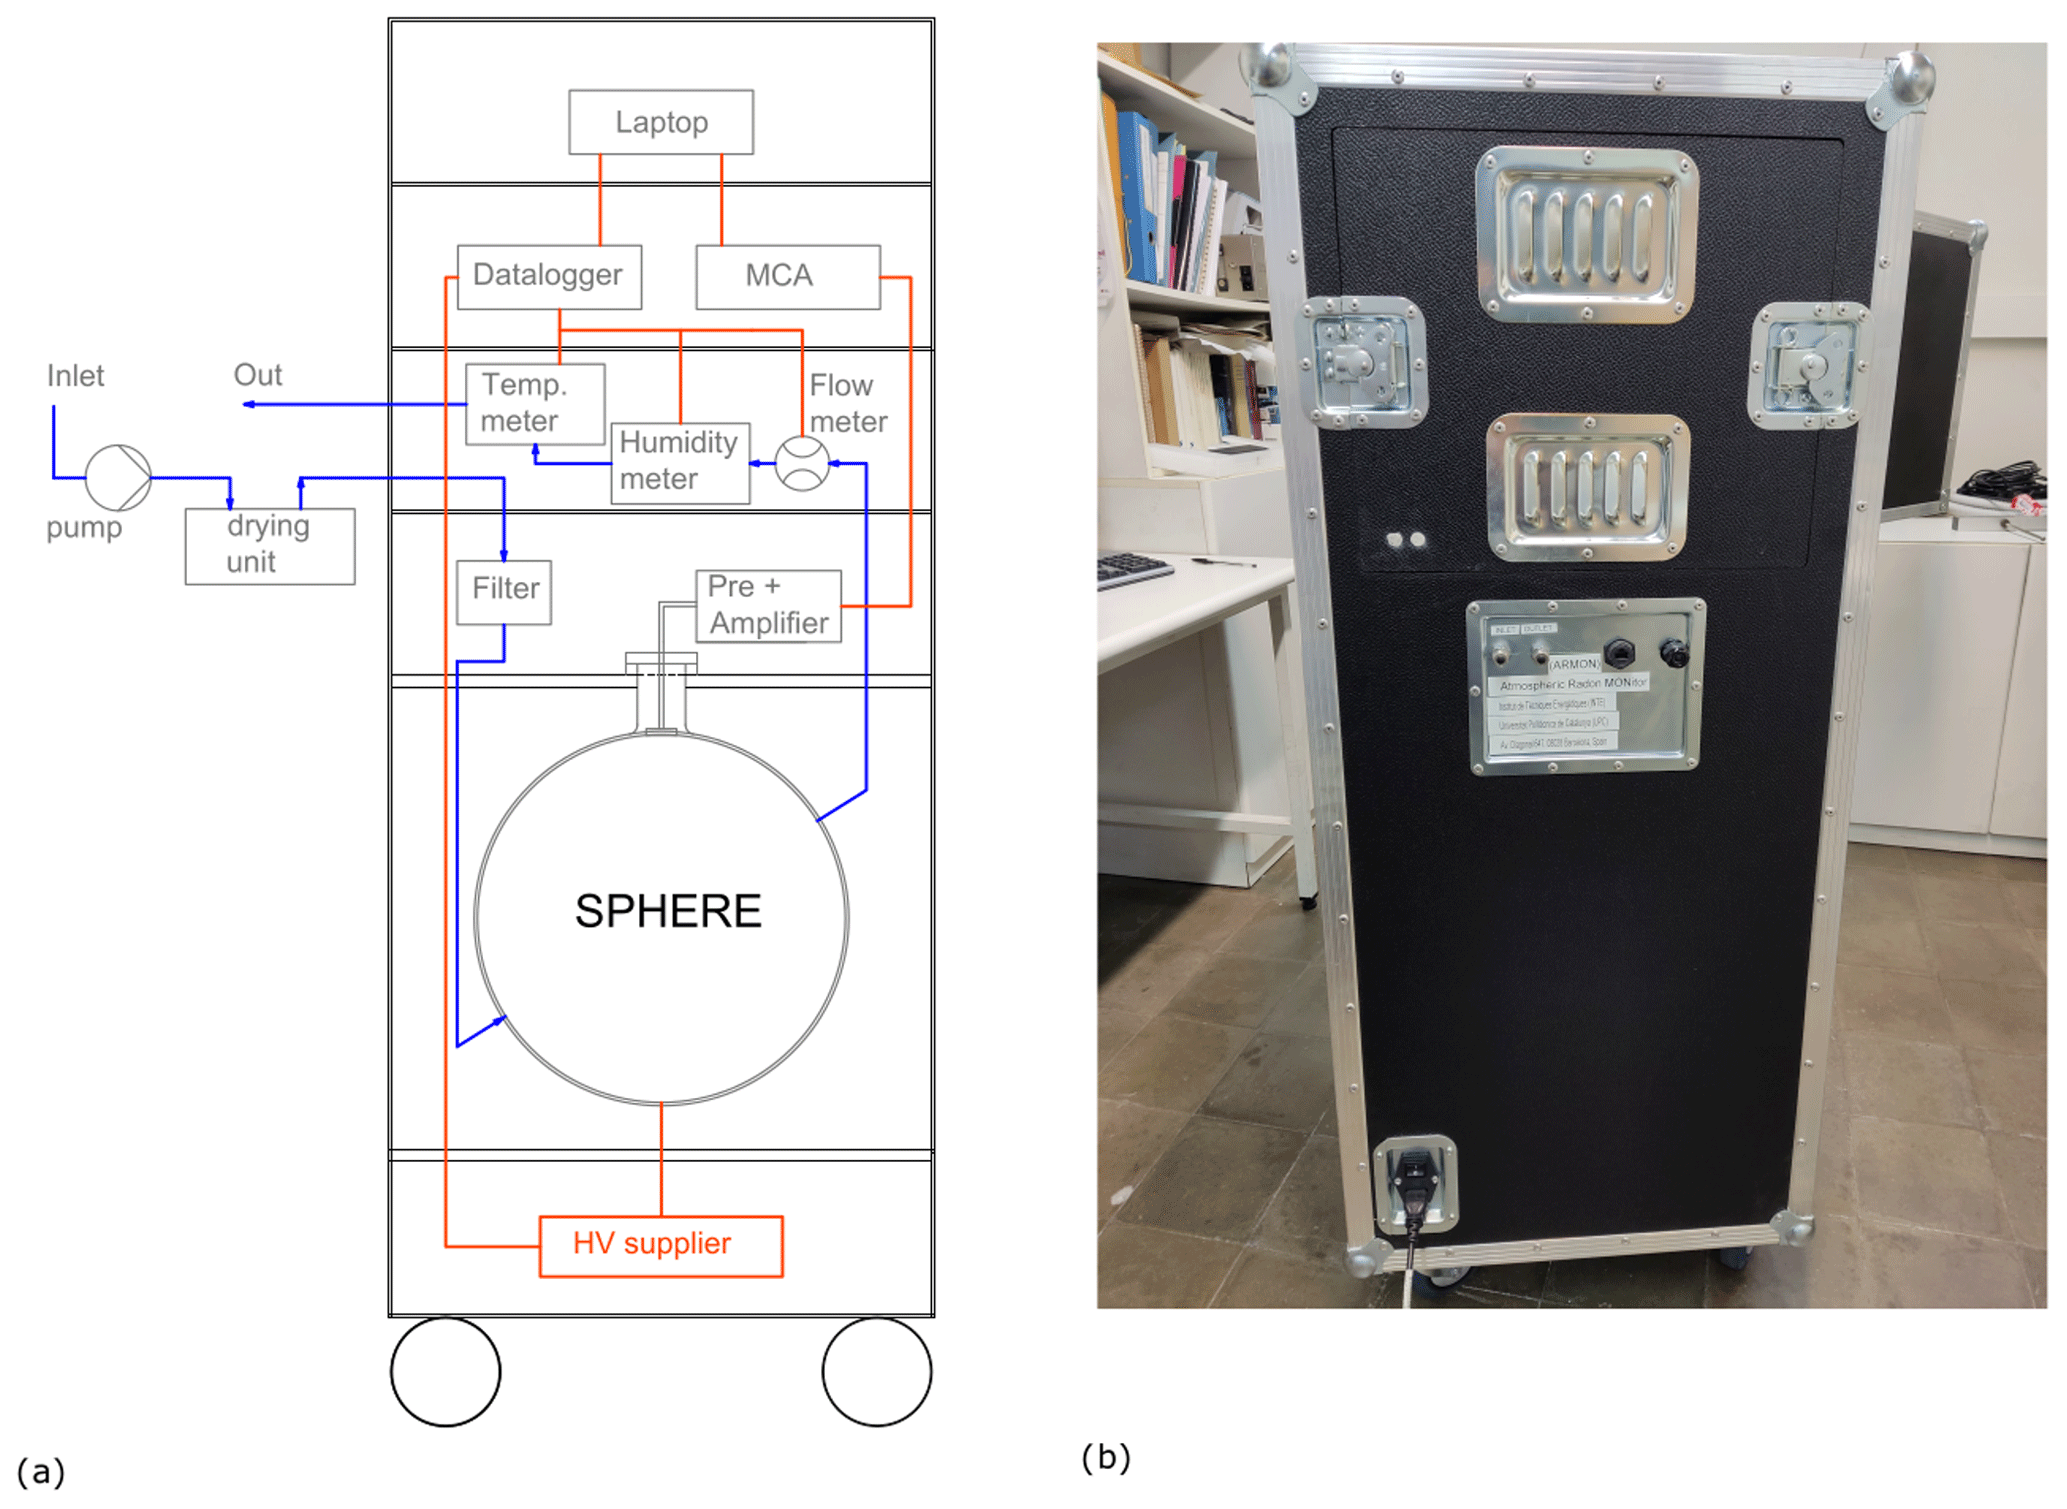
Figure 1(a) Schematic design of the ARMON v2 with its main hardware and hardware locations. (b) Image of the backside of the instrument.
A specific software named ARMON_LAB, built on LabVIEW® (Laboratory Virtual Instrument Engineering Workbench), was developed in order to monitor and to control all the parameters and variables of the instrument with the help of the Advantech® data logger. The software is installed in the ARMON v2 laptop to give the user full control of the monitor. The software allows the visualization in real time of the different sensors' outputs (flow, humidity, and temperature) and allows the control of the high voltage applied to the detection volume; 10 min averages of the different variables are automatically saved in daily files. In parallel, the spectra obtained by the MCA are automatically and regularly saved using the MAESTRO software script (ORTEC, 2012). After each measurement (usually working on an hourly basis, as per atmospheric-station requirements, but this can be easily modified), the ARMON_LAB software calls an R script which uses the information from the MAESTRO and the output from the environmental sensors to calculate the radon concentration. Real-time and past radon concentration data can be visualized within the ARMON_LAB interface. Two screenshots of the software are shown in the Appendix A (Fig. A3). The laptop can be connected to the internet, either by WiFi or by an ethernet wire, and, once installed, the instrument can be fully remotely controlled. A flow chart of the data of the ARMON v2 monitor is shown in the Appendix A (Fig. A4).
2.3 ARMON v2 detection efficiency
2.3.1 Theoretical approach
In order to calculate the radon concentration measured by the ARMON v2 with Eq. (1), the total efficiency (ε) of the instrument needs to be known with the lowest uncertainty achievable. First of all, the order of magnitude of this efficiency was evaluated using a simplified theoretical approach. The theoretical detection efficiency of the ARMON v2, εt, can mainly be factorized in two terms: (i) the geometric contribution (εg) due to the geometry of the detector surface and corona and (ii) the collection efficiency (εc) that depends on the efficiency of the collection of the 218Po+ on the detector active surface. The two contributions are expressed in Eq. (3):
The analysis of these two factors allowed us to optimize them during the building of the monitor. As commented on in Sect. 2.1, the maximum possible percentage of positively charged 218Po ions collected over the detector surface is 88 % (Hopke, 1989) (). However, the active surface and the non-active surface (the corona) of the PIPS detector are at the same potential (0 V); thus, when the ions reach the detector, they will be distributed over the entire surface, both on the active part and on the non-active one. Luckily, this distribution is not spatially homogenous, and it will depend on the symmetry and geometry of the generated EF, as will be shown here. Furthermore, of those particles collected at the active surface (pActive), only about 50 % will emit alpha particles on the plane, including the detector, and are therefore counted (pDetected) as those emitted in the opposite direction away from the detector cannot be counted. The number of ions that are formed per second in the sphere for a radon concentration in the air of 1 Bq m−3 is calculated by multiplying the formed ions by the sampled air volume V (0.02 m3) and then multiplying this by the percent of ions arriving on the detector surface and being emitted in the detector plane. The resulting εg (in s−1 per (Bq m−3)) is calculated according Eq. (4):
In order to understand and thus to maximize the collection of the polonium ions on the detector surface, the software COMSOL Multiphysics (COMSOL, 2015) was used to simulate the shape of the EF generated within the ARMON v2 detection volume when different kV values of electric potential (V) were applied to the sphere wall. The COMSOL is based on the solving of equations by finite-element analysis. The output of the COMSOL simulation, with the value of the simulated electrostatic field at each spatial grid of the ARMON v2 detection volume, was then used to calculate the drift velocity; the collection trajectories; and the travelling time of 10 000 polonium fictitious particles, which were initially randomly spaced within the volume. The instantaneous drift velocity for each particle i inside the detection volume depends on the mobility (μ) of the 218Po+ particles and the EF at its position, as reported in Eq. (5):
The mobility of the 218Po+ ions in air is known to be between 1 and 6 cm2 (V s)−1 (Nazaroff and Nero, 1988; Pugliese et al., 2000). A mobility of 3 cm2 (V s)−1 was recently reported by Symour (2017) for a similar study and was also used in the present study. Trajectories were calculated using time steps of 10 µs. The arriving positions of the simulated particles on the detector surface were used to estimate the percentage of polonium particles collected on the active area (2.99 cm2) and on the non-active area (3.44 cm2) of the detector.
The percentage of polonium ions arriving on the detector's surface was calculated taking into account both the radioactive decay ( 184.3 s) and the neutralization due to their recombination with OH− particles or small positive air ions (Dankelmann et al., 2001). In this regard, Hopke (1989) found that this recombination depends on the water volume concentration and that the interval time for 218Po recombination in an electrostatic chamber had a value of 0.879 [H2O], with [H2O] being the water vapour concentration in parts per million (ppm). From the calculated travelling time, equal to the ratio between the trajectory of each particle to reach the detector and its drift velocity, the effect of the recombination with water particles was calculated using Eq. (6):
where N refers to the particles that have not been recombined within the travelling time t, No is the initial number of particles, and 0.879 [H2O] is the interval time of recombination with H2O for 218Po+ particles. Finally, the theoretical collection efficiency εc will be calculated as .
The theoretical efficiency εt obtained from Eq. (3) has been calculated under the hypothesis of ideal conditions. However, the real geometry of the generated EF may not be so regular due to (i) the difficulty of positioning the PIPS surface tangentially to the sphere, (ii) the inhomogeneity present in the layer of the cover conductive material of the internal wall of the sphere, (iii) the uncertainty in the determination of the potential V applied to the sphere, and (iv) the spherical shape and exact measure of the detection volume. Thus, the real efficiency of the monitor could be lower than εt, and it also needs to be evaluated experimentally.
2.3.2 Experimental approach
The experimental detection efficiency of the ARMON v2 was obtained by comparing the detected net counts of 218Po measured with the instrument with a reference radon activity concentration Cref measured with a secondary standard reference instrument, as will be explained in the following.
The ARMON v2 was calibrated at the INTE-UPC STAR (System for Test Atmospheres with Radon) (Vargas et al., 2004) in October 2021. The INTE-UPC STAR is a chamber with a volume of 20 m3 which allows us to set up and continuously measure the radon activity concentration (range of 200 Bq m−3 to 30 kBq m−3), the temperature (range of 10–40 °C), and the relative humidity (range of 15 %–95 %) (Vargas et al., 2004). The radon source inside the chamber consists of an enclosed Pylon Electronics passive source containing 2100 kBq of 226Ra. Stable radon concentrations inside the chamber are reached by controlling the air flow through the enclosed source and the ventilation rate of the chamber. The second standard reference instrument of this facility is an ATMOS monitor (Radonova), serial no. 220030. The traceability of the measured magnitude (in Bq m−3) is referred to using the Swedish Radiation Safety Authority (calibration certificate no. SSM2021-2989-4) with an expanded uncertainty (k= 2) of 6.7 % for 1500 Bq m−3.
During the experiments, the ARMON v2 detection efficiency was estimated in a range of radon concentrations between 0.5 and 6.2 kBq m−3. The ARMON v2 and the reference monitor were installed outside the STAR in parallel configuration. For each instrument, air coming from the radon chamber passed through monitor and then returned to the chamber. A silica gel dryer was installed before the air entered the ARMON v2 in order to reduce the water concentration of the sampled air. The integration time of the ARMON v2 spectra was chosen to be 1 h, and hourly means from the ATMOS monitor were selected from the 10 min default integration time. Calibration experiments lasted 3 weeks. The average H2O concentration inside the ARMON v2's detection volume during the efficiency experiments was about 300 ppmv. The influence of the water vapour concentration on the efficiency was also evaluated at different radon concentrations within the range (635–5900) Bq m−3 and within the range (100–3000) ppmv H2O using different levels of saturated silica gel as the dryer.
2.4 Uncertainty analysis and characteristic limits of the ARMON v2
The radon activity concentration with the ARMON v2 is calculated, for each acquired spectrum, using Eq. (1) (in units of Bq m−3). In order to have comparable results with radon values from other stations or monitors, the concentration can be multiplied by a standard temperature and pressure (STP) factor to standardize the concentration obtained to a referenced value of the temperature and pressure of air. The STP factor, assuming an ideal gas behaviour, can be calculated by Eq. (7):
where CT and CP are the corrections for temperature and pressure, respectively; with T and Tref are the sampling temperature and the reference temperature, respectively (in K); and P and Pref are the sampling pressure and the reference pressure, respectively.
Therefore, Eq. (1) can be expanded, taking into account both the corrected value of the monitor detection efficiency under different humidity conditions as expressed in Eq. (2) and the STP correction from Eq. (6), in Eq. (8):
The uncertainty for the radon concentration measurement will be calculated, in agreement with the guide to the expression of uncertainty in the measurements (BIPM et al., 2008), using Eq. (9):
where xi refers to the different variables from Eq. (8) applied for a consideration of the propagation of the uncertainty.
Resolving the partial differential equations of Eq. (9) and Eq. (8), the resulting equation is given in Eq. (10):
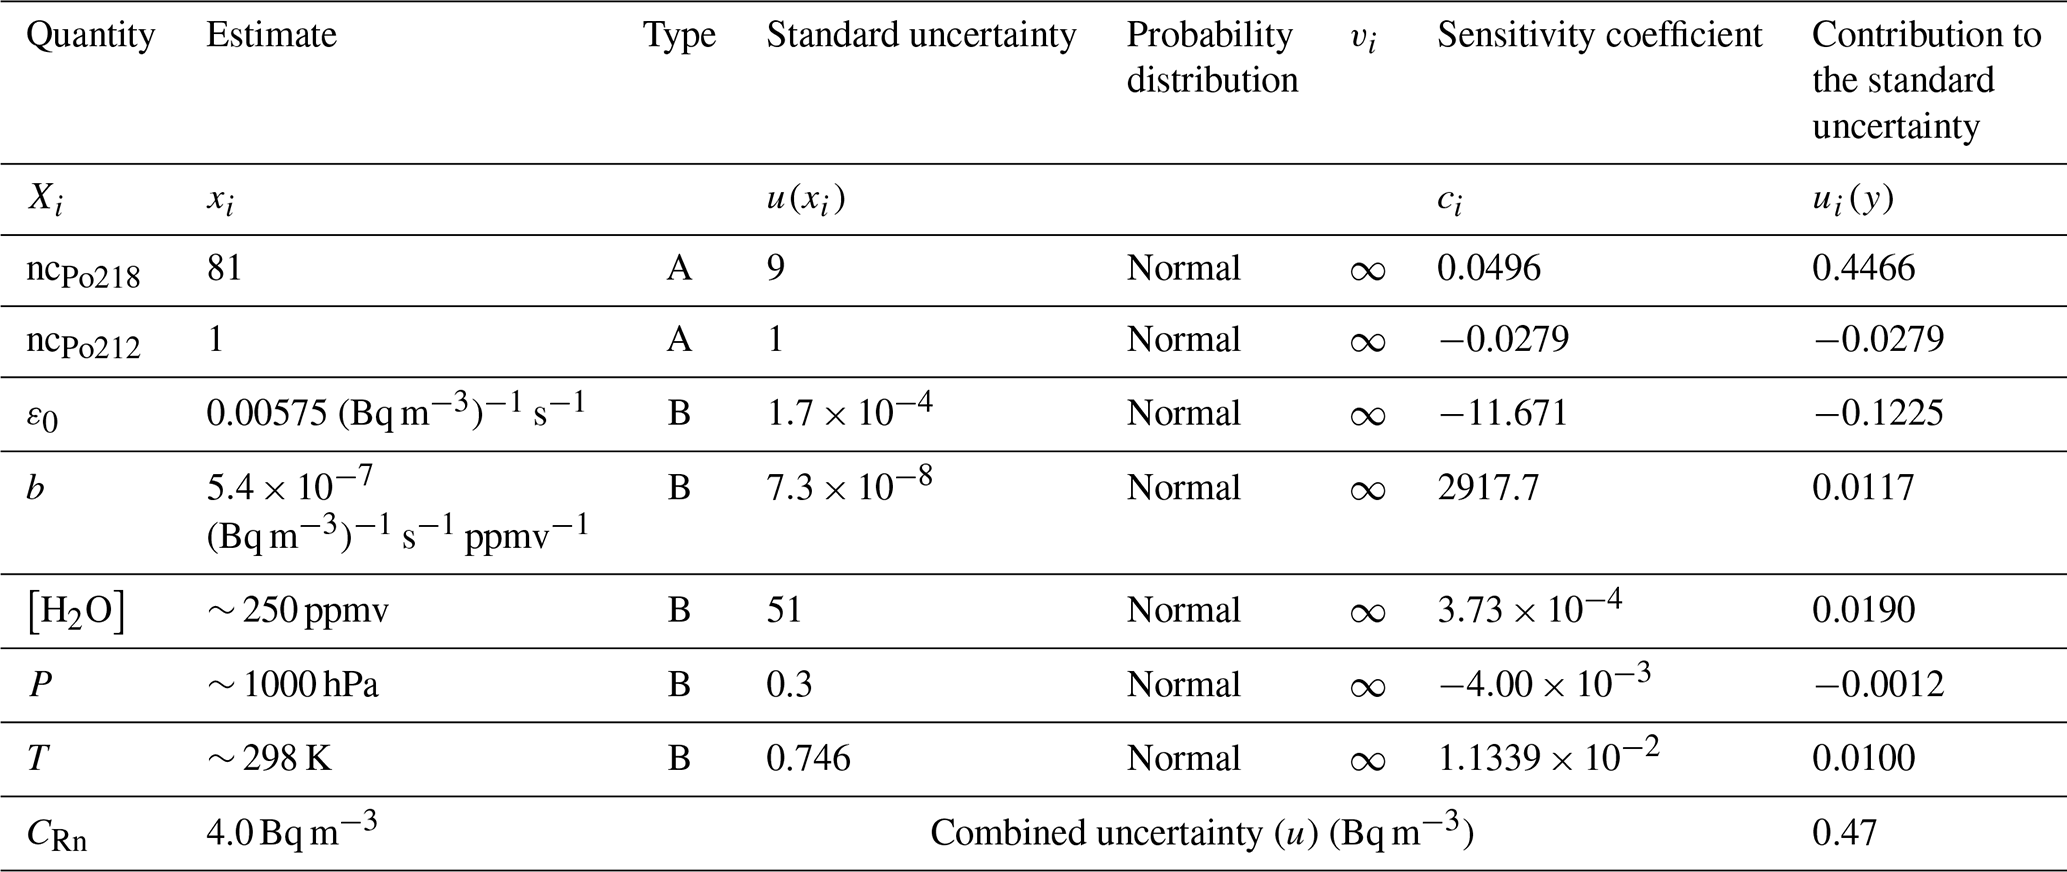
Table 1 presents the different contributions to the total uncertainty of each radon measurement performed with the ARMON v2. In this example, the average radon concentration, water vapour concentration, hourly 212Po count, and the atmospheric pressure and temperature from a 6-month intercomparison within the traceRadon project at Saclay Atmospheric Station (SAC) were selected as reference values to perform an estimation. The integration time for radon concentration measurements was 1 h.
Table 1Contributions of the different variables and/or parameters to the total uncertainty of a typical radon concentration measurement performed with the ARMON v2 at an atmospheric station.
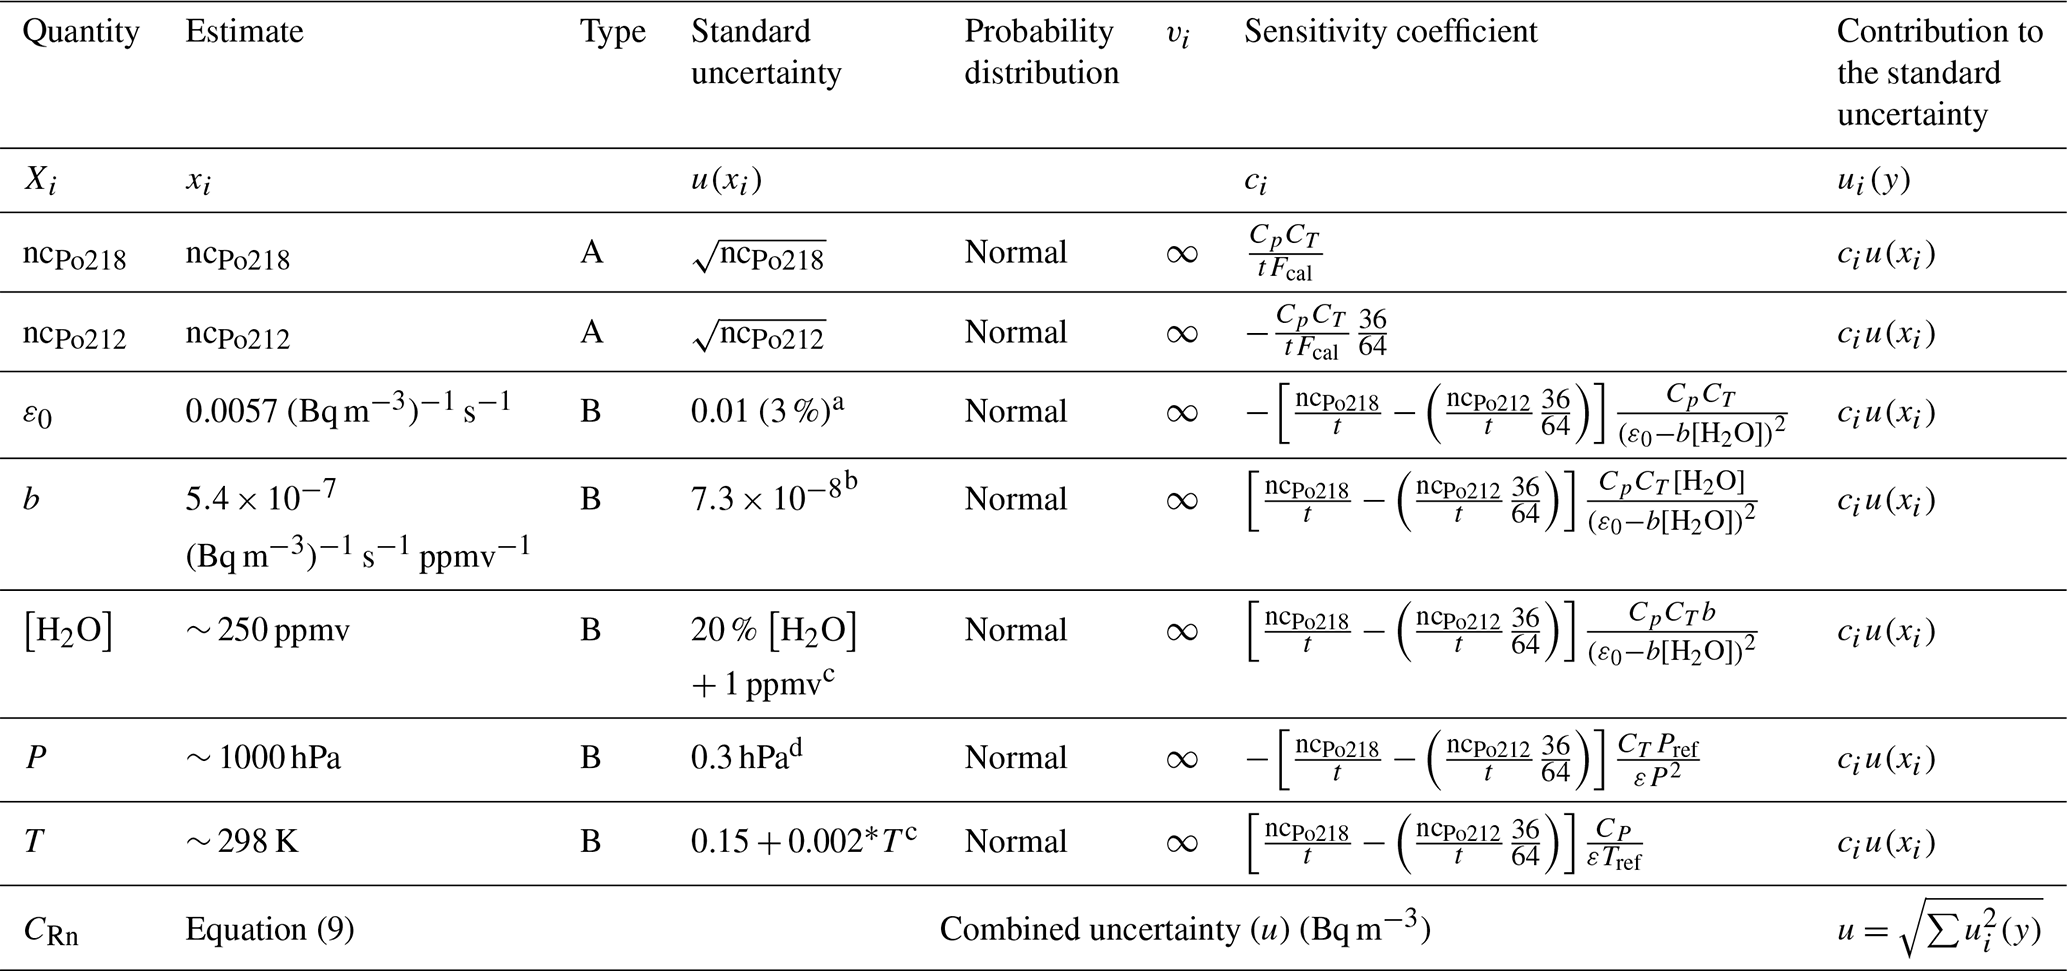
a Uncertainty from the calibration at INTE radon chamber. b Residual–standard error from correlation linear model according to calibration at INTE radon chamber. c From manufacturer's documentation. d From ICOS Atmosphere Station specification, v2.0 (https://box.lsce.ipsl.fr/index.php/s/uvnKhrEinB2Adw9?path=/Specifications, last access: 1 March 2024.)
Due to its long half-life, 210Po activity will grow on the detector's surface. However, as the ARMON v2 is able to separate the energy of the alpha particles emitted by the different polonium isotopes, even large activities of e 210Po will not affect the counting of 218Po. Interferences in the 218Po counts are only due to 212Bi, as was explained in Sect. 2.1. Therefore, the typical limits (threshold limit and detection limit) will depend on the presence of thoron within the sampled air.
According to the ISO 11929-4, the decision threshold of the activity (a∗) can be calculated using Eq. (11):
where 1.645, is the standard uncertainty of the background, w is the calibration factor (), n0 is the number of counts of the background effect, and t0 and tg are the count times of the measurement and the background.
The detection limit, according to the same standard, can be calculated, with a 95 % confidence, as in Eq. (12):
with urel(w) being the relative standard uncertainty of the estimated efficiency ε.
2.5 Evaluation of the linearity of the ARMON v2 detection efficiency for low radon concentrations
The linearity of the detection efficiency of the ARMON v2 was checked thanks to the availability of a new methodology, developed within the WP1 of the traceRadon project, to create a low-radon reference atmosphere of a few becquerels per cubic metre (Bq m−3) using low-radon-emanation sources developed by the radioactivity group of the PTB (Röttger et al., 2023). The ARMON v2 was actually exposed within the climatic chamber of the PTB (see Fig. B1 in Appendix B) under radon levels of a few tens of becquerels per cubic metre (Bq m−3) and over the course of several months.
The PTB chamber has a nominal volume of V = (21.035 ± 0.030) m3, which makes a calibration of larger devices inside the chamber possible. This chamber is equipped with a walkable air lock system and can be operated in a temperature range between −20 and +40 °C, as well as between 5 % and 95 % relative humidity. The pressure inside the chamber is recorded. The walls of the chamber consist of 100 mm polyurethane foam, clad inside and outside with stainless steel 0.6 mm in thickness. Due to this construction, the heat transmission coefficient is smaller than k = 0.2 W m−2 K−1, which provides very stable calibration conditions. The inner wall is polished and connected to the ground, thus providing a homogeneous radon progeny field (Honig et al., 1998). Within the chamber, the traceable 222Rn activity concentration is established either via a 222Rn gas standard (Dersch and Schötzig, 1998) or via primary 226Ra emanation sources (Mertes et al., 2022). Due to the low activity concentration values intended during this calibration (5 to 20 Bq m−3), the emanation source technique was used (Röttger et al., 2023). A 222Rn-free background was achieved, applying aged, synthetic, compressed air to the chamber and flushing all remainders of 222Rn from it.
Extensive experiments over a period of 4 months with varying activity concentrations between (7.8 ± 0.4) and (45.4 ± 0.8) Bq m−3 have been carried out. Even though dry air had been applied through the background determination, additional silica gel and a thoron delay volume were installed at the inlet of the ARMON v2 to prevent thoron progeny events and humidity during the experiment. All installations and detectors were completely installed inside the climate chamber, which was operated in a closed mode to prevent any exchange with the surrounding low-activity-concentration lab air. All results are consistent with this assumption.
3.1 Theoretical efficiency
The EF and its force lines inside the sphere, when V = 10 kV was applied, were modelled with the COMSOL software and are shown in Fig. 2a. The simulation of the tracks of 1×10⁴ randomly spaced particles in a 3D sphere using this EF (Fig. 2b, c and d) shows that 98 % of the 218Po+ particles generated inside the spherical detection volume are collected inside the active area of the detector if we assume no interactions with other particles, as well as no decay or neutralization. Applying Eq. (4) and assuming that 0.88, pActive= 0.98, and pDetected = 0.5, the maximum efficiency of our geometry (εg – in terms of counts detected per disintegration inside the detection volume) will be 43 %. If we express the efficiency in terms of count rate (s−1) per becquerel per cubic metre (Bq m−3), assuming a detection volume of 0.02 m−3, the εg efficiency of our system is 0.0086 (Bq m−3)−1 s−1.
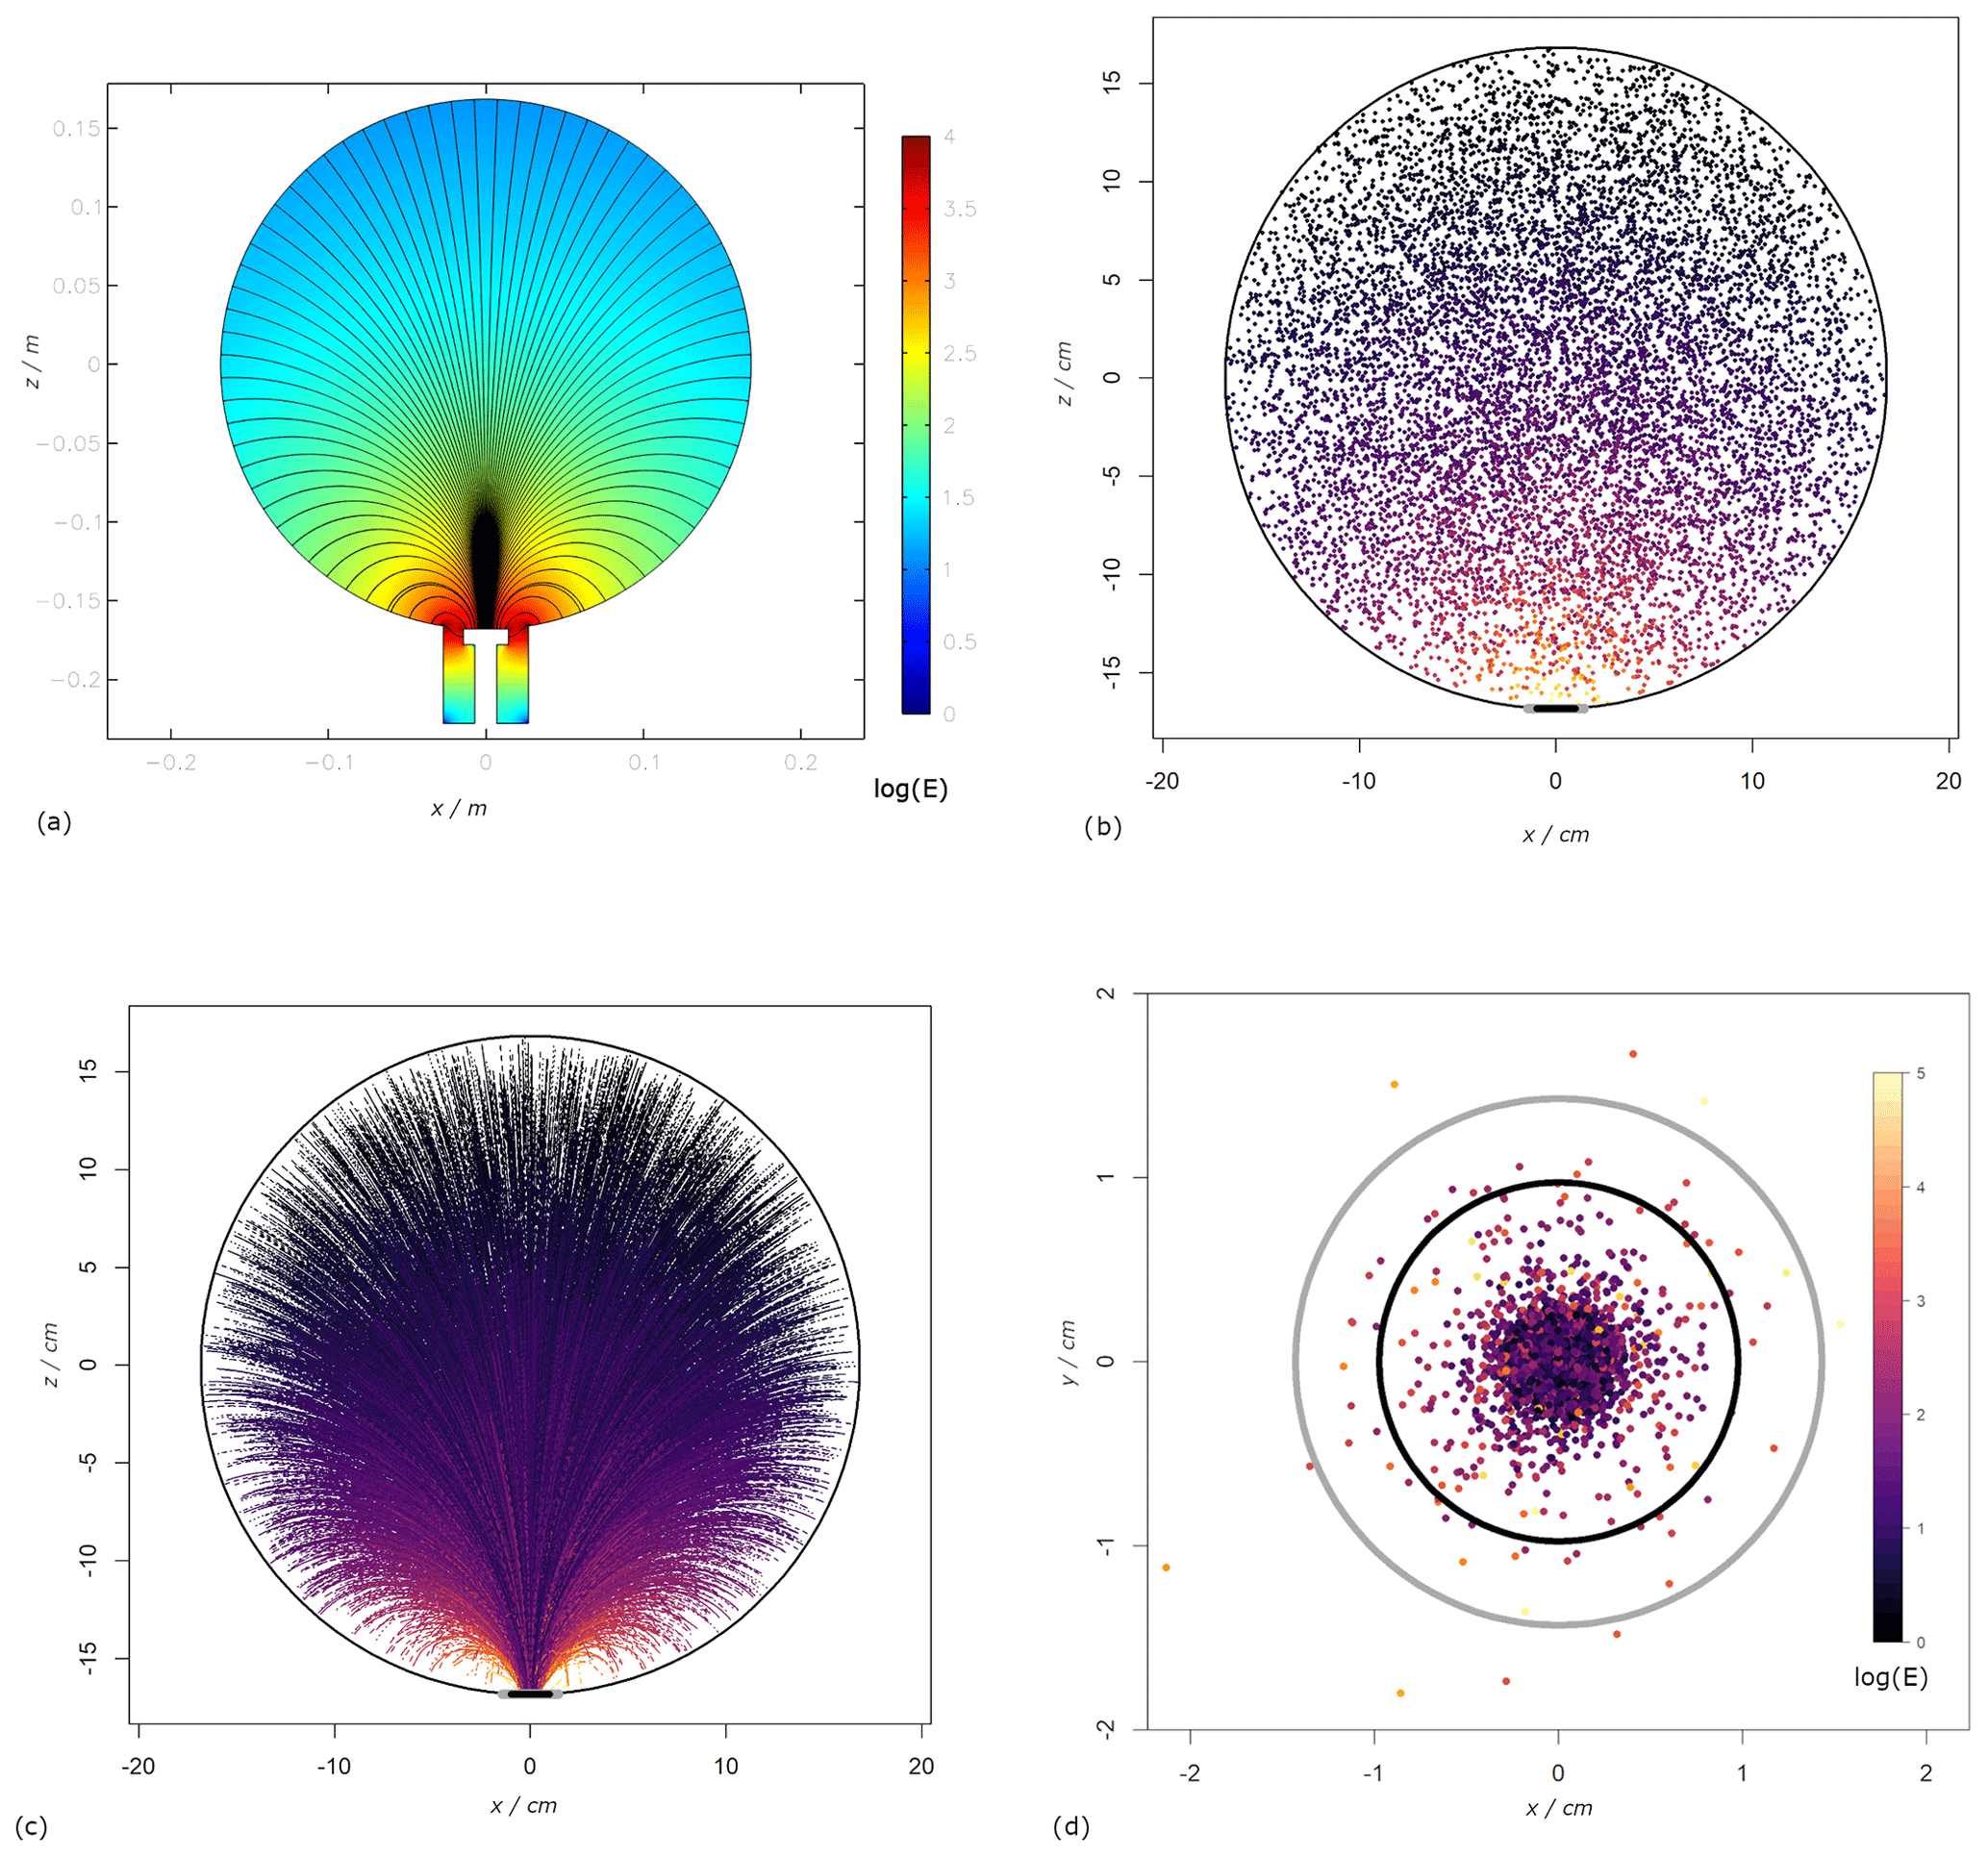
Figure 2(a) Simulation of the electrostatic field generated within the ARMON v2 detection volume with the application of 10 kV voltage; black lines represent the EF direction. (b) Initial position inside the detection volume of the simulated 218Po ions (105 fictitious particles). (c) Trajectories of the simulated particles inside the sphere when the 10 kV voltage is applied between the sphere walls and the PIPS detector. (d) Distribution of the simulated deposition of the charged particles at the detector surface. The inner black circle denotes the active area. The colour scale for Fig. 2b, c, and d is the natural logarithm of the EF in log(V cm−1), and it is shown in Fig. 2d.
From the simulation of the trajectories of the 1×10⁴ polonium ions, the estimated travelling time of the particles in order to reach the detector surface will vary between 0 and s, depending on the particles' distances from the detector, with a mean value of s. During these travelling times, the probability of 218Po decay events will be completely negligible, while the effect of the recombination with OH− particles will cause a loss of particles from 0 % to 25 % in an interval between 0 and 2000 ppmv. Consequently, the collection efficiency εc will vary between 100 % at 0 ppmv and 75 % at 2000 ppmv, being 87.6 % at the nominal humidity of 400 ppmv.
Multiplying both geometrical and collection efficiencies, the maximum theoretical efficiency of our system, when no water is present, will be ε0 = 0.0086 (Bq m−3)−1 s−1, while the theoretical ε when working at 400 and 2000 ppmv of H2O will be 0.0075 and 0.0065 (Bq m−3)−1 s−1, respectively. Figure 3 shows the relationship between the estimated theoretical detection efficiency of the ARMON v2 in relation to the water content of the sampled air (blue line).
It should be take into account that, during the simulations, some hypotheses were proposed which may not be entirely correct: (i) no other recombination processes of the 218Po particles were considered; (ii) a regular spherical potential surface was considered to generate an EF with spherical symmetry, although the real EF is expected to have some irregularities due to the inhomogeneous distribution of the potential over the sphere wall due to, among others, the presence of inlet and outlet tubbing connections; (iii) no air diffusion effects were considered; and (iv) it has been observed in the results of the COMSOL simulations that a small vertical shift in the detector position could change the percentage of particles collected on the active area of the detector surface. All these previous observations lead to the conclusion that the theoretical efficiency obtained for the ARMON v2 should only be considered to be the ideal highest value and should not treated as nominal efficiency of the instrument.
3.2 INTE calibration results
Figure 3 shows the results of the water correction experiments carried out at the INTE-UPC and PTB chambers. A linear relationship between the detection efficiency of the instrument and the water vapour concentration is observed within a range of 150–2000 ppmv. This relationship was found to be independent of the radon concentration in a range of 600–5900 Bq m−3. When the water vapour concentration of the sampled air is above 2000 ppmv, the relation loses this linearity, and, for this reason, it is worthwhile not measuring over this vapour concentration. In the range of 150–2000 ppmv, the detection efficiency of the ARMON v2 may be corrected using Eq. (2), with b being equal to (Bq m−3)−1 s−1 ppmv−1 and with an uncertainty (RSE) of (Bq m−3)−1 s−1 ppmv−1.
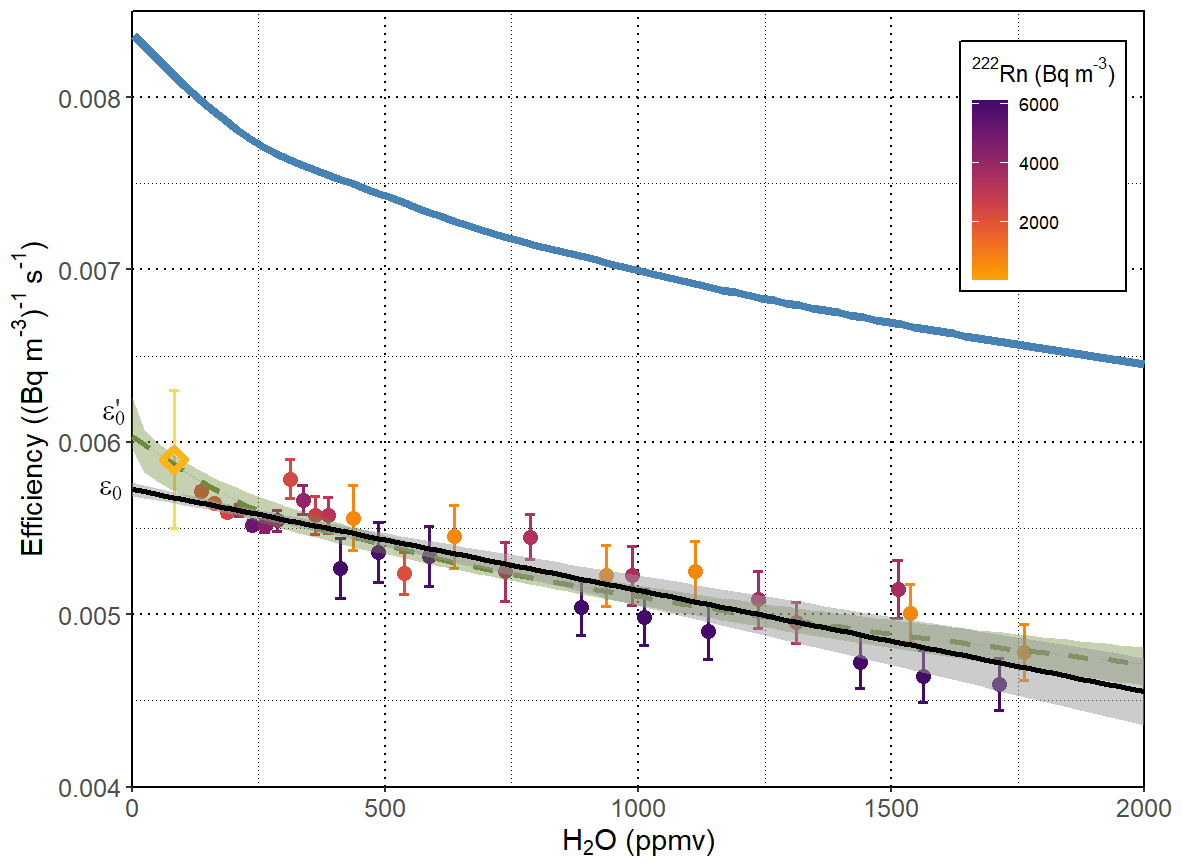
Figure 3Dependence of the efficiency of the ARMON v2 monitor on the water vapour concentration (in ppmv H2O) at the detection volume. The coloured points are the efficiency – and its uncertainty – of the hourly measurements for all the calibrations at INTE-UPC, averaged in intervals of 10 ppmv of H2O. The black line is the linear fit of the observational points, with the 95 % confidence interval represented by the grey-shaded zone. The dotted green curve is the exponential fit of the observational points, with the 95 % confidence interval represented by the green-shaded zone. The rhombus represents the efficiency of the ARMON at the PTB with its uncertainty. The blue curve represents the theoretical efficiency simulation assuming a mobility of 3 cm2 V s−1. ε0 is the y interception of the linear fit e, and is the y interception o the exponential fit.
Due to the increment observed in the detection efficiency for values of water vapour concentration lower than 150 ppmv, an exponential correction fit was also applied to the data following Eq. (13):
The exponential curve (dashed green line) is also represented in Fig. 3 and may be more appropriate for very low water concentrations, which are usually uncommon for sampled air at atmospheric stations. For this reason, the use of the linear fit is proposed here.
Once we determined the water correction coefficient b, the efficiency of the monitor ε0 was calculated within the radon concentration range of 500–6000 Bq m−3. From the results obtained (Fig. 4), a high linearity (r2= 0.999) in the regression between 218Po counts against the 222Rn concentration measured with the ATMOS monitor was observed. Within the calibration range (300–6200 Bq m−3), and taking into consideration the ATMOS uncertainty, the ε0 of the ARMON v2 calculated with the ATMOS monitor at the INTE chamber was in the range of (0.0057 ± 0.0002) Bq m−3 s−1. If an exponential fit had been applied, the value of obtained would have been (0.0061 ± 0.0002) Bq m−3 s−1.
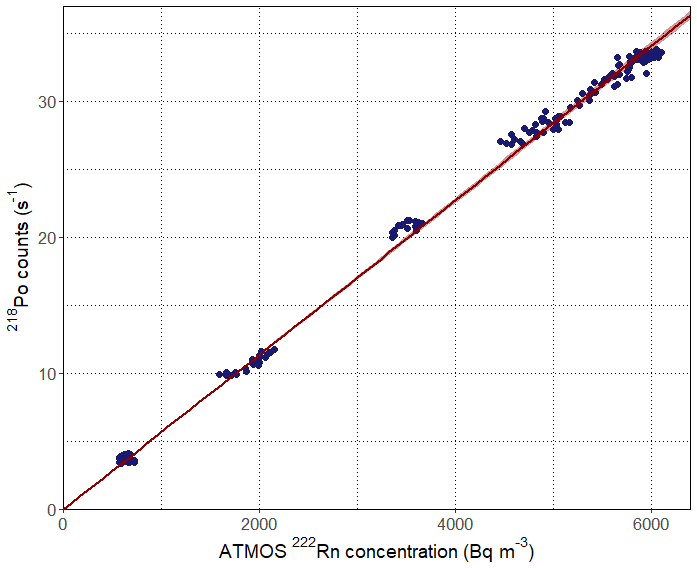
Figure 4Calibration of the efficiency of the ARMON v2 monitor (218Po counts against 222Rn concentration) within the range 0–6000 Bq m−3. The 222Rn concentration measured with an ATMOS monitor at the INTE-UPC radon chamber (hourly means). The 218Po counts (s−1) from hourly spectra. Red line is the regression line (r2= 0.999).
It has to be underlined that the experimentally calculated efficiency of the ARMON v2 in the range between 300 and 2000 ppmv of [H2O] is 24 % lower than the theoretical one (assuming a mobility of 3 cm2 V s−1). Although, on the same order of magnitude, this difference could be explained, as described in Sect. 3.1, by a multitude of variables, which could cause the 218Po ions not to be collected at the detector surface.
3.3 Uncertainty, background and typical limits
The total uncertainty of the radon measurements performed with the ARMON v2 is calculated with Eq. (9). As an example, here, it has been estimated for a typical atmospheric hourly radon measurement performed at the SAC atmospheric site (CRn = 4 Bq m−3, T = 298 K, P = 1000 hPa, [H2O] = 250 ppmv, and ncPo212 = 1). The uncertainty values for all parameters and their sensitivity coefficients are shown in Table 2. The combined uncertainty obtained was 0.46 Bq m−3, which amounts to 11 % of the absolute value of the measurement. The most influential contribution in the calculation of the total uncertainty of the measurement is the uncertainty of the total net 218Po counts, followed by the uncertainty of the detection efficiency and the uncertainty of the water vapour correction factor. As for the STP correction, the values of T and P uncertainties have been taken from the sensor uncertainties. A higher uncertainty could be due to the distance between the sensor position and the detection volume of the instrument. However, calculations show that these uncertainties will be negligible. Let the reader consider that an increase of the temperature uncertainty of 2° will suppose an increase in the uncertainty of Bq m−3, and an increase of 5 hPa in the uncertainty of pressure will only increase the total uncertainty by Bq m−3.
Table 2Calculated contributions of the different variables and/or parameters to the total uncertainty of a typical radon concentration measurement performed with the ARMON v2 at an atmospheric station.
Calculating the variability for a range of humidity (0–2000 ppmv), the total uncertainty of the measure has been plotted as a function of radon concentration (Fig. 5a). In the range of 0–400 ppmv, the total uncertainty is below 10 % for radon concentrations greater than 5 Bq m−3. For humidity greater than 1000 ppmv, the uncertainty increases due to the decrease in the detection efficiency.
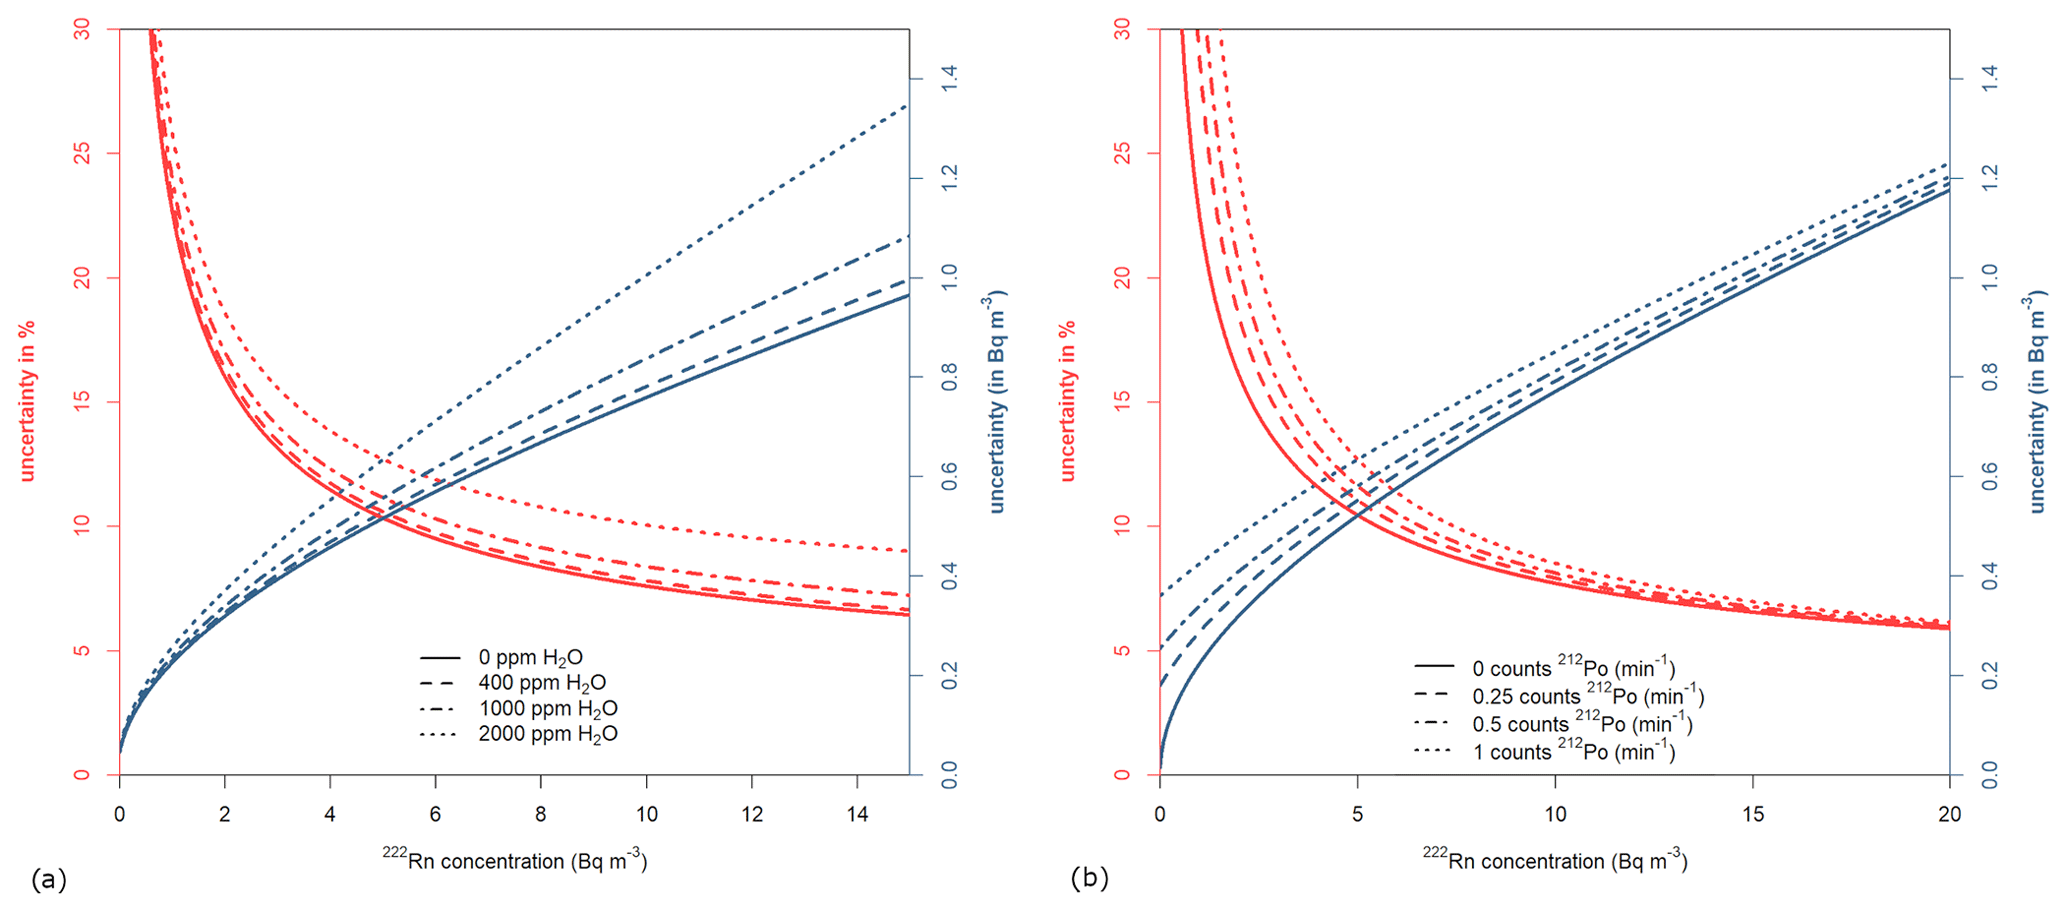
Figure 5(a) Absolute (blue) and relative (red) uncertainty as a function of 222Rn activity concentration at different water vapour concentrations. (b) Absolute (blue) and relative (red) uncertainty as a function of 222Rn activity concentration at different 212Po (thoron decay) concentrations.
In addition, given a typical water content of 250 ppmv H2O in sampled air, the total uncertainty of the measurement has also been calculated, taking into account different possible levels of thoron gas in the sample (Fig. 5b). It can be observed that, when the radon concentration increases to tens of becquerels per cubic metre (Bq m−3), the thoron concentration present in the sampled air has almost no effect on the uncertainty of the measurement. However, at low radon concentrations below 5 Bq m−3, the thoron concentration can be an important source of uncertainty. This problem can be easily avoided using a thoron decay volume before the ARMON v2 detection volume. Within this scenario, the uncertainties at 0.6, 1, 2, 5, 10, and 100 Bq m−3 are 29 %, 22 %, 16 %, 10 %, 7.7 % and 5.1 %, respectively.
As an piece of additional information, it may be of interest to explain that, during the INTE-UPC experiments, it was discovered that the silica gel material may contain thorium material, which is a thoron source. Actually, hourly spectra showed up to 1 count per minute (min−1) of 212Po, which means 0.56 counts min−1 of 212Bi α decays to 208Tl, and this implies an increase greater than 50 % in the uncertainty for radon concentrations below 5 Bq m−3. For this reason, and although the content of thorium material within commercial silica gel has not yet been quantitatively estimated, the authors highly recommend not using this dryer for radon measurements or using a delay volume of at least 10 L between the silica gel dryer and the selected radon instrument. Generally, the authors suggest the use of other drying systems, such as Nafion tubes or cold traps.
With regard to the detection limit and the decision threshold of the ARMON v2, these previous values are only dependent on the presence of thoron concentrations within the detection volume. When no thoron counts are present (e.g. when using a buffer volume before the ARMON v2), the decision threshold is 0.045 Bq m−3, corresponding to 1 count per hour, and the detection limit is a#= 0.132 Bq m−3, with an uncertainty of 0.08 Bq m−3. At a typical thoron concentration of 0.017 min−1 at atmospheric sites (100 m tall towers), the detection limit and the decision threshold are 0.3 and 0.08 Bq m−3, respectively. The change in the characteristic limits as a function of the detected 212Po count rate (in min−1) is shown in Fig. 6.
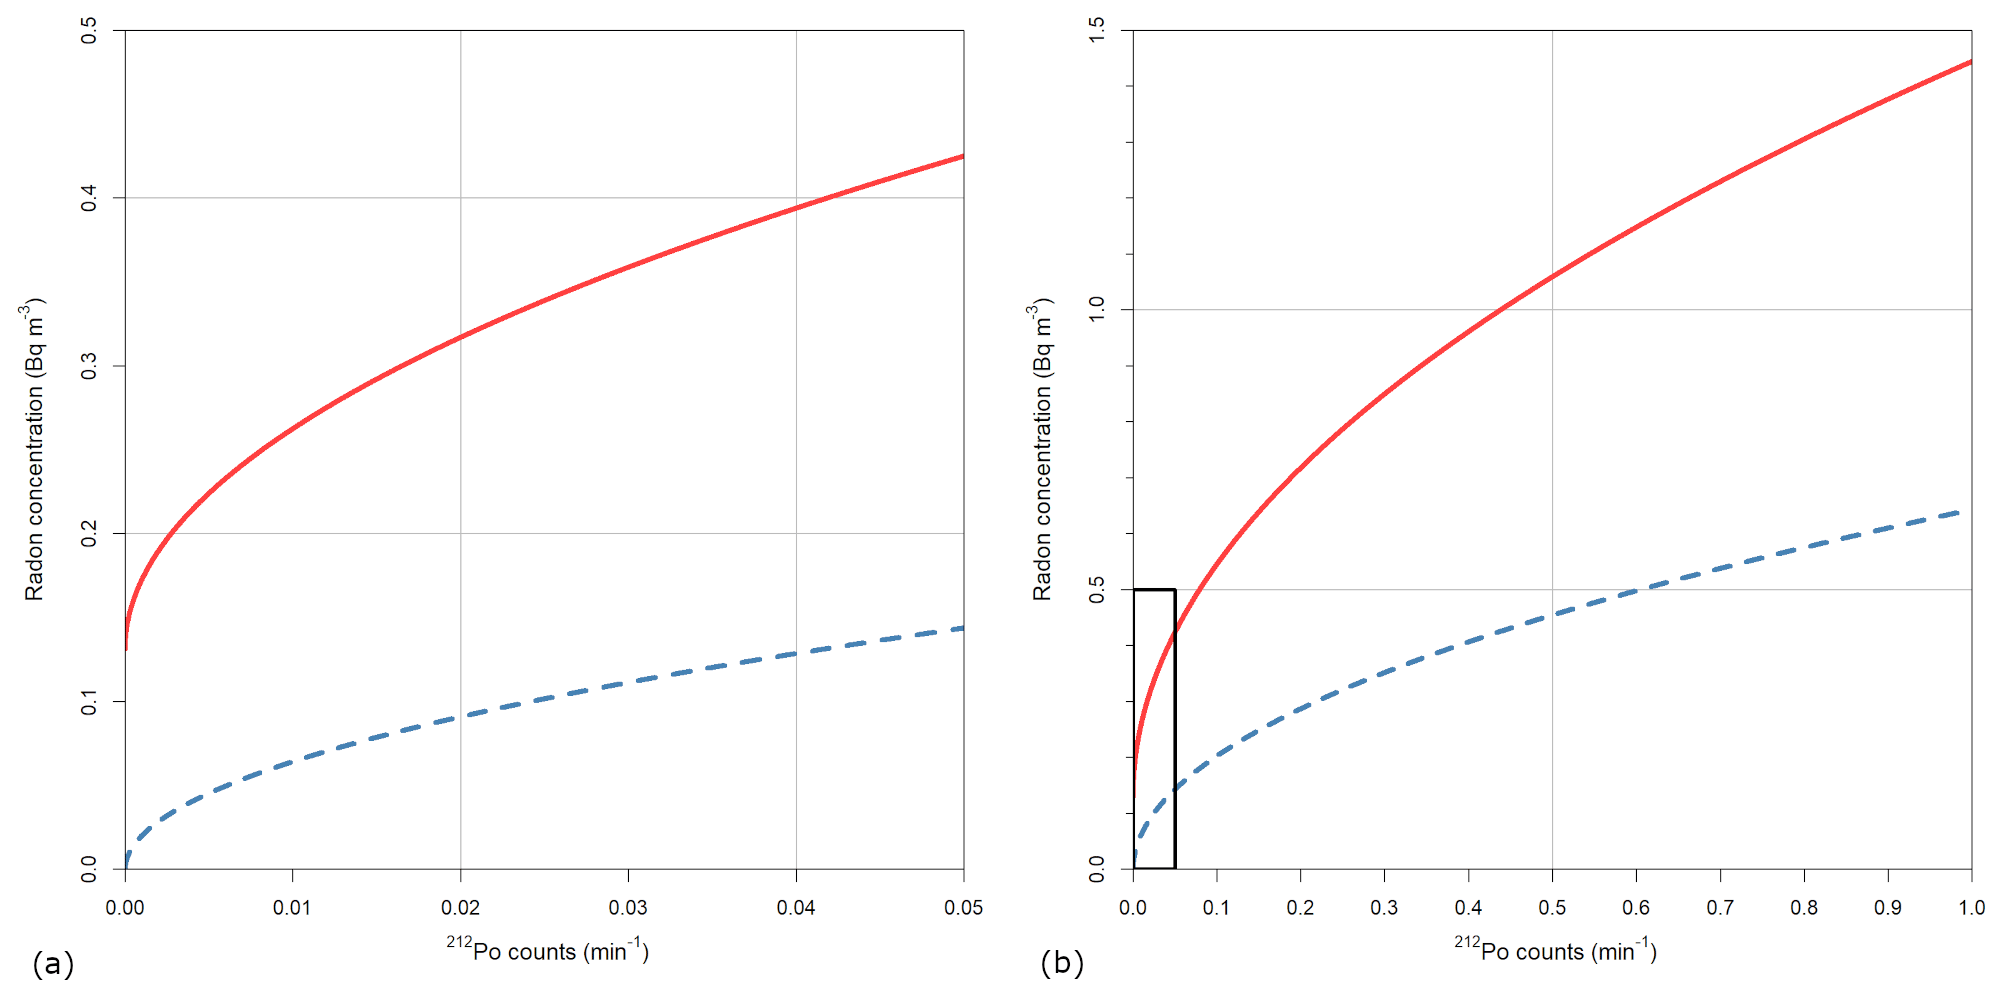
Figure 6Radon activity concentration detection limit (red straight) and decision threshold (dashed blue) of the ARMON v2 monitor from (a) 0 to 0.05 counts min−1 and (b) 0 to 1 count min−1 of detected 212Po.
3.4 PTB results
Figure 7 shows a summary of the results of the values of the detection efficiency of the ARMON v2 as obtained by INTE-UPC (orange dots) and the PTB (blue dots) experiments. Both experiments, carried out under different conditions in terms of radon concentrations, show a linearity in the counts detected by the instrument and in the radon concentrations to be measured (Fig. 7a). In total, five calibration points with three different emanation sources were realized at the PTB (see Fig. B2 in Appendix B).
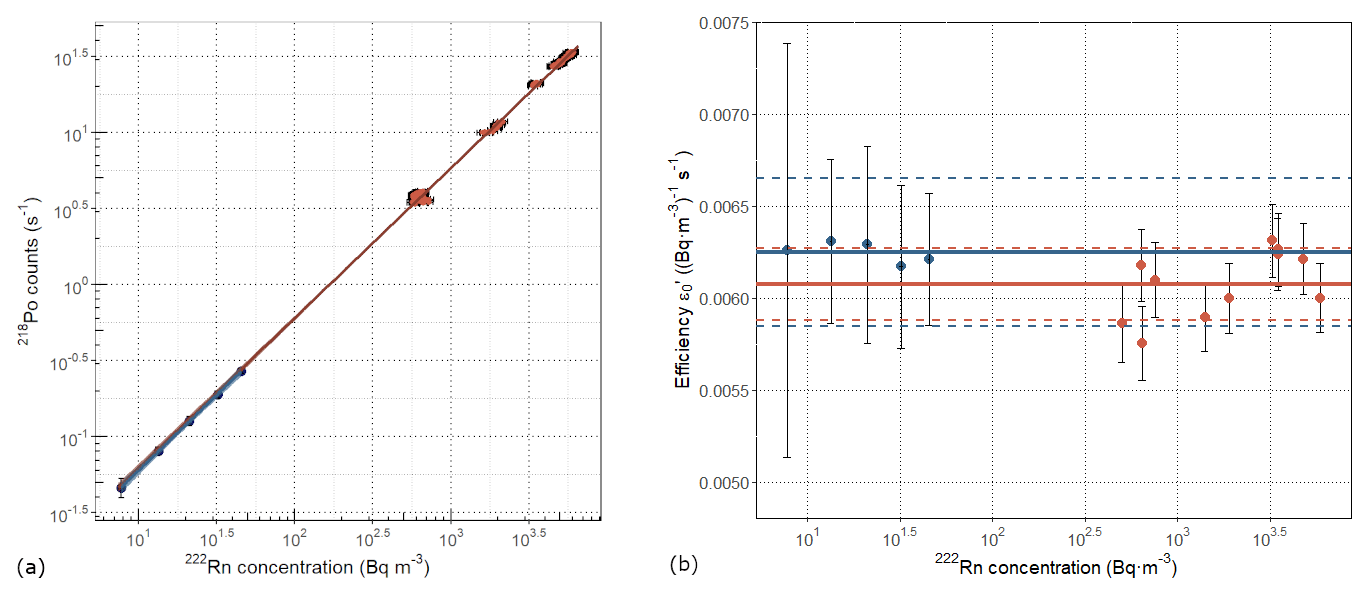
Figure 7(a) Counts per second versus radon concentration (dots) and regression lines for the detection efficiency obtained during INTE-UPC experiments (orange) and PTB experiments (blue), with the 99 % confidence level shadowed. (b) Dots: detection efficiency () of the ARMON v2 and its uncertainty versus radon concentration for the different exposures at the PTB (blue) and INTE-UPC (orange). Solid lines are the mean of the efficiency values obtained at the PTB (blue) and INTE (orange), with its uncertainty at k= 1 (dashed lines). The x axis for both figures and the y axis for Fig. 7a are in logarithmic scale.
During the ARMON v2 exposures at the PTB climate chamber, the sampled air had an average water content of 83 ± 21 ppmv for the whole measurement campaign (Fig. 3, gold rhombus); thus, the estimated detection efficiency was corrected by applying the exponential fit (Eq. 13).
Since five calibration points with three different emanation sources were realized (see Fig. B2 in Appendix B) and because the characterization of the sources was done with the same instruments, the statistical correlation of the error distributions has to be further investigated in detail. A full correlation of the sources and their uncertainties was considered at this point; this probably overestimates the total uncertainty of the calibration and increases the uncertainty by about a factor of 2 with respect to just ignoring the correlation.
Taking all of this into account, the sensitivity of the ARMON v2 (), determined during the calibration described in Sect. 2.5, was (0.0062 ± 0.0008) (Bq m−3)−1 s−1. This result is in good agreement with the one obtained from INTE-UPC when the exponential fit is applied (0.0061 ± 0.0002), as previously reported in Sect. 3.2. The offset determined during this calibration is (0.002 ± 0.007) s−1, in good agreement with the theoretical 0.
The detection efficiency of the ARMON v2, within its uncertainty, does not change when the radon concentrations vary between a few becquerels per cubic metre (Bq m−3) and thousands of becquerels per cubic metre (Bq m−3) (Fig. 7b). This is an important output which confirms the robustness of this instrument and its response. This last result also allows us to accept and to use the detection efficiency value obtained at high radon concentrations with a much smaller uncertainty. Additionally, the stability of the linearity in time and in a wide range of radon concentrations in terms of the detection efficiency of the ARMON v2 proves its suitability to be used as a transfer standard for in situ calibration and/or comparison of other radon and radon progeny monitors.
If the linear correction was used for the water vapour conditions (Fig. 3), the detection efficiency ε0 obtained in the PTB experiments will be in the range of (0.00595 ± 0.0008), which is also within the uncertainty range of the efficiency obtained during INTE calibrations (0.00575 ± 0.0002). Results of the calibration at the PTB, done 18 months after the calibration at INTE, also confirm that the calibration of the instrument is stable overtime, as was already appreciated in the older version of the monitor (Grossi et al., 2012, 2018, 2020; Vargas et al., 2015). However, within the framework of calibration procedures of radon measurement networks, it is suggested that one perform periodical stability checks of the efficiency of the different radon and radon progeny instruments running at the different stations.
In this paper, a new version of the Atmospheric Radon MONitor (ARMON) is described. This new version is more robust and transportable than the previous prototype, can be easily installed at atmospheric stations, and can be remotely controlled thank to a GUI window.
For the first time ever, the response of the ARMON v2 has been fully characterized by both theoretical and experimental approaches to obtain its detection efficiency for different radon concentrations, spanning between a few becquerels per cubic metre (Bq m−3) and thousands of becquerels per cubic metre (Bq m−3). A total uncertainty budget of the ARMON v2 monitor has been also carried out for the first time. Independent experiments were carried out both at the INTE-UPC radon chamber and at the PTB climate chamber in the framework of the European project traceRadon.
The monitor detection efficiency was found to be (0.0057 ± 0.0002) (Bq m−3)−1 s−1 according to the INTE-UPC exposure results and (0.00595 ± 0.0008) (Bq m−3)−1 s−1 according to the PTB experiments. The combined uncertainty of the ARMON v2 is lower than 10 % for radon activity values higher than 5 Bq m−3, and the detection limit is 0.132 Bq m−3 when no thoron concentration is present in the sampled air. The theoretical detection efficiency was (0.0075 (Bq m−3)−1 s−1), which is 27 % higher than the real one, assuming that there are factors that were not taken into account and that were possible irregularities in the electrostatic field or a recombination of 218Po+ ions with other particles.
The linearity of the ARMON v2 response observed thanks to the INTE-UPC and PTB experiments allows the instrument to be calibrated at high concentration value; thus, we are able to reduce the calibration uncertainty.
In addition to the present full characterization of the ARMON v2, another completely different calibration method based on short pulses of 222Rn was applied at the PTB in the framework of the same traceRadon project. Due to the special features of the ARMON v2 detector, this will allow for very short calibrations or recalibrations, even outside a calibration chamber and under field conditions. Results are still under investigation and will be the object of a future paper. Finally, the ARMON v2 was also compared, under field conditions, with the new ANSTO 200 L (Chambers et al., 2022), and these results will be published in a third scientific paper.
From the results of the present study, it can be confirmed that the ARMON v2 can be considered to be a good transfer standard for in situ calibration of radon and radon progeny monitors installed at atmospheric sites according to the requirements of the atmospheric radon community.
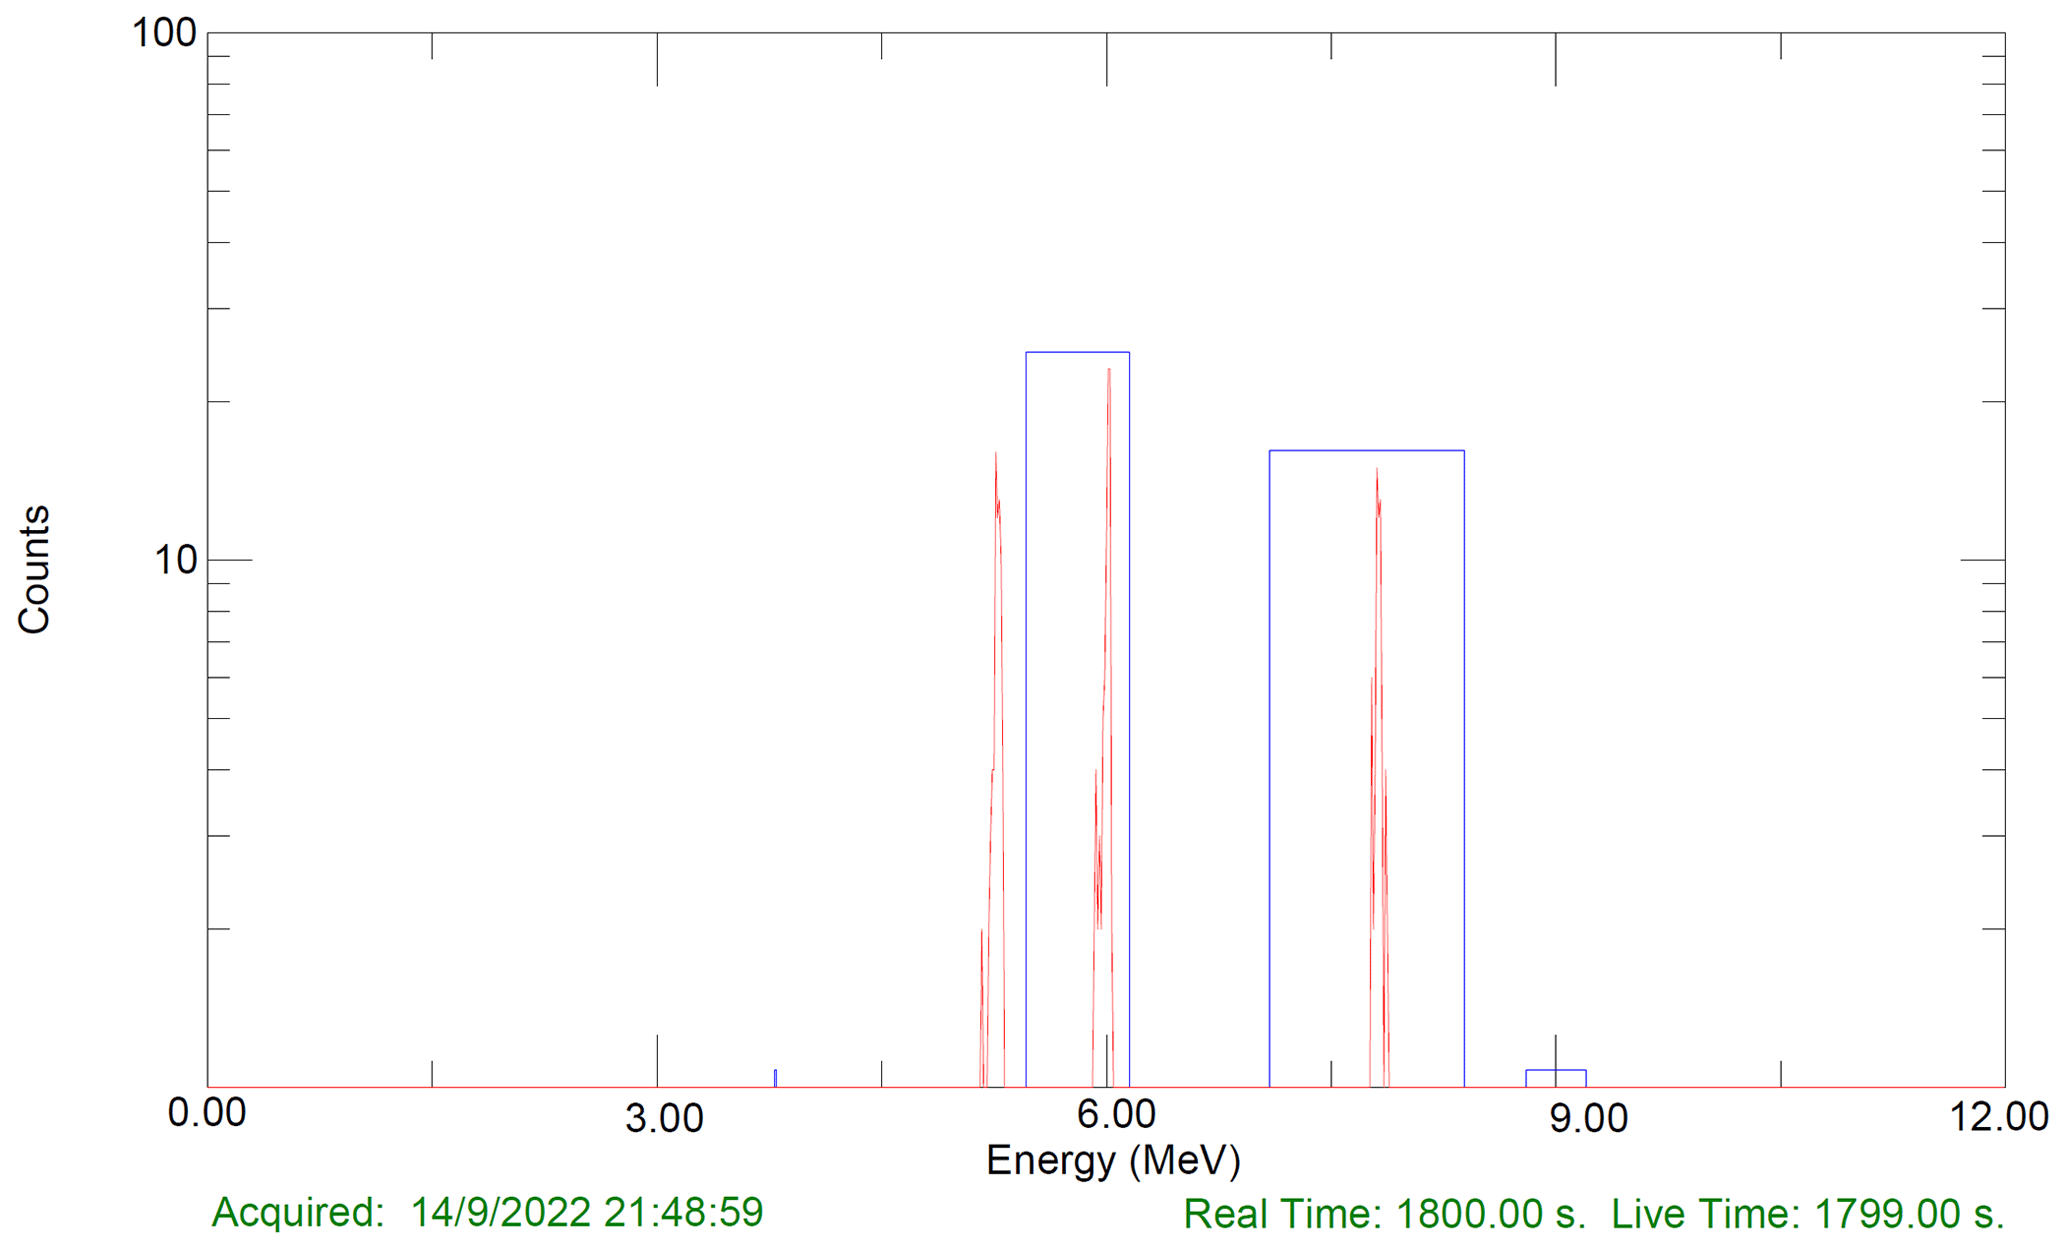
Figure A1Typical spectrum from the ARMON v2 monitor with the 210Po (5.30 MeV), 218Po (6.0 MeV), and 214Po (7.69 MeV) peaks observed. No 212Po and 214Po counts are observed.
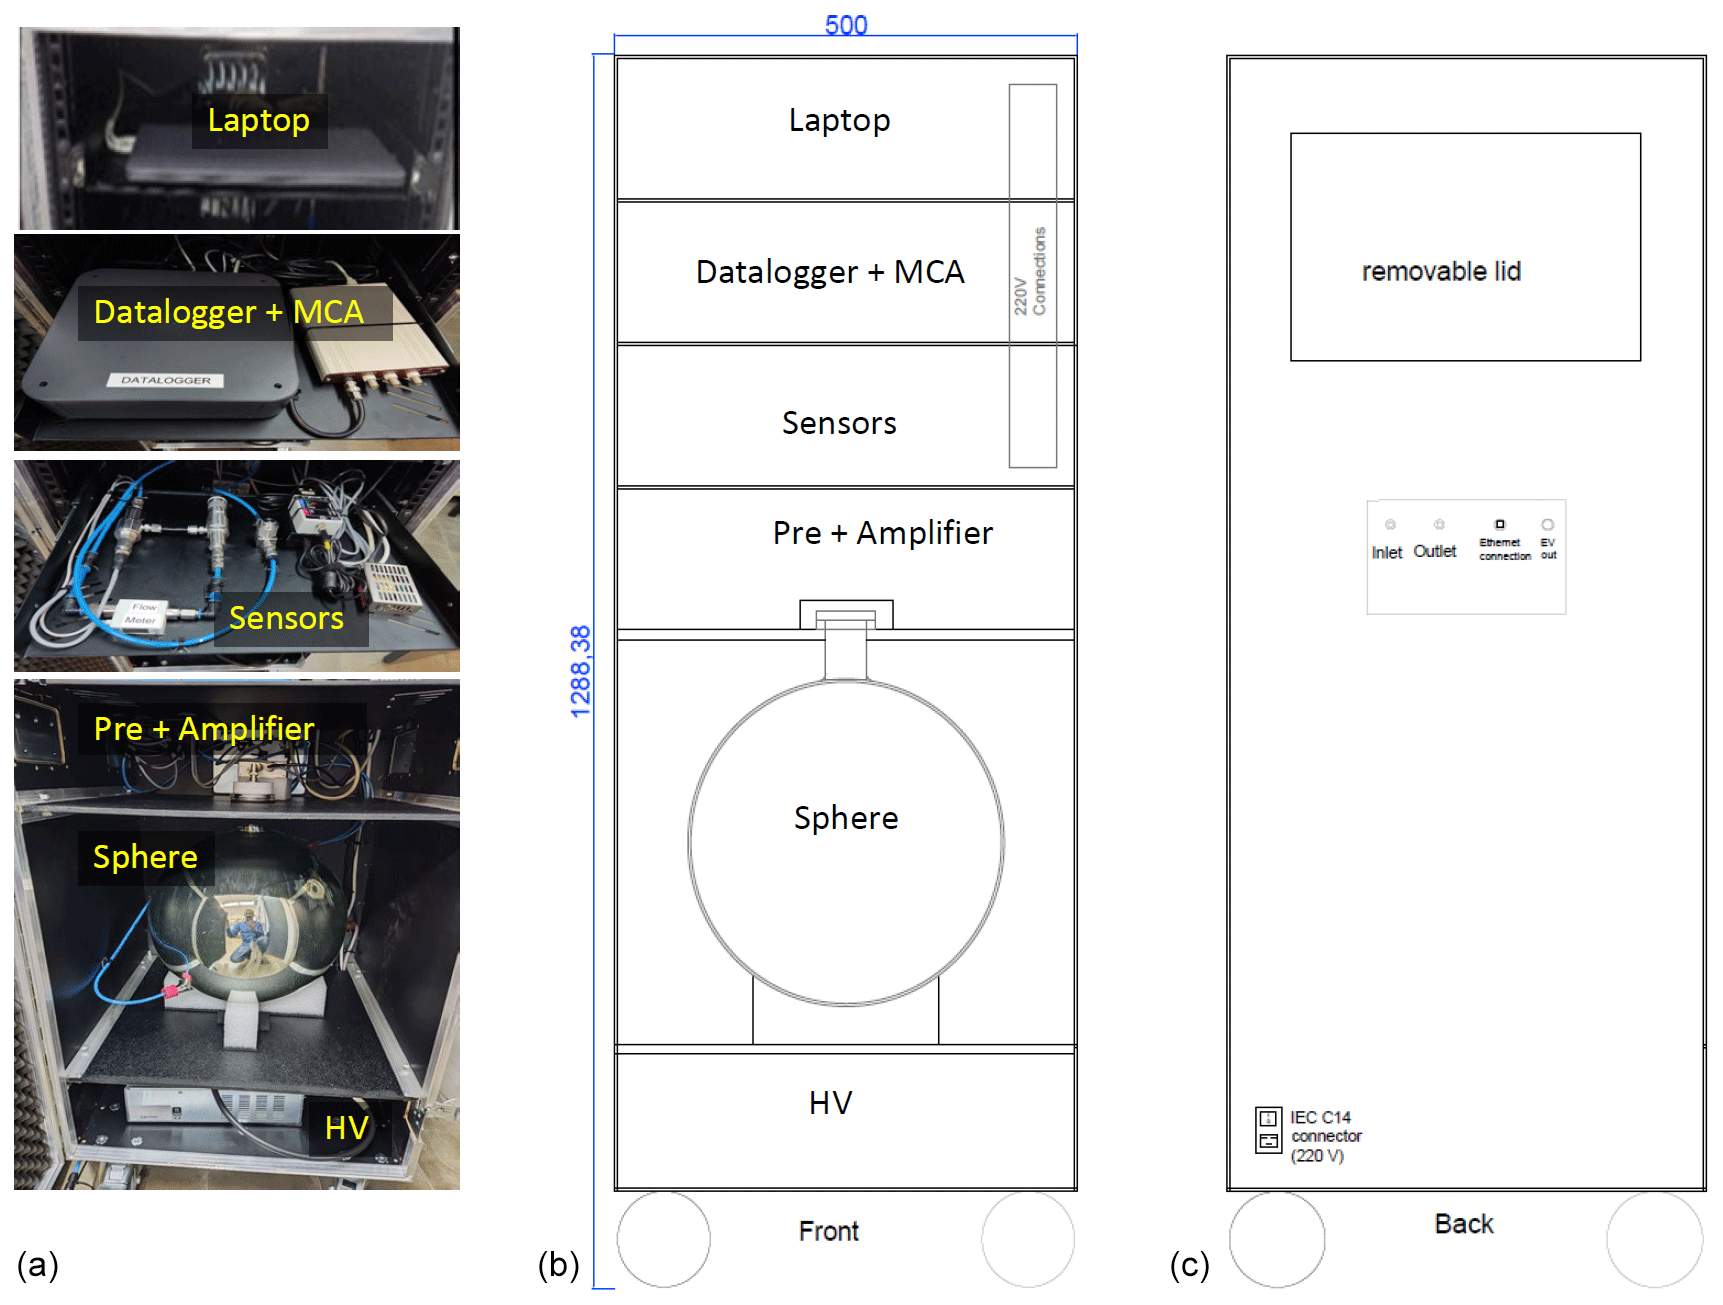
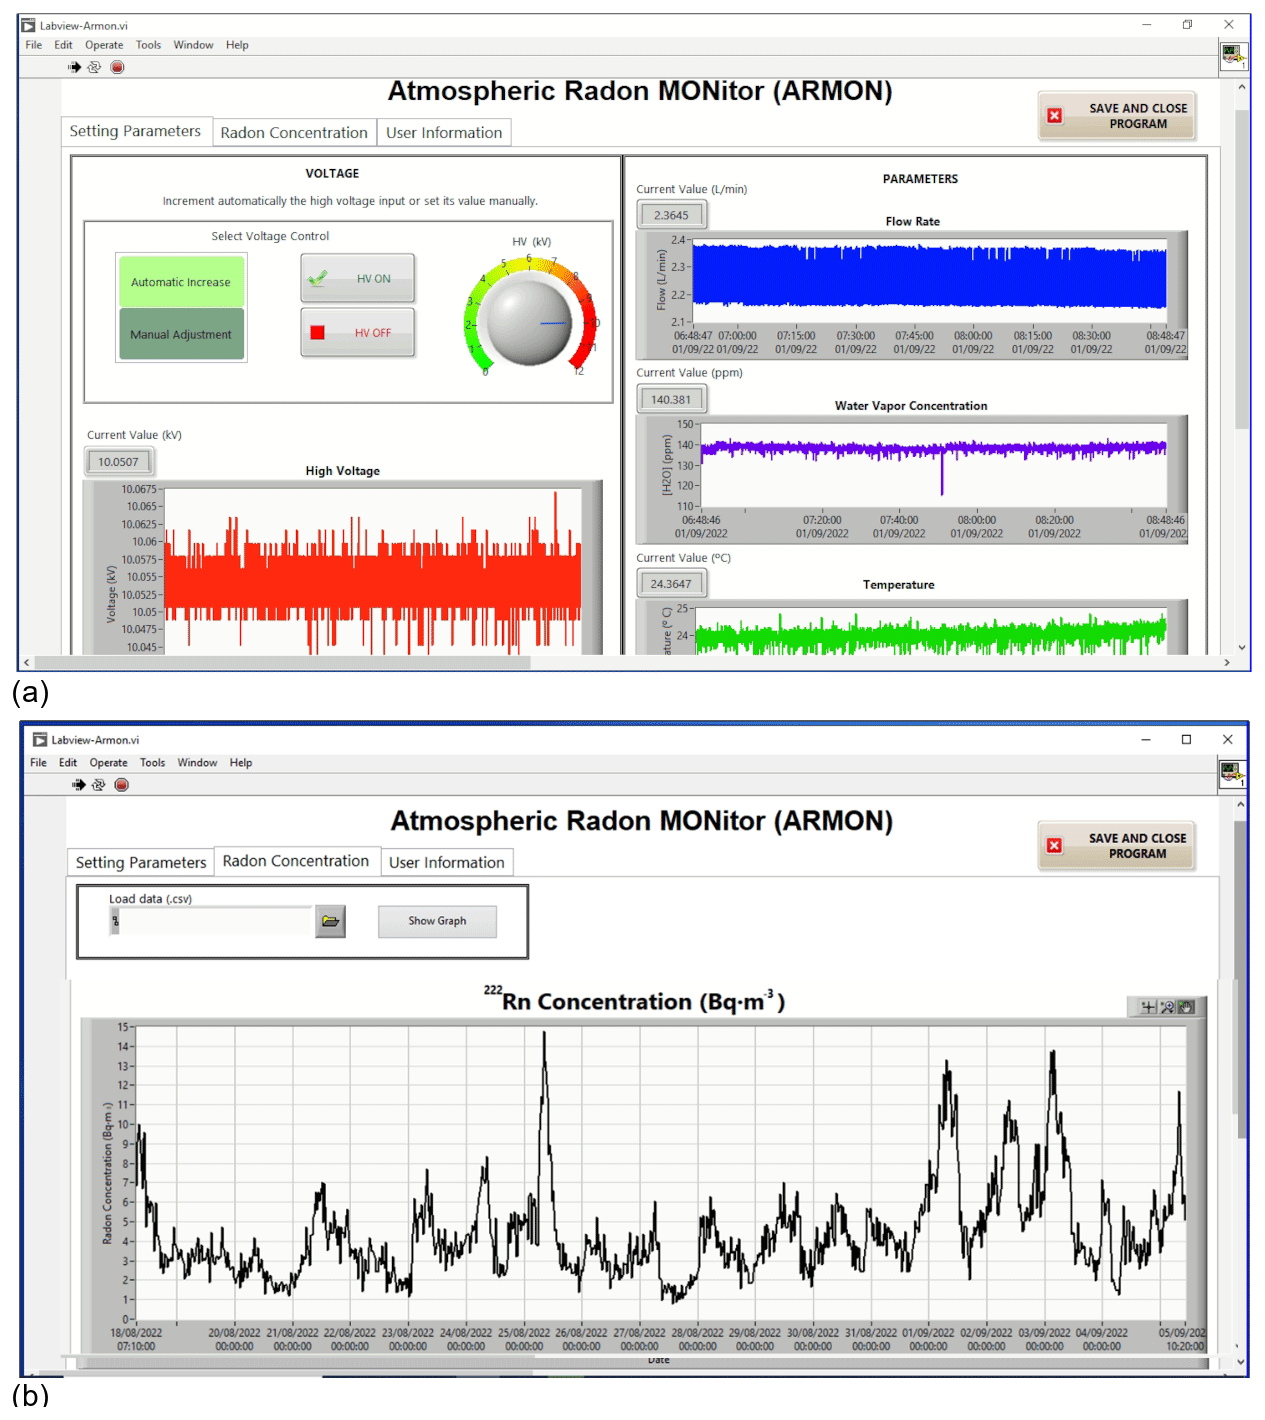
Figure A3User interface of the new ARMON monitor. (a) Sensor and voltage control. (b) Radon concentration visualization tab.
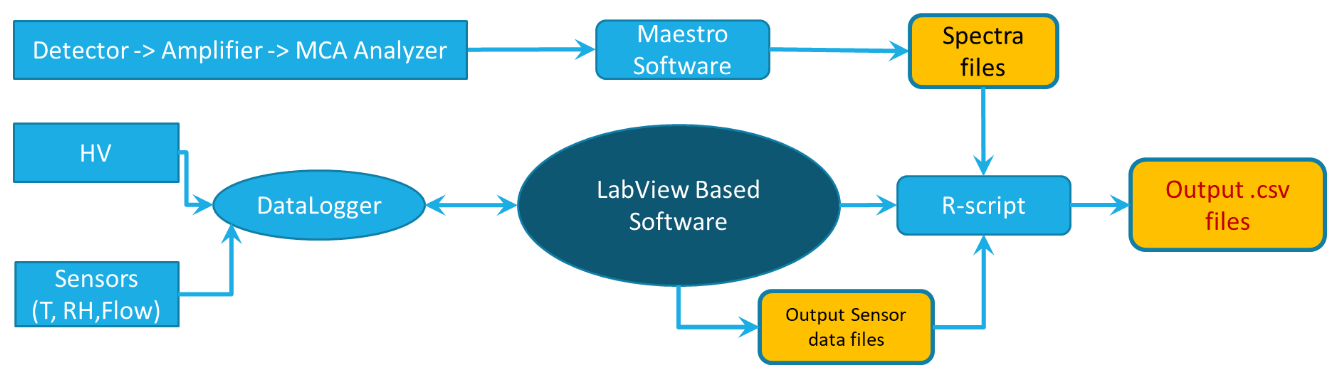
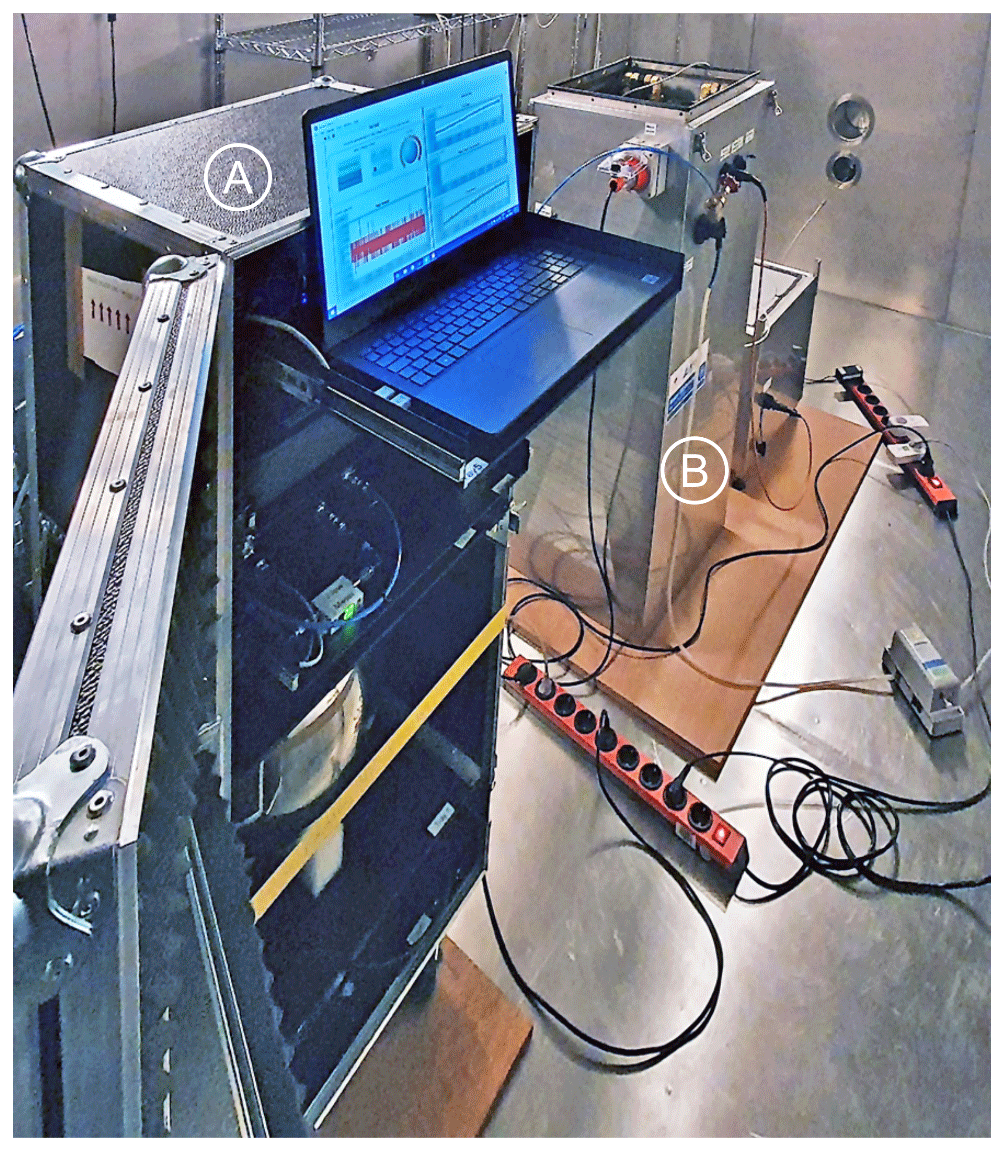
Figure B1Picture of the calibration setup of the ARMON v2 in the calibration chamber at the PTB. In the foreground, one can see the opened case of the ARMON v2 (A), and in the background, one can see a monitoring system developed by ANSTO (B) (Chambers et al., 2022).
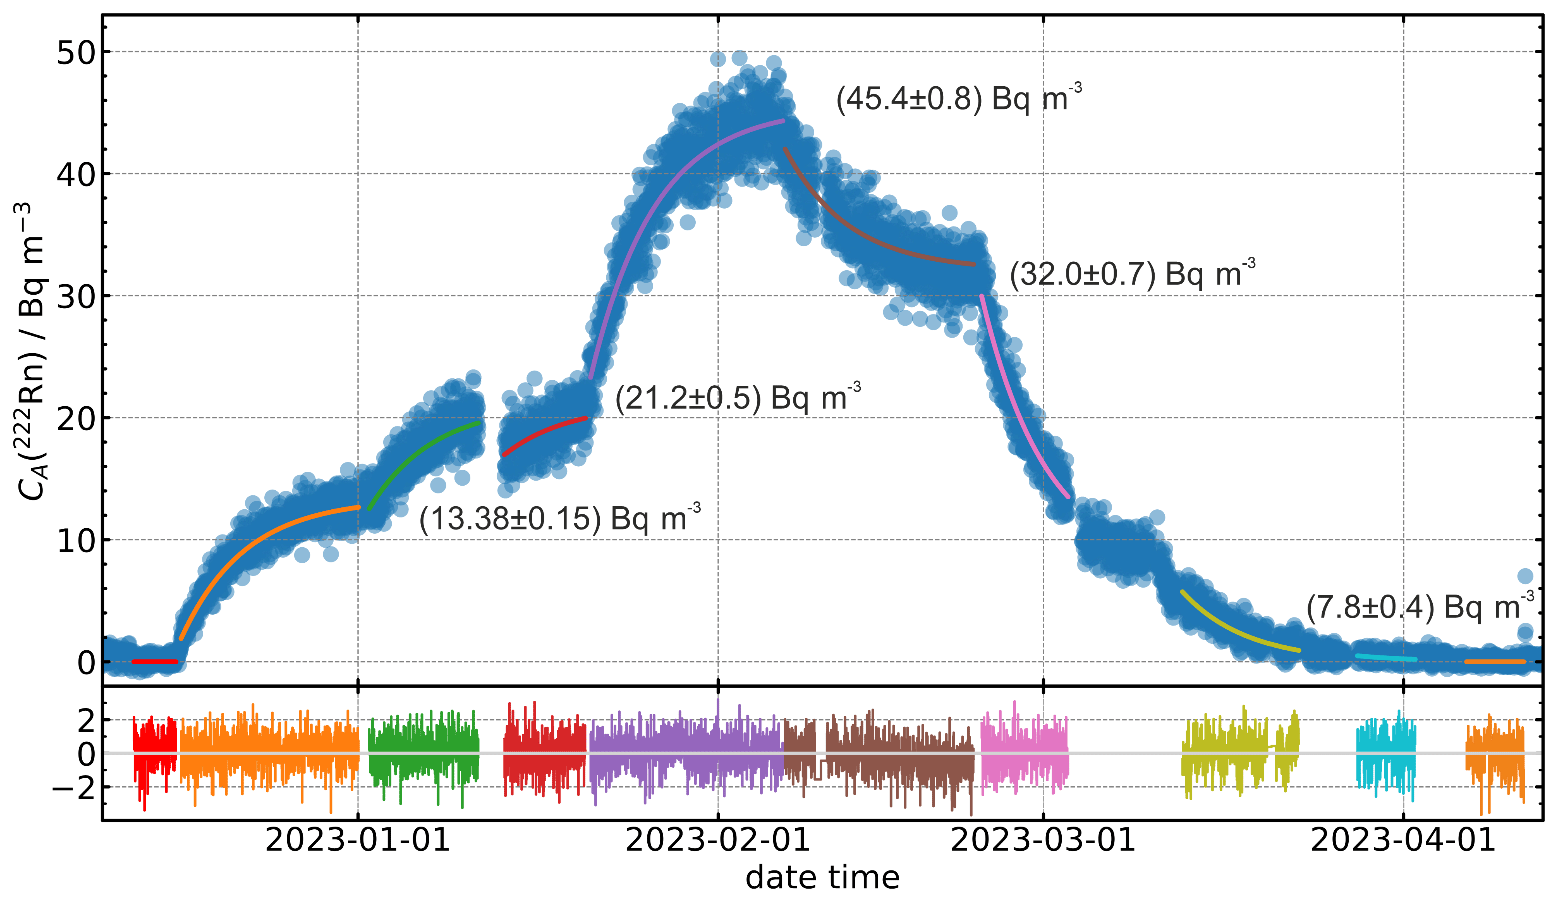
Figure B2Radon activity concentration determined with the ARMON v2 using three different emanation sources in five combinations. The values given in the figure illustrate the equilibrium activity concentration reached after infinite time with this source combination. The blue dots show the measured results of the ARMON v2 acquired over 30 min per point. The coloured lines show the modelled activity concentration determined from the emanation source combination. The coloured lines in the lower graph show the relative residuals between the model and measurements, which prove the excellent agreement.
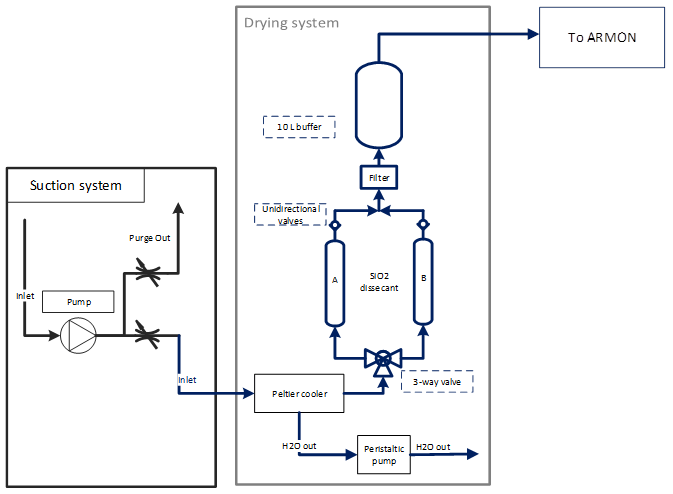
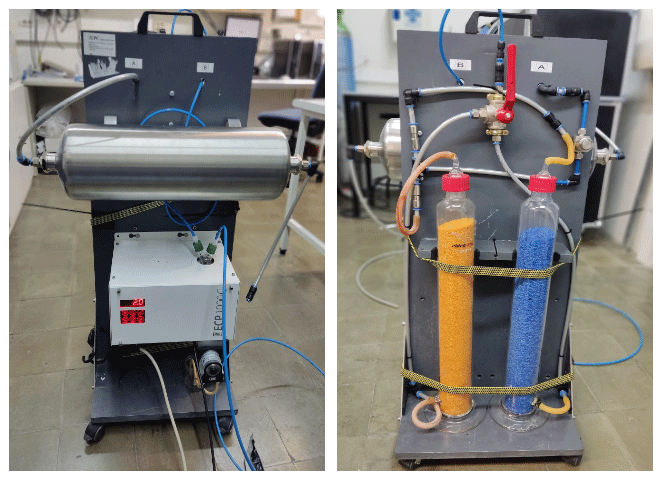
The drying system used with the ARMON v.2 is based on a two-step drying process: a Peltier cooler and drying through a silica gel cylinders. This system is capable of drying the air up to a water concentration between 150 and 300 ppm.
In the first step, the Peltier cools down the inlet air to a 2 °C temperature and extracts the condensed water. Then a three-way valve allows redirection of the flow to each of the two silica gel cylinders that capture water molecules of air. After the silica cylinders, a retention valve before a T connection ensures a unidirectional flow. After that, a 7 µm filter prevents silica dust from getting over the circuit.
As the silica gel can release small quantities of 220Rn, a 10 L tank is used to prevent thoron entries into the detection volume. After the 10 L buffer, the air can be introduced into the ARMON v2.
Figure C1 shows the basic scheme of the drying system. Two photographs of the drying unit are shown in Fig. C2.
The data and codes for this paper are available at the CORA Repositori de Dades de Recerca with https://doi.org/10.34810/data893 (Curcoll Masanes et al., 2024).
RC, in the framework of his PhD project, built the new version of the ARMON, ran the calibration experiments at the INTE-UPC, and analysed the data with their corresponding uncertainties. RG and CG designed the COMSOL setting simulations for the theoretical efficiency analysis. AV and CG supervised the work as the primary investigator (PI) and co-PI of the MAREA project and as senior researchers of the traceRadon project. SR carried out the ARMON v2 exposures at the PTB and the relative data analysis. RC led the paper writing, and all the authors contributed to it. All the authors have read and agreed to the published version of the paper.
The contact author has declared that none of the authors has any competing interests.
Publisher’s note: Copernicus Publications remains neutral with regard to jurisdictional claims made in the text, published maps, institutional affiliations, or any other geographical representation in this paper. While Copernicus Publications makes every effort to include appropriate place names, the final responsibility lies with the authors.
This article is part of the special issue “Outcomes of the traceRadon project: radon metrology for use in climate change observation and radiation protection at the environmental level”. It is a result of the 19ENV01 traceRadon project (June 2020 - May 2023).
The authors want to acknowledge Annette Röttger, as the coordinator of the traceRadon project, for her work and continuous support. The authors also want to acknowledge Liza Shiro for her work in the development of the ARMON-Labview program, Juan Antonio Romero for his support during the ARMON v2 building, Anja Honig and Tanita Ballé for their support during the ARMON exposures at the PTB, and Florian Mertes for his interesting ideas during the development of the low-radon-emanation sources of the PTB.
This research has been supported by the EU Horizon 2020 research and innovation programme (traceRadon project, grant no. 19ENV01) and the Agència de Gestió d'Ajuts Universitaris i de Recerca (MAR2EA; grant no. IU68-017047).
This paper was edited by Ute Karstens and reviewed by two anonymous referees.
Arnold, D., Vargas, A., Vermeulen, A. T., Verheggen, B., and Seibert, P.: Analysis of radon origin by backward atmospheric transport modelling, Atmos. Environ., 44, 494–502, https://doi.org/10.1016/j.atmosenv.2009.11.003, 2010.
Baskaran, M.: Po-210 and Pb-210 as atmospheric tracers and global atmospheric Pb-210 fallout: a Review, J. Environ. Radioactiv., 102, 500–513, https://doi.org/10.1016/j.jenvrad.2010.10.007, 2011.
Baskaran, M.: Radon: A Tracer for Geological, Geophysical and Geochemical Studies, Springer, Cham, 167–188, https://doi.org/10.1007/978-3-319-21329-3, 2016.
BIPM, IEC, IFCC, ILAC, ISO, IUPAC, IUPAP, and OIML: Evaluation of measurement data – Guide to the expression of uncertainty in measurement, https://www.bipm.org/documents/20126/2071204/JCGM_100_2008_E.pdf/cb0ef43f-baa5-11cf-3f85-4dcd86f77bd6 (last access: 1 March 2024), 2008.
Chambers, S., Williams, A. G., Zahorowski, W., Griffiths, A., and Crawford, J.: Separating remote fetch and local mixing influences on vertical radon measurements in the lower atmosphere, Tellus B, 63, 843–859, https://doi.org/10.1111/j.1600-0889.2011.00565.x, 2011.
Chambers, S., Williams, A., Griffiths, A., Podstawczyñska, A., Pawlak, W., and Fortuniak, K.: Characterizing the State of the Urban Surface Layer Using Radon-222, J. Geophys. Res., 124, 770–788, https://doi.org/10.1029/2018JD029507, 2019.
Chambers, S. D., Williams, A. G., Conen, F., Griffiths, A. D., Reimann, S., Steinbacher, M., Krummel, P. B., Steele, L. P., van der Schoot, M. V., Galbally, I. E., Molloy, S. B., and Barnes, J. E.: Towards a universal “Baseline” characterisation of air masses for high- and low-altitude observing stations using radon-222, Aerosol Air Qual. Res., 16, 885–899, https://doi.org/10.4209/aaqr.2015.06.0391, 2016.
Chambers, S. D., Griffiths, A. D., Williams, A. G., Sisoutham, O., Morosh, V., Röttger, S., Mertes, F., and Röttger, A.: Portable two-filter dual-flow-loop 222Rn detector: stand-alone monitor and calibration transfer device, Adv. Geosci., 57, 63–80, https://doi.org/10.5194/adgeo-57-63-2022, 2022.
COMSOL: Documentation for comsol release 5.1, COMSOL Multiphysics, Inc., MA, https://doc.comsol.com/6.2/docserver/#!/com.comsol.help.comsol/helpdesk/helpdesk.html (last access: 1 March 2024), 2015.
Conen, F. and Robertson, L. B.: Latitudinal distribution of radon-222 flux from continents, Tellus B, 54, 127–133, https://doi.org/10.3402/tellusb.v54i2.16653, 2002.
Curcoll Masanes, R., Grossi, C., and Vargas Drechsler, A.: Replication data for: Full characterization and calibration of a transfer standard monitor for atmospheric radon and thoron measurements, Version V1, CORA.Repositori de Dades de Recerca [data set/code], https://doi.org/10.34810/data893, 2024.
Dankelmann, V., Reineking, A., and Postendörfer, J.: Determination of Neutralisation Rates of 218Po Ions in Air, Radiat. Prot. Dosim., 94, 353–357, https://doi.org/10.1093/oxfordjournals.rpd.a006510, 2001.
Dersch, R. and Schötzig, U.: Production and measurement of 222Rn standards, Appl. Radiat. Isotopes, 49, 1171–1174, https://doi.org/10.1016/S0969-8043(97)10040-9, 1998.
Galmarini, S.: One year of 222Rn concentration in the atmospheric surface layer, Atmos. Chem. Phys., 6, 2865–2886, https://doi.org/10.5194/acp-6-2865-2006, 2006.
Goldstein, S. D. and Hopke, P. K.: Environmental Neutralization of Polonium-218, Environ. Sci. Technol., 19, 146–150, https://doi.org/10.1021/es00132a006, 1985.
Grossi, C.: 222Rn as a tracer for air mass transport characterization at 100-m-high tower in the south-west Spanish coast, PhD dissertation, http://www.tdx.cat/handle/10803/125236 (last access: 1 March 2024), 2012.
Grossi, C., Arnold, D., Adame, J. A., López-Coto, I., Bolívar, J. P., De La Morena, B. A., and Vargas, A.: Atmospheric 222Rn concentration and source term at El Arenosillo 100 m meteorological tower in southwest Spain, Radiat. Meas., 47, 149–162, https://doi.org/10.1016/j.radmeas.2011.11.006, 2012.
Grossi, C., Àgueda, A., Vogel, F. R., Vargas, A., Zimnoch, M., Wach, P., Martín, J. E., López-Coto, I., Bolívar, J. P., Morguí, J. A., and Rodó, X.: Analysis of ground-based 222Rn measurements over Spain: Filling the gap in southwestern Europe, J. Geophys. Res.-Atmos., 121, 11021–11037, https://doi.org/10.1002/2016JD025196, 2016.
Grossi, C., Vogel, F. R., Curcoll, R., Àgueda, A., Vargas, A., Rodó, X., and Morguí, J.-A.: Study of the daily and seasonal atmospheric CH4 mixing ratio variability in a rural Spanish region using 222Rn tracer, Atmos. Chem. Phys., 18, 5847–5860, https://doi.org/10.5194/acp-18-5847-2018, 2018.
Grossi, C., Chambers, S. D., Llido, O., Vogel, F. R., Kazan, V., Capuana, A., Werczynski, S., Curcoll, R., Delmotte, M., Vargas, A., Morguí, J.-A., Levin, I., and Ramonet, M.: Intercomparison study of atmospheric 222Rn and 222Rn progeny monitors, Atmos. Meas. Tech., 13, 2241–2255, https://doi.org/10.5194/amt-13-2241-2020, 2020.
Gutiérrez-Álvarez, I., Guerrero, J. L., Martín, J. E., Adame, J. A., Vargas, A., and Bolívar, J. P.: Radon behavior investigation based on cluster analysis and atmospheric modelling, Atmos. Environ., 201, 50–61, https://doi.org/10.1016/j.atmosenv.2018.12.010, 2019.
Hernández-Ceballos, M. A., Vargas, A., Arnold, D., and Bolívar, J. P.: The role of mesoscale meteorology in modulating the 222Rn concentrations in Huelva (Spain) – impact of phosphogypsum piles, J. Environ. Radioactiv., 145, 1–9, https://doi.org/10.1016/j.jenvrad.2015.03.023, 2015.
Hirao, S., Yamazawa, H., and Moriizumi, J.: Estimation of the Global 222Rn Flux Density from the Earth's Surface, Japanese Journal of Health Physics, 45, 161–171, https://doi.org/10.5453/jhps.45.161, 2010.
Honig, A., Paul, A., Röttger, S., and Keyser, U.: Environmental control of the German radon reference chamber, Nucl. Instrum. Meth. A, 416, 525–530, https://doi.org/10.1016/S0168-9002(98)00788-8, 1998.
Hopke, P. K.: Use of Electrostatic Collection of 218Po for Measuring Rn, Health Phys., 57, 39–42, https://doi.org/10.1097/00004032-198907000-00005, 1989.
ICOS RI: ICOS Atmosphere Station Specifications V2.0, edited by: Laurent, O., ICOS ERIC, https://doi.org/10.18160/GK28-2188, 2020.
Jacob, D. J. and Prather, M. J.: Radon-222 as a test of convective transport in a general circulation model, Tellus B, 42, 118–134, https://doi.org/10.3402/tellusb.v42i1.15196, 1990.
Karstens, U., Schwingshackl, C., Schmithüsen, D., and Levin, I.: A process-based 222radon flux map for Europe and its comparison to long-term observations, Atmos. Chem. Phys., 15, 12845–12865, https://doi.org/10.5194/acp-15-12845-2015, 2015.
Levin, I., Glatzel-Mattheier, H., Marik, T., Cuntz, M., Schmidt, M., and Worthy, D. E.: Verification of German methane emission inventories and their recent changes based on atmospheric observations, J. Geophys. Res.-Atmos., 104, 3447–3456, https://doi.org/10.1029/1998JD100064, 1999.
Levin, I., Born, M., Cuntz, M., Langendörfer, U., Mantsch, S., Naegler, T., Schmidt, M., Varlagin, A., Verclas, S., and Wagenbach, D.: Observations of atmospheric variability and soil exhalation rate of radon-222 at a Russian forest site. Technical approach and deployment for boundary layer studies, Tellus B, 54, 462–475, https://doi.org/10.3402/tellusb.v54i5.16681, 2002.
Levin, I., Karstens, U., Hammer, S., DellaColetta, J., Maier, F., and Gachkivskyi, M.: Limitations of the radon tracer method (RTM) to estimate regional greenhouse gas (GHG) emissions – a case study for methane in Heidelberg, Atmos. Chem. Phys., 21, 17907–17926, https://doi.org/10.5194/acp-21-17907-2021, 2021.
Mertes, F., Röttger, S., and Röttger, A.: Development of 222Rn Emanation Sources with Integrated Quasi 2π Active Monitoring, Int. J. Env. Res. Pub. He., 19, 840, https://doi.org/10.3390/ijerph19020840, 2022.
Nazaroff, W. and Nero, A. V: Radon and its decay products in indoor air, John Wiley and Sons Inc, New York, NY, USA, ISBN 10: 0471628107/ISBN 13: 9780471628101, 1988.
ORTEC: MAESTRO v7.0 User's Manual, https://www.ortec-online.com/-/media/ametekortec/manuals/a/a65-mnl.pdf?la=en&revision=f2f3ed3f-fa2d-4185-9301-7d480b0a6955 (last access: 1 March 2024), 2012.
Pal, S., Lopez, M., Schmidt, M., Ramonet, M., Gibert, F., Xueref-Remy, I., and Ciais, P.: Investigation of the atmospheric boundary layer depth variability and its impact on the 222Rn concentration at a rural site in France, J. Geophys. Res.-Atmos., 120, 623–643, https://doi.org/10.1002/2014JD022322, 2015.
Pugliese, M., Baiano, G., Boiano, A., D'Onofrio, A., Roca, V., Sabbarese, C., and Vollaro, P.: A compact multiparameter acquisition system for radon concentration studies, Appl. Radiat. Isotopes, 53, 365–370, https://doi.org/10.1016/S0969-8043(00)00154-8, 2000.
Radulescu, I., Calin, M. R., Luca, A., Röttger, A., Grossi, C., Done, L., and Ioan, M. R.: Inter-comparison of commercial continuous radon monitors responses, Nucl. Instrum. Meth. A, 1021, 165927, https://doi.org/10.1016/j.nima.2021.165927, 2022.
Röttger, A., Röttger, S., Grossi, C., Vargas, A., Curcoll, R., Otáhal, P., Hernández-Ceballos, M. Á., Cinelli, G., Chambers, S., Barbosa, S. A., Ioan, M., Radulescu, I., Kikaj, D., Chung, E., Arnold, T., Yver-Kwok, C., Fuente, M., Mertes, F., and Morosh, V.: New metrology for radon at the environmental level, Meas. Sci. Technol., 32, 124008, https://doi.org/10.1088/1361-6501/ac298d, 2021.
Röttger, S., Röttger, A., Mertes, F., Morosch, V., Ballé, T., and Chambers, S.: Evolution of traceable radon emanation sources from MBq to few Bq, Appl. Radiat. Isotopes, 196, 110726, https://doi.org/10.1016/j.apradiso.2023.110726, 2023.
Schery, S. D. and Huang, S.: An estimate of the global distribution of radon emissions from the ocean, Geophys. Res. Lett., 31, L19104, https://doi.org/10.1029/2004GL021051, 2004.
Schmidt, M., Graul, R., Sartorius, H., and Levin, I.: Carbon dioxide and methane in continental Europe: a climatology, and 222Radon-based emission estimates, Tellus B, 48, 457–473, https://doi.org/10.3402/tellusb.v48i4.15926, 1996.
Schmithüsen, D., Chambers, S., Fischer, B., Gilge, S., Hatakka, J., Kazan, V., Neubert, R., Paatero, J., Ramonet, M., Schlosser, C., Schmid, S., Vermeulen, A., and Levin, I.: A European-wide 222radon and 222radon progeny comparison study, Atmos. Meas. Tech., 10, 1299–1312, https://doi.org/10.5194/amt-10-1299-2017, 2017.
Szegvary, T., Conen, F., and Ciais, P.: European 222Rn inventory for applied atmospheric studies, Atmos. Environ., 43, 1536–1539, https://doi.org/10.1016/j.atmosenv.2008.11.025, 2009.
Tositti, L., Pereira, E. B., Sandrini, S., Capra, D., Tubertini, O., and Bettoli, M. G.: Assessment of Summer Trends of Tropospheric Radon Isotopes in a Coastal Antarctic Station (Terra Nova Bay), Int. J. Environ. An. Ch., 82, 259–274, https://doi.org/10.1080/03067310290027767, 2002.
Vargas, A., Ortega, X., and Matarranz, J. L. M.: Traceability of radon-222 activity concentration in the radon chamber at the technical university of Catalonia (Spain), Nucl. Instrum. Meth. A, 526, 501–509, https://doi.org/10.1016/j.nima.2004.02.022, 2004.
Vargas, A., Arnold, D., Adame, J. A., Grossi, C., Hernández-Ceballos, M. A., and Bolivar, J. P.: Analysis of the vertical radon structure at the spanish “El arenosillo” tower station, J. Environ. Radioactiv., 139, 1–17, https://doi.org/10.1016/j.jenvrad.2014.09.018, 2015.
Vogel, F. R., Ishizawa, M., Chan, E., Chan, D., Hammer, S., Levin, I., and Worthy, D. E. J.: Regional non-CO2 greenhouse gas fluxes inferred from atmospheric measurements in Ontario, Canada, J. Integr. Environ. Sci., 9, 41–55, https://doi.org/10.1080/1943815X.2012.691884, 2012.
Wada, A., Murayama, S., Kondo, H., Matsueda, H., Sawa, Y., and Tsuboi, K.: Development of a Compact and Sensitive Electrostatic Radon-222 Measuring System for Use in Atmospheric Observation, J. Meteorol. Soc. Jpn, Ser. II, 88, 123–134, https://doi.org/10.2151/jmsj.2010-202, 2010.
Wada, A., Matsueda, H., Murayama, S., Taguchi, S., Hirao, S., Yamazawa, H., Moriizumi, J., Tsuboi, K., Niwa, Y., and Sawa, Y.: Quantification of emission estimates of CO2, CH4 and CO for east asia derived from atmospheric radon-222 measurements over the western North Pacific, Tellus B, 65, 1–16, https://doi.org/10.3402/tellusb.v65i0.18037, 2013.
Whittlestone, S. and Zahorowski, W.: Baseline radon detectors for shipboard use: Development and deployment in the First Aerosol Characterization Experiment (ACE 1), J. Geophys. Res.-Atmos., 103, 16743–16751, https://doi.org/10.1029/98JD00687, 1998.
Williams, A. G., Chambers, S. D., Conen, F., Reimann, S., Hill, M., Griffiths, A. D., and Crawford, J.: Radon as a tracer of atmospheric influences on traffic-related air pollution in a small inland city, Tellus B, 68, 30967, https://doi.org/10.3402/tellusb.v68.30967, 2016.
Zahorowski, W., Chambers, S. D., and Henderson-Sellers, A.: Ground based radon-222 observations and their application to atmospheric studies, J. Environ. Radioactiv., 76, 3–33, https://doi.org/10.1016/j.jenvrad.2004.03.033, 2004.
- Abstract
- Introduction
- ARMON description
- Results and discussion
- Summary, conclusions, and further steps
- Appendix A: ARMON v2 supplementary figures
- Appendix B: Calibration at PTB climatic chamber supplementary figures
- Appendix C: Drying unit
- Code and data availability
- Author contributions
- Competing interests
- Disclaimer
- Special issue statement
- Acknowledgements
- Financial support
- Review statement
- References