the Creative Commons Attribution 4.0 License.
the Creative Commons Attribution 4.0 License.
 | 31 Jul 2024
Characterization of a new Teflon chamber and on-line analysis of isomeric multifunctional photooxidation products
Esther Borrás
Amalia Muñoz
Anke Christine Nölscher
The photooxidation of volatile organic compounds (VOCs) in the troposphere has important implications for air quality, weather, and climate. A deeper understanding of the underlying mechanisms can be achieved by studying these reactions under controlled conditions and analysing the emerging photooxidation products. This requires dedicated laboratory infrastructure as well as sensitive and selective analytical techniques. Here, we constructed a new 300 L indoor Teflon atmospheric simulation chamber as part of the Bayreuth ATmospheric simulation CHambers (BATCH) infrastructure. The chamber was irradiated by a bandpass-filtered solar simulator that enabled experiments with realistic photon fluxes and OH radical concentrations. It was coupled to a proton-transfer-reaction time-of-flight mass spectrometer (PTR-ToF-MS) and a solid-phase microextraction–gas chromatography–mass spectrometry (SPME-GC-MS) system for the on-line analysis of the precursor VOC and its oxidation products in the gas phase. As part of the SPME-GC-MS method, multifunctional oxygenated compounds (carbonyls, alcohols, carboxylic acids) were derivatized with O-(2,3,4,5,6-pentafluorobenzyl)hydroxylamine (PFBHA) and N-trimethylsilyl-N-methyltrifluoroacetamide (MSTFA). We designed a permeation source for the on-line addition of internal standards to improve method reproducibility. The joint setup was tested and validated by studying the OH-radical-induced photooxidation of toluene, one of the most abundant aromatic hydrocarbons in the atmosphere. For chamber characterization, we first derived the photolysis rates for several typical toluene products in the irradiated BATCH Teflon chamber (1.77 × 10⁻⁸–3.02 × 10⁻⁴ s−1). Additionally, wall loss rates were determined empirically (4.54 × 10⁻⁶–8.53 × 10⁻⁵ s−1) and then parameterized according to fundamental molecular properties. For the cresols, we compiled a weighted calibration factor for the PTR-ToF-MS, taking into account isomer-specific sensitivities as well as the relative distribution as determined by the SPME-GC-MS. The weighted calibration improved the instrumental agreement to 14 %, whereas the PTR-ToF-MS overestimated the sum of the isomers by 31 % compared to the SPME-GC-MS concentrations when using the averaged calibration factor. Thus, the combined data set offered insight into both temporal trends and the isomeric composition. Finally, we conducted six toluene photooxidation experiments to evaluate the ring-retaining first-generation products. Based on the loss-corrected concentrations, we derived formation yields for o-cresol (8.0 ± 1.8 %), m-cresol (0.4 ± 0.1 %), p-cresol (2.4 ± 0.6 %), benzyl alcohol (0.5 ± 0.1 %), and benzaldehyde (4.6 ± 1.7 %) under NOx-free conditions at T = 298 ± 1 K. These yields are consistent with previous studies and therefore serve as proof of concept for our applied methods.
- Article
(2306 KB) - Full-text XML
-
Supplement
(1797 KB) - BibTeX
- EndNote


Volatile organic compounds (VOCs) readily undergo photooxidation in the troposphere. These reactions are tightly linked to the formation of secondary pollutants such as ground-level ozone (O3) or secondary organic aerosol (SOA) (Henze et al., 2008; Kanakidou et al., 2005; Zhao et al., 2022). Furthermore, they directly impact the ambient budget of hydroxyl (OH) radicals and thus the oxidative capacity of the atmosphere (Lelieveld et al., 2008; Williams et al., 2016). Indirectly, VOC photooxidation affects radiative forcing, as it competes with the removal of greenhouse gases such as methane (CH4) (von Schneidemesser et al., 2015). To improve and complement model predictions of air quality and climate, the underlying reaction mechanisms of VOC photooxidation therefore need to be better constrained.
Atmospheric simulation chambers (ASCs) are an established and powerful tool to mimic tropospheric oxidation processes and to derive both mechanistic understanding and kinetic data (Chu et al., 2022; Finlayson-Pitts and Pitts, 2000; Kiendler-Scharr et al., 2023). Typical applications include photooxidant studies (e.g. Carter et al., 1979), gas-phase reaction and product studies (e.g. Zaytsev et al., 2019), and aerosol studies (e.g. Charan et al., 2020). In ASCs, added reagents and ambient conditions can be controlled with great precision. Thus, they enable gradual increases in complexity, the imitation of diverse environments and chemical regimes, and, finally, transferability to the real world. These data, in turn, provide the foundation for atmospheric chemistry models such as the near-explicit Master Chemical Mechanism (MCM) for gas-phase reactions (Jenkin et al., 2003; Saunders et al., 2003).
ASCs worldwide differ in their size and shape, material, and light source. For instance, the EUPHORE (EUropean PHOtoREactor) chamber is spherical, irradiated by natural sunlight, and one of the largest photoreactors in Europe, with a volume of about 200 m3 (Muñoz et al., 2018; Zádor et al., 2006). In contrast, other chambers fit into laboratory facilities (e.g. Carter et al., 2005; Huang et al., 2017). Such indoor chambers have the advantage of being independent of weather and season but require carefully tuned artificial light sources. Knowledge of the spectral distribution and intensity of these light sources is needed for assessing their similarity to the natural solar spectrum as well as radical production rates and photolytic losses of the involved species. Regarding the wall materials of ASCs and flow reactors, common choices include borosilicate glass (e.g. Behnke et al., 1988), quartz (e.g. Huang et al., 2017), stainless steel (e.g. Shaw et al., 2018), and Teflon films (e.g. Leskinen et al., 2015). Teflon films provide flexible arrangements of the chamber design and volume, are UV transparent, and are a preferred option for many gas-phase studies due to their high chemical inertia (Schwantes et al., 2017; Zádor et al., 2006; Zaytsev et al., 2019). Nevertheless, wall losses matter in Teflon chambers as well, especially for species with low volatility, for small chambers, and for experiments conducted over long time frames (Grosjean, 1985; Krechmer et al., 2020; Ye et al., 2016; Zhang et al., 2015). Regardless of their specific designs, all chambers therefore need to be characterized thoroughly (Alfarra et al., 2023; Carter et al., 2005; Leskinen et al., 2015; Ma et al., 2022) to account not only for contamination and artefacts but also for chamber- and compound-specific losses.
In recent years, the identification and quantification of the multifunctional products formed during VOC photooxidation has become increasingly important and has contributed to great advances in the understanding of autoxidation (e.g. Rissanen, 2021), gas–particle partitioning (e.g. Gkatzelis et al., 2018), and peroxy radical chemistry (e.g. Berndt et al., 2018). The analysis of these products is often approached using spectroscopic methods (e.g. Klotz et al., 1998; Olariu et al., 2002) or stand-alone mass spectrometry (MS) (e.g. Baltaretu et al., 2009; Schwantes et al., 2017; Zaytsev et al., 2019). One powerful soft-ionization technique for the real-time MS analysis of gas-phase species is proton transfer reaction MS (PTR-MS) (Lindinger et al., 1998). PTR-MS is selective for compounds with a higher proton affinity than water and is commonly applied to quantify airborne VOCs and their photooxidation products (e.g. Müller et al., 2012; Zaytsev et al., 2019). When using high-resolution mass spectrometers such as time-of-flight (ToF) models, PTR-ToF-MS spectra give insights into sum formulas and enable suspect screening (Romano and Hanna, 2018).
Meanwhile, isomeric information remains scarce for many reaction systems, even though isomers can differ in their properties, rate constants, and yields and can help to elucidate precise reaction mechanisms and intermediate species (Atkinson et al., 1980; Olariu et al., 2002). To distinguish between isomers with equal masses, MS detectors can be coupled to gas chromatography (GC) so that compounds are identified along two dimensions. However, oxygenated products such as ketones, aldehydes, alcohols, and carboxylic acids are often not suitable for GC analysis due to their high fragility and polarity. If they are analysable at all, there is a substantial risk of losses, poor separation, surface reactions, or conversions to other species during the chromatographic process, resulting in a lowered sensitivity and potentially creating artefacts (Rivera-Rios et al., 2014; Vasquez et al., 2018). To mitigate these problems, Borrás et al. (2021) have recently proposed an on-line GC-MS method with solid-phase microextraction (SPME) sampling and the on-fibre double derivatization of fragile analytes.
SPME is a sampling and enrichment technique which was first developed by Arthur and Pawliszyn (1990). The associated fibres are coated with a thin layer of a stationary sorbent phase which is exposed to extract and retain analytes during sampling. SPME can be used as a preparatory step for GC-MS analysis, in which case the high temperature in the GC inlet desorbs the analytes from the coated fibre. Advantages include high selectivity and sensitivity, the minimization of human error due to the high degree of automation associated with autosampler systems, the reduction in solvent consumption, and the increased analytical throughput due to fewer preparation steps and shorter extraction times (Arthur and Pawliszyn, 1990; Borrás et al., 2021; Koziel and Pawliszyn, 2001). However, the performance and reproducibility of SPME can be compromised by saturation effects and competition between analytes due to the limited sorption capacity of the fibre (Bartelt, 1997) as well as varying extraction efficiencies due to fibre effects (Tumbiolo et al., 2004).
Through controlled chemical modification, derivatization procedures can help preserve molecular structures and stabilize analytes throughout the chromatographic process. Additionally, the compounds of interest can be made more amenable to the specific analytical technique, such as by increasing their volatility for subsequent GC separation. For the analysis of photooxidation products, this concerns in particular the derivatization of hydroxy groups (e.g. alcohols and carboxylic acids) and carbonyl groups (e.g. aldehydes and ketones). The most common approaches for subsequent GC-MS analysis include silylation for the hydroxy group (using reagents like N-trimethylsilyl-N-methyl trifluoroacetamide (MSTFA) or N,O-bis(trimethylsilyl)trifluoroacetamide (BSTFA)) and oxime formation for the carbonyl group (using, for instance, O-(2,3,4,5,6-pentafluorobenzyl)hydroxylamine (PFBHA)). These derivatization techniques have been used, for example, to analyse gaseous and particulate oxygenated products formed in the photooxidation of aromatic compounds (e.g. Gómez Alvarez et al., 2007; White et al., 2014), monoterpenes (e.g. Jang and Kamens, 1999; Yu et al., 1998), or VOC mixtures (e.g. Pindado Jiménez et al., 2013) in laboratory studies. By combining silylation and oxime formation, a broad range of compounds with diverse functionalities can be covered (Pindado Jiménez et al., 2013; White et al., 2014; Yu et al., 1998). As a means of automating the analytical process, derivatization can be performed directly on SPME fibres, which has been reported for PFBHA previously (Gómez Alvarez et al., 2007; Martos and Pawliszyn, 1998; Schmarr et al., 2008).
Here, we constructed and characterized a new indoor Teflon ASC as part of the Bayreuth ATmospheric simulation CHambers (BATCH). For the purpose of studying multifunctional VOC photooxidation products, we coupled the BATCH Teflon chamber to a PTR-ToF-MS and an on-line SPME-GC-MS system with double derivatization using PFBHA and MSTFA. The developed methods were tested and validated by studying the reaction of toluene with OH radicals.
Toluene is one of the most abundant aromatic hydrocarbons in the atmosphere (Cabrera-Perez et al., 2016). Most of its first-generation products are well studied (Atkinson et al., 1980; Bloss et al., 2005; Klotz et al., 1998; Zaytsev et al., 2019), making it a suitable and relevant reference system (e.g. Leskinen et al., 2015; Ma et al., 2022). Toluene reacts with OH radicals at a rate of about k = 5.6 × 10⁻¹² molec.−1 cm3 s−1 at T = 298 K (IUPAC, 2024) via either the addition of the OH radical to the aromatic ring structure or H abstraction from the substituted methyl group. The MCMv3.1 (Bloss et al., 2005) distinguishes between four channels in the primary chemistry of toluene (Fig. 1). Following the formation of an intermediate OH–toluene adduct (Klotz et al., 1998; Zhang et al., 2019), the addition pathway can lead to ring-retaining cresol isomers (cresol channel, 18 % yield) or to ring-opened products, such as an epoxydicarbonylene compound (epoxy-oxy channel, 10 % yield). Alternatively, peroxy radical isomerization can produce bicyclic peroxy radicals, which ultimately fragment to form the α-dicarbonyl compounds glyoxal and methylglyoxal along with their respective furanone or γ-dicarbonyl co-products (dicarbonyl channel, 65 % yield). In the H-abstraction pathway (benzaldehyde channel, 7 % yield), benzyl radicals readily form peroxy radicals, which undergo a range of bimolecular reactions, producing ring-retaining products such as benzaldehyde and benzyl alcohol (Bloss et al., 2005). The follow-up chemistry of major toluene products such as the cresols, benzaldehyde, or the different dicarbonyls has been the subject of previous laboratory studies (e.g. Atkinson et al., 1980; Liu et al., 1999; Majer et al., 1969; Olariu et al., 2002; Schwantes et al., 2017).
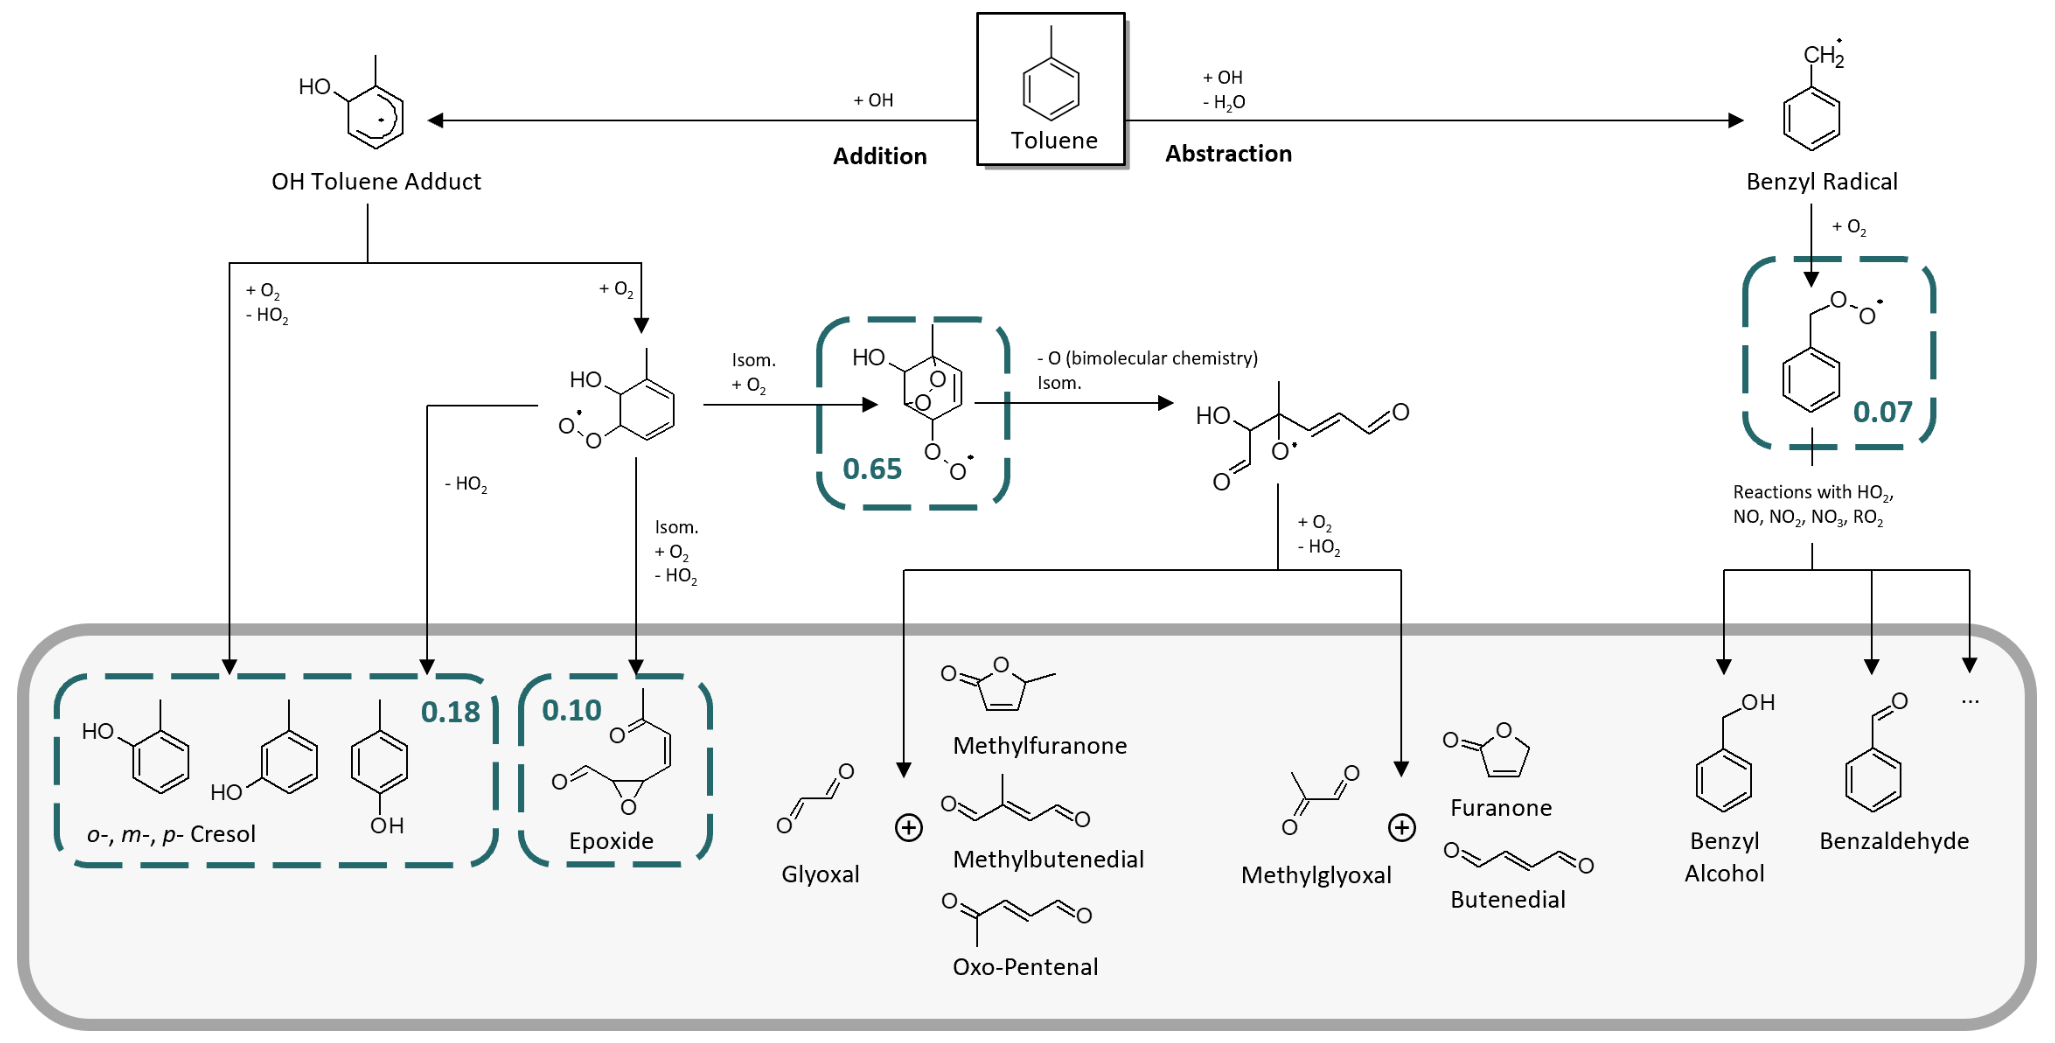
Figure 1Primary chemistry of toluene following the reaction with OH radicals in the MCM. The blue boxes represent the four major channels and their corresponding yields. The grey area includes the main first-generation products.
Here, we aimed at evaluating the formation yields of the first-generation products that can be calibrated and quantified and that are specific to their reaction channel. The dicarbonyl products glyoxal and methylglyoxal not only occur in the primary chemistry of toluene but are also formed as secondary products in most channels (Atkinson et al., 1980; Bloss et al., 2005; Wagner et al., 2003), especially in the breakdown of other dicarbonyls (Liu et al., 1999). Although primary production is typically dominant (Gómez Alvarez et al., 2007; Volkamer et al., 2001), secondary sources contribute to a fraction of the observed concentrations of glyoxal and methylglyoxal. Meanwhile, their co-products remain poorly constrained (Bloss et al., 2005; Jenkin et al., 2003; and references therein) and are not available as authentic standards. The epoxy-oxy channel is highly controversial (e.g. Hu et al., 2007; Wu et al., 2014; Zaytsev et al., 2019) and only included in the MCM based on qualitative indications in order to balance the reaction flux (Bloss et al., 2005; Jenkin et al., 2003). No authentic standard of the epoxydicarbonylene product is available. Therefore, we focus especially on the main NOx-free ring-retaining first-generation products of toluene, namely the cresol isomers, benzyl alcohol, and benzaldehyde. For the purpose of evaluating the novel setup, however, we refer to the entire test system, with its wide range of multifunctional first- and second-generation products (which is beyond the scope of the photooxidation chemistry shown in Fig. 1).
An overview of the novel laboratory setup is provided in Fig. 2. The BATCH Teflon chamber was located in a temperature-controlled room (Hans Zettner GmbH; 3 × 4 × 5 m) in which the temperature could be adjusted between −25 and 35 °C with a stability of ±1 K (DeLonghi HCS 2550 FTS and Dixell XR170C).
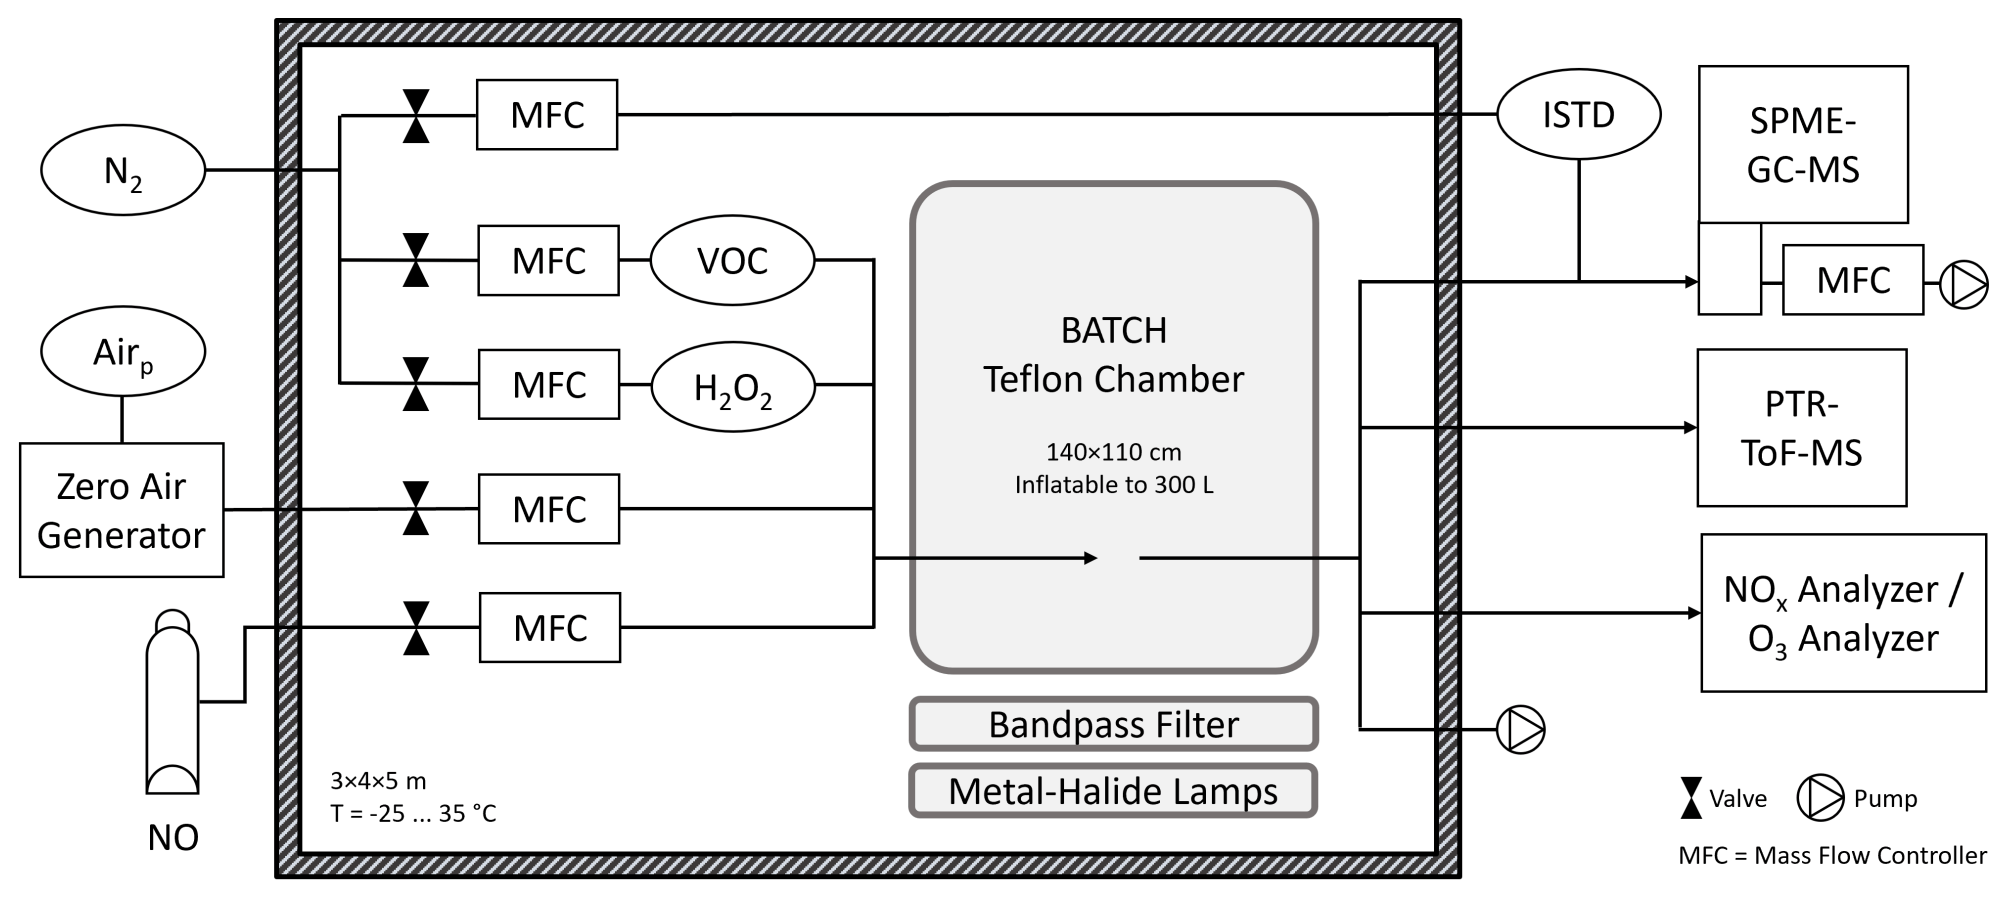
Figure 2BATCH Teflon chamber with infrastructure and instrumentation. The Teflon chamber was installed in a temperature-controlled room (T = −25–35 °C) and placed above a bandpass-filtered solar simulator. Pressurized air and N2 were available from the in-house gas supply. Added reagents included the VOC precursor, hydrogen peroxide (H2O2) as an OH radical precursor, optional nitric oxide (NO), and zero air as the matrix. The VOC precursor and H2O2 were introduced with a flow of N2. The chamber had one connector, which was used as the inlet during filling and the outlet during the experiments. All lines were made from polytetrafluoroethylene (PTFE). Coupled analytical instruments included a NOx analyser, an O3 analyser, a PTR-ToF-MS, and an on-line SPME-GC-MS with attached sampling cell. Two internal standards (ISTDs) were added into the SPME-GC-MS flow using a permeation source. Dimensions are not to scale.
3.1 Atmospheric simulation chamber
The BATCH Teflon chamber was made from UV-transparent fluorinated ethylene propylene (FEP). We constructed the pillow-shaped bag by folding a single sheet of a 50 µm thick FEP film (Chemours, 200A FEP100) and heat sealing (Dieck, UM 802) the three open sides. Excluding the heat-sealed areas, the empty and flattened chamber was 140 × 110 cm in size. It was suspended in a metal scaffold, with the two short sides being used as top and bottom ends. It was not further stabilized into a specific shape, so it remained flexible and fully collapsible, and it could be operated in batch mode. The chamber could be filled to approximately 300 L, in which case the surface-area-to-volume ratio was about SA : V = 0.1 cm−1. When it was inflated, it expanded to a maximum of about 100 cm in the third dimension. To reduce the risk of leaks, only one connector was installed at the front side of the chamber; this was used as both inlet (during filling) and outlet (during ongoing experiments).
3.1.1 Light source and photolysis rates
The chamber was irradiated by a solar simulator, as described in detail previously (Bleicher, 2012; Buxmann et al., 2012; Siekmann, 2018; Wittmer et al., 2015). The solar simulator was located underneath the chamber and consisted of seven metal-halide gas discharge medium-arc lamps (Osram, HMI 1200 W; HMI is hydrargyrum medium-arc iodide) with a total power of 8.4 kW. A twofold bandpass filter was positioned in between the lamps and the chamber to better reproduce the natural solar spectrum. A 3 mm thick borosilicate glass plate (Schott, Tempax) was mounted approximately 1 m above the lamps to act as a UV filter. A 3 cm column of decalcified water on top of the glass plate was used as both an IR filter and a cooling system. During the experiments, the water was circulated to prevent overheating.
The emission spectrum of the solar simulator was already available from a previous measurement by Bleicher (2012). However, ageing and replacement of the lamps, changes in the optical properties of the glass plate, or trace contaminations in the water layer can affect the photon flux. Therefore, we recorded an updated emission spectrum with a spectroradiometer (StellarNet, SILVER-Nova) in the wavelength range λ = 325–1000 nm. The instrument was equipped with a 14 µm slit (for a spectral resolution of 0.75 nm) and a CR2 cosine receptor calibrated with NIST-traceable calibration lamps. An aperture with 11 % transmission was used to extend the dynamic range. We performed 30 measurements in 15 different positions above the solar simulator to represent the spatial expansion of the inflated chamber. We selected three vertical planes (bottom, middle, and top) and five spots (middle, front, back, left, and right) in each plane. The final spectrum was derived as the average of these measurements. In order to characterize lower wavelength ranges, we compared our recorded spectrum to the old measurement by Bleicher (2012). We scaled the old spectrum to the new spectrum according to the data available in the spectral range of λ = 350–500 nm. This scaled spectrum was used for the wavelength range λ = 262–325 nm.
We calculated the photolysis rates of the individual compounds according to Eq. (1):
where J is the photolysis rate in s−1, λ is the wavelength in nm, ϕ is the quantum yield in molec. per photon, σ is the absorption cross section in cm2 molec.−1, and F is the photon flux of the solar simulator in photons cm−2 nm−1 s−1. Compound-specific absorption cross sections and quantum yields were taken from the literature (Table S1 in the Supplement). Whenever available, IUPAC-recommended values were selected. If such recommendations were missing, absorption cross-section data sets that were recorded at a temperature close to T = 298 K, had a high spectral resolution, and covered a wide wavelength range were selected. If no absorption cross section was available, we assumed that no substantial photolytic loss occurred and did not compile a photolysis rate. For the quantum yields, we used wavelength-specific values or distinct values assigned to a defined actinic range. Otherwise, we assumed a quantum yield of 1, which can be regarded as the upper limit. More details and visualization are provided in Sect. S1.1 and Fig. S1 in the Supplement.
To validate the recorded spectrum as well as the scaled spectrum in the UV range, we performed two actinometric experiments. Firstly, we evaluated the NO2 photolysis rate as described, for example, by Bohn et al. (2005). We injected 40 ppbv of NO2 (Rießner-Gase; 106 ppmv in N2) into the dark chamber in a zero air matrix. After allowing 15 min for mixing, the solar simulator was ignited to start the photochemistry. The photolysis rate of NO2 was calculated with NO2, NO, and O3 in a photostationary state (for details, see Sect. S1.2 and Fig. S2). Secondly, we measured the photolysis rate of methylglyoxal by injecting 120 ppbv of the pure compound into the chamber and observing the wall-loss-corrected decay while the chamber was irradiated (see Sect. S1.2 and Fig. S3). Both NO2 and methylglyoxal absorb in a broad UV-vis range (Table S1) and are hence useful to reference spectral data.
3.1.2 Wall losses
To obtain the individual wall losses, a solution containing all authentic standards was injected into the chamber in a dry N2 matrix at T = 298 ± 1 K (c = 12.3 × 10¹⁰ molec. cm−3; see the description of SPME-GC-MS calibration in Sect. 3.2.1). We then recorded five consecutive SPME-GC-MS measurements in the dark. For each compound, the relative response was plotted against time, and the first-order loss rate in s−1 was derived by exponential regression. In order to characterize compounds without available authentic standards as well, we developed a parameterization of these empirical rates as a function of their vapour pressure, molecular weight, and oxygen-to-carbon ratio, as described in more detail in Sect. 4.1.2.
3.2 Analytical instrumentation
While the SPME-GC-MS enabled the quantitative and isomer-resolved analysis of photooxidation products, the PTR-ToF-MS was used for analysing the sum of isomers at a high temporal resolution, for suspect screening, and for monitoring toluene as the precursor VOC. All solvents and authentic standards were purchased in the highest available purity (see Sect. S2.1). The instrumental setup was complemented by NOx and O3 analysers (see Sect. S2.2).
3.2.1 SPME-GC-MS for isomer-resolved VOC product analysis
The SPME-GC-MS setup included an SPME autosampler unit (PAL, RSI 85), a gas chromatograph (Agilent, 7890B), and a mass spectrometer (Agilent, 5977A; Xtr 350 electron ionization source; single quad). The GC-MS was operated using splitless injections and a standard HP-5MS column ramping from a temperature of 45 to 280 °C and using both scan and selected-ion-monitoring (SIM) modes. Details on the instrumental settings are listed in Table S2. The selected SPME fibre had a mixed polydimethylsiloxane (PDMS) and divinylbenzene (DVB) coating (Agilent, 5191-5873, PDMS/DVB, 65 µm thickness). Joint PDMS/DVB coatings are bipolar and combine extraction mechanisms based on absorption and adsorption. They are not only well suited for the analysis of oxygenated products, but they also have a high affinity for nitro-aromatic compounds and amines such as PFBHA. We exchanged the SPME fibres every three to four experiments.
We adopted the on-fibre double-derivatization method of Borrás et al. (2021), including (1) the extraction of PFBHA as a carbonyl reagent, (2) the on-line sampling of the gas-phase photooxidation products, (3) the extraction of MSTFA as a hydroxy and carboxylic reagent, and (4) the thermal desorption of the derivatized compounds from the fibre into the GC-MS inlet. The derivatization reagents were prepared freshly for each experiment in 20 mL glass vials. A PFBHA solution (2 mL; c = 85 mg L−1 in H2O) was made from a concentrated stock solution (c = 850 mg L−1 in H2O) which was prepared weekly and stored in the dark at 4 °C. For the silylation reagents, 40 µL of MSTFA was mixed with 10 µL of trimethylchlorosilane (TMCS) as catalyst for a higher silylation efficiency. At the beginning of each SPME-GC-MS sequence, the fibre was conditioned at elevated temperature (T = 240 °C) in an inert N2 environment. If a new fibre was used, it was placed in the conditioning cell for 60 min. If an old fibre was re-used, it was first cleaned with methanol (3 min of immersion and 10 min of desorption) and then conditioned for 30 min. The steps in each subsequent sampling cycle are summarized in Table S3 and were automated via the SPME autosampler unit. Including fibre-conditioning times, an entire run took 41 min.
A customized PTFE sampling cell (Fig. S4) was placed in the SPME-GC-MS sample tray, enabling the on-line extraction of the photooxidation products (for details, see Sect. S3.2). In the cell, the fibre was placed perpendicular to the sample air flow for better sampling efficiency (Gómez Alvarez et al., 2012). We used a flow rate of 5 slpm to accommodate the limited chamber volume and to prevent excessive physical stress on the fibre while still providing enough mass for analysis and enabling fast equilibration and transportation through the transfer line. The resulting air velocity was 131 cm s−1, which is well above the critical value of 10 cm s−1 (Gómez Alvarez et al., 2012). The calculated Reynolds number of Re = 760 indicates laminar flow conditions. To maintain comparable conditions between the experiments and to reduce losses, the transfer line from the chamber to the sampling cell (∼ 6 m length and 6 mm inner diameter) was temperature-controlled to 50 °C.
Table 1List of all compounds monitored by SPME-GC-MS. Compound-specific abbreviations (Abb), retention times (RT), and molecular weights (MW) are given. The functional groups amenable to oxime formation (PFBHA derivatization) or silylation (MSTFA and TMCS derivatization) are denoted as aldehydes (CHO), ketones (C=O), alcohols (OH), and carboxylic acids (COOH). The selected-ion-monitoring (SIM) masses refer to the derivatized compounds. Internal standards (ISTDs) were assigned based on the derivatization mechanism (acetophenone-d8 for oxime formation; phenol-d6 for silylation). Compounds are sorted according to their retention times. Horizontal lines mark the time segments starting at 4.0, 9.8, and 15.0 min, respectively.
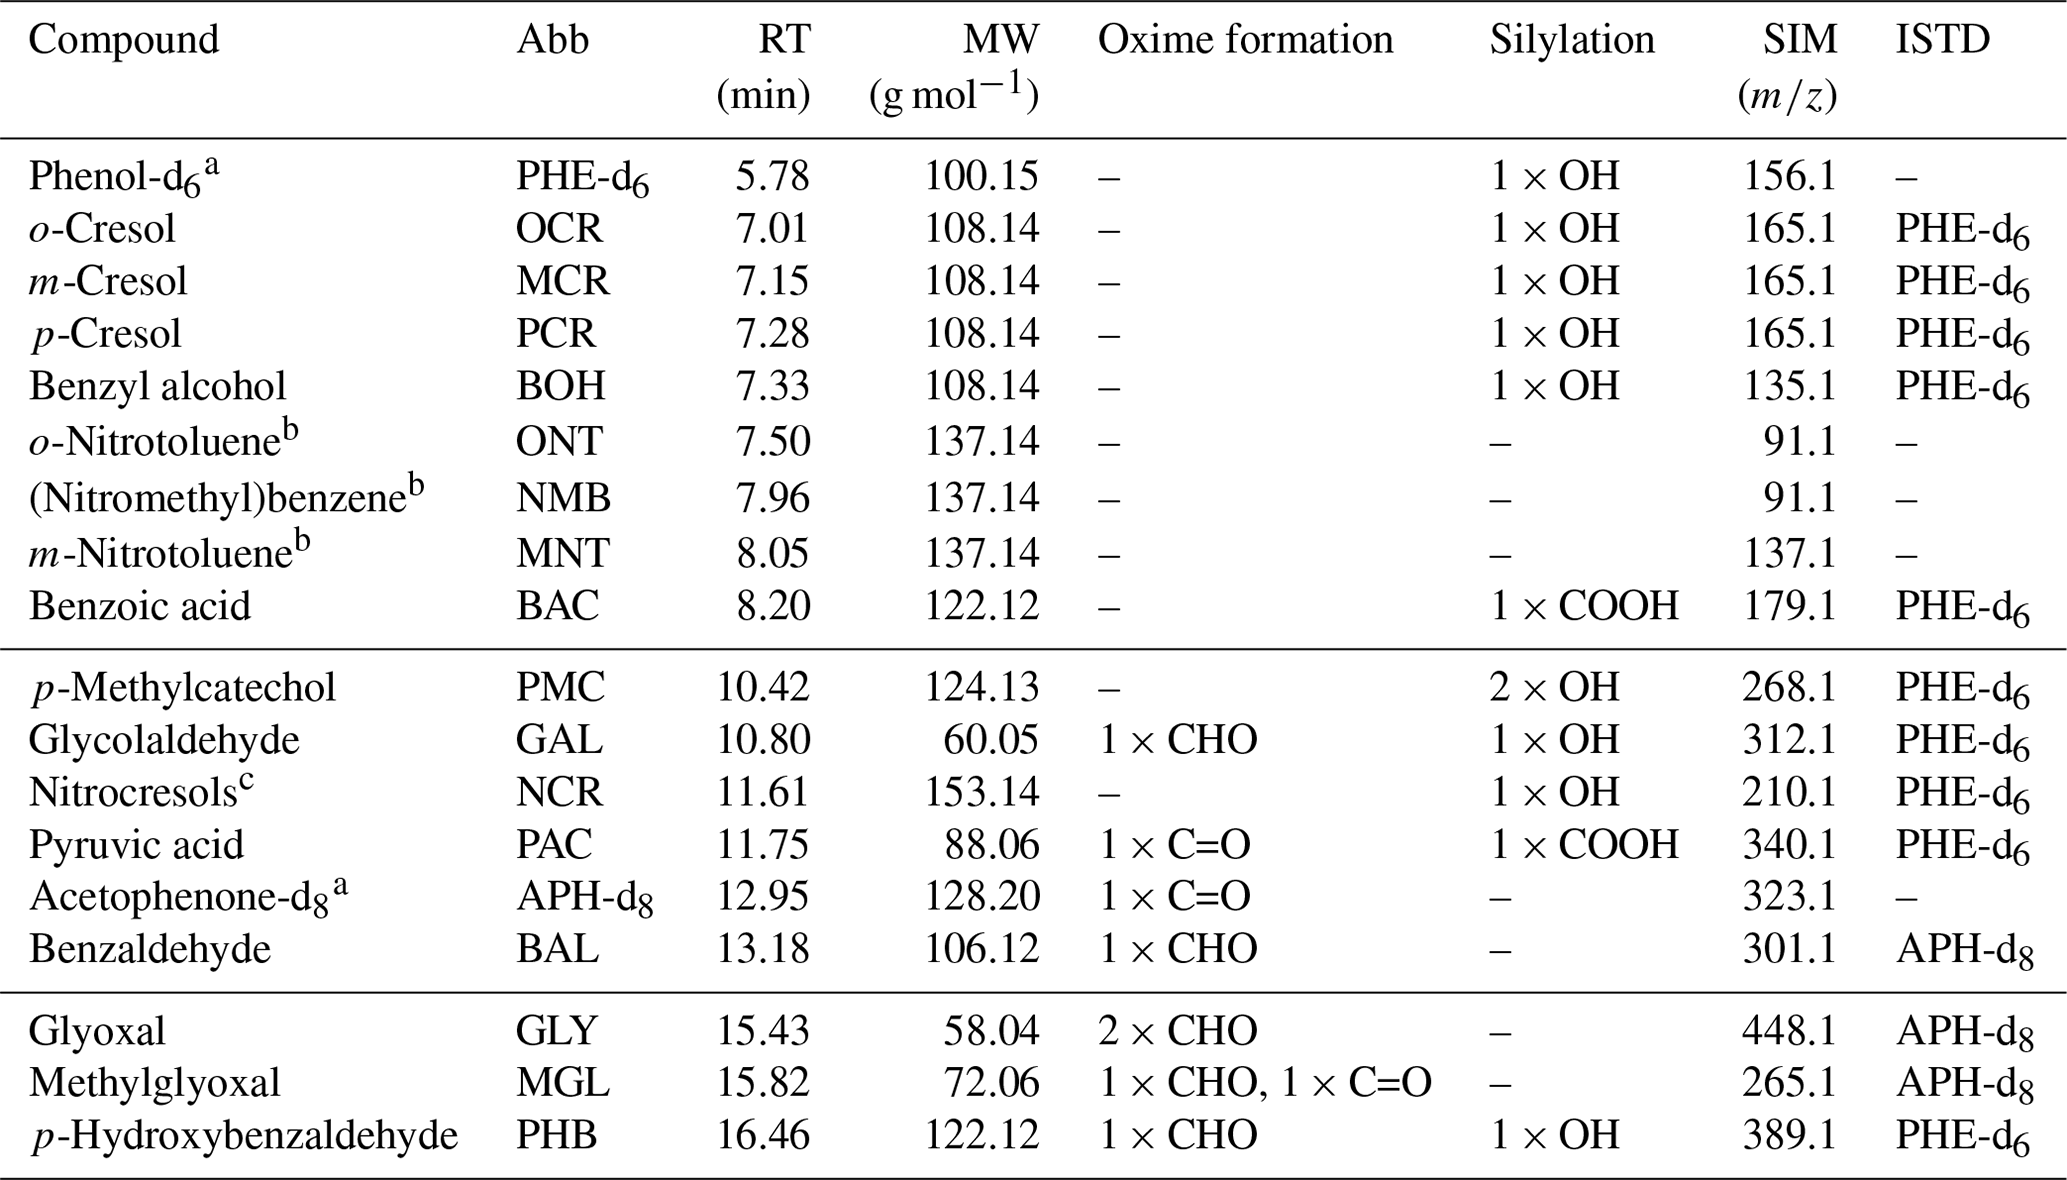
a Internal standard. b Only an NO2 functional group. c Co-elution of 2-nitro-p-cresol and 6-nitro-m-cresol.
We used two internal standards (ISTDs) to correct for the general variability of SPME fibres (Tumbiolo et al., 2004) as well as for variations in the derivatization efficiency. These ISTDs were added into the transfer line between the chamber and the SPME-GC-MS sampling cell by means of a customized permeation source (for details, see Sect. S3.3 and Fig. S5). To validate the temporal stability of the permeation source, the enriched outflow was monitored over a period of 1 week by PTR-ToF-MS. Phenol-d6 was used to correct alcohols and carboxylic acids (derivatized by MSTFA and TMCS), while acetophenone-d8 was used to correct aldehydes and ketones (derivatized by PFBHA). Multifunctional compounds were assigned to the specific ISTD associated with the higher R2 value of the ISTD-corrected calibration curve. Compounds lacking functional groups amenable to the derivatization scheme were not ISTD-corrected (Table 1).
We tested several known toluene oxidation products. The retention times and SIM masses of the compounds which were included in the final method are provided in Table 1. The SIM masses were selected based on the electron ionization (EI) mass spectra measured for the authentic standards. We considered only those SIM masses which result from mass shifts and fragmentations that are typical for the respective derivatization process (for details, see Sect. S3.4 with Figs. S6 and S7). Thus, we ensured an unambiguous assignment of the quantified ion to the derivatized compound structure. This was necessary so that the internal standards, which were also specifically monitored in their derivatized forms, could provide a meaningful correction. Additionally, we made sure to select ions which were still specific to the original molecular structure instead of reagent fragments such as 181 for PFBHA. These non-specific reagent fragments can be dominant and therefore increase sensitivity, but they are more prone to interference from compounds with similar functional groups and the same or a similar retention time. For each compound, we selected the most abundant ion in the EI spectrum that fulfilled these criteria. Additional information on the peak systems and the measured ions is given in Table S4.
To account for losses in the transfer line, the extraction from the sampling cell, and the on-line ISTD addition, we calibrated the analytes determined by SPME-GC-MS directly from within the chamber. Joint stock solutions of the analytes were prepared in acetonitrile (ACN) at six different concentrations (c = 0, 0.05, 0.1, 0.2, 0.3, and 0.5 mM). For each calibration level, 125 µL of the solution was injected into an installed round-bottomed flask and flushed into the chamber with a 5 slpm N2 flow. After 15 min, the flask was heated to 60 °C for 5 min to ensure complete vaporization. Once the chamber was completely filled, three samples were measured by the on-line SPME-GC-MS system consecutively. The active sampling scheme used during the calibration was exactly the same as that used during the experiments (Sect. 3.3.1). For the entire calibration, the ambient temperature was controlled at T = 298 ± 1 K. In between the different calibration levels, we cleaned the chamber, the introduction system, and the sampling system thoroughly. Each calibration level was preceded by a blank measurement of the chamber to account for remaining carry-over. With a total chamber volume of about 300 L, the calibration levels spanned between c = 0–12.3 × 10¹⁰ molec. cm−3, corresponding to mixing ratios of approximately 0–5 ppbv at standard pressure. The acquired responses of the analytes were corrected for the ISTD response, the blank value, and the determined wall loss rate. For each compound, a linear regression of these corrected relative responses against the concentration in molec. cm−3 was performed and forced through the origin. We calculated the limits of detection (LODs) as 3 times the standard deviation of the blank calibration sample. For most tested compounds, the LOD was in the low pptv range (median = 10.75 pptv at T = 298 K and standard pressure; Table 3 in Sect. 4.2.1).
For the chamber experiments, we calculated the total error of the concentration (quantification error) from the propagation of the compound-specific instrumental error, the calibration error, and the experimental error. The instrumental error (5 %–52 %; Table 3 in Sect. 4.2.1) was obtained as the mean of the relative standard deviations (RSDs) for each calibration level. It was primarily affected by the GC-MS response, the derivatization procedure, fibre effects, and peak integration. Furthermore, it reflects the degree to which the ISTD response and the analyte response co-varied. The calibration error (18 %) included the preparation and stability of the calibration solutions and their vaporization and transportation into the chamber. The experimental error (10 %) resulted from variations in the flows and injections during chamber filling and was calculated from the variability of the monitored toluene start concentrations across all experiments.
3.2.2 PTR-ToF-MS for VOC and product screening with high temporal resolution
The PTR-ToF-MS used in this work (IONICON, PTR-TOF 4000) has a mass resolution of > 4000 (full width at half maximum) for > 147. It is equipped with a multichannel plate (MCP) detector and an internal permeation source, 1,3-diiodobenzene (C6H4I2), to calibrate the mass axis continuously. We operated the instrument with a drift tube pressure of 2.6 mbar and a reduced electric field strength of = 95 Td. For all PTR-ToF-MS data shown here, hydronium reagent ions (H3O+) were used as the primary ion (PI) in order to enable ionization with low fragmentation and to accommodate the analysis of diverse classes of products (Lindinger et al., 1998; Romano and Hanna, 2018). During the experiments, the chamber air was sampled continuously through a in. PTFE line of about 5 m length with a flow of 50 sccm. Besides the analysis of toluene, we focused here on the quantitative analysis of the major photooxidation products. All compounds were measured at their protonated masses (Table S5). For toluene, we monitored the 13C isotope at 94.0716 to avoid artefacts related to peak saturation. We averaged all data in the experiments and the calibrations by the minute.
All PTR-ToF-MS calibrations were performed from the chamber to better mimic the conditions and losses during the experimental measurements. For the photooxidation products, the general procedure was analogous to the SPME-GC-MS calibration, except that the calibration solutions were prepared in water instead of ACN. The aqueous matrix was necessary to avoid solvent mixing ratios in the chamber in the ppmv range, but it limited the range of studied compounds to those soluble in water. We calibrated the cresols, benzyl alcohol, benzaldehyde, glyoxal, and methylglyoxal. The change in relative humidity during the calibrations compared to the experiments was negligible, as only 125 µL water was injected into the 300 L chamber. For each calibration level, the PI-normalized signal was averaged over a stable time frame of 15 min after equilibration. The calibration curves were derived from the blank-corrected values and forced through the origin. The LODs were calculated as 3 times the standard deviation of the response obtained during an instrumental blank measurement that was performed with an activated charcoal filter. Except for glyoxal (LOD = 1827.8 pptv), the LODs varied between 0.5 and 4.8 pptv (Table S6). As in the case of the SPME-GC-MS, we derived the instrumental error as the mean RSD of all calibration levels and calculated the quantification error from the propagation of the instrumental error (1 %–2 %, except for glyoxal, with 89 %; Table S6), the calibration error (18 %), and the experimental error (10 %).
For the toluene calibration, we evaluated the measured signal in the filled chamber after equilibration and prior to the ignition of the solar simulator. As we always used the same start concentration of toluene, we averaged the measured response across all experiments (Sect. 3.3). These experiments were carried out over a period of 6 weeks. During this time, we did not observe a substantial drift in the sensitivity of the instrument. We performed a two-point calibration of toluene using the mean signal for its calculated start concentration of c = 3.79 × 10¹² molec. cm−3 and the blank value of the cleaned chamber. The overall quantification error was 10 %, calculated as the propagation of the instrumental error (0.30 %) and the experimental error (the variability of the monitored start concentrations, 10 %).
To highlight the benefit of the combined analytical instrumentation, we also aimed to resolve the C7H8O isomers in the PTR-ToF-MS signal. In a first step, we compiled a weighted calibration similar to, for example, the work by Koss et al. (2018). Therefore, we performed separate calibrations for each of the three cresol isomers and benzyl alcohol. These calibrations were conducted on-line from the BATCH Teflon chamber analogously to the joint PTR-ToF-MS calibration. All compounds were analysed at the protonated mass of 109.0626, yet the instrumental response of each of the isomers was derived individually. To analyse the sum signal during the photooxidation experiments, we calculated the weighted sensitivity for each of the isomers as the product of its instrumental sensitivity and its relative abundance. Since benzyl alcohol did not have any signal at this mass (Table S6), only the cresol isomers were included in the weighted calibration. Their relative abundances were derived as fixed values from the formation yields determined with the SPME-GC-MS data (Sect. 4.3.2). According to Eq. (2), the sum of these weighted sensitivities was used as the weighted calibration factor for the 109.0626 signal (Table S6). From the correctly quantified sum signal, we later extracted the experimental concentrations of the individual cresol isomers using the same fixed relative abundances.
3.3 Photooxidation experiments and data analysis
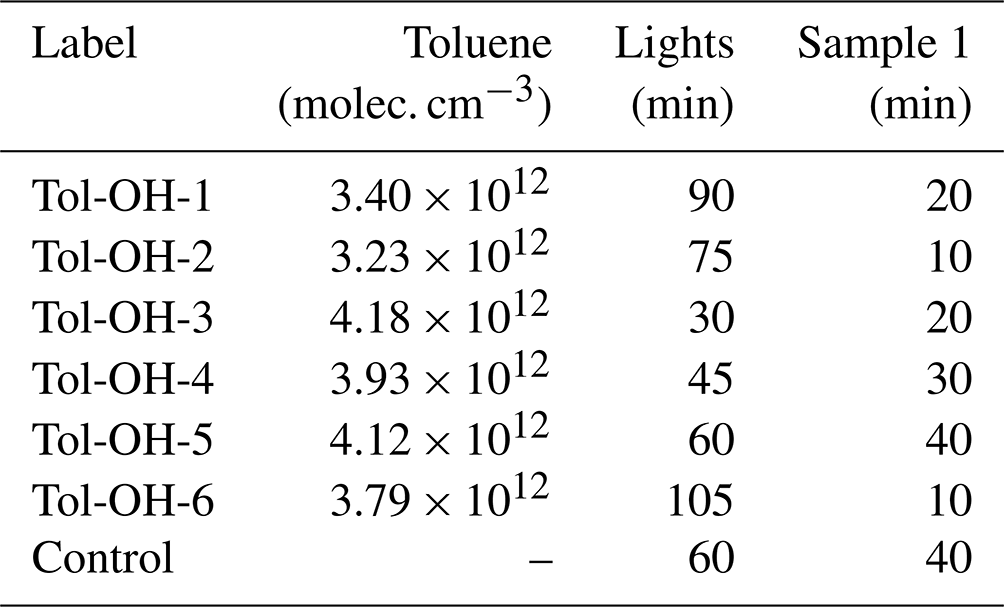
In total, we performed 18 experiments at different temperatures and with different initial NOx mixing ratios for method development purposes. To evaluate the product formation yields and gain mechanistic insight into the toluene chemistry, we focused here exclusively on six NOx-free toluene–OH photooxidation experiments at T = 298 ± 1 K and different degrees of photochemical ageing (Table 2). These experiments were performed first to avoid the risk for contamination and wall sources of NOx (e.g. Rohrer et al., 2005). We decided to work with an excess of toluene to keep secondary chemistry to a minimum and produce sufficient product mass for analysis.
Table 2List of NOx-free experiments conducted at T = 298 ± 1 K. The monitored start concentration of toluene varied around the calculated start concentration of c = 3.79 × 10¹² molec. cm−3. The timing of the first (and all consecutive) SPME-GC-MS samples was varied to better constrain formation yields. For all experiments, we obtained four SPME-GC-MS samples, resulting in total experimental durations of about 3 h.
3.3.1 Experimental protocol
Prior to each experiment, we cleaned the chamber and recorded blank values. To dilute and remove any remaining impurities, the chamber was filled with zero air and then fully evacuated three times in total. Zero air was prepared by purifying pressurized synthetic air with a commercial zero air generator (Messer Griesheim GmbH, SL 50). In the first flushing cycle, the solar simulator was ignited to promote the oxidation of potential residuals and their release from the walls. After the cleaning, we filled the chamber with zero air again and measured preliminary chamber blanks with the SPME-GC-MS and the PTR-ToF-MS to confirm the cleanliness of the chamber and to test the instrumental performances. For the SPME-GC-MS, this concerned in particular the condition of the SPME fibre, as indicated by the PFBHA and ISTD responses. For the PTR-ToF-MS, the background concentration of toluene was obtained. After these checks, the chamber was completely evacuated in preparation for the experiment. The temperature was set to the target value.
Upon the completion of the preparatory work, we added the reagents sequentially. First, we introduced the VOC precursor into the chamber. The pure compound was injected through a septum into a 100 mL round-bottomed flask, which was then flushed with N2 used as a pick-up flow (5 slpm) for 15 min. In this work, we used 0.2 µL toluene (Roth, ≥ 99.9 % purity), equivalent to a target concentration of 3.79 × 10¹² molec. cm−3 (154 ppbv at T = 298 K and standard pressure). Second, hydrogen peroxide (H2O2) was added as an OH radical precursor by filling 3 mL of a 50 % aqueous solution (Sigma Aldrich) into a 5 mL impinger to enrich a flow of N2 (100 sccm) which entered the chamber for 20 min. We selected H2O2 because it provides a NOx-free method of generating OH radicals and photolyses, even under the near-UV conditions in the chamber. If needed, NO was then introduced directly from a gas cylinder (Rießner-Gase GmbH; 2.88 ppmv in N2). Finally, the chamber was filled to 300 L with zero air (10 slpm). All flows were regulated by mass flow controllers and determined with flow meters.
After complete filling was achieved, the SPME-GC-MS, the PTR-ToF-MS, and (if needed) the NOx and O3 analysers were connected to the chamber. The true experimental blank of the oxidation products was obtained in the presence of toluene and H2O2, and the start concentration of toluene was monitored. Afterwards, the solar simulator was turned on to initiate the photooxidation chemistry. The lights were kept covered for 3 min after ignition, as the emission from the lamps during this warm-up period is generally small and not reproducible (Bleicher, 2012; Wittmer et al., 2015). The start of the oxidation process was marked by the uncovering of the lights. For each SPME-GC-MS sample, the vacuum pump for active sampling was started 3 min prior to the on-line extraction and stopped again afterwards in order to conserve chamber volume but still allow sufficient time for equilibration. Since all instruments were attached to the same outlet line of the chamber, the PTR-ToF-MS sample flow (50 sccm) was affected by the active sampling of the SPME-GC-MS pump (5 slpm) every 41 min. This effect was minimized by attaching the PTR-ToF-MS transfer line as closely as possible to the chamber (∼ 5 cm distance from the chamber interior). Remaining artefacts in the PTR-ToF-MS signal were corrected by linear interpolation using the data acquired 2 min before and after the SPME-GC-MS pump was turned on, respectively.
During the experiments, the chamber was never emptied to less than 30 % of its initial volume to avoid (i) too high surface-area-to-volume ratios and an increased importance of wall effects as well as (ii) contamination through leaks. After all the data were collected, the chamber was completely evacuated and then cleaned three times (zero air filling and subsequent evacuation). In the final cycle, the chamber was evacuated by the SPME-GC-MS pump to also clean the transfer line and sampling cell.
For each experiment, air pressure data were retrieved from the weather station at the Botanical Garden of the University of Bayreuth (4 km distance from the atmospheric chemistry laboratory) and averaged over the experimental time frame. We measured the relative humidity in the chamber in one of the experiments and derived a value of 0.1 %. This is consistent with the composition of the air mixture, since the only source of water in the chamber was the N2 flow enriched with the H2O2 H2O solution, accounting for only 2 L of the 300 L total chamber volume in all performed experiments.
3.3.2 Initial data treatment
The raw GC-MS data were processed using MassHunter (GC/MS Data Acquisition v10.1.49, Qualitative Analysis v10.0, and Quantitative Analysis v10.2) for peak integration. All further data analysis was performed in Python (v3.9.7). After normalizing the responses to the assigned ISTDs (relative responses), they were blank subtracted and converted to concentrations in molec. cm−3. For the PTR-ToF-MS data, we used the IONICON Data Analyser (v2.1.1.2) for mass axis calibration, peak definition, and PI normalization. In Python, we compiled mean values per minute, subtracted blank values, and applied the calibration factors.
3.3.3 Loss corrections
Corrections for compound-specific physical and chemical losses were needed to obtain the true formation yields of the studied photooxidation products. In the present work, these losses included wall losses, photolysis, and secondary OH radical reactions. As we evaluated the yields for NOx-free conditions, secondary reactions with O3 and NO3 radicals acting as competing oxidants were irrelevant. We corrected the losses for each discrete data point iteratively in order to account for the simultaneous formation and loss of the photooxidation products. The calculation is shown in Eq. (3):
where ΔL(Δt) is the absolute loss (in units of molec. cm−3) that occurred over the time span between two given data points. This loss is defined by , the mean value of the measured concentrations ct and ct−1 in molec. cm−3; Δt, the time span between the two data points in seconds; and k, the first-order loss rate constant for the specific loss process in s−1. The total product concentration formed up to a given point in time, the loss-corrected concentration hereinafter, entails both the measured concentration and the cumulative loss that occurred from the beginning of the experiment (Fig. S8). The loss-corrected concentration of a given data point is therefore calculated as the sum of the loss-corrected concentration of the previous data point , the absolute loss that occurred since that point in time ΔL(Δt), and the measured difference between these two data points Δc(Δt) (all in molec. cm−3).
This procedure is based on the approach described by Galloway et al. (2011) but was adapted for the low temporal resolution of the SPME-GC-MS method by relating the loss term to rather than to the measured concentration of the previous data point. The calculation was performed for each of the three loss processes individually so as to better account for the conditions in the chamber, e.g. light or dark, and in order to derive the absolute losses associated with each process. All three corrections were implemented with reference to the measured data and then summed to derive the final loss-corrected concentration (Fig. S8). The calculations were performed for the SPME-GC-MS and the PTR-ToF-MS analogously. In cases where different compounds with an unknown distribution contributed to a sum signal at the PTR-ToF-MS, we selected the rate constants of the compound which we assumed to be most abundant.
Both the wall loss rates and the photolysis rates were available as first-order rate constants. While wall losses were corrected for the entire experimental duration, photolytic losses were corrected only for the periods in which the solar simulator was ignited. To treat the reaction with OH radicals using the same correction formula, we converted the second-order reaction of any of the analytes with OH radicals to a pseudo first-order approach. For this purpose, we referred to the OH exposure as the time-integrated OH radical concentration, as shown in Eq. (4):
where OHexpt is the OH exposure between time t and the beginning of the experiment in units of molec. cm−3 s, [OH] is the OH radical concentration in molec. cm−3, ΔOHexp is the difference in OH exposure between the two data points in molec. cm−3 s, k′ is the pseudo-first-order rate constant in s−1, and k is the second-order rate constant in molec.−1 cm3 s−1. The second order rate constants for the reactions of the photooxidation products with OH radicals were obtained from the IUPAC recommendations and the scientific literature (Table S7). To circumvent the need for direct OH radical measurements, the OH exposure at a given point in time was calculated based on the observed decay of toluene, as shown in Eq. (5):
where OHexpt and OHexpt−1 are the OH exposures determined for the time steps associated with the target data point and the previous data point in molec. cm−3 s, [toluene]t and [toluene]0 are the concentrations of toluene at the given point in time and at the beginning of the experiment in molec. cm−3, and ktoluene+OH = 5.6 × 10⁻¹² molec.−1 cm3 s−1 is the well-characterized second-order rate constant of toluene with OH radicals (IUPAC, 2024). Based on the temporally resolved OH exposure (available at minute resolution according to the toluene data set), we used the relationship in Eq. (4b) to calculate OH radical concentrations averaged over the time intervals between t and t−1 according to Eq. (6):
3.3.4 Yield calculations
The formation yields of the first-generation products that we observed, identified, and quantified in the new chamber for T = 298 ± 1 K in the absence of NOx were calculated from a large data set assembled from six experiments (Table 2). For each compound, we plotted the loss-corrected concentration against the change in toluene for a given point in time, performed a linear regression of the collected data set, and determined the yield as the slope of this regression. This approach helps to minimize the impact of the random error by regressing over a broad range of precursor losses (e.g. Atkinson et al., 1989; Olariu et al., 2002). We included only those data for which the non-corrected value was higher than the LOD to enhance accuracy and reliability. Since the data acquired at the end of the experiments were more affected by secondary chemistry and chamber effects, we considered only the data obtained while the chamber was irradiated as well as the first sample in the dark in case of the SPME-GC-MS.
An exemplary time series of toluene and its ring-retaining first-generation products for one of the experiments at T = 298 ± 1 K under NOx-free conditions is shown in Fig. 3. While the chamber was irradiated, OH radicals were generated and caused a decrease in toluene and the formation of products. No loss of toluene was observed after the lights were turned off, indicating the termination of the oxidation chemistry in the absence of photolytic OH radical generation.
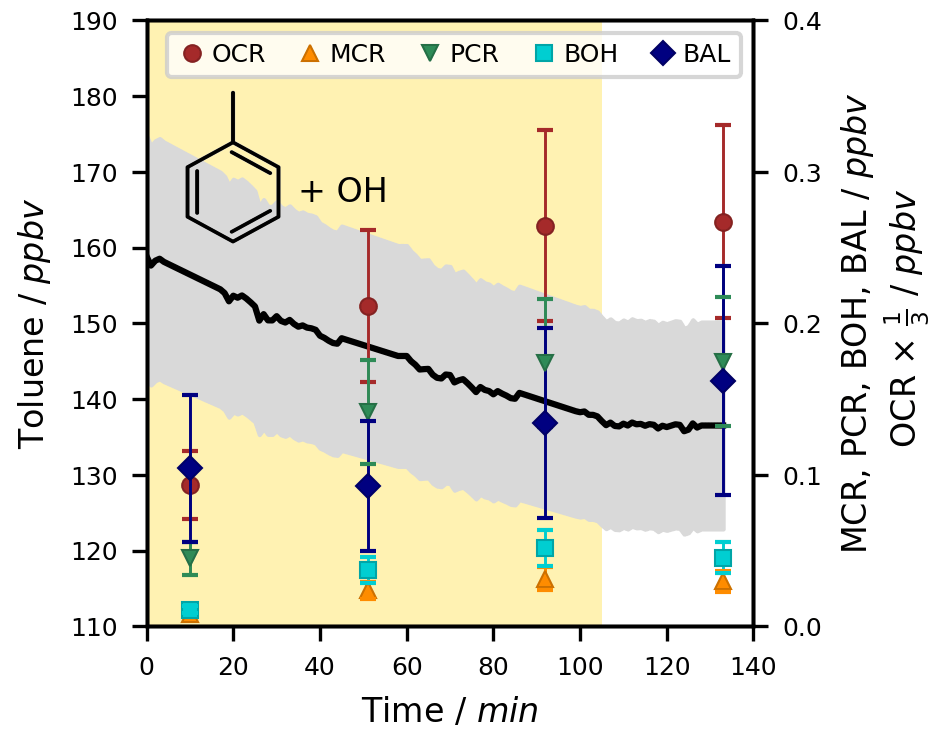
Figure 3Exemplary time series for the OH-radical-induced photooxidation of toluene at T = 298 ± 1 K in the absence of NOx. The temporal profiles of toluene and its ring-retaining first-generation products in experiment Tol-OH-6 are shown. Toluene was determined by PTR-ToF-MS (black line; quantification error shown as the grey area), while the products were analysed using the on-line double-derivatization SPME-GC-MS method (quantification error shown as error bars). No loss corrections were applied to the depicted data. The area shaded in yellow represents the period in which the chamber was irradiated. Toluene products in this figure include o-cresol (OCR), m-cresol (MCR), p-cresol (PCR), benzyl alcohol (BOH), and benzaldehyde (BAL).
Under the studied conditions, the OH radical reaction was the only relevant sink of toluene, so the change in its concentration could be directly used for the calculation of OH radical concentrations and product formation yields. The photolysis rate of toluene in the irradiated chamber was calculated to be as low as J = 3.78 ± 1.44 × 10⁻⁷ s−1 (Table S1). Due to the high vapour pressure (21.78 torr at T = 293 K; Munday et al., 1980) and the low degree of functionalization of toluene, losses to the chamber wall were not substantial.
4.1 Chamber characterization
The new BATCH Teflon chamber was built for the purpose of studying multifunctional gas-phase products. Losses and uncertainties in the quantification of these target species result from, amongst other reasons, the interaction with the chamber setup. Thus, we first characterized the spectrum of the solar simulator. Secondly, we derived typical wall losses of the photooxidation products and proposed a chamber-specific parameterization. Thirdly, we assessed possible carry-over and artefacts.
4.1.1 Solar simulator spectrum and photolysis rates
The measured emission spectrum of the solar simulator is shown in Fig. 4a. On average, the emission intensity of our recorded spectrum was about 3 times higher compared to the previous measurement by Bleicher (2012), which was obtained by differential optical absorption spectroscopy (DOAS) and normalized to the empirical Cl2 photolysis rate. This difference could relate to the specific emission and age of each lamp or to the vertical distance at which the previous spectrum was recorded. Meanwhile, the same qualitative features are visible in both spectra. Using the newly measured spectrum (λ = 325–1000 nm) and the spectrum scaled from the old data set (λ = 262–325 nm), the NO2 photolysis rates calculated theoretically (2.07 ± 0.79 × 10⁻² s−1) and derived experimentally (2.32 ± 1.99 × 10⁻² s−1; Fig. S2) agree within 12 %. For methylglyoxal, the experimental photolysis rate (3.66 ± 0.56 × 10⁻⁴ s−1; Fig. S3) is 21 % higher than the calculated value (3.02 ± 1.15 × 10⁻⁴ s−1), yet the uncertainties of these rates overlap. Hence, the updated spectrum with the scaled data in the UV range allows us to reliably derive photolysis rates in the BATCH Teflon chamber.
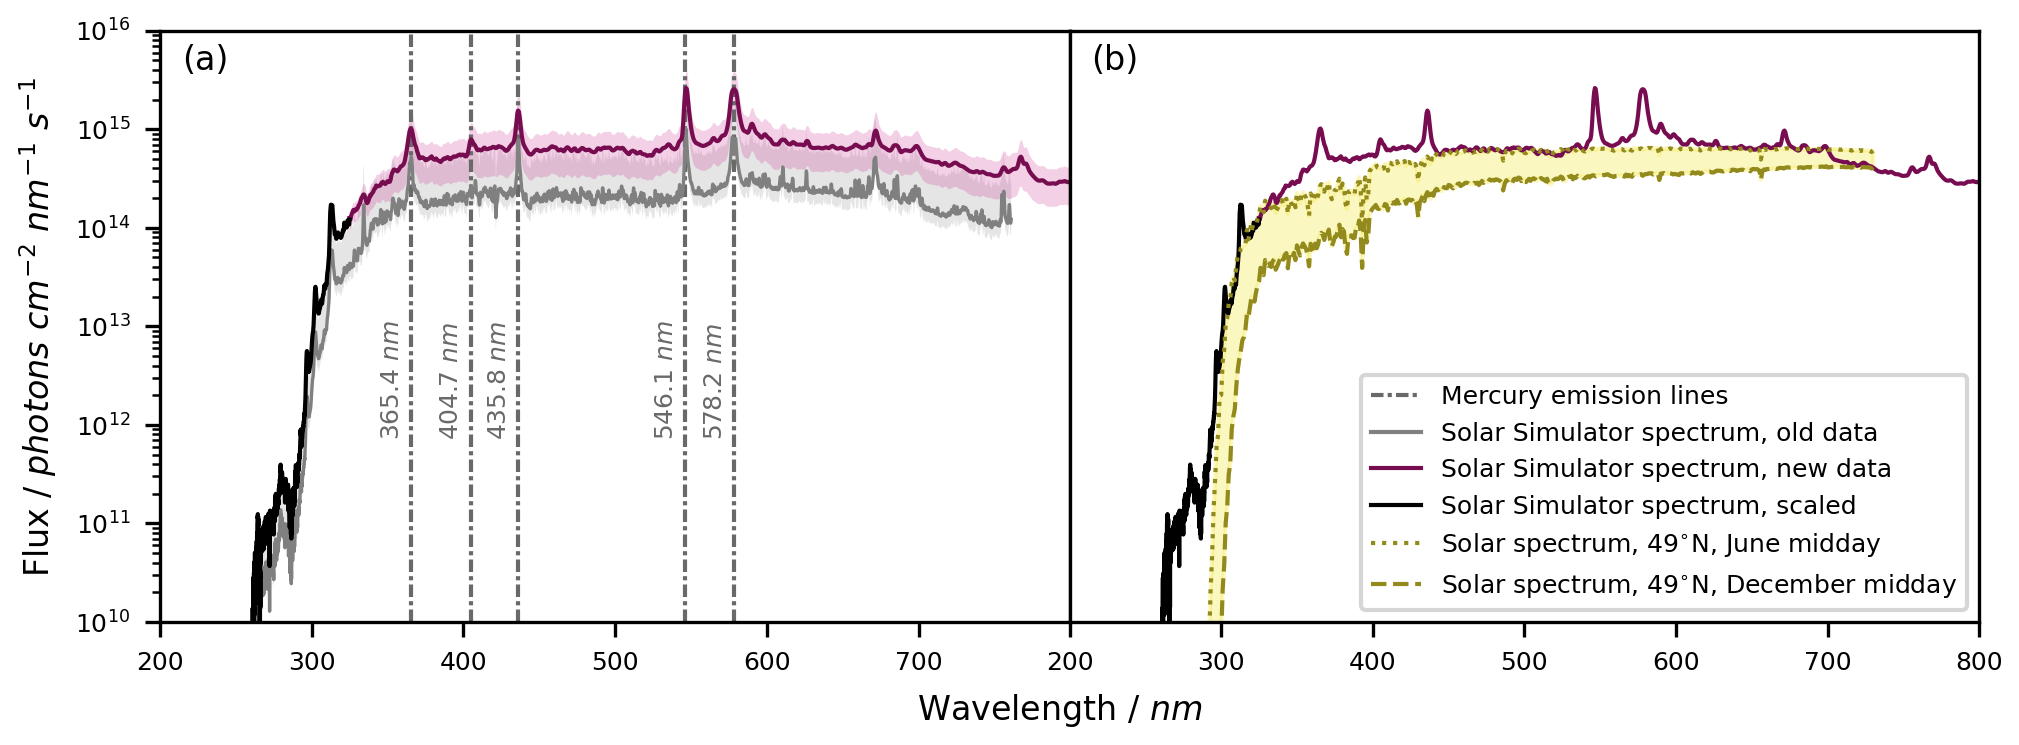
Figure 4Solar simulator emission spectrum. (a) The emission spectrum of the solar simulator (seven HMI lamps with a bandpass filter) obtained from an old measurement (Bleicher, 2012), the newly recorded spectrum, and the scaled spectrum in the wavelength range between λ = 262–325 nm (scaled by comparing the new data and the old data for the wavelength range λ = 350–500 nm). The new spectrum is shown as the mean ± standard deviation of 30 measurements at different positions above the solar simulator. The uncertainty in the old data results from the quantification of Cl radicals used to calibrate the actinic flux. The main Hg emission lines are shown. (b) The solar simulator spectrum compared against the natural actinic flux as calculated with the TUV radiation model for 49° N and midday in June and December, respectively (NCAR, 2024). The figure concept was inspired by Bleicher (2012).
The calculated photolysis rates of the studied oxidation products (Table S1) were in the range between 1.77 ± 0.67 × 10⁻⁸ s−1 (m-nitrotoluene) and 3.02 ± 1.15 × 10⁻⁴ s−1 (methylglyoxal). High photolysis rates of > 10−4 s−1 were determined for the carbonyl compounds benzaldehyde, glyoxal, methylglyoxal, and pyruvic acid. Specific quantum yields were mostly available for those compounds which are prone to absorb in the solar actinic spectrum and have therefore been extensively investigated with regard to their photochemistry, such as carbonyls and nitro compounds. For the studied alcohols and carboxylic acids for which no quantum yield was available in the literature, we determined maximum photolysis rates of < 2 × 10⁻⁵ s−1 with assumed quantum yields of 1. These loss rates do not substantially affect the chemistry and calculated concentrations over the course of the experiment, so overcorrections of the photolytic losses are negligible.
The emission of the solar simulator directly affected the photolysis of H2O2 and thereby the OH radical source. The photolysis of H2O2 generates OH radicals with a near-unity quantum yield (Vaghjiani and Ravishankara, 1990) and occurred at a rate of about J = 1.13 ± 0.43 × 10⁻⁵ s−1 in the irradiated chamber (Fig. S1, Table S1). For NOx-free experiments at T = 298 ± 1 K, the resulting mean OH radical concentration was [OH] = 4.89 × 10⁶ molec. cm−3 while the solar simulator was activated. This is comparable to tropospheric daytime OH radical levels, which typically peak in the range of 2 × 10⁶–8 × 10⁶ molec. cm−3 for similar latitudes (Altshuller, 1989). We did not observe any product formation in a test run without H2O2 addition, confirming that H2O2 photolysis is the main source of OH radicals.
By design, the HMI lamp housings filter radiation λ < 260 nm (Siekmann, 2018) in order to block for instance the 185 and 254 nm mercury emission lines. By shifting the UV absorption edge to about λ < 300 nm, the bandpass filter of the solar simulator reproduced a more realistic photon flux in the UV range. For comparison, Fig. 4b shows the resemblance between the solar simulator emission spectrum and the natural solar spectrum, as calculated for a latitude of 49° N with the National Center for Atmospheric Research (NCAR) Tropospheric Ultraviolet and Visible (TUV) radiation model v5.3 (NCAR, 2024) for midday in June and December.
4.1.2 Wall losses
The wall loss rates, which were determined empirically in this work for dry air at T = 298 ± 1 K (Table S8), ranged between 4.54 ± 1.80 × 10⁻⁶ s−1 (benzaldehyde) and 8.53 ± 0.68 × 10⁻⁵ s−1 (p-hydroxybenzaldehyde). These orders of magnitude are in line with reported vapour loss rates on Teflon films in the literature (McMurry and Grosjean, 1985; Zhang et al., 2015).
The dependence of wall losses on molecular properties has been investigated and described for other Teflon chambers by sophisticated gas–wall partitioning models which are, for example, based on the ideal gas law or on related parameters such as the saturation concentration (e.g. Matsunaga and Ziemann, 2010; Ye et al., 2016; Yeh and Ziemann, 2015; Zhang et al., 2015). These models also reveal fundamental relationships, such as an inverse link between wall loss rates and vapour pressure and an increase in wall losses with increasing carbon number, molecular size, and functionalization degree. Building on these findings, we developed a simple parameterization that is based on readily accessible parameters and expresses the wall losses of the toluene photooxidation products as first-order processes with a fixed rate constant. We tested several fundamental molecular properties alone and in combination for their ability to describe the empirical loss rates. The most influential parameter was the vapour pressure. We obtained the best fit (R2 = 0.80) when also including the molecular weight and oxygen-to-carbon ratio (O : C ratio) and reducing the impact of the vapour pressure by taking its square root (Fig. 5). We therefore propose the parameterization for the wall loss rate given in Eq. (7):
where WL is the wall loss rate in s−1, a is 6.49 × 10⁻⁵ s−1, b is −19.68 ()−1 g mol−1, and P is the parameter in g−1 mol. The parameter P entails the vapour pressure vp in mmHg, the molecular weight (MW) in g mol−1, and the dimensionless O : C ratio OC. We observed a different trend for nitro compounds without further functional groups and did not include their empirical wall loss rates when fitting the regression. The empirical and parameterized wall loss rates and their relative deviations are summarized for all oxygenated products in Table S8. With the exception of benzaldehyde and methylglyoxal, which both have small empirical loss rates with high uncertainties (< 2 × 10⁻⁵ s−1; uncertainties of 40 % and 32 %, respectively), the empirical and parameterized values agree to within 30 %.
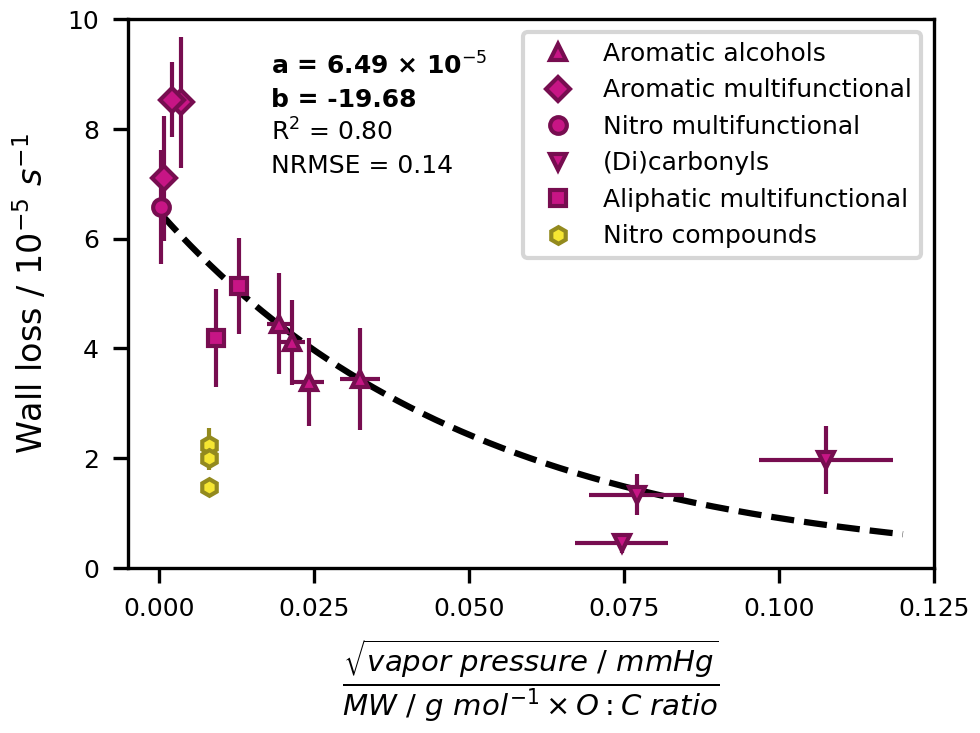
Figure 5Wall loss parameterization based on empirically determined wall loss rates. Error bars along the y axis are the normalized root mean square errors (NRMSEs) of the individual exponential regressions for the empirical wall loss determination. Error bars along the x axis show a generic 10 % error resulting from uncertainties in available vapour pressure data. Oxidation products with different functional groups are distinguished. Nitro compounds (nitrotoluene isomers and (nitromethyl)benzene) were not included as model input.
In a larger context, the presented parameterization provides the possibility to describe the chamber-specific wall loss of a multitude of oxygenated photooxidation products which cannot be tested empirically. For higher internal consistency, we used the parameterized loss rates for all studied compounds with hydroxy, carboxyl, or carbonyl groups. These values are associated with an uncertainty of 14 % according to the normalized root mean square error (NRMSE) of the parameterization.
The application of the parameterization is limited in that a reasonably well-constrained vapour pressure is required to make an explicit prediction. In the absence of such data, the loss rate can be approximated by generic values for clusters of compounds with the same functional group composition. Here, six groups of compounds could be clearly distinguished (see also Table S8). Using the fitted wall loss rates of all associated compounds, we derived generic loss rates (mean ± standard deviation) of 1.23 ± 0.32 × 10⁻⁵ s−1 for carbonyls and dicarbonyls (benzaldehyde, glyoxal, and methylglyoxal), 4.04 ± 0.38 × 10⁻⁵ s−1 for monohydric aromatic alcohols (cresols and benzyl alcohol), 5.23 ± 0.19 × 10⁻⁵ s−1 for aliphatic multifunctional compounds (glycolaldehyde and pyruvic acid), 6.23 ± 0.14 × 10⁻⁵ s−1 for aromatic acids and multifunctional compounds (benzoic acid, p-methylcatechol, and p-hydroxybenzaldehyde), and 6.44 × 10⁻⁵ s−1 for nitro compounds with additional hydroxy groups (nitrocresol isomers). The order of the associated wall loss rates (multifunctional compounds and acids > alcohols > carbonyls) agrees well with previous studies which have investigated the effect of the type (Yeh and Ziemann, 2015) and number (Lumiaro et al., 2021) of functional groups on partitioning coefficients of gaseous compounds to walls and particles. Although not included in the parameterization, nitro compounds can be described by their mean empirical wall loss rate of 1.90 ± 0.32 × 10⁻⁵ s−1.
It should be noted that the presented wall loss rates as well as their parameterization are valid only for dry conditions and a temperature of 298 K and may differ if experimental conditions change (Grosjean, 1985; Zhang et al., 2015). Furthermore, both the time frame over which we determined the wall losses empirically and the conducted photooxidation experiments were limited to 3 to 4 h. On longer timescales, desorption processes, wall saturation, and the equilibrium between the gas phase and the chamber walls need to be taken into account more specifically (Yeh and Ziemann, 2015; Zhang et al., 2015).
4.1.3 Cleanliness and quality control
To minimize carry-over effects and quantify chamber contamination, the cleanliness of the chamber was examined carefully prior to each experiment. During these checks of the pre-cleaned chamber, the product concentrations measured in the irradiated chamber and in the dark chamber agreed well within the instrumental error. Hence, there was no substantial desorption of residual compounds from the irradiated walls. In addition, we measured the experimental blank values from the filled chamber to prevent overestimations of product concentrations due to impurities and analytical artefacts related to the added reagents. For most compounds, these blank values were in a similar range to their respective LODs, several orders of magnitude smaller than their typical concentrations during the photooxidation experiments, and did not differ substantially among the different runs (Fig. 6).
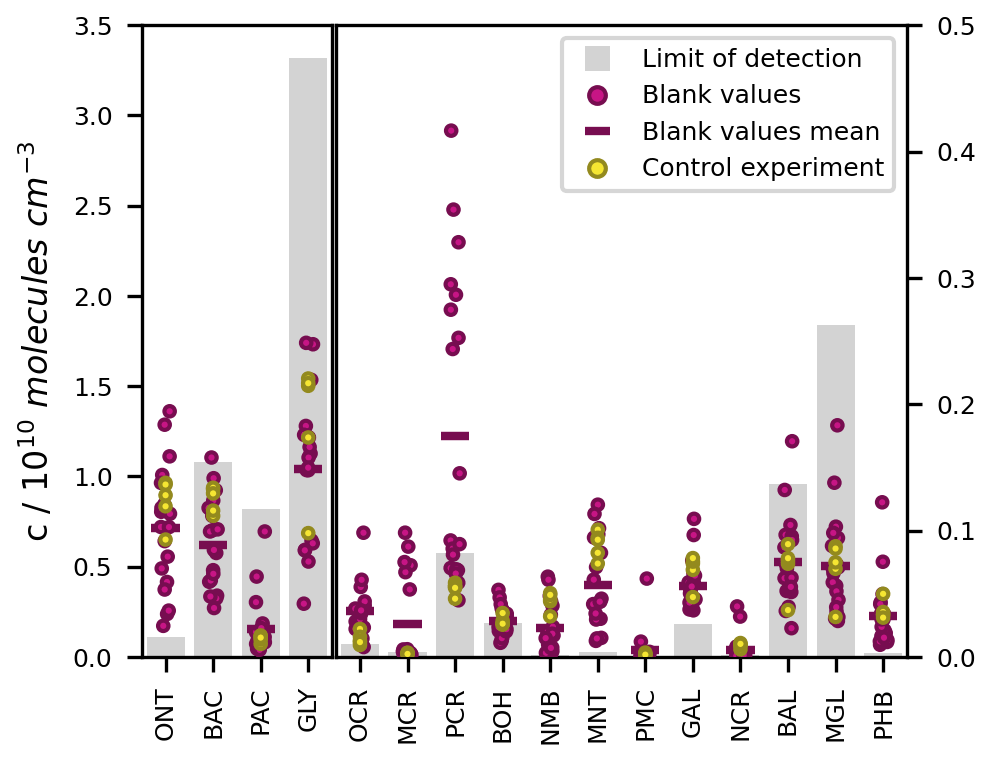
Figure 6LODs, blank values, and control experiment concentrations of the toluene photooxidation products measured by SPME-GC-MS. The LODs refer to the on-line measurement from the chamber. Blank values are shown for 18 separate experiments. The measured concentrations in the toluene-free control experiment are shown without blank subtraction or further loss corrections. All values are given as concentrations in molec. cm−3 because the LODs for the SPME-GC-MS were derived as fixed concentrations, whereas the corresponding mixing ratios varied between the experiments due to the ambient temperature and pressure.
To confirm that the observed product formation during the photooxidation experiments is solely attributable to the reaction of toluene with OH radicals, we conducted an additional control experiment in the absence of toluene (Table 2). The concentrations obtained in the course of this experiment are comparable to the measured blank values (Fig. 6). Hence, we conclude that the reacted toluene was the unique source of the products in our setup.
4.1.4 Best practice for future work
For future work, we propose a best-practice procedure to re-evaluate chamber properties when experimental conditions change and time progresses.
The qualitative pattern of the solar simulator emission spectrum is stable over time, yet we found a difference in the absolute photon flux of about a factor of 3 over the course of roughly 1 decade (Fig. 4a). Therefore, the spectrum should be recorded regularly. More frequent checks are needed when there is high experimental throughput or when new HMI lamps are inserted since each lamp is unique and metal depositions on the glass lead to a relatively quick loss of intensity at the beginning of the lamp lifetime (Bleicher, 2012).
Wall losses need to be re-assessed (i) for experiments performed at different temperatures, (ii) for experiments performed in humid air, (iii) for new VOC photooxidation systems with different compound structures and properties, (iv) for new chambers when the Teflon body is replaced (see below), and (v) for longer periods of time and more complex wall interactions if the experimental duration is increased.
Prior to every single experiment, the chamber needs to be carefully cleaned and evaluated for possible artefacts and contamination by recording chamber blank values. For each set of experiments, at least one control experiment without the VOC precursor should be performed. As the chamber is completely evacuated at the end of any experiment, it should still be empty when the next experiment is started. If this is not the case, leaks in the chamber body need to be fixed. A new Teflon body should be constructed after working with high concentrations of sticky compounds and/or NOx to avoid carry-over or the unintended formation of photochemically relevant species such as HONO (Bell et al., 2023; Rohrer et al., 2005).
4.2 Analytical performance evaluation: SPME-GC-MS and PTR-ToF-MS
While it was possible to quantify the isomers of functionally diverse photooxidation products at ppbv and pptv levels with the double-derivatization SPME-GC-MS method, its temporal resolution was limited to 41 min. In contrast, PTR-ToF-MS scans were averaged every minute with high precision and provided additional information about potential photooxidation products but without the possibility of distinguishing between isomers. Thus, here we combined the two analytical tools to extend and improve the information derived from the conducted photooxidation experiments, merging isomeric information from the SPME-GC-MS with the high time resolution from the PTR-ToF-MS.
4.2.1 SPME-GC-MS analysis and calibration of toluene products
For the compounds which could be analysed efficiently with the on-line SPME-GC-MS method, the determined calibration factors, associated errors, and LODs are listed in Table 3. Exemplary calibration curves are shown for the ring-retaining first-generation products in Fig. 7. No saturation effect is apparent in these curves, indicating that the calibration interval between c = 0–12.3 × 10¹⁰ molec. cm−3 is still within the linear range of the SPME fibre. As all tested toluene products were injected jointly during the calibration, the total mixing ratio of the products reached about 85 ppbv for the highest calibration level. During the NOx-free photooxidation experiments, the loss of toluene and hence the maximum production of oxygenated compounds (as C7 equivalents) was about a factor of 4 or more lower than that, so the sampling capacity of the fibre was likely not exceeded. We observed the lowest sensitivity for compounds that underwent both derivatization steps (glycolaldehyde, pyruvic acid, and p-hydroxybenzaldehyde) and the highest instrumental sensitivity for the non-derivatized nitrotoluene isomers and (nitromethyl)benzene. This is partly due to the selection of ions for the SIM mode and the more complex mass spectrum after derivatization. While non-derivatized compounds were monitored based on predominant ions in their mass spectra, the SIM masses of the derivatized compounds were chosen more specifically to represent typical adducts with all involved derivatization reagents.
Table 3Calibration factors, errors, and LODs for the compounds analysed with the on-line SPME-GC-MS method. The uncertainty of the slope was derived from the standard error of the slope with a 95 % confidence interval. R2 is the coefficient of determination of the regression performed for the calibration. The instrumental error (Instr. err.) is the mean RSD of all calibration levels. The quantification error (Quant. err.) includes the instrumental error, the calibration error, and the experimental error. The LODs for the SPME-GC-MS were derived as fixed concentrations in molec. cm−3, whereas the corresponding mixing ratios varied between the experiments due to the ambient conditions. For the benefit of the reader, the LOD in pptv at T = 298 K and standard pressure is also shown here.
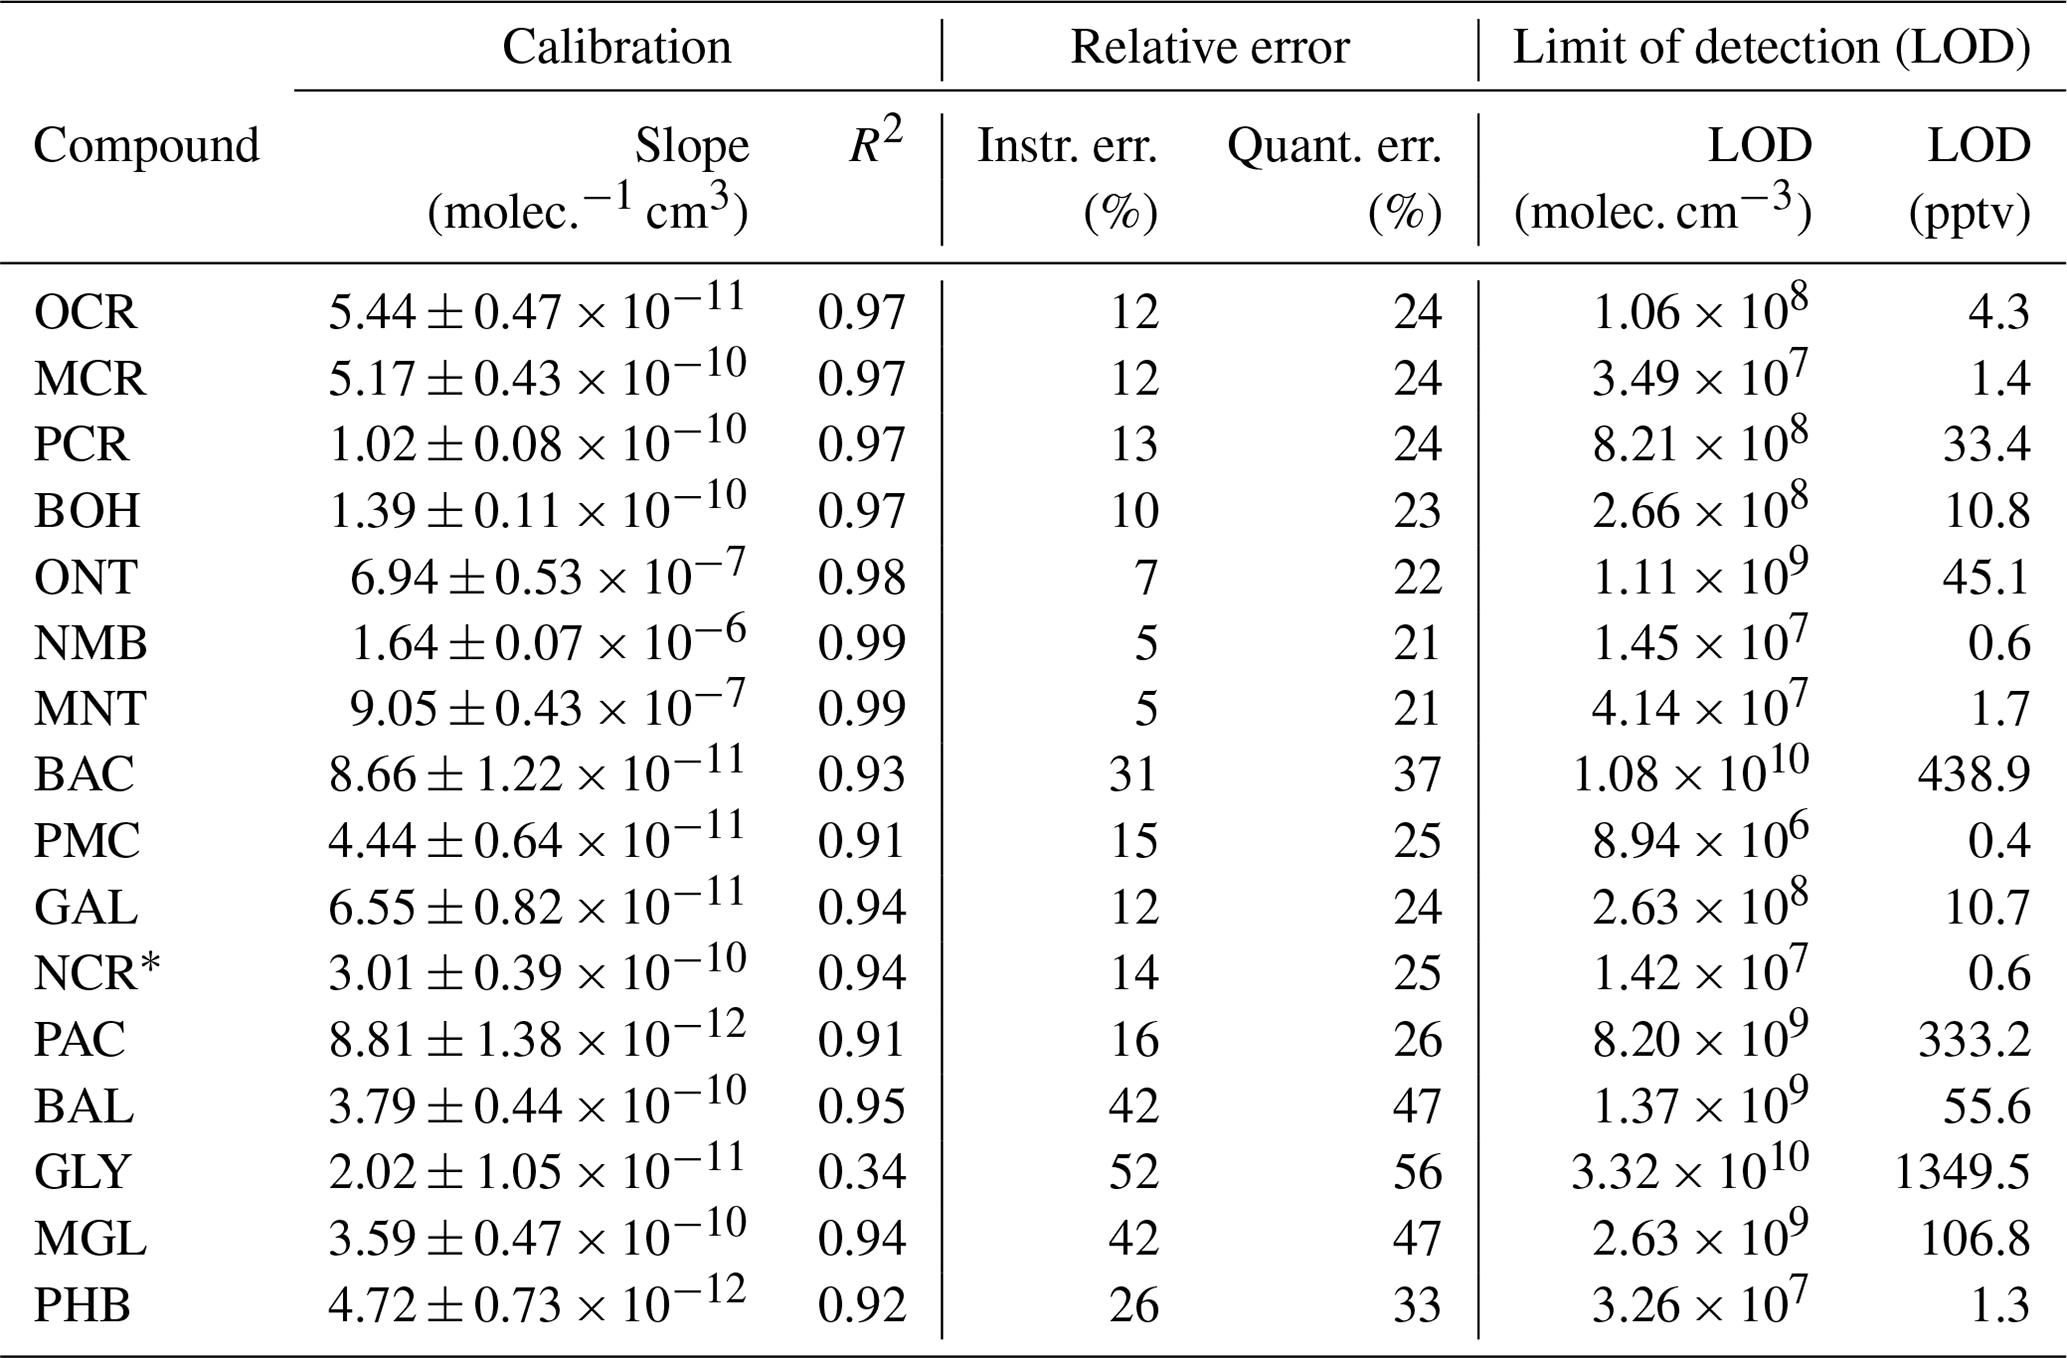
∗ Evaluated as the average concentration of both 2-nitro-p-cresol and 6-nitro-m-cresol.
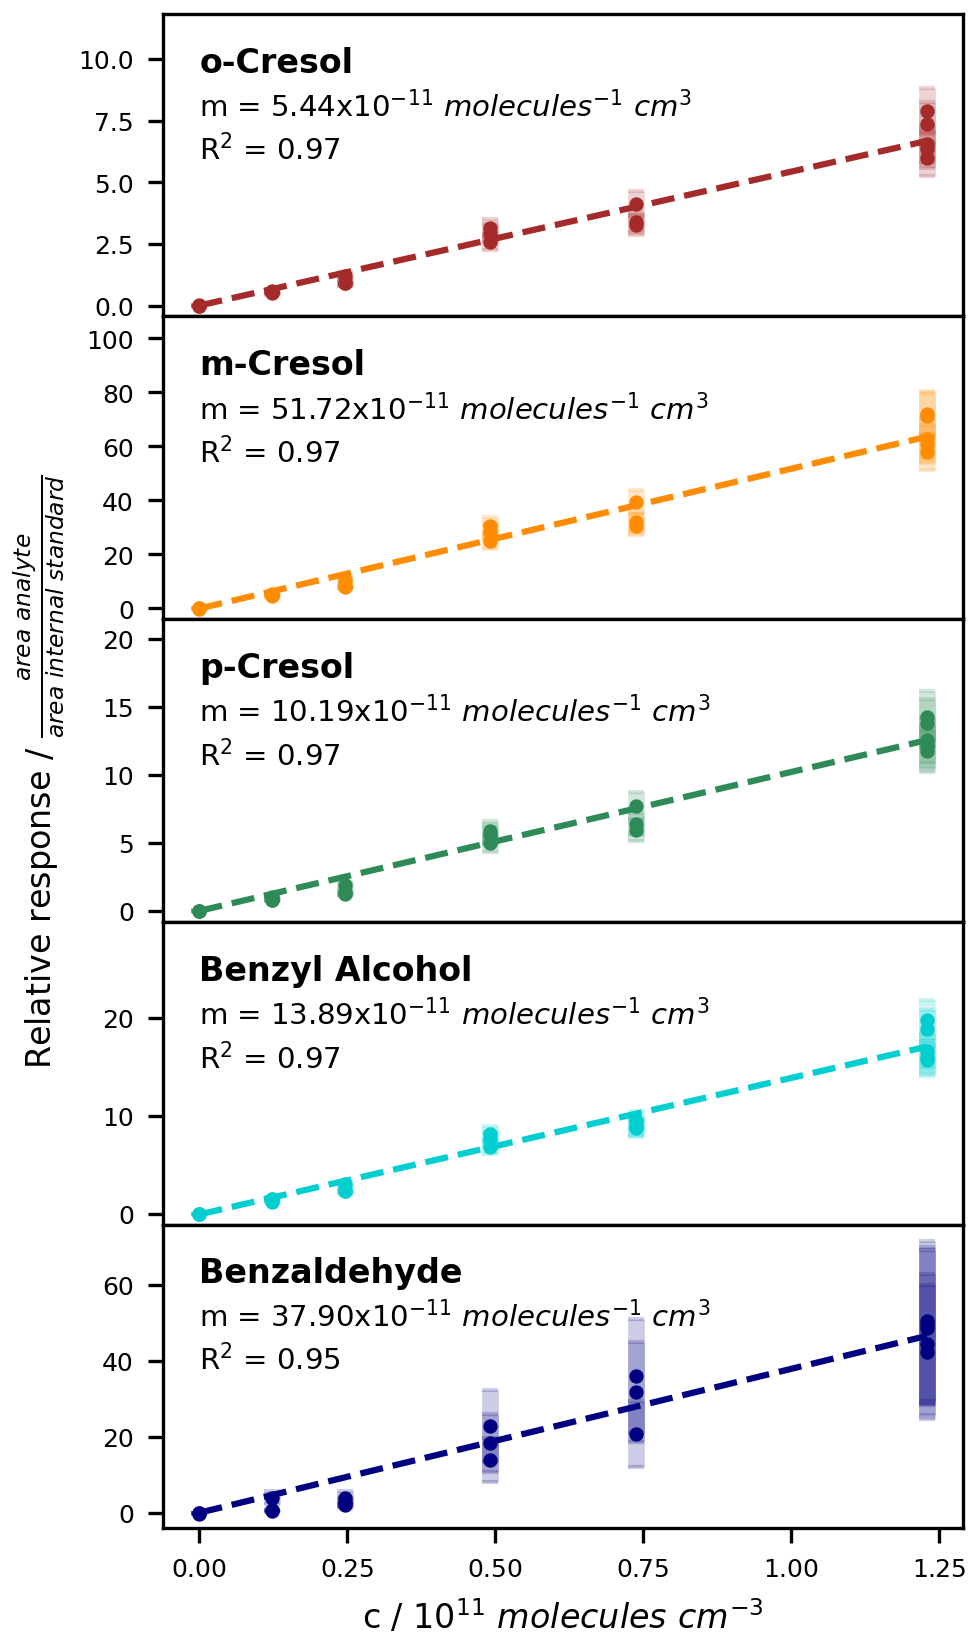
Figure 7Calibration curves for the ring-retaining first-generation products of toluene with the ISTD correction. The relative responses are plotted against the concentration in the chamber. Uncertainty areas represent the instrumental error.
The instrumental error was highest for the carbonyls benzaldehyde, glyoxal, and methylglyoxal, which were derivatized by PFBHA and corrected via acetophenone-d8. Furthermore, along with the two carboxylic acids (benzoic acid and pyruvic acid), these compounds had the highest LODs. This is in contrast to the study by Borrás et al. (2021), where carbonyls were determined with great precision and where glyoxal performed especially well. Probably, this difference results from the distinct experimental setups of the BATCH Teflon chamber and the EUPHORE chamber. In particular, the transfer line in the present work was longer (∼ 6 m), heated to 50 °C instead of 80 °C, and made from PTFE instead of sulfinert material. Additionally, the periodic sampling process allowed only 3 min of equilibration prior to extraction. We acknowledge that these conditions limit our ability to analyse sticky compounds with regard to sensitivity and sample-to-sample variability (Fig. S9). Furthermore, during preliminary stability and optimization tests, we sometimes observed declining responses of PFBHA and the associated analytes over time due to either reagent depletion or fibre degradation (Fig. S10). We avoided such effects in the experimental data by checking the fibre condition prior to each experiment and by conducting relatively short experiments with not more than five samples. Still, we note that the derivatization with PFBHA may be less robust than the derivatization with MSTFA and TMCS. Although such effects should be accounted for by the ISTD correction, acetophenone-d8 as the selected ISTD may be too structurally different from the photooxidation products with regard to aromaticity and the type of carbonyl group to be able to sufficiently correct for pronounced methodological variations.
The calibration solutions were prepared in ACN because (i) all compounds were soluble at the target concentrations and (ii) ACN contains no functional groups that could scavenge the derivatization reagents when present in excess. However, this choice of solvent led to a substantial difference in chamber matrix between the calibration and the experiments. In the present study, any potential matrix-induced changes in the instrumental sensitivity were compensated for by the on-line ISTD correction. Additionally, matrix-specific blank samples were subtracted in both the calibration (injection of ACN into the chamber without dissolved analytes) and the experiments (the filled chamber prior to irradiation) to account for possible variations in instrumental offsets. To experimentally confirm the validity of the performed calibration, joint stock solutions of the cresol isomers, benzyl alcohol, benzaldehyde, glyoxal, and methylglyoxal were prepared in ACN and water (c = 0.5 mM). For each solvent, 125 µL of the stock solution was injected into the chamber and measured by SPME-GC-MS. For all tested compounds, the uncertainty ranges of the mean relative responses of the two solutions overlapped. Hence, any potential solvent effect was within the instrumental error, and artefacts related to the presence of ACN can be excluded.
Optimizing and testing the new SPME-GC-MS method, we also evaluated several compounds which we did not include in the characterization of the BATCH Teflon chamber due to insufficient sensitivity or poor transportation from the chamber to the instrument (Table S9). We observed some patterns that could be of general interest for the optimization of the methods for these compounds, as described in more detail in Sect. S6.3.
4.2.2 SPME-GC-MS fibre effects and ISTD addition
In the present setup, the comparability of different samples, of different experiments, and of the experimental period and the on-line calibration was maintained by the added ISTDs. The PTR-ToF-MS data showed that the ISTDs in the permeation source outflow were stable over the course of 1 week, with RSDs of 5 % and 6 % for the PI-normalized responses of phenol-d6 and acetophenone-d8, respectively. Hence, the variability of the ISTD responses measured by SPME-GC-MS (Fig. 8) is indicative of changes in the derivatization efficiency, the performance of the GC-MS, and, most importantly, fibre effects.
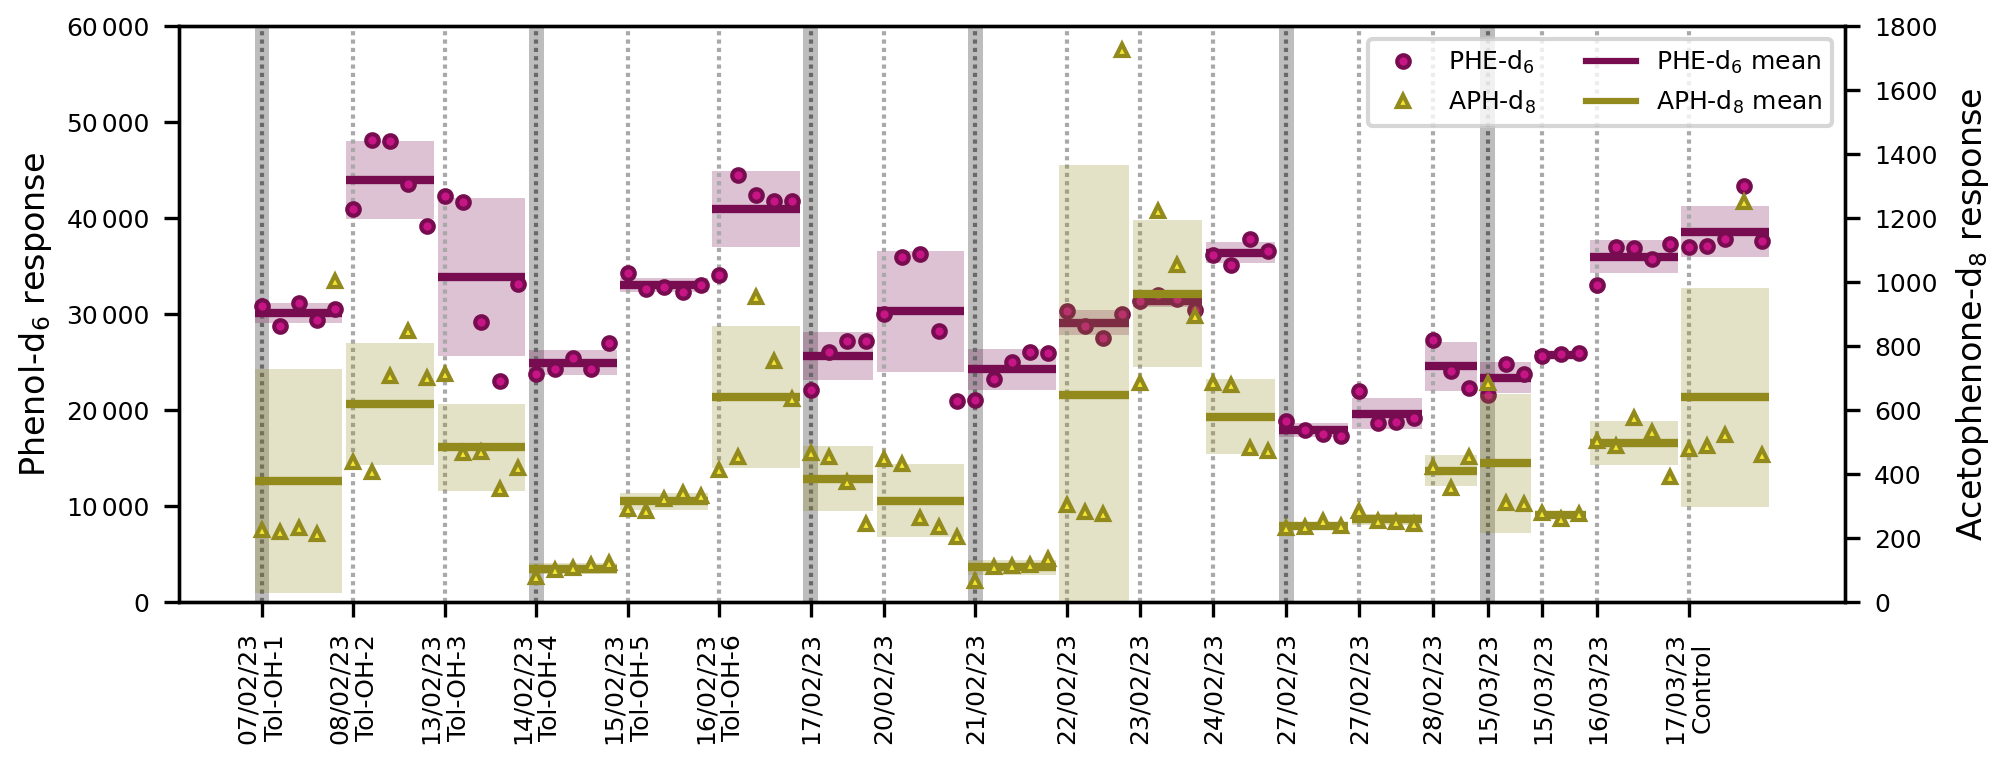
Figure 8ISTD responses from SPME-GC-MS over the entire experimental period in chronological order. Each individual marker represents one measurement of phenol-d6 (PHE-d6) or acetophenone-d8 (APH-d8). Only the experimental data are included, not the fibre-conditioning and chamber-cleanliness-test measurements prior to each experiment. The dotted vertical lines indicate the start of a new experiment. The insertion of a new SPME fibre is illustrated with additional dark grey bars. The horizontal lines show the mean value of the entire experiment, with the standard deviations included as uncertainty areas.
For SPME sampling, as many as 200 assays per fibre have been reported in the literature (Martos and Pawliszyn, 1997). Here, the number of sampling cycles (PFBHA + on-line sampling + MSTFA and TMCS) conducted with a single fibre was in the range of about 20–30 (Fig. 8) and therefore considerably lower. This high fibre turnover is likely related to (i) the multitude of steps per sampling cycle; (ii) the active analyte extraction, where the fibre is located perpendicular to a flow of air with a high velocity of 131 cm s−1; and (iii) additional stress caused by the added derivatization reagents, especially TMCS.
The ISTD response often increased over the lifetime of a single SPME fibre (Fig. 8), suggesting either a carry-over effect or enhanced performance of the fibres after repeated usage. This development typically reversed after three to four experiments, and fibres were exchanged when this was apparent in the preparatory work of a given experiment. While there was no general trend over time, the SPME fibres differed in their overall extraction efficiencies. The mean values of each fibre across all samples in the associated experiments were compared to indicate inter-fibre reproducibility, resulting in relative standard deviations of 17 % for phenol-d6 and 25 % for acetophenone-d8. This is in accordance with the inter-fibre variability of 18 % reported previously by Tumbiolo et al. (2004). It is important to note that with the controlled sequencing of the SPME autosampler system, the conditions and the duration of the extraction process were exactly the same for all samples. Thus, reproducibility could even be achieved for pre-equilibrium conditions when time control is critical.
Functional similarity is important for the ability of ISTDs to correct analytes under various conditions, yet just one ISTD was available for all compounds derivatized by each of the employed derivatization reagents. Most compounds derivatized by MSTFA and TMCS contained a hydroxy group and were functionally similar to phenol-d6. The concentrations of the two studied carboxylic acids (pyruvic acid and benzoic acid) throughout the photooxidation experiments rarely exceeded their high LODs (Table 3), so potential errors associated with insufficient resemblance to the assigned ISTD did not become relevant in the data evaluation. All carbonyls derivatized by PFBHA were corrected with acetophenone-d8. As aldehydes are generally more reactive towards PFBHA than ketones (Jang and Kamens, 1999), acetophenone-d8 is likely to be derivatized less effectively if there is strong competition for the reagent (Fig. S10). In that case, concentrations of the aldehyde products would be overestimated. We therefore recommend a broader range of more functionally diverse ISTDs for future applications. Nevertheless, even with the available ISTDs and regardless of the class of compounds, we achieved improved fit qualities (R2) of the calibration curves upon the normalization of the instrumental response to the assigned ISTD (see the calibration curves with ISTD correction in Fig. 7 and without ISTD correction in Fig. S11). This indicates advanced method precision.
4.2.3 PTR-ToF-MS calibration and instrumental inter-comparison
The PI-normalized sensitivities, instrumental uncertainties, and LODs of the toluene photooxidation products calibrated for the PTR-ToF-MS are listed in Table S6. Overall, the ring-retaining compounds had the highest instrumental sensitivity. In contrast, the sensitivity of glyoxal at 59.0041 was very low and barely quantifiable. Firstly, this is due to its low proton affinity of 161.41–165.06 kcal mol−1, which barely exceeds the proton affinity of water (Wróblewski et al., 2007). Secondly, we observed the fragmentation of glyoxal to formaldehyde at 31.0145, as also described by Stönner et al. (2017). However, as formaldehyde can occur as a product of toluene photooxidation (Seuwen and Warneck, 1996; Wagner et al., 2003) but could not be determined sufficiently well using the on-line SPME-GC-MS method (Table S9), we had no possibility of differentiating between glyoxal and formaldehyde based on that mass, and we therefore measured glyoxal based on its more specific protonated mass.
By performing separate calibrations for the cresols and benzyl alcohol, we determined isomer-specific sensitivities (Table S6). We found that o-cresol and m-cresol had the highest sensitivities, while the sensitivity of p-cresol was by about a factor of 2.5 lower. Benzyl alcohol did not show any signal at 109.0626 and thus did not contribute to the sum signal and was excluded from the weighted calibration. Instead, it fragmented to 91.0522, which is in accordance with the literature (Yeoman et al., 2021) and probably indicates the formation of the benzyl radical after the abstraction of water from the protonated molecule. As this fragment is unspecific, we did not evaluate it further. The isomer-specific calibration was performed with relative abundances of 0.74 for o-cresol, 0.04 for m-cresol, and 0.22 for p-cresol (Sect. 4.3.2). As o-cresol is by far the most abundant isomer, its contribution to the weighted calibration factor at 109.0626 was as high as 87 %. Overall, considering the relative abundances and the specific sensitivities of the individual isomers led to a 1.15-fold increase of the calibration factor compared to the non-weighted calibration (Table S6).
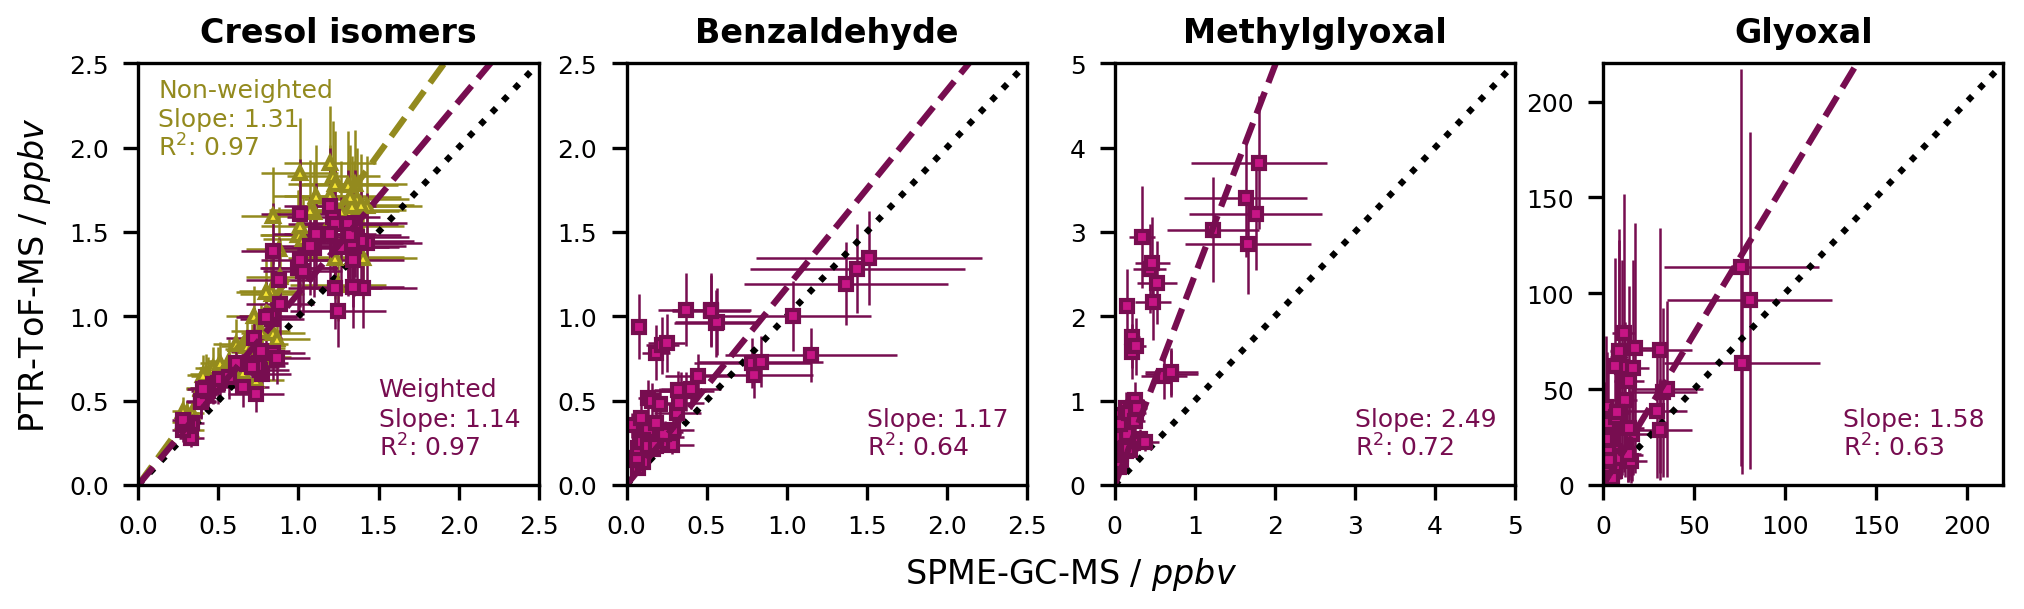
Figure 9Comparison of the non-corrected mixing ratios of the toluene first-generation products that were calibrated for both the SPME-GC-MS and the PTR-ToF-MS. The dashed black line represents a 1 : 1 fit. For both instruments, the mixing ratios derived from the chamber calibration are shown. In the case of the cresol isomers, the non-weighted and weighted calibrations for the sum of the isomers are distinguished. Error bars represent the quantification error of the respective instrument. The error bars for the sum of the cresol isomers at the SPME-GC-MS are the weighted sum of the individual errors. The data are derived from 18 different experiments at different temperatures and in both the absence and presence of NOx.
The difference between the PTR-ToF-MS data and the SPME-GC-MS data is shown for all calibrated compounds in Fig. 9. For the cresol isomers, the weighted calibration improved the coherence between the two instruments from a 31 % to a 14 % deviation. Additionally, we determined the best fit quality (R2) for these compounds, which likely relates to the good detectability and relatively low instrumental error for these compounds at both the SPME-GC-MS and the PTR-ToF-MS. The difference between the two instruments was below 20 % for all ring-retaining first-generation products, which was within the quantification error of both instruments. For the dicarbonyls, on the other hand, there was substantial instrumental disagreement. While the analysis of glyoxal at both the SPME-GC-MS and the PTR-ToF-MS was too uncertain to reliably interpret the observed relationship, the concentration of methylglyoxal was clearly higher when derived by PTR-ToF-MS. This is possibly due to the lower selectivity of the PTR-ToF-MS and overestimations due to analytical artefacts. Especially for small molecules, such artefacts can relate to either isobaric interferences or the actual formation of the target compounds within the instrument upon the fragmentation of larger compounds (Michoud et al., 2018; Salazar Gómez et al., 2021). For instance, the C4 and C5 γ-dicarbonyl co-products of glyoxal and methylglyoxal photolyse rapidly in natural sunlight (Newland et al., 2019) and therefore are likely to produce substantial amounts of follow-up products in our experiments. The MCM suggests the formation of photolytic products with a high degree of oxygenation (Bloss et al., 2005), some of which may well produce C3H5O fragments. Oppositely, underestimated concentrations at the SPME-GC-MS could result, for instance, from insufficient equilibration in the SPME-GC-MS transfer line (Sect. 4.2.1).
As shown in Fig. 10, the combination of SPME-GC-MS data and weighted PTR-ToF-MS data effectively provides isomeric information at a high temporal resolution. This is particularly valuable for modelling and for gaining insights into chemical mechanisms. Rather than performing a separate weighted calibration for each time segment assigned to a specific SPME-GC-MS sample, we used a fixed relative abundance of the cresol isomers for both the weighted calibration and the experimental data. This is a reasonable assumption, as their sinks in the BATCH Teflon chamber (wall losses, photolysis, and secondary OH radical reactions) agree within 16 % (Tables S1, S7, and S8). Accordingly, the isomeric distribution derived from the formation yields (including loss corrections) is equal to the average isomeric distribution calculated from the measured concentrations (excluding loss corrections). The variability of the isomeric distribution in the experimental SPME-GC-MS data is only 13 % and hence within the quantification error. In addition to the simplicity of implementation, the adoption of a fixed relative abundance also makes the PTR-ToF-MS results less susceptible to outliers and the random error of the SPME-GC-MS data.
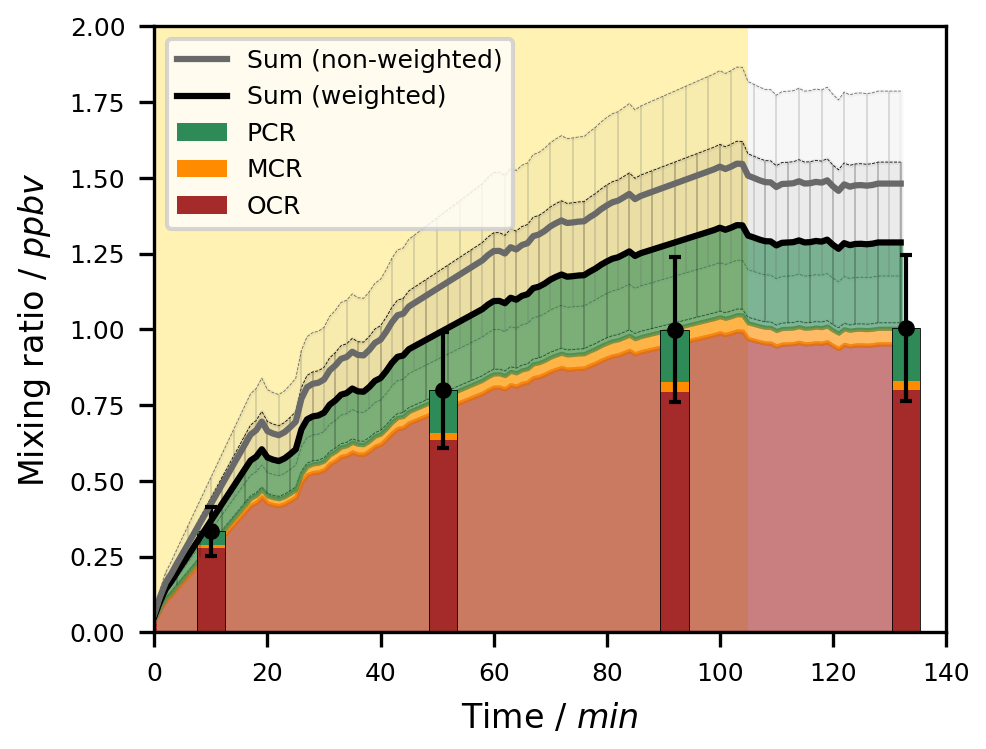
Figure 10Time series of the cresol isomers according to SPME-GC-MS and PTR-ToF-MS. Data are shown for experiment Tol-OH-6 (T = 298 ± 1 K, NOx-free). No loss corrections were applied to the depicted data. The area shaded in yellow represents the period in which the chamber was irradiated. The sum signal from the PTR-ToF-MS is shown for both the weighted and the non-weighted calibrations, with the quantification error shown as a shaded area. For the weighted data set, the individual isomers are shown according to their fixed relative abundances. The error of the sum of the isomers in the SPME-GC-MS data is calculated as the weighted sum of the individual quantification errors. Toluene products in this figure include o-cresol (OCR), m-cresol (MCR), and p-cresol (PCR).
4.3 Application: product study
The conducted experiments allowed us to validate the developed methods and to gain insight into the OH radical-induced photooxidation of toluene. Since the calculated product formation yields take into account compound- and chamber-specific losses and the ambient oxidation efficiency, they provide a bridge from individual experiments to generalizable mechanistic evaluations. Thus, our results can be placed in the context of previous studies and atmospheric chemistry models.
4.3.1 Loss corrections and error
The contribution of the three characterized loss processes (wall losses, photolysis, and secondary OH radical reactions) to the loss-corrected concentration differed over time and according to the experimental conditions. As shown for the NOx-free experiment Tol-OH-6 in Fig. 11, the different losses gained in importance over the course of the experiment, and the fraction of the measured non-corrected data decreased accordingly. Furthermore, the absolute and relative contributions of the various loss corrections differed for the individual compounds. In the exemplary case of the ring-retaining first-generation products, the cresol isomers and benzyl alcohol were affected mainly by wall losses and secondary reactions with OH radicals, whereas photolytic losses were more important for benzaldehyde. An overview of the first-order rate constants of all three loss processes for each of the analysed compounds is provided in Fig. S12.
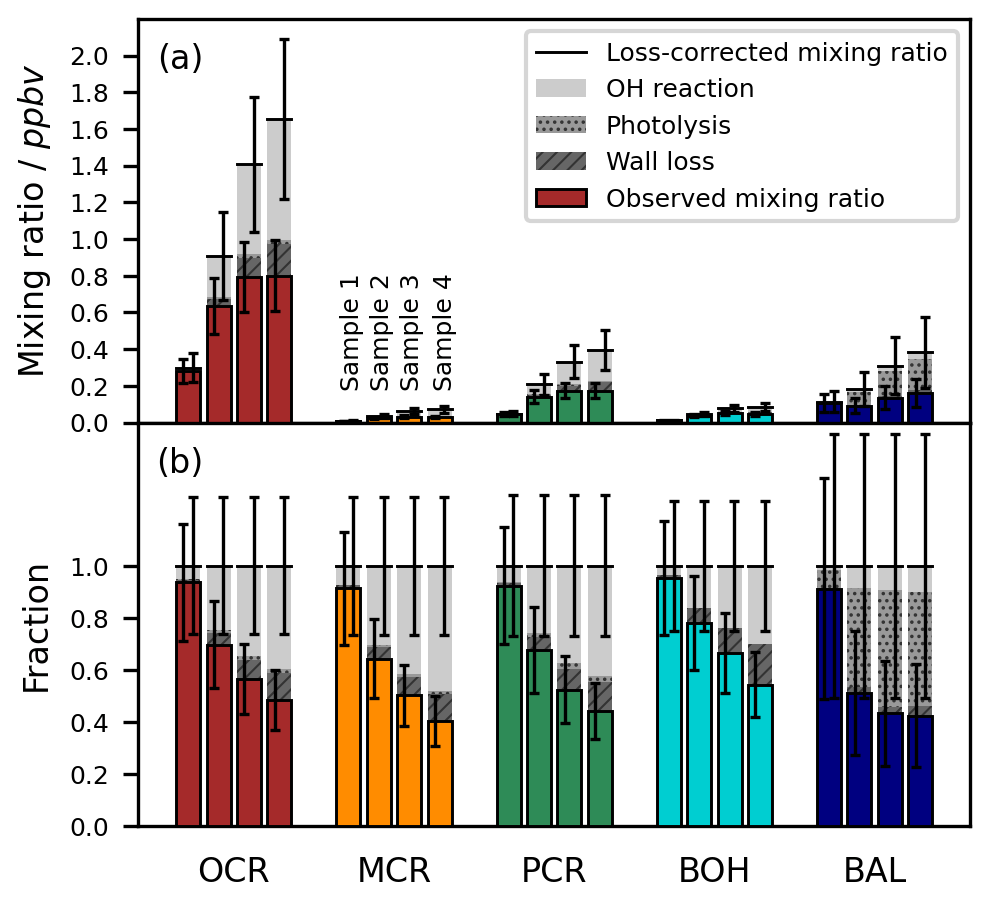
Figure 11Contributions of the non-corrected data and each of the three included loss corrections (wall losses, photolysis, and secondary OH radical reactions) to the loss-corrected concentration. The displayed data refer to SPME-GC-MS samples 1 to 4 in experiment Tol-OH-6 (T = 298 ± 1 K, NOx-free). The shares of the raw data and the losses are shown on (a) an absolute scale (mixing ratios) and (b) a relative scale (normalized to the loss-corrected mixing ratio). The error bars represent the compound-specific quantification errors of the non-corrected data. The toluene products in this figure include o-cresol (OCR), m-cresol (MCR), p-cresol (PCR), benzyl alcohol (BOH), and benzaldehyde (BAL).
The loss corrections introduced additional uncertainty in the final data sets. For the wall loss rates, we adopted the uncertainty of the parameterization (14 %), since we used the modelled values for all compounds. The error of the photolysis rates (38 %) resulted from the recorded spectrum, the uncertainty in the literature values used for the quantum yields and absorption cross sections, and temporal variations in the emission from the solar simulator. The uncertainty associated with secondary reactions of the analytes with OH radicals (19 %) was calculated from the quantification error of toluene, the error of the rate constant of toluene with OH radicals, and the error of the rate constants of OH radicals with the analytes. The total error of the loss-corrected concentrations was weighted and calculated for each data point separately to account for the variable contributions of the different loss processes (for details, see Sect. S7 with Table S10).
As proof of concept for the implemented correction scheme, we furthermore compared the measured and the loss-corrected data sets obtained by SPME-GC-MS and PTR-ToF-MS for different compounds and experiments (see Sect. S7 with Figs. S13 and S14). The absolute losses for each of the distinct loss processes as well as the total loss-corrected concentrations are in good agreement between the SPME-GC-MS and the PTR-ToF-MS data, indicating that the correction procedure is valid for both instruments in spite of their different temporal resolutions.
4.3.2 Formation yields
The linear regressions performed to derive the formation yields of the ring-retaining first-generation products of toluene for T = 298 ± 1 K in the absence of NOx are shown in Fig. 12. For demonstration, and to be able to resolve the C7H8O isomers, we focus here mainly on the SPME-GC-MS data. The results obtained in this study are clustered according to the reaction channel and compared with the MCM predictions and literature values in Table 4.
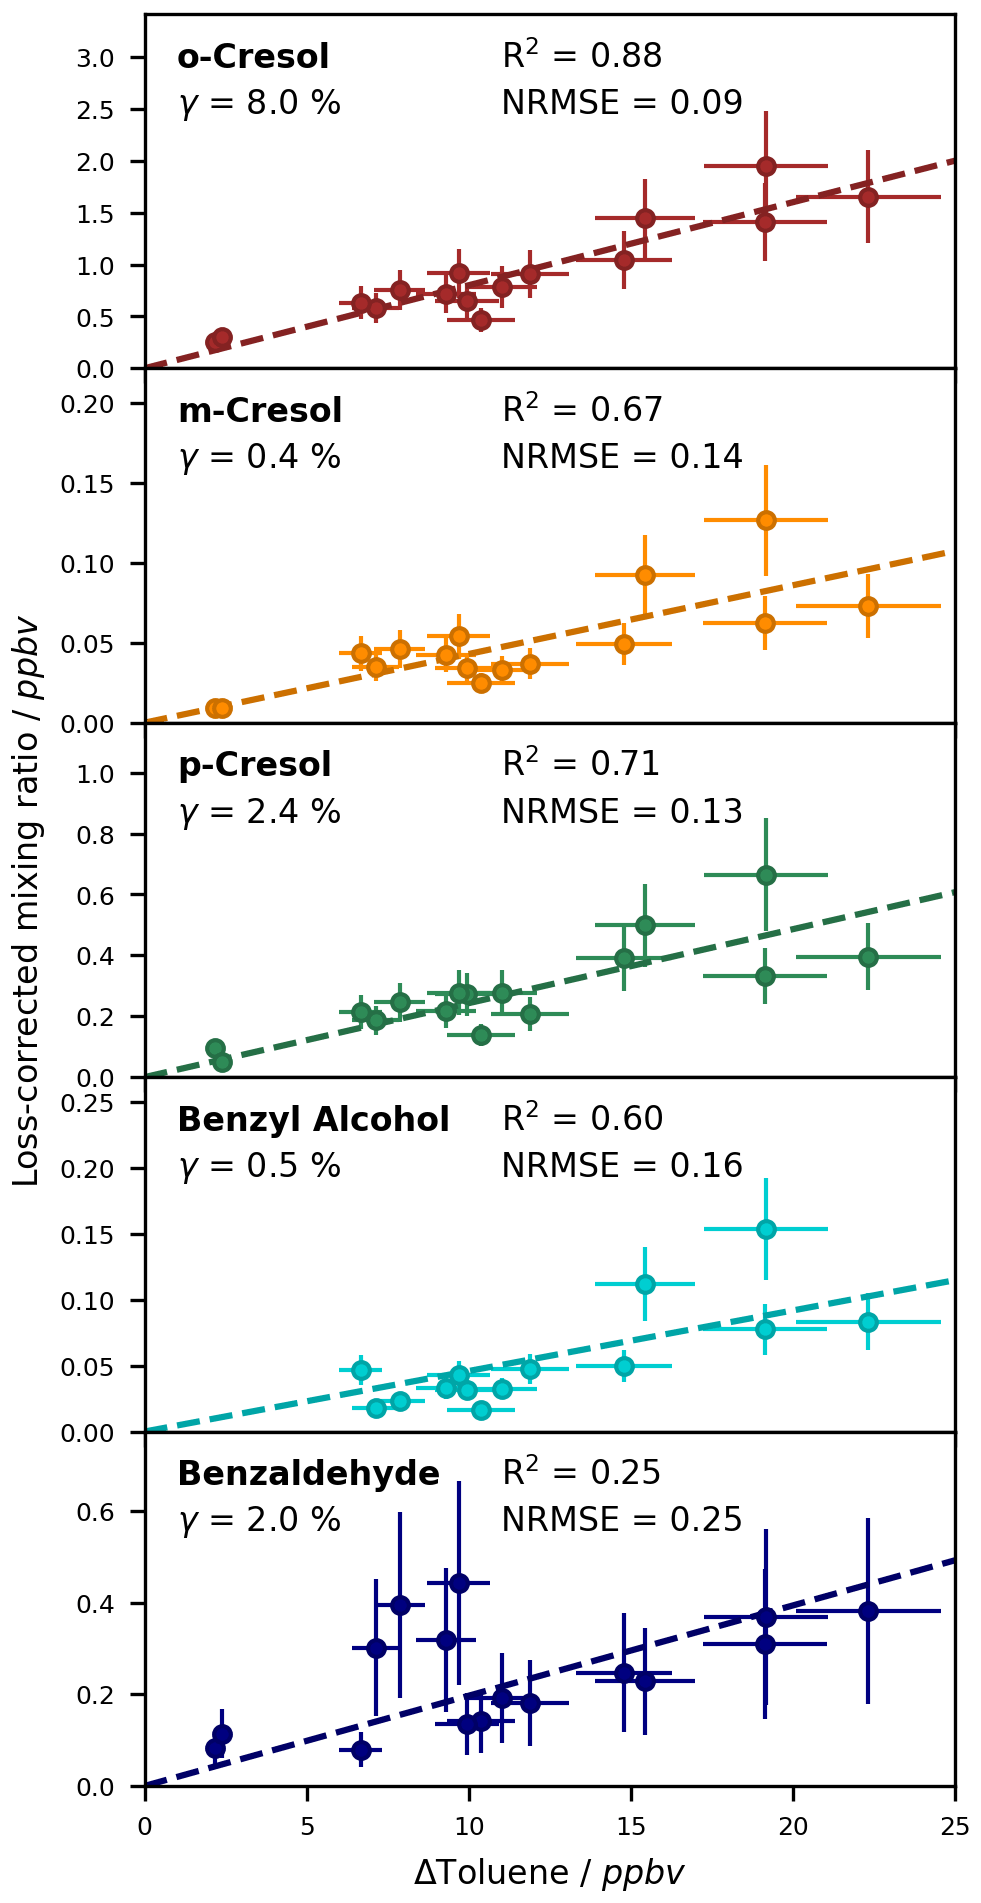
Figure 12Yields of the ring-retaining first-generation products of toluene, derived by linear regressions of the loss-corrected mixing ratio (including loss corrections for wall losses, photolysis, and secondary OH radical reactions) against the monitored change in toluene. For each compound, the slope of the regression is equal to the formation yield. To perform the regressions, only experiments conducted at T = 298 ± 1 K and in the absence of NOx were used. Error bars represent the quantification error.
Table 4Yields of the ring-retaining first-generation products of toluene. The compounds are clustered according to the main channel, which in turn is listed as the sum of the associated products. All yields are given in %. Unless stated otherwise, the yields shown for this work are based on the SPME-GC-MS data. The error of these yields was calculated from the propagation of the NRMSEs of the linear regressions, the calibration error, and the quantification error of toluene. The yields in the MCM refer to the latest representation of the toluene chemistry in MCM v3.1 (Bloss et al., 2005). The MCM does not distinguish between the cresol isomers (NA – not available), while in the abstraction channel, the product yields depend on the chemistry of the preceding peroxy radical (n/a – not applicable). References in bold font refer to NOx-free studies, while all other cited yields were obtained in the presence of NOx. The asterisk (*) indicates computational values, as presented by Wu et al. (2014). The instrumental techniques used in the cited literature were chemical ionization mass spectrometry (Baltaretu et al., 2009; Ji et al., 2017; Zaytsev et al., 2019), differential optical absorption spectroscopy (Klotz et al., 1998), gas chromatography with flame ionization detection (Atkinson et al., 1983, 1989; Atkinson and Aschmann, 1994; Moschonas et al., 1998; Seuwen and Warneck, 1996; Smith et al., 1998), offline determination of carbonyls after derivatization (Seuwen and Warneck, 1996; Smith et al., 1998), and tandem mass spectrometry (Dumdei et al., 1988). The literature values presented here provide a comprehensive overview of relevant data; however, we acknowledge that there may be additional relevant studies beyond those included in this table.
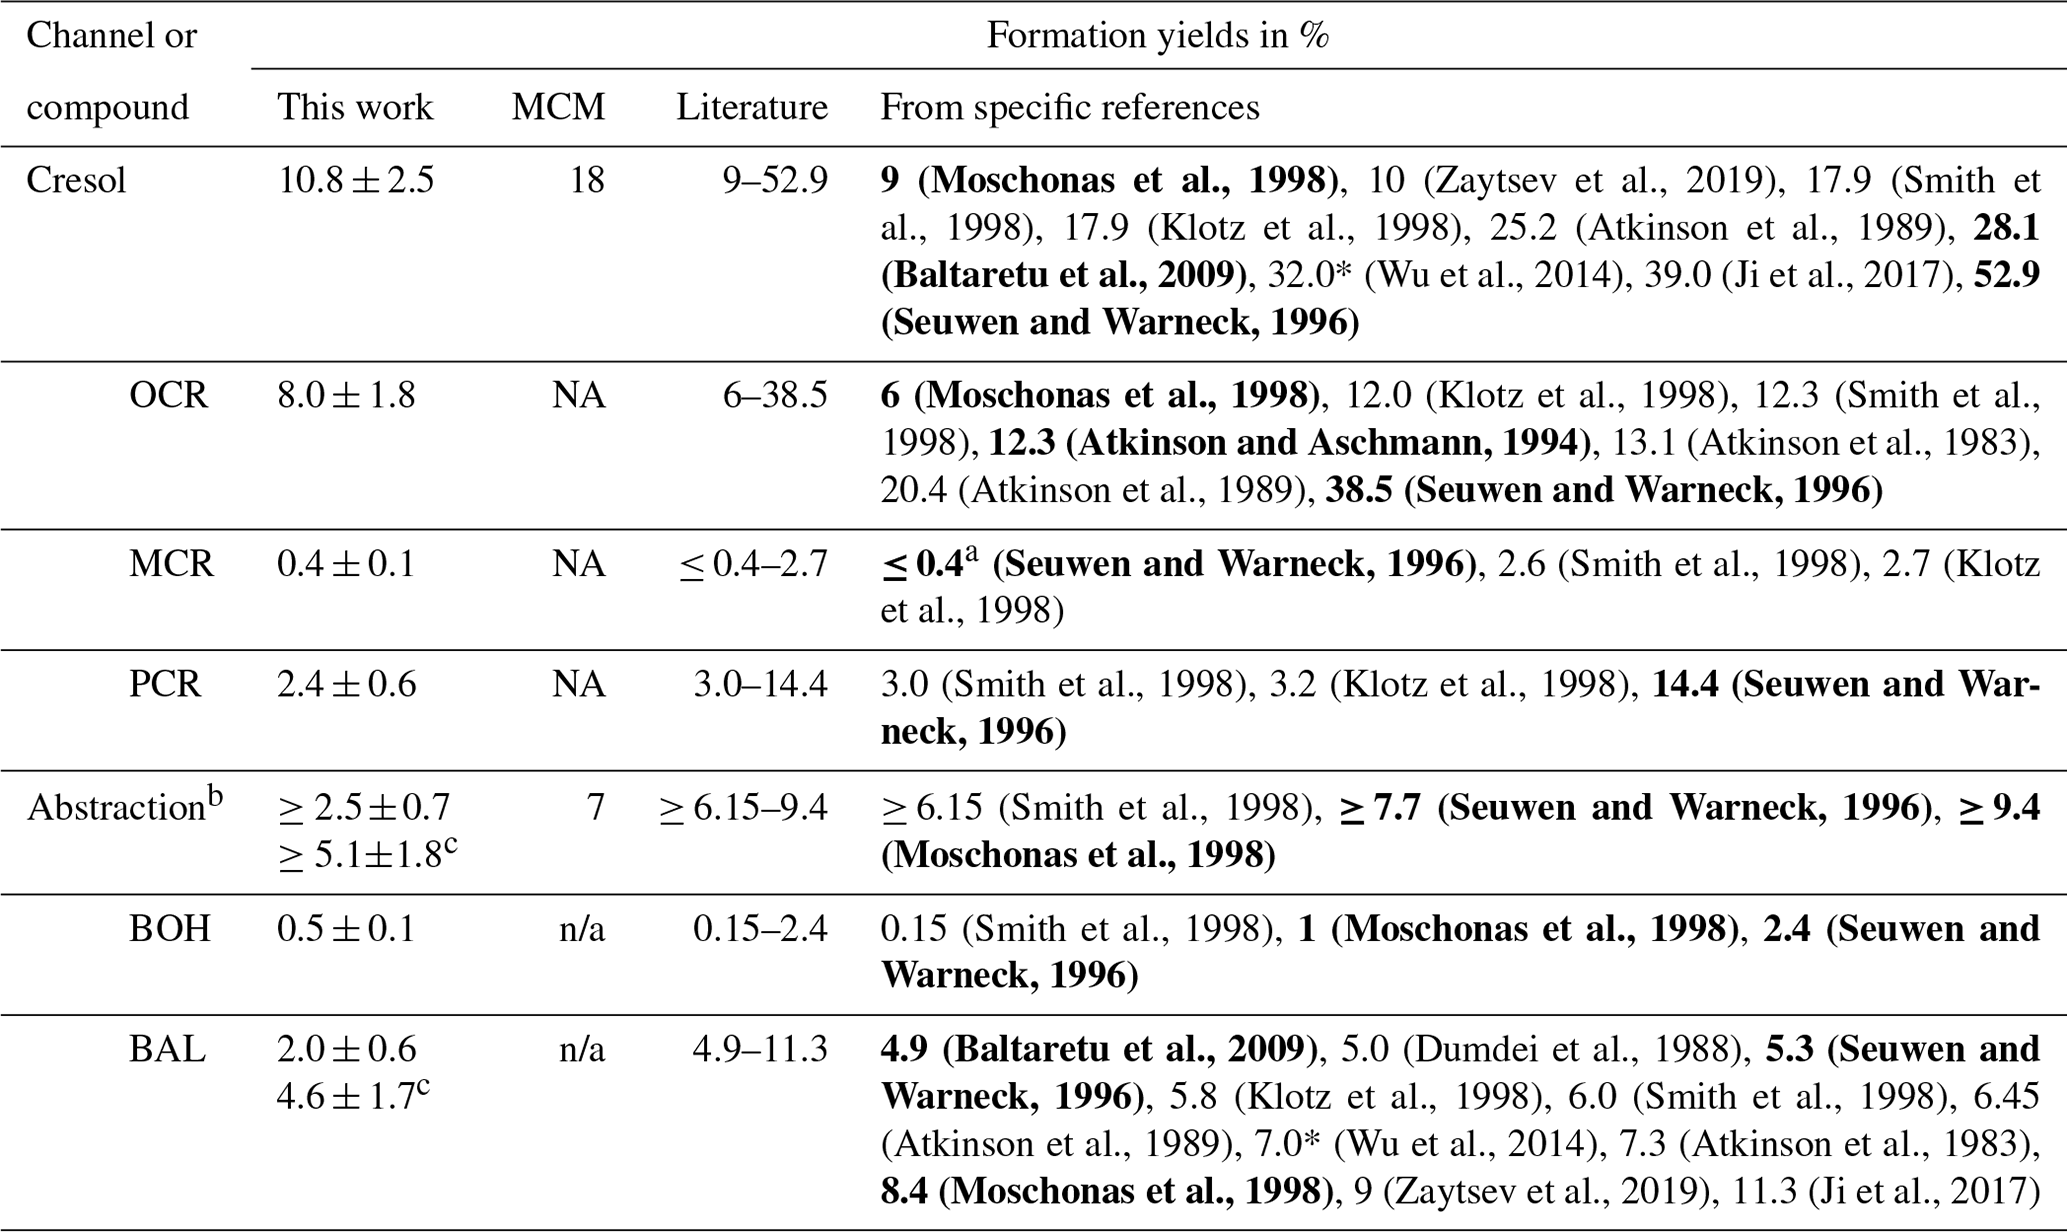
a Without correction for secondary losses. b The MCM v3.1 yield encompasses all possible products of the abstraction channel. For the values obtained in this work as well as for the cited literature values, only the sum of benzyl alcohol and benzaldehyde is compiled. c The PTR-ToF-MS data set for benzaldehyde.
For the cresol channel, we derived a sum yield of 10.8 ± 2.5 %. This is in the low range of most reported values but is in close agreement with the 10 % yield obtained in another recent study by Zaytsev et al. (2019). The large range of available literature values (9 %–52.9 %) can be explained by the high reactivity of the cresols and by their susceptibility to various physical and chemical losses, which are in turn specific to the experimental setup and analytical technique (Klotz et al., 1998; Schwantes et al., 2017). Notably, the three highest cresol yields reported in the literature in the last 20 years were obtained theoretically (Wu et al., 2014) or under low-O2 conditions (Baltaretu et al., 2009; Ji et al., 2017) that may disfavour the competing dicarbonyl channel (Jenkin et al., 2009; Newland et al., 2017). The very high yield of 52.9 % obtained by Seuwen and Warneck (1996) was obtained from experiments with toluene mixing ratios of about 1000 ppmv, limiting the transferability of these data to the real atmosphere. The isomeric distribution was previously reported to be o-cresol > p-cresol > m-cresol (Klotz et al., 1998; Seuwen and Warneck, 1996; Smith et al., 1998). This pattern is well reproduced in the present work, with yields of 8.0 ± 1.8 %, 2.4 ± 0.6 %, and 0.4 ± 0.1 %, respectively. These yields correspond to a ratio of 74 : 4 : 22 for o-, m-, and p-cresol, respectively. As Seuwen and Warneck (1996) could not quantify the yield of m-cresol, and other studies have evaluated the sum of m- and p-cresol due to insufficient chromatographic separation (e.g. Moschonas et al., 1998), this study provides the first report of the NOx-free distribution of all the cresol isomers to the best of our knowledge.
The yield of benzyl alcohol determined in this work (0.5 ± 0.1 %) is within the range of the few reported values (Moschonas et al., 1998; Seuwen and Warneck, 1996; Smith et al., 1998), confirming that it is a relevant first-generation product in the abstraction channel. While the yield of benzyl alcohol was always found to be lower than that of benzaldehyde, it is uncertain whether it is more abundant (Seuwen and Warneck, 1996), less abundant (Smith et al., 1998), or in a similar range (this work) compared to its isomer m-cresol. This is important for the interpretation of purely mass-spectrometric approaches, which often neglect benzyl alcohol and assign the sum signal exclusively to the o-, m-, and p-isomers of cresol (e.g. Baltaretu et al., 2009; Ji et al., 2017; Zaytsev et al., 2019). While we found that benzyl alcohol does not contribute to the sum signal in H3O+ soft ionization, its sensitivity in other ionization techniques should be verified to avoid overestimated cresol yields.
As the dominant product in the H-abstraction channel, benzaldehyde has been studied for many decades. The yield obtained in this work using the SPME-GC-MS data (2.0 ± 0.6 %) is smaller than any of the reported values obtained both in the presence and in the absence of NOx. Notably, the regression performed for benzaldehyde has a relatively high uncertainty (NRMSE = 0.25; Fig. 12), which is in line with the discussed instrumental variability of the aldehydes determined with the on-line SPME-GC-MS method in our setup. As there are no relevant isomers or spectral interferences for benzaldehyde, we could refer to the PTR-ToF-MS measurements as well. These data resulted in a yield of 4.6 ± 1.7 % (Fig. 13). The fact that this value is more than a factor of 2 higher than the yield obtained using the SPME-GC-MS data relates to the observed difference in the measured concentrations (Fig. 9), which is further amplified by the applied loss corrections. The PTR-ToF-MS yield for benzaldehyde is in better agreement with the literature values, albeit still at the lower end. We conclude that in the case of benzaldehyde, the SPME-GC-MS data set is too small to compensate for the instrumental error, and the more precise PTR-ToF-MS data should therefore be used. Interestingly, the PTR-ToF-MS yield agrees reasonably well with the apparent outliers in the SPME-GC-MS data set in the range of Δtoluene = 7.0–9.8 ppbv (Fig. 12). These data correspond to the experiments Tol-OH-4 and Tol-OH-5, which in turn show the best intra-experimental stability of acetophenone-d8 (Fig. 8). Although we lack definite proof that these effects are causally related, this observation nevertheless reinforces our recommendation to include internal standards for on-line analytical methods used in chamber experiments and to select compounds with good stability and a high resemblance to the analytes for correction.
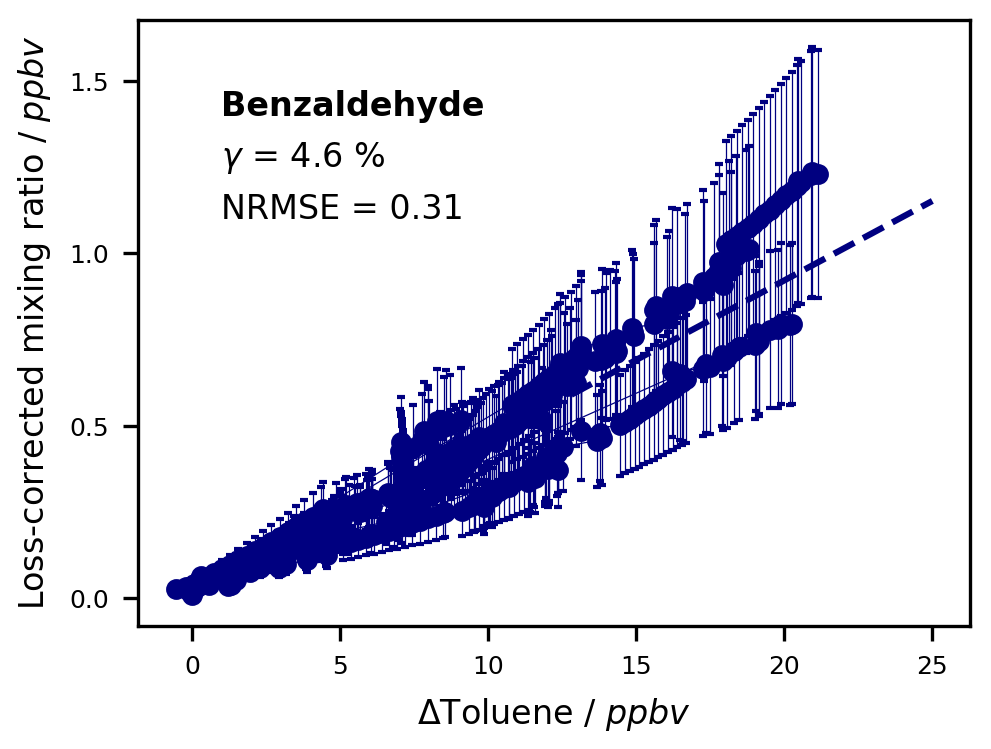
Figure 13Benzaldehyde formation yield, derived by linear regression of the loss-corrected mixing ratio (including loss corrections for wall loss, photolysis, and reaction with OH radicals) against the monitored change in toluene. The slope of the regression is equal to the formation yield. To perform the regression, only experiments conducted at T = 298 ± 1 K and in the absence of NOx were used. Error bars represent the uncertainty of the loss-corrected data.
In this work, we set up an indoor atmospheric simulation chamber to study multifunctional photooxidation products in the gas phase by on-line SPME-GC-MS and PTR-ToF-MS. Specifically, the products emerging from the reaction of toluene with OH radicals were investigated and used as reference compounds to characterize the chamber properties and the instrumental capabilities. In the new chamber, controlled experiments were performed with realistic photon fluxes and OH radical concentrations. We characterized the photolysis rates (1.77 × 10⁻⁸–3.02 × 10⁻⁴ s−1), wall losses (4.54 × 10⁻⁶–8.53 × 10⁻⁵ s−1), and secondary OH radical reactions of photooxidation products with diverse functional groups. The wall losses were determined empirically and found to be dependent on fundamental molecular properties. We parameterized the loss rates accordingly, opening up the possibility of accurately characterizing the losses of compounds for which no authentic standards are available. In addition to the wall losses, we calculated photolytic losses using available literature values of the absorption cross sections and quantum yields, as well as reactive losses using the rate constants for the reactions with OH radicals.
The SPME-GC-MS method with on-fibre PFBHA and MSTFA derivatization enabled the on-line analysis of fragile oxygenated compounds with high sensitivity and isomeric resolution. Due to the continuous addition of functionally similar internal standards from a customized permeation source, variations in the SPME fibre extraction efficiency were effectively accounted for. Our method worked particularly well for the studied aromatic alcohols. The carbonyl compounds were associated with a higher instrumental error due to the limitations of the experimental setup regarding the on-line analysis of sticky compounds. For future applications, we recommend using a wider range of internal standards to facilitate a greater structural resemblance to the analytes. Combining the SPME-GC-MS data with the PTR-ToF-MS data, we gained additional insight into temporal trends and cross-compared the absolute concentrations. We calibrated the main first-generation products of toluene for both instruments and found good agreement for the cresol isomers and benzaldehyde. We further demonstrated that the sensitivity of the PTR-ToF-MS can vary substantially for different structural isomers. For the cresols, we therefore applied a weighted calibration factor based on the determined isomer-specific sensitivities and the distribution of the isomers as obtained from the SPME-GC-MS data. This led to improved instrumental agreement and allowed us to derive continuous time series of the individual isomers. For a wide range of applications based on mass-spectrometric techniques, it may be worth examining and potentially incorporating isomer-specific sensitivities if the relative distribution is known and calibration standards are available.
For method validation purposes, we focused on the initial photooxidation period to evaluate the primary chemistry and the dominant first-generation products of toluene. Taking into account compound-specific physical and chemical losses, we obtained product formation yields under NOx-free conditions at T = 298 ± 1 K for o-cresol (8.0 ± 1.8 %), m-cresol (0.4 ± 0.1 %), p-cresol (2.4 ± 0.6 %), benzyl alcohol (0.5 ± 0.1 %), and benzaldehyde (4.6 ± 1.7 %). These results are comparable to previous studies. The experimental design, instrumental analysis, and data-processing approaches that we have tested and optimized in this work jointly provide a means of determining the formation yields of the individual isomers of photooxidation products with different functional groups with good accuracy.
The code and data used in this study are available by request to the corresponding authors.
The supplement related to this article is available online at: https://doi.org/10.5194/amt-17-4553-2024-supplement.
ACN acquired funding, conceptualized the project, and provided supervision. EB and AM provided methodological training at the EUPHORE chamber. With support from ACN, FL set up the methodology in Bayreuth, performed the experiments, validated the results, and was in charge of the curation, formal analysis, and visualization of the data. FL and ACN prepared the manuscript with contributions from all co-authors.
The contact author has declared that none of the authors has any competing interests.
Publisher’s note: Copernicus Publications remains neutral with regard to jurisdictional claims made in the text, published maps, institutional affiliations, or any other geographical representation in this paper. While Copernicus Publications makes every effort to include appropriate place names, the final responsibility lies with the authors.
We thank the workshop of the University of Bayreuth for manufacturing the SPME-GC-MS sampling cell. Also, we thank Andrej Einhorn and Agnes Bednorz for their support regarding the technical setup and the experimental work. We thank Sergej Bleicher for helpful discussions about the solar simulator emission spectrum and Cornelius Zetzsch for advice regarding hydroxyl radical generation.
This research has been supported by the European Commission Horizon 2020 Framework Programme (H2020-INFRADEV-2019-2, grant no. 871115) for practical training at the EUPHORE chambers via ACTRIS TNA. The German Research Foundation (Deutsche Forschungsgemeinschaft, DFG) financed the PTR-ToF-MS (grant no. 495692966). This open-access publication was funded by the Open Access Publishing Fund of the University of Bayreuth.
This paper was edited by Anna Novelli and reviewed by two anonymous referees.
Alfarra, R., Camredon, M., Cazaunau, M., Doussin, J.-F., Fuchs, H., Jorga, S., McFiggans, G., Newland, M. J., Pandis, S., Rickard, A. R., and Saathoff, H.: Physical and Chemical Characterization of the Chamber, in: A Practical Guide to Atmospheric Simulation Chambers, edited by: Doussin, J.-F., Fuchs, H., Kiendler-Scharr, A., Seakins, P., and Wenger, J., Springer International Publishing, Cham, 73–111, https://doi.org/10.1007/978-3-031-22277-1_2, 2023.
Altshuller, A. P.: Ambient Air Hydroxyl Radical Concentrations: Measurements and Model Predictions, JAPCA, 39, 704–708, https://doi.org/10.1080/08940630.1989.10466556, 1989.
Arthur, C. L. and Pawliszyn, J.: Solid phase microextraction with thermal desorption using fused silica optical fibers, Anal. Chem., 62, 2145–2148, https://doi.org/10.1021/ac00218a019, 1990.
Atkinson, R. and Aschmann, S. M.: Products of the gas-phase reactions of aromatic hydrocarbons: Effect of NO2 concentration, Int. J. Chem. Kinet., 26, 929–944, https://doi.org/10.1002/kin.550260907, 1994.
Atkinson, R., Carter, W. P. L., Darnall, K. R., Winer, A. M., and Pitts Jr., J. N.: A smog chamber and modeling study of the gas phase NOx–air photooxidation of toluene and the cresols, Int. J. Chem. Kinet., 12, 779–836, https://doi.org/10.1002/kin.550121102, 1980.
Atkinson, R., Carter, W. P. L., and Winer, A. M.: Effects of pressure on product yields in the nitrogen oxide (NOx) photooxidations of selected aromatic hydrocarbons, J. Phys. Chem., 87, 1605–1610, https://doi.org/10.1021/j100232a029, 1983.
Atkinson, R., Aschmann, S. M., Arey, J., and Carter, W. P. L.: Formation of ring-retaining products from the OH radical-initiated reactions of benzene and toluene, Int. J. Chem. Kinet., 21, 801–827, https://doi.org/10.1002/kin.550210907, 1989.
Baltaretu, C. O., Lichtman, E. I., Hadler, A. B., and Elrod, M. J.: Primary Atmospheric Oxidation Mechanism for Toluene, J. Phys. Chem. A, 113, 221–230, https://doi.org/10.1021/jp806841t, 2009.
Bartelt, R. J.: Calibration of a Commercial Solid-Phase Microextraction Device for Measuring Headspace Concentrations of Organic Volatiles, Anal. Chem., 69, 364–372, https://doi.org/10.1021/ac960820n, 1997.
Behnke, W., Holländer, W., Koch, W., Nolting, F., and Zetzsch, C.: A smog chamber for studies of the photochemical degradation of chemicals in the presence of aerosols, Atmos. Environ. 1967, 22, 1113–1120, https://doi.org/10.1016/0004-6981(88)90341-1, 1988.
Bell, D., Doussin, J.-F., and Hohaus, T.: Preparation of Simulation Chambers for Experiments, in: A Practical Guide to Atmospheric Simulation Chambers, edited by: Doussin, J.-F., Fuchs, H., Kiendler-Scharr, A., Seakins, P., and Wenger, J., Springer International Publishing, Cham, 113–127, https://doi.org/10.1007/978-3-031-22277-1_3, 2023.
Berndt, T., Scholz, W., Mentler, B., Fischer, L., Herrmann, H., Kulmala, M., and Hansel, A.: Accretion Product Formation from Self- and Cross-Reactions of RO2 Radicals in the Atmosphere, Angew. Chem. Int. Ed., 57, 3820–3824, https://doi.org/10.1002/anie.201710989, 2018.
Bleicher, S.: Zur Halogenaktivierung im Aerosol und in Salzpfannen, Doctoral thesis, University of Bayreuth, Bayreuth, 181 pp., URN urn:nbn:de:bvb:703-opus4-13701, 2012.
Bloss, C., Wagner, V., Jenkin, M. E., Volkamer, R., Bloss, W. J., Lee, J. D., Heard, D. E., Wirtz, K., Martin-Reviejo, M., Rea, G., Wenger, J. C., and Pilling, M. J.: Development of a detailed chemical mechanism (MCMv3.1) for the atmospheric oxidation of aromatic hydrocarbons, Atmos. Chem. Phys., 5, 641–664, https://doi.org/10.5194/acp-5-641-2005, 2005.
Bohn, B., Rohrer, F., Brauers, T., and Wahner, A.: Actinometric measurements of NO2 photolysis frequencies in the atmosphere simulation chamber SAPHIR, Atmos. Chem. Phys., 5, 493–503, https://doi.org/10.5194/acp-5-493-2005, 2005.
Borrás, E., Tortajada-Genaro, L. A., Ródenas, M., Vera, T., Speak, T., Seakins, P., Shaw, M. D., Lewis, A. C., and Muñoz, A.: On-line solid phase microextraction derivatization for the sensitive determination of multi-oxygenated volatile compounds in air, Atmos. Meas. Tech., 14, 4989–4999, https://doi.org/10.5194/amt-14-4989-2021, 2021.
Buxmann, J., Balzer, N., Bleicher, S., Platt, U., and Zetzsch, C.: Observations of bromine explosions in smog chamber experiments above a model salt pan, Int. J. Chem. Kinet., 44, 312–326, https://doi.org/10.1002/kin.20714, 2012.
Cabrera-Perez, D., Taraborrelli, D., Sander, R., and Pozzer, A.: Global atmospheric budget of simple monocyclic aromatic compounds, Atmos. Chem. Phys., 16, 6931–6947, https://doi.org/10.5194/acp-16-6931-2016, 2016.
Carter, W. P. L., Winer, A. M., Darnall, K. R., and Pitts, J. N. Jr.: Smog chamber studies of temperature effects in photochemical smog, Environ. Sci. Technol., 13, 1094–1100, https://doi.org/10.1021/es60157a006, 1979.
Carter, W. P. L., Cocker, D. R., Fitz, D. R., Malkina, I. L., Bumiller, K., Sauer, C. G., Pisano, J. T., Bufalino, C., and Song, C.: A new environmental chamber for evaluation of gas-phase chemical mechanisms and secondary aerosol formation, Atmos. Environ., 39, 7768–7788, https://doi.org/10.1016/j.atmosenv.2005.08.040, 2005.
Charan, S. M., Buenconsejo, R. S., and Seinfeld, J. H.: Secondary organic aerosol yields from the oxidation of benzyl alcohol, Atmos. Chem. Phys., 20, 13167–13190, https://doi.org/10.5194/acp-20-13167-2020, 2020.
Chu, B., Chen, T., Liu, Y., Ma, Q., Mu, Y., Wang, Y., Ma, J., Zhang, P., Liu, J., Liu, C., Gui, H., Hu, R., Hu, B., Wang, X., Wang, Y., Liu, J., Xie, P., Chen, J., Liu, Q., Jiang, J., Li, J., He, K., Liu, W., Jiang, G., Hao, J., and He, H.: Application of smog chambers in atmospheric process studies, Natl. Sci. Rev., 9, nwab103, https://doi.org/10.1093/nsr/nwab103, 2022.
Dumdei, B. E., Kenny, D. V., Shepson, P. B., Kleindienst, T. E., Nero, C. M., Cupitt, L. T., and Claxton, L. D.: MS/MS analysis of the products of toluene photooxidation and measurement of their mutagenic activity, Environ. Sci. Technol., 22, 1493–1498, https://doi.org/10.1021/es00177a017, 1988.
Finlayson-Pitts, B. J. and Pitts Jr., J. N.: Chemistry of the Upper and Lower Atmosphere: Theory, Experiments, and Applications, Elsevier, 993 pp., https://doi.org/10.1016/B978-0-12-257060-5.X5000-X, 2000.
Galloway, M. M., Huisman, A. J., Yee, L. D., Chan, A. W. H., Loza, C. L., Seinfeld, J. H., and Keutsch, F. N.: Yields of oxidized volatile organic compounds during the OH radical initiated oxidation of isoprene, methyl vinyl ketone, and methacrolein under high-NOx conditions, Atmos. Chem. Phys., 11, 10779–10790, https://doi.org/10.5194/acp-11-10779-2011, 2011.
Gkatzelis, G. I., Hohaus, T., Tillmann, R., Gensch, I., Müller, M., Eichler, P., Xu, K.-M., Schlag, P., Schmitt, S. H., Yu, Z., Wegener, R., Kaminski, M., Holzinger, R., Wisthaler, A., and Kiendler-Scharr, A.: Gas-to-particle partitioning of major biogenic oxidation products: a study on freshly formed and aged biogenic SOA, Atmos. Chem. Phys., 18, 12969–12989, https://doi.org/10.5194/acp-18-12969-2018, 2018.
Gómez Alvarez, E., Viidanoja, J., Muñoz, A., Wirtz, K., and Hjorth, J.: Experimental Confirmation of the Dicarbonyl Route in the Photo-oxidation of Toluene and Benzene, Environ. Sci. Technol., 41, 8362–8369, https://doi.org/10.1021/es0713274, 2007.
Gómez Alvarez, E., Moreno, M. V., Gligorovski, S., Wortham, H., and Cases, M. V.: Characterisation and calibration of active sampling Solid Phase Microextraction applied to sensitive determination of gaseous carbonyls, Talanta, 88, 252–258, https://doi.org/10.1016/j.talanta.2011.10.039, 2012.
Grosjean, D.: Wall loss of gaseous pollutants in outdoor Teflon chambers, Environ. Sci. Technol., 19, 1059–1065, https://doi.org/10.1021/es00141a006, 1985.
Henze, D. K., Seinfeld, J. H., Ng, N. L., Kroll, J. H., Fu, T.-M., Jacob, D. J., and Heald, C. L.: Global modeling of secondary organic aerosol formation from aromatic hydrocarbons: high- vs. low-yield pathways, Atmos. Chem. Phys., 8, 2405–2420, https://doi.org/10.5194/acp-8-2405-2008, 2008.
Hu, D., Tolocka, M., Li, Q., and Kamens, R. M.: A kinetic mechanism for predicting secondary organic aerosol formation from toluene oxidation in the presence of NOx and natural sunlight, Atmos. Environ., 41, 6478–6496, https://doi.org/10.1016/j.atmosenv.2007.04.025, 2007.
Huang, Y., Coggon, M. M., Zhao, R., Lignell, H., Bauer, M. U., Flagan, R. C., and Seinfeld, J. H.: The Caltech Photooxidation Flow Tube reactor: design, fluid dynamics and characterization, Atmos. Meas. Tech., 10, 839–867, https://doi.org/10.5194/amt-10-839-2017, 2017.
IUPAC: Evaluated Kinetic Data, International Union of Pure and Applied Chemistry (IUPAC) Task Group on Atmospheric Chemical Kinetic Data Evaluation, https://iupac.aeris-data.fr/ (last access: 5 February 2024), 2024.
Jang, M. and Kamens, R. M.: Newly characterized products and composition of secondary aerosols from the reaction of á-pinene with ozone, Atmos. Environ., 33, 459–474, https://doi.org/10.1016/S1352-2310(98)00222-2, 1999.
Jenkin, M. E., Saunders, S. M., Wagner, V., and Pilling, M. J.: Protocol for the development of the Master Chemical Mechanism, MCM v3 (Part B): tropospheric degradation of aromatic volatile organic compounds, Atmos. Chem. Phys., 3, 181–193, https://doi.org/10.5194/acp-3-181-2003, 2003.
Jenkin, M. E., Glowacki, D. R., Rickard, A. R., and Pilling, M. J.: Comment on “Primary Atmospheric Oxidation Mechanism for Toluene,” J. Phys. Chem. A, 113, 8136–8138, https://doi.org/10.1021/jp903119k, 2009.
Ji, Y., Zhao, J., Terazono, H., Misawa, K., Levitt, N. P., Li, Y., Lin, Y., Peng, J., Wang, Y., Duan, L., Pan, B., Zhang, F., Feng, X., An, T., Marrero-Ortiz, W., Secrest, J., Zhang, A. L., Shibuya, K., Molina, M. J., and Zhang, R.: Reassessing the atmospheric oxidation mechanism of toluene, P. Natl. Acad. Sci. USA, 114, 8169–8174, https://doi.org/10.1073/pnas.1705463114, 2017.
Kanakidou, M., Seinfeld, J. H., Pandis, S. N., Barnes, I., Dentener, F. J., Facchini, M. C., Van Dingenen, R., Ervens, B., Nenes, A., Nielsen, C. J., Swietlicki, E., Putaud, J. P., Balkanski, Y., Fuzzi, S., Horth, J., Moortgat, G. K., Winterhalter, R., Myhre, C. E. L., Tsigaridis, K., Vignati, E., Stephanou, E. G., and Wilson, J.: Organic aerosol and global climate modelling: a review, Atmos. Chem. Phys., 5, 1053–1123, https://doi.org/10.5194/acp-5-1053-2005, 2005.
Kiendler-Scharr, A., Becker, K.-H., Doussin, J.-F., Fuchs, H., Seakins, P., Wenger, J., and Wiesen, P.: Introduction to Atmospheric Simulation Chambers and Their Applications, in: A Practical Guide to Atmospheric Simulation Chambers, edited by: Doussin, J.-F., Fuchs, H., Kiendler-Scharr, A., Seakins, P., and Wenger, J., Springer International Publishing, Cham, 1–72, https://doi.org/10.1007/978-3-031-22277-1_1, 2023.
Klotz, B., Sørensen, S., Barnes, I., Becker, K. H., Etzkorn, T., Volkamer, R., Platt, U., Wirtz, K., and Martín-Reviejo, M.: Atmospheric Oxidation of Toluene in a Large-Volume Outdoor Photoreactor: In Situ Determination of Ring-Retaining Product Yields, J. Phys. Chem. A, 102, 10289–10299, https://doi.org/10.1021/jp982719n, 1998.
Koss, A. R., Sekimoto, K., Gilman, J. B., Selimovic, V., Coggon, M. M., Zarzana, K. J., Yuan, B., Lerner, B. M., Brown, S. S., Jimenez, J. L., Krechmer, J., Roberts, J. M., Warneke, C., Yokelson, R. J., and de Gouw, J.: Non-methane organic gas emissions from biomass burning: identification, quantification, and emission factors from PTR-ToF during the FIREX 2016 laboratory experiment, Atmos. Chem. Phys., 18, 3299–3319, https://doi.org/10.5194/acp-18-3299-2018, 2018.
Koziel, J. A. and Pawliszyn, J.: Air sampling and analysis of volatile organic compounds with solid phase microextraction, J. Air Waste Manag. Assoc., 51, 173–184, https://doi.org/10.1080/10473289.2001.10464263, 2001.
Krechmer, J. E., Day, D. A., and Jimenez, J. L.: Always Lost but Never Forgotten: Gas-Phase Wall Losses Are Important in All Teflon Environmental Chambers, Environ. Sci. Technol., 54, 12890–12897, https://doi.org/10.1021/acs.est.0c03381, 2020.
Lelieveld, J., Butler, T. M., Crowley, J. N., Dillon, T. J., Fischer, H., Ganzeveld, L., Harder, H., Lawrence, M. G., Martinez, M., Taraborrelli, D., and Williams, J.: Atmospheric oxidation capacity sustained by a tropical forest, Nature, 452, 737–740, https://doi.org/10.1038/nature06870, 2008.
Leskinen, A., Yli-Pirilä, P., Kuuspalo, K., Sippula, O., Jalava, P., Hirvonen, M.-R., Jokiniemi, J., Virtanen, A., Komppula, M., and Lehtinen, K. E. J.: Characterization and testing of a new environmental chamber, Atmos. Meas. Tech., 8, 2267–2278, https://doi.org/10.5194/amt-8-2267-2015, 2015.
Lindinger, W., Hansel, A., and Jordan, A.: On-line monitoring of volatile organic compounds at pptv levels by means of proton-transfer-reaction mass spectrometry (PTR-MS) medical applications, food control and environmental research, Int. J. Mass Spectrom. Ion Process., 173, 191–241, https://doi.org/10.1016/S0168-1176(97)00281-4, 1998.
Liu, X., Jeffries, H. E., and Sexton, K. G.: Atmospheric Photochemical Degradation of 1,4-Unsaturated Dicarbonyls, Environ. Sci. Technol., 33, 4212–4220, https://doi.org/10.1021/es990469y, 1999.
Lumiaro, E., Todorović, M., Kurten, T., Vehkamäki, H., and Rinke, P.: Predicting gas–particle partitioning coefficients of atmospheric molecules with machine learning, Atmos. Chem. Phys., 21, 13227–13246, https://doi.org/10.5194/acp-21-13227-2021, 2021.
Ma, W., Liu, Y., Zhang, Y., Feng, Z., Zhan, J., Hua, C., Ma, L., Guo, Y., Zhang, Y., Zhou, W., Yan, C., Chu, B., Chen, T., Ma, Q., Liu, C., Kulmala, M., Mu, Y., and He, H.: A New Type of Quartz Smog Chamber: Design and Characterization, Environ. Sci. Technol., 56, 2181–2190, https://doi.org/10.1021/acs.est.1c06341, 2022.
Majer, J. R., Naman, S.-A. M. A., and Robb, J. C.: Photolysis of aromatic aldehydes, Trans. Faraday Soc., 65, 1846–1853, https://doi.org/10.1039/TF9696501846, 1969.
Martos, P. A. and Pawliszyn, J.: Calibration of Solid Phase Microextraction for Air Analyses Based on Physical Chemical Properties of the Coating, Anal. Chem., 69, 206–215, https://doi.org/10.1021/ac960415w, 1997.
Martos, P. A. and Pawliszyn, J.: Sampling and Determination of Formaldehyde Using Solid-Phase Microextraction with On-Fiber Derivatization, Anal. Chem., 70, 2311–2320, https://doi.org/10.1021/ac9711394, 1998.
Matsunaga, A. and Ziemann, P. J.: Gas-Wall Partitioning of Organic Compounds in a Teflon Film Chamber and Potential Effects on Reaction Product and Aerosol Yield Measurements, Aerosol Sci. Technol., 44, 881–892, https://doi.org/10.1080/02786826.2010.501044, 2010.
McMurry, P. H. and Grosjean, D.: Gas and aerosol wall losses in Teflon film smog chambers, Environ. Sci. Technol., 19, 1176–1182, https://doi.org/10.1021/es00142a006, 1985.
Michoud, V., Sauvage, S., Léonardis, T., Fronval, I., Kukui, A., Locoge, N., and Dusanter, S.: Field measurements of methylglyoxal using proton transfer reaction time-of-flight mass spectrometry and comparison to the DNPH–HPLC–UV method, Atmos. Meas. Tech., 11, 5729–5740, https://doi.org/10.5194/amt-11-5729-2018, 2018.
Moschonas, N., Danalatos, D., and Glavas, S.: The effect of O2 and NO2 on the ring retaining products of the reaction of toluene with hydroxyl radicals, Atmos. Environ., 33, 111–116, https://doi.org/10.1016/S1352-2310(98)00134-4, 1998.
Müller, M., Graus, M., Wisthaler, A., Hansel, A., Metzger, A., Dommen, J., and Baltensperger, U.: Analysis of high mass resolution PTR-TOF mass spectra from 1,3,5-trimethylbenzene (TMB) environmental chamber experiments, Atmos. Chem. Phys., 12, 829–843, https://doi.org/10.5194/acp-12-829-2012, 2012.
Munday, E. B., Mullins, J. C., and Edie, D. D.: Vapor pressure data for toluene, 1-pentanol, 1-butanol, water, and 1-propanol and for the water and 1-propanol system from 273.15 to 323.15 K, J. Chem. Eng. Data, 25, 191–194, https://doi.org/10.1021/je60086a006, 1980.
Muñoz, A., Borrás, E., Ródenas, M., Vera, T., and Pedersen, H. A.: Atmospheric Oxidation of a Thiocarbamate Herbicide Used in Winter Cereals, Environ. Sci. Technol., 52, 9136–9144, https://doi.org/10.1021/acs.est.8b02157, 2018.
NCAR: Tropospheric Ultraviolet and Visible (TUV) Radiation Model, v5.3, National Center for Atmospheric Research (NCAR), web version of model, https://www.acom.ucar.edu/Models/TUV/Interactive_TUV/ (last access: 5 February 2024), 2024.
Newland, M. J., Jenkin, M. E., and Rickard, A. R.: Elucidating the fate of the OH-adduct in toluene oxidation under tropospheric boundary layer conditions, P. Natl. Acad. Sci. USA, 114, E7856–E7857, https://doi.org/10.1073/pnas.1713678114, 2017.
Newland, M. J., Rea, G. J., Thüner, L. P., Henderson, A. P., Golding, B. T., Rickard, A. R., Barnes, I., and Wenger, J.: Photochemistry of 2-butenedial and 4-oxo-2-pentenal under atmospheric boundary layer conditions, Phys. Chem. Chem. Phys., 21, 1160–1171, https://doi.org/10.1039/C8CP06437G, 2019.
Olariu, R. I., Klotz, B., Barnes, I., Becker, K. H., and Mocanu, R.: FT–IR study of the ring-retaining products from the reaction of OH radicals with phenol, o-, m-, and p-cresol, Atmos. Environ., 36, 3685–3697, https://doi.org/10.1016/S1352-2310(02)00202-9, 2002.
Pindado Jiménez, O., Pérez Pastor, R. M., Vivanco, M. G., and Santiago Aladro, M.: A chromatographic method to analyze products from photo-oxidation of anthropogenic and biogenic mixtures of volatile organic compounds in smog chambers, Talanta, 106, 20–28, https://doi.org/10.1016/j.talanta.2012.11.081, 2013.
Rissanen, M.: Anthropogenic Volatile Organic Compound (AVOC) Autoxidation as a Source of Highly Oxygenated Organic Molecules (HOM), J. Phys. Chem. A, 125, 9027–9039, https://doi.org/10.1021/acs.jpca.1c06465, 2021.
Rivera-Rios, J. C., Nguyen, T. B., Crounse, J. D., Jud, W., St. Clair, J. M., Mikoviny, T., Gilman, J. B., Lerner, B. M., Kaiser, J. B., de Gouw, J., Wisthaler, A., Hansel, A., Wennberg, P. O., Seinfeld, J. H., and Keutsch, F. N.: Conversion of hydroperoxides to carbonyls in field and laboratory instrumentation: Observational bias in diagnosing pristine versus anthropogenically controlled atmospheric chemistry, Geophys. Res. Lett., 41, 8645–8651, https://doi.org/10.1002/2014GL061919, 2014.
Rohrer, F., Bohn, B., Brauers, T., Brüning, D., Johnen, F.-J., Wahner, A., and Kleffmann, J.: Characterisation of the photolytic HONO-source in the atmosphere simulation chamber SAPHIR, Atmos. Chem. Phys., 5, 2189–2201, https://doi.org/10.5194/acp-5-2189-2005, 2005.
Romano, A. and Hanna, G. B.: Identification and quantification of VOCs by proton transfer reaction time of flight mass spectrometry: An experimental workflow for the optimization of specificity, sensitivity, and accuracy, J. Mass Spectrom., 53, 287–295, https://doi.org/10.1002/jms.4063, 2018.
Salazar Gómez, J. I., Sojka, M., Klucken, C., Schlögl, R., and Ruland, H.: Determination of trace compounds and artifacts in nitrogen background measurements by proton transfer reaction time-of-flight mass spectrometry under dry and humid conditions, J. Mass Spectrom., 56, e4777, https://doi.org/10.1002/jms.4777, 2021.
Saunders, S. M., Jenkin, M. E., Derwent, R. G., and Pilling, M. J.: Protocol for the development of the Master Chemical Mechanism, MCM v3 (Part A): tropospheric degradation of non-aromatic volatile organic compounds, Atmos. Chem. Phys., 3, 161–180, https://doi.org/10.5194/acp-3-161-2003, 2003.
Schmarr, H.-G., Sang, W., Ganss, S., Fischer, U., Köpp, B., Schulz, C., and Potouridis, T.: Analysis of aldehydes via headspace SPME with on-fiber derivatization to their O-(2,3,4,5,6-pentafluorobenzyl)oxime derivatives and comprehensive 2D-GC-MS, J. Sep. Sci., 31, 3458–3465, https://doi.org/10.1002/jssc.200800294, 2008.
Schwantes, R. H., Schilling, K. A., McVay, R. C., Lignell, H., Coggon, M. M., Zhang, X., Wennberg, P. O., and Seinfeld, J. H.: Formation of highly oxygenated low-volatility products from cresol oxidation, Atmos. Chem. Phys., 17, 3453–3474, https://doi.org/10.5194/acp-17-3453-2017, 2017.
Seuwen, R. and Warneck, P.: Oxidation of toluene in NOx free air: Product distribution and mechanism, Int. J. Chem. Kinet., 28, 315–332, https://doi.org/10.1002/(SICI)1097-4601(1996)28:5<315::AID-KIN1>3.0.CO;2-Y, 1996.
Shaw, J. T., Lidster, R. T., Cryer, D. R., Ramirez, N., Whiting, F. C., Boustead, G. A., Whalley, L. K., Ingham, T., Rickard, A. R., Dunmore, R. E., Heard, D. E., Lewis, A. C., Carpenter, L. J., Hamilton, J. F., and Dillon, T. J.: A self-consistent, multivariate method for the determination of gas-phase rate coefficients, applied to reactions of atmospheric VOCs and the hydroxyl radical, Atmos. Chem. Phys., 18, 4039–4054, https://doi.org/10.5194/acp-18-4039-2018, 2018.
Siekmann, F.: Freisetzung von photolabilen und reaktiven Halogenverbindungen aus salzhaltigen Aerosolen unter simulierten troposphärischen Reinluftbedingungen in einer Aerosol-Smogkammer, Doctoral thesis, University of Bayreuth, Bayreuth, 139 pp., URN urn:nbn:de:bvb:703-opus-4917, 2018.
Smith, D. F., McIver, C. D., and Kleindienst, T. E.: Primary Product Distribution from the Reaction of Hydroxyl Radicals with Toluene at ppb NOx Mixing Ratios, J. Atmos. Chem., 30, 209–228, https://doi.org/10.1023/A:1005980301720, 1998.
Stönner, C., Derstroff, B., Klüpfel, T., Crowley, J. N., and Williams, J.: Glyoxal measurement with a proton transfer reaction time of flight mass spectrometer (PTR-TOF-MS): characterization and calibration, J. Mass Spectrom., 52, 30–35, https://doi.org/10.1002/jms.3893, 2017.
Tumbiolo, S., Gal, J.-F., Maria, P.-C., and Zerbinati, O.: Determination of benzene, toluene, ethylbenzene and xylenes in air by solid phase micro-extraction/gas chromatography/mass spectrometry, Anal. Bioanal. Chem., 380, 824–830, https://doi.org/10.1007/s00216-004-2837-1, 2004.
Vaghjiani, G. L. and Ravishankara, A. R.: Photodissociation of H2O2 and CH3OOH at 248 nm and 298 K: Quantum yields for OH, O(3P) and H(2S), J. Chem. Phys., 92, 996–1003, https://doi.org/10.1063/1.458081, 1990.
Vasquez, K. T., Allen, H. M., Crounse, J. D., Praske, E., Xu, L., Noelscher, A. C., and Wennberg, P. O.: Low-pressure gas chromatography with chemical ionization mass spectrometry for quantification of multifunctional organic compounds in the atmosphere, Atmos. Meas. Tech., 11, 6815–6832, https://doi.org/10.5194/amt-11-6815-2018, 2018.
Volkamer, R., Platt, U., and Wirtz, K.: Primary and Secondary Glyoxal Formation from Aromatics: Experimental Evidence for the Bicycloalkyl-Radical Pathway from Benzene, Toluene, and p-Xylene, J. Phys. Chem. A, 105, 7865–7874, https://doi.org/10.1021/jp010152w, 2001.
von Schneidemesser, E., Monks, P. S., Allan, J. D., Bruhwiler, L., Forster, P., Fowler, D., Lauer, A., Morgan, W. T., Paasonen, P., Righi, M., Sindelarova, K., and Sutton, M. A.: Chemistry and the Linkages between Air Quality and Climate Change, Chem. Rev., 115, 3856–3897, https://doi.org/10.1021/acs.chemrev.5b00089, 2015.
Wagner, V., Jenkin, M. E., Saunders, S. M., Stanton, J., Wirtz, K., and Pilling, M. J.: Modelling of the photooxidation of toluene: conceptual ideas for validating detailed mechanisms, Atmos. Chem. Phys., 3, 89–106, https://doi.org/10.5194/acp-3-89-2003, 2003.
White, S. J., Jamie, I. M., and Angove, D. E.: Chemical characterisation of semi-volatile and aerosol compounds from the photooxidation of toluene and NOx, Atmos. Environ., 83, 237–244, https://doi.org/10.1016/j.atmosenv.2013.11.023, 2014.
Williams, J., Keßel, S. U., Nölscher, A. C., Yang, Y., Lee, Y., Yáñez-Serrano, A. M., Wolff, S., Kesselmeier, J., Klüpfel, T., Lelieveld, J., and Shao, M.: Opposite OH reactivity and ozone cycles in the Amazon rainforest and megacity Beijing: Subversion of biospheric oxidant control by anthropogenic emissions, Atmos. Environ., 125, 112–118, https://doi.org/10.1016/j.atmosenv.2015.11.007, 2016.
Wittmer, J., Bleicher, S., and Zetzsch, C.: Iron(III)-Induced Activation of Chloride and Bromide from Modeled Salt Pans, J. Phys. Chem. A, 119, 4373–4385, https://doi.org/10.1021/jp508006s, 2015.
Wróblewski, T., Ziemczonek, L., Alhasan, A. M., and Karwasz, G. P.: Ab initio and density functional theory calculations of proton affinities for volatile organic compounds, Eur. Phys. J. Spec. Top., 144, 191–195, https://doi.org/10.1140/epjst/e2007-00126-7, 2007.
Wu, R., Pan, S., Li, Y., and Wang, L.: Atmospheric Oxidation Mechanism of Toluene, J. Phys. Chem. A, 118, 4533–4547, https://doi.org/10.1021/jp500077f, 2014.
Ye, P., Ding, X., Hakala, J., Hofbauer, V., Robinson, E. S., and Donahue, N. M.: Vapor wall loss of semi-volatile organic compounds in a Teflon chamber, Aerosol Sci. Tech., 50, 822–834, https://doi.org/10.1080/02786826.2016.1195905, 2016.
Yeh, G. K. and Ziemann, P. J.: Gas-Wall Partitioning of Oxygenated Organic Compounds: Measurements, Structure–Activity Relationships, and Correlation with Gas Chromatographic Retention Factor, Aerosol Sci. Tech., 49, 727–738, https://doi.org/10.1080/02786826.2015.1068427, 2015.
Yeoman, A. M., Shaw, M., and Lewis, A. C.: Estimating person-to-person variability in VOC emissions from personal care products used during showering, Indoor Air, 31, 1281–1291, https://doi.org/10.1111/ina.12811, 2021.
Yu, J., Flagan, R. C., and Seinfeld, J. H.: Identification of Products Containing -COOH, -OH, and -CO in Atmospheric Oxidation of Hydrocarbons, Environ. Sci. Technol., 32, 2357–2370, https://doi.org/10.1021/es980129x, 1998.
Zádor, J., Turányi, T., Wirtz, K., and Pilling, M. J.: Measurement and investigation of chamber radical sources in the European Photoreactor (EUPHORE), J. Atmos. Chem., 55, 147–166, https://doi.org/10.1007/s10874-006-9033-y, 2006.
Zaytsev, A., Koss, A. R., Breitenlechner, M., Krechmer, J. E., Nihill, K. J., Lim, C. Y., Rowe, J. C., Cox, J. L., Moss, J., Roscioli, J. R., Canagaratna, M. R., Worsnop, D. R., Kroll, J. H., and Keutsch, F. N.: Mechanistic study of the formation of ring-retaining and ring-opening products from the oxidation of aromatic compounds under urban atmospheric conditions, Atmos. Chem. Phys., 19, 15117–15129, https://doi.org/10.5194/acp-19-15117-2019, 2019.
Zhang, R. M., Truhlar, D. G., and Xu, X.: Kinetics of the Toluene Reaction with OH Radical, Research, 2019, 5373785, https://doi.org/10.34133/2019/5373785, 2019.
Zhang, X., Schwantes, R. H., McVay, R. C., Lignell, H., Coggon, M. M., Flagan, R. C., and Seinfeld, J. H.: Vapor wall deposition in Teflon chambers, Atmos. Chem. Phys., 15, 4197–4214, https://doi.org/10.5194/acp-15-4197-2015, 2015.
Zhao, Y., Li, Y., Kumar, A., Ying, Q., Vandenberghe, F., and Kleeman, M. J.: Separately resolving NOx and VOC contributions to ozone formation, Atmos. Environ., 285, 119224, https://doi.org/10.1016/j.atmosenv.2022.119224, 2022.