the Creative Commons Attribution 4.0 License.
the Creative Commons Attribution 4.0 License.
 | 09 Aug 2024
Multi-decadal atmospheric carbon dioxide measurements in Hungary, central Europe
The paper reviews and evaluates a 30-year-long atmospheric CO2 data series measured at the Hegyhátsál tall-tower greenhouse gas monitoring site, a member of the World Meteorological Organization (WMO) Global Atmosphere Watch (GAW), US National Oceanic and Atmospheric Administration (NOAA), and pan-European Integrated Carbon Observation System (ICOS) networks. The paper also gives the technical description of the monitoring system and its changes over time and introduces the environment of the station. This low-elevation (248 m above mean sea level – m a.m.s.l.), mid-continental central European site shows a 3.90 ± 0.83 µmol mol−1 offset relative to the latitudinally representative marine boundary layer reference concentration, presumably due to European net anthropogenic emissions. The long-term trend (2.20 ) closely follows the global tendencies. In the concentration growth rate, the ENSO effect is clearly detectable with a 6–7-month lag time. The summer diurnal concentration amplitude is slightly decreasing due to the faster-than-average increase in the nighttime concentrations, which is related to the warming climate. The warming climate also caused a 0.96 ± 0.41 d yr−1 advance at the beginning of the summer CO2-deficit season in the first half of the measurement period, which did not continue later. The summer CO2-deficit season was extended by 9.0 ± 6.1 d during the measurement period.
- Article
(6088 KB) - Full-text XML
-
Supplement
(1032 KB) - BibTeX
- EndNote


More than a century ago Ekholm (1901) and Arrhenius (1908) suggested that carbon dioxide (CO2) produced by coal burning might accumulate in the atmosphere, causing global climate change in the long run. Later, analyzing the sporadic measurements available, Callendar (1938, 1949) considered it proven that carbon dioxide was indeed accumulating in the atmosphere and that it might be the driver of the warming trend observed since the beginning of the 20th century. However, the revealed trend was not convincing because of the uncertainties caused by the wide scatter of the data, the different measurement methods used, the different sampling protocols applied, and the different characteristics of the sampling locations. Finally, radiocarbon studies of Suess (1955) and Revelle and Suess (1957) confirmed that atmospheric carbon dioxide concentrations were indeed increasing, potentially foreshadowing dangerous global climate change. Their works led to the initiation of direct continuous monitoring of atmospheric carbon dioxide concentration by Keeling in 1957 (Keeling, 1960). Since David Keeling's pioneering work, a large number of monitoring sites have been established around the world (World Meteorological Organization BAPMoN/Global Atmosphere Watch – GAW – network, US National Oceanic and Atmospheric Administration – NOAA – Global Cooperative Air Sampling Network, and other network-independent monitoring sites – WDCGG, 2023a). At the beginning, they were established in very isolated remote places, far from any anthropogenic and biospheric influences (arctic regions, high mountain peaks, mid-oceanic islands). However, one of the main actors of the global carbon cycle is the biosphere with its climate-sensitive assimilation, respiration, and carbon storage. While the remote sites were able to record the changes in the CO2 content of the global background atmosphere, they could not provide detailed information on the governing biospheric processes, e.g., on the effects of the biosphere–climate interactions. By the end of the 1980s, it became evident that the carbon cycle could not be properly quantified, and thus the future evolution of the climate could not be assessed without the operation of extensive monitoring networks in the mid-continental, vegetation-covered regions (Tans, 1991).
In 1981, when the first CO2 monitoring station was established in Hungary (K-puszta; 46°58′ N, 19°33′ E; 125 m a.m.s.l. – WMO GAW code: KPS, WIGOS ID: 0-348-4-46316), there were only six similar monitoring sites in Europe, five in Germany (Levin et al., 1995) and one in Italy (Ciattaglia, 1983), which reported data to the World Meteorological Organization (WMO) (WDCGG, 2023b). Measurements at K-puszta started in June 1981. Tans (1991) suggested the use of tall towers (100+ m) for monitoring in continental environments to increase spatial representativeness, avoiding any direct influence from local natural or anthropogenic sources and sinks. Construction of a tall tower at the original Hungarian monitoring site in K-puszta was not possible; therefore, a TV and radio transmission tower 220 km to the west of it (Hegyhátsál; 46°57′ N, 16°39′ E; 248 m a.m.s.l.) was equipped in 1993. The in situ measurements started in September 1994. By now, the two sites together have a 43-year-long data series from this central European region. K-puszta was shut down in 1999 but allowed 5 years of parallel measurements at the two sites.
Since the 1960s, many monitoring sites have been established, especially during the last decade, and more than 150 are reporting data to international databases such as the WMO World Data Centre for Greenhouse Gases (WDCGG, 2023b) or the ObsPack product of the United States National Oceanic and Atmospheric Administration (Masarie et al., 2014; Schuldt et al., 2023). The global dataset is primarily used for the localization and quantification of carbon dioxide sources and sinks by inverse atmospheric transport models, as well as for the determination of the carbon budget of the atmosphere (see, e.g., Friedlingstein et al., 2023). For a large number of stations, the measurement data from the individual monitoring sites are also published with the technical details of the measurements and present the site-specific variations in the CO2 concentration (see, e.g., Navascues and Rus, 1991; Cundari et al., 1995; Levin et al., 1995; Aalto et al., 2002; Derwent et al., 2002; Necki et al., 2003; Schmidt et al., 2003, 2014; Zhou et al., 2006; Artuso et al., 2009; Thompson et al., 2009; Popa et al., 2010; Winderlich et al., 2010; Vermeulen et al., 2011; Brailsford et al., 2012; Stephens et al., 2013; Fang et al., 2014, 2015; Liu et al., 2014; Lopez et al., 2015; Zhu and Yoshikawa-Inoue, 2015; Apadula et al., 2019; Conil et al., 2019; Curcoll et al., 2019; Pérez et al., 2020; Xia et al., 2020; Botía et al., 2022; Lelandais et al., 2022; Panov et al., 2022; Adcock et al., 2023; Wu et al., 2023 – and others). This information may be valuable for model tuning and validation, as well as for the interpretation of the model results. The reliability of the model results depends on the extension, density, and spatial distribution of the monitoring network. The coverage of Europe has increased significantly during the last 2 decades, especially with the establishment of the pan-European Integrated Carbon Observation System (ICOS) (Heiskanen et al., 2022). A large part of Europe is located in the zone of the westerlies. A monitoring station in the eastern part of Europe can provide valuable information on emissions in highly industrialized, densely populated western Europe. Despite the expansion of the European monitoring network, the Hungarian monitoring sites are still the southeasternmost stations in geographical Europe.
As the characteristics of the first Hungarian monitoring site in K-puszta have already been published (Haszpra, 1995, 1999a, b), the present paper focuses on the measurements performed at the Hegyhátsál tall-tower greenhouse gas monitoring station since 1994.
2.1 Monitoring site
The Hegyhátsál tall-tower greenhouse gas monitoring station was established in the framework of a scientific cooperation between the Hungarian Meteorological Service (HMS) and the US National Oceanic and Atmospheric Administration (NOAA) in 1993. The 117 m tall tower equipped with air intakes and meteorological sensors is a TV and radio transmitter tower owned by the telecommunication company Antenna Hungária Corporation. The operation of the monitoring site was taken over from HMS by the Institute for Nuclear Physics (ATOMKI), Hungary, in 2020.
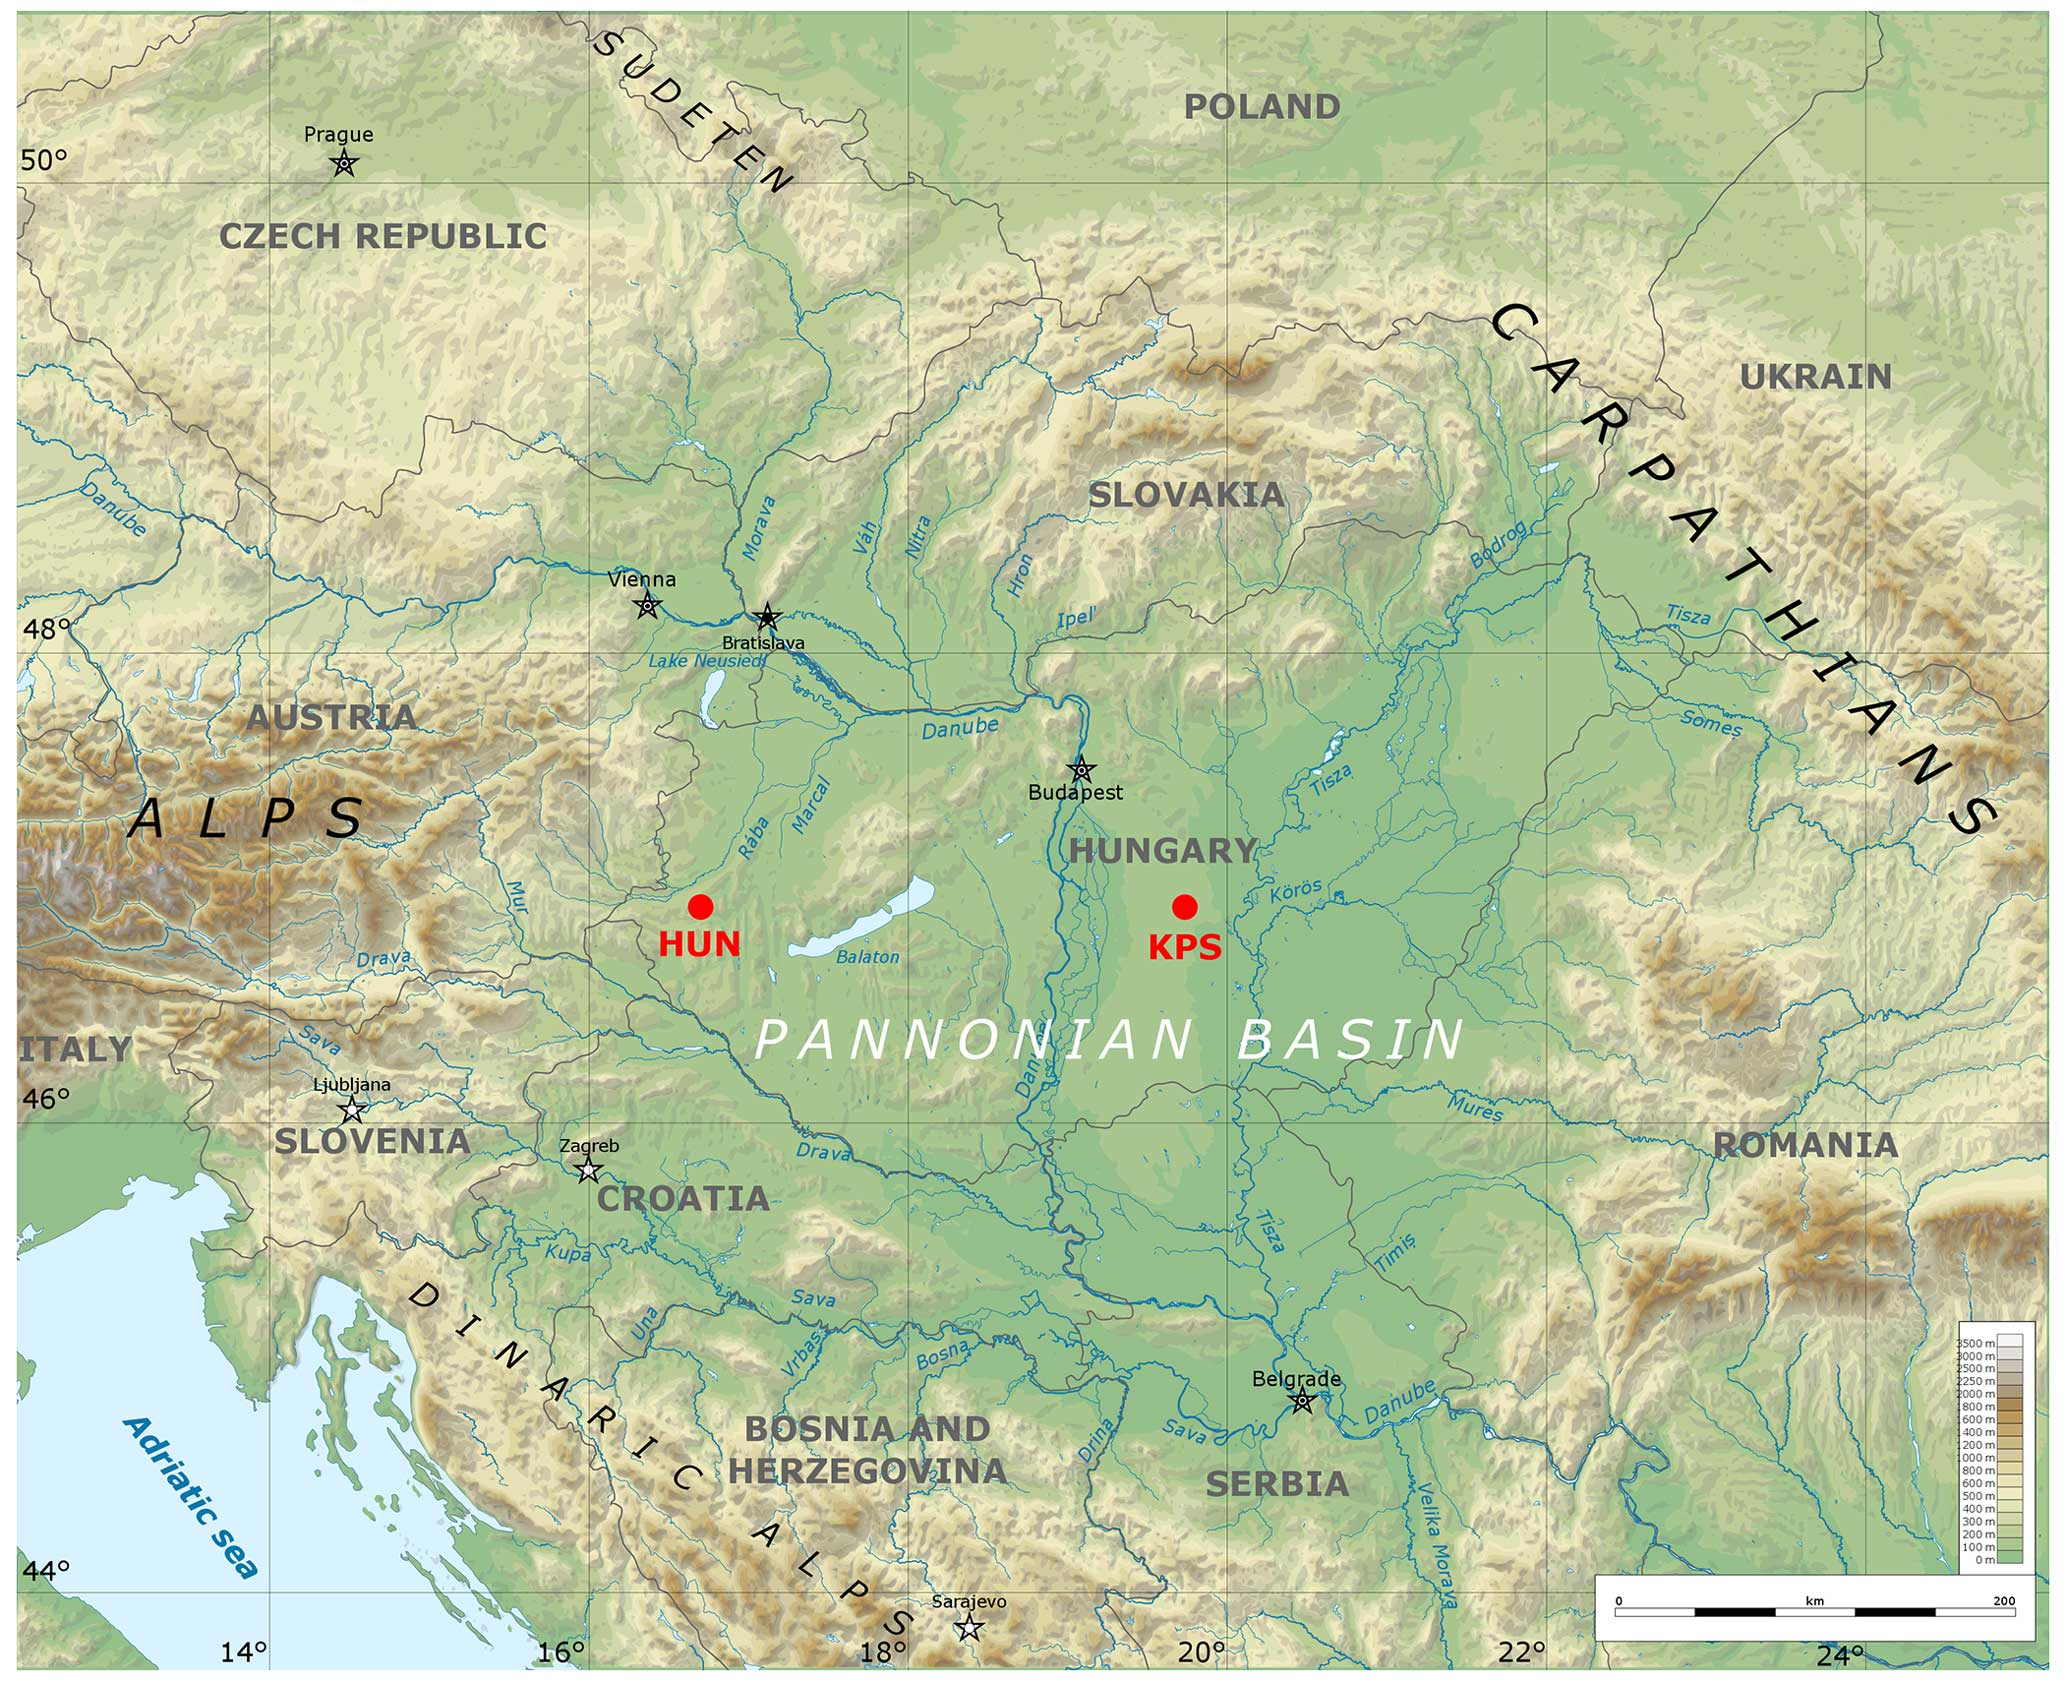
Figure 1Geographical locations of the Hungarian CO2 monitoring stations (HUN – Hegyhátsál, KPS – K-puszta) (map base: https://en.wikipedia.org/wiki/Pannonian_Basin, last access: 18 December 2023).
As shown in Fig. 1 the station is located near the western edge of the Pannonian Basin (46°57′ N, 16°39′ E) at an altitude of 248 m a.m.s.l. in a fairly flat region and in a rural environment, which provides high spatial representativeness to the measurements. The terrain does not modify the regional-scale atmospheric conditions; thus, no special microclimate can develop around the station. The monitoring site is surrounded by agricultural fields (dominantly corn, winter wheat, sunflower, and rapeseed in crop rotation with small plots of other cultivars of annually changing types), grasslands, and forest patches. The distribution of vegetation types within 10 km of the tower (53 % agricultural region, 35 % forest, 6 % grassland, 6 % other, which includes transitional woodland–scrubland and settlements) does not differ much from the average for the surrounding western Hungarian landscape unit (Barcza et al., 2009). The soil type in the region of the tower is “lessivated brown forest soil” (Alfisol according to the USDA system). The upper layer is generally 10–20 cm thick, and its organic matter content is 5 %–8 % (Haszpra et al., 2018).
Human habitations within 10 km of the tower are only small villages (100–400 inhabitants). The nearest village is Hegyhátsál, giving the name to the tower, located 400–1200 m to the northwest. At the time of the beginning of the measurements, the number of inhabitants was 183, which decreased to 139 by 2023 (KSH, 2023). There is no notable industrial activity in this predominantly agricultural region. Local roads have mostly low levels of traffic (100–400 vehicles per day). The only major road in the region is the two-lane trans-European E65 running northwest–southeast with ∼4000 vehicles per day (Magyar Közút, 2019). Its closest point to the monitoring site is about 500 m to the southwest. A Lagrangian forward transport model was used to estimate the influence of the local emission sources on the concentration measurements. The study (Haszpra et al., 2022) showed that during the most critical winter periods (residential heating in the village in addition to the road traffic and limited vertical mixing of the atmosphere) 83.2 % of the time the emissions from the nearby village did not reach the sampling intake because the emission sources were leeward to the monitoring site or an inversion layer prevented the intake height from contamination. Only in 0.09 % of the winter periods studied did the excess CO2 from the nearby anthropogenic sources exceed 0.04 µmol mol−1. Another study (Haszpra et al., 2008) revealed a lack of nighttime accumulation of sulfur hexafluoride (SF6) at the station. SF6 is mainly used in high-voltage electrical equipment, and thus its emission through leakages is a good indicator of anthropogenic activity. The diurnal variation of the atmospheric mixing would result in a diurnal variation in the concentration if emissions were present. The lack of diurnal variation in the SF6 mixing ratio indicates that there is no remarkable source within the area represented by the measurements. The station can be classified as a regionally representative monitoring site.
The climate of the region is a warm temperate one that is fully humid with a warm summer (Köppen–Geiger class Cfb) (https://gawsis.meteoswiss.ch/GAWSIS//index.html#/search/station/stationReportDetails/0-348-4-16307, last access: 29 May 2024). The mean annual temperature in the region was 10.4 °C in 1991–2020 and increasing rapidly with time (0.54 ± 0.13 °C per decade). The average annual precipitation is 690 mm, showing no significant trend but a wide range of variation between 475 and 939 mm yr−1 during the indicated period (Hungarian Meteorological Service, 2023) (Fig. S1 in the Supplement). Although the monitoring station is located in the zone of westerly winds, the prevailing wind directions at the site are northeast and southwest. This is the consequence of the location of the Alps, which rise approximately 100 km to the west of the station and significantly modify the regional wind pattern. The westerly airflows bypass the Alps on the north or the south side and reach the monitoring site almost perpendicularly. The sensitivity area map of the station calculated by the STILT model (Lin et al., 2003) using the software tool provided by the ICOS Carbon Portal is shown in Fig. 2. The detailed characterization of the station's footprint is available on the ICOS Carbon Portal (Carbon Portal ICOS RI, 2024).
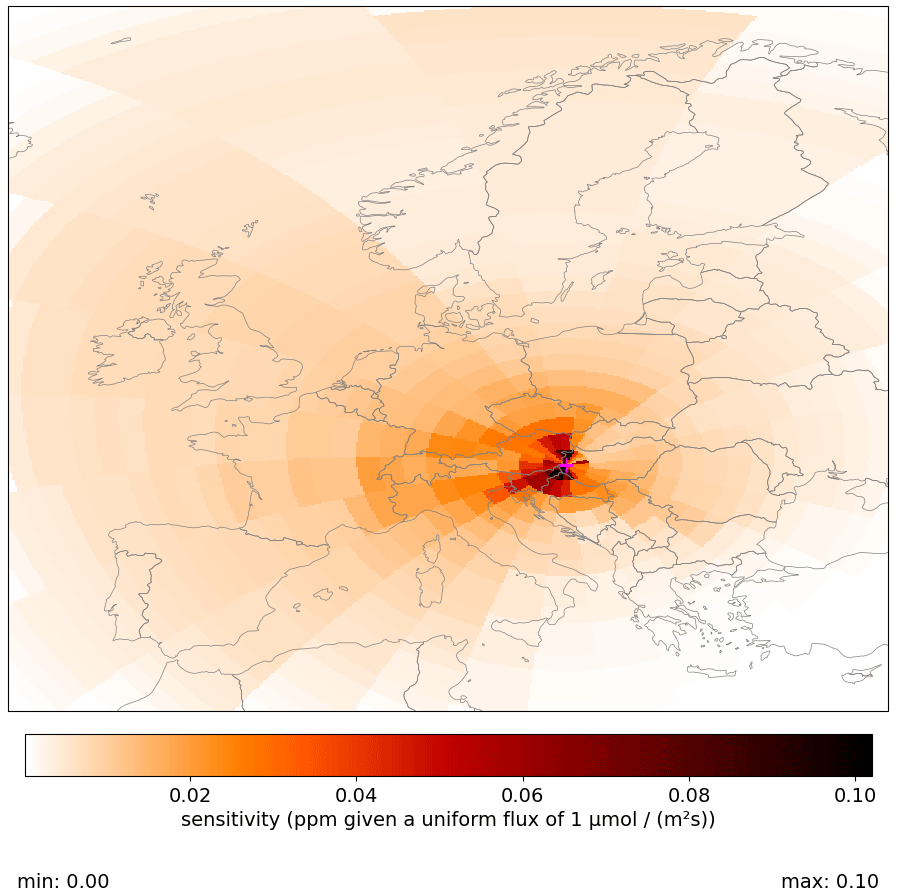
Figure 2The sensitivity area map of the top monitoring level (115 m) at the Hegyhátsál tall-tower monitoring site calculated for 2022. The most important 50 % sensitivity area is 355 000 km2 (Carbon Portal ICOS RI, 2024).
The monitoring site has been a member of the WMO Global Atmosphere Watch (GAW) network (GAW ID: HUN, WIGOS ID: 0-348-4-16307) and of the NOAA Global Cooperative Air Sampling Network (ID: HUN) since its establishment and joined the pan-European Integrated Carbon Observation System (ICOS) in 2022 (ID: HUN).
2.2 Monitoring system
The monitoring site was established in 1993 as a flask air sampling site for the NOAA Global Cooperative Air Sampling Network (Thoning et al., 1995; NOAA, 2023). In situ measurements of carbon dioxide concentration started in 1994. Since the Hegyhátsál monitoring site was set up within the framework of a US–Hungarian scientific collaboration only 1 year after the construction of the first NOAA tall-tower monitoring site in the USA (North Carolina) (Bakwin et al., 1995), the design of the measuring system at Hegyhátsál (Fig. 3) is similar to that at the US tower (Zhao et al., 1997). The dry-air mole fraction of CO2 is measured at 10, 48, 82, and 115 m above the ground. Air is pumped through in. diameter tubes (Synflex 1300) to a CO2 analyzer located on the ground floor in an air-conditioned room. Diaphragm pumps are used to continuously draw air through each of the tubes from the four monitoring levels (1994–2005: KNF model UN73MVP, ∼2 L min−1; from 2005: KNF model N 811 KN.18, ∼6 L min−1). The pumps are protected by Whatman GF/A glass microfiber filters. After leaving the pump, the air at 40 kPa overpressure enters a glass trap for liquid water that is cooled in a standard household refrigerator to dry the air to a dew point of 3–4 °C. Liquid water is forced out through an orifice at the bottom of each trap to minimize the loss of CO2 to the liquid phase. The four inlet tubes and the standard gases are connected to a computer-controlled 16-position flow-through rotary selector valve (VICI AG, Valco Europe). The valve selects which intake tube or standard gas is sampled by the analyzer. The valve head is protected by 7 µm in-line filters. Ambient air continuously flows through the multiport valve so that the system is constantly flushed. The standard gases are shut off when not in use by means of computer-controlled solenoid valves. The air exiting the multiport valve through its common outlet is further dried to a dew point of about −25 °C by passing through a 182 cm long Nafion drier (Permapure, type MD-110-72P) so that the water vapor interference and dilution effect are <0.1 µmol mol−1 equivalent CO2 (Zhao et al., 1997). The Nafion drier is purged in a counterflow arrangement using waste sample air that has been further dried by passage through anhydrous CaSO4 (W. A. Hammond Drierite Co. Ltd.).
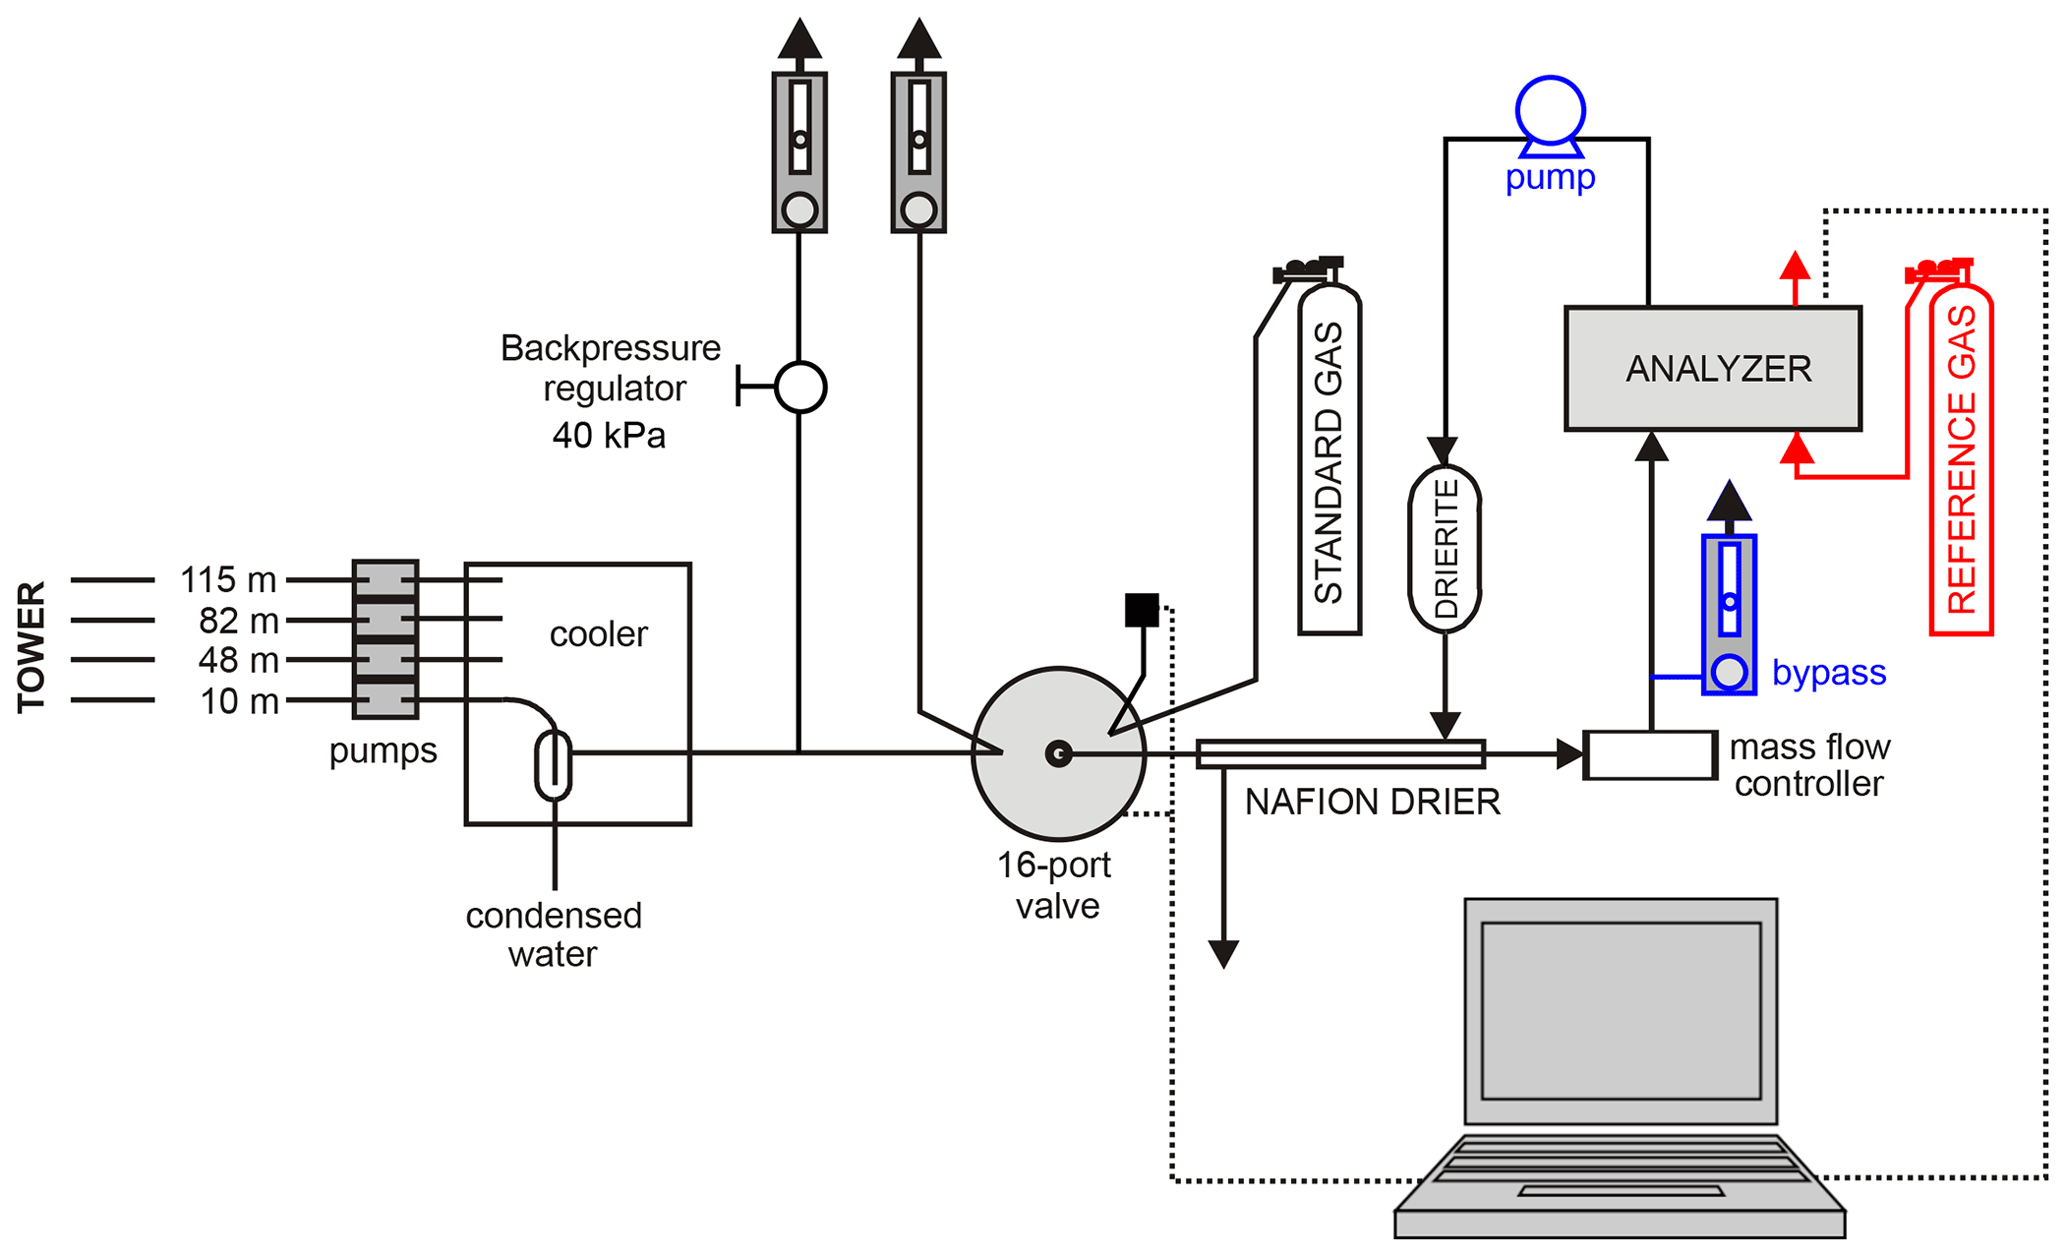
Figure 3Schematics of the monitoring system at Hegyhátsál (HUN). Blue parts were added and red parts were removed when the Li-Cor NDIR analyzer was replaced by the Picarro CRDS one in 2020. For clarity, only one sampling line and one standard gas are shown.
Until 2020, CO2 analysis was performed using non-dispersive infrared (NDIR) gas analyzers (1994–2007: Li-Cor Inc. model LI-6251; 2007–2020: Li-Cor Inc. model LI-7000). A constant sample flow rate of 100 cm3 min−1 was maintained by a mass flow controller (Tylan, model FC-260). The reference cell of the CO2 analyzer was continuously flushed at a flow rate of 5–10 cm3 min−1 with a compressed reference gas of 330–400 µmol mol−1 CO2 in synthetic air (Messer Hungarogáz), gradually following the concentration trend in the atmosphere. Since 2020, a Picarro model G2301 cavity ring-down spectrometer (CRDS) has been used to determine the CO2 content of the air. While the NDIR analyzers required air to be pressed through the measuring cells, the pressure in the measuring cell (cavity) of the CRDS analyzer is well below the atmospheric one (∼185 hPa), which required a partial redesign of the system. CRDS analyzers are absolute instruments, so they do not require a continuously flowing reference gas like the NDIR ones. Provision of the low pressure in the analyzer requires a vacuum pump (Picarro model A2000) after the analyzer in the airstream. The mass flow controller has been set to above the flow requirement of the analyzer, and an overflow bypass (∼200 cm3 min−1) has been inserted to prevent the overpressure (generated by the back-pressure regulators for the removal of the condensed water) at the inlet of the analyzer. The bypass flow is monitored to prevent any backflow contamination. The modifications to the original system are indicated in Fig. 3 in different colors. This transformation needed the minimum modification of the original design to accommodate the CRDS analyzer until the monitoring system was rebuilt according to the ICOS recommendations (ICOS RI, 2020) in late 2023.
The instruments used at the monitoring stations provided the atmospheric dry-air mole fraction of carbon dioxide. For simplicity, throughout this paper, we use the term “concentration” as a synonym.
2.3 Measurement cycles and calibration
Typically, a single gas analyzer that scans the intakes sequentially is used at a tall-tower, multi-inlet-height monitoring site (see, e.g., Bakwin et al., 1998; Thompson et al., 2009; Popa et al., 2010; Sasakawa et al., 2010; Winderlich et al., 2010; Vermeulen et al., 2011; Andrews et al., 2014; Schmidt et al., 2014; Berhanu et al., 2016; Stanley et al., 2018; Conil et al., 2019; ICOS RI, 2020; Lelandais et al., 2022). It involves the continuous concentration signal being sampled only for discrete short periods at each intake point, which does not allow the perfect reconstruction of the original concentration variation (Andrews et al., 2014; Haszpra and Prácser, 2021). It increases the uncertainty of the calculated hourly averages usually used by the atmospheric inversion and budget models. The uncertainty derived from the noncontinuous sampling at the tall-tower sites can be significantly higher than the other terms of the measurement uncertainty (e.g., scale transfer, scale inconsistency, scale drift, instrument noise) (Haszpra and Prácser, 2021). This type of uncertainty can be reduced by frequent sampling at each intake. Obviously, increasing the frequency reduces the time available for flushing the instrument and signal integration at each intake, which also introduces uncertainty into the measured concentrations. Therefore, the decision on the length of the sampling periods – that is, on the frequency of the sampling at a given intake – is a compromise. The uncertainty of the hourly average concentration is the highest when the concentration changes rapidly within the hour. Under low-elevation continental conditions, the typical periods are the morning and evening hours when the stable nocturnal boundary layer breaks up or builds up. Today models try to avoid these transition periods and use data only from the afternoon hours when the atmosphere is the best mixed, and the fluctuation of the CO2 concentration tends to be low. This approach loses 75 %–85 % of the available measurement data. The more precise allocation of the sources and sinks requires high-resolution models that are able to handle the rapid changes in the planetary boundary layer and that can use not only a small fraction of the available concentration data. Therefore, the measurement protocols should provide low-uncertainty data for the whole day.
In the mid-continental planetary boundary layer, the fluctuation of the carbon dioxide concentration is high due to the rapidly changing photosynthesis and respiration of the vegetation and that of the turbulence. The diurnal variation of the height of the planetary boundary layer can also be great (from 20–50 m to over 3000 m). Therefore, we have chosen the shortest realistic sampling time at each air intake to reduce the uncertainty as much as possible. Taking into account the small dead volume of the system to be flushed at each intake change, a 2 min sampling time seemed to be an acceptable compromise (Zhao et al., 1997; Werner et al., 2006). With 2 min of sampling at each of the four sampling elevations, seven to eight subsamples are available for the calculation of the hourly average concentrations. The 2 min period consisted of 1 min of flushing and 1 min of signal integration when the LI-6251 or LI-7000 NDIR analyzer was working in the system. The Picarro model G2301 CRDS analyzer has a larger measuring cell and somewhat lower instrument noise; therefore, we changed to 90 s flushing and 30 s integration time when the NDIR analyzers were replaced with the CRDS one. As all the tubes are continuously flushed, 60–90 s is sufficient for the reasonable flushing of the analyzers. Our experience showed that the difference between the “true” concentration and the measured concentration at an intake fell below 0.1 µmol mol−1 in 35–45 s after switching from another intake even if the concentration difference between them was as high as 70 µmol mol−1 (Haszpra and Prácser, 2021). After switching from one intake to the other and after the flushing of the analyzer, during the signal integration, there is no need to wait for any “stabilization” because the atmospheric concentration is never “stable”; it varies continuously. When studying a year-long data series with a 5 s temporal resolution it was found that at 82 m above the ground, 38 % of the 40 s periods show statistically significant (p<0.05) concentration changes due to the natural concentration variations (Haszpra and Prácser, 2021).
Four CO2-in-air standards prepared and certified by the WMO Central Calibration Laboratory for CO2 (NOAA, Boulder, Colorado) (Trivett and Kohler, 1999; WMO, 2023) were used to calibrate the measuring system. All data in this paper are reported on the WMO X2019 CO2 scale. The NDIR analyzers are pressure- and temperature-sensitive. The analyzers at Hegyhátsál were not temperature- and pressure-stabilized; therefore, they required frequent calibration to compensate for the scale drift. Every 32 min, after four 8 min measuring cycles (4 intakes × 2 min), the standard gas with the lowest CO2 mixing ratio was selected and analyzed, and this measurement was termed “zero.” After every sixth cycle (every 202 min), a full four-point calibration was carried out, and a new quadratic response function was calculated. The zero measurements were used to account for any short-term drift of the analyzer due to changes in ambient pressure or temperature. The zero offsets and response functions were linearly interpolated in time to obtain values suitable for the calculation of CO2 concentrations from the instrument response.
The CRDS analyzers are much less sensitive to the pressure and temperature fluctuations in the environment because they are internally temperature- and pressure-stabilized. They can operate safely with much less frequent calibration. The Picarro model G2301 CRDS CO2 analyzer, installed in the monitoring system in 2020, was calibrated at monthly intervals against four NOAA certified standards.
2.4 Quality assurance and quality control
As mentioned in the previous section, for the calibration of the analyzers four CO2-in-air standards, prepared and certified by the WMO Central Calibration Laboratory for CO2 (WMO, 2023), were used. Hegyhátsál is also a site in NOAA's Global Cooperative Flask Air Sampling Network (NOAA, 2023) (station code: HUN) where every week two glass flasks (2.5 L each) are filled in parallel with ambient air at 96 m elevation on the tower. The samples are analyzed by the NOAA ESRL Carbon Cycle Greenhouse Gases Group (Boulder, Colorado, USA) for CO2 and several other greenhouse gases. The independent in situ and flask sample measurements provide continuous quality assurance against any scale drift or other issues, although exact comparability is not possible: (i) while the flask air samples are taken at 96 m elevation, the in situ measurements are carried out at 82 and 115 m, and (ii) while the flasks contain instantaneous air samples, the in situ measurements are carried out only every 8 min at a given sampling elevation, which is further complicated by the different flow rates and residence times.
The flask air samples are always taken in the early afternoon hours when the atmosphere is the best mixed. The average of the in situ measurements at 82 and 115 m can approximate the concentration at the flask sampling elevation (96 m) fairly well. To reduce the bias due to the not exactly known temporal asynchrony the in situ measurements in the ±20 min time window around the nominal sampling time are averaged. For the comparison, 1089 flask air samples were available for the 1994–2023 period (Fig. S2 in the Supplement). We filtered out cases (n=22) for which the difference between the in situ and the flask measurements was larger than 3σ (presumably caused by extreme concentration variability in the time window, possible sampling or analytical errors, etc.). The mean deviation of the in situ measurements from the flask measurements is −0.08 ± 1.59 µmol mol−1, which indicates that these independent measurements are on the same scale. The relatively large scatter is due to the high temporal variability of the atmospheric concentration at this mid-continental site even at 82–115 m above the ground and to the unavoidable spatial and temporal asynchrony of the in situ and flask measurements. Similarly high scatter was also reported by Bakwin et al. (1995) for a tall-tower site in North Carolina, USA.
2.5 Data selection
Comparison of the parallel measurements at K-puszta and Hegyhátsál in 1994–1999 showed that the smallest difference between the two sites 220 km away from each other can be observed during the afternoon hours, after 12:00 local standard time (LST) (Haszpra, 1999b). This is the natural consequence of the mixing of the atmosphere, which is the most intensive in the early afternoon hours. The study also indicated that, unlike at coastal stations, no clean-air sector can be defined at this mid-continental site (Haszpra, 1999a). The air in this geographical basin (Pannonian Basin) is well-mixed, and no directional difference can be observed far from the significant anthropogenic sources (Haszpra, 1999b). Therefore, no data selection other than disqualifying the technically false data (instrument malfunction, maintenance, calibration, etc.) is applied. To achieve a higher spatial representativeness, in most of our studies only data from the early afternoon period (12:00–16:00 LST) are used.
3.1 Diurnal cycle of carbon dioxide concentration
One of the most striking features of the atmospheric carbon dioxide concentration at a mid-continental site surrounded by vegetation is its remarkable diurnal cycle. It is generated by the cyclic photosynthesis and respiration periods of plants and modulated by the diurnal cycle of the vertical mixing of the atmosphere. Figure 4 shows the monthly average diurnal cycles at the different measurement elevations in different seasons relative to the daily average concentration at the top of the tower. Being the closest to the sources and sinks at the surface (soil, vegetation) the lowest elevation (10 m) shows the highest diurnal amplitude throughout the year. The maximum diurnal amplitudes can be observed in the middle of the summer at all measurement elevations due to the activity of the vegetation and the high respiration rates during the night. The maximum diurnal amplitudes are 60.5 and 17.2 µmol mol−1 at 10 and 115 m, respectively, while they are only 6.5 and 1.5 µmol mol−1 in winter (Fig. 5). Atmospheric dynamics also contribute to the high summer diurnal amplitudes. The nighttime boundary layer is the shallowest at this mid-continental site in summer (Fig. S3 in the Supplement). The temperature-dependent respiration causes elevated concentrations in the shallow boundary layer, reaching 550–600 µmol mol−1 (hourly average) at 10 m during certain summer nights in the last years.
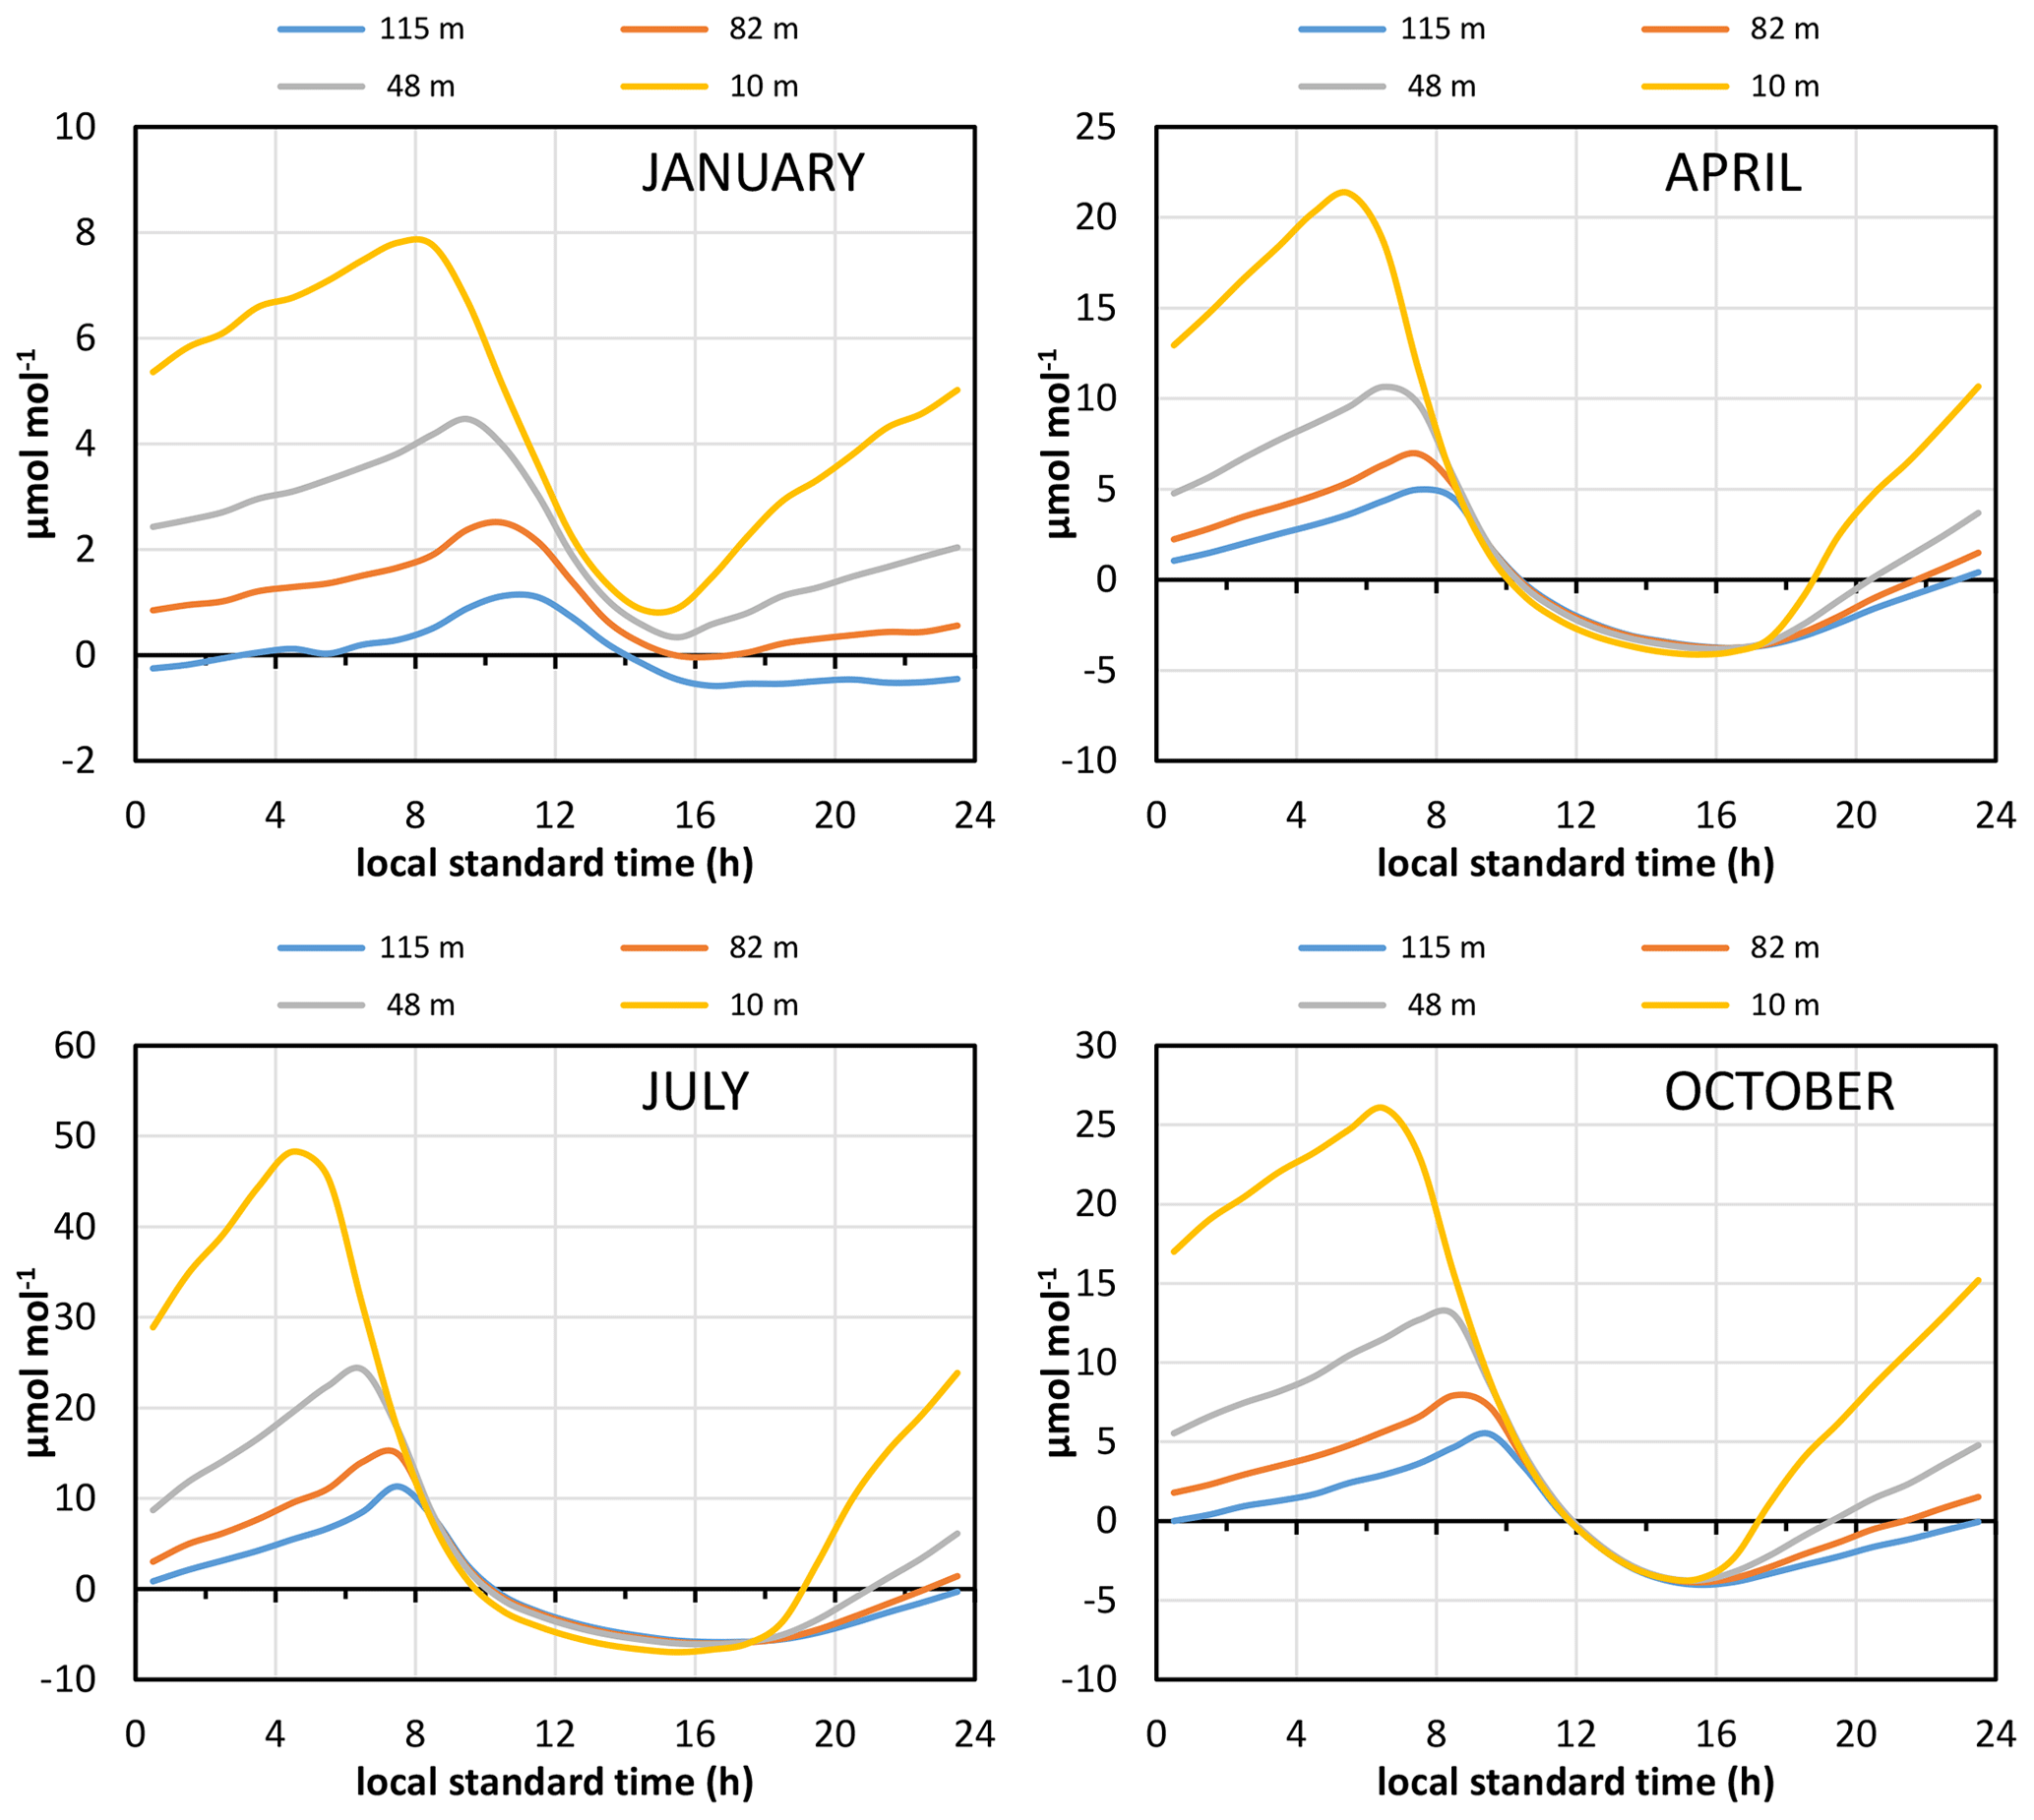
Figure 4Monthly mean diurnal variation of the CO2 dry-air mole fraction at different elevations in different seasons relative to the daily mean at 115 m. Note the different y scales in the different panels.
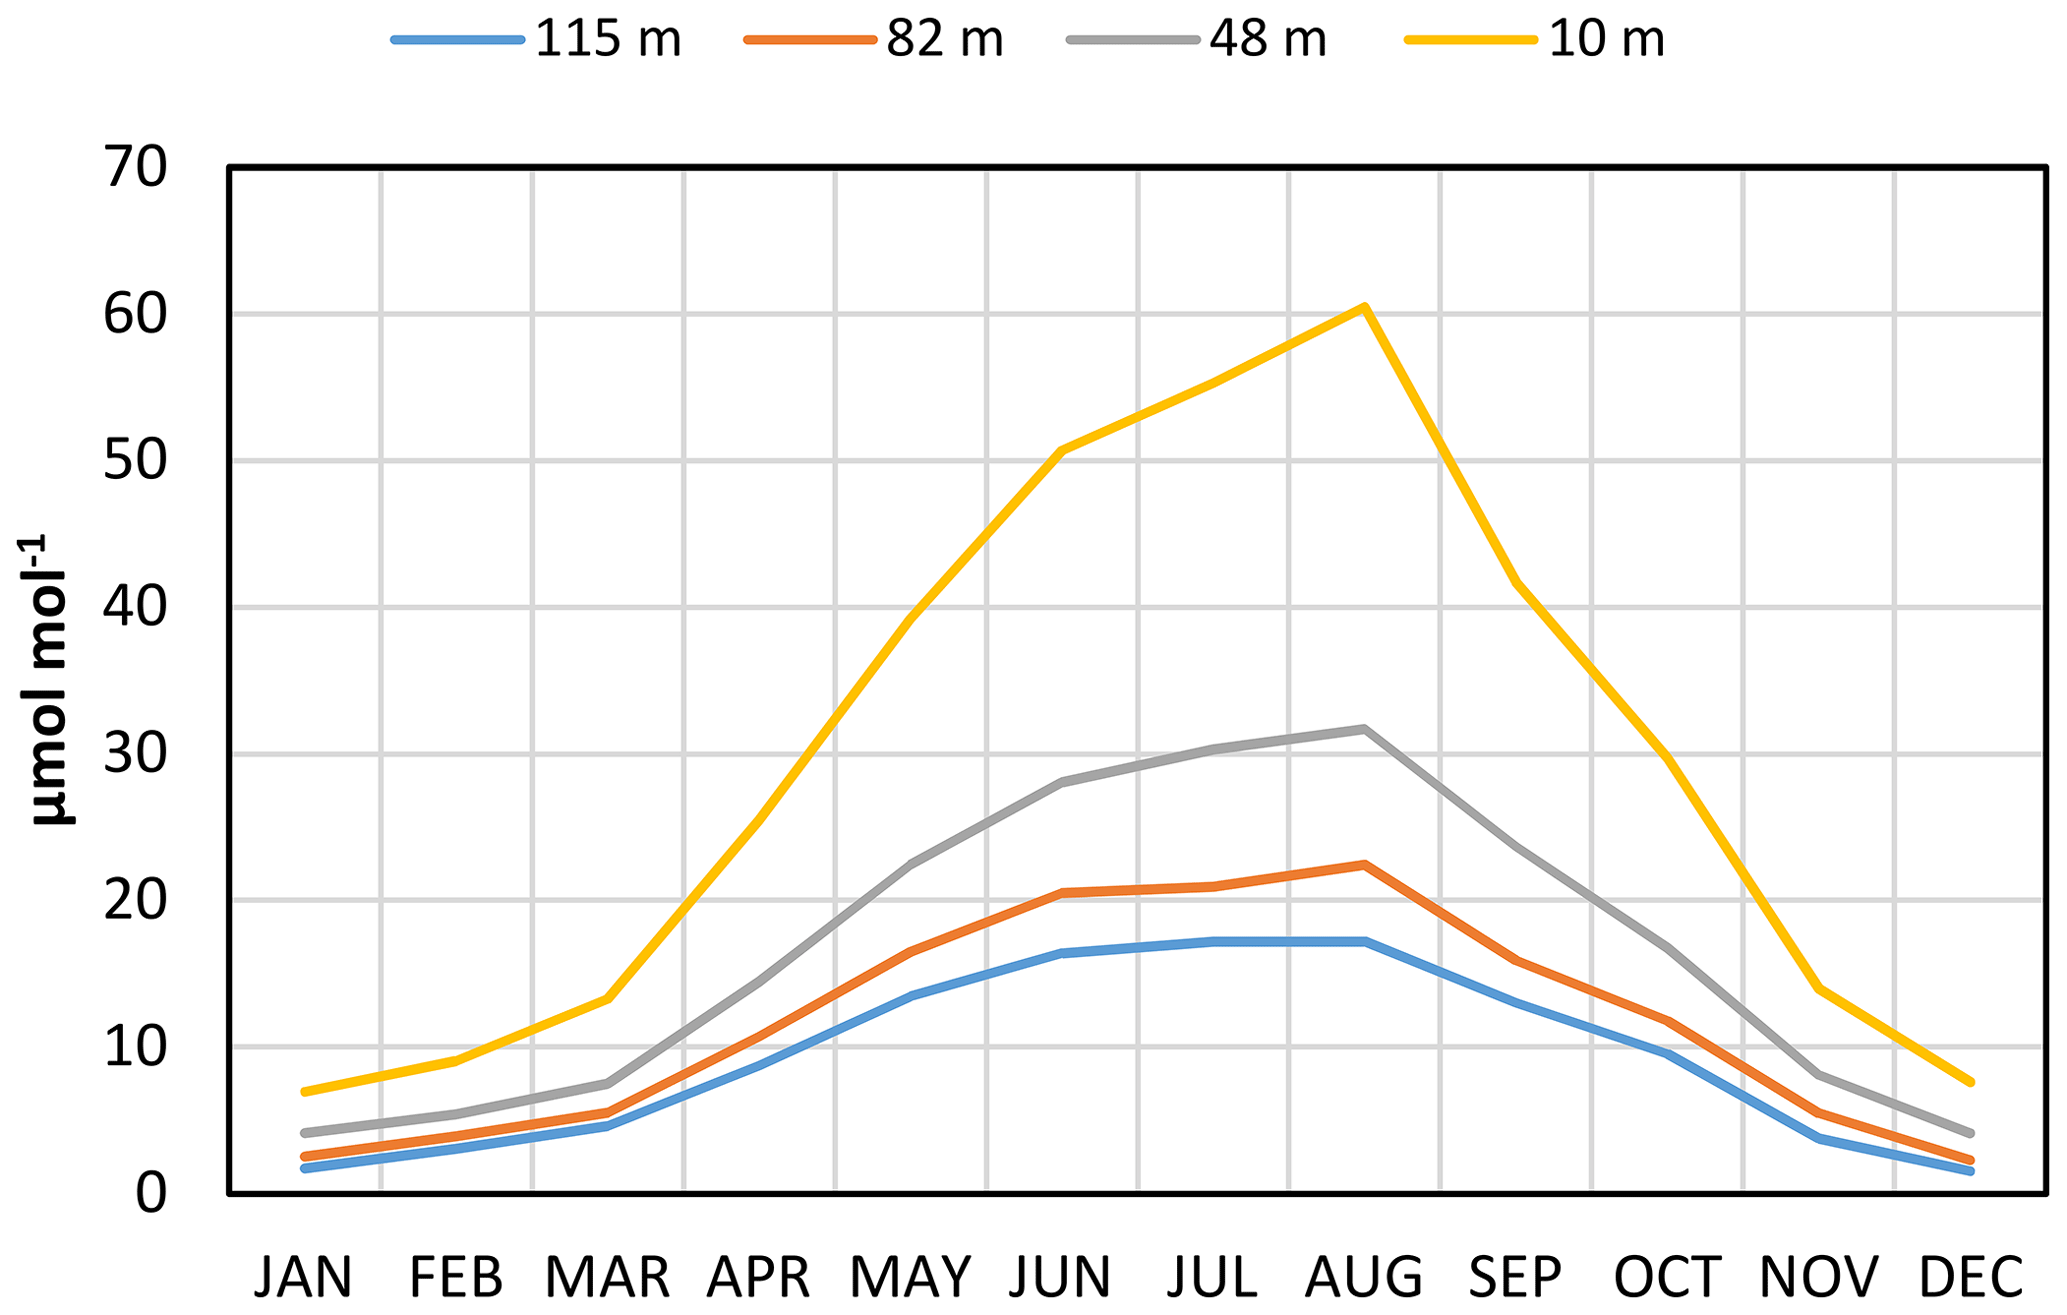
Figure 5Seasonal variations of the monthly mean daily amplitudes of the CO2 concentration at different elevations.
Although the tower is not very tall, the gradual intrusion of the CO2-enriched nighttime surface layer air into the higher layers is clearly observable (Fig. 4), especially in summer. The morning concentration peak at 115 m is delayed by 2–3 h relative to that at 10 m elevation.
The diurnal amplitude at the different measurement elevations has not changed significantly at the usual probability levels (p<0.05) during the past 30 years; however, an upward tendency can be observed throughout the year, especially at the lowest monitoring elevation (10 m). The highest increase (0.57 ± 0.30 , p=0.074) appears in the warmest month of the year, in July (Fig. S4 in the Supplement). Comparing the July concentration values from the first and the second halves of the measurement period (Şen, 2012, 2017) it seems the high concentrations grow somewhat faster than the lower ones (Fig. 6). Based on a shorter data series Perez et al. (2020) also noticed a higher-than-average trend for the 90th percentile concentration values. Furthermore, according to the ECMWF ERA5 reanalysis, the height of the nighttime boundary layer has not changed during the decades of the measurements around the monitoring site (average of the four grid points surrounding the site). The high concentrations are typical in the nighttime surface layer due to the respiration of the ecological systems. The intensity of respiration is typically an exponential-like function of the temperature (see, e.g., Meyer et al., 2018). As the nighttime minimum temperature at Hegyhátsál is statistically significantly increasing (Fig. S5 in the Supplement) the likely reason for the upward tendency in the diurnal amplitude is increasing respiration due to the significant increase in temperature. Barcza et al. (2020) studied the surface–atmosphere CO2 exchange in the region of the Hegyhátsál tall tower using an eddy covariance system mounted at 82 m elevation on the tower. Analyzing a 21-year-long data series (1997–2018) they detected a 9 positive trend (p<0.001) in the ecosystem respiration. Although the footprint areas of the flux measurements and the concentration measurements are significantly different, this positive trend is consistent with the increasing summer minima in the seasonal variation of the concentration. Unfortunately, Barcza et al. (2020) report trend data only for the annual total respiration without seasonal or monthly resolution.
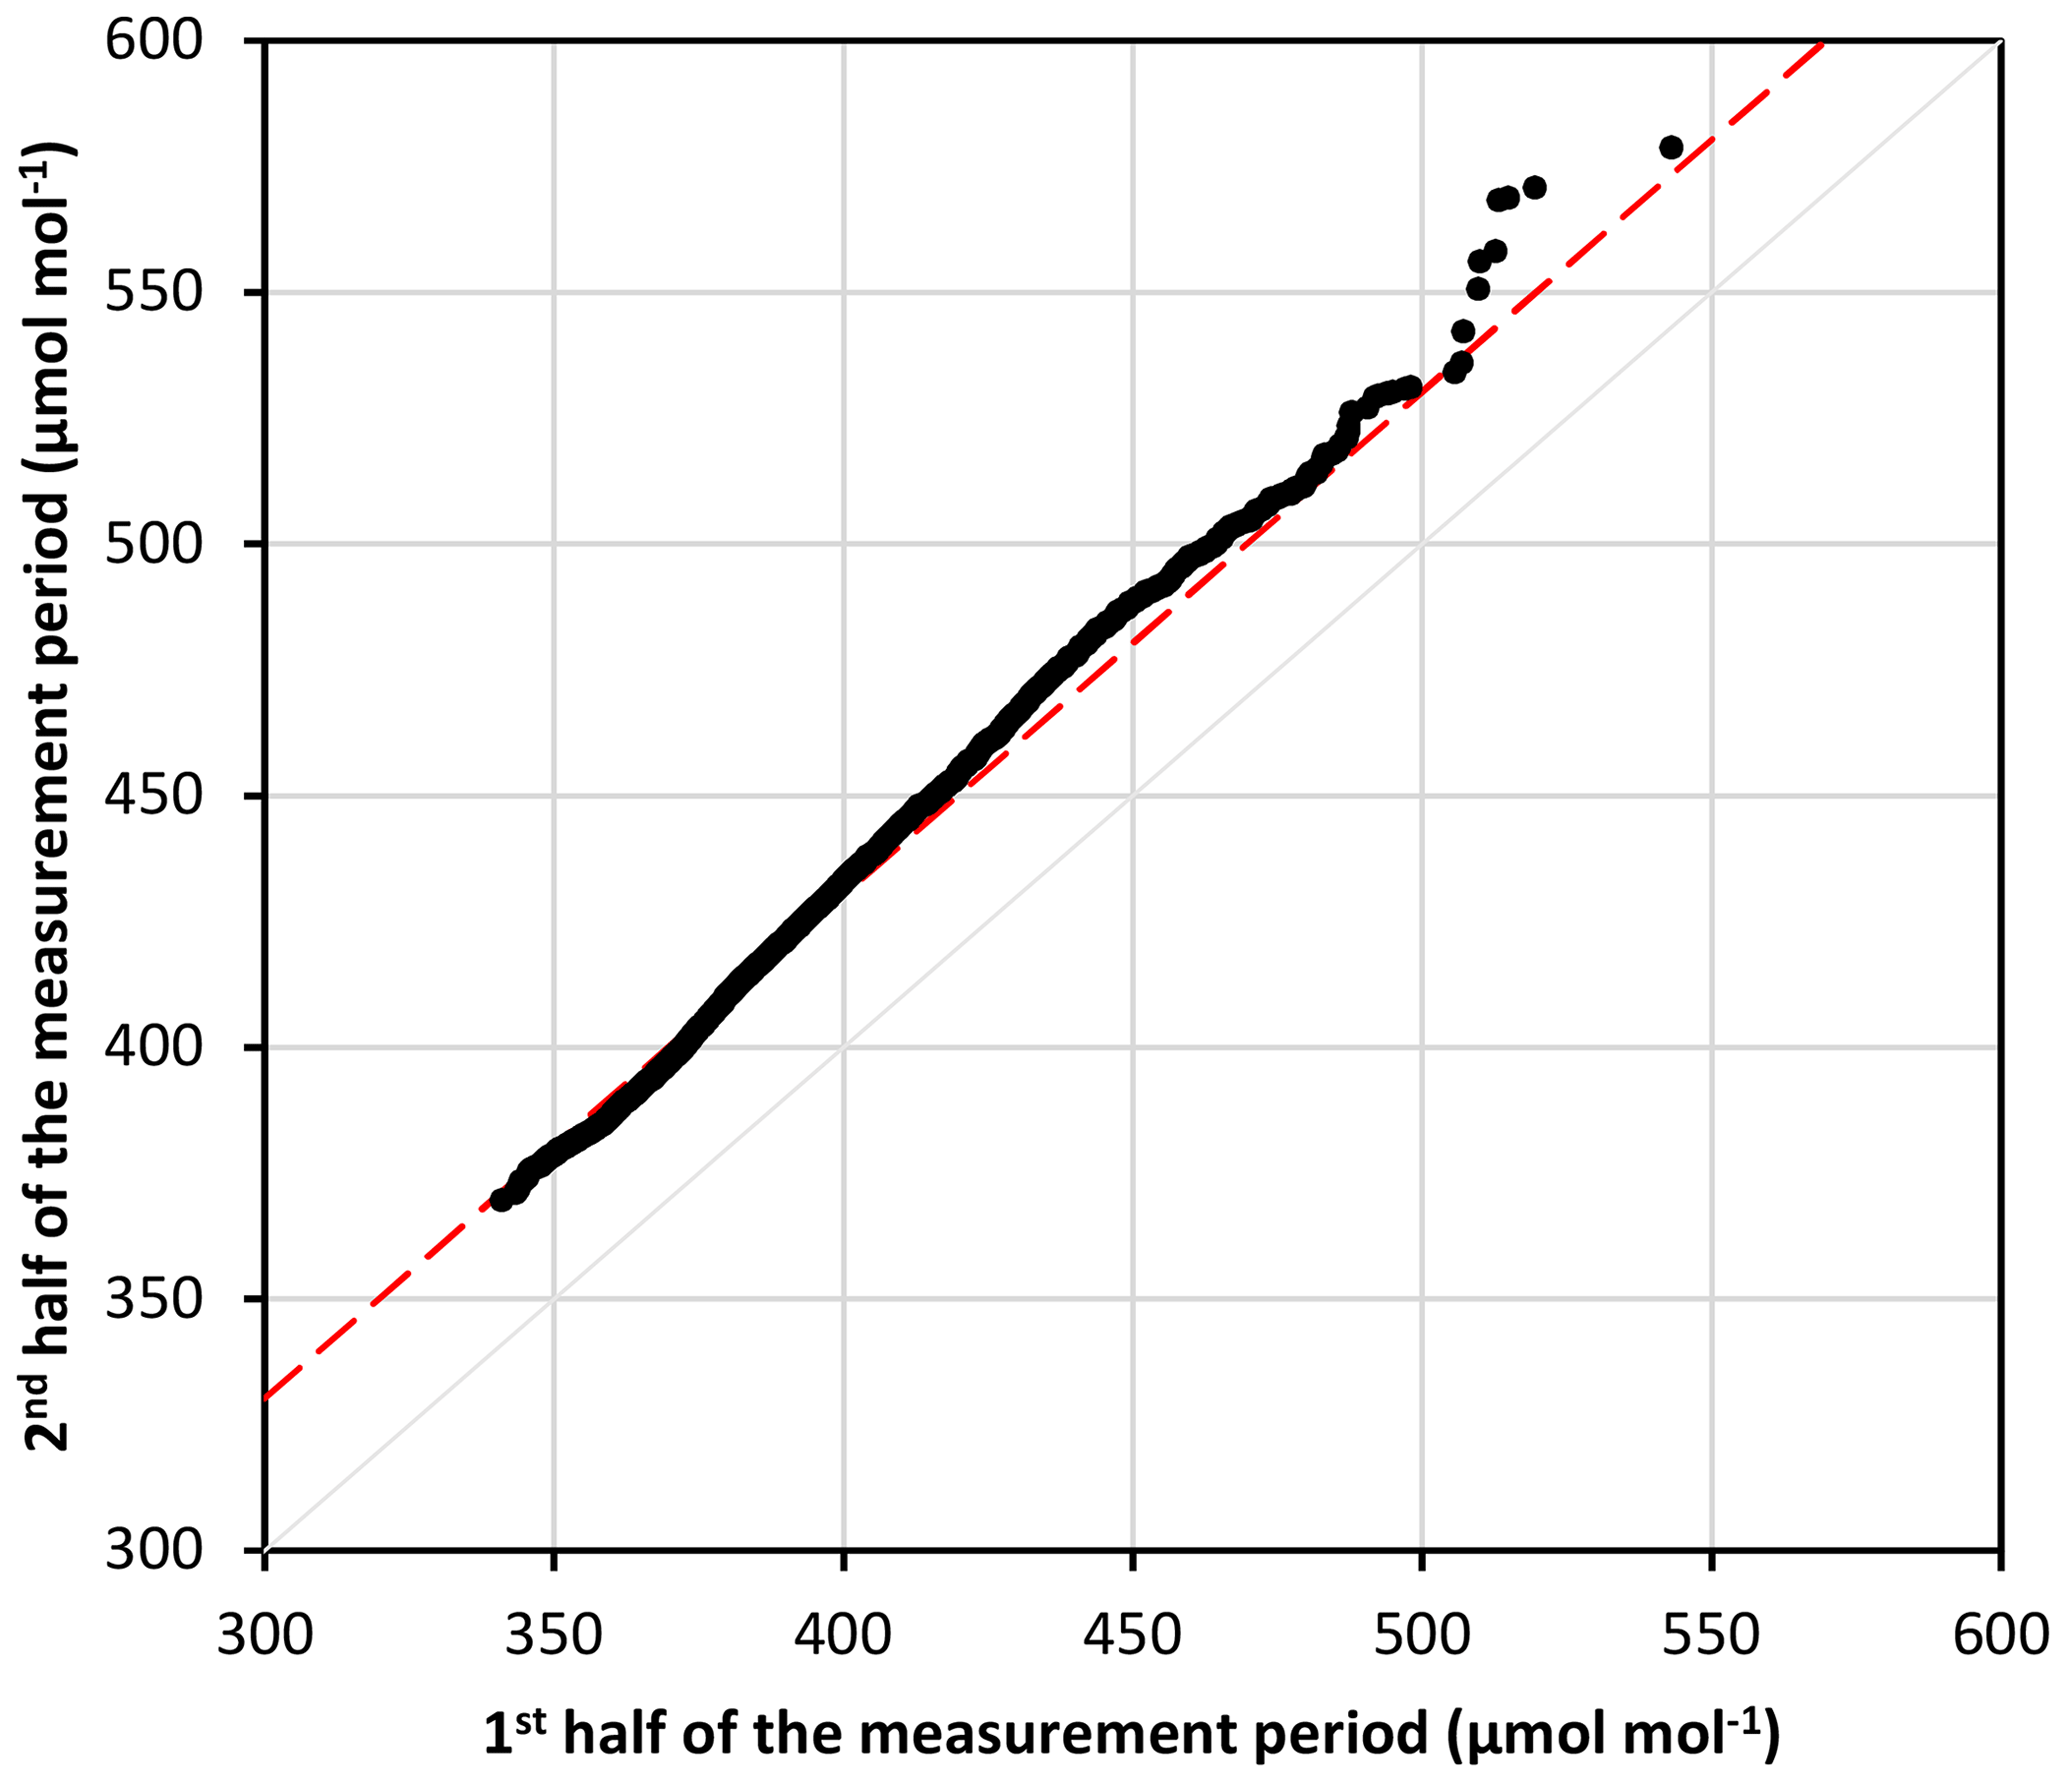
Figure 6Sen diagram showing the ordered pairs of the hourly average CO2 concentrations measured at 10 m in July in the first half (x) and the second half (y) of the measurement period. The shift of the dashed red line from the 1:1 line would give half of the concentration increase during the measurement period if the increase were uniform, independent of the concentration. The deviation of the data points from the dashed red line shows how the trend of the given concentration range deviates from the overall trend. The upward deviations of the high-concentration data points from the dashed red line mean that the higher concentrations increased more than the lower concentrations. The overall trend is dominated by the x<400 µmol mol−1 data points representing 78.5 % of the total data series (n=8344).
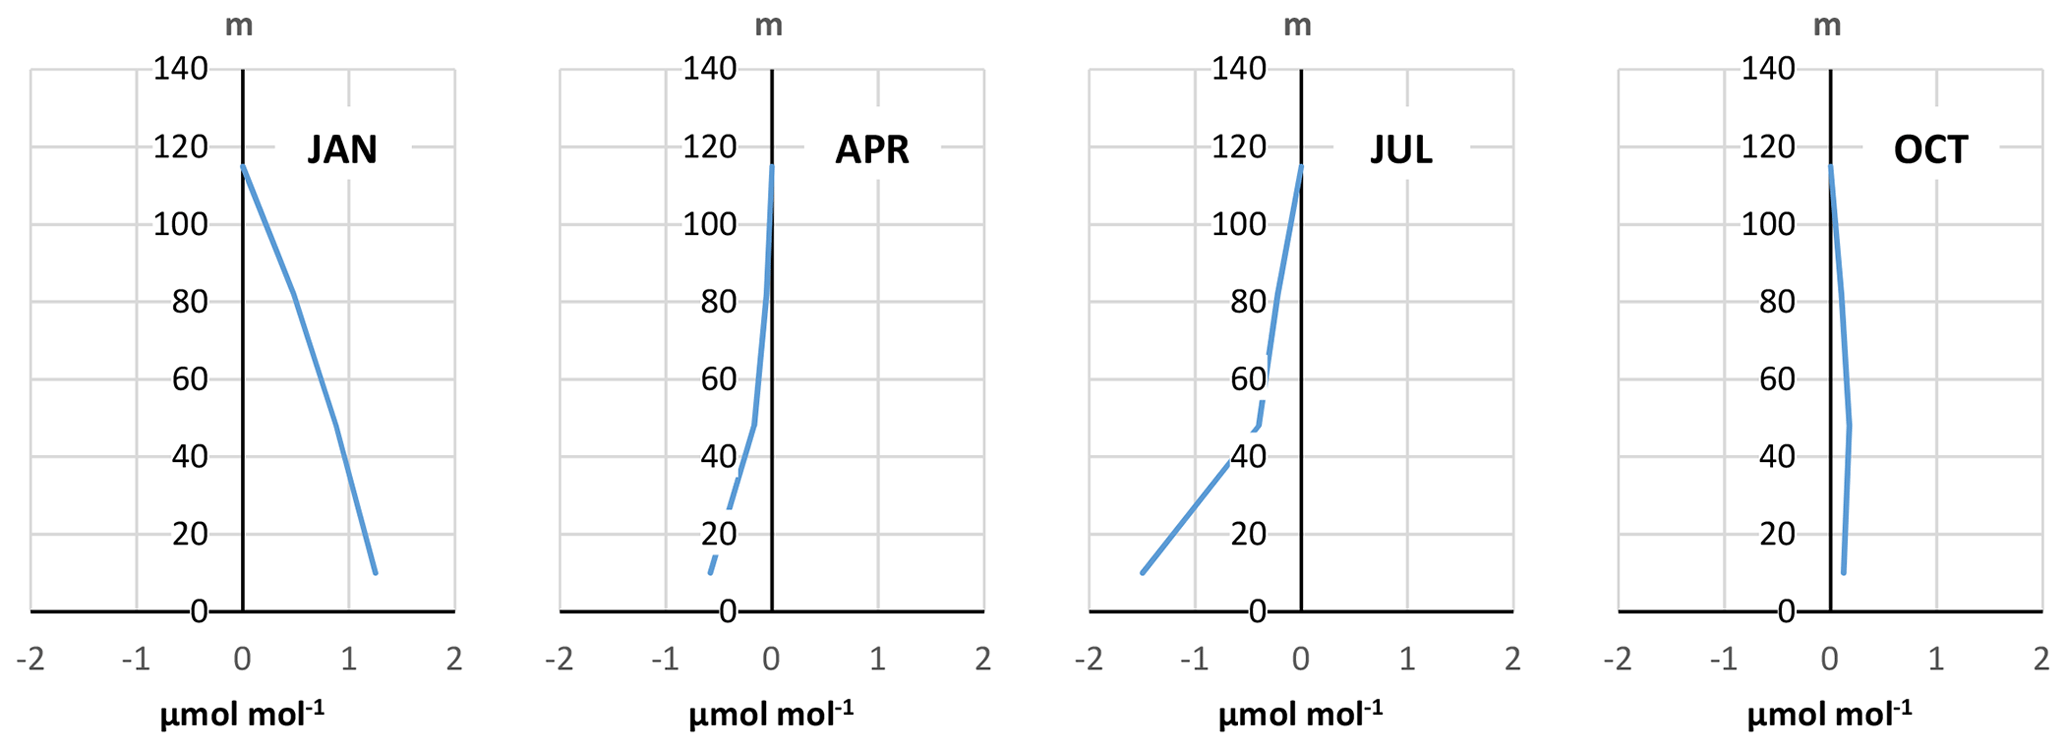
Figure 7Monthly mean early afternoon (12:00–16:00 LST) vertical concentration gradients in different seasons relative to the concentration at 115 m.
Sources and sinks at the surface cause a vertical concentration gradient even in the early afternoon hours when the atmosphere is most mixed. Due to the seasonally varying source–sink yield, the early afternoon concentration gradient is positive (concentration increases with elevation) from late March to October and negative during the winter half-year (Fig. 7). According to airborne measurement campaigns in 2006–2008 (Haszpra et al., 2015), the top of the tower underestimates the mean planetary boundary layer concentration by 0.9 µmol mol−1 in summer afternoons and overestimates it by 1.2 µmol mol−1 in winter (median values). The interquartile ranges are [0.16–1.54] and [−0.2–3.04] µmol mol−1, respectively. These results may be informative for those using models with coarse vertical resolution.
3.2 Seasonal variations of carbon dioxide concentration
In addition to the diurnal variation, the cyclic activity of the temperate zone vegetation also generates a remarkable seasonal variation in the atmospheric carbon dioxide concentration. For its evaluation, the detrended concentration time series was used. The data series was detrended by applying the widely used CCGCRV software (Schmidt et al., 2003; Zhao and Zeng, 2014; Fang et al., 2015; Zhu and Yoshikawa-Inoue, 2015; Piao et al., 2018; Curcoll et al., 2019; Reum et al., 2019; Lin et al., 2020; Wang et al., 2020; Xia et al., 2020; Resovsky et al., 2021; Tiemoko et al., 2021 – and others) developed by Thoning et al. (1989) and publicly available at https://gml.noaa.gov/ccgg/mbl/crvfit/crvfit.html (last access: 13 October 2023). The mean seasonal cycles for 10 and 115 m can be seen in Fig. 8. The figure shows the seasonal cycles calculated from both the daily average concentrations and the early afternoon (12:00–16:00 LST) measurements, which are more spatially representative. There is a significant difference between the amplitudes of the seasonal cycles of the whole-day data and the early afternoon data. The reason for this is that the summer daily means are much higher than the early afternoon values due to the intensive respiration and the accumulation of carbon dioxide respired to the shallow nighttime boundary layer, and this compresses the range of the seasonal variation. The mean seasonal amplitude based on the early afternoon (12:00–16:00 LST) measurements is 25.8 µmol mol−1 at 115 m, and it is 29.3 µmol mol−1 at 10 m where the influence of the vegetation is more pronounced. The high seasonal amplitude is the consequence of the cyclic behavior of the ecological systems surrounding the monitoring station. Comparable high seasonal amplitudes are reported only from a few sites (Popa et al., 2010; Vermeulen et al., 2011; Liu et al., 2014; Conil et al., 2019; Curcoll et al., 2019), the majority of which are also located in a mid-continental environment.
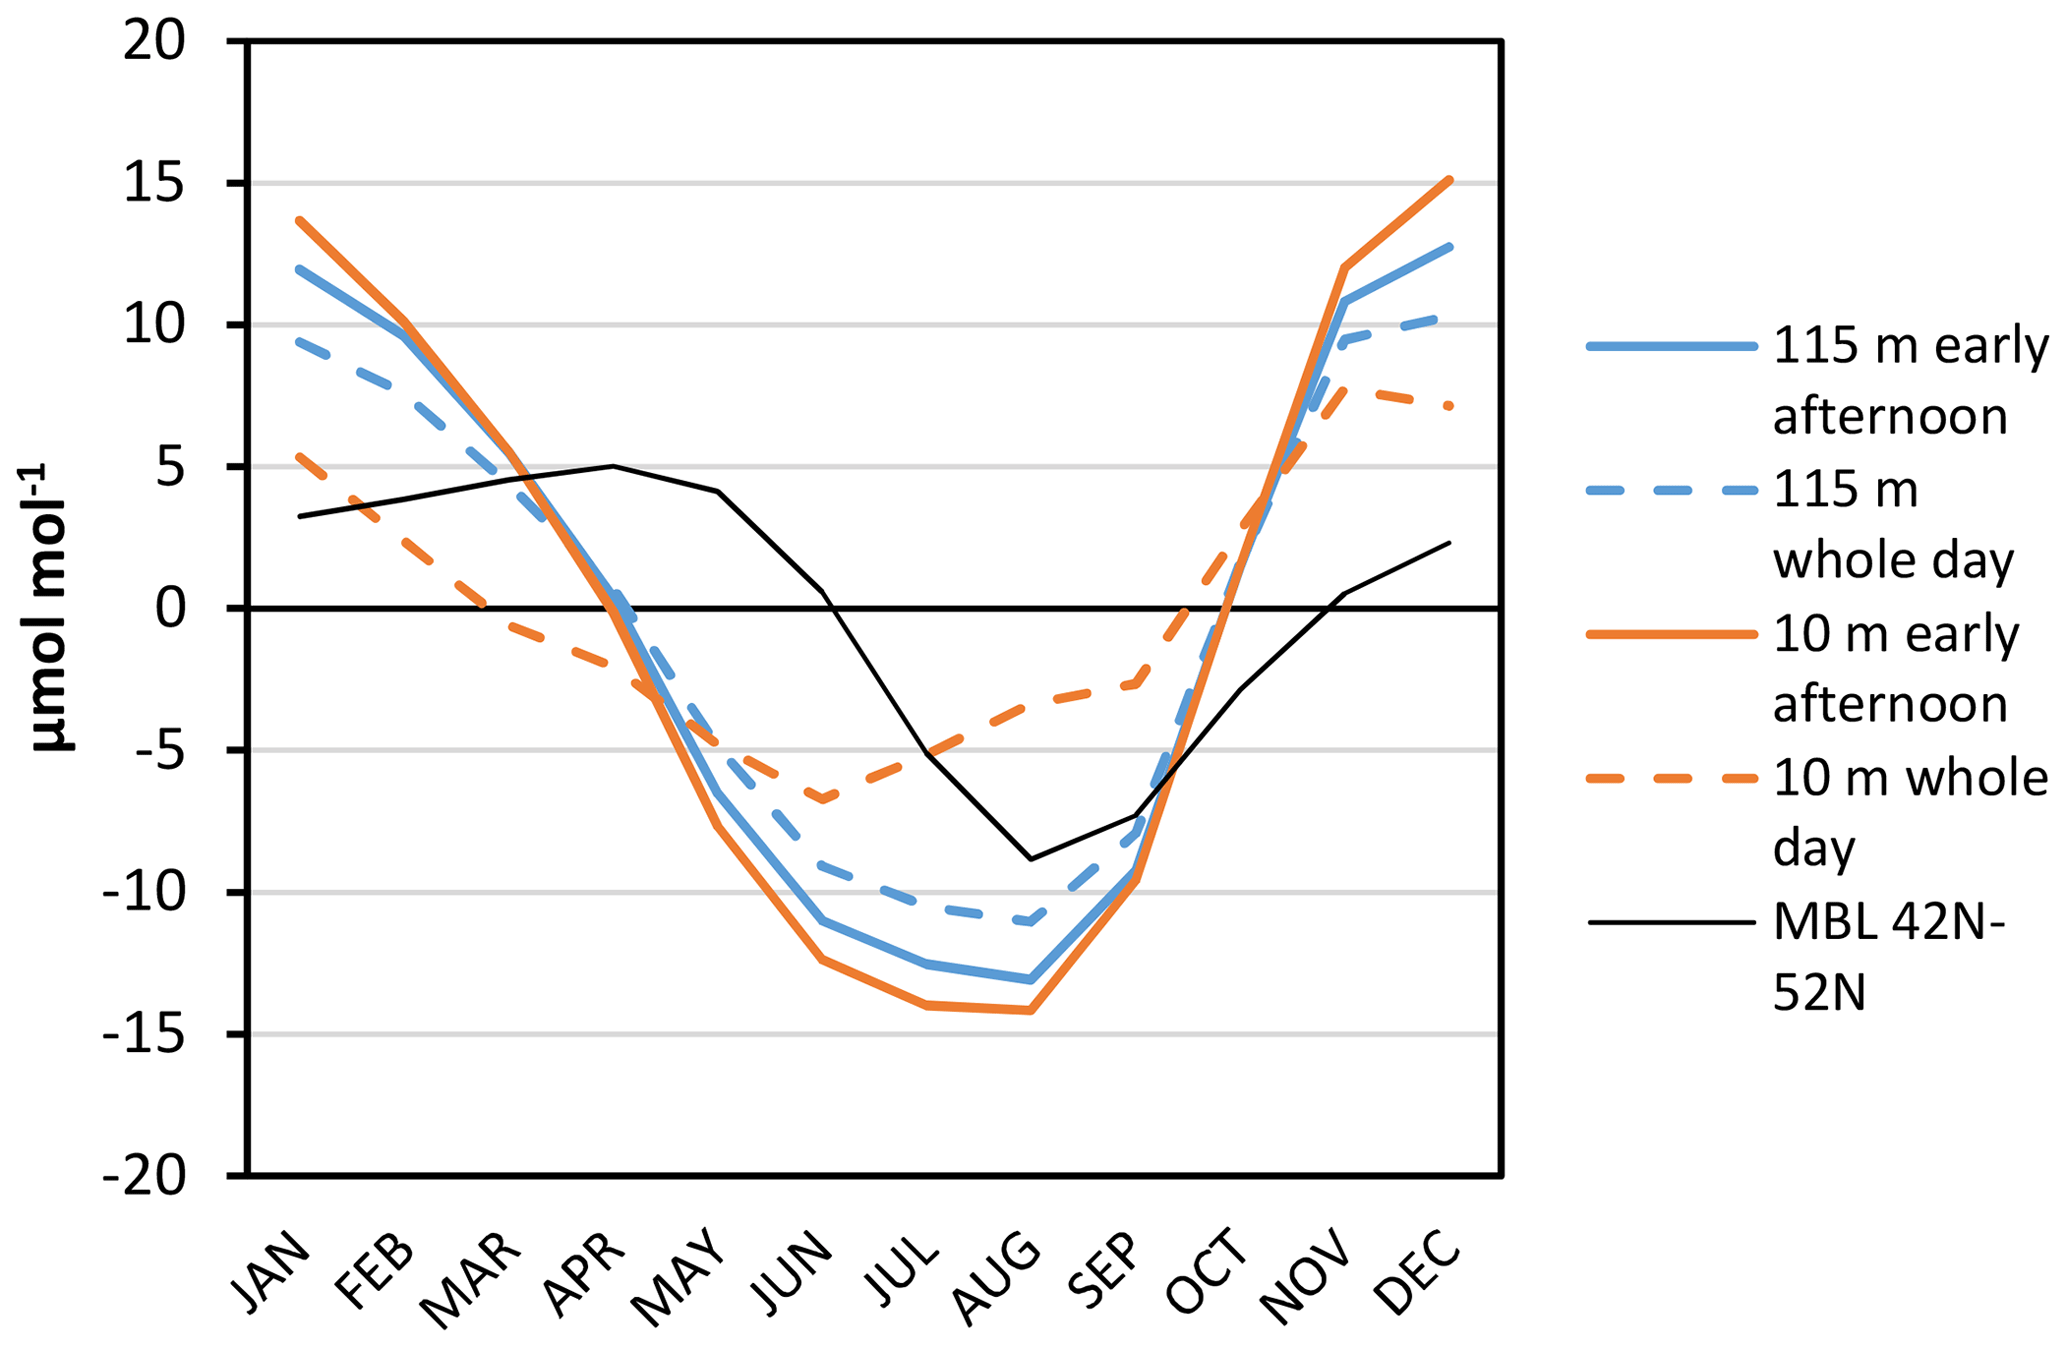
Figure 8The mean seasonal variations at Hegyhátsál at 10 and 115 m elevations based on the early afternoon (12:00–16:00 LST) measurements and the whole-day measurements. The figure also shows the mean seasonal variation of the marine boundary layer reference concentrations characteristic for the 42–52° N latitudinal band (MBL 42N-52N) (Lan et al., 2023b).
Figure 8 also presents the seasonal variation of the marine boundary layer reference concentration (Lan et al., 2023b) for the 42–52° N latitudinal belt where the Hegyhátsál station is located. The shape of its annual cycle significantly differs from those measured at our mid-continental site. In the marine boundary layer, the maximum of the annual cycle forms in April when the ecological systems in the northern temperate zone turn from a net CO2 source to a net CO2 sink (Fig. 8). At Hegyhátsál, unlike in the marine boundary layer, the CO2 concentration reaches its annual maximum at the end of the year, long before the vegetation becomes a net CO2 sink. Such a big difference cannot be explained by horizontal transport from regions with depleted CO2 concentrations. January and February are the coldest months of the year; therefore, changes in heating or energy demand cannot be the cause of the decreasing atmospheric CO2 concentration either. The main reason is the changing dynamics of the regional atmosphere. From January, following the increasing insolation after the winter solstice, the vertical mixing rapidly gets more vigorous (see Fig. S3), mixing more and more relatively clean free-tropospheric air into the CO2-enriched boundary layer. This process overcompensates for the contribution of the surface that is still a net CO2 source at that time of the year. A simple box model used in our earlier work (Haszpra and Barcza, 2010) proved that the changing vertical mixing can result in the observed reduction in the late winter–early spring surface layer concentrations. Concentration maximums preceding the net uptake period of the regional vegetation can also be observed at other monitoring sites (Levin et al., 1995; Davis et al., 2003; Kozlova et al., 2008; Popa et al., 2010; Schmidt et al., 2014; Belikov et al., 2019; Conil et al., 2019; Curcoll et al., 2019; Lelandais et al., 2022; Jiang et al., 2023).
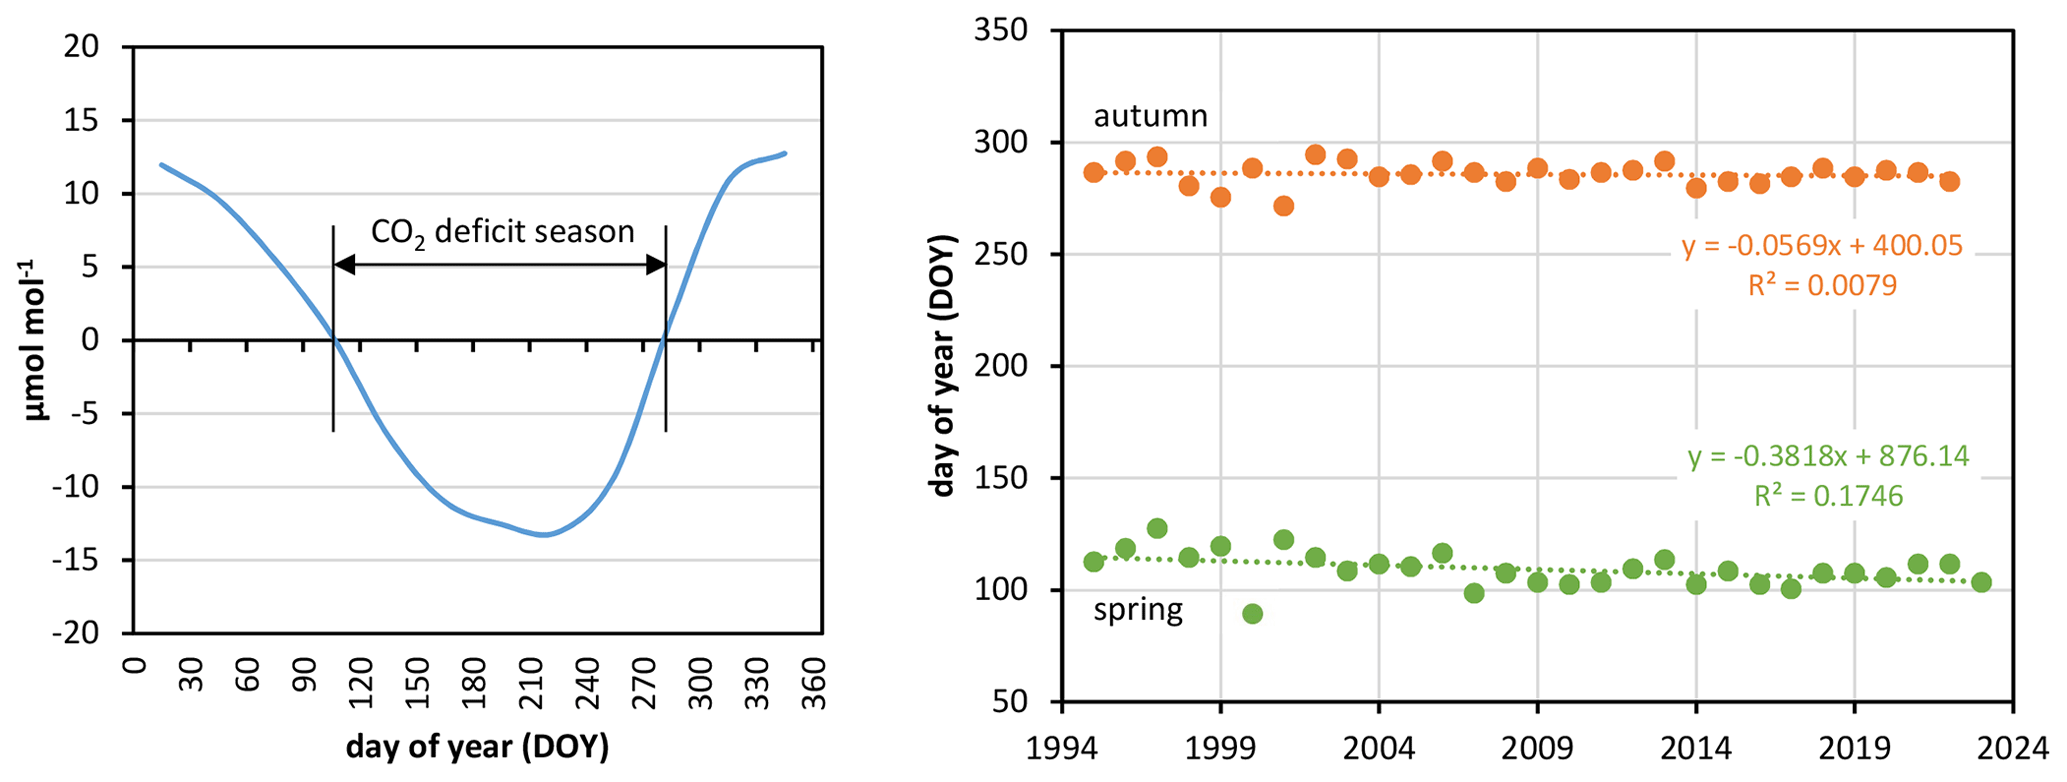
Figure 9Temporal variations of the beginning and end of the CO2-deficit season, with the spring and autumn zero crossings at 115 m above the ground.
The length of the summer season, when the CO2 concentration is negative relative to the annual average (CO2 deficit season), has increased. Defining its beginning as the day of the year when the CO2 concentration becomes negative relative to the annual average (spring zero crossing), the beginning of the summer season is getting earlier by −0.38 ± 0.16 d yr−1 (p=0.024) (Fig. 9). Although this linear trend over the entire measurement period is statistically significant at an acceptable level of confidence, the data suggest faster progress at the beginning of the period, until about the end of the 2000s, and a stagnation thereafter. The linear trend of the spring zero crossings between 1995 and 2011 is −0.96 ± 0.41 d yr−1 (p=0.033), with an average date of the zero crossing at day of year (DOY) 110.7, while from 2011 through 2023 it is 0.08 ± 0.32 d yr−1 (p=0.81), with an average start of the growing season on DOY 106.7.
Not forgetting about the contribution of the dynamics of the atmosphere mentioned above, the spring drawdown of the atmospheric carbon dioxide concentration is essentially caused by the increasing activity of the biosphere, and the date of the spring zero crossing is closely related to the start of the growing season of the vegetation in temperate and arctic regions. Numerous phenological studies show the shift in the timing of the spring leaf unfolding and the increasing greening of the terrestrial vegetation in these geographical zones (Schwartz et al., 2006; Peñuelas et al., 2009; Piao et al., 2019, 2020; Wang et al., 2019; Chen and Yang, 2020; Vitasse et al., 2022; Rahmati et al., 2023). The phenomenon has multiple drivers, but climate warming is the main contributor. Despite the steady rise in temperature, the phenological and NDVI (Normalized Difference Vegetation Index) observations indicate that the advancement of the start of the growing season slowed down in the last decade (Piao et al., 2017; Rahmati et al., 2023). Our atmospheric carbon dioxide measurements and the changing trend of the spring zero crossing also support the decreasing temperature control over the start of the growing season. The possible explanations for this phenomenon are the reduced chilling during the dormant period and the emerging light limitation (Piao et al., 2017) that prevents the even earlier start of the growing season despite the otherwise increasingly favorable conditions.
In a large part of Europe, the timing of the end of the growing season does not show a significant trend (Rahmati et al., 2023). The autumn zero crossing also does not have any significant trend at Hegyhátsál (−0.06 ± 0.12 d yr−1, p=0.65 – Fig. 9). The end of the growing season is determined by multiple factors, and it only weakly correlates with temperature (Wang et al., 2019). The warming summer may lead to increased atmospheric water demand, reduced soil moisture, and the earlier start of senescence (Rahmati et al., 2023; Zhang et al., 2023). In central Europe, where large regions are covered by agricultural fields, the summer–early autumn harvest of crops may also contribute to the fact that the net carbon uptake period is not longer despite the prolonged warming, which is in principle favorable for vegetation.
The earlier start of the growing season, the general warming, and the increasing CO2 fertilization make the CO2 uptake of the vegetation more intensive, which is reflected in the increasing NDVI values (Piao et al., 2020). The warming also increases respiration, and in principle, the more intensive CO2 uptake and the more intensive respiration result in increasing seasonal amplitude in the atmospheric CO2 concentration. The increasing amplitude was observed at several monitoring sites (Keeling et al., 1996; Graven et al., 2013; Forkel et al., 2016; Liptak et al., 2017; Piao et al., 2018; Jin et al., 2022). However, the increasing trend slowed down significantly around the turn of the millennium, likely due to the increasing temperature, increased summer respiration, evaporative demand, and water stress (Wang et al., 2018, 2020; Yin et al., 2018; Yu et al., 2021; Rahmati et al., 2023). The measurements started at Hegyhátsál in 1994 do not show any statistically significant trend in the seasonal amplitude at the commonly applied probability levels (Fig. 10), but it seems as if they indicate a minor negative tendency (−0.09 ± 0.06 , p=0.14). Mathematically, this is the result of the increased summer minima with a minor contribution of the reduced winter peaks (Fig. 10). Although it might be the first sign of the consequences of the European emission control measures (Mcgrath et al., 2023) decreasing the winter peaks and the decreasing summer biospheric uptake due to the declining environmental conditions including more frequent heatwaves and prolonged droughts (Bastos et al., 2020; Ramonet et al., 2020; van der Woude et al., 2023), it cannot be stated with certainty at this stage; however, it is worth keeping an eye on the progress. The generally milder winter and the lower heating emissions might also contribute to the phenomenon.
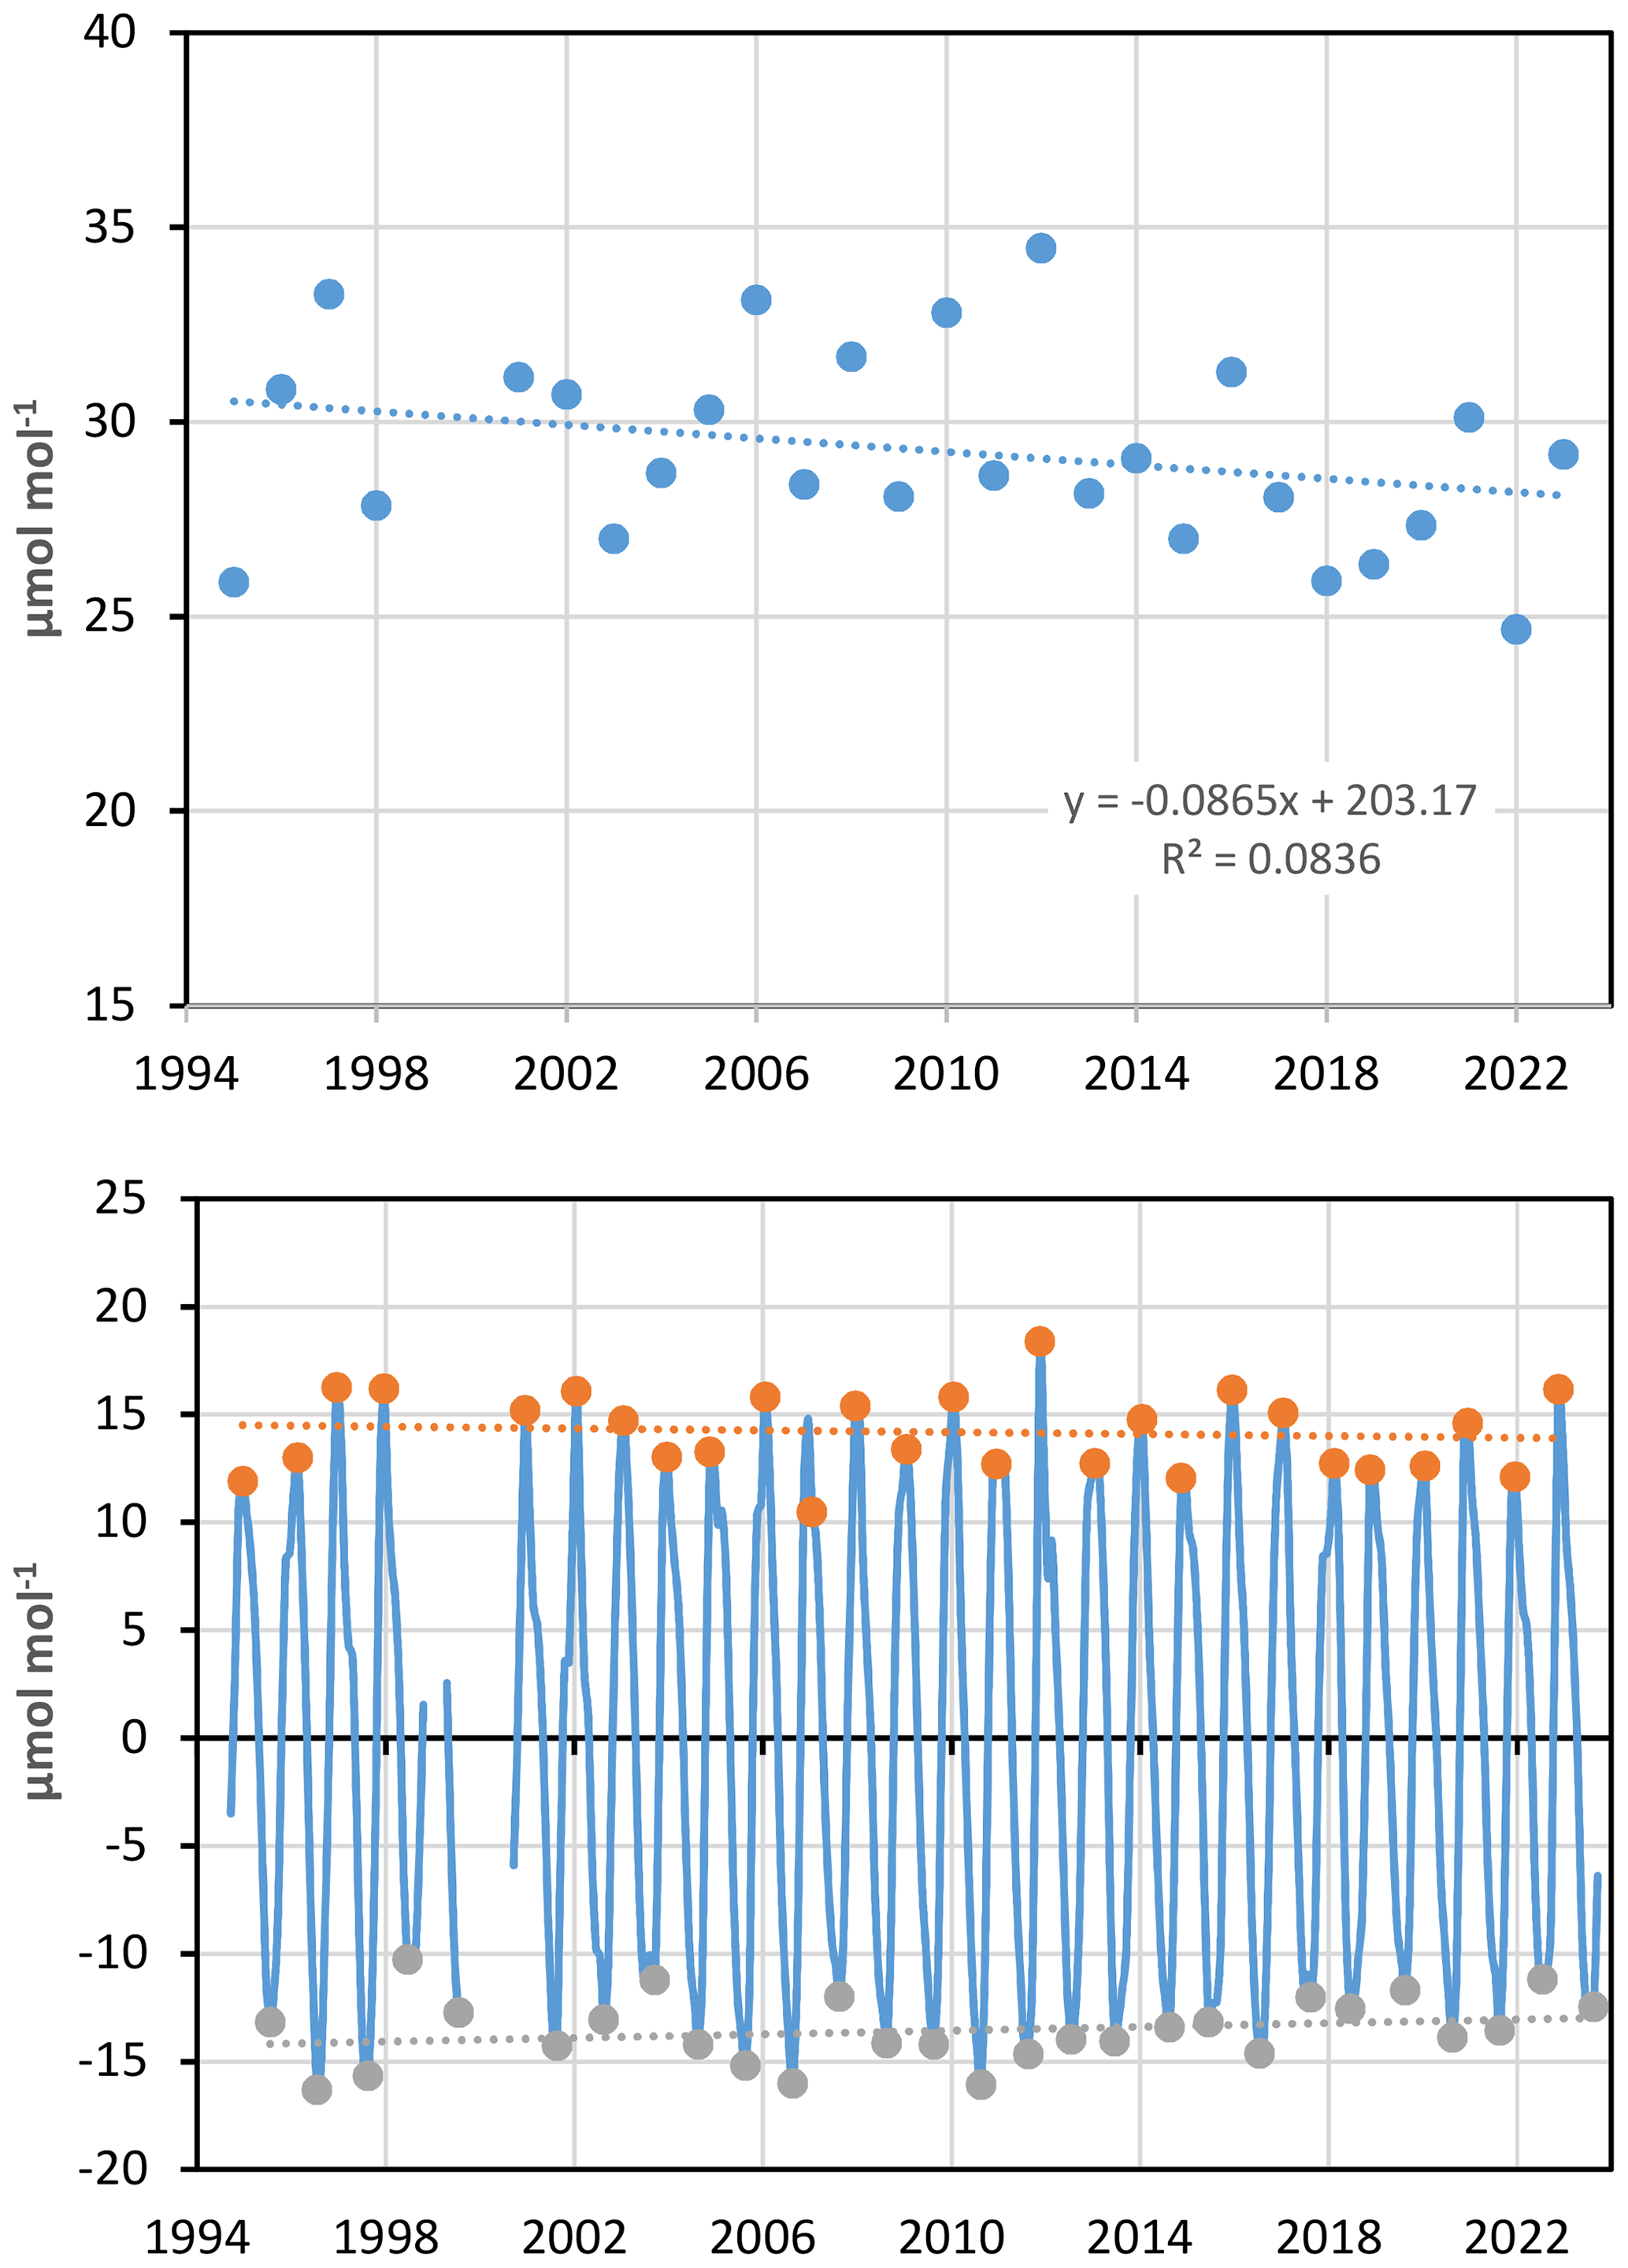
Figure 10Temporal variation of the seasonal amplitude at Hegyhátsál at 115 m elevation (upper panel) and the tendencies in summer (April–September) minimums and winter (October–March) maximums. The period 1999–2000 was not taken into account in the trend estimations due to the repeated and prolonged data gaps caused by technical problems.
3.3 Long-term changes in the atmospheric CO2 concentration
Figure 11 shows the smoothed temporal variation and long-term trend calculated by the CCGCRV software (Thoning et al., 1989). The data indicate a steady increase in the concentration with an overall growth rate of 2.20 . This is close to what the marine boundary layer reference concentration (Lan et al., 2023b) gives for the 42–52° N latitude band (2.16 ) and to the overall global growth rate of 2.09 (Lan et al., 2023a). Not considering the wide seasonal variation, the data from Hegyhátsál show a 3.90 ± 0.83 µmol mol−1 offset relative to the marine boundary layer reference concentration (Fig. 11). The offset is presumably caused by the anthropogenic emissions in Europe. 14CO2 measurements in 2008–2014 indicated 1–6 µmol mol−1 of seasonally varying fossil fuel excess CO2 relative to the European high-mountain baseline greenhouse gas (GHG) monitoring station at Jungfraujoch (46°33′ N, 7°59′ E; 3450 m a.s.l.) (Major et al., 2018).
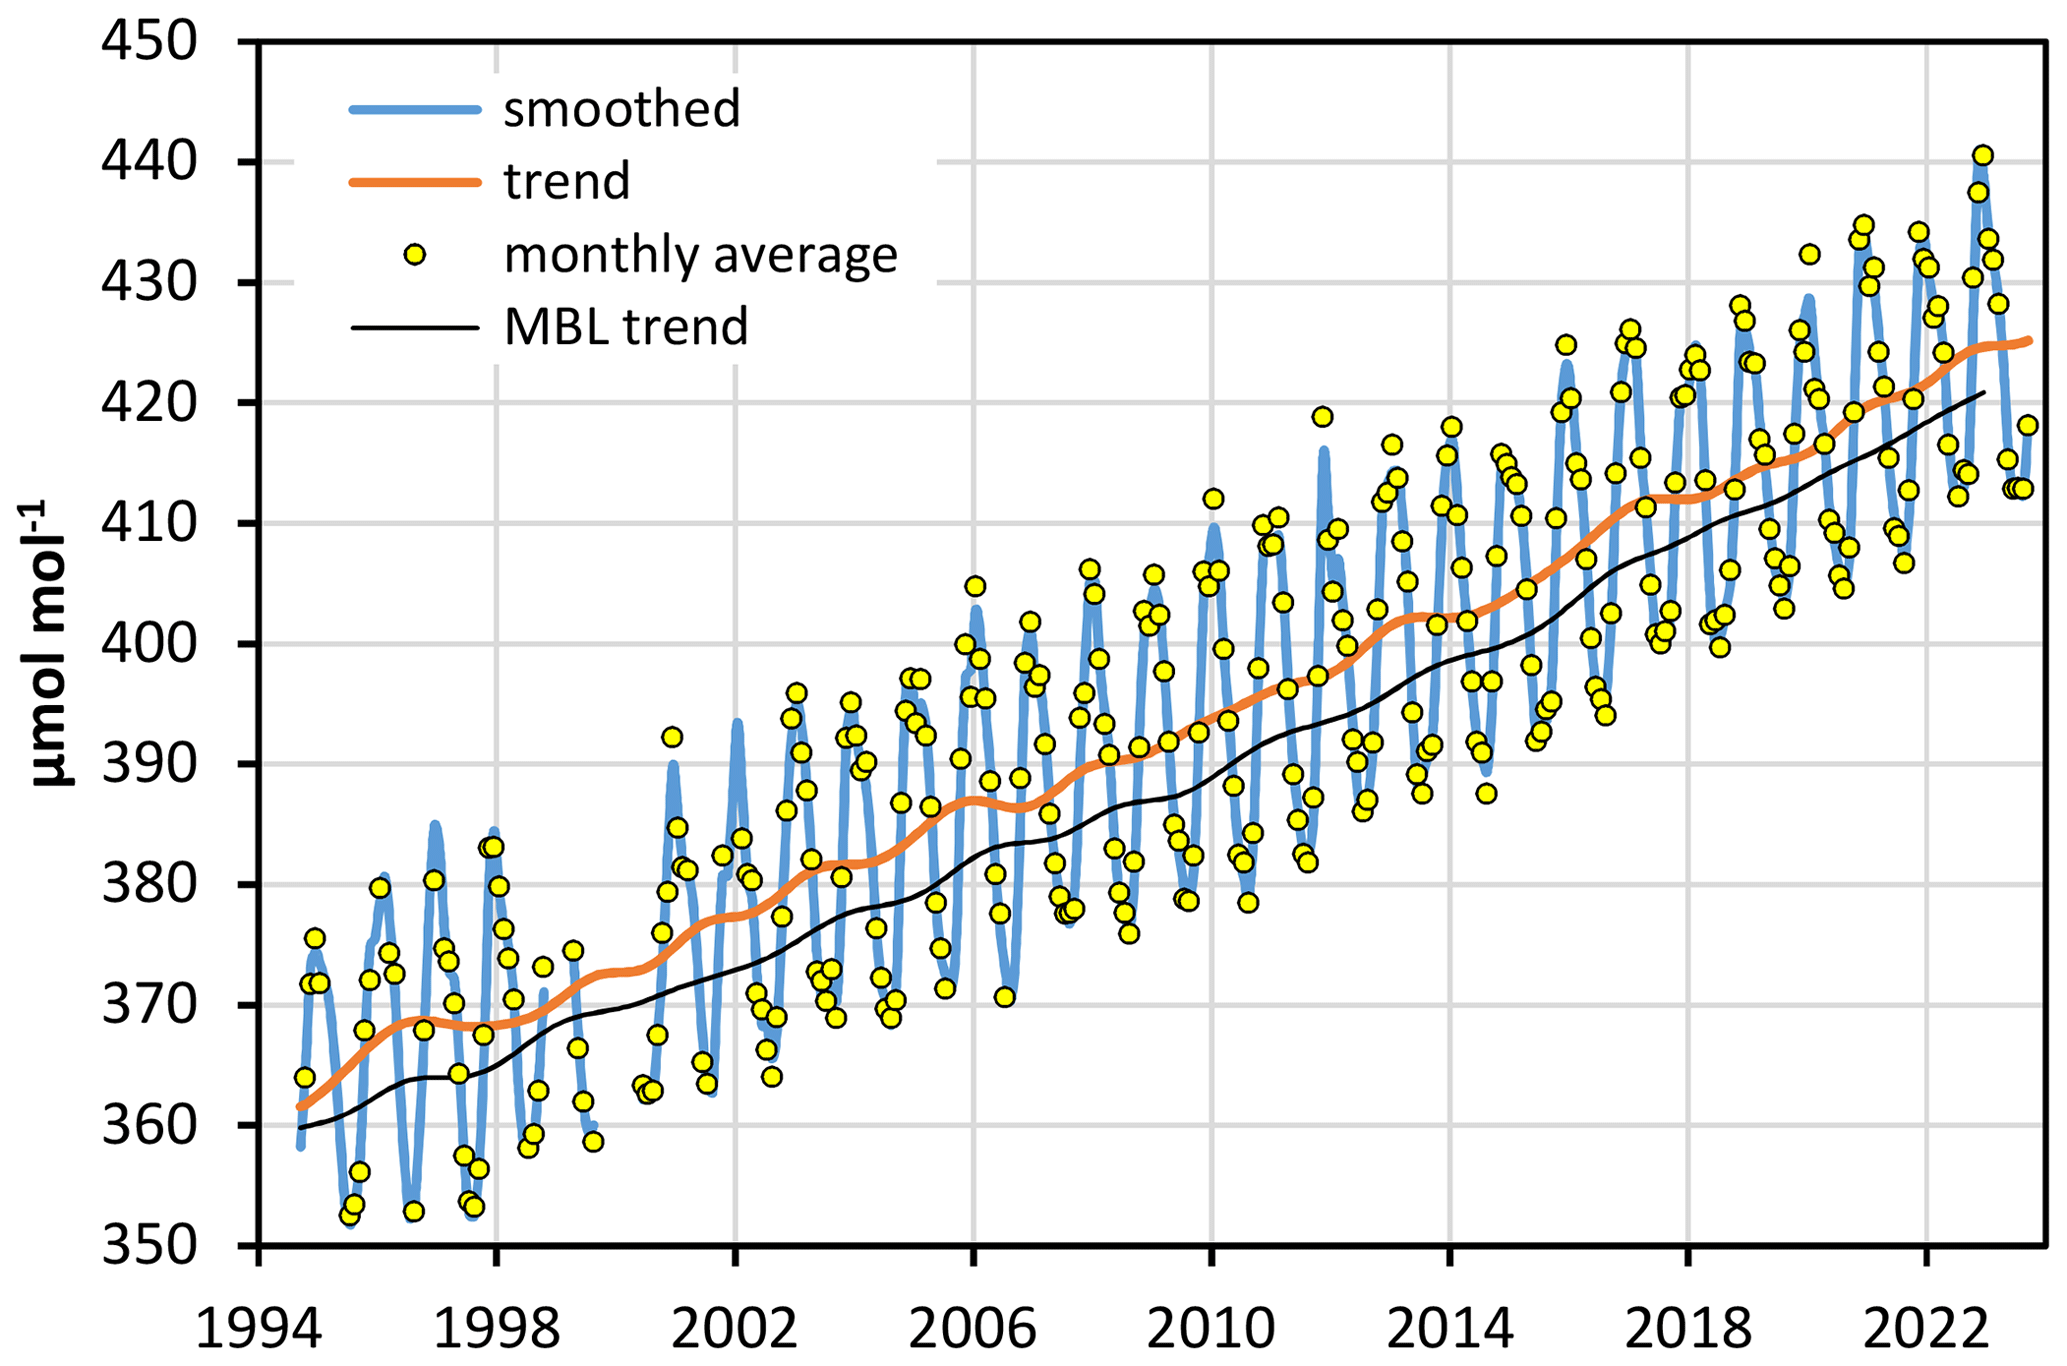
Figure 11The temporal variation of CO2 concentration at 115 m elevation at Hegyhátsál showing the monthly averages, the fitted smoothed curve, and the trend, as well as the trend of the marine boundary layer reference concentration (MBL) in the 42–52° N latitudinal band.
At Hegyhátsál, the growth rate, which is the derivative of the time-dependent trend, varies between −1.35 and +4.94 (Fig. 12). Both global and regional anthropogenic emissions vary in much narrower ranges (globally, a 1 µmol mol−1 increase corresponds to approximately 7.8 Pg CO2 [2.12 Pg C] net input into the atmosphere – Ciais et al., 2013). As was first noticed by Bacastow studying measurements from Mauna Loa Observatory (Hawaii) and the South Pole, the growth rate of the atmospheric carbon dioxide concentration is strongly modulated by the El Niño–Southern Oscillation (ENSO) phenomenon (Bacastow, 1976). ENSO is an irregularly periodic variation in winds, pressure, and sea surface temperatures over the tropical Pacific Ocean. In general, its warm phase (also called El Niño) is associated with positive temperature and negative precipitation anomalies, especially in the tropics. The high temperature and prolonged drought conditions reduce the gross primary production of the vegetation and increase fire activity, which reduces the net carbon uptake (Patra et al., 2005; Zeng et al., 2005; Kim et al., 2016; Bastos et al., 2018; Rödenbeck et al., 2018). The negative phase of ENSO causes the opposite effects. The ENSO-associated land–atmosphere CO2 exchange variability can be as high as 5 Pg C yr−1 (Zeng et al., 2005), comparable to the atmospheric fraction of current anthropogenic CO2 emissions. The ENSO-associated (dominantly) tropical land uptake fluctuations lead to large variations in atmospheric CO2 growth rates that lag ENSO by some time.
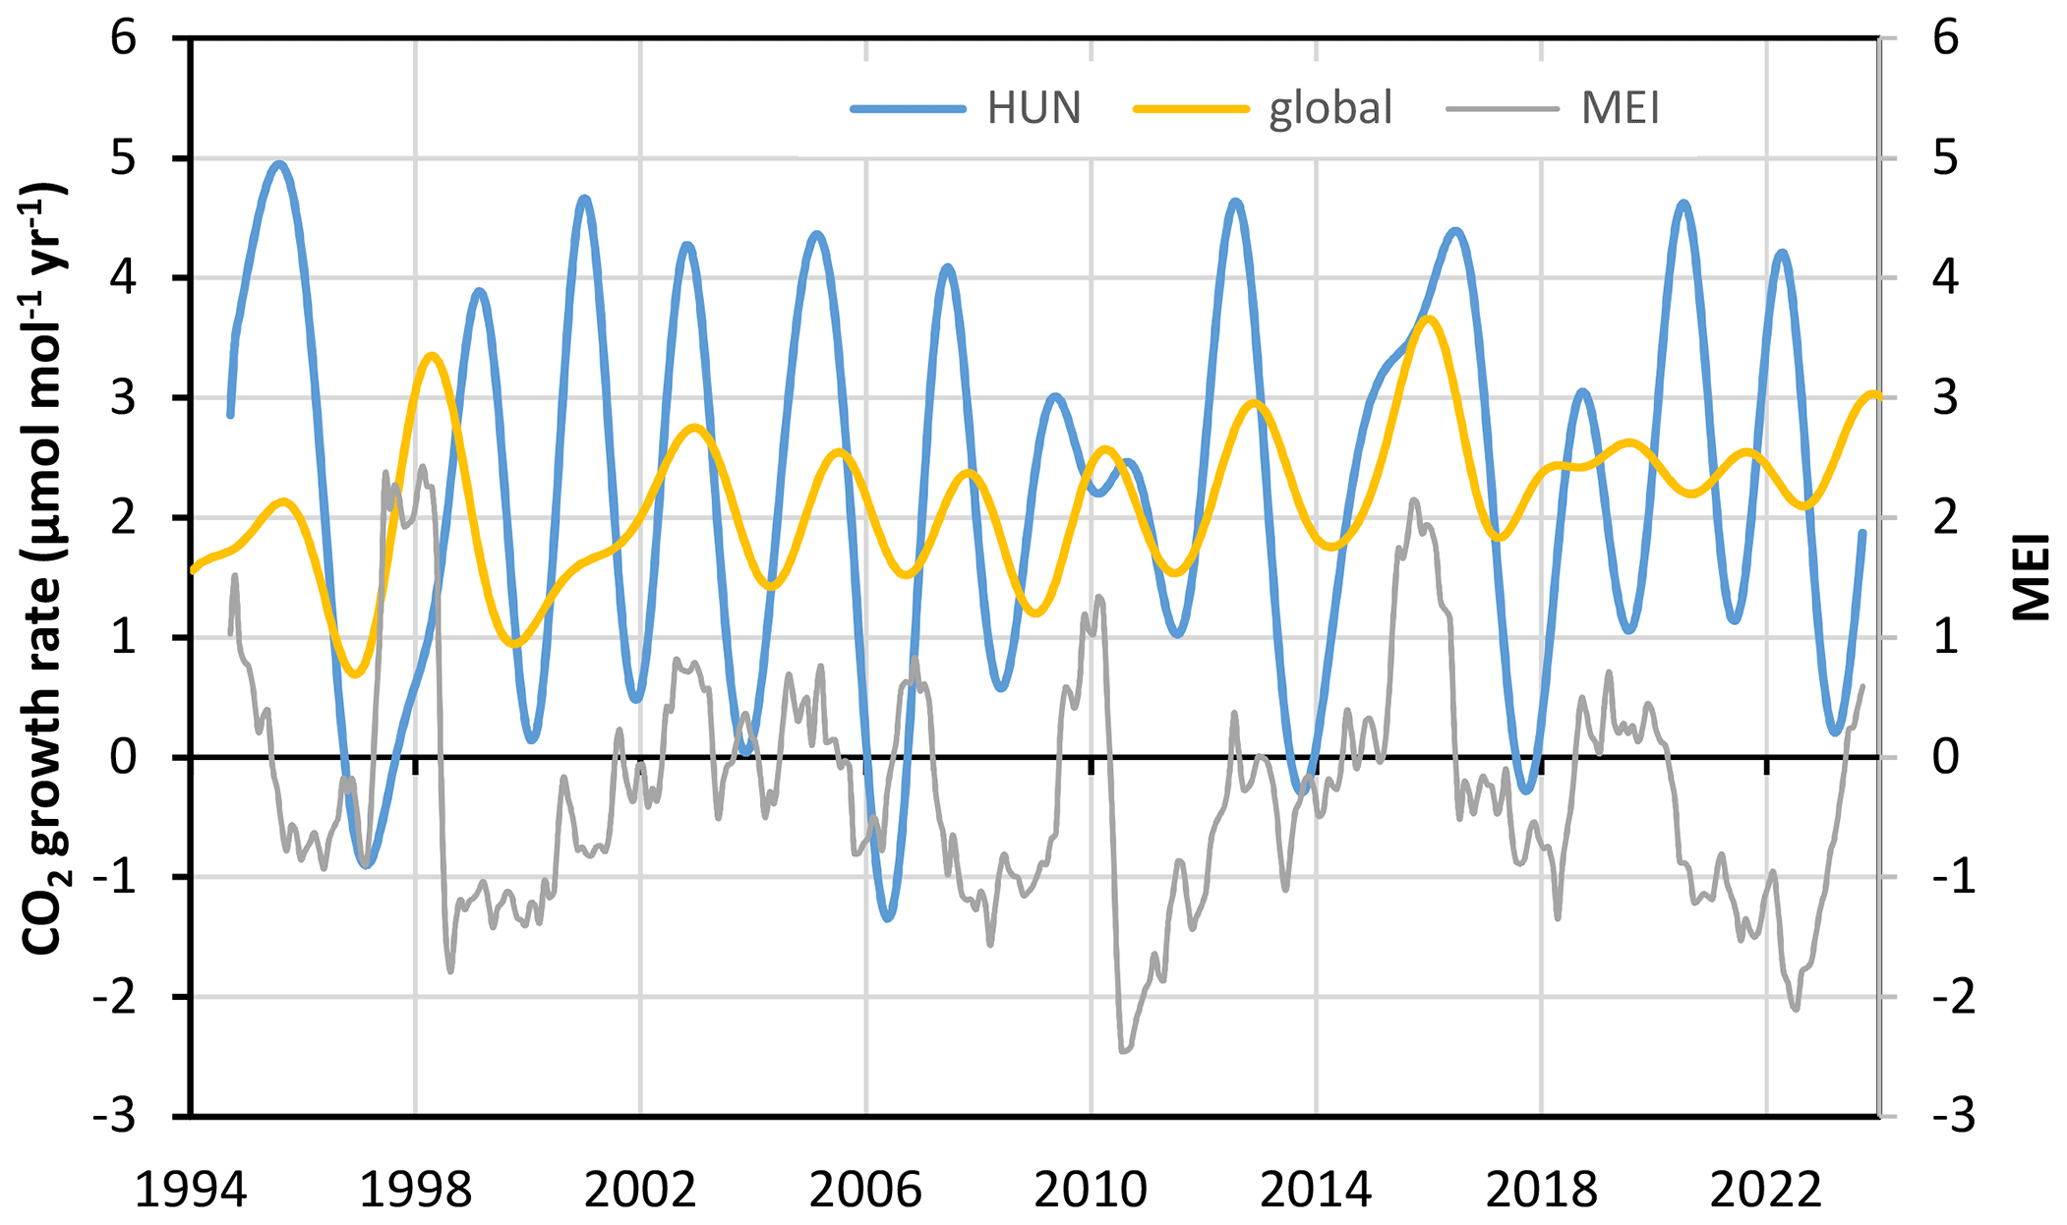
Figure 12The temporal variation of the growth rate of the CO2 concentration at 115 m elevation at Hegyhátsál (HUN) and in the global atmosphere, as well as that of the multivariate ENSO index (MEI). The global growth rate has been calculated from the globally averaged marine surface monthly mean data (https://gml.noaa.gov/webdata/ccgg/trends/co2/co2_mm_gl.txt, last access: 27 May 2024).
Mauna Loa Observatory is located almost in the middle of the Pacific Basin, in Hawaii (20° N), the closest to the ENSO phenomenon. Chylek et al. (2018) reported a lag time of 5.2 ± 2.7 months in the correlation between ENSO and the CO2 growth rate. The Baring Head Clean Air Monitoring Station in New Zealand, also in the Pacific Basin but at 41° S, also reported a 5-month lag (Stephens et al., 2013). The ENSO relationship is less robust in Europe. Cundari et al. (1995) calculated the correlation between ENSO and the CO2 growth rate measured at Mt. Cimone, Italy, and obtained the maximum correlation coefficient (0.6) with a 7–8-month lag time. Apadula et al. (2019) reported a 4-month lag at Plateau Rosa, Italy, while Artuso et al. (2009) calculated 9 months for Lampedusa, an Italian island in the Mediterranean Sea. Using measurement data from 43 monitoring stations Das et al. (2022) investigated how the ENSO signal in the atmospheric CO2 growth rate propagates meridionally and how the lag time changes with latitude. They also found significant scatter in the northern extratropics ranging from 0 to 12 months.
ENSO is characterized by different indices. The most commonly used are the Southern Oscillation Index (SOI) and the multivariate ENSO index (MEI) (https://www.weather.gov/fwd/indices, last access: 6 December 2023). For the analysis of the Hungarian measurements, the values of the multivariate ENSO index downloaded from the NOAA Physical Sciences Laboratory (https://psl.noaa.gov/enso/mei/, last access: 6 December 2023) were used (Fig. 13). The maximum correlation (r=0.45; p<0.01) was calculated when the growth rate values were delayed by 6 months relative to the MEI ones. The 7-month delay gave practically the same value (r=0.44). The latitudinally representative marine boundary layer reference data series showed the highest correlation (0.53) for the same period (1994–2023) with a 7-month delay (Fig. 13).
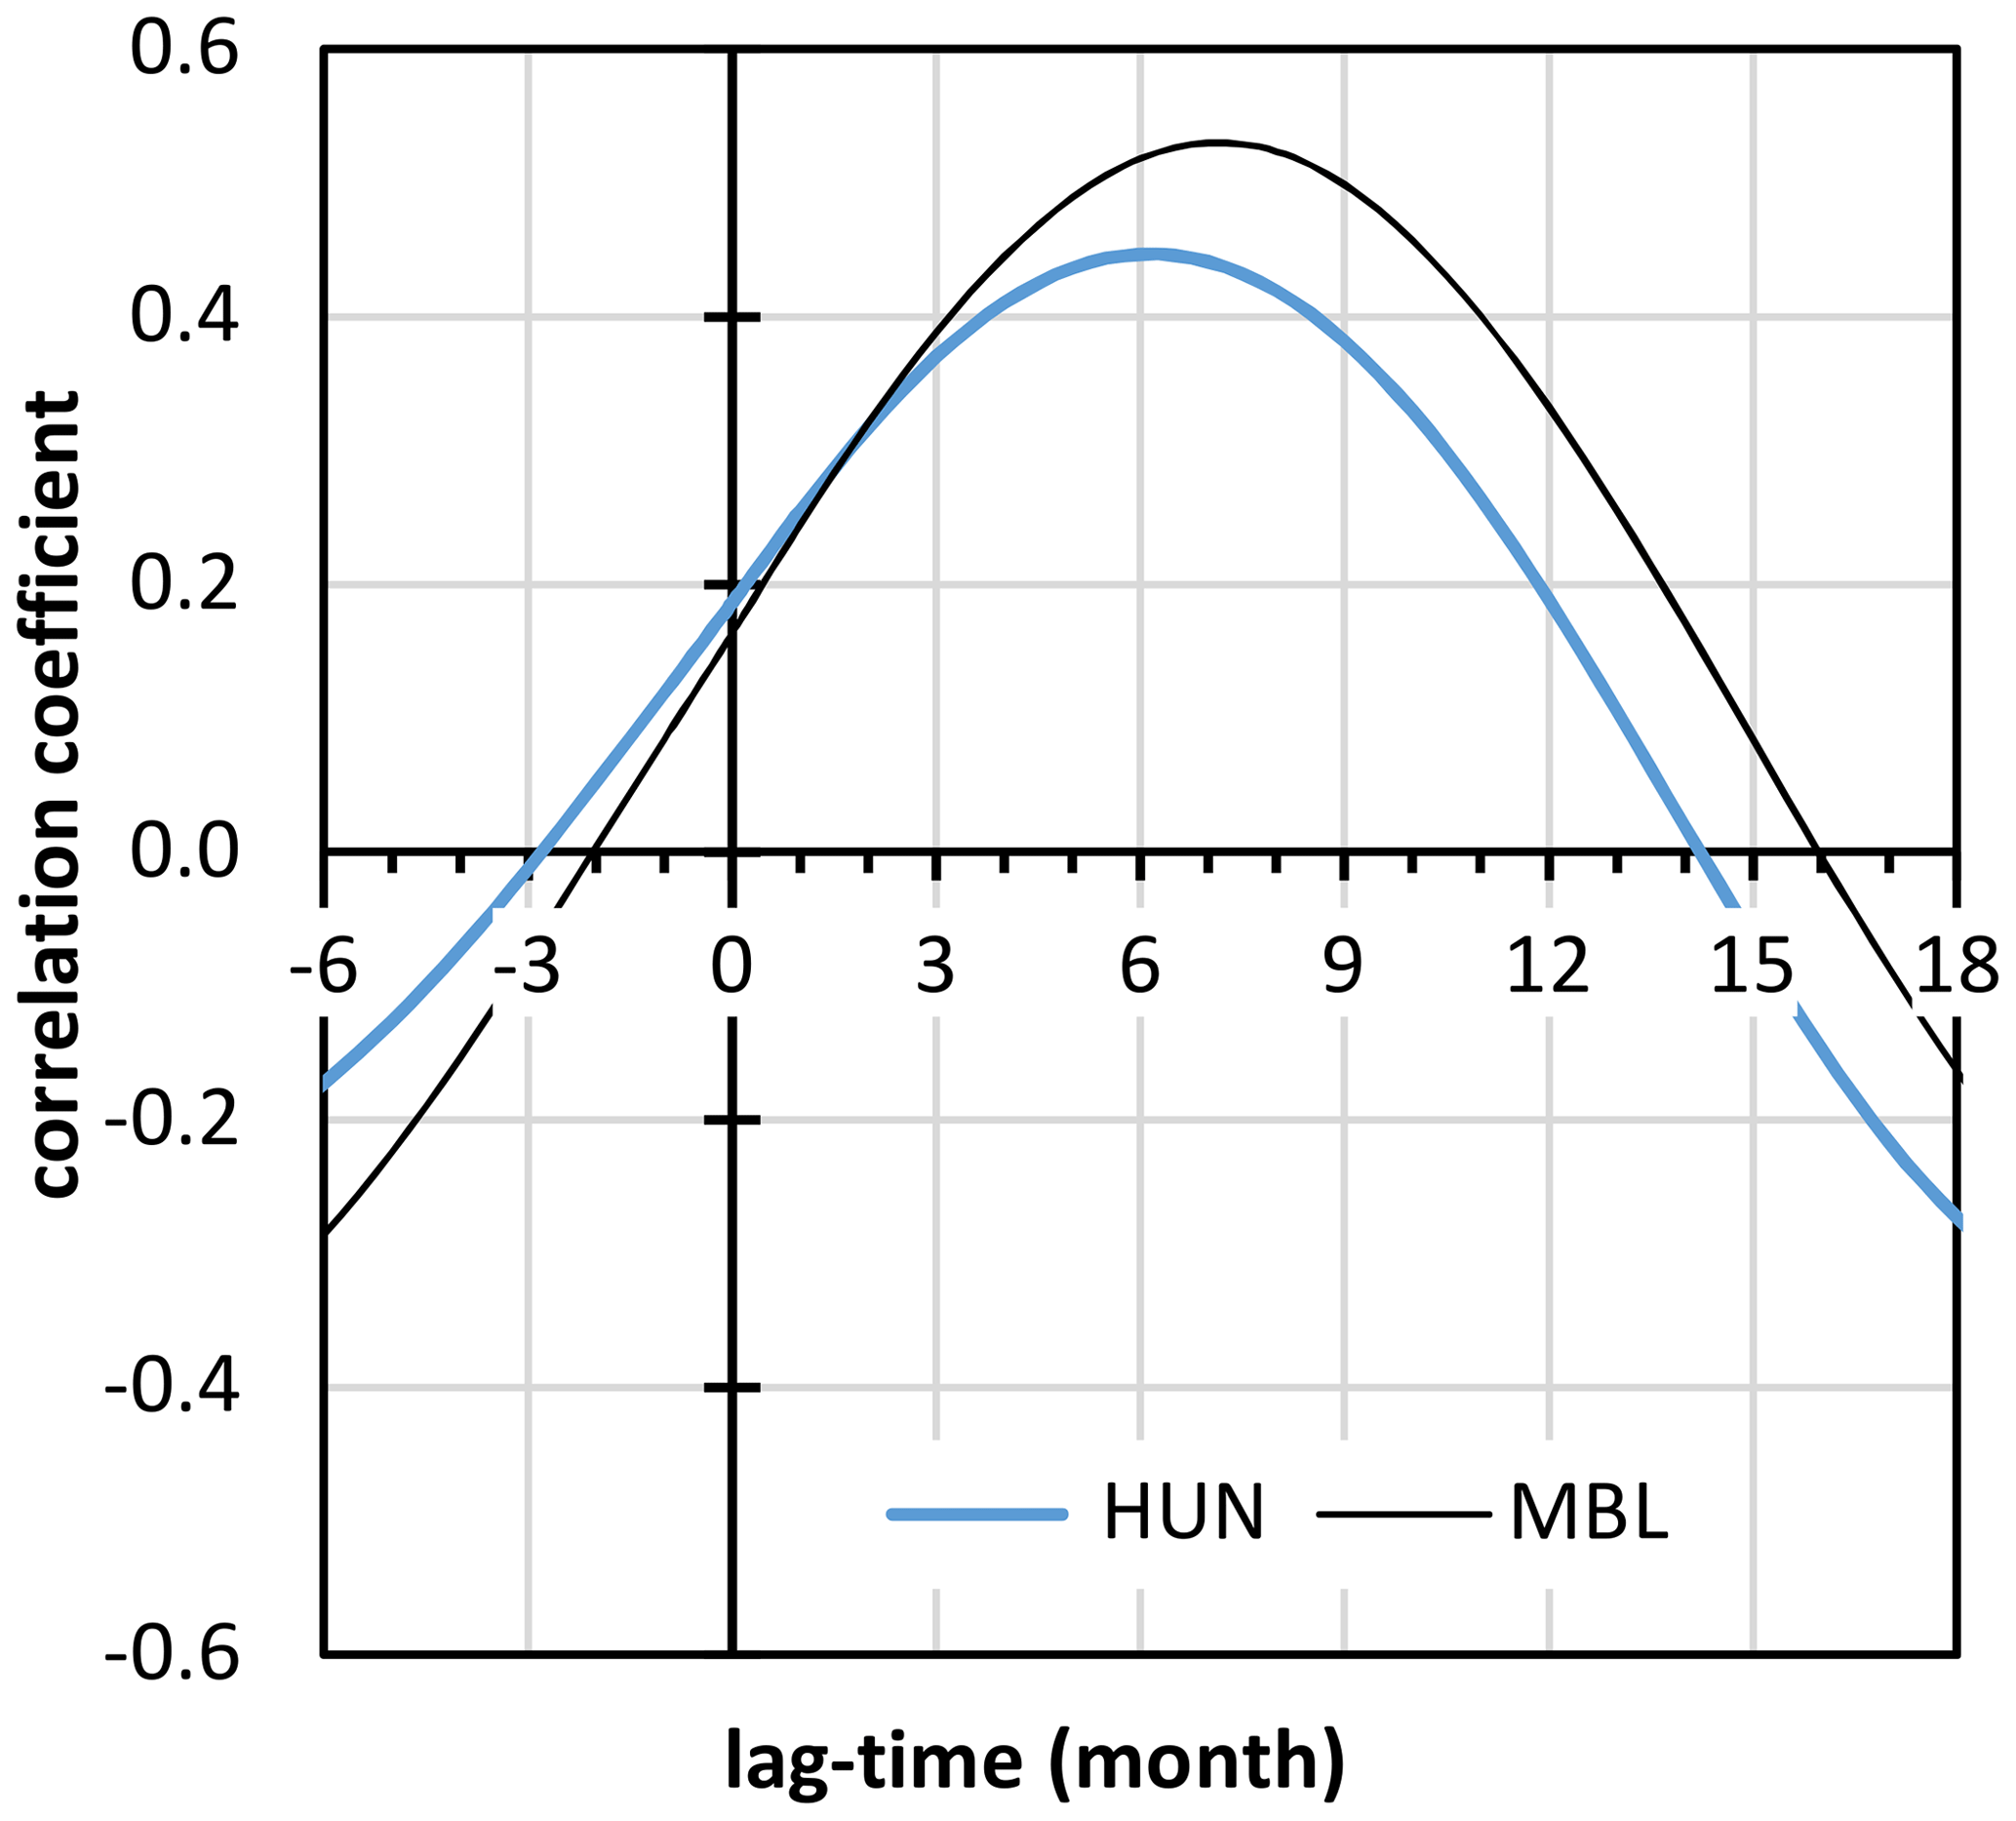
Figure 13Correlation coefficient between the CO2 growth rate and the multivariate ENSO index at Hegyhátsál (HUN) and in the marine boundary layer as functions of the lag time.
Due to the high natural variability in the atmospheric carbon dioxide concentration, primarily caused by the climate–biosphere feedbacks, the tendencies and governing processes may be hidden for a long time. The longer a data series, the more valuable it is for scientific research as it can allow the revelation of previously unknown processes and support (or reject) hypotheses. Due to the natural variability of the atmosphere, the evaluation of the performance of atmospheric carbon budget models also needs long data series. All of these underscore the need for long-term, uninterrupted operation of monitoring stations, which requires stable funding and dedicated staff in the background.
In this study, we analyzed the 3-decade-long data series from Hegyhátsál, a central European monitoring site, which is unique in the sense that most of the monitoring sites with similar characteristics (low-elevation mid-continental sites surrounded by active vegetation) have much shorter data series. By studying the diurnal and seasonal variations in the long CO2 concentration data series we have concluded that they are slowly changing with time as a consequence of the changing climate. The diurnal concentration amplitude tends to increase, especially in summer. The reason is the above-average increase in the nighttime concentrations, which is caused by the enhanced respiration during the warming nights. The tendency is slow, and it can only be seen in long data series. The warming climate has also caused the earlier onset of the summer CO2-deficit season. The long data series has also allowed us to identify a break in this trend around 2010 when the advance of the spring zero crossing stopped. Presumably, the ecosystems of the region have become light-limited, and the continuing warming cannot advance the start of the growing season further. While the northern temperate ecosystems turn from a net CO2 source to a net CO2 sink only in March–April, the boundary layer CO2 concentration peaks in December–January at our mid-continental, low-elevation site. The reason for this is the significant change in atmospheric dynamics in the late winter to early spring period. The role of the changing atmospheric dynamics in the formation of the atmospheric CO2 concentration has not yet been studied at many monitoring sites.
At the Hegyhátsál monitoring station, the long-term trend follows that in the global background atmosphere with a positive offset of a few µmol mol−1, which is the contribution of the European net emissions. Although the monitoring site is far from the Pacific Basin and several factors are making the data series noisier than at the global background stations, the effect of the Southern Oscillation is clearly detectable in the data series. In the European emission calculations, this effect should also be taken into account.
The carbon dioxide concentration data measured at Hegyhátsál (HUN) are publicly available from the WMO World Data Centre for Greenhouse Gases (https://gaw.kishou.go.jp/, WDCGG, 2024) and as part of NOAA's ObsPack data product (https://doi.org/10.25925/20230801, Schuldt et al., 2023).
The supplement related to this article is available online at: https://doi.org/10.5194/amt-17-4629-2024-supplement.
The author has declared that there are no competing interests.
Publisher's note: Copernicus Publications remains neutral with regard to jurisdictional claims made in the text, published maps, institutional affiliations, or any other geographical representation in this paper. While Copernicus Publications makes every effort to include appropriate place names, the final responsibility lies with the authors.
The monitoring program at Hegyhátsál was initiated by Ernő Mészáros (Hungarian Meteorological Service) and Pieter Tans (NOAA), with contributions by Peter Bakwin (NOAA), and was supported by Antenna Hungaria Corp., the owner of the telecommunication tower used. During the initial years, the monitoring program was funded by the US–Hungarian Scientific and Technological Joint Fund and later by several European Union (AEROCARB, CHIOTTO, CarboEurope, CarboEurope-IP, Carbon-Pro, IMECC, InGOS, RINGO) and Hungarian research projects (OTKA). The monitoring site was operated by the Hungarian Meteorological Service until 2020 when it was taken over by the Institute for Nuclear Research (Hungary). The compilation of the present review study was supported by the Hungarian National Research, Development and Innovation Office (grant OTKA K141839). The author thanks Kirk Thoning (NOAA) for the CCGCRV software used in the data evaluation and Ida Storm (ICOS Carbon Portal) for the footprint calculations. The author also thanks the staff of the NOAA ESRL Global Monitoring Laboratory for the long-term cooperation and analyses of the air samples taken at Hegyhátsál.
This research has been supported by the National Research, Development and Innovation Office (grant no. OTKA 141839).
This paper was edited by Dominik Brunner and reviewed by two anonymous referees.
Aalto, T., Hatakka, J., Paatero, J., Tuovinen, J. P., Aurela, M., Laurila, T., Holmén, K., Trivett, N., and Viisanen, Y.: Tropospheric carbon dioxide concentrations at a northern boreal site in Finland: basic variations and source areas, Tellus B, 54, 110–126, https://doi.org/10.3402/tellusb.v54i2.16652, 2002.
Adcock, K. E., Pickers, P. A., Manning, A. C., Forster, G. L., Fleming, L. S., Barningham, T., Wilson, P. A., Kozlova, E. A., Hewitt, M., Etchells, A. J., and Macdonald, A. J.: 12 years of continuous atmospheric O2, CO2 and APO data from Weybourne Atmospheric Observatory in the United Kingdom, Earth Syst. Sci. Data, 15, 5183–5206, https://doi.org/10.5194/essd-15-5183-2023, 2023.
Andrews, A. E., Kofler, J. D., Trudeau, M. E., Williams, J. C., Neff, D. H., Masarie, K. A., Chao, D. Y., Kitzis, D. R., Novelli, P. C., Zhao, C. L., Dlugokencky, E. J., Lang, P. M., Crotwell, M. J., Fischer, M. L., Parker, M. J., Lee, J. T., Baumann, D. D., Desai, A. R., Stanier, C. O., De Wekker, S. F. J., Wolfe, D. E., Munger, J. W., and Tans, P. P.: CO2, CO, and CH4 measurements from tall towers in the NOAA Earth System Research Laboratory's Global Greenhouse Gas Reference Network: instrumentation, uncertainty analysis, and recommendations for future high-accuracy greenhouse gas monitoring efforts, Atmos. Meas. Tech., 7, 647–687, https://doi.org/10.5194/amt-7-647-2014, 2014.
Apadula, F., Cassardo, C., Ferrarese, S., Heltai, D., and Lanza, A.: Thirty years of atmospheric CO2 observations at the Plateau Rosa Station, Italy, Atmosphere, 10, 418, https://doi.org/10.3390/atmos10070418, 2019.
Arrhenius, S.: Worlds in the making, Harper and Brothers Publishers, New York, London, 1908.
Artuso, F., Chamard, P., Piacentino, S., Sferlazzo, D. M., Silvestri, L. D., di Sarra, A., Meloni, D., and Monteleone, F.: Influence of transport and trends in atmospheric CO2 at Lampedusa, Atmos. Environ., 43, 3044–3051, 2009.
, R. B.: Modulation of atmospheric carbon dioxide by the Southern Oscillation, Nature, 261, 116–118, https://doi.org/10.1038/261116a0, 1976.
Bakwin, P. S., Tans, P. P., Zhao, C., Ussler, W. I., and Quesnell, E.: Measurements of carbon dioxide on a very tall tower, Tellus B, 47, 535–549, https://doi.org/10.1034/j.1600-0889.47.issue5.2.x, 1995.
Bakwin, P. S., Tans, P. P., Hurst, D. F., and Zhao, C.: Measurement of carbon dioxide on very tall towers: results of the NOAA/CMDL program, Tellus B, 50, 401–415, https://doi.org/10.3402/tellusb.v50i5.16216, 1998.
Barcza, Z., Kern, A., Haszpra, L., and Kljun, N.: Spatial representativeness of tall tower eddy covariance measurements using remote sensing and footprint analysis, Agr. Forest Meteorol., 149, 795–807, https://doi.org/10.1016/j.agrformet.2008.10.021, 2009.
Barcza, Z., Kern, A., Davis, K. J., and Haszpra, L.: Analysis of the 21 years long carbon dioxide flux dataset from a Central European tall tower site, Agr. Forest Meteorol., 290, 108027, https://doi.org/10.1016/j.agrformet.2020.108027, 2020.
Bastos, A., Friedlingstein, P., Sitch, S., Chen, C., Mialon, A., Wigneron, J.-P., Arora, V. K., Briggs, P. R., Canadell, J. G., Ciais, P., Chevallier, F., Cheng, L., Delire, C., Haverd, V., Jain, A. K., Joos, F., Kato, E., Lienert, S., Lombardozzi, D., Melton, J. R., Myneni, R., Nabel, J. E. M. S., Pongratz, J., Poulter, B., Rödenbeck, C., Séférian, R., Tian, H., van Eck, C., Viovy, N., Vuichard, N., Walker, A. P., Wiltshire, A., Yang, J., Zaehle, S., Zeng, N., and Zhu, D.: Impact of the 2015/2016 El Niño on the terrestrial carbon cycle constrained by bottom-up and top-down approaches, Philos. T. Roy. Soc. B, 373, 20170304, https://doi.org/10.1098/rstb.2017.0304, 2018.
Bastos, A., Fu, Z., Ciais, P., Friedlingstein, P., Sitch, S., Pongratz, J., Weber, U., Reichstein, M., Anthoni, P., Arneth, A., Haverd, V., Jain, A., Joetzjer, E., Knauer, J., Lienert, S., Loughran, T., McGuire, P. C., Obermeier, W., Padrón, R. S., Shi, H., Tian, H., Viovy, N., and Zaehle, S.: Impacts of extreme summers on European ecosystems: a comparative analysis of 2003, 2010 and 2018, Philos. T. Roy. Soc. B, 375, 20190507, https://doi.org/10.1098/rstb.2019.0507, 2020.
Belikov, D., Arshinov, M., Belan, B., Davydov, D., Fofonov, A., Sasakawa, M., and Machida, T.: Analysis of the Diurnal, Weekly, and Seasonal Cycles and Annual Trends in Atmospheric CO2 and CH4 at Tower Network in Siberia from 2005 to 2016, Atmosphere, 10, 689, 2019.
Berhanu, T. A., Satar, E., Schanda, R., Nyfeler, P., Moret, H., Brunner, D., Oney, B., and Leuenberger, M.: Measurements of greenhouse gases at Beromünster tall-tower station in Switzerland, Atmos. Meas. Tech., 9, 2603–2614, https://doi.org/10.5194/amt-9-2603-2016, 2016.
Botía, S., Komiya, S., Marshall, J., Koch, T., Gałkowski, M., Lavric, J., Gomes-Alves, E., Walter, D., Fisch, G., Pinho, D. M., Nelson, B. W., Martins, G., Luijkx, I. T., Koren, G., Florentie, L., Carioca de Araújo, A., Sá, M., Andreae, M. O., Heimann, M., Peters, W., and Gerbig, C.: The CO2 record at the Amazon Tall Tower Observatory: A new opportunity to study processes on seasonal and inter-annual scales, Global Change Biol., 28, 588–611, https://doi.org/10.1111/gcb.15905, 2022.
Brailsford, G. W., Stephens, B. B., Gomez, A. J., Riedel, K., Mikaloff Fletcher, S. E., Nichol, S. E., and Manning, M. R.: Long-term continuous atmospheric CO2 measurements at Baring Head, New Zealand, Atmos. Meas. Tech., 5, 3109–3117, https://doi.org/10.5194/amt-5-3109-2012, 2012.
Callendar, G. S.: The artifical production of carbon dioxide and its influence on temperature, Q. J. Roy. Meteor. Soc., 64, 223–240, https://doi.org/10.1002/qj.49706427503, 1938.
Callendar, G. S.: Can carbon dioxide influence climate?, Weather, 4, 310–318, 1949.
Carbon Portal ICOS RI: STILT station characterization for Hegyhátsál at 115 m, https://hdl.handle.net/11676/P8ovRbMVpf26-XlBpql4UBbV (last access: 12 January 2024), 2024.
Chen, X. and Yang, Y.: Observed earlier start of the growing season from middle to high latitudes across the Northern Hemisphere snow-covered landmass for the period 2001–2014, Environ. Res. Lett., 15, 034042, https://doi.org/10.1088/1748-9326/ab6d39, 2020.
Chylek, P., Tans, P., Christy, J., and Dubey, M. K.: The carbon cycle response to two El Nino types: an observational study, Environ. Res. Lett., 13, 024001, https://doi.org/10.1088/1748-9326/aa9c5b, 2018.
Ciais, P., Sabine, C., Bala, G., Bopp, L., Brovkin, V., Canadell, J., Chhabra, A., DeFries, R., Galloway, J., Heimann, M., Jones, C., Le Quéré, C., Myneni, R. B., Piao, S., and Thornton, P.: Carbon and other biogeochemical cycles, in: Climate Change 2013: The Physical Science Basis. Contribution of Working Group I to the Fifth Assessment Report of the Intergovernmental Panel on Climate Change, edited by: Stocker, T. F., Qin, D., Plattner, G.-K., Tignor, M., Allen, S. K., Boschung, J., Nauels, A., Xia, Y., Bex, V., and Midgley, P. M., Cambridge University Press, Cambridge, United Kingdom and New York, NY, USA, 465–570, ISBN 978-1-107-05799, 2013.
Ciattaglia, L.: Interpretation of atmospheric CO2 measurements at Mt. Cimone (Italy) related to wind data, J. Geophys. Res.-Oceans, 88, 1331–1338, https://doi.org/10.1029/JC088iC02p01331, 1983.
Conil, S., Helle, J., Langrene, L., Laurent, O., Delmotte, M., and Ramonet, M.: Continuous atmospheric CO2, CH4 and CO measurements at the Observatoire Pérenne de l'Environnement (OPE) station in France from 2011 to 2018, Atmos. Meas. Tech., 12, 6361–6383, https://doi.org/10.5194/amt-12-6361-2019, 2019.
Cundari, V., Colombo, T., and Ciattaglia, L.: Thirteen years of atmospheric carbon dioxide measurements at Mt. Cimone station, Italy, Nuovo Cimento C, 18, 33–47, https://doi.org/10.1007/bf02561457, 1995.
Curcoll, R., Camarero, L., Bacardit, M., Àgueda, A., Grossi, C., Gacia, E., Font, A., and Morguí, J.-A.: Atmospheric carbon dioxide variability at Aigüestortes, Central Pyrenees, Spain, Reg. Environ. Change, 19, 313–324, https://doi.org/10.1007/s10113-018-1443-2, 2019.
Das, C., Kunchala, R. K., Chandra, N., Chmura, L., Nęcki, J., and Patra, P. K.: Meridional propagation of carbon dioxide (CO2) growth rate and flux anomalies from the tropics due to ENSO, Geophys. Res. Lett., 49, e2022GL100105, https://doi.org/10.1029/2022GL100105, 2022.
Davis, K. J., Bakwin, P. S., Yi, C., Berger, B. W., Zhao, C., Teclaw, R. M., and Isebrands, J. G.: The annual cycles of CO2 and H2O exchange over a northern mixed forest as observed from a very tall tower, Global Change Biol., 9, 1278–1293, 2003.
Derwent, R. G., Ryall, D. B., Manning, A. J., Simmonds, P. G., O'Doherty, S., Biraud, S., Ciais, P., Ramonet, M., and Jennings, S. G.: Continuous observations of carbon dioxide at Mace Head, Ireland from 1995 to 1999 and its net European ecosystem exchange, Atmos. Environ., 36, 2799–2807, 2002.
Ekholm, N.: On the variations of the climate of the geological and historical past and their causes, Q. J. Roy. Meteor. Soc., 27, 1–62, https://doi.org/10.1002/qj.49702711702, 1901.
Fang, S. X., Zhou, L. X., Tans, P. P., Ciais, P., Steinbacher, M., Xu, L., and Luan, T.: In situ measurement of atmospheric CO2 at the four WMO/GAW stations in China, Atmos. Chem. Phys., 14, 2541–2554, https://doi.org/10.5194/acp-14-2541-2014, 2014.
Fang, S.-X., Luan, T., Zhang, G., Wu, Y.-L., and Yu, D.-J.: The determination of regional CO2 mole fractions at the Longfengshan WMO/GAW station: A comparison of four data filtering approaches, Atmos. Environ., 116, 36–43, https://doi.org/10.1016/j.atmosenv.2015.05.059, 2015.
Forkel, M., Carvalhais, N., Rödenbeck, C., Keeling, R., Heimann, M., Thonicke, K., Zaehle, S., and Reichstein, M.: Enhanced seasonal CO2 exchange caused by amplified plant productivity in northern ecosystems, Science, 351, 696–699, https://doi.org/10.1126/science.aac4971, 2016.
Friedlingstein, P., O'Sullivan, M., Jones, M. W., Andrew, R. M., Bakker, D. C. E., Hauck, J., Landschützer, P., Le Quéré, C., Luijkx, I. T., Peters, G. P., Peters, W., Pongratz, J., Schwingshackl, C., Sitch, S., Canadell, J. G., Ciais, P., Jackson, R. B., Alin, S. R., Anthoni, P., Barbero, L., Bates, N. R., Becker, M., Bellouin, N., Decharme, B., Bopp, L., Brasika, I. B. M., Cadule, P., Chamberlain, M. A., Chandra, N., Chau, T.-T.-T., Chevallier, F., Chini, L. P., Cronin, M., Dou, X., Enyo, K., Evans, W., Falk, S., Feely, R. A., Feng, L., Ford, D. J., Gasser, T., Ghattas, J., Gkritzalis, T., Grassi, G., Gregor, L., Gruber, N., Gürses, Ö., Harris, I., Hefner, M., Heinke, J., Houghton, R. A., Hurtt, G. C., Iida, Y., Ilyina, T., Jacobson, A. R., Jain, A., Jarníková, T., Jersild, A., Jiang, F., Jin, Z., Joos, F., Kato, E., Keeling, R. F., Kennedy, D., Klein Goldewijk, K., Knauer, J., Korsbakken, J. I., Körtzinger, A., Lan, X., Lefèvre, N., Li, H., Liu, J., Liu, Z., Ma, L., Marland, G., Mayot, N., McGuire, P. C., McKinley, G. A., Meyer, G., Morgan, E. J., Munro, D. R., Nakaoka, S.-I., Niwa, Y., O'Brien, K. M., Olsen, A., Omar, A. M., Ono, T., Paulsen, M., Pierrot, D., Pocock, K., Poulter, B., Powis, C. M., Rehder, G., Resplandy, L., Robertson, E., Rödenbeck, C., Rosan, T. M., Schwinger, J., Séférian, R., Smallman, T. L., Smith, S. M., Sospedra-Alfonso, R., Sun, Q., Sutton, A. J., Sweeney, C., Takao, S., Tans, P. P., Tian, H., Tilbrook, B., Tsujino, H., Tubiello, F., van der Werf, G. R., van Ooijen, E., Wanninkhof, R., Watanabe, M., Wimart-Rousseau, C., Yang, D., Yang, X., Yuan, W., Yue, X., Zaehle, S., Zeng, J., and Zheng, B.: Global Carbon Budget 2023, Earth Syst. Sci. Data, 15, 5301–5369, https://doi.org/10.5194/essd-15-5301-2023, 2023.
Graven, H. D., Keeling, R. F., Piper, S. C., Patra, P. K., Stephens, B. B., Wofsy, S. C., Welp, L. R., Sweeney, C., Tans, P. P., Kelley, J. J., Daube, B. C., Kort, E. A., Santoni, G. W., and Bent, J. D.: Enhanced seasonal exchange of CO2 by northern ecosystems since 1960, Science, 341, 1085–1089, https://doi.org/10.1126/science.1239207, 2013.
Haszpra, L.: Carbon dioxide concentration measurements at a rural site in Hungary, Tellus B, 47, 14–22, https://doi.org/10.1034/j.1600-0889.47.issue1.3.x, 1995.
Haszpra, L.: Measurement of atmospheric carbon dioxide at a low elevation rural site in Central Europe, Időjárás, 103, 93–106, 1999a.
Haszpra, L.: On the representativeness of carbon dioxide measurements, J. Geophys. Res., 104D, 26953–26960, https://doi.org/10.1029/1999JD900311, 1999b.
Haszpra, L. and Barcza, Z.: Climate variability as reflected in a regional atmospheric CO2 record, Tellus B, 62, 417–426, https://doi.org/10.1111/j.1600-0889.2010.00505.x, 2010.
Haszpra, L. and Prácser, E.: Uncertainty of hourly-average concentration values derived from non-continuous measurements, Atmos. Meas. Tech., 14, 3561–3571, https://doi.org/10.5194/amt-14-3561-2021, 2021.
Haszpra, L., Barcza, Z., Hidy, D., Szilágyi, I., Dlugokencky, E., and Tans, P.: Trends and temporal variations of major greenhouse gases at a rural site in Central Europe, Atmos. Environ., 42, 8707–8716, https://doi.org/10.1016/j.atmosenv.2008.09.012, 2008.
Haszpra, L., Barcza, Z., Haszpra, T., Pátkai, Zs., and Davis, K. J.: How well do tall-tower measurements characterize the CO2 mole fraction distribution in the planetary boundary layer?, Atmos. Meas. Tech., 8, 1657–1671, https://doi.org/10.5194/amt-8-1657-2015, 2015.
Haszpra, L., Hidy, D., Taligás, T., and Barcza, Z.: First results of tall tower based nitrous oxide flux monitoring over an agricultural region in Central Europe, Atmos. Environ., 176, 240–251, https://doi.org/10.1016/j.atmosenv.2017.12.035, 2018.
Haszpra, L., Barcza, Z., Ferenczi, Z., Hollós, R., Kern, A., and Kljun, N.: Real-world wintertime CO, N2O, and CO2 emissions of a central European village, Atmos. Meas. Tech., 15, 5019–5031, https://doi.org/10.5194/amt-15-5019-2022, 2022.
Heiskanen, J., Brümmer, C., Buchmann, N., Calfapietra, C., Chen, H., Gielen, B., Gkritzalis, T., Hammer, S., Hartman, S., Herbst, M., Janssens, I. A., Jordan, A., Juurola, E., Karstens, U., Kasurinen, V., Kruijt, B., Lankreijer, H., Levin, I., Linderson, M.-L., Loustau, D., Merbold, L., Myhre, C. L., Papale, D., Pavelka, M., Pilegaard, K., Ramonet, M., Rebmann, C., Rinne, J., Rivier, L., Saltikoff, E., Sanders, R., Steinbacher, M., Steinhoff, T., Watson, A., Vermeulen, A. T., Vesala, T., Vítková, G., and Kutsch, W.: The Integrated Carbon Observation System in Europe, B. Am. Meteorol. Soc., 103, E855–E872, https://doi.org/10.1175/bams-d-19-0364.1, 2022.
Hungarian Meteorological Service: Meteorological Database, https://odp.met.hu/climate/homogenized_data/gridded_data_series/daily_data_series/, last access: 12 September 2023.
ICOS RI: ICOS Atmosphere Station Specifications V2.0, edited by: Laurent, O., ICOS ERIC, https://doi.org/10.18160/GK28-2188, 2020.
Jiang, K., Ma, Q., Zang, K., Lin, Y., Chen, Y., Liu, S., Qing, X., Qiu, S., Xiong, H., Hong, H., Li, J., and Fang, S.: Evolution of atmospheric carbon dioxide and methane mole fractions in the Yangtze River Delta, China, Atmosphere, 14, 1295, 2023.
Jin, Y., Keeling, R. F., Rödenbeck, C., Patra, P. K., Piper, S. C., and Schwartzman, A.: Impact of changing winds on the Mauna Loa CO2 seasonal cycle in relation to the Pacific Decadal Oscillation, J. Geophys. Res.-Atmos., 127, e2021JD035892, https://doi.org/10.1029/2021JD035892, 2022.
Keeling, C. D.: The concentration and isotopic abundances of carbon dioxide in the atmosphere, Tellus, 12, 200–203, https://doi.org/10.1111/j.2153-3490.1960.tb01300.x, 1960.
Keeling, C. D., Chin, J. F. S., and Whorf, T. P.: Increased activity of northern vegetation inferred from atmospheric CO2 measurements, Nature, 382, 146–149, https://doi.org/10.1038/382146a0, 1996.
Kim, J.-S., Kug, J.-S., Yoon, J.-H., and Jeong, S.-J.: Increased atmospheric CO2 growth rate during El Niño driven by reduced terrestrial productivity in the CMIP5 ESMs, J. Climate, 29, 8783–8805, https://doi.org/10.1175/jcli-d-14-00672.1, 2016.
Kozlova, E. A., Manning, A. C., Kisilyakhov, Y., Seifert, T., and Heimann, M.: Seasonal, synoptic, and diurnal-scale variability of biogeochemical trace gases and O2 from a 300 m tall tower in central Siberia, Global Biogeochem. Cy., 22, GB4020, https://doi.org/10.1029/2008GB003209, 2008.
KSH: Hegyhátsál, Detailed Gazeteer, Hungarian Central Statistical Office, https://www.ksh.hu/apps/hntr.telepules?p_lang=EN&p_id=30216, last access: 18 December 2023.
Lan, X., Tans, P., and Thoning, K. W.: Trends in globally-averaged CO2 determined from NOAA Global Monitoring Laboratory measurements, Version 2023-11, NOAA GML, https://doi.org/10.15138/9N0H-ZH07, 2023a.
Lan, X., Tans, P., Thoning, K., and NOAA Global Monitoring Laboratory: NOAA Greenhouse Gas Marine Boundary Layer Reference – CO2, [data set], NOAA GML, https://doi.org/10.15138/DVNP-F961, 2023b.
Lelandais, L., Xueref-Remy, I., Riandet, A., Blanc, P. E., Armengaud, A., Oppo, S., Yohia, C., Ramonet, M., and Delmotte, M.: Analysis of 5.5 years of atmospheric CO2, CH4, CO continuous observations (2014–2020) and their correlations, at the Observatoire de Haute Provence, a station of the ICOS-France national greenhouse gases observation network, Atmos. Environ., 277, 119020, https://doi.org/10.1016/j.atmosenv.2022.119020, 2022.
Levin, I., Graul, R., and Trivett, N. B. A.: Long-term observations of atmospheric CO2 and carbon isotopes at continental sites in Germany, Tellus B, 47, 23–34, https://doi.org/10.3402/tellusb.v47i1-2.15996, 1995.
Lin, J. C., Gerbig, C., Wofsy, S. C., Andrews, A. E., Daube, B. C., Davis, K. J., and Grainger, C. A.: A near-field tool for simulating the upstream influence of atmospheric observations: The Stochastic Time-Inverted Lagrangian Transport (STILT) model, J. Geophys. Res., 108D, 4493, https://doi.org/10.1029/2002JD003161, 2003.
Lin, X., Rogers, B. M., Sweeney, C., Chevallier, F., Arshinov, M., Dlugokencky, E., Machida, T., Sasakawa, M., Tans, P., and Keppel-Aleks, G.: Siberian and temperate ecosystems shape Northern Hemisphere atmospheric CO2 seasonal amplification, P. Natl. Acad. Sci. USA, 117, 21079–21087, https://doi.org/10.1073/pnas.1914135117, 2020.
Liptak, J., Keppel-Aleks, G., and Lindsay, K.: Drivers of multi-century trends in the atmospheric CO2 mean annual cycle in a prognostic ESM, Biogeosciences, 14, 1383–1401, https://doi.org/10.5194/bg-14-1383-2017, 2017.
Liu, L., Zhou, L., Vaughn, B., Miller, J. B., Brand, W. A., Rothe, M., and Xia, L.: Background variations of atmospheric CO2 and carbon-stable isotopes at Waliguan and Shangdianzi stations in China, J. Geophys. Res.-Atmos., 119, 2013JD019605, https://doi.org/10.1002/2013jd019605, 2014.
Lopez, M., Schmidt, M., Ramonet, M., Bonne, J.-L., Colomb, A., Kazan, V., Laj, P., and Pichon, J.-M.: Three years of semicontinuous greenhouse gas measurements at the Puy de Dôme station (central France), Atmos. Meas. Tech., 8, 3941–3958, https://doi.org/10.5194/amt-8-3941-2015, 2015.
Magyar Közút: Az országos közutak 2018. évre vonatkozó keresztmetszeti forgalma, https://internet.kozut.hu/kozerdeku-adatok/orszagos-kozuti-adatbank/forgalomszamlalas/ (last access: 4 August 2021), 2019.
Major, I., Haszpra, L., Rinyu, L., Futó, I., Bihari, Á., Hammer, S., Jull, A. J. T., and Molnár, M.: Temporal variation of atmospheric fossil and modern CO2 excess at a Central European rural tower station between 2008 and 2014, Radiocarbon, 60, 1285–1299, https://doi.org/10.1017/rdc.2018.79, 2018.
Masarie, K. A., Peters, W., Jacobson, A. R., and Tans, P. P.: ObsPack: a framework for the preparation, delivery, and attribution of atmospheric greenhouse gas measurements, Earth Syst. Sci. Data, 6, 375–384, https://doi.org/10.5194/essd-6-375-2014, 2014.
McGrath, M. J., Petrescu, A. M. R., Peylin, P., Andrew, R. M., Matthews, B., Dentener, F., Balkovič, J., Bastrikov, V., Becker, M., Broquet, G., Ciais, P., Fortems-Cheiney, A., Ganzenmüller, R., Grassi, G., Harris, I., Jones, M., Knauer, J., Kuhnert, M., Monteil, G., Munassar, S., Palmer, P. I., Peters, G. P., Qiu, C., Schelhaas, M.-J., Tarasova, O., Vizzarri, M., Winkler, K., Balsamo, G., Berchet, A., Briggs, P., Brockmann, P., Chevallier, F., Conchedda, G., Crippa, M., Dellaert, S. N. C., Denier van der Gon, H. A. C., Filipek, S., Friedlingstein, P., Fuchs, R., Gauss, M., Gerbig, C., Guizzardi, D., Günther, D., Houghton, R. A., Janssens-Maenhout, G., Lauerwald, R., Lerink, B., Luijkx, I. T., Moulas, G., Muntean, M., Nabuurs, G.-J., Paquirissamy, A., Perugini, L., Peters, W., Pilli, R., Pongratz, J., Regnier, P., Scholze, M., Serengil, Y., Smith, P., Solazzo, E., Thompson, R. L., Tubiello, F. N., Vesala, T., and Walther, S.: The consolidated European synthesis of CO2 emissions and removals for the European Union and United Kingdom: 1990–2020, Earth Syst. Sci. Data, 15, 4295–4370, https://doi.org/10.5194/essd-15-4295-2023, 2023.
Meyer, N., Welp, G., and Amelung, W.: The temperature sensitivity (Q10) of soil respiration: controlling factors and spatial prediction at regional scale based on environmental soil classes, Global Biogeochem. Cy., 32, 306–323, https://doi.org/10.1002/2017GB005644, 2018.
Navascues, B. and Rus, C.: Carbon dioxide observations at Izaña baseline station, Tenerife (Canary Island): 1984–1988, Tellus B, 43, 118–125, https://doi.org/10.1034/j.1600-0889.1991.t01-1-00006.x, 1991.
Necki, J., Schmidt, M., Rozanski, K., Zimnoch, M., Korus, A., Lasa, J., Graul, R., and Levin, I.: Six-year record of atmospheric carbon dioxide and methane at a high-altitude mountain site in Poland, Tellus B, 55, 94–104, https://doi.org/10.1034/j.1600-0889.2003.01446.x, 2003.
NOAA: Cooperative Air Sampling Network, National Oceanic and Atmospheric Administration, Earth System Research Laboratories, Global Monitoring Laboratory, https://gml.noaa.gov/ccgg/flask.html, last access: 12 September 2023.
Panov, A., Prokushkin, A., Semiletov, I., Kübler, K., Korets, M., Putilin, I., Urban, A., Bondar, M., and Heimann, M.: Atmospheric CO2 and CH4 fluctuations over the continent-sea interface in the Yenisei River sector of the Kara Sea, Atmosphere, 13, 1402, https://doi.org/10.3390/atmos13091402, 2022.
Patra, P. K., Maksyutov, S., and Nakazawa, T.: Analysis of atmospheric CO2 growth rates at Mauna Loa using CO2 fluxes derived from an inverse model, Tellus B, 57, 357–365, https://doi.org/10.1111/j.1600-0889.2005.00159.x, 2005.
Peñuelas, J., Rutishauser, T., and Filella, I.: Phenology feedbacks on climate change, Science, 324, 887–888, https://doi.org/10.1126/science.1173004, 2009.
Pérez, I. A., Sánchez, M. L., García, M. Á., Pardo, N., and Fernández-Duque, B.: Statistical analysis of the CO2 and CH4 annual cycle on the Northern Plateau of the Iberian Peninsula, Atmosphere, 11, 769, https://doi.org/10.3390/atmos11070769, 2020.
Piao, S., Liu, Z., Wang, T., Peng, S., Ciais, P., Huang, M., Ahlstrom, A., Burkhart, J. F., Chevallier, F., Janssens, I. A., Jeong, S.-J., Lin, X., Mao, J., Miller, J., Mohammat, A., Myneni, R. B., Penuelas, J., Shi, X., Stohl, A., Yao, Y., Zhu, Z., and Tans, P. P.: Weakening temperature control on the interannual variations of spring carbon uptake across northern lands, Nature Clim. Change, 7, 359–363, https://doi.org/10.1038/nclimate3277, 2017.
Piao, S., Liu, Z., Wang, Y., Ciais, P., Yao, Y., Peng, S., Chevallier, F., Friedlingstein, P., Janssens, I. A., Peñuelas, J., Sitch, S., and Wang, T.: On the causes of trends in the seasonal amplitude of atmospheric CO2, Global Change Biol., 24, 608–616, https://doi.org/10.1111/gcb.13909, 2018.
Piao, S., Liu, Q., Chen, A., Janssens, I. A., Fu, Y., Dai, J., Liu, L., Lian, X., Shen, M., and Zhu, X.: Plant phenology and global climate change: Current progresses and challenges, Global Change Biol., 25, 1922–1940, https://doi.org/10.1111/gcb.14619, 2019.
Piao, S., Wang, X., Park, T., Chen, C., Lian, X., He, Y., Bjerke, J. W., Chen, A., Ciais, P., Tømmervik, H., Nemani, R. R., and Myneni, R. B.: Characteristics, drivers and feedbacks of global greening, Nature Reviews Earth & Environment, 1, 14–27, https://doi.org/10.1038/s43017-019-0001-x, 2020.
Popa, M. E., Gloor, M., Manning, A. C., Jordan, A., Schultz, U., Haensel, F., Seifert, T., and Heimann, M.: Measurements of greenhouse gases and related tracers at Bialystok tall tower station in Poland, Atmos. Meas. Tech., 3, 407–427, https://doi.org/10.5194/amt-3-407-2010, 2010.
Rahmati, M., Graf, A., Poppe Terán, C., Amelung, W., Dorigo, W., Franssen, H.-J. H., Montzka, C., Or, D., Sprenger, M., Vanderborght, J., Verhoest, N. E. C., and Vereecken, H.: Continuous increase in evaporative demand shortened the growing season of European ecosystems in the last decade, Communications Earth & Environment, 4, 236, https://doi.org/10.1038/s43247-023-00890-7, 2023.
Ramonet, M., Ciais, P., Apadula, F., Bartyzel, J., Bastos, A., Bergamaschi, P., Blanc, P. E., Brunner, D., di Torchiarolo, L. C., Calzolari, F., Chen, H., Chmura, L., Colomb, A., Conil, S., Cristofanelli, P., Cuevas, E., Curcoll, R., Delmotte, M., di Sarra, A., Emmenegger, L., Forster, G., Frumau, A., Gerbig, C., Gheusi, F., Hammer, S., Haszpra, L., Hatakka, J., Hazan, L., Heliasz, M., Henne, S., Hensen, A., Hermansen, O., Keronen, P., Kivi, R., Komínková, K., Kubistin, D., Laurent, O., Laurila, T., Lavric, J. V., Lehner, I., Lehtinen, K. E. J., Leskinen, A., Leuenberger, M., Levin, I., Lindauer, M., Lopez, M., Myhre, C. L., Mammarella, I., Manca, G., Manning, A., Marek, M. V., Marklund, P., Martin, D., Meinhardt, F., Mihalopoulos, N., Mölder, M., Morgui, J. A., Necki, J., O'Doherty, S., O'Dowd, C., Ottosson, M., Philippon, C., Piacentino, S., Pichon, J. M., Plass-Duelmer, C., Resovsky, A., Rivier, L., Rodó, X., Sha, M. K., Scheeren, H. A., Sferlazzo, D., Spain, T. G., Stanley, K. M., Steinbacher, M., Trisolino, P., Vermeulen, A., Vítková, G., Weyrauch, D., Xueref-Remy, I., Yala, K., and Kwok, C. Y.: The fingerprint of the summer 2018 drought in Europe on ground-based atmospheric CO2 measurements, Philos. T. Roy. Soc. B, 375, 20190513, https://doi.org/10.1098/rstb.2019.0513, 2020.
Resovsky, A., Ramonet, M., Rivier, L., Tarniewicz, J., Ciais, P., Steinbacher, M., Mammarella, I., Mölder, M., Heliasz, M., Kubistin, D., Lindauer, M., Müller-Williams, J., Conil, S., and Engelen, R.: An algorithm to detect non-background signals in greenhouse gas time series from European tall tower and mountain stations, Atmos. Meas. Tech., 14, 6119–6135, https://doi.org/10.5194/amt-14-6119-2021, 2021.
Reum, F., Göckede, M., Lavric, J. V., Kolle, O., Zimov, S., Zimov, N., Pallandt, M., and Heimann, M.: Accurate measurements of atmospheric carbon dioxide and methane mole fractions at the Siberian coastal site Ambarchik, Atmos. Meas. Tech., 12, 5717–5740, https://doi.org/10.5194/amt-12-5717-2019, 2019.
Revelle, R. and Suess, H. E.: Carbon dioxide exchange between atmosphere and ocean and the question of an increase of atmospheric CO2 during the past decades, Tellus, 9, 18–27, https://doi.org/10.1111/j.2153-3490.1957.tb01849.x, 1957.
Rödenbeck, C., Zaehle, S., Keeling, R., and Heimann, M.: History of El Niño impacts on the global carbon cycle 1957–2017: a quantification from atmospheric CO2 data, Philos. T. Roy. Soc. B, 373, 20170303, https://doi.org/10.1098/rstb.2017.0303, 2018.
Sasakawa, M., Shimoyama, K., Machida, T., Tsuda, N., Suto, H., Arshinov, M., Davydov, D., Fofonov, A., Krasnov, O., Saeki, T., Koyama, Y., and Maksyutov, S.: Continuous measurements of methane from a tower network over Siberia, Tellus B, 62, 403–416, https://doi.org/10.1111/j.1600-0889.2010.00494.x, 2010.
Schmidt, M., Graul, R., Sartorius, H., and Levin, I.: The Schauinsland CO2 record: 30 years of continental observations and their implications for the variability of the European CO2 budget, J. Geophys. Res., 108, D4619, https://doi.org/10.1029/2002JD003085, 2003.
Schmidt, M., Lopez, M., Yver Kwok, C., Messager, C., Ramonet, M., Wastine, B., Vuillemin, C., Truong, F., Gal, B., Parmentier, E., Cloué, O., and Ciais, P.: High-precision quasi-continuous atmospheric greenhouse gas measurements at Trainou tower (Orléans forest, France), Atmos. Meas. Tech., 7, 2283–2296, https://doi.org/10.5194/amt-7-2283-2014, 2014.
Schuldt, K. N., Mund, J., Aalto, T., Abshire, J. B., Aikin, K., Allen, G., Andrews, A., Apadula, F., Arnold, S., Baier, B., Bakwin, P., Bartyzel, J., Bentz, G., Bergamaschi, P., Beyersdorf, A., Biermann, T., Biraud, S. C., Blanc, P.-E., Boenisch, H., Bowling, D., Brailsford, G., Brand, W. A., Brunner, D., Bui, T. P., Bäni, L., Calzolari, F., Chang, C. S., Chen, H., Chen, G., Chmura, L., Clark, S., Climadat, S., Colomb, A., Commane, R., Conen, F., Conil, S., Couret, C., Cristofanelli, P., Cuevas, E., Curcoll, R., Daube, B., Davis, K. J., Mazière, M. D., Wekker, S. D., Dean-Day, J. M., Coletta, J. D., Delmotte, M., Iorio, T. D., DiGangi, E., DiGangi, J. P., Elkins, J. W., Elsasser, M., Emmenegger, L., Fang, S., Fischer, M. L., Forster, G., France, J., Frumau, A., Fuente-Lastra, M., Galkowski, M., Gatti, L. V., Gehrlein, T., Gerbig, C., Gheusi, F., Gloor, E., Goto, D., Griffis, T., Hammer, S., Hanisco, T. F., Hanson, C., Haszpra, L., Hatakka, J., Heimann, M., Heliasz, M., Heltai, D., Henne, S., Hensen, A., Hermans, C., Hermansen, O., Hintsa, E., Hoheisel, A., Holst, J., Iraci, L. T., Ivakhov, V., Jaffe, D. A., Jordan, A., Joubert, W., Karion, A., Kawa, S. R., Kazan, V., Keeling, R. F., Keronen, P., Kim, J., Klausen, J., Kneuer, T., Kolari, P., Kominkova, K., Kort, E., Kozlova, E., Krumme, P. B., Kubistin, D., Kulawik, S. S., Kumps, N., Labuschagne, C., Lam, D. H., Lan, X., Langenfelds, R. L., Lanza, A., Laurent, O., Laurila, T., Lauvaux, T., Lavric, J., Law, B. E., Lee, J., Lehner, I., Lehtinen, K., Leppert, R., Leskinen, A., Leuenberger, M., Leung, W. H., Levin, I., Levula, J., Lin, J., Lindauer, M., Lindroth, A., Loh, Z. M., Lopez, M., Lunder, C. R., Löfvenius, M. O., Machida, T., Mammarella, I., Manca, G., Manning, A., Manning, A., Marek, M. V., Marklund, P., Marrero, J. E., Martin, D., Martin, M. Y., Martins, G. A., Matsueda, H., McKain, K., Meijer, H., Frank Meinhardt, Merchant, L., Metzger, J.-M., Mihalopoulos, N., Miles, N. L., Miller, J. B., Miller, C. E., Mitchell, L., Monteiro, V., Montzka, S., Moore, F., Moossen, H., Morgan, E., Morgui, J.-A., Morimoto, S., Munger, J. W., Munro, D., Mutuku, M., Myhre, C. L., Mölder, M., Müller-Williams, J., Necki, J., Newman, S., Nichol, S., Nisbet, E., Niwa, Y., Njiru, D. M., Noe, S. M., Nojiri, Y., O'Doherty, S., Obersteiner, F., Paplawsky, B., Parworth, C. L., Peischl, J., Peltola, O., Peters, W., Philippon, C., Piacentino, S., Pichon, J. M., Pickers, P., Piper, S., Pitt, J., Plass-Dülmer, C., Platt, S. M., Prinzivalli, S., Ramonet, M., Ramos, R., Reyes-Sanchez, E., Richardson, S. J., Rigouleau, L.-J., Riris, H., Rivas, P. P., Rothe, M., Roulet, Y.-A., Ryerson, T., Ryoo, J.-M., Sargent, M., Sasakawa, M., Scheeren, B., Schmidt, M., Schuck, T., Schumacher, M., Seibel, J., Seifert, T., Sha, M. K., Shepson, P., Shook, M., Sloop, C. D., Smith, P. D., Spain, G., Clair, J. M. S., Steger, D., Steinbacher, M., Stephens, B., Sweeney, C., Sørensen, L. L., Taipale, R., Takatsuji, S., Tans, P., Thoning, K., Timas, H., Torn, M., Trisolino, P., Turnbull, J., Vermeulen, A., Viner, B., Vitkova, G., Walker, S., Watson, A., Weiss, R., Weyrauch, D., Wofsy, S. C., Worsey, J., Worthy, D., Xueref-Remy, I., Yates, E. L., Young, D., Yver-Kwok, C., Zaehle, S., Zahn, A., Zellweger, C., Zimnoch, M., de Souza, R. A., di Sarra, A. G., van Dinther, D., and van den Bulk, P.: Multi-laboratory compilation of atmospheric carbon dioxide data for the period 1957–2022; obspack_co2_1_GLOBALVIEWplus_v9.0_2023-09-09, NOAA Earth System Research Laboratory, Global Monitoring Laboratory [data set], https://doi.org/10.25925/20230801, 2023.
Schwartz, M. D., Ahas, R., and Aasa, A.: Onset of spring starting earlier across the Northern Hemisphere, Global Change Biol., 12, 343–351, https://doi.org/10.1111/j.1365-2486.2005.01097.x, 2006.
Şen, Z.: Innovative trend analysis methodology, J. Hydrol. Eng., 17, 1042–1046, https://doi.org/10.1061/(ASCE)HE.1943-5584.0000556, 2012.
Şen, Z.: Innovative trend significance test and applications, Theor. Appl. Climatol., 127, 939–947, https://doi.org/10.1007/s00704-015-1681-x, 2017.
Stanley, K. M., Grant, A., O'Doherty, S., Young, D., Manning, A. J., Stavert, A. R., Spain, T. G., Salameh, P. K., Harth, C. M., Simmonds, P. G., Sturges, W. T., Oram, D. E., and Derwent, R. G.: Greenhouse gas measurements from a UK network of tall towers: technical description and first results, Atmos. Meas. Tech., 11, 1437–1458, https://doi.org/10.5194/amt-11-1437-2018, 2018.
Stephens, B. B., Brailsford, G. W., Gomez, A. J., Riedel, K., Mikaloff Fletcher, S. E., Nichol, S., and Manning, M.: Analysis of a 39 year continuous atmospheric CO2 record from Baring Head, New Zealand, Biogeosciences, 10, 2683–2697, https://doi.org/10.5194/bg-10-2683-2013, 2013.
Suess, H. E.: Radiocarbon concentration in modern wood, Science, 122, 415–417, https://doi.org/10.1126/science.122.3166.415-a, 1955.
Tans, P. P.: An observational strategy for assessing the role of terrestrial ecosystems in the global carbon cycle: scaling down to regional levels, in: Scaling Processes Between Leaf and Landscape Levels, edited by: Ehleringer, J. and Field, C., Academic Press, New York, USA, 71–105, 1991.
Thompson, R. L., Manning, A. C., Gloor, E., Schultz, U., Seifert, T., Hänsel, F., Jordan, A., and Heimann, M.: In-situ measurements of oxygen, carbon monoxide and greenhouse gases from Ochsenkopf tall tower in Germany, Atmos. Meas. Tech., 2, 573–591, https://doi.org/10.5194/amt-2-573-2009, 2009.
Thoning, K. W., Tans, P. P., and Komhyr, W. D.: Atmospheric carbon dioxide at Mauna Loa Observatory, 2, Analysis of the NOAA GMCC data, 1974–1985, J. Geophys. Res., 94D, 8549–8566, https://doi.org/10.1029/JD094iD06p08549, 1989.
Thoning, K. W., Conway, T. J., Zhang, N., and Kitzis, D.: Analysis system for measurement of CO2 mixing ratios in flask air samples, J. Atmos. Ocean. Tech., 12, 1349–1356, https://doi.org/10.1175/1520-0426(1995)012<1349:ASFMOC>2.0.CO;2, 1995.
Tiemoko, T. D., Ramonet, M., Yoroba, F., Kouassi, K. B., Kouadio, K., Kazan, V., Kaiser, C., Truong, F., Vuillemin, C., Delmotte, M., Wastine, B., and Ciais, P.: Analysis of the temporal variability of CO2, CH4 and CO concentrations at Lamto, West Africa, Tellus B, 73, 1–24, https://doi.org/10.1080/16000889.2020.1863707, 2021.
Trivett, N. and Kohler, A.: Guide on sampling and analysis techniques for chemical constituents and physical properties in air and precipitation as applied at stations of the Global Atmosphere Watch – Part 1: Carbon dioxide, WMO GAW Report no. 134, https://library.wmo.int/viewer/37245/?offset=#page=1&viewer=picture&o=bookmarks&n=0&q= (last access: 16 May 2019), 1999.
van der Woude, A. M., Peters, W., Joetzjer, E., Lafont, S., Koren, G., Ciais, P., Ramonet, M., Xu, Y., Bastos, A., Botía, S., Sitch, S., de Kok, R., Kneuer, T., Kubistin, D., Jacotot, A., Loubet, B., Herig-Coimbra, P.-H., Loustau, D., and Luijkx, I. T.: Temperature extremes of 2022 reduced carbon uptake by forests in Europe, Nat. Commun., 14, 6218, https://doi.org/10.1038/s41467-023-41851-0, 2023.
Vermeulen, A. T., Hensen, A., Popa, M. E., van den Bulk, W. C. M., and Jongejan, P. A. C.: Greenhouse gas observations from Cabauw Tall Tower (1992–2010), Atmos. Meas. Tech., 4, 617–644, https://doi.org/10.5194/amt-4-617-2011, 2011.
Vitasse, Y., Baumgarten, F., Zohner, C. M., Rutishauser, T., Pietragalla, B., Gehrig, R., Dai, J., Wang, H., Aono, Y., and Sparks, T. H.: The great acceleration of plant phenological shifts, Nat. Clim. Change, 12, 300–302, https://doi.org/10.1038/s41558-022-01283-y, 2022.
Wang, K., Wang, Y., Wang, X., He, Y., Li, X., Keeling, R. F., Ciais, P., Heimann, M., Peng, S., Chevallier, F., Friedlingstein, P., Sitch, S., Buermann, W., Arora, V. K., Haverd, V., Jain, A. K., Kato, E., Lienert, S., Lombardozzi, D., Nabel, J. E. M. S., Poulter, B., Vuichard, N., Wiltshire, A., Zeng, N., Zhu, D., and Piao, S.: Causes of slowing-down seasonal CO2 amplitude at Mauna Loa, Global Change Biol., 26, 4462–4477, https://doi.org/10.1111/gcb.15162, 2020.
Wang, T., Liu, D., Piao, S., Wang, Y., Wang, X., Guo, H., Lian, X., Burkhart, J. F., Ciais, P., Huang, M., Janssens, I., Li, Y., Liu, Y., Peñuelas, J., Peng, S., Yang, H., Yao, Y., Yin, Y., and Zhao, Y.: Emerging negative impact of warming on summer carbon uptake in northern ecosystems, Nat. Commun., 9, 5391, https://doi.org/10.1038/s41467-018-07813-7, 2018.
Wang, X., Xiao, J., Li, X., Cheng, G., Ma, M., Zhu, G., Altaf Arain, M., Andrew Black, T., and Jassal, R. S.: No trends in spring and autumn phenology during the global warming hiatus, Nat. Commun., 10, 2389, https://doi.org/10.1038/s41467-019-10235-8, 2019.
WDCGG: Stations, WMO WDCGG, https://gaw.kishou.go.jp/search/station, last access: 18 December 2023a.
WDCGG: WDCGG: WMO WDCGG data summary: GAW data – Vol. IV, Greenhouse Gases and Other Atmospheric Gases, WDCGG, 47, https://gaw.kishou.go.jp/static/publications/summary/sum47/sum47.pdf (last access: 23 November 2023), 2023b.
WDCGG: Carbon dioxide concentration data measured at Hegyhátsál (HUN), WMO World Data Centre for Greenhouse Gases, https://gaw.kishou.go.jp/, last access: 8 August 2024.
Werner, C., Bosveld, F., Vermeulen, A., and Moors, E.: The role of advection on CO2 flux measurements at the Cabauw Tall Tower, The Netherlands, JP 5.3 Extended abstract, 17th Symposium on Boundary Layers and Turbulence/27th Conference on Agricultural and Forest Meteorology, San Diego, California, USA, 22–25 May 2006, https://ams.confex.com/ams/pdfpapers/110809.pdf (last access: 20 December 2023), 2006.
Winderlich, J., Chen, H., Gerbig, C., Seifert, T., Kolle, O., Lavrič, J. V., Kaiser, C., Höfer, A., and Heimann, M.: Continuous low-maintenance measurements at the Zotino Tall Tower Observatory (ZOTTO) in Central Siberia, Atmos. Meas. Tech., 3, 1113–1128, https://doi.org/10.5194/amt-3-1113-2010, 2010.
WMO: GAW Central Facilities, https://community.wmo.int/en/activity-areas/gaw/research-infrastructure/qaqc/central-facilities, last access: 12 September 2023.
Wu, D., Yue, Y., Jing, J., Liang, M., Sun, W., Han, G., and Lou, M.: Background characteristics and influence analysis of greenhouse gases at Jinsha Atmospheric Background Station in China, Atmosphere, 14, 1541, https://doi.org/10.3390/atmos14101541, 2023.
Xia, L., Zhang, G., Liu, L., Li, B., Zhan, M., Kong, P., and Wang, H.: Atmospheric CO2 and CO at Jingdezhen station in central China: Understanding the regional transport and combustion efficiency, Atmos. Environ., 222, 117104, https://doi.org/10.1016/j.atmosenv.2019.117104, 2020.
Yin, Y., Ciais, P., Chevallier, F., Li, W., Bastos, A., Piao, S., Wang, T., and Liu, H.: Changes in the response of the Northern Hemisphere carbon uptake to temperature over the last three decades, Geophys. Res. Lett., 45, 4371–4380, https://doi.org/10.1029/2018GL077316, 2018.
Yu, Z., Griffis, T. J., and Baker, J. M.: Warming temperatures lead to reduced summer carbon sequestration in the U. S. Corn Belt, Communications Earth & Environment, 2, 53, https://doi.org/10.1038/s43247-021-00123-9, 2021.
Zeng, N., Mariotti, A., and Wetzel, P.: Terrestrial mechanisms of interannual CO2 variability, Global Biogeochem. Cy., 19, GB1016, https://doi.org/10.1029/2004GB002273, 2005.
Zhang, Y., Hong, S., Liu, Q., Huntingford, C., Peñuelas, J., Rossi, S., Myneni, R. B., and Piao, S.: Autumn canopy senescence has slowed down with global warming since the 1980s in the Northern Hemisphere, Communications Earth & Environment, 4, 173, https://doi.org/10.1038/s43247-023-00835-0, 2023.
Zhao, C. L., Bakwin, P. S., and Tans, P. P.: A design for unattended monitoring of carbon dioxide on a very tall tower, J. Atmos. Ocean. Tech., 14, 1139–1145, https://doi.org/10.1175/1520-0426(1997)014<1139:ADFUMO>2.0.CO;2, 1997.
Zhao, F. and Zeng, N.: Continued increase in atmospheric CO2 seasonal amplitude in the 21st century projected by the CMIP5 Earth system models, Earth Syst. Dynam., 5, 423–439, https://doi.org/10.5194/esd-5-423-2014, 2014.
Zhou, L., White, J. W. C., Conway, T. J., Mukai, H., MacClune, K., Zhang, X., Wen, Y., and Li, J.: Long-term record of atmospheric CO2 and stable isotopic ratios at Waliguan Observatory: Seasonally averaged 1991–2002 source/sink signals, and a comparison of 1998–2002 record to the 11 selected sites in the Northern Hemisphere, Global Biogeochem. Cy., 20, GB2001, https://doi.org/10.1029/2004GB002431, 2006.
Zhu, C. and Yoshikawa-Inoue, H.: Seven years of observational atmospheric CO2 at a maritime site in northernmost Japan and its implications, Sci. Total Environ., 524–525, 331–337, https://doi.org/10.1016/j.scitotenv.2015.04.044, 2015.