the Creative Commons Attribution 4.0 License.
the Creative Commons Attribution 4.0 License.
 | 23 Aug 2024
Partition between supercooled liquid droplets and ice crystals in mixed-phase clouds based on airborne in situ observations
Flor Vanessa Maciel
Ching An Yang
The onset of ice nucleation in mixed-phase clouds determines the lifetime and microphysical properties of ice clouds. In this work, we develop a novel method that differentiates between various phases of mixed-phase clouds, such as clouds dominated by pure liquid or pure ice segments, compared with those having ice crystals surrounded by supercooled liquid water droplets or vice versa. Using this method, we examine the relationship between the macrophysical and microphysical properties of Southern Ocean mixed-phase clouds at −40 to 0 °C (e.g. stratiform and cumuliform clouds) based on the in situ aircraft-based observations during the US National Science Foundation Southern Ocean Clouds, Radiation, Aerosol Transport Experimental Study (SOCRATES) flight campaign. The results show that the exchange between supercooled liquid water and ice crystals from a macrophysical perspective, represented by the increasing spatial ratio of regions containing ice crystals relative to the total in-cloud region (defined as ice spatial ratio), is positively correlated with the phase exchange from a microphysical perspective, represented by the increasing ice water content (IWC), decreasing liquid water content (LWC), increasing ice mass fraction, and increasing ice particle number fraction (IPNF). The mass exchange between liquid and ice becomes more significant during phase 3 when pure ice cloud regions (ICRs) start to appear. Occurrence frequencies of cloud thermodynamic phases show a significant phase change from liquid to ice at a similar temperature (i.e. −17.5 °C) among three types of definitions of mixed-phase clouds based on ice spatial ratio, ice mass fraction, or IPNF. Aerosol indirect effects are quantified for different phases using number concentrations of aerosols greater than 100 or 500 nm (N>100 and N>500, respectively). N>500 shows stronger positive correlations with ice spatial ratios compared with N>100. This result indicates that larger aerosols potentially contain ice-nucleating particles (INPs), which facilitate the formation of ice crystals in mixed-phase clouds. The impact of N>500 is also more significant in phase 2 when ice crystals just start to appear in the mixed phase compared with phase 3 when pure ICRs have formed, possibly due to the competing aerosol indirect effects on primary and secondary ice production in phase 3. The thermodynamic and dynamic conditions are quantified for each phase. The results show stronger in-cloud turbulence and higher updraughts in phases 2 and 3 when liquid and ice coexist compared with pure liquid or ice (phases 1 and 4, respectively). The highest updraughts and turbulence are seen in phase 3 when supercooled liquid droplets are surrounded by ice crystals. These results indicate both updraughts and turbulence support the maintenance of supercooled liquid water amongst ice crystals. Overall, these results illustrate the varying effects of aerosols, thermodynamics, and dynamics through various stages of mixed-phase cloud evolution based on this new method that categorizes cloud phases.
- Article
(5870 KB) - Full-text XML
-
Supplement
(3107 KB) - BibTeX
- EndNote


Clouds with different thermodynamic phases can have contrasting influences on the net radiation at the top of the atmosphere, depending on their microphysical properties, spatial extent, and the distributions of hydrometeors (Matus and L'Ecuyer, 2017). Among three types of cloud phases (i.e. ice, liquid, and mixed), mixed-phase clouds contain both supercooled liquid water and ice crystals. Radiative forcing of mixed-phase clouds over the Southern Ocean has large impacts on Earth's climate based on global climate model simulations (e.g. Tan et al., 2016; Hyder et al., 2018). Evaluating and improving the model parameterizations of mixed-phase clouds require an improved understanding of their macrophysical and microphysical properties, as well as the factors controlling their formation and evolution.
Previous observations of mixed-phase clouds in the high latitudes have identified complex structures both vertically and horizontally. Using aircraft-based observations over the Southern Ocean, a high frequency of supercooled liquid water was found within low-level clouds in this region, and mixed-phase cloud segments were found to be more spatially heterogeneous compared with the pure liquid and pure ice segments (D'Alessandro et al., 2021). When calculating cloud top phase frequencies as a function of cloud top temperature by using aircraft-based lidar and radar observations over the Southern Ocean, the liquid phase was seen as the dominant phase for 74.9 % of the cloud top cases with subfreezing temperatures, and supercooled liquid water was found in cloud tops at temperatures as low as −30 °C (Zaremba et al., 2020). Using a large dataset collected by the Convair 580 aircraft of the National Research Council (NRC) of Canada, it was found that several microphysical properties are dependent upon temperature, including supercooled liquid droplet number concentration (Nliq), ice water content (IWC), and liquid water content (LWC) (Korolev et al., 2003).
Ice nucleation within mixed-phase clouds and the factors behind the sustainability of mixed-phase clouds are still topics of contention within the field. The persistent existence of mixed-phase cloud systems has been shown to be affected by local processes such as the formation and growth of cloud droplets and ice crystals (Morrison et al., 2012). The thermodynamics and dynamics of the atmosphere also play a large role in affecting the formation and development of mixed-phase clouds. Using observations of vertical motion within Arctic mixed-phase stratiform, Shupe et al. (2008) showed that an in-cloud updraught sustains the clouds, which also supports growth of ice and liquid mass concentrations. Their results also suggest that ice crystal number concentrations (Nice) are often limited in order to support the persistent supercooled liquid water. The connection between ice formation and vertical air velocity at cloud base was examined for mixed-phase clouds with less than 380 m depth by using ground-based Doppler lidar and cloud radar, and the mass flux of IWC was found to increase by 2 orders of magnitude when the vertical velocity fluctuation increases (Bühl et al., 2019). A study analysed generating cells of ice crystals inside mixed-phase cloud layers over the Southern Ocean and found that these generating cells have small horizontal widths and contain supercooled liquid water with higher LWC and Nliq than that of the areas between the generating cells, which also held true for ice particles whose dispersions, number concentration, and sizes are larger within the generating cells (Wang et al., 2020). With 7 years of ground-based observations at an Alaskan site, it was found that Arctic mixed-phase clouds occur less often in the early fall when the winds are southerly as the atmosphere is more stable, drier, colder, and has lower relative humidity. Conversely, during northerly winds they have wider particle distributions (Qiu et al., 2018).
Aerosols have been documented to influence the microphysical properties of mixed-phase clouds around the globe. Field study observations over a 14-year time period and from various locations around the Earth have been combined to show that both temperature and the number concentration of aerosols larger than 0.5 µm in diameter can impact the concentrations of ice-nucleating particles (INPs) in mixed-phase clouds (DeMott et al., 2010). From aircraft observations over the Arctic, it was found that entrainment above mixed-phase clouds could enhance Nice, and an aerosol thermodynamic indirect effect likely occurs (Jackson et al., 2012). Using a 9-year-long aerosol dataset, Norgren et al. (2018) found that clean mixed-phase clouds with a lower aerosol loading have higher IWC at their base compared with clouds with a higher aerosol loading. Other studies over the Southern Ocean, e.g. McFarquhar et al. (2021), showed that those environments are primarily pristine, suggesting limited long-range continental aerosol transport and potentially more aerosols newly formed over the high southern latitudes. Observations and simulations of INPs showed that sea spray aerosol may play a major role in initiating primary ice nucleation in low-level mixed-phase clouds over the Southern Ocean (McCluskey et al., 2018). Besides primary ice production, secondary ice production has also been shown to be a critical process enhancing Nice in mixed-phase clouds based on both in situ airborne observations (Huang et al., 2017; Järvinen et al., 2022) and global climate simulations (Zhao and Liu, 2021; Zhao et al., 2023) over the Southern Ocean. Secondary ice production can also be affected by aerosol loading; e.g. higher concentrations of cloud condensation nuclei can lead to higher supercooled liquid droplet concentrations, therefore reducing the efficiency of the rime-splintering process.
These aforementioned studies have demonstrated that the coexistence and interaction between supercooled liquid droplets and ice crystals are key to understanding the persistence of mixed-phase clouds despite the fact that ice–liquid mixtures are unstable. An examination of aerosol indirect effects on liquid and ice hydrometeors separately is also a critical step towards a better understanding of the net aerosol indirect effects on the entire cloud (Korolev et al., 2017; Storelvmo, 2017). Targeting these topics, in this work, we develop a method to identify several phases of mixed-phase clouds by using the spatial relationships among segments containing pure ice or liquid, as well as those containing both ice and liquid. In Sect. 2, a description of the observation dataset and instruments is given. In Sect. 3, the details of the identification of the four phases, their occurrence frequencies, and comparisons with previously established mixed-phase cloud definitions are provided. The difference between thermodynamic and dynamic conditions among these phases is shown. In addition, the relationships between macrophysical and microphysical properties of mixed-phase clouds during various phases are examined. Aerosol indirect effects from larger and smaller aerosols are quantified for individual phases. Lastly, in Sect. 4, we discuss the applications of this method for contrasting different definitions of mixed-phase clouds and the implications of model parameterizations.
2.1 SOCRATES in situ observations and instrumentation
The US National Science Foundation (NSF) Southern Ocean Clouds, Radiation, Aerosol Transport Experimental Study (SOCRATES) flight campaign was conducted from 15 January to 24 February 2018 (McFarquhar et al., 2021). This NSF-funded campaign utilized the NSF/National Center for Atmospheric Research (NCAR) Gulfstream V (G-V) research aircraft, which flew over the Southern Ocean region of 62–42° S and 133–164° E, as shown in Fig. 1. A total of 15 research flights (RFs) in this campaign were performed with a combined total of 111 flight hours flown. In this work, we applied a temperature restriction of −40 to 0 °C, commonly known as the mixed-phase cloud regime as this temperature range allows for the occurrence of both ice particles and supercooled liquid water, for all our analyses.
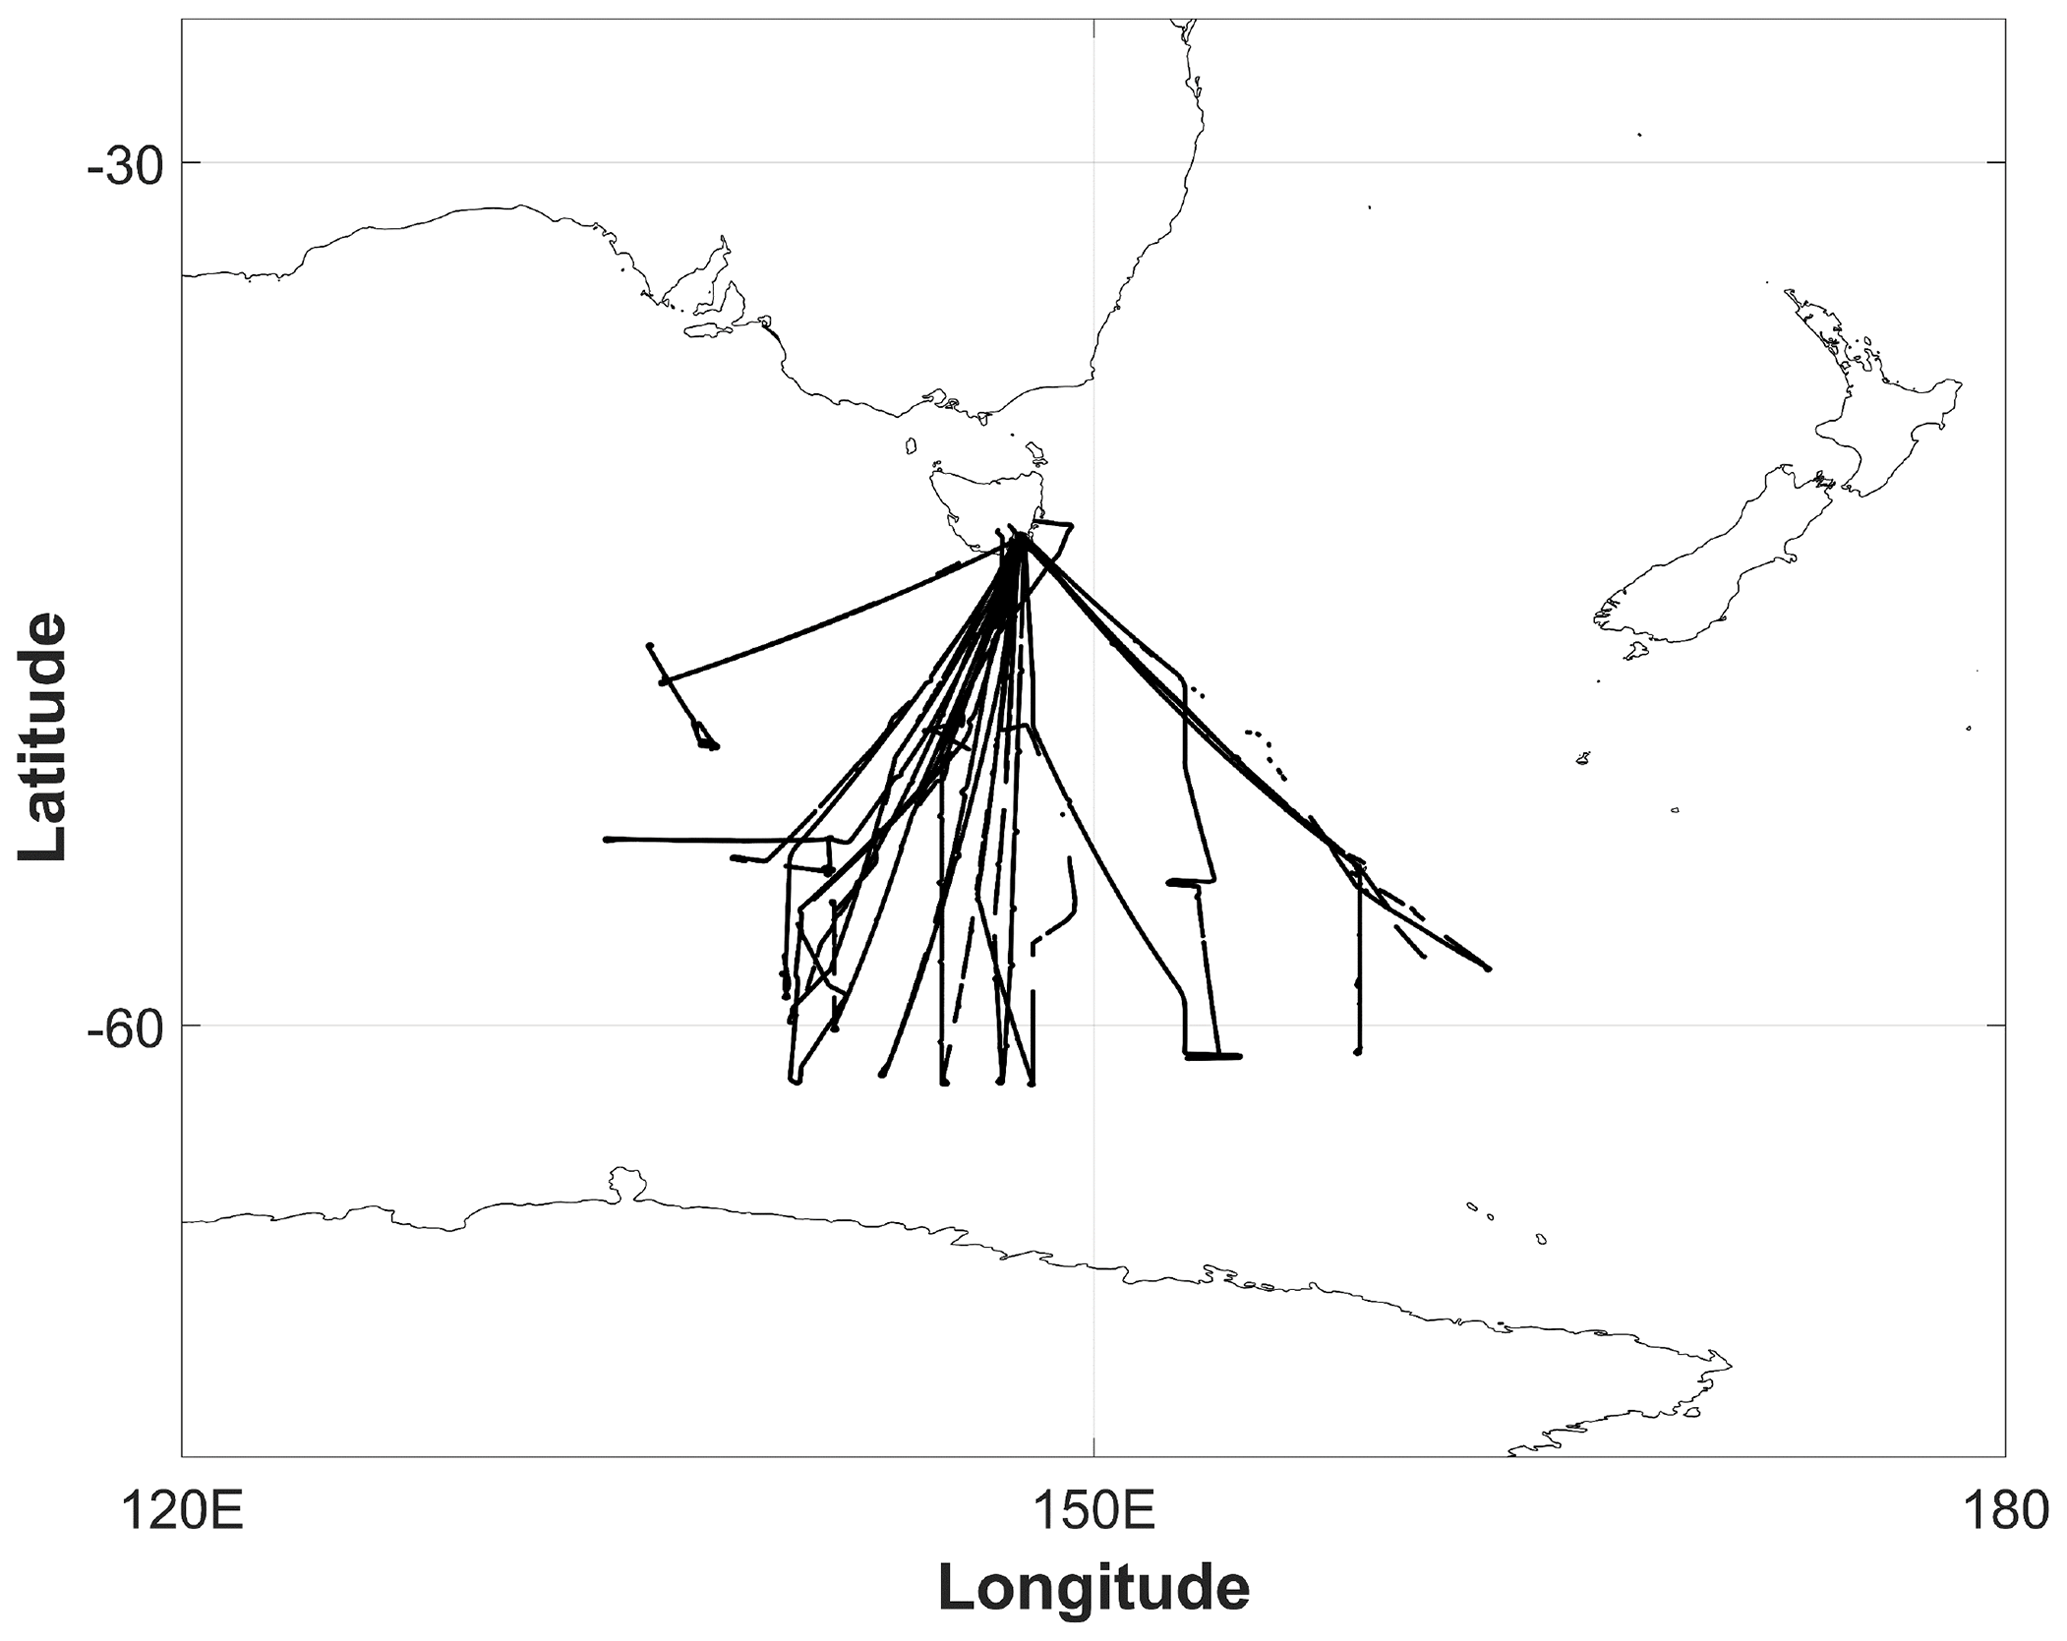
Figure 1Map of the flight tracks for SOCRATES for only temperatures between 0 and −40 °C.
The NSF G-V research aircraft during the SOCRATES campaign was equipped with scientific instruments to measure the various characteristics of the atmosphere, such as aerosol number concentrations (Na), cloud microphysical properties, and common meteorological components – temperature, pressure, wind speed, and humidity. The temperature was measured by the Rosemount temperature probe. To measure the water vapour molecule number density at 25 Hz resolution, a vertical-cavity surface-emitting laser (VCSEL) hygrometer was used. The final data reported the water vapour mixing ratio in 1 Hz resolution, and a corrected version of water vapour data based on a post-campaign calibration in the summer of 2018 is used in this study (Diao, 2021). The water vapour and temperature data are used to calculate relative humidity with respect to liquid and ice (RHliq and RHi) by using the equations for saturation vapour pressure with respect to liquid and ice from Murphy and Koop (2005), respectively. The uncertainties associated with RHliq and RHi originate from both water vapour and temperature measurements, which sum up to 6 %–7 % for the mixed-phase cloud regime. We placed a limit on RH values by restricting all RHliq values greater than 101 % to 101 %. For RHliq lower than 100 %, an adjustment to 100 % is applied if two criteria are satisfied for a 1 Hz sample: (1) it contains supercooled liquid water, and (2) either the cloud droplet probe (CDP) or the King probe measures LWC greater than 0.001 g m−3. The hydrometeor measurements used in this study were obtained from a two-dimensional stereo (2DS) probe and a CDP, which have size ranges at 40–5000 and 2–50 µm, respectively. IWC and LWC are derived from the 2DS probe and CDP following the method described in Yang et al. (2021). That is, a mass–dimension relationship based on a spherical shape is used to calculate LWC for liquid droplets in both CDP and 2DS measurements. A mass–dimension relationship based on Wu and McFarquhar (2016) is used to calculate IWC for ice particles in 2DS measurements. In-cloud conditions are defined as 1 Hz measurements with total water content (TWC, calculated as TWC = IWC + LWC) greater than 0.001 g m−3. Lower IWC and LWC values have also been reported by the two probes, but the threshold of 0.001 g m−3 is chosen here due to the larger uncertainties in these cloud probes reporting lower mass concentrations of hydrometeors (e.g. Baumgardner et al., 2017). To provide a more focused analysis of cloud layers instead of precipitation below the clouds, we use two remote sensing instruments on board the G-V aircraft – the NSF/NCAR High-performance Instrumented Airborne Platform for Environmental Research (HIAPER) Cloud Radar (HCR) and the High Spectral Resolution Lidar (HSRL) – to identify potential precipitating samples. A particle identification (PID) product is used, which includes identifications of 11 categories – rain, supercooled rain, drizzle, supercooled drizzle, cloud liquid, supercooled cloud liquid, melting, large frozen, small frozen, precipitation, and cloud (Romatschke and Vivekanandan, 2022). By manually inspecting hourly time series of this product, we remove segments that are identified as precipitation, supercooled drizzle, drizzle, supercooled rain, and rain. In addition, we further examined the NSF SOCRATES campaign field catalogue for each flight to ensure that we do not miss any precipitation segments that have been identified in the field catalogue. The timestamps of the beginning and end of these segments are shown in Table S1 in the Supplement. For most flights, we identified on average about 5–20 min of samples of precipitating regions, except RF15, which has about an hour of precipitating samples. It is worth noting that most of these precipitating segments occur at temperatures above 0 °C, while this study only focuses on −40 to 0 °C.
Aerosol number concentration and size distribution are measured by the Ultra-High Sensitivity Aerosol Spectrometer (UHSAS), which has a size range of 60–1000 nanometres (nm). The vertical velocity measurements are derived from several instruments, including radome pressure, static pressure, the Honeywell LASEREF IV inertial reference unit, pitot tubes, a temperature probe, and a differential global positioning system, providing an accuracy of ∼ ±0.15–0.30 m s−1 and precision of ∼ 0.01 m s−1 (Diao et al., 2015). When examining the in-cloud and clear-sky conditions in the SOCRATES campaign, we noticed a low bias of the original vertical velocity measurements and therefore applied a correction of +0.125 m s−1 to the vertical velocity values. After this correction, the peak of the frequency distributions of vertical velocity was centred at 0 m s−1 for both in-cloud and clear-sky conditions. To minimize the impacts of ascent and descent and the possible associated biases of vertical velocity measurements, we restrict the analysis of vertical velocity fluctuations (i.e. standard deviations of vertical velocity calculated for every 40 s) to segments where the maximum pressure change difference (dP) within 40 s is less than 10 hPa.
2.2 Two previous datasets for cloud and hydrometeor thermodynamic phase classifications
For this work, two previously published datasets regarding thermodynamic phase classifications for the SOCRATES observations are used. Both datasets cover all research flights in the SOCRATES campaign with the exception of research flight 15 due to malfunction of the 2DS probe. The first dataset reports the cloud phase (ice, liquid, or mixed) at 1 Hz resolution, which was mainly derived from the 2DS probe and CDP (Yang et al., 2021). The method used in Yang et al. (2021) was based on the study of D'Alessandro et al. (2019) and their Fig. 1. The cloud phase identification was also verified by other cloud probes, such as the King probe used for detecting LWC and the Rosemount icing detector used for detecting the existence of supercooled liquid droplets by freezing them when they collide with the detector, which subsequently changes the vibration frequency of the detector. Two modifications are applied to the previous cloud phase identification method of D'Alessandro et al. (2019) and Yang et al. (2021). The first modification is that CDP measurements are used in the analysis only when they are categorized as liquid droplets, while those categorized as ice particles are excluded since previous work has shown that the CDP measurements related to counting ice are most likely artefacts (e.g. Korolev et al., 2013). The second modification concerns the treatment of large particles identified as liquid droplets. The previous method defines particles with maximum dimensions (Dmax)>312.5 µm as ice particles, while those with Dmax between 112.5 and 312.5 µm can be either liquid or ice depending on the standard deviation of particle sizes measured by 2DS in that second. In this work, we define particles with Dmax>212.5 µm as ice particles, reducing the number of large particles being categorized as liquid droplets.
The second dataset that detects an individual hydrometeor's thermodynamic phase (either ice or liquid) is also used, which was produced by the University of Washington Ice–Liquid Discriminator (UWILD) through a machine learning approach (Atlas et al., 2021; Mohrmann et al., 2021). Each particle imaged by the 2DS probe is classified particle by particle into ice, liquid, or unclassified as 0, 1, and NaN, respectively. In this dataset, the group also provides 1 Hz aggregated data for each research flight, which include a quantification of phase-separated particle size distributions (PSDs). We use the hydrometeor count defined by the maximum diameter in the UWILD dataset to calculate Nliq and Nice detected by the 2DS probe within each second. Then we further add Nliq detected by CDP to that detected by 2DS to derive the total Nliq. Finally, we define the ice particle number fraction (IPNF), which equals in 1 s.
3.1 A method to classify four phases of mixed-phase clouds
A method to classify four phases of mixed-phase clouds is developed for 1 Hz aircraft-based observations, which mainly involves two steps. In the first step, each second of observations is categorized into one of four conditions: clear-sky condition, liquid cloud region (LCR), ice cloud region (ICR), or mixed-phase cloud region (MCR). LCR is defined as a 1 s sample where only supercooled liquid droplets were observed, while ICR is defined as a 1 s sample with only ice crystals. MCR is a 1 s sample where both ice and liquid occur. Here, the identification of liquid and ice within each second of observations is based on the 1 Hz cloud phase identification method modified from D'Alessandro et al. (2019) and Yang et al. (2021), as described in Sect. 2.2.
In the second step, a total cloud region (TCR) that can potentially contain multiple seconds with a combination of LCR, ICR, and MCR is identified, which basically is a consecutive in-cloud segment surrounded by clear-sky conditions. In other words, LCR, ICR, and MCR are defined at the scale of each second, while TCR is defined at the scale of a consecutive in-cloud segment which can contain more than 1 s. If a TCR sample is surrounded by 2 adjacent seconds of NaN, then this sample is deleted because one cannot determine if the NaN points are the edge of the cloud or if they are still part of the cloud. But if a TCR sample is surrounded by 2 adjacent seconds of clear-sky samples, then this in-cloud sample is valid, and its measurement can last from 1 s to many seconds. An illustration of the identification of TCR is shown in Fig. 2. In that example, 1 s of LCR, 2 s of MCR, and 4 s of ICR are adjacent to each other. Then the 1 LCR sample, 2 MCR samples, and 4 ICR samples all belong to the same TCR, which produces a total of 7 s of samples. All the 1 Hz samples within the TCR are used in the analysis in Sect. 3.3–3.8 (i.e. Figs. 4a, b and 5–10). The length of each second of sample within a TCR is calculated based on the aircraft true air speed at that specific second. The length of each TCR is calculated as the sum of all in-cloud samples within that TCR. The mean true air speed of the G-V research aircraft between −40 and 0 °C during the SOCRATES campaign is ∼ 172 m s−1.
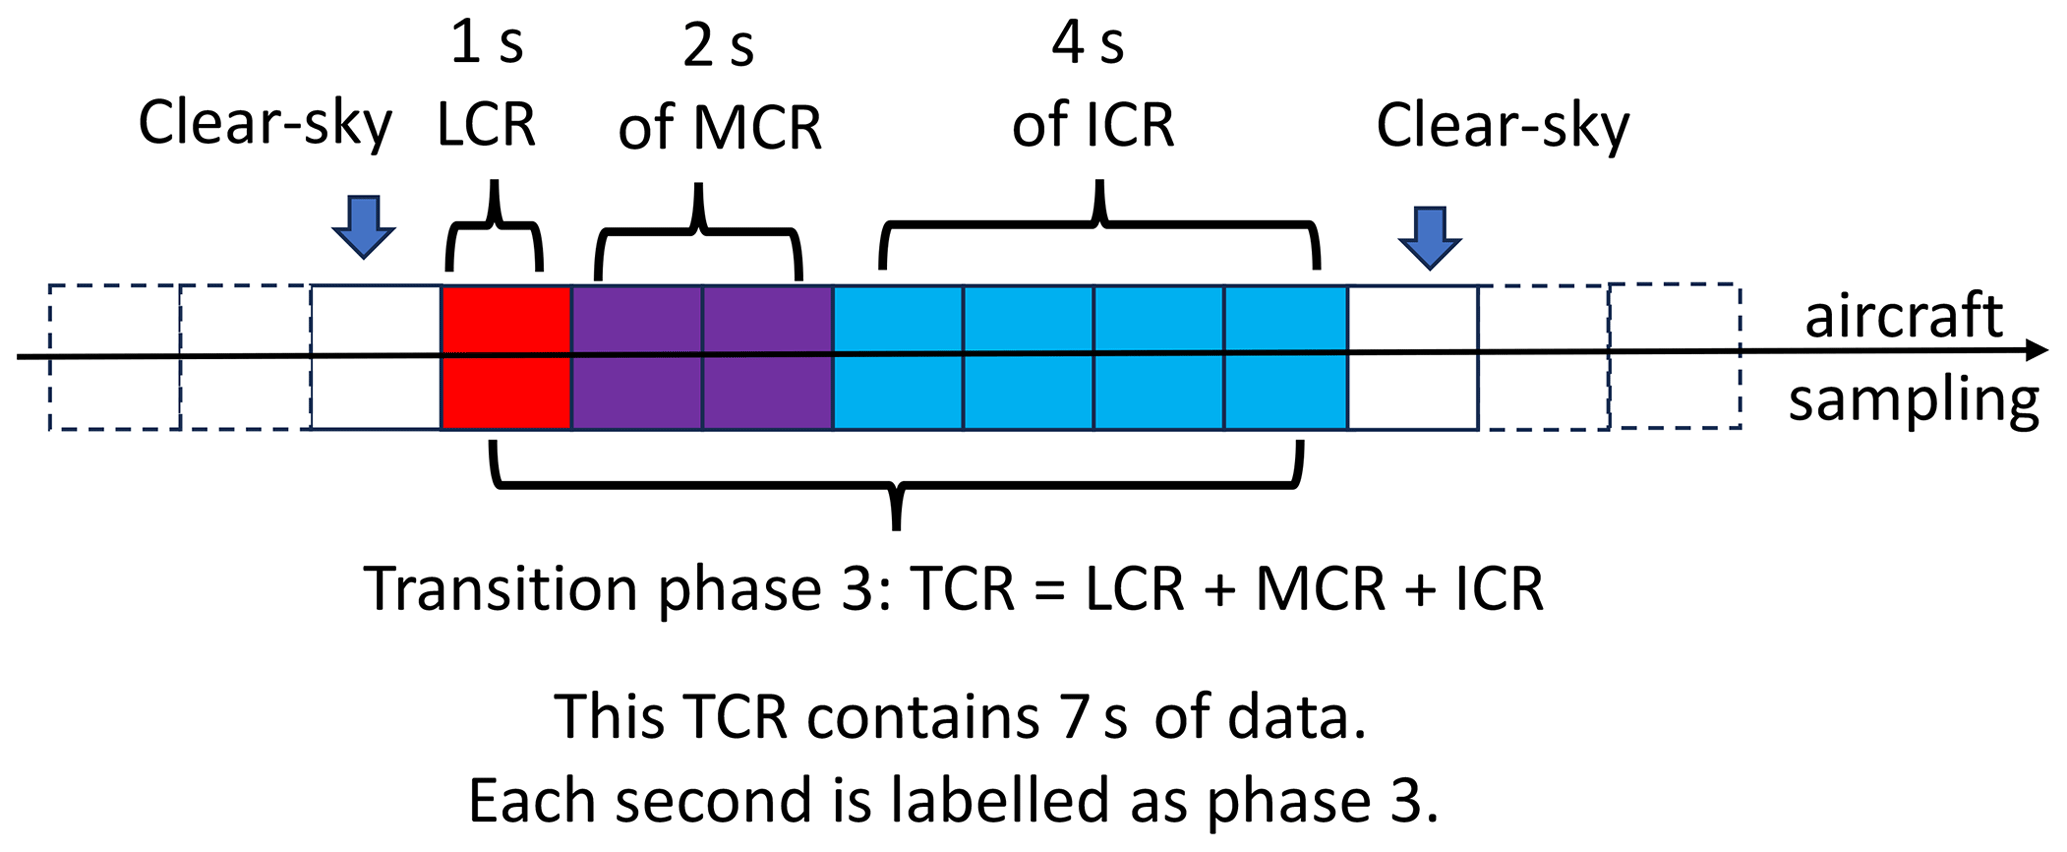
Figure 2A schematic diagram that illustrates the identification of a total cloud region (TCR) sample, with 1 s of LCR (red), 2 s of MCR (purple), and 4 s of ICR (blue) embedded inside this TCR. All 7 s of samples inside this TCR are used in the following analysis of cloud properties.
Within each TCR, the spatial ratios of LCR, MCR, and ICR relative to TCR are calculated. The definitions of each phase are based on these spatial ratios as described in Table 1. The number of 1 s samples and the number of cloud segments for the four phases are summarized. Following the calculation of these spatial ratios, the four phases are defined as follows: (1) only LCR appears in the TCR; (2) MCR exists by itself or coexists with LCR, but no ICR exists; (3) ICR appears and it resides with either LCR or MCR or both; and (4) only ICR appears in the TCR. In other words, phases 1 and 4 stand for pure liquid and pure ice cloud segments, respectively. Phase 2 represents the ice crystals embedded in MCR and surrounded by supercooled liquid droplets. Phase 3 represents the stage when pockets of pure ice segments start to appear. The four phases are depicted in a conceptual diagram in Fig. 3.
Table 1Definitions of the four phases of mixed-phase clouds based on the ratios of the lengths of LCR, MCR, and ICR to the length of TCR within a consecutive cloud segment, i.e. , , and , respectively.
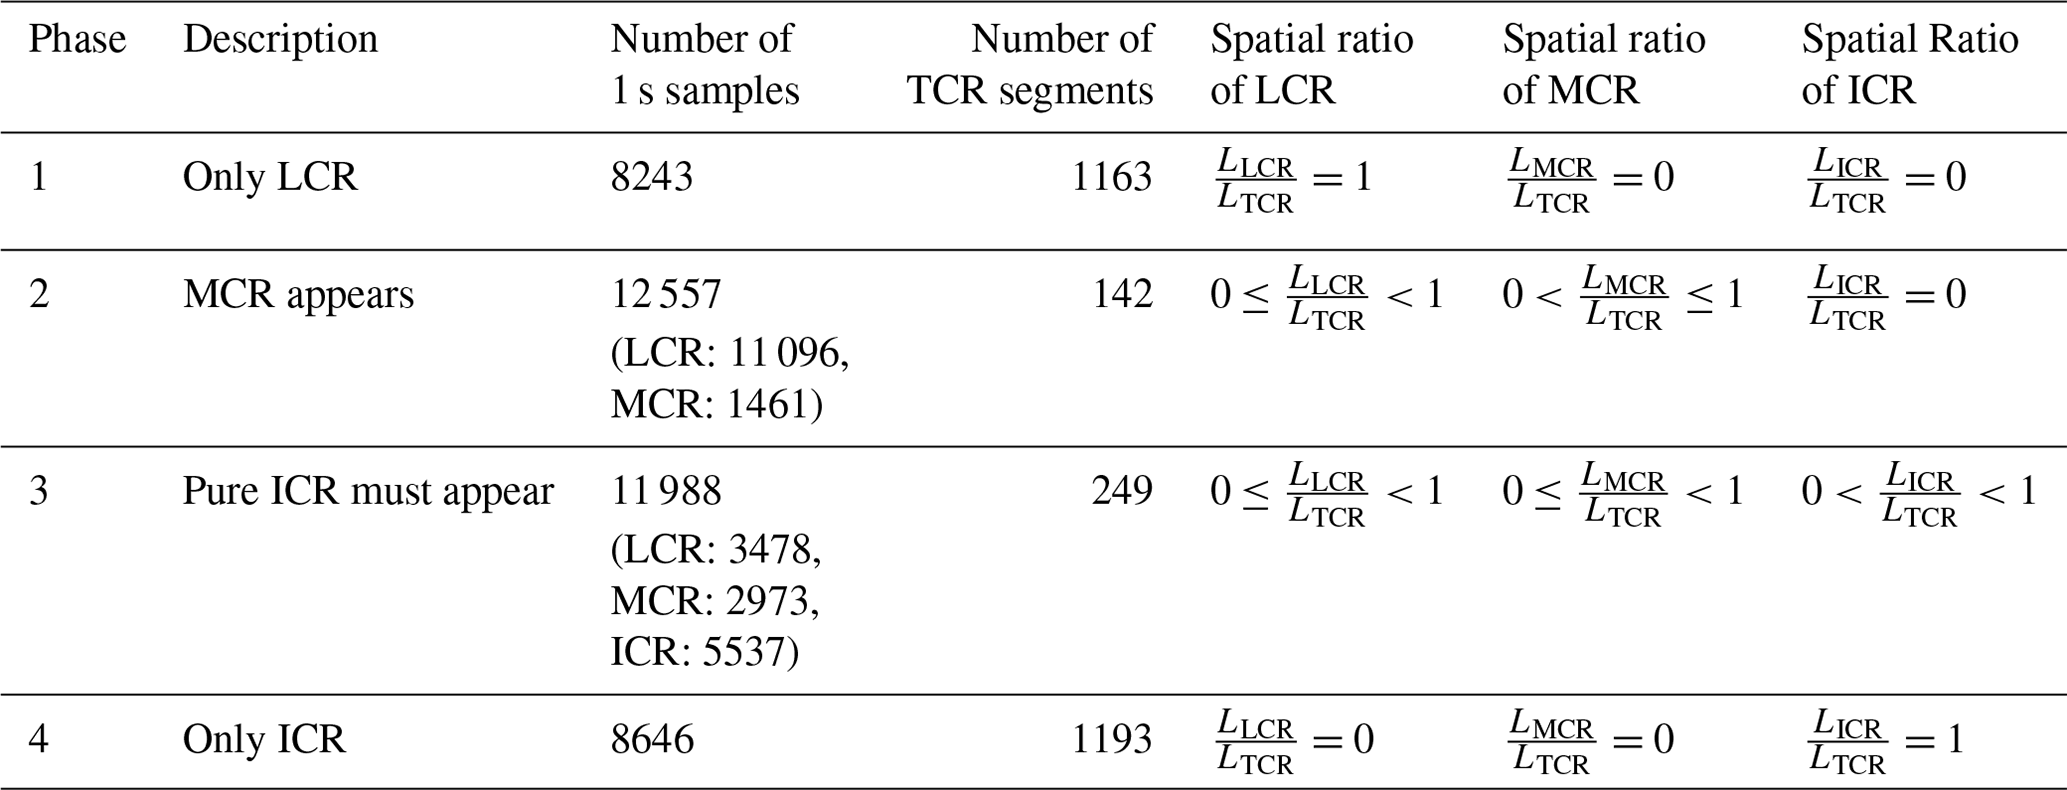
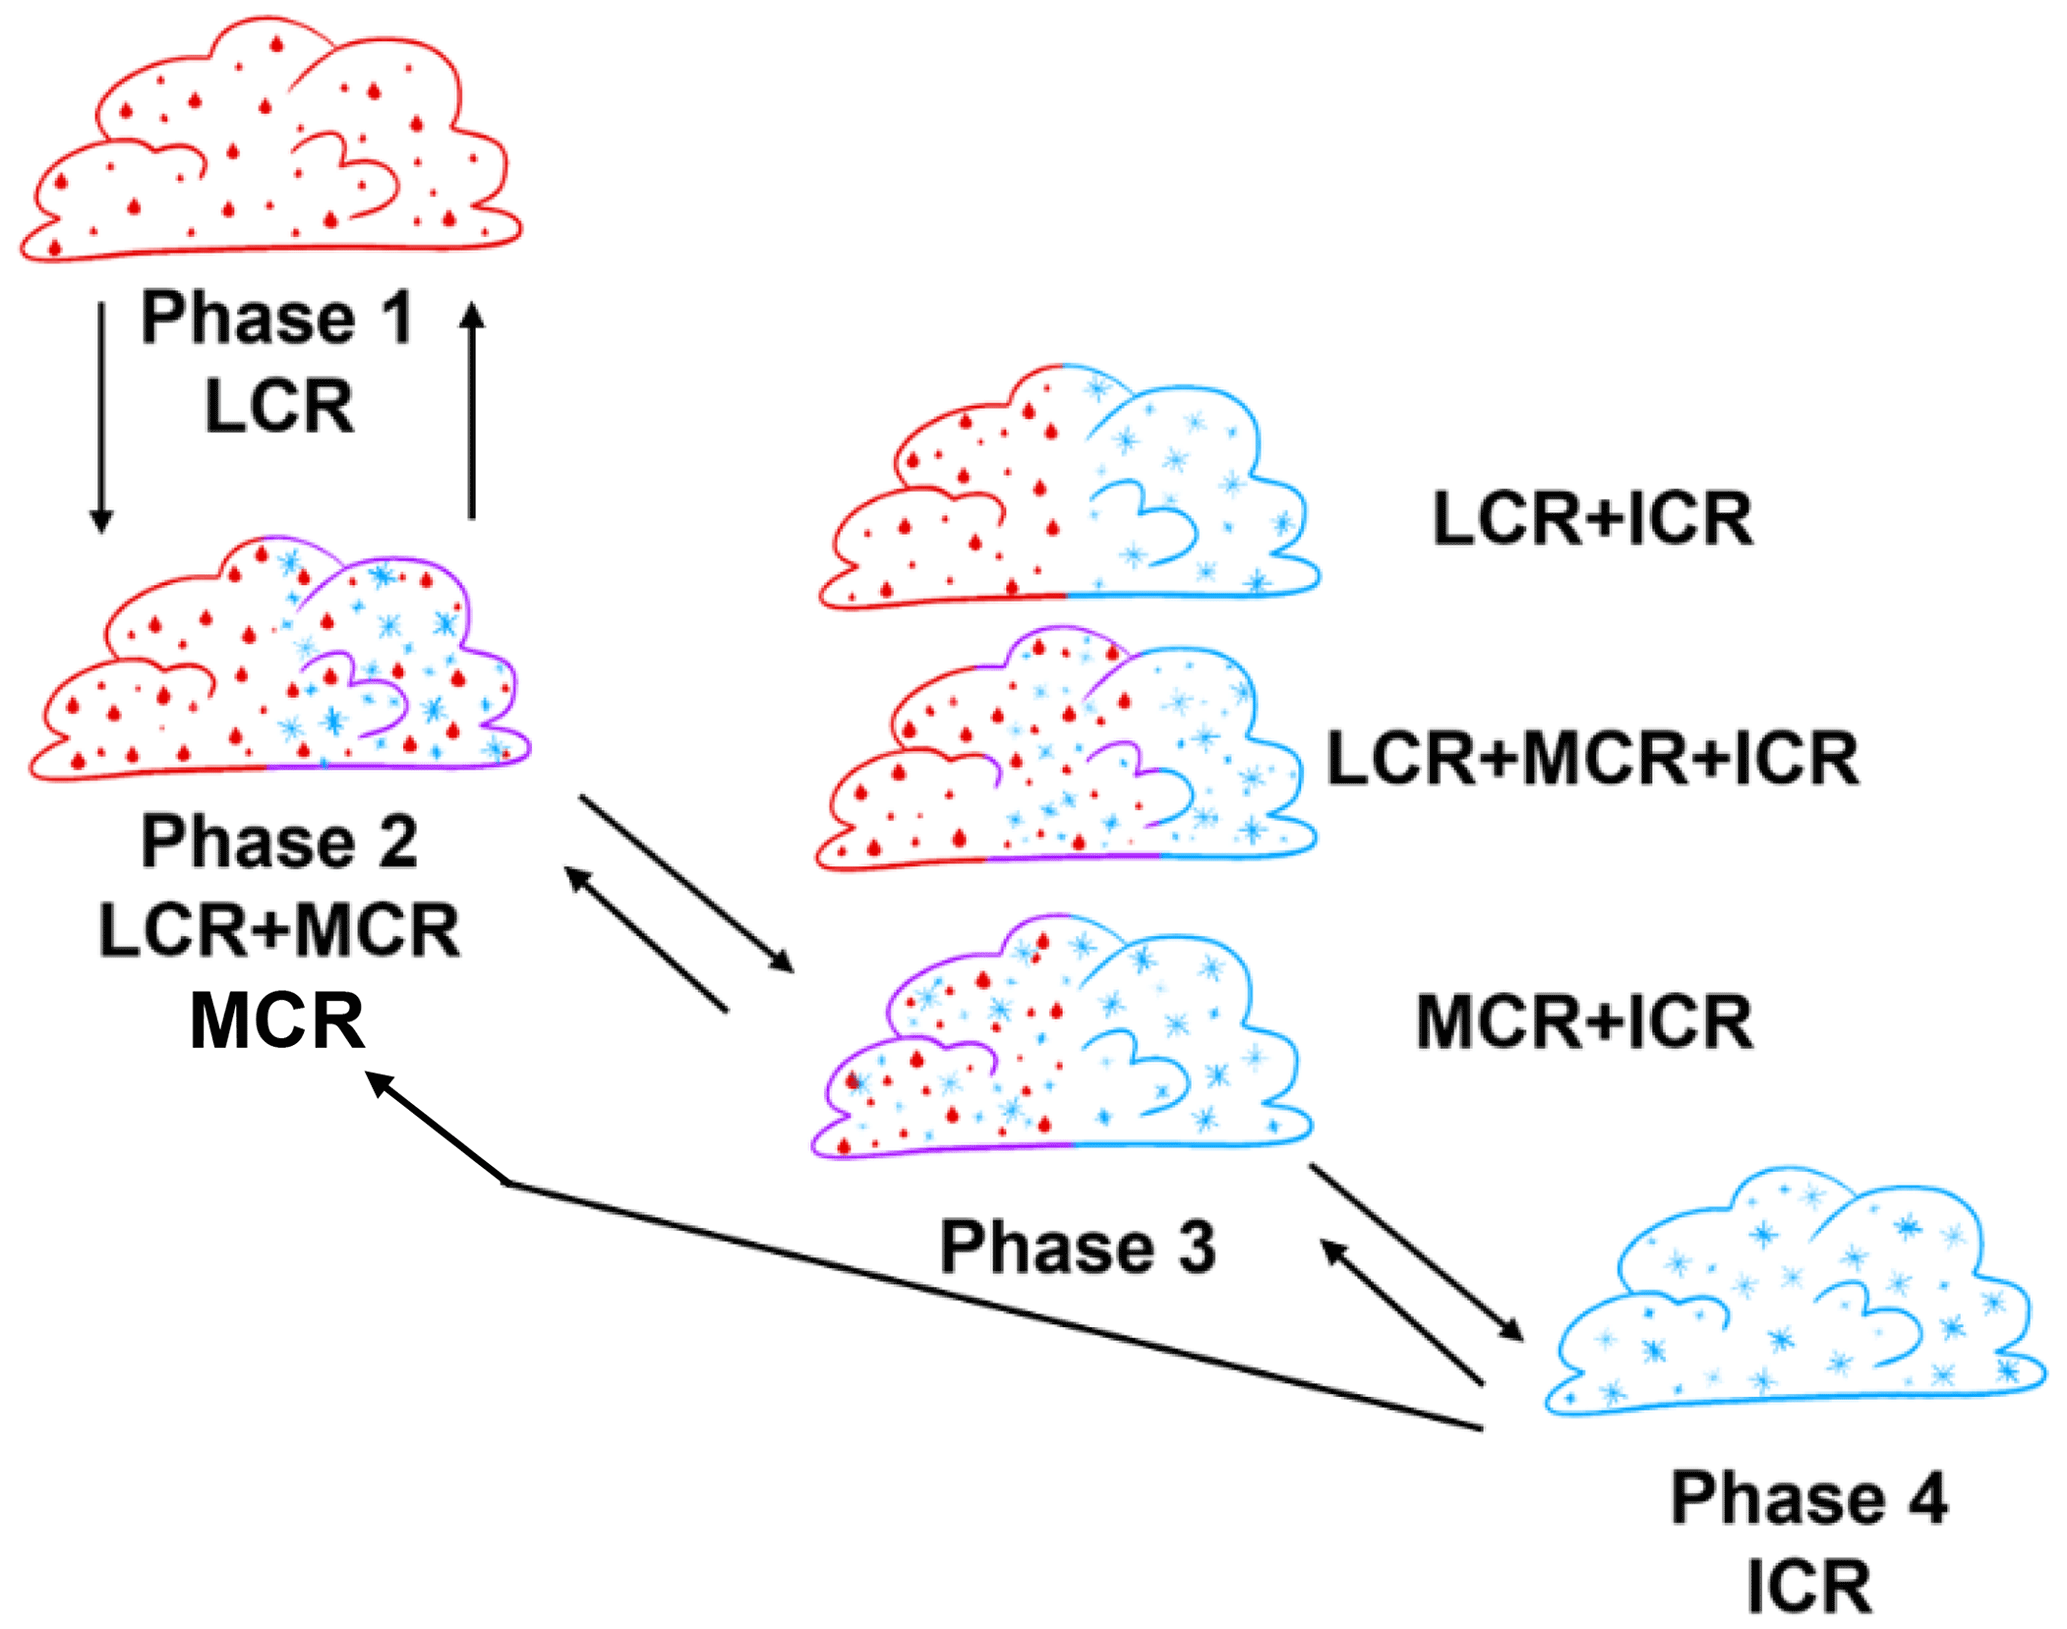
Figure 3A conceptual diagram of the four phases for the phase exchange between supercooled liquid water and ice particles in mixed-phase clouds. Red, blue, and purple shading indicates the liquid cloud region (LCR), ice cloud region (ICR), and mixed cloud region (MCR), respectively.
The spatial distributions of LCR, MCR, and ICR are also related to the two types of mixed-phase clouds – genuinely versus conditionally mixed – separated by the level of mixing between supercooled liquid water and ice crystals (e.g. Korolev et al., 2017, their Fig. 5-1; Korolev and Milbrandt, 2022, their Fig. 1). The scenario of LCR + ICR indicates a sequence of spatially adjacent cloud segments of ice–liquid–ice–liquid, etc., which is considered a conditionally mixed-phase cloud as a sub-category of phase 3. Such clouds may be thermodynamically stable, and their lifetime would be determined by processes other than the interaction between ice and liquid (e.g. Wegener–Bergeron–Findeisen (WBF) and riming). This special scenario when LCR + ICR exists in the TCR without the existence of MCR has 840 s of samples, which is a small fraction of the total 11 988 s of phase 3 samples. This result suggests that most of the clouds with coexisting supercooled liquid water and ice particles contain at least some partial segments of genuinely mixed-phase clouds, i.e. MCR.
To investigate the possibility of misclassifying MCR as LCR due to the relatively lower number concentrations of ice particles compared with supercooled liquid droplets in a 1 s sampling volume, distributions of mass and number concentrations of ice crystals are examined against those of supercooled liquid droplets (not shown). When liquid and ice coexist, the majority of the 1 s samples have both IWC > 0.01 g m−3 and LWC > 0.01 g m−3. In addition, the mass concentrations and number concentrations of ice and liquid are positively correlated with each other. This indicates that when ice and liquid coexist, both types of hydrometeors most likely have significant mass and number concentrations. Thus, it is less likely that the smaller sampling volume for ice crystals would lead to a misclassification of MCR as LCR. However, it is possible that some pure ICR pockets with very low number concentrations of ice crystals may be missing.
3.2 Relationships of the four phases to potential evolution pathways of mixed-phase clouds
Several potential evolution pathways have been documented and discussed in previous literature, which can be linked with the separation of the four phases described above. A “classical” type of evolution pathway follows phases (1) ⇒ (2) ⇒ (3) ⇒ (4), which was observed and documented over 35 years ago (e.g. Hobbs and Rangno, 1985). This type of evolution describes a situation in which a cloud is initiated as a liquid-phase cloud under supercooled conditions. Following this, it experiences ice nucleation and turns into a mixed-phase cloud, after which some sections of the mixed-phase cloud glaciate and turn into ice. Then, in the final stage, the entire cloud is glaciated. Besides the classical progression of mixed-phase clouds, there are two other routes of evolution of mixed-phase clouds. The first “non-classical” pathway is when, after nucleation of INPs and the transition of liquid clouds into mixed-phase clouds, all ice particles precipitate out of the clouds, turning the mixed-phase cloud back into liquid. In other words, the thermodynamic phase evolution of such clouds can be described as liquid ⇒ mixed phase ⇒ liquid, i.e. phases (1) ⇒ (2) ⇒ (1). The imbalance between the water vapour supply and the bulk ice mass crystal growth, required for the maintenance of mixed-phase clouds, is discussed in Rauber and Tokay (1991), Pinto (1998), and Westbrook and Illingworth (2011). There is a fair number of modelling attempts to explain the maintenance of mixed-phase clouds through the balance of INPs and dynamic forcing (e.g. Avramov et al., 2011; Fan et al., 2009, 2011; Smith et al., 2009). The second non-classical pathway of mixed-phase evolution is related to the generation of mixed-phase clouds in a pre-existing ice cloud due to dynamic forcing, which can be presented as ice ⇒ mixed phase, i.e. phases (4) ⇒ (2) or (4) ⇒ (3) ⇒ (2). Note that the numerical order of phases 1–4 does not necessarily represent the evolution direction as indicated by the arrows in Fig. 3. For example, phase 4 may be the final stage in the classical pathway, whereas in the second non-classical pathway, phase 4 is an initial stage. The theoretical basis explaining such a process was developed in several previous studies (e.g. Korolev and Mazin, 2003; Korolev and Field, 2008; Field et al., 2014; Hill et al., 2014). These studies were supported by earlier observations of mixed-phase clouds embedded in pre-existing, deep ice clouds (e.g. Hogan et al., 2002; Field et al., 2004). We caution that a mixed-phase cloud may or may not follow these exact pathways in the real atmosphere, as certain phases may be skipped, the evolution direction could be reversed, and multiple phases can appear in the same cloud in a 3D view. Nevertheless, this method provides a statistical separation of the cloud phases and allows for a more focused analysis of the coexistence of supercooled liquid water and ice crystals that cannot be achieved if a 1 s sample is analysed without the context of its surrounding conditions, for instance, if a 1 s LCR is part of a pure liquid cloud segment or surrounded by MCR or ICR.
After defining the four phases, the following sections examine the thermodynamic (i.e. temperature and relative humidity) and dynamic conditions of the four phases (Figs. 4 and 5), the macro- and microphysical properties of the four phases, and their correlations with each other. For the macrophysical properties of mixed-phase clouds, we focus on investigating the lengths of cloud segments (Fig. 4c and d) and the spatial fraction of a cloud segment containing ice (Figs. 7–10). For the microphysical properties of mixed-phase clouds, we focus on investigating particle size distributions (Fig. 6), the fraction of number concentrations containing ice (Fig. 7), and mass concentrations of supercooled liquid droplets and ice crystals (Fig. 8).
3.3 Distributions of the four phases at various temperatures
Figure 4a and b show the number of 1 s samples for each phase and their probability among all phases within 5° temperature bins. The results show that phases 1 and 4 are more dominant at higher and lower temperatures, respectively, which follows the basic thermodynamic process that the phase change from liquid to ice occurs more frequently at lower temperatures. At temperatures between −20 and −5 °C, phase 2 is the most dominant phase and constitutes 40 % of the total samples, while phase 3 constitutes 20 %–40 % of the total samples. The fact that the pure ice or liquid phase only constitutes 5 %–35 % of the total samples between −20 and −5 °C demonstrates that the cloud segments sampled in the SOCRATES campaign are spatially heterogeneous, consistent with the results in the study of D'Alessandro et al. (2021). Figure 4c and d show the distributions of the length of TCRs in the four phases. The distribution of TCR lengths is consistent with the previously observed power-law distribution of cloud horizontal sizes shown in Wood and Field (2011). The lengths of TCR segments vary from ∼ 0.2–180 km in various temperature ranges, with low sampling statistics (i.e. less than 100) of continuous in-cloud segments longer than 60 km, which indicates a patchy horizontal structure with clear-sky gaps inside the clouds. Since the 1D aircraft sampling can be at any vertical level relative to a cloud layer, we further examine the impacts of restricting the analysis to different ranges of LWC, IWC, and RHi values (Figs. S1 and S2 in the Supplement). Previous studies, such as Wang et al. (2012) and D'Alessandro et al. (2023), have shown that the cloud top usually contains higher LWC than the cloud base, while IWC increases from the cloud top to the cloud base. By using different ranges of LWC and IWC as proxies for vertical levels within cloud layers, we found that the number of samples of the four phases is relatively similar unless very high LWC or IWC is used (>0.1 g m−3).
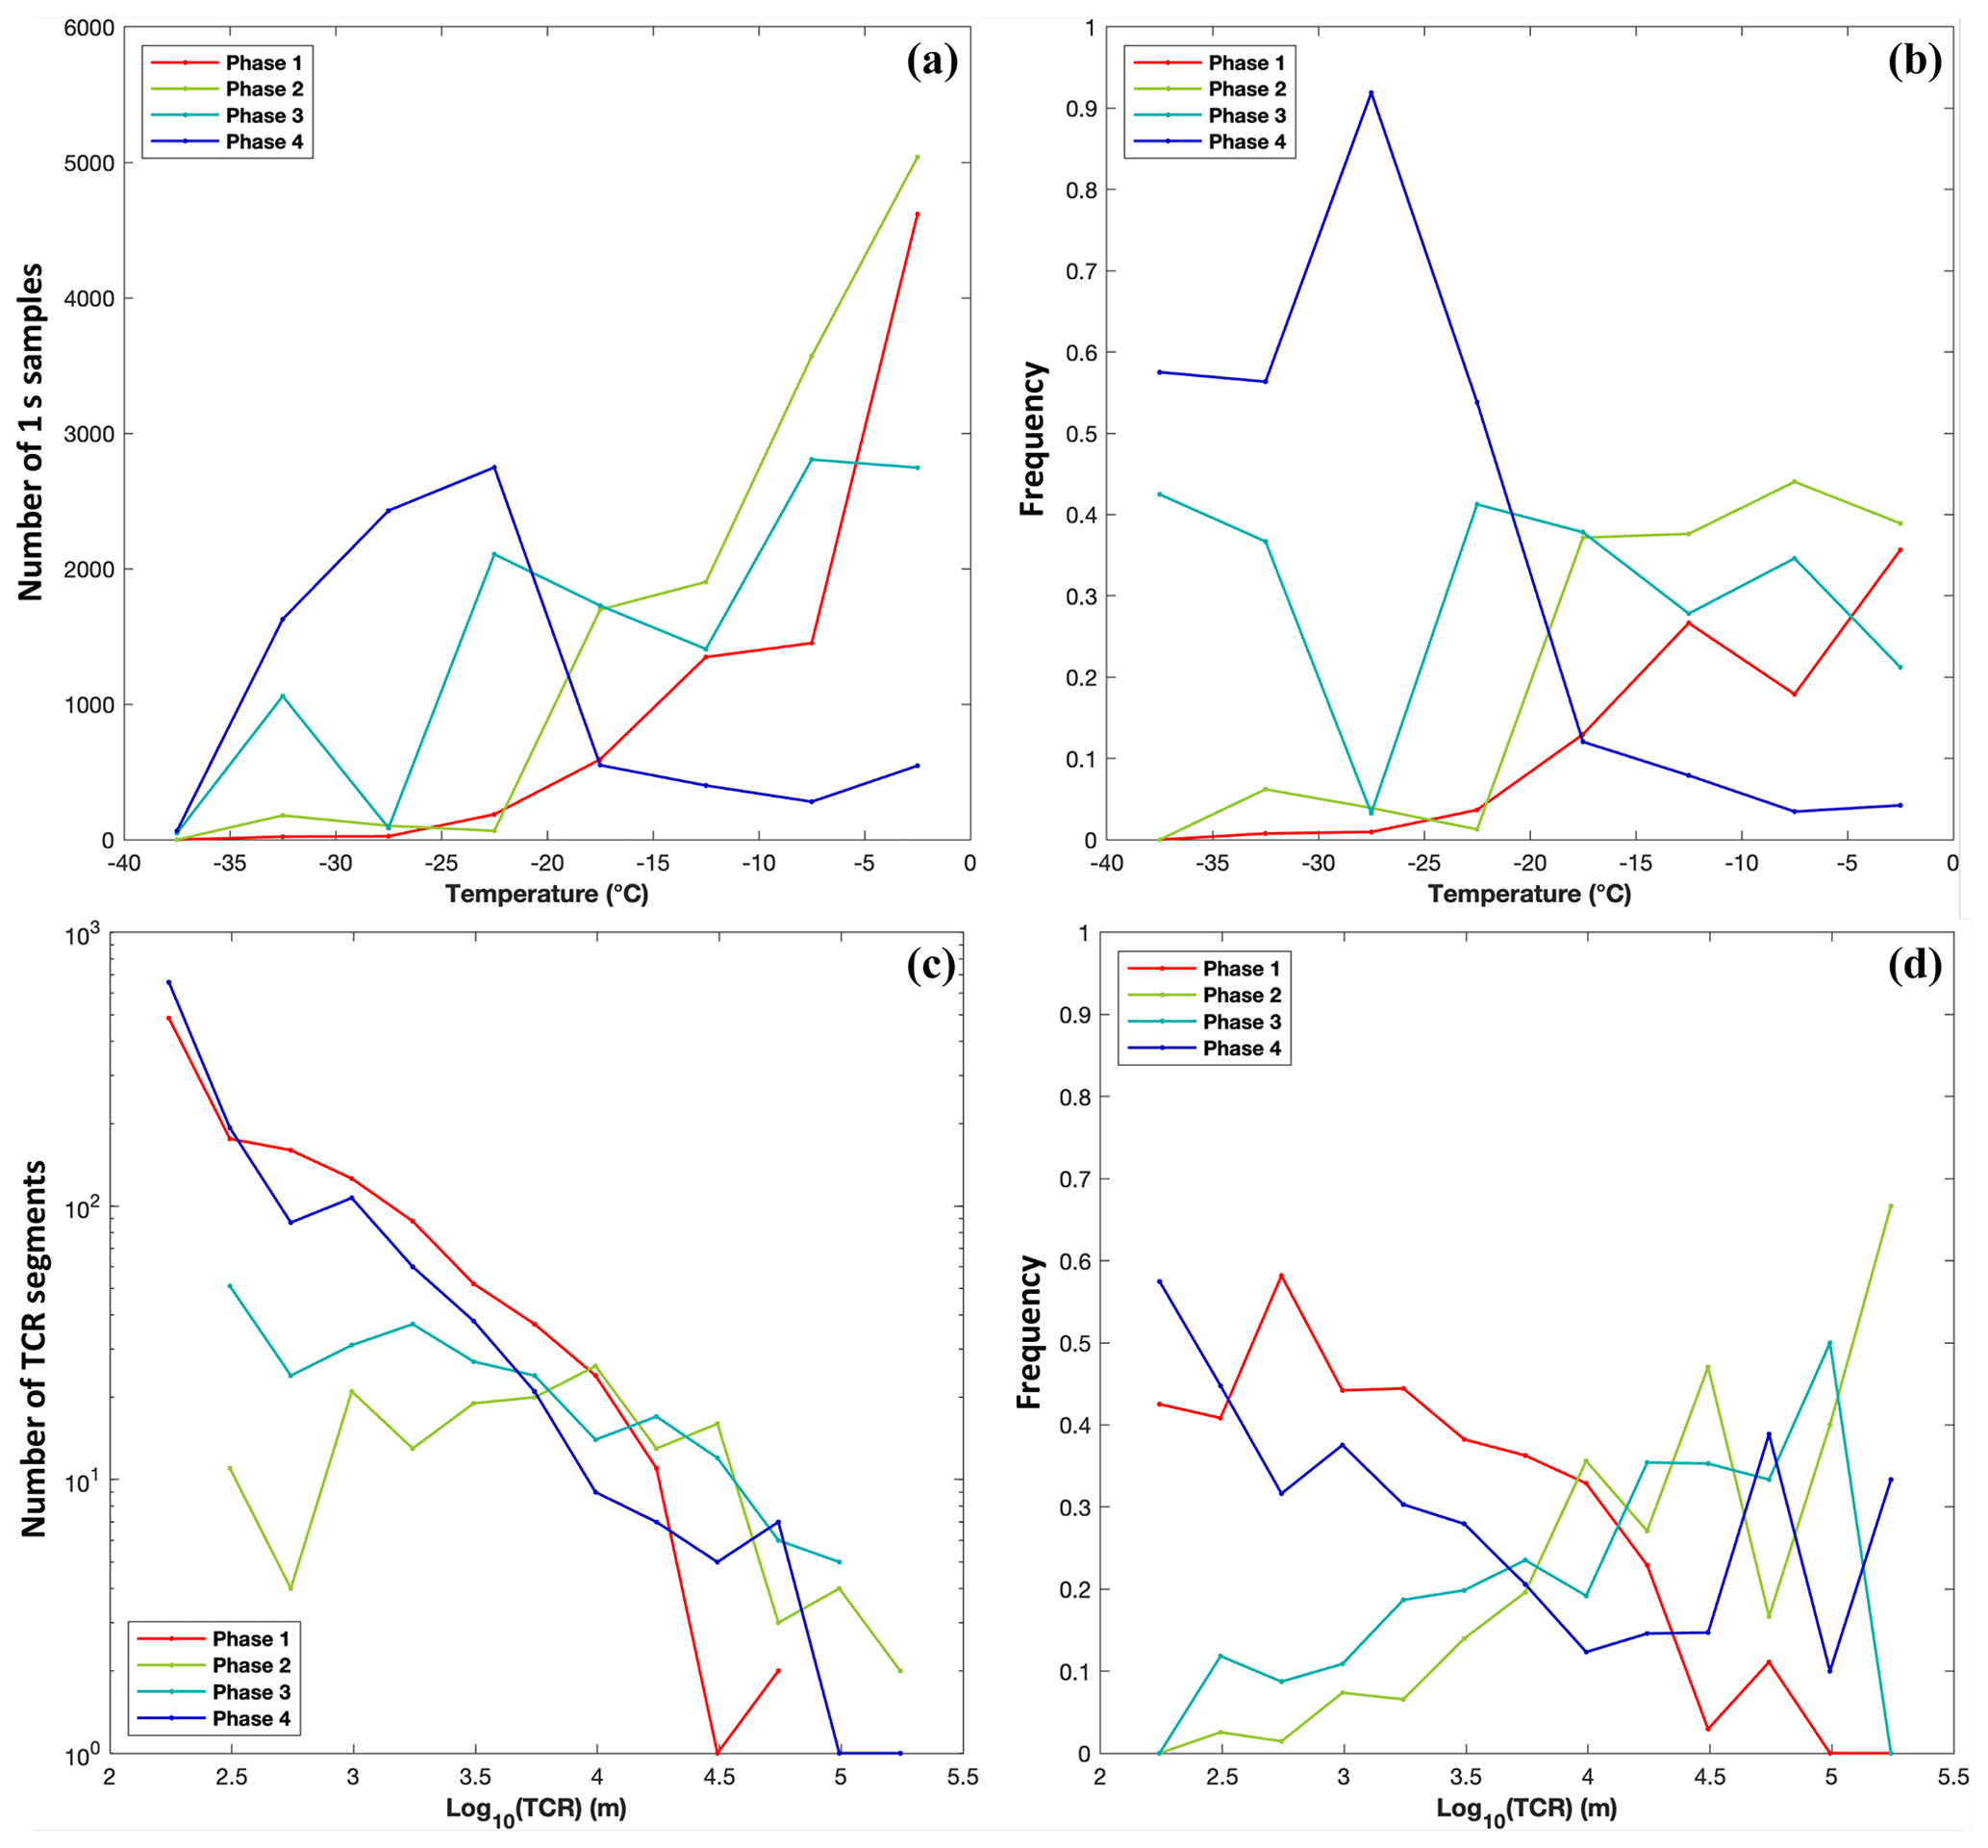
Figure 4Distributions of 1 Hz samples in the four phases at various temperatures (a, b). (a) Number of 1 s samples and (b) frequency of 1 s samples in each phase within various temperature bins. In panel (b), the frequency of 1 s samples in each phase is normalized by the total number of 1 s samples of all phases in each 5° temperature bin. Distributions of various lengths of TCR segments are analysed in panels (c) and (d). (c) Number of TCR segments and (d) frequency of cloud segments in each phase associated with various lengths in log10 scale. In panel (d), frequency is calculated as the number of segments of a specific phase divided by the total number of segments in each 100.25 bin.
The impact of the length scales of TCR on the phase distributions is examined in Fig. S3. TCR samples are separated into four scales – 0.1–1, 1–10, 10–100, and > 100 km. The dependence on temperature for the distributions of the four phases is consistently seen for various scales; e.g. phase 1 has more samples at higher temperatures, while phase 4 has more samples at lower temperatures. Comparing the shorter (panels a and b) and longer (panels c and d) TCR samples, the shorter ones have more samples in phase 1 (i.e. pure liquid phase), while the longer ones have more in phases 2 and 3. For the length scales of phase 4, more 1 s samples in phase 4 were found in shorter segments (0.1–1 km) at −20 to 0 °C, while more 1 s samples in phase 4 were found in longer segments (10–100 km) at −40 to −20 °C. This result indicates that the coexistence of ice and liquid occurs more frequently in clouds with a larger spatial extent, such as stratocumulus and stratus clouds.
3.4 Thermodynamic and dynamic effects on the evolution of mixed-phase clouds
Thermodynamic and dynamic conditions of each phase are examined at various temperatures in Fig. 5, which shows the distributions of RHi, vertical velocity, and standard deviation of vertical velocity (σw, calculated for every 40 s). For phases 2 and 3, LCR represents seconds without ice particles, while MCR and ICR represent seconds with ice particles. These two conditions (i.e. with or without ice) are examined separately in Fig. 5e–l. For 1 Hz samples dominated by supercooled liquid water (i.e. the entirety of phases 1 and 2 and phase 3 samples without ice), RH values are distributed close to the liquid saturation line. This is consistent with previous theoretical and observational studies (Korolev and Mazin, 2003; Korolev and Isaac, 2006), which showed that RHliq in mixed-phase clouds is close to 100 % due to rapidly evaporating droplets via the Wegener–Bergeron–Findeisen (WBF) process, bringing the system of “droplets–water vapour” into quasi-equilibrium and therefore saturating the environment. As liquid droplets glaciate into ice particles, the peak of RH frequency would also shift towards ice saturation (e.g. D'Alessandro et al., 2019), as shown by the wider range of RHi in 1 Hz samples containing ice in phase 3 (Fig. 5g). The in-cloud samples used in this study contain a small number of sub-saturated conditions that deviate from liquid saturation in phases 1–3, with phase 1 showing the least amount of liquid sub-saturation compared with other phases. These liquid sub-saturated conditions may be attributed to a combination of reasons, such as the 6 %–7 % uncertainty in RH values originating from water vapour and temperature measurement uncertainties; heterogeneous distributions of LCR, MCR, and ICR that lead to an uneven distribution of supercooled liquid water; and non-equilibrated states between vapour–liquid or vapour–ice phases due to the larger volume being sampled by fast aircraft measurements (∼ 172 m horizontal resolution for 1 Hz measurements used here). For all four phases, RHi values above ice saturation and closer to liquid saturation have been observed, providing observational evidence that new formation of supercooled liquid water droplets and ice crystals may occur in any of the four phases, following either of the three evolution pathways mentioned in Sect. 3.2.
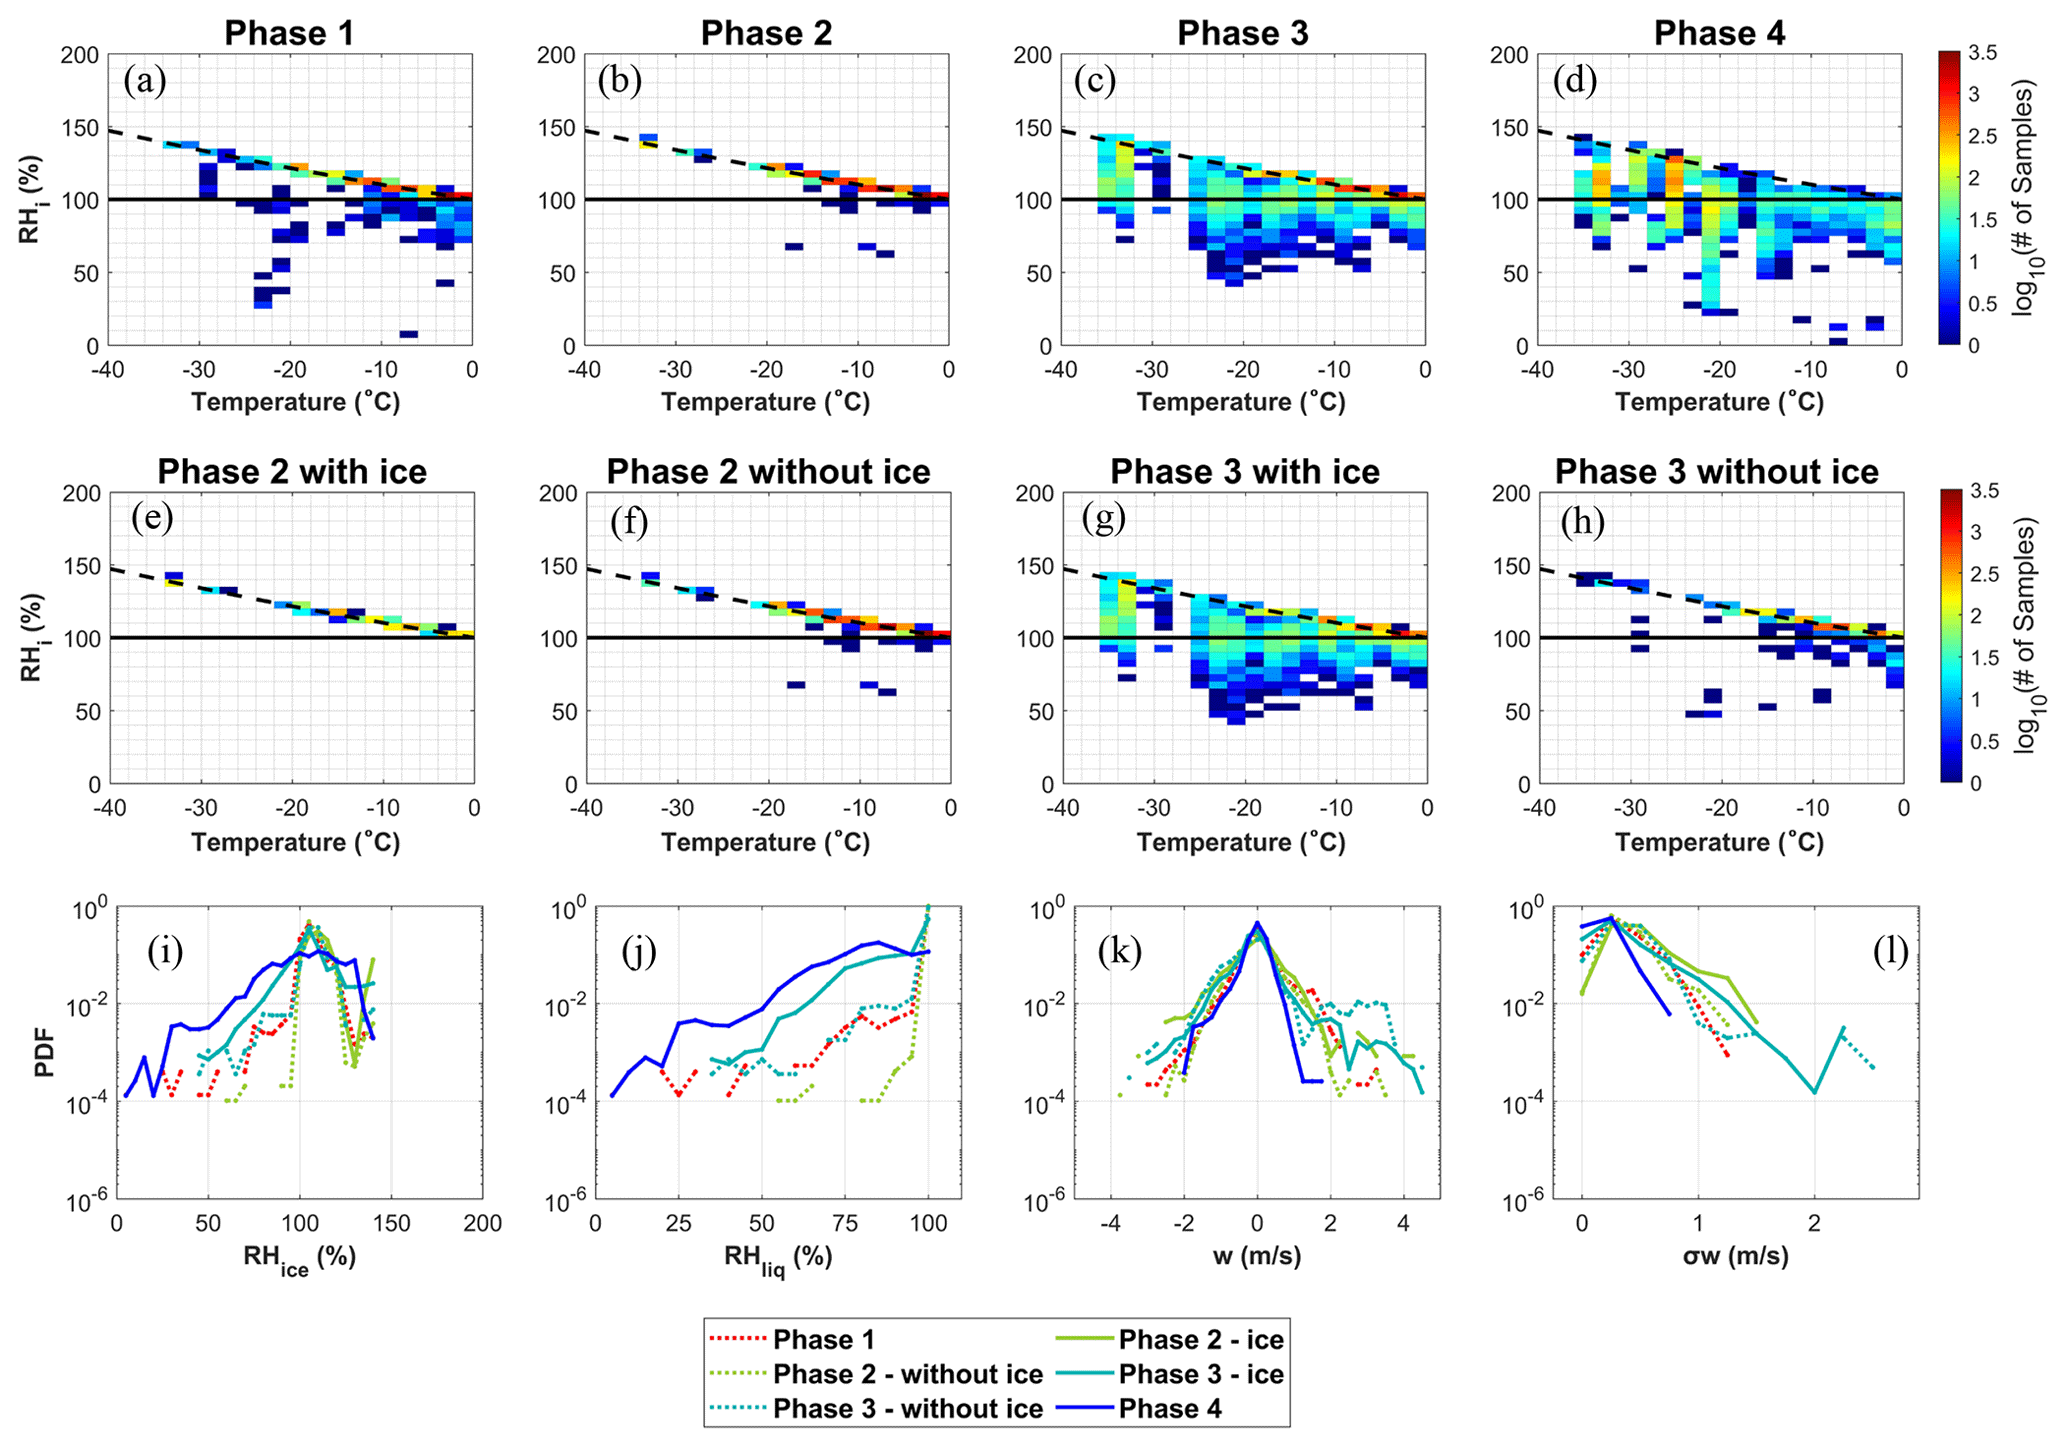
Figure 5(a–h) Distributions of RHi as a function of temperature. (i–l) PDFs of RHi, RHliq, vertical velocity (w), and σw of the various phases, respectively. The dashed lines in panels (a)–(h) indicate liquid saturation.
The probability density functions (PDFs) of RHi, RHliq, vertical velocity, and σw are further examined in Fig. 5i–l. The peak frequencies of RHliq are seen at liquid saturation for phases 1–3, consistent with the findings in Fig. 5a–d. The PDFs of vertical velocity show higher frequencies of updraughts for phases 2 and 3 compared with phases 1 and 4. In addition, the PDFs of σw show higher frequencies of large σw values in phases 2 and 3 than phases 1 and 4. The number of 1 Hz σw samples at various ranges (i.e. ≥0.5, ≥1, and ≥1.25 m s−1) and their percentages relative to the total samples in each phase are shown in Table S2. The analysis in Table S2 also shows higher percentages of larger σw values in phases 2 and 3 compared with phases 1 and 4. Similarly, the distributions of σw as a function of temperature in Fig. S4 show more samples above 1 m s−1 across a wide range of temperatures from −36 to 0 °C in phases 2 and 3 compared with phases 1 and 4. These results indicate that the segments containing both supercooled liquid droplets and ice particles are subject to relatively stronger updraughts and more turbulent conditions compared with the segments containing only liquid droplets or only ice crystals. This finding is consistent with Shupe et al. (2008), who pointed out the importance of updraughts for sustaining mixed-phase clouds. Unlike previous studies, our method can further specify that the highest updraughts and the highest vertical velocity fluctuations are both found in phase 3 when pure ice segments start to appear (∼ 4.5 m s−1 in Fig. 5k and ∼ 2.3 m s−1 in Fig. 5l), consistent with the fact that RHliq deviates more from liquid saturation in phase 3 (Fig. 5c), and therefore higher updraughts would be required to maintain supercooled liquid droplets.
3.5 Particle size distributions in the four phases of mixed-phase clouds
The PSD for the four phases is shown in Fig. 6, separately plotted for the 2DS probe and CDP. Phases 1, 2, and 3 have similar concentrations of small liquid droplets between 2 and 10 µm. Phase 2 has the highest concentrations of hydrometeors at 10–60 µm, while phase 3 has the highest concentrations at 60–3000 µm. Phase 4 also has relatively high concentrations of ice crystals at 200–3000 µm, but they are lower than the values from phase 3 by a factor of 5–10. The decreasing ice crystal concentrations per size bin from phase 3 to phase 4 may be caused by stronger aggregation, sublimation, and/or sedimentation of ice crystals in phase 4, as well as by stronger glaciation and/or secondary ice production in phase 3. The significant decrease (1 to 4 orders of magnitude) of hydrometeor concentrations per size bin at 20–100 µm in phase 4 compared with the other three phases suggests that most supercooled liquid water may have evaporated and transitioned into the ice phase through the WBF process or riming instead of the freezing of individual droplets, while the small ice crystals may have sublimated. It is possible that some of the phase 4 samples may represent the trails of generating cells, where the growth is aloft, and sublimation is at the lower part of the cloud layer. In addition, smaller supercooled liquid droplets require lower temperatures to freeze into ice crystals. This feature is also shown in Fig. S5d from −10 to −40 °C, as small ice crystals at the 20–200 µm size range show increasing concentrations with decreasing temperatures in phase 4. On the other hand, phase 3, which still has supercooled liquid water coexisting with ice particles, does not show such a trend, probably because ice crystal formation and growth may occur via various processes in phase 3, such as secondary ice production, the WBF process, glaciation, and/or riming. Phases 3 and 4 in Fig. S5c and d show a trend of decreasing frequency of large ice particles (e.g. Dmax>1000 µm) with decreasing temperature. This could be due to an increasing probability of droplet freezing with decreasing temperature given the same dimension that reduces the available amount of large supercooled liquid droplets for glaciation or riming at lower temperatures.
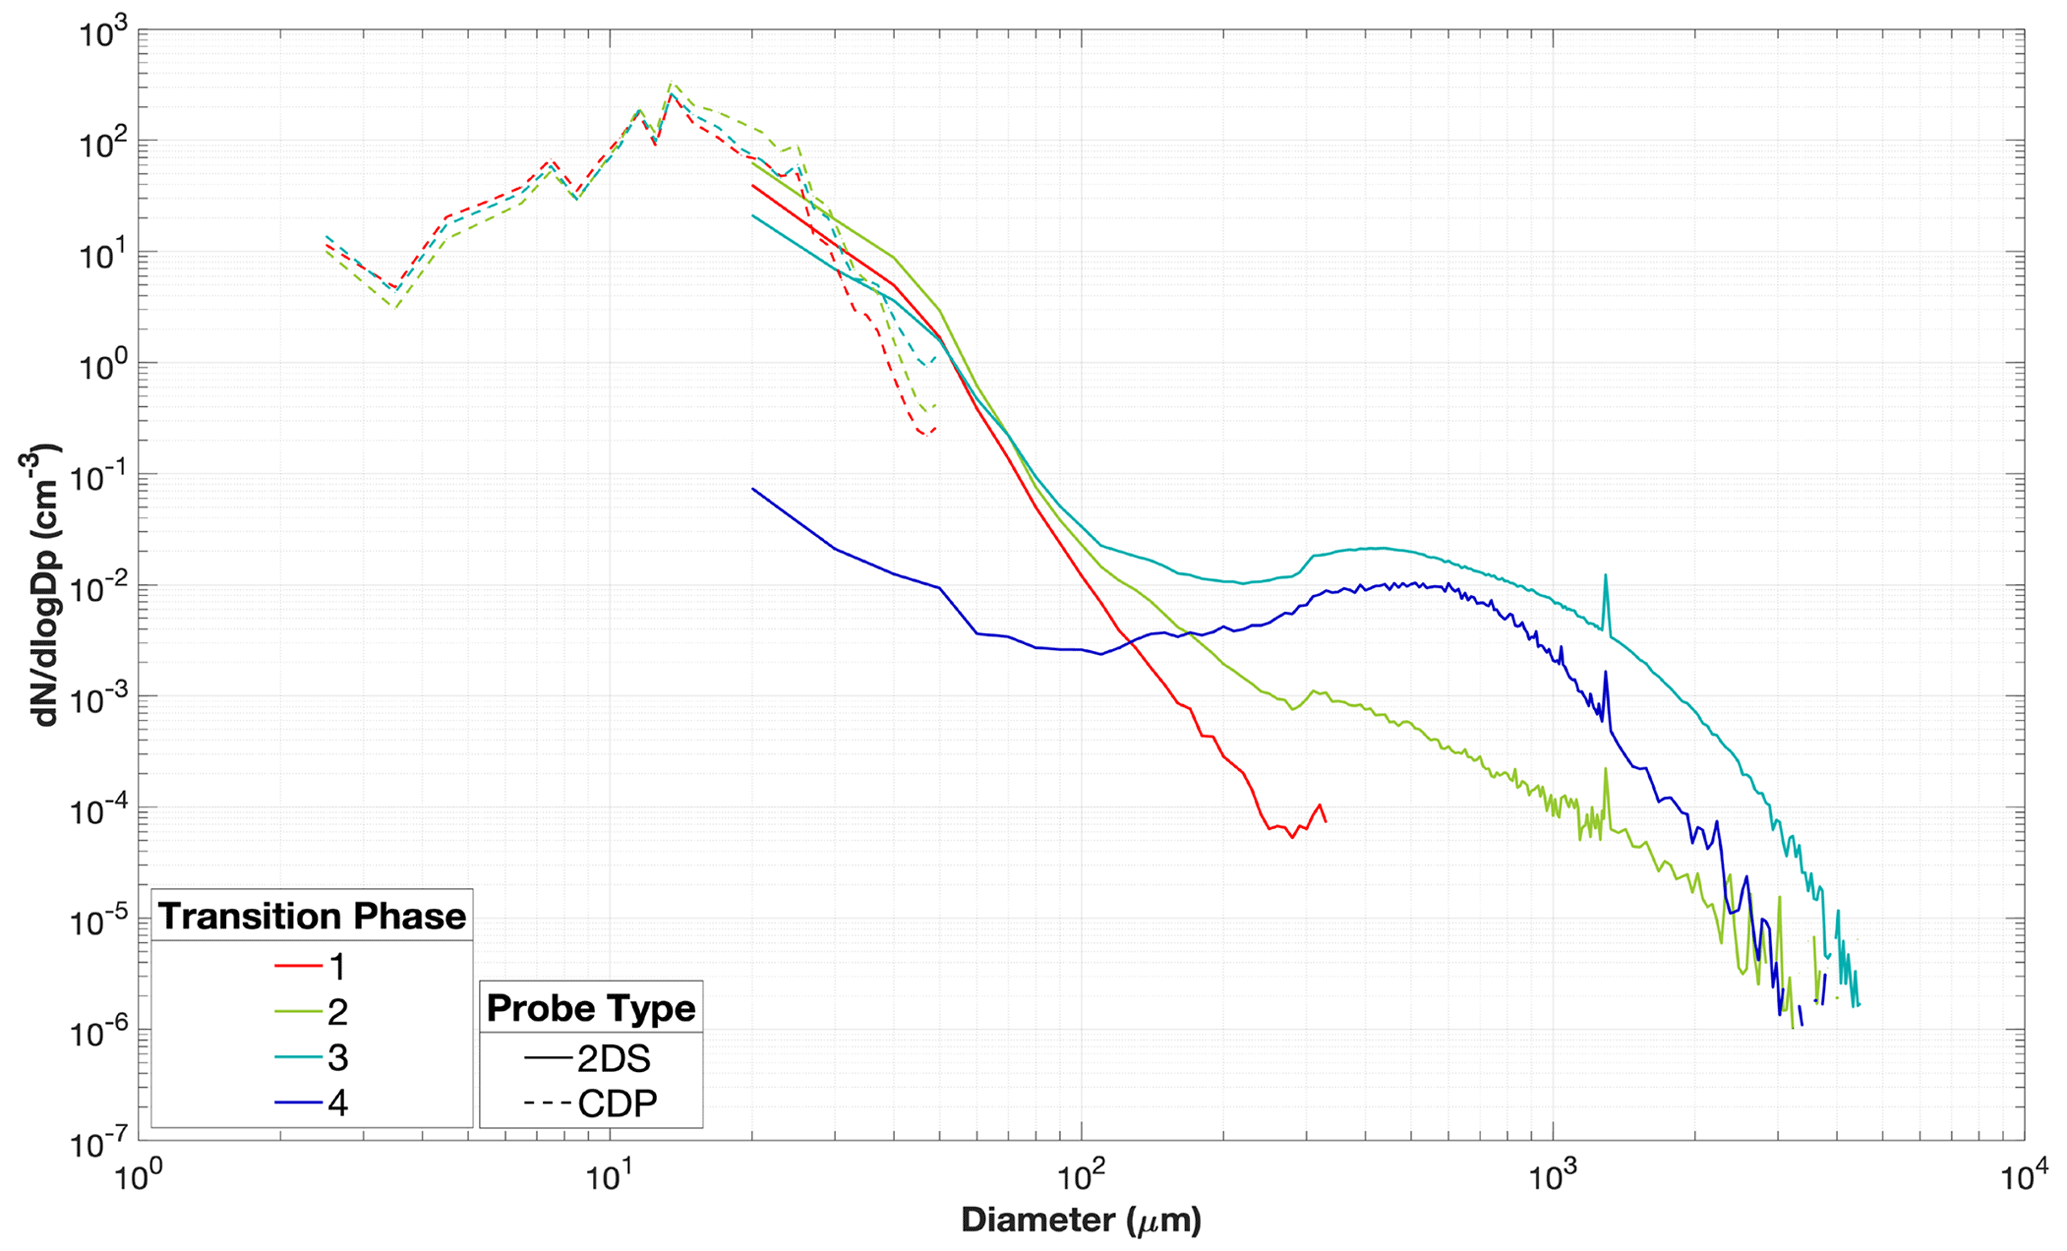
Figure 6Particle size distribution of the four phases for mixed-phase clouds separated by probe types. The entire dataset at the temperature range of −40 to 0 °C is shown. Phase 4 only shows 2DS measurements because ice particles measured by CDP are excluded from the analysis.
3.6 Relationship between microphysical and macrophysical properties of mixed-phase clouds
One unique contribution of this work is to quantify how cloud microphysical and macrophysical properties are correlated with each other. The relationship between cloud macrophysical properties (represented by the mixed or ice spatial ratio) and several microphysical properties, including IPNF (Fig. 7), is further examined, as well as LWC, IWC, and ice mass fraction (Fig. 8). Specifically, the mixed spatial ratio represents the fraction of MCR as part of an individual consecutive TCR, calculated as the length of MCRthe length of TCR. The ice spatial ratio represents the fraction of ice-containing segments as part of an individual consecutive TCR, calculated as . The contribution of MCR to the ice spatial ratio in phase 3 is weighted by the ice mass fraction, giving the MCR a smaller weighting function compared with ICR since MCR contains higher fractions of supercooled liquid droplets than ICR. Note that the definitions of the mixed spatial ratio and ice spatial ratio differ from the spatial ratio previously used for characterization of mixed-phase clouds in Korolev et al. (2017, Fig. 5–13a). In the previous method, the spatial ratio of a thermodynamic phase (i.e. liquid, mixed, or ice) is calculated as the number of samples of that thermodynamic phase divided by the total cloud samples in a certain temperature bin. In this work, the mixed spatial ratio and ice spatial ratio are calculated for individual TCR segments, and therefore each TCR would produce one value of the mixed spatial ratio and one value of the ice spatial ratio. These values of the mixed spatial ratio or ice spatial ratio are applied to every 1 s sample within this TCR.
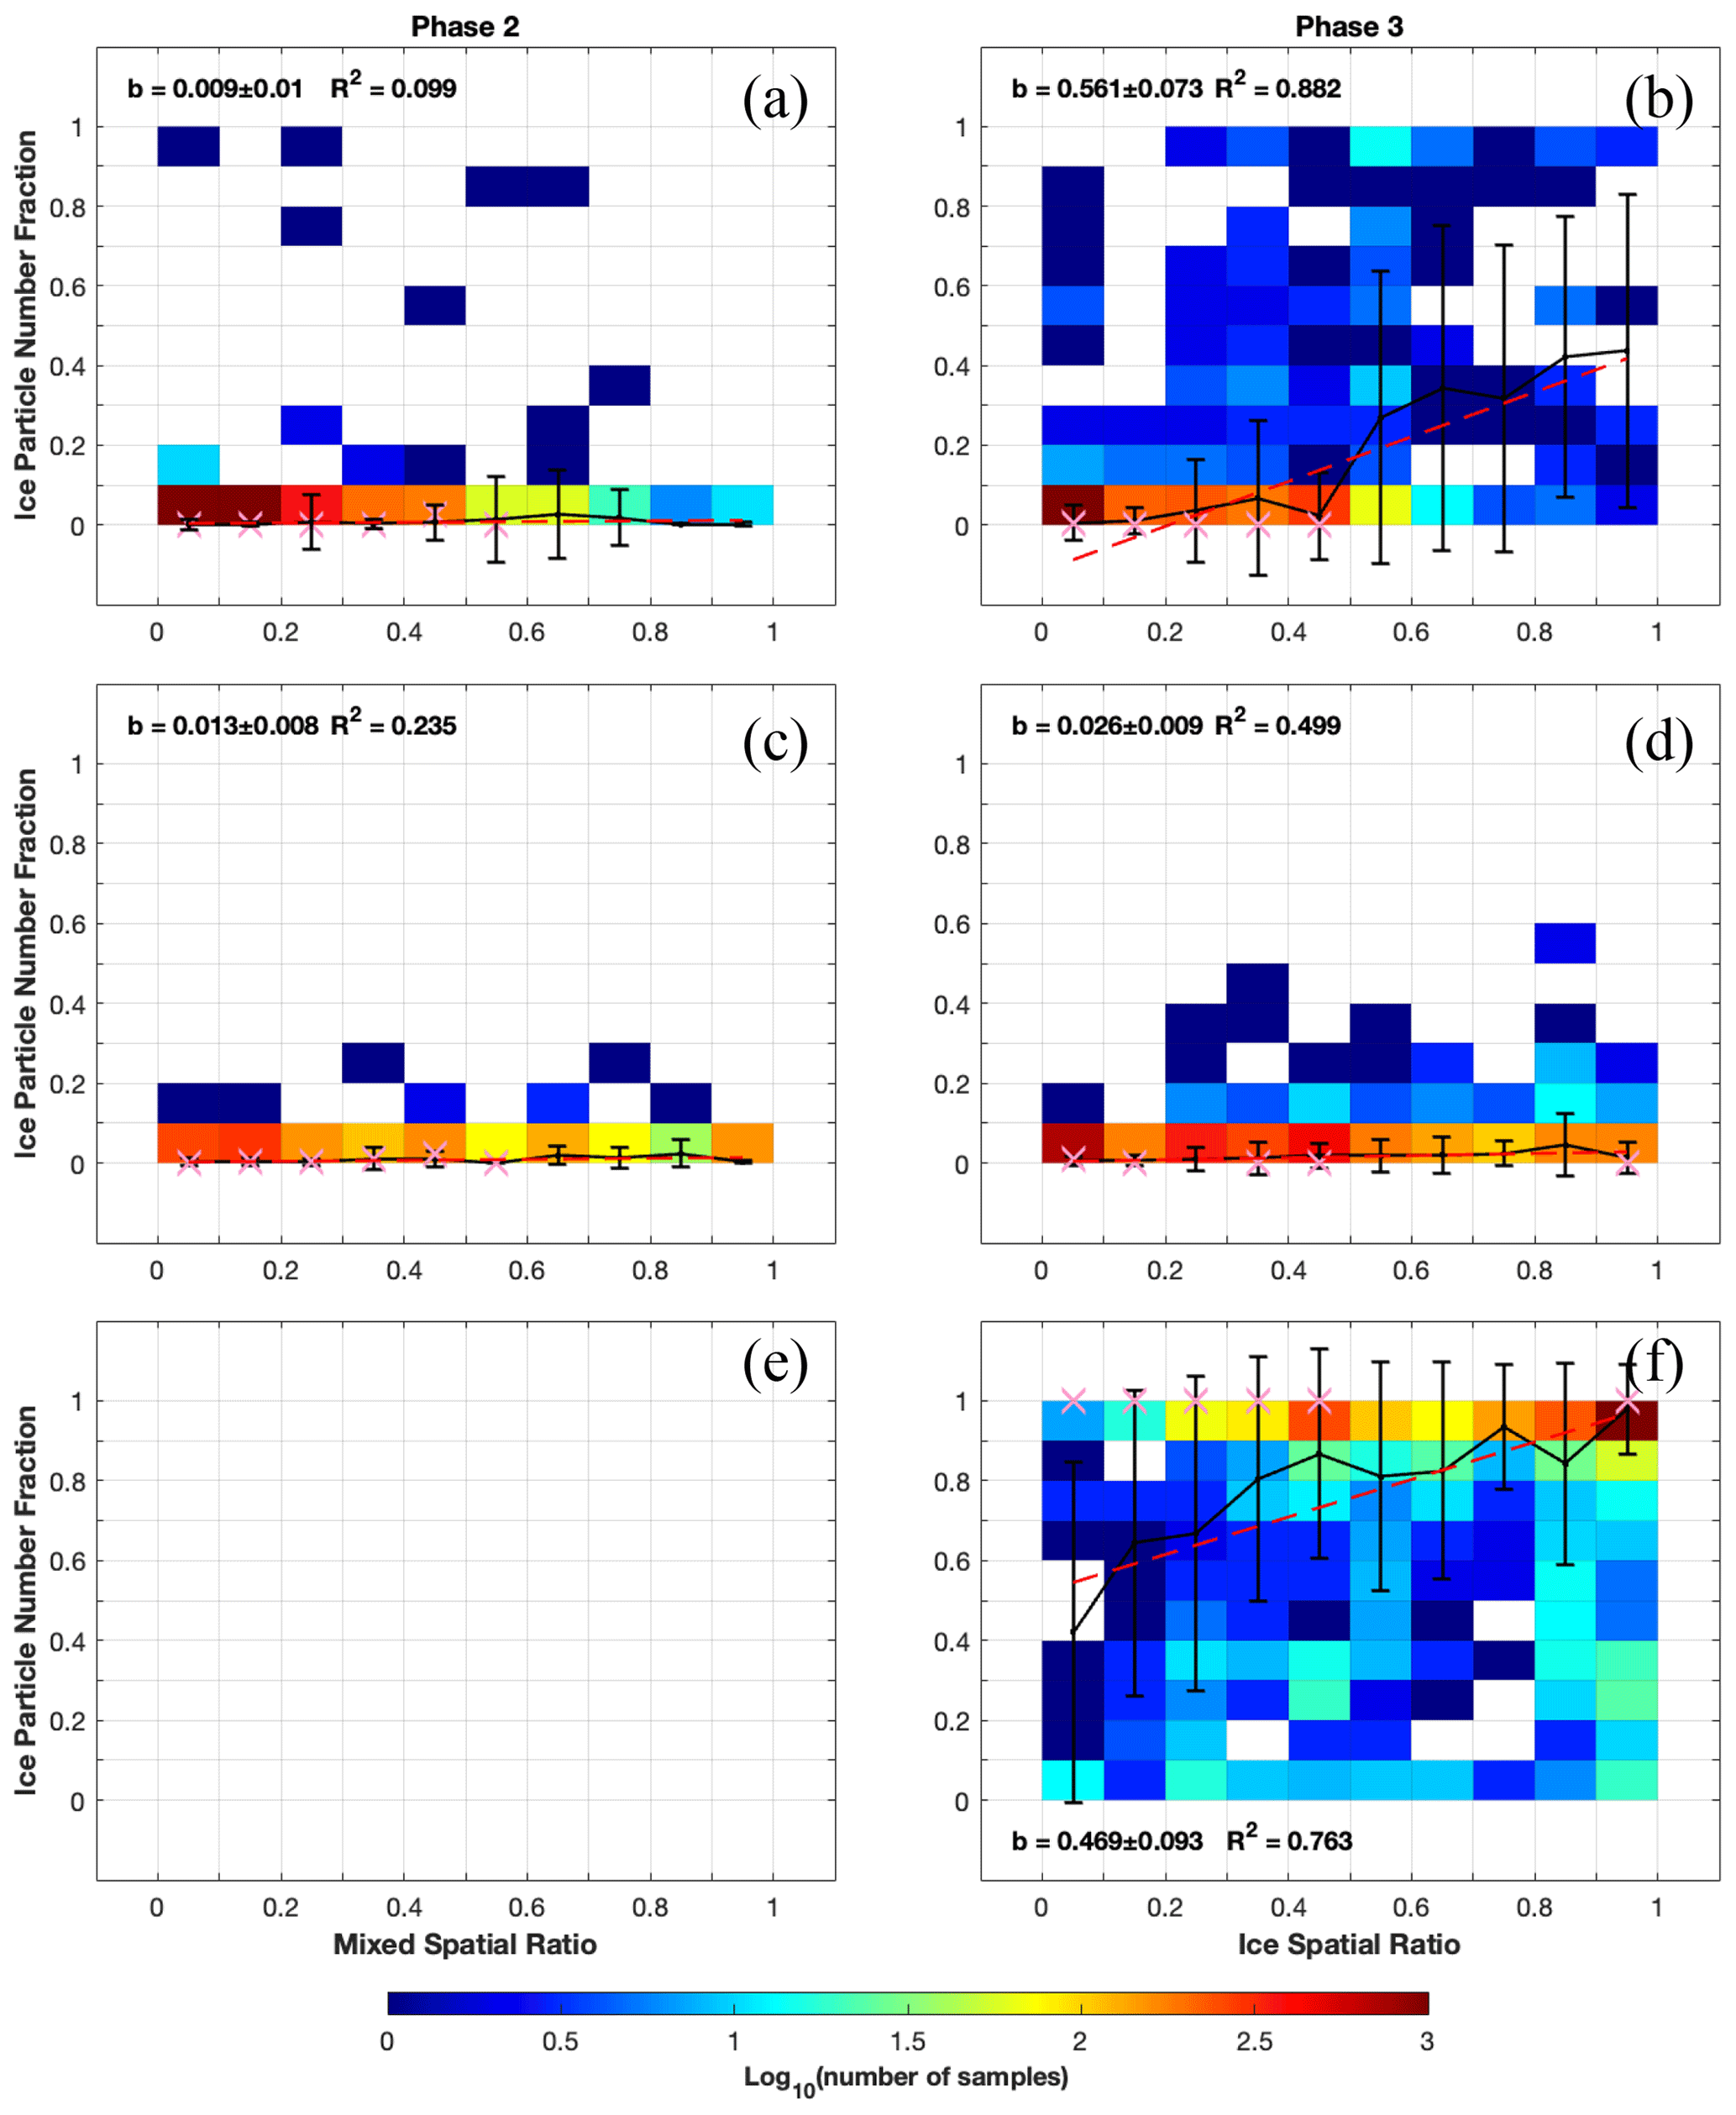
Figure 7Relationship between the ice particle number fraction (IPNF) and mixed spatial ratio or ice spatial ratio, separated by the phase type (phase 2 in column 1 and phase 3 in column 2) and by various cloud segments – (a, b) LCR, (c, d) MCR, and (e, f) ICR. Average values for each ice spatial ratio bin are shown with the solid black lines, with the vertical bars representing standard deviations. Linear fit is shown with the dashed red line. Average values of generating cells (time series obtained from Wang et al., 2020) are in pink “×” markers. The slope value b, its associated standard deviation, and the ordinary R-squared value are shown in the legend.
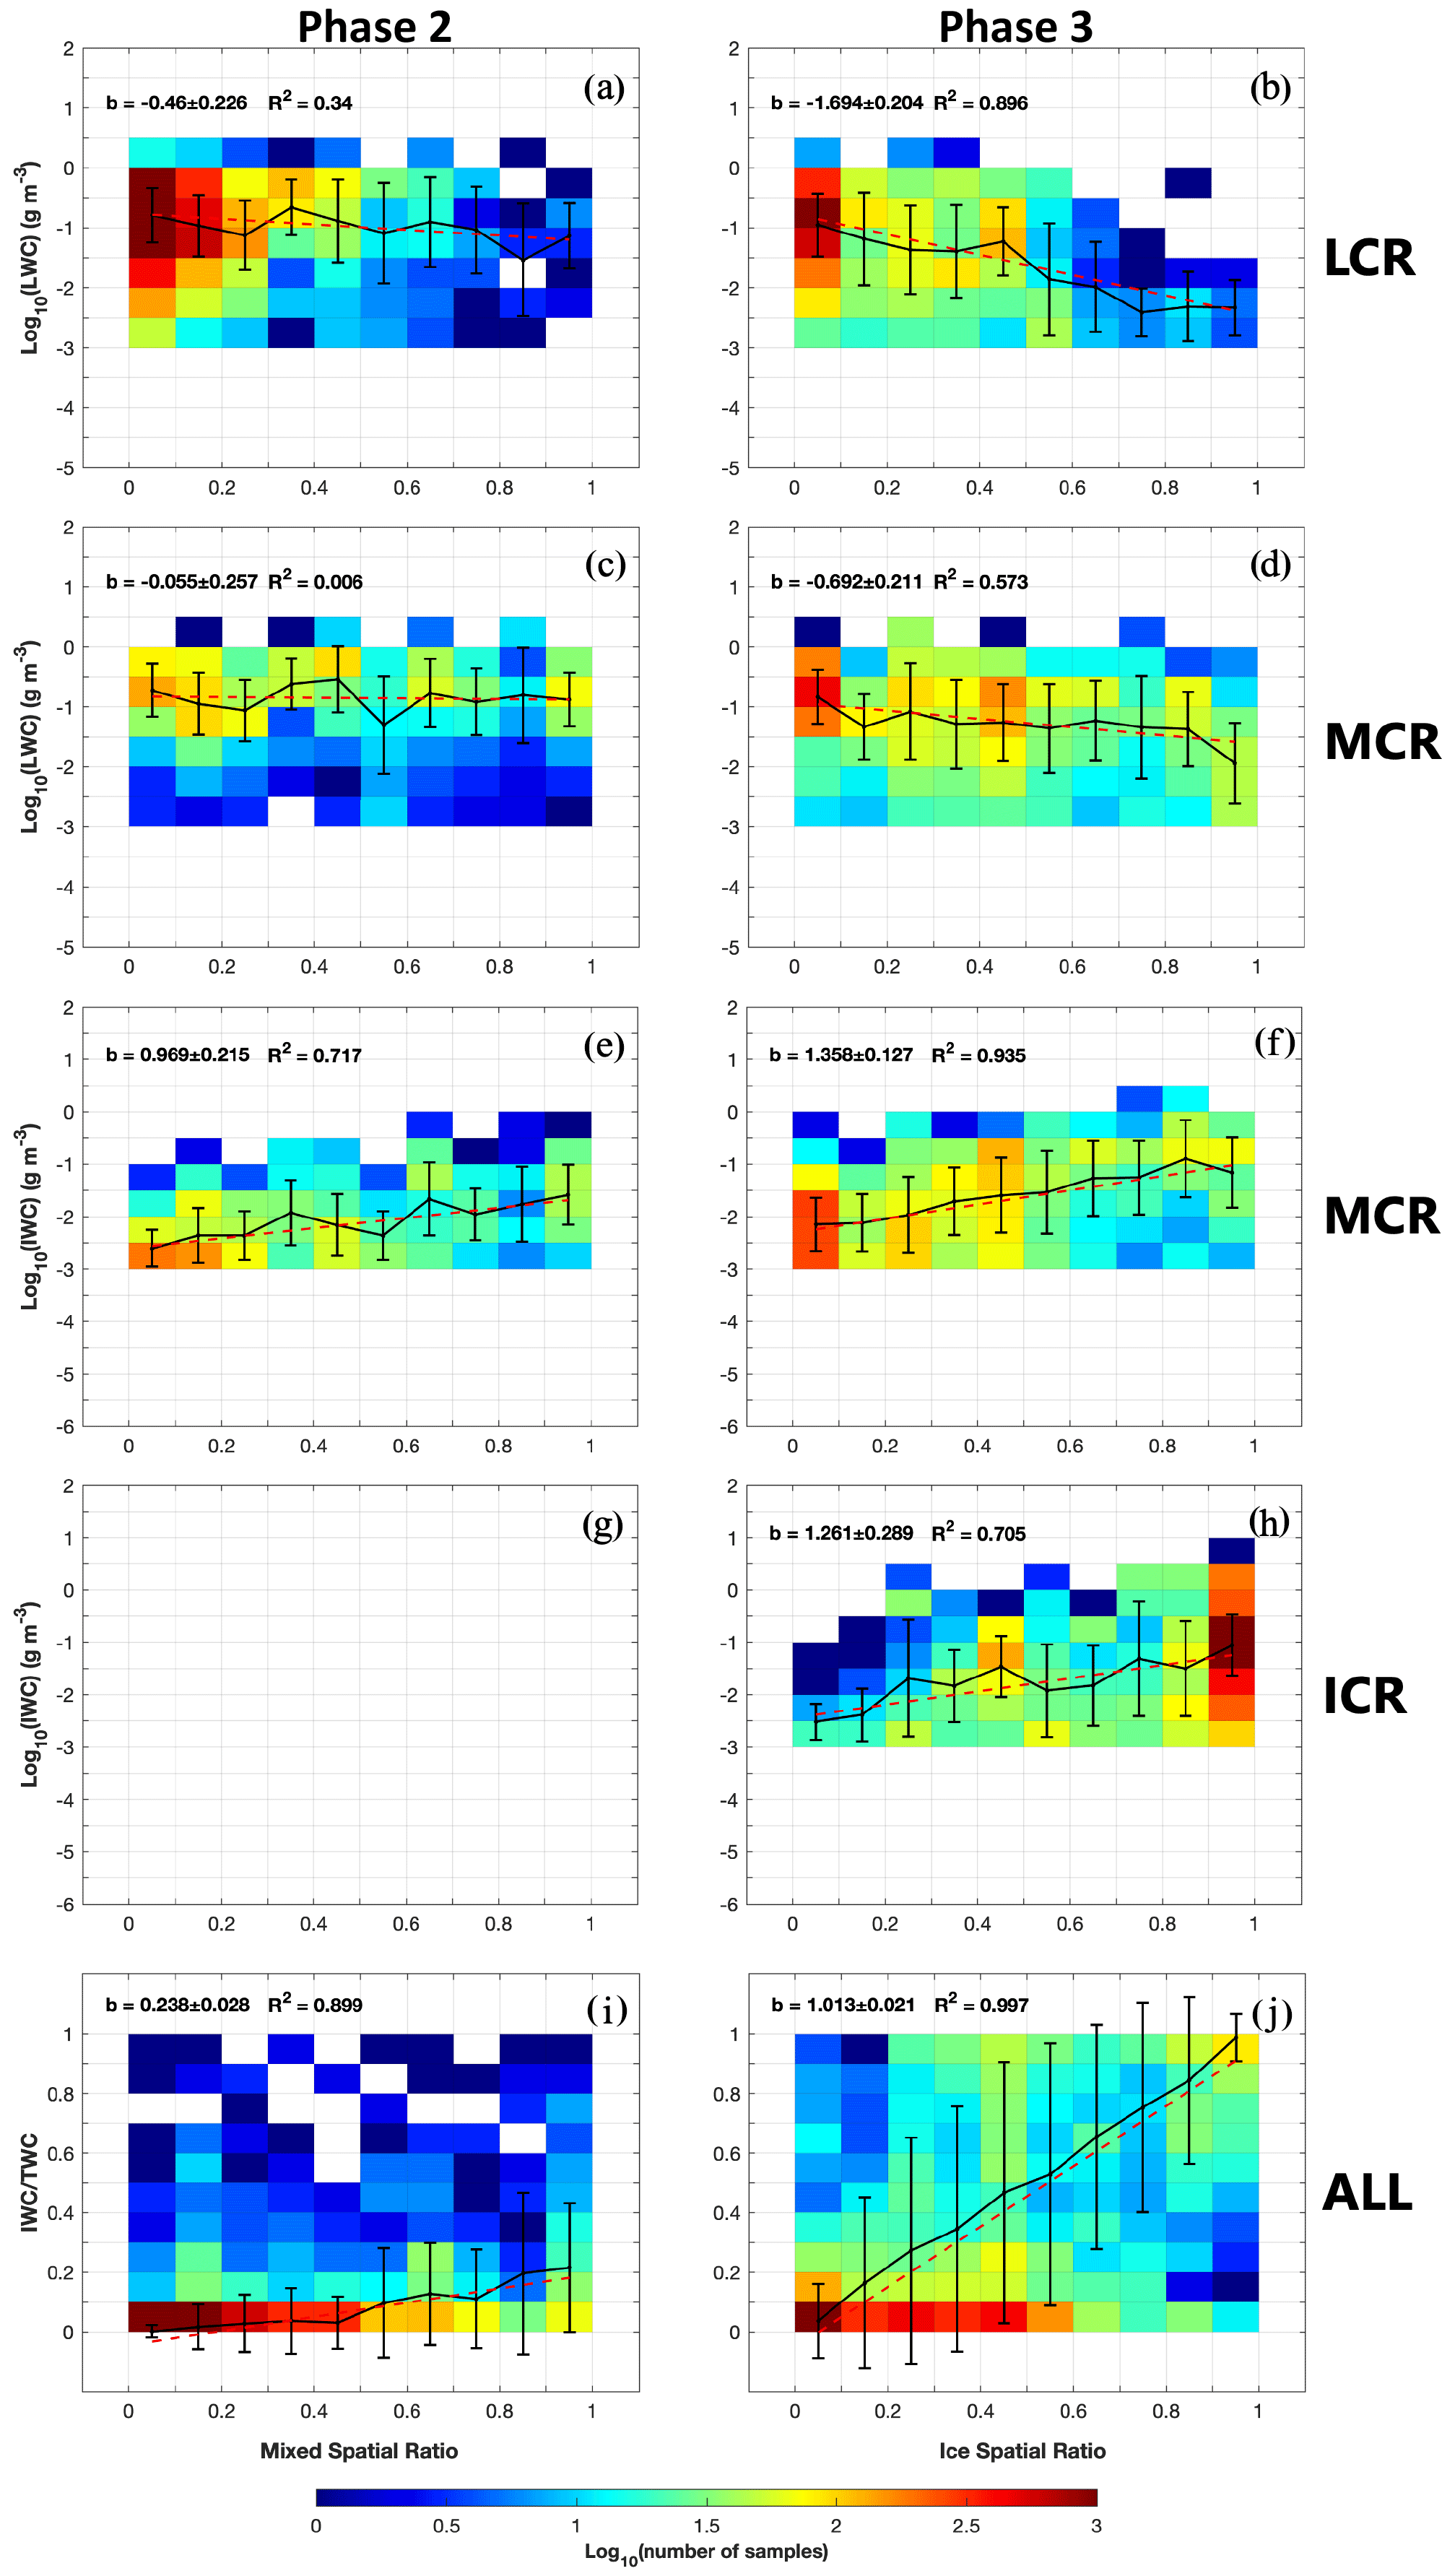
Figure 8Similar to Fig. 7 but showing (a–d) LWC (unit: g m−3), (e–h) IWC (unit: g m−3), and (i, j) ice mass fraction in relation to the mixed spatial ratio for phase 2 and ice spatial ratio for phase 3, separated by the phase type and cloud regions.
In Figs. 7 and 8, linear regressions of the mixed spatial ratio and ice spatial ratio against each microphysical property are shown for phases 2 and 3, respectively. The analysis is separated by whether the 1 s sample is an LCR, MCR, or ICR.
The slope value (b) of the linear regression is provided in the text legend. Since phase 2 does not contain ICR, no data points are shown in the sub-panels in Figs. 7, 8, and 10. The linear regression analysis is applied to the average values of microphysical properties in each spatial ratio bin in order to assign an equal weight to each bin of the mixed or ice spatial ratios. When directly applying the linear regression analysis to individual seconds of IPNFs (as shown in Fig. S6), similar slope values are seen compared with Fig. 7, but the bins of the mixed spatial ratio and ice spatial ratio have uneven distributions of samples.
Note that additional quality control procedures are applied to the IPNF data because the machine-learning-based particle identifications of 2DS data may misidentify small ice fragments as supercooled liquid droplets, especially at lower temperatures. To minimize such misidentifications, the following two quality control procedures are applied, which were developed after inspecting the Particle Habit Imaging and Polar Scattering (PHIPS) airborne cloud probe: (1) for 1 Hz samples of ICR in phases 3 and 4, when temperatures are below −20 °C and 0 < IPNF < 1, IPNF is reset to 1 to be pure ice; (2) for 1 Hz samples of ICR in phase 3, when temperatures are between −20 and −10 °C and 0.4 < IPNF < 1, these IPNF values are reset to 1. After the corrections, out of 2866 s of samples analysed in Fig. 7b, 172 s (i.e. 6.00 %) show IPNF > 0.1.
All regions (i.e. LCR, MCR, and ICR) in Fig. 7 show positive correlations between IPNF and the mixed or ice spatial ratio in phases 2 and 3. This means that while ice crystals gradually dominate the total particle population (i.e. IPNF increases) in cloud segments, the spatial fraction containing ice particles (i.e. MCR + ICR) also approaches 1 from a macroscopic perspective. Comparing phases 2 and 3, phase 2 (without ICRs) shows a smaller positive correlation (b values of 0.009 and 0.013) compared with phase 3 (b values of 0.561, 0.026, and 0.469). This is because when ice particles are surrounded by supercooled liquid droplets, the latter has a much higher number concentration than ice crystals, and therefore IPNFs are relatively low on average in phase 2. On the other hand, in phase 3, ice crystals start to become the dominant particles by number concentration, and supercooled liquid droplets become less dominant. Note that even after quality control is applied to IPNF, a small number of high IPNF values is still seen (e.g. 0.4 ≤ IPNF < 1) in Fig. 7b and f. A sensitivity test is conducted by removing all 0.4 ≤ IPNF < 1 (not shown), which shows consistent conclusions as indicated in Fig. 7; that is, all phases show positive correlations between IPNF and the spatial expansion of ice-containing regions. In addition, phase 3 still shows higher slopes of linear regressions compared with phase 2, indicating faster increases in IPNF in phase 3 when pure ice segments start to appear.
Previously, Wang et al. (2020) used airborne remote sensing measurements from the SOCRATES campaign to identify generating cells of ice crystals. Based on the definition from the American Meteorological Society (2024), generating cells are defined as cloud top regions with high radar reflectivity, which often produce fall streaks of falling hydrometeors. Out of the 16 cases of generating cells detected by Wang et al. (2020), all 16 cases contain supercooled liquid droplets. The average LWC and Nliq inside generating cells were found to be greater than those outside the generating cells. In addition, larger ice particles and higher Nice were seen in the generating cells, associated with the updraughts inside the cells. These reported generating cells are also analysed in Fig. 7, with the average IPNF values shown in each mixed and ice spatial ratio bin. The generating cells associated with LCR and MCR contain a lower IPNF (Fig. 7a–d). This is because when generating cells are associated with high concentrations of supercooled liquid droplets, Nice may be lower than Nliq, which leads to the lower IPNF. But when the generating cells are associated with ICR, significantly higher IPNFs (close to 1) are seen for most ice spatial ratio bins (Fig. 7f). This result suggests that not all regions within the generating cells experience a significant phase change from liquid to ice, unless the ice-containing regions become dominated by ice.
Figure 8 shows the correlations of LWC and IWC with respect to the mixed spatial ratio or ice spatial ratio. A clear negative slope is seen in Fig. 8a–d, indicating that as the mixed spatial ratio or ice spatial ratio increases, the LWC decreases. On the contrary, a positive trend is seen in Fig. 8e, f, and h, indicating increasing IWC with an increasing mixed or ice spatial ratio. These results are consistent with the analysis of IPNF, showing that the increasing dominance of ice crystals in both mass and number concentrations is correlated with the increasing spatial ratio of ice-containing regions in cloud segments. Slope values in Fig. 8 illustrate that LWC decreases more significantly in LCR () than MCR () in phase 2. Phase 3 shows a more significant decrease in LWC by a factor of 3 compared with phase 2, with slope values and −0.692 in LCR and MCR, respectively. For the changes in IWC, the slope values are similar between MCR and ICR in phase 3 (b=1.358 and 1.261, respectively), while the slope value of IWC is slightly lower for MCR in phase 2 (b=0.969).
Figure 8i and j show the positive correlations of the ice mass fraction with respect to the mixed spatial ratio or ice spatial ratio for the entire phase 2 and phase 3, respectively. The ice mass fraction increases more rapidly with an increasing spatial fraction of ice-containing regions in phase 3 than in phase 2, with slope values of 1.013 and 0.238, respectively. This result indicates that when ice crystals first appear in MCR, the mass partitioning is still dominated by the liquid phase. As ice crystals grow into pure ice segments (i.e. ICR), the liquid phase starts to rapidly evolve into the ice phase. This result indicates that even though ice and supercooled liquid water coexist throughout the lifetime of mixed-phase clouds, the partition between them has different rates of phase change during different phases.
3.7 Comparison of three methods to define cloud thermodynamic phases
Thermodynamic phases of an in-cloud sample can be defined based on the relative dominance of ice crystals and supercooled liquid water. Three parameters are evaluated here – the ice spatial ratio that represents the macrophysical property of a TCR, ice mass fraction per second, and IPNF per second. The frequency distributions of these three metrics are shown for the four phases (Fig. 9a–c) and for all in-cloud conditions (Fig. 9d–f). The results show all three parameters have a bi-modal distribution that peaks at 0 and 1, indicating that most of the cloud segments are dominated by either liquid or ice, and a few of them have similar amounts of liquid and ice, regardless of whether cloud macrophysical or microphysical properties are used to define cloud thermodynamic phases. The number of samples associated with each parameter and cloud phase is shown in Fig. S7.
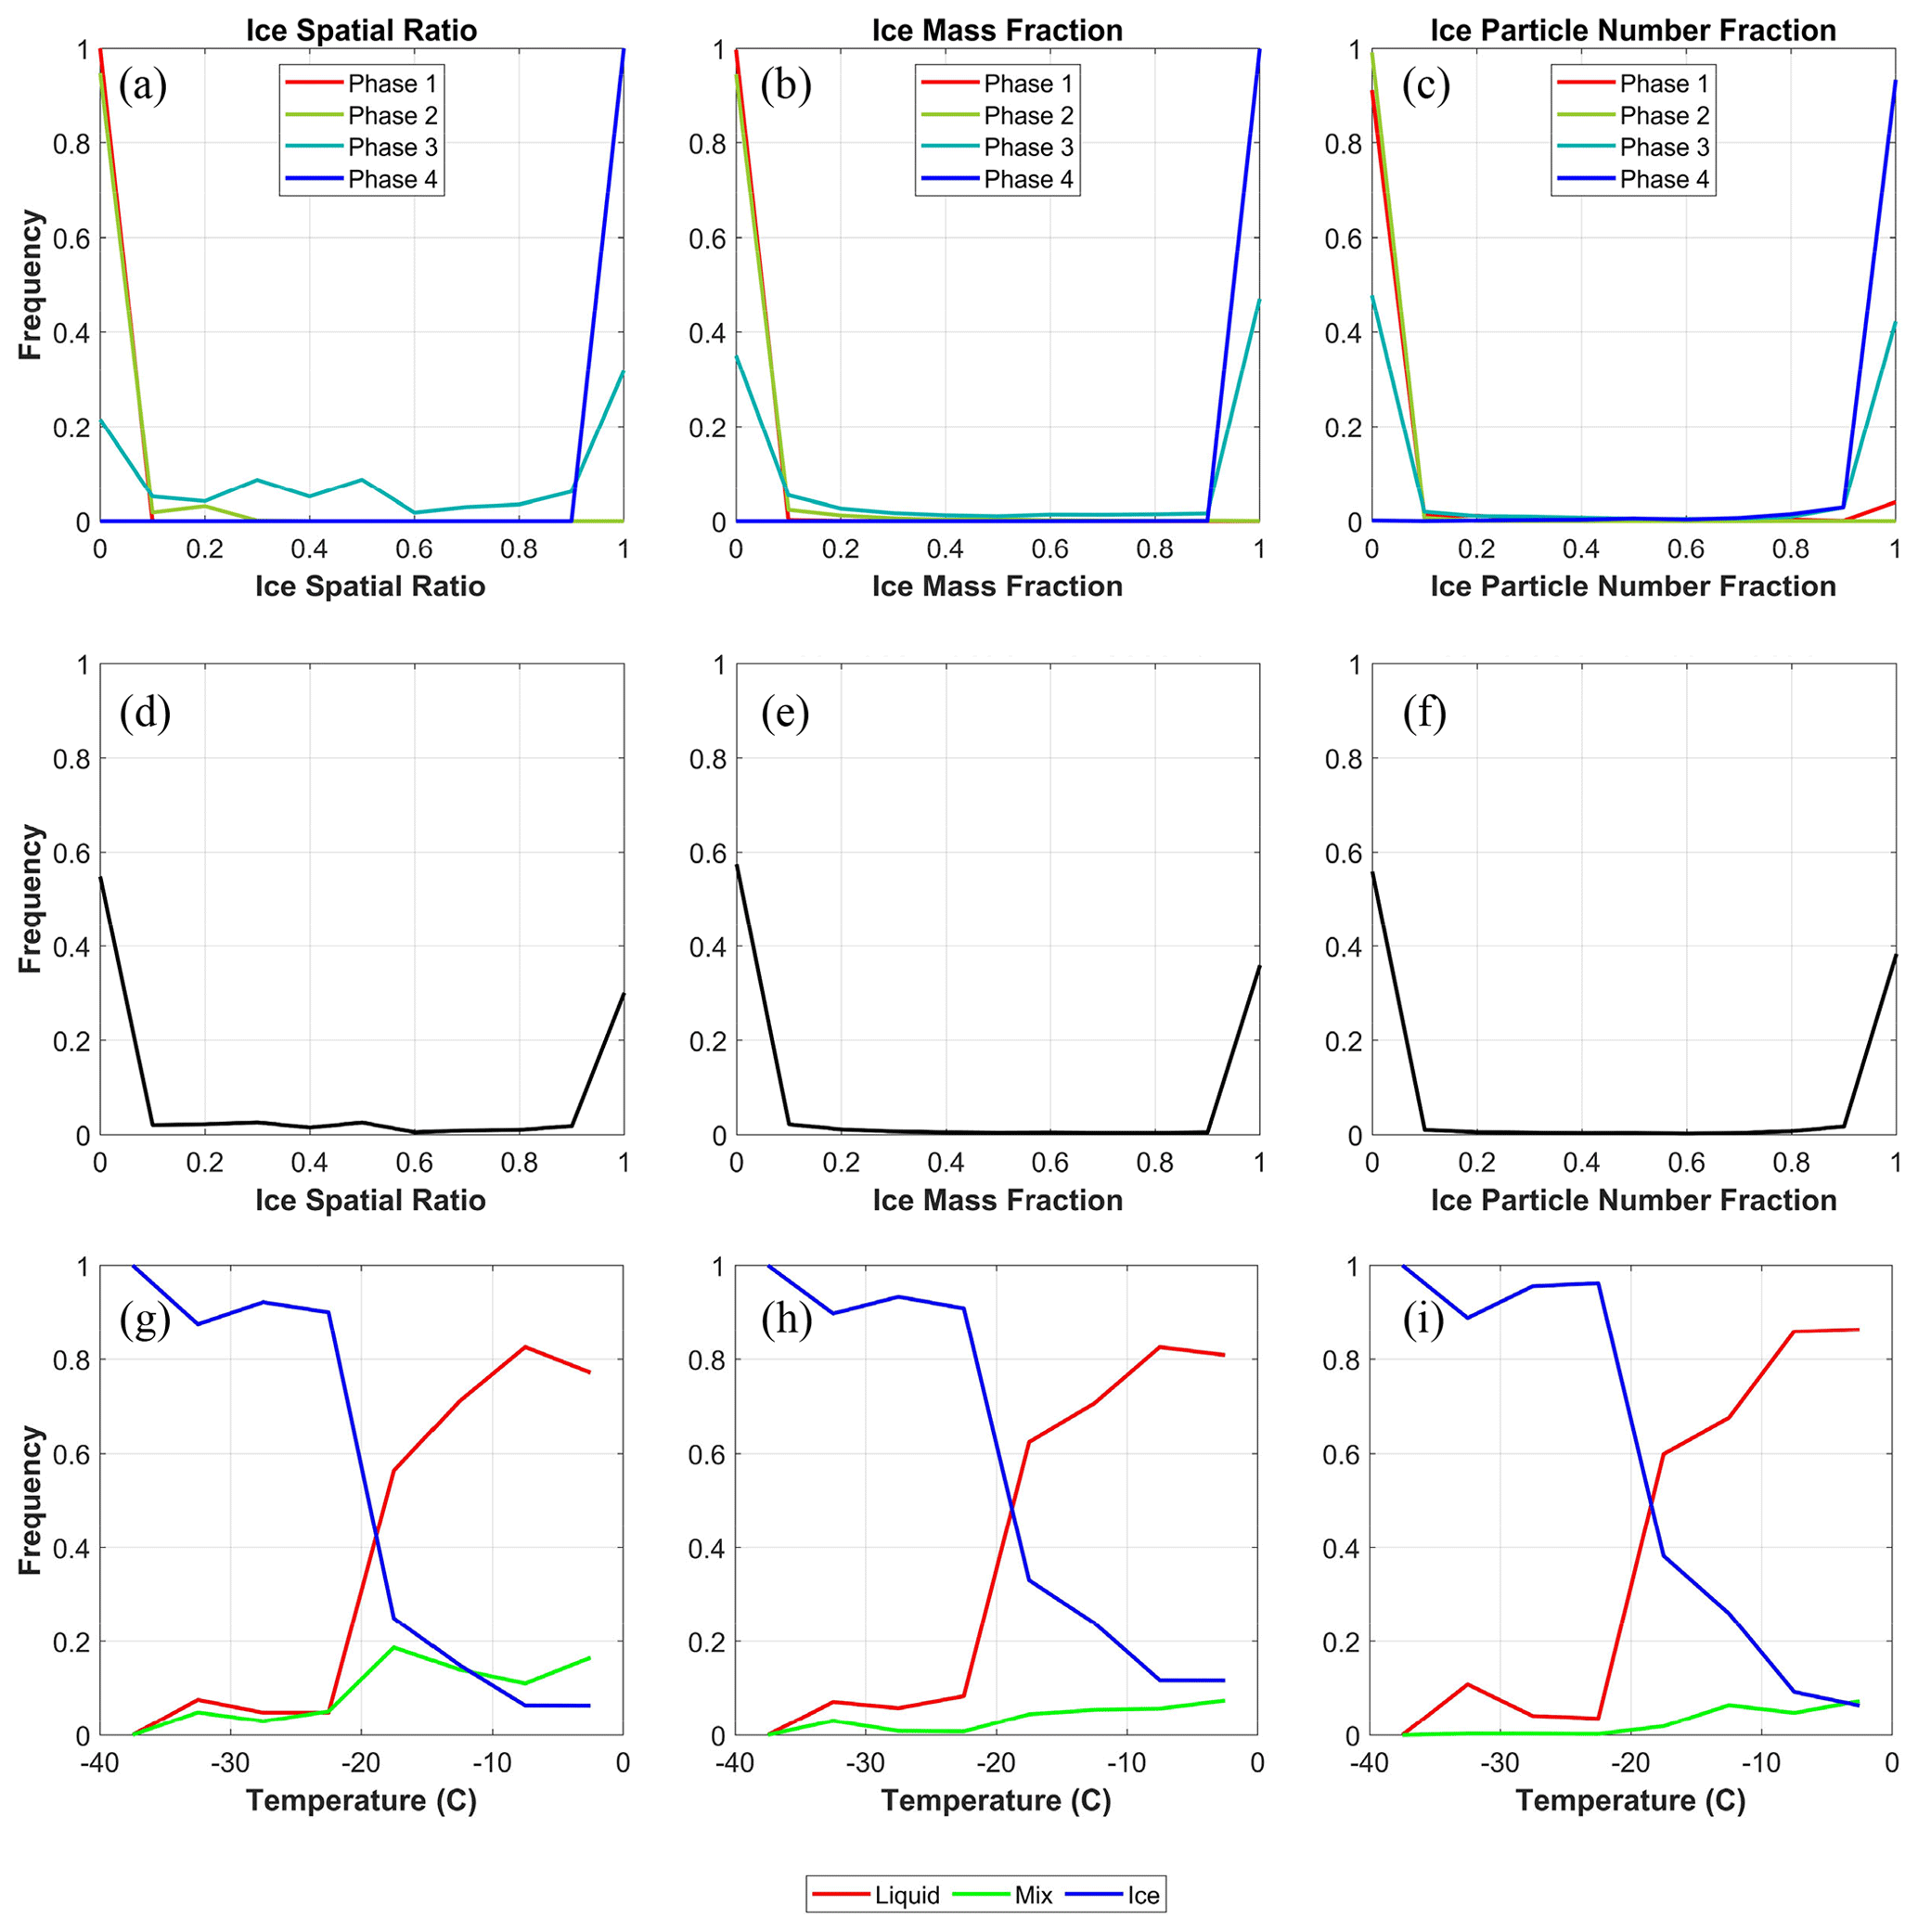
Figure 9Frequency distributions of (a) ice spatial ratios calculated for individual consecutive TCR, (b) ice mass fraction per second, and (c) IPNF per second for the four phases. (d–f) Similar to panels (a)–(c) but for the four phases combined, representing all in-cloud conditions, and (g–i) cloud phase frequency distributions defined based on the respective parameter in each column.
Using these three parameters, the distributions of three cloud thermodynamic phases (i.e. ice, liquid, and mixed) are compared among three types of definitions, including (i) cloud phases defined by the ice spatial ratio within each TCR using the method developed in this work. Liquid, mixed, and ice phases are defined as having an ice spatial ratio of an entire TCR of <0.1, 0.1–0.9, and >0.9, respectively. (ii) The second definition is the 1 Hz cloud phase distribution defined by the ice mass fraction (i.e. IWCTWC) derived for 1 s observations, i.e. liquid, mixed, and ice phases defined as having an ice mass fraction of < 0.1, 0.1–0.9, and > 0.9, respectively. This method of using the ice mass fraction to define mixed-phase clouds has been used in the cloud physics community for approximately 30 years (e.g. Korolev, 1998; Korolev et al., 2017, their Eq. 5-1 and references therein). (iii) The third definition is the cloud phase distribution defined by the majority of the hydrometeors by particle number concentrations using the combined CDP and 2DS data, i.e. the liquid (ice) phase defined as a second of data with more than 90 % (less than 10 %) of hydrometeor particle number concentrations being liquid droplets and the mixed phase defined as a second of data with 10 %–90 % of particle number concentrations being liquid droplets. To summarize, each of these three types of methods relies on a certain type of fraction of ice crystals relative to the total hydrometeors, either in terms of the spatial fraction relative to the entire cloud segment or in terms of 1 Hz mass fraction or 1 Hz particle number fraction. This concept of using various ice fractions to define cloud thermodynamic phases has been summarized in the review article by Korolev et al. (2017).
Figure 9g–i show the occurrence frequencies of cloud thermodynamic phases in relation to temperature compared among three types of definitions. The results show that all three methods have similar distributions of three cloud thermodynamic phases at temperatures from 0 to −40 °C, with the two definitions using ice mass fraction per second and ice number particle fraction per second being even closer to each other. For temperatures between −20 and 0 °C, the ice spatial ratio method has a slightly higher mixed-phase frequency (0.1–0.2) than the ice mass fraction and IPNF methods (∼ 0.05–0.1). Overall, all three methods show a significant transition from the liquid phase to the ice phase at a similar temperature of approximately −17.5 °C. This indicates that the major transition from liquid to ice is reflected in both cloud microphysical properties (i.e. mass partition and number partition) and cloud macrophysical properties (spatial extent partition). The rapid increase in occurrence of ice clouds in the temperature range of −15 to −20 °C has also been observed by previous studies (e.g. Wallace and Hobbs, 1977; Moss and Johnson, 1994).
3.8 Aerosol indirect effects on the evolution of mixed-phase clouds
The relationship between aerosol number concentration and the mixed spatial ratio or ice spatial ratio is examined in Fig. 10. Due to the possible complication of in-cloud measurements of aerosol number concentrations, we applied a moving average to calculate logarithmic scales of clear-sky aerosol concentrations every 50 s in Fig. 10. Furthermore, the average aerosol concentration is only analysed if more than half of the entire 50 s satisfies the criteria of in-cloud conditions. A coarser spatial averaging using the 100 s moving average of clear-sky conditions every 100 s is also shown in Fig. S8.
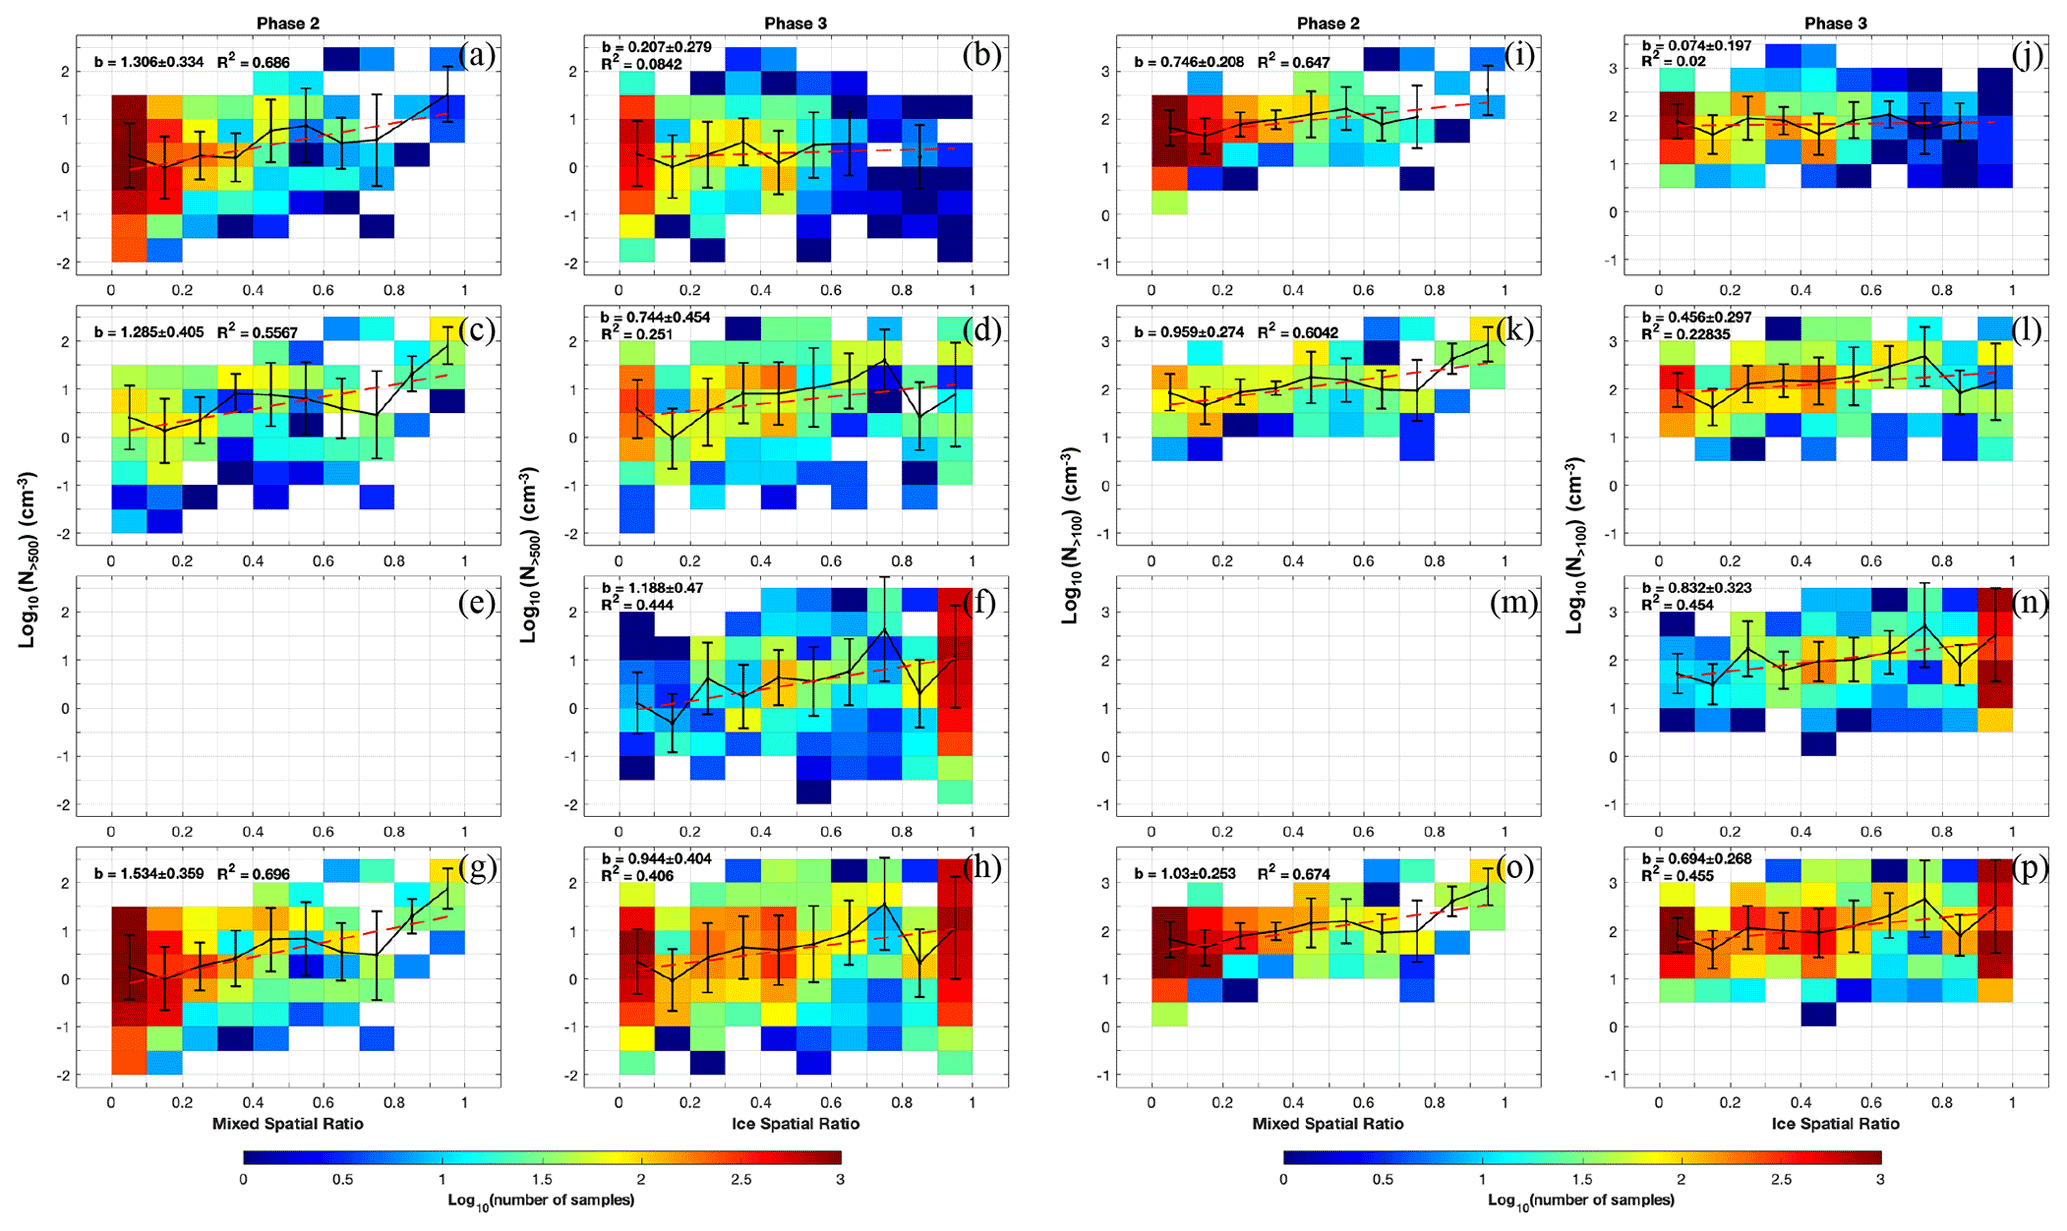
Figure 10Similar to Fig. 7 but showing logarithmic-scale (a–h) N>500 and (i–p) N>100 in relation to the mixed spatial ratio or ice spatial ratio, separated by the phases and cloud regions. The first, second, and third rows represent LCR, MCR, and ICR, respectively. The last row represents all cloud regions in a specific phase. The aerosol number concentrations represent the moving average values of every 50 s.
Number concentrations of larger aerosols (diameters > 500 nm, namely N>500) and smaller aerosols (diameters > 100 nm, namely N>100) are analysed in Fig. 10a–h and i–p, respectively. The slope values of the linear regressions show strong positive correlations between N>500 and the ice spatial ratio in phase 2 (Fig. 10g, b=1.534) when ice crystals just start to appear and are surrounded by supercooled liquid droplets. Such a positive correlation becomes weaker in phase 3 (Fig. 10h, b=0.944) when ICR starts to appear. The stronger positive correlation with N>500 in phase 2 is likely due to primary ice nucleation (such as heterogeneous nucleation) playing a major role in phase 2 when ice crystals first start to appear. On the other hand, secondary ice production may occur more frequently in phase 3, and secondary ice production via rime splintering is less effective when concentrations of cloud condensation nuclei are higher. For the correlations with N>100, a positive trend is still seen with respect to the ice spatial ratio in MCR and ICR, indicating possible pathways of ice formation via condensation freezing and immersion freezing assisted by smaller aerosols. Overall, the weaker positive correlations with N>100 in MCR and ICR compared with N>500 indicate that larger aerosols play a more dominant role in initiating ice nucleation than smaller aerosols. Stronger positive correlations between IWC and N>500 compared with N>100 are also shown in the work by Yang et al. (2021), although they did not differentiate between the four phases of clouds or examine aerosol indirect effects in relation to cloud macrophysical properties, i.e. the spatial expansion of ice-containing cloud segments.
Mixed-phase clouds are ubiquitous in the atmosphere. In order to fully capture the extent of their impacts on Earth's climate, more studies need to be conducted in order to investigate their formation, evolution, and aerosol effects on their microphysical and macrophysical characteristics. Therefore, in this study, a novel method that categorizes mixed-phase clouds into four phases, which represent different conditions of partition between liquid and ice, was presented. This method allows for an investigation into cloud macrophysical and microphysical properties as well as the related aerosol indirect effects at different levels of partitioning between supercooled liquid water and ice particles, as the phase change occurs among the vapour, liquid, and solid phases of water molecules.
The relationships between microphysical and macrophysical properties are examined, which addresses the question of whether the dominance of ice crystals in hydrometeor mass or number concentration also leads to the dominance of ice-containing regions in a consecutive in-cloud segment. Two spatial extent parameters – the mixed spatial ratio and ice spatial ratio – are used to quantify the spatial distributions of hydrometeors within supercooled liquid-water-dominant and ice-dominant mixed-phase clouds. Positive correlations of IPNF and IWC in relation to the mixed spatial ratio and ice spatial ratio are seen in both phase 2 and phase 3, respectively. Comparing phases 2 and 3, the latter phase shows higher rates of changes in four microphysical properties with an increasing ice spatial ratio, including faster increase in IPNF, faster increase in IWC, faster decrease in LWC, and faster increase in ice mass fraction (Figs. 7 and 8). These results indicate that when ice crystals become more dominant and pure ice segments start to appear, both the mass partition and the number partition between the liquid phase and ice phase experience a higher rate of phase change with respect to the spatial ratio of ice-containing regions (note that this rate of change is not with respect to time).
The correlations between various cloud macro- and microphysical properties are further demonstrated by using three methods to define ice, liquid, and mixed phases. We followed the generic definition of mixed-phase clouds described in Korolev (1998) and Korolev et al. (2017), , where μice is the ice-phase fraction, and αice and αliq are specific cloud microphysical properties. We examined αice as the ice mass fraction or IPNF at 1 Hz resolution but also extended the definition to include αice as the ice spatial ratio in a consecutive cloud segment, which is a macrophysical property that has not been investigated before. All three methods follow the same thresholds of < 0.1, 0.1–0.9, and > 0.9 to separate μice into liquid, mixed, and ice phases, respectively. As a result, all three methods identify a significant transition from liquid to ice around a similar temperature of −17.5 °C. A minor difference between the three methods is that the mixed-phase cloud frequency between −20 and 0 °C is slightly higher when defined by the ice number fraction and ice spatial ratio (0.1–0.2) compared with that defined by the ice mass fraction and IPNF (0.05–0.1). Such a comparison of various phase definition methods indicates that a spatial-extent-based cloud phase identification method, such as using the number of pixels in remote sensing data by Yip et al. (2021), Desai et al. (2023), Wang et al. (2024), and Barone et al. (2024), can produce similar statistical distributions of liquid and ice phases compared with other methods based on the ice mass fraction, e.g. D'Alessandro et al. (2019) and Yang et al. (2021). However, the spatial-extent-based method produces a slightly higher mixed-phase cloud frequency. Future analysis of cloud phase distributions based on different types of observation techniques and model simulations is recommended to quantify differences caused by various definitions of cloud thermodynamic phases in the consideration of this comparison result, especially when evaluating model output against observations using different definitions of mixed-phase clouds.
Differing from previous studies on the coexistence of ice crystals and supercooled liquid water, the method presented in this work allows one to compare the cloud segments when ice crystals are surrounded by supercooled liquid water in MCR with those when pure ICR starts to appear. Aerosol indirect effects on mixed-phase clouds during different levels of phase partitioning can also be examined separately. In both phases 2 and 3, N>500 shows stronger positive correlations with the mixed spatial ratio and ice spatial ratio compared with N>100. This indicates that the larger aerosols are more likely to act as INPs to initiate primary ice nucleation. Phase 3 shows a slightly weaker positive correlation of the ice spatial ratio with aerosol number concentrations (i.e. N>500 and N>100) compared with phase 2, indicating that the aerosol indirect effects are more prominent when ice crystals first start to appear amongst supercooled liquid water in MCR. Such weaker aerosol indirect effects in phase 3 are possibly due to a competition between the positive correlation of primary ice nucleation with aerosol number concentrations and the negative correlation of secondary ice production with aerosol number concentrations. When pure ice segments (ICR) start to appear, it is possible that secondary ice production plays a more important role, and therefore the net aerosol indirect effects become weaker.
Thermodynamic and dynamic conditions are examined for each phase, especially for the key stage of mixed-phase clouds – the maintenance of supercooled liquid droplets when they coexist with ice. Previously, several dynamic mechanisms were proposed in the study of Korolev and Field (2008), highlighting the critical thresholds of vertical motion for sustaining supercooled liquid water. Our analysis shows that both higher updraughts and stronger in-cloud turbulence are more frequently observed in phases containing both ice and liquid (i.e. phases 2 and 3) compared with the pure liquid or pure ice phase (i.e. phases 1 and 4, respectively). Even higher updraughts and turbulence are seen in phase 3 when pure ice segments start to appear, compared with phase 2 with only mixed-phase segments, indicating that higher updraughts are needed to sustain supercooled liquid water when they are surrounded by ice-dominated segments. This observation-based method can be used to assess the contribution from different dynamic mechanisms in maintaining different evolution stages of mixed-phase clouds in various field campaigns.
Parameterizations of mixed-phase clouds in climate models often rely on a tunable parameter that can modify the mixing volume between ice and liquid (e.g. Tan and Storelvmo, 2016; Zhang et al., 2019). In other words, the model parameterization assumes that when ice crystals are mixed more uniformly among supercooled liquid water within a model grid box (i.e. when the mixed spatial ratio or ice spatial ratio is higher), the WBF process become more effective, and the transition from liquid to ice would be faster. This study illustrates that the mass partitioning and number partitioning between liquid and ice hydrometeors in mixed-phase clouds are not only correlated with the mixed spatial ratio or ice spatial ratio, which reflects the spatial fraction of ice-containing regions, but also correlated with the existence of pure ice segments (Figs. 7 and 8). Future model parameterization is recommended to quantify the varying rates of phase change throughout a cloud's lifetime by considering two main factors – the type of phases (especially phase 2 versus phase 3 depending on the existence of pure ice segments) and the spatial fraction of the ice-containing region.
Overall, the method proposed in this work provides a unique perspective to assess mixed-phase cloud properties from both macrophysical and microphysical perspectives, especially for phases when supercooled liquid droplets and ice particles coexist. Such partition can be reflected in the particle number fraction, mass fraction, and spatial ratio. We note that this is an idealized method with its own caveats. For example, the evolution of mixed-phase clouds may not always follow a simple direction from phase 1 to 4. In addition, the aircraft observations used here only capture the 1D structure of a cloud segment, while cloud layers above and below the aircraft flight track may show a different ice spatial ratio in a 2D or 3D view. Nevertheless, this method helps to provide a statistical categorization of different phases of mixed-phase clouds solely based on an Eulerian-view sampling of aircraft data. Future studies may derive such statistical distributions of phases based on 2D remote sensing observations and 3D model simulations. Examining individual phases of mixed-phase clouds may also provide more direct comparisons between observations and simulations.
Observations from the NSF SOCRATES campaign are accessible at https://doi.org/10.5065/D6M32TM9 (UCAR/NCAR- Earth Observing Laboratory, 2022).
The supplement related to this article is available online at: https://doi.org/10.5194/amt-17-4843-2024-supplement.
FVM, MD, and CAY contributed to the development of the ideas, conducted quality control on aircraft-based observations, and conducted data analysis. FVM and MD wrote the paper.
The contact author has declared that none of the authors has any competing interests.
Publisher's note: Copernicus Publications remains neutral with regard to jurisdictional claims made in the text, published maps, institutional affiliations, or any other geographical representation in this paper. While Copernicus Publications makes every effort to include appropriate place names, the final responsibility lies with the authors.
Flor Vanessa Maciel, Ching An Yang, and Minghui Diao acknowledge funding from the NSF OPP (no. 1744965). Minghui Diao acknowledges funding support from the US Department of Energy (DOE) Atmospheric System Research (ASR) (grant no. DE-SC0021211) and RDPP (grant no. DE-SC0023155). Ching An Yang and Minghui Diao acknowledge funding from the SJSU Division of Research and Innovation (award no. 22-LUG-08-006). Flor Vanessa Maciel and Ching An Yang also acknowledge support from the San Jose State University Walker Fellowship.
This research has been supported by the National Science Foundation, Directorate for Geosciences (grant no. NSF OPP-1744965); US Department of Energy (DOE) Atmospheric System Research (ASR) (grant no. DE-SC0021211); US DOE RDPP (grant no. DESC0023155); SJSU Division of Research and Innovation (award no. 22-LUG-08-006); and San Jose State University Walker Fellowship.
This paper was edited by Zamin A. Kanji and reviewed by Alexei Korolev and five anonymous referees.
American Meteorological Society: Generating cell Glossary of Meteorology, http://glossary.ametsoc.org/wiki/generating_cell (last access: 10 August 2024), 2024.
Atlas, R., Mohrmann, J., Finlon, J., Lu, J., Hsiao, I., Wood, R., and Diao, M.: The University of Washington Ice–Liquid Discriminator (UWILD) improves single-particle phase classifications of hydrometeors within Southern Ocean clouds using machine learning, Atmos. Meas. Tech., 14, 7079–7101, https://doi.org/10.5194/amt-14-7079-2021, 2021.
Avramov, A., Ackerman, A. S., Fridlind, A. M., Van Diedenhoven, B., Botta, G., Aydin, K., Verlinde, J., Korolev, A. V., Strapp, J. W., McFarquhar, G. M., Jackson, R., Brooks, S. D., Glen, A., and Wolde, M.: Toward ice formation closure in Arctic mixed-phase boundary layer clouds during ISDAC, J. Geophys. Res.-Atmos., 116, D00T08, https://doi.org/10.1029/2011JD015910, 2011.
Barone, T., Diao, M., Shi, Y., Zhao, X., Liu, X., and Silber, I.: Impacts of synoptic‐scale dynamics on clouds and radiation in high southern latitudes, J. Geophys. Res.-Atmos., 129, e2023JD040329, https://doi.org/10.1029/2023JD040329, 2024.
Baumgardner, D., Abel, S. J., Axisa, D., Cotton, R., Crosier, J., Field, P., Gurganus, C., Heymsfield, A., Korolev, A., Krämer, M., Lawson, P., McFarquhar, G., Ulanowski, Z., and Um, J.: Cloud Ice Properties: In Situ Measurement Challenges, Meteor. Mon., 58, 9.1–9.23, https://doi.org/10.1175/AMSMONOGRAPHS-D-16-0011.1, 2017.
Bühl, J., Seifert, P., Engelmann, R., and Ansmann, A.: Impact of vertical air motions on ice formation rate in mixed-phase cloud layers, npj Clim. Atmos. Sci., 2, 36, https://doi.org/10.1038/s41612-019-0092-6, 2019.
D'Alessandro, J. J., Diao, M., Wu, C., Liu, X., Jensen, J. B., and Stephens, B. B.: Cloud phase and relative humidity distributions over the Southern Ocean in austral summer based on in situ observations and CAM5 simulations, J. Climate, 32, 2781–2805, https://doi.org/10.1175/JCLI-D-18-0232.1, 2019.
D'Alessandro, J. J., McFarquhar, G. M., Wu, W., Stith, J. L., Jensen, J. B., and Rauber, R. M.: Characterizing the Occurrence and Spatial Heterogeneity of Liquid, Ice, and Mixed Phase Low-Level Clouds Over the Southern Ocean Using in Situ Observations Acquired During SOCRATES, J. Geophys. Res.-Atmos., 126, 1–18, https://doi.org/10.1029/2020JD034482, 2021.
D'Alessandro, J. J., McFarquhar, G. M., Stith, J. L., Diao, M., DeMott, P. J., McCluskey, C. S., Hill, T. C. J., Roberts, G. C., and Sanchez, K. J.: An evaluation of phase, aerosol-cloud interactions and microphysical properties of single- and multi-layer clouds over the Southern Ocean using in situ observations from SOCRATES, J. Geophys. Res.-Atmos., 128, e2023JD038610, https://doi.org/10.1029/2023JD038610, 2023.
DeMott, P. J., Prenni, A. J., Liu, X., Kreidenweis, S. M., Petters, M. D., Twohy, C. H., Richardson, M. S., Eidhammer, T., and Rogers, D. C.: Predicting global atmospheric ice nuclei distributions and their impacts on climate, P. Natl. Acad. Sci. USA, 107, 11217–11222, https://doi.org/10.1073/pnas.0910818107, 2010.
Desai, N., Diao, M., Shi, Y., Liu, X., and Silber, I.: Ship-based observations and climate model simulations of cloud phase over the Southern Ocean, J. Geophys. Res.-Atmos., 128, e2023JD038581, https://doi.org/10.1029/2023JD038581, 2023.
Diao, M.: VCSEL 1 Hz Water Vapor Data, Version 2.0, UCAR/NCAR - Earth Observing Laboratory [data set], https://doi.org/10.26023/KFSD-Y8DQ-YC0D, 2021.
Diao, M., Jensen, J. B., Pan, L. L., Homeyer, C. R., Honomichl, S., Bresch, J. F., and Bansemer, A.: Distributions of ice supersaturation and ice crystals from airborne observations in relation to upper tropospheric dynamical boundaries, J. Geophys. Res.-Atmos., 120, 5101–5121, https://doi.org/10.1002/2015JD023139, 2015.
Fan, J., Ovtchinnikov, M., Comstock, J. M., McFarlane, S. A., and Khain, A.: Ice formation in Arctic mixed-phase clouds: Insights from a 3-D cloud-resolving model with size-resolved aerosol and cloud microphysics, J. Geophys. Res., 114, D04205, https://doi.org/10.1029/2008JD010782, 2009.
Fan, J., Ghan, S., Ovchinnikov, M., Liu, X., Rasch, P. J., and Korolev, A.: Representation of Arctic mixed-phase clouds and the Wegener-Bergeron-Findeisen process in climate models: Perspectives from a cloud-resolving study, J. Geophys. Res.-Atmos., 116, D00T07, https://doi.org/10.1029/2010JD015375, 2011.
Field, P. R., Hogan, R. J., Brown, P. R. A., Illingworth, A. J., Choularton, T. W., Kaye, P. H., Hirst, E., and Greenaway, R.: Simultaneous radar and aircraft observations of mixed-phase cloud at the 100 m scale, Q. J. Roy. Meteor. Soc., 130, 1877–1904, https://doi.org/10.1256/QJ.03.102, 2004.
Field, P. R., Hill, A. A., Furtado, K., and Korolev, A.: Mixed-phase clouds in a turbulent environment. Part 2: Analytic treatment, Q. J. Roy. Meteor. Soc., 140, 870–880, https://doi.org/10.1002/QJ.2175, 2014.
Hill, A. A., Field, P. R., Furtado, K., Korolev, A., and Shipway, B. J.: Mixed-phase clouds in a turbulent environment. Part 1: Large-eddy simulation experiments, Q. J. Roy. Meteor. Soc., 140, 855–869, https://doi.org/10.1002/QJ.2177, 2014.
Hobbs, P. V. and Rangno, A. L.: Ice Particle Concentrations in Clouds, J. Atmos. Sci., 42, 2523–2549, https://doi.org/10.1175/1520-0469(1985)042<2523:IPCIC>2.0.CO;2, 1985.
Hogan, R. J., Field, P. R., Illingworth, A. J., Cotton, R. J., and Choularton, T. W.: Properties of embedded convection in warm-frontal mixed-phase cloud from aircraft and polarimetric radar, Q. J. Roy. Meteor. Soc., 128, 451–476, https://doi.org/10.1256/003590002321042054, 2002.
Huang, Y., Chubb, T., Baumgardner, D., DeHoog, M., Siems, S. T., and Manton, M. J.: Evidence for secondary ice production in Southern Ocean open cellular convection, Q. J. Roy. Meteor. Soc., 143, 1685–1703, https://doi.org/10.1002/qj.3041, 2017.
Hyder, P., Edwards, J. M., Allan, R. P., Hewitt, H. T., Bracegirdle, T. J., Gregory, J. M., Wood, R. A., Meijers, A. J. S., Mulcahy, J., Field, P., Furtado, K., Bodas-Salcedo, A., Williams, K. D., Copsey, D., Josey, S. A., Liu, C., Roberts, C. D., Sanchez, C., Ridley, J., Thorpe, L., Hardiman, S. C., Mayer, M., Berry, D. I., and Belcher, S. E.: Critical Southern Ocean climate model biases traced to atmospheric model cloud errors, Nat. Commun., 9, 3625, https://doi.org/10.1038/s41467-018-05634-2, 2018.
Jackson, R. C., McFarquhar, G. M., Korolev, A. V, Earle, M. E., Liu, P. S. K., Lawson, R. P., Brooks, S., Wolde, M., Laskin, A., and Freer, M.: The dependence of ice microphysics on aerosol concentration in arctic mixed-phase stratus clouds during ISDAC and M-PACE, J. Geophys. Res.-Atmos., 117, 1–20, https://doi.org/10.1029/2012JD017668, 2012.
Järvinen, E., McCluskey, C. S., Waitz, F., Schnaiter, M., Bansemer, A., Bardeen, C. G., Gettelman, A., Heymsfield, A., Stith, J. L., Wu, W., D'Alessandro, J. J., McFarquhar, G. M., Diao, M., Finlon, J. A., Hill, T. C. J., Levin, E. J. T., Moore, K. A., and DeMott, P. J.: Evidence for Secondary Ice Production in Southern Ocean Maritime Boundary Layer Clouds, J. Geophys. Res.-Atmos., 127, 1–31, https://doi.org/10.1029/2021JD036411, 2022.
Korolev, A. V.: About Definition of Liquid, Mixed and Ice Clouds, FAA Workshop on Mixed-Phase and Glaciated Icing Conditions, Atlantic City, NJ, 2–3 December 1998, Federal Aviation Authority, Atlantic City, NJ, USA, 325–326, 1998.
Korolev, A. V. and Field, P. R.: The Effect of Dynamics on Mixed-Phase Clouds: Theoretical Considerations, J. Atmos. Sci., 65, 66–86, https://doi.org/10.1175/2007JAS2355.1, 2008.
Korolev, A. V. and Isaac, G. A.: Relative Humidity in Liquid, Mixed-Phase, and Ice Clouds, J. Atmos. Sci., 63, 2865–2880, https://doi.org/10.1175/JAS3784.1, 2006.
Korolev, A. V. and Mazin, I. P.: Supersaturation of water vapor in clouds, J. Atmos. Sci., 60, 2957–2974, https://doi.org/10.1175/1520-0469(2003)060<2957:SOWVIC>2.0.CO;2, 2003.
Korolev, A. V. and Milbrandt, J.: How Are Mixed-Phase Clouds Mixed?, Geophys. Res. Lett., 49, 1–7, https://doi.org/10.1029/2022GL099578, 2022.
Korolev, A. V., Isaac, G. A., Cober, S. G., Strapp, J. W., and Hallett, J.: Microphysical characterization of mixed-phase clouds, Q. J. Roy. Meteor. Soc., 129, 39–65, https://doi.org/10.1256/qj.01.204, 2003.
Korolev, A. V., Emery, E. F., Strapp, J. W., Cober, S. G., and Isaac, G. A.: Quantification of the effects of shattering on airborne ice particle measurements, J. Atmos. Ocean. Tech., 30, 2527–2553, https://doi.org/10.1175/JTECH-D-13-00115.1, 2013.
Korolev, A. V., McFarquhar, G., Field, P. R., Franklin, C., Lawson, P., Wang, Z., Williams, E., Abel, S. J., Axisa, D., Borrmann, S., Crosier, J., Fugal, J., Krämer, M., Lohmann, U., Schlenczek, O., Schnaiter, M., and Wendisch, M.: Mixed-Phase Clouds: Progress and Challenges, Meteor. Mon., 58, 5.1–5.50, https://doi.org/10.1175/AMSMONOGRAPHS-D-17-0001.1, 2017.
Matus, A. V and L'Ecuyer, T. S.: The role of cloud phase in Earth's radiation budget, J. Geophys. Res.-Atmos., 122, 2559–2578, https://doi.org/10.1002/2016JD025951, 2017.
McCluskey, C. S., Hill, T. C. J., Humphries, R. S., Rauker, A. M., Moreau, S., Strutton, P. G., Chambers, S. D., Williams, A. G., McRobert, I., Ward, J., Keywood, M. D., Harnwell, J., Ponsonby, W., Loh, Z. M., Krummel, P. B., Protat, A., Kreidenweis, S. M., and DeMott, P. J.: Observations of Ice Nucleating Particles Over Southern Ocean Waters, Geophys. Res. Lett., 45, 11989–11997, https://doi.org/10.1029/2018GL079981, 2018.
McFarquhar, G. M., Bretherton, C. S., Marchand, R., Protat, A., DeMott, P. J., Alexander, S. P., Roberts, G. C., Twohy, C. H., Toohey, D., Siems, S., Huang, Y., Wood, R., Rauber, R. M., Lasher-Trapp, S., Jensen, J., Stith, J. L., Mace, J., Um, J., Järvinen, E., Schnaiter, M., Gettelman, A., Sanchez, K. J., McCluskey, C. S., Russell, L. M., McCoy, I. L., Atlas, R. L., Bardeen, C. G., Moore, K. A., Hill, T. C. J., Humphries, R. S., Keywood, M. D., Ristovski, Z., Cravigan, L., Schofield, R., Fairall, C., Mallet, M. D., Kreidenweis, S. M., Rainwater, B., D'Alessandro, J., Wang, Y., Wu, W., Saliba, G., Levin, E. J. T., Ding, S., Lang, F., Truong, S. C. H., Wolff, C., Haggerty, J., Harvey, M. J., Klekociuk, A. R., and McDonald, A.: Observations of Clouds, Aerosols, Precipitation, and Surface Radiation over the Southern Ocean: An Overview of CAPRICORN, MARCUS, MICRE, and SOCRATES, B. Am. Meteorol. Soc., 102, E894–E928, https://doi.org/10.1175/BAMS-D-20-0132.1, 2021.
Mohrmann, J., Finlon, J., Atlas, R., Lu, J., Hsiao, I., and Wood, R.: University of Washington Ice-Liquid Discriminator single particle phase classifications and 1 Hz particle size distributions/heterogeneity estimate, Version 1.0, UCAR/NCAR – Earth Observing Laboratory [data set], https://doi.org/10.26023/PA5W-4DRX-W50A, 2021.
Morrison, H., de Boer, G., Feingold, G., Harrington, J., Shupe, M. D., and Sulia, K.: Resilience of persistent Arctic mixed-phase clouds, Nat. Geosci., 5, 11–17, https://doi.org/10.1038/ngeo1332, 2012.
Moss, S. J. and Johnson, D. W.: Aircraft measurements to validate and improve numerical model parametrisations of ice to water ratios in clouds, Atmos. Res., 34, 1–25, https://doi.org/10.1016/0169-8095(94)90078-7, 1994.
Murphy, D. M. and Koop, T.: Review of the vapour pressures of ice and supercooled water for atmospheric applications, Q. J. Roy. Meteor. Soc., 131, 1539–1565, https://doi.org/10.1256/qj.04.94, 2005.
Norgren, M. S., de Boer, G., and Shupe, M. D.: Observed aerosol suppression of cloud ice in low-level Arctic mixed-phase clouds, Atmos. Chem. Phys., 18, 13345–13361, https://doi.org/10.5194/acp-18-13345-2018, 2018.
Pinto, J. O.: Autumnal mixed-phase cloudy boundary layers in the arctic, J. Atmos. Sci., 55, 2016–2038, https://doi.org/10.1175/1520-0469(1998)055<2016:AMPCBL>2.0.CO;2, 1998.
Qiu, S., Xi, B., and Dong, X.: Influence of Wind Direction on Thermodynamic Properties and Arctic Mixed-Phase Clouds in Autumn at Utqiaġvik, Alaska, J. Geophys. Res.-Atmos., 123, 9589–9603, https://doi.org/10.1029/2018JD028631, 2018.
Rauber, R. M. and Tokay, A.: An Explanation for the Existence of Supercooled Water at the Top of Cold Clouds, J. Atmos. Sci., 48, 1005–1023, https://doi.org/10.1175/1520-0469(1991)048<1005:AEFTEO>2.0.CO;2, 1991.
Romatschke, U. and Vivekanandan, J.: Cloud and precipitation particle identification using cloud radar and lidar measurements: Retrieval technique and validation, Earth and Space Science, 9, e2022EA002299, https://doi.org/10.1029/2022EA002299, 2022.
Shupe, M. D., Kollias, P., Persson, P. O. G., and McFarquhar, G. M.: Vertical Motions in Arctic Mixed-Phase Stratiform Clouds, J. Atmos. Sci., 65, 1304–1322, https://doi.org/10.1175/2007JAS2479.1, 2008.
Smith, A. J., Larson, V. E., Niu, J., Kankiewicz, J. A., and Carey, L. D.: Processes that generate and deplete liquid water and snow in thin midlevel mixed-phase clouds, J. Geophys. Res.-Atmos., 114, 1–18, https://doi.org/10.1029/2008JD011531, 2009.
Storelvmo, T.: Aerosol Effects on Climate via Mixed-Phase and Ice Clouds, Annu. Rev. Earth Pl. Sc., 45, 199–222, https://doi.org/10.1146/annurev-earth-060115-012240, 2017.
Tan, I. and Storelvmo, T.: Sensitivity Study on the Influence of Cloud Microphysical Parameters on Mixed-Phase Cloud Thermodynamic Phase Partitioning in CAM5, J. Atmos. Sci., 73, 709–728, https://doi.org/10.1175/JAS-D-15-0152.1, 2016.
Tan, I., Storelvmo, T., and Zelinka, M. D.: Observational constraints on mixed-phase clouds imply higher climate sensitivity, Science, 352, 224–227, https://doi.org/10.1126/science.aad5300, 2016.
UCAR/NCAR - Earth Observing Laboratory: SOCRATES: Low Rate (LRT - 1 sps) Navigation, State Parameter, and Microphysics Flight-Level Data, Version 1.4, UCAR/NCAR - Earth Observing Laboratory [data set], https://doi.org/10.5065/D6M32TM9, 2022.
Wallace, J. M. and Hobbs, P. V.: Atmospheric Science: An Introductory Survey, Elsevier Inc., New York, USA, https://doi.org/10.1016/C2009-0-00034-8, 1977.
Wang, D., Yang, C. A., and Diao, M.: Validation of satellite-based cloud phase distributions using global-scale in situ airborne observations, Earth and Space Science, 11, e2023EA003355, https://doi.org/10.1029/2023EA003355, 2024.
Wang, Y., McFarquhar, G. M., Rauber, R. M., Zhao, C., Wu, W., Finlon, J. A., Stechman, D. M., Stith, J., Jensen, J. B., Schnaiter, M., Järvinen, E., Waitz, F., Vivekanandan, J., Dixon, M., Rainwater, B., and Toohey, D. W.: Microphysical Properties of Generating Cells Over the Southern Ocean: Results From SOCRATES, J. Geophys. Res.-Atmos., 125, 1–23, https://doi.org/10.1029/2019JD032237, 2020.
Wang, Z., French, J., Vali, G., Wechsler, P., Haimov, S., Rodi, A., Deng, M., Leon, D., Snider, J., Peng, L., and Pazmany, A. L.: Single Aircraft Integration of Remote Sensing and In Situ Sampling for the Study of Cloud Microphysics and Dynamics, B. Am. Meteorol. Soc., 93, 653–668, https://doi.org/10.1175/BAMS-D-11-00044.1, 2012.
Westbrook, C. D. and Illingworth, A. J.: Evidence that ice forms primarily in supercooled liquid clouds at temperatures °C, Geophys. Res. Lett., 38, 1–4, https://doi.org/10.1029/2011GL048021, 2011.
Wood, R. and Field, P. R.: The Distribution of Cloud Horizontal Sizes, J. Climate, 24, 4800–4816, https://doi.org/10.1175/2011JCLI4056.1, 2011.
Wu, W. and McFarquhar, G. M.: On the impacts of different definitions of maximum dimension for nonspherical particles recorded by 2D imaging probes, J. Atmos. Ocean. Tech., 33, 1057–1072, https://doi.org/10.1175/JTECH-D-15-0177.1, 2016.
Yang, C. A., Diao, M., Gettelman, A., Zhang, K., Sun, J., McFarquhar, G., and Wu, W.: Ice and Supercooled Liquid Water Distributions Over the Southern Ocean Based on In Situ Observations and Climate Model Simulations, J. Geophys. Res.-Atmos., 126, e2021JD036045, https://doi.org/10.1029/2021JD036045, 2021.
Yip, J., Diao, M., Silber, I., and Gettelman, A.: Evaluation of the CAM6 Climate Model Using Cloud Observations at McMurdo Station, Antarctica, J. Geophys. Res.-Atmos., 126, 1–21, https://doi.org/10.1029/2021JD034653, 2021.
Zaremba, T. J., Rauber, R. M., McFarquhar, G. M., Hayman, M., Finlon, J. A., and Stechman, D. M.: Phase Characterization of Cold Sector Southern Ocean Cloud Tops: Results From SOCRATES, J. Geophys. Res.-Atmos., 125, e2020JD033673, https://doi.org/10.1029/2020JD033673, 2020.
Zhang, M., Liu, X., Diao, M., D'Alessandro, J. J., Wang, Y., Wu, C., Zhang, D., Wang, Z., and Xie, S.: Impacts of Representing Heterogeneous Distribution of Cloud Liquid and Ice on Phase Partitioning of Arctic Mixed-Phase Clouds with NCAR CAM5, J. Geophys. Res.-Atmos., 124, 13071–13090, https://doi.org/10.1029/2019JD030502, 2019.
Zhao, X. and Liu, X.: Global Importance of Secondary Ice Production, Geophys. Res. Lett., 48, 1–11, https://doi.org/10.1029/2021GL092581, 2021.
Zhao, X., Liu, X., Burrows, S., DeMott, P. J., Diao, M., McFarquhar, G. M., Patade, S., Phillips, V., Roberts, G. C., Sanchez, K. J., Shi, Y., and Zhang, M.: Important ice processes are missed by the Community Earth System Model in Southern Ocean mixed-phase clouds: Bridging SOCRATES observations to model developments, J. Geophys. Res.-Atmos., 128, e2022JD037513, https://doi.org/10.1029/2022JD037513, 2023.